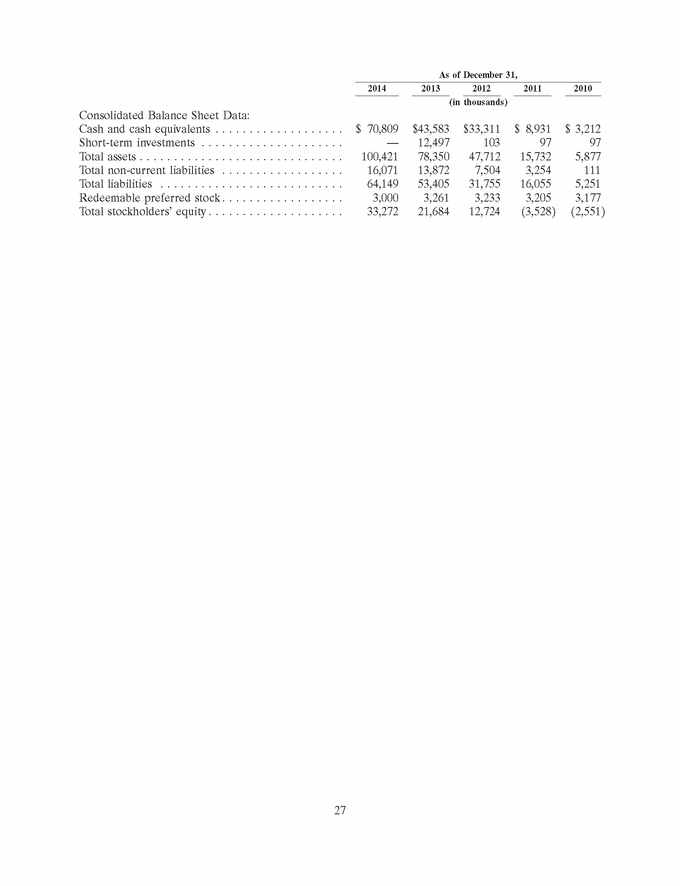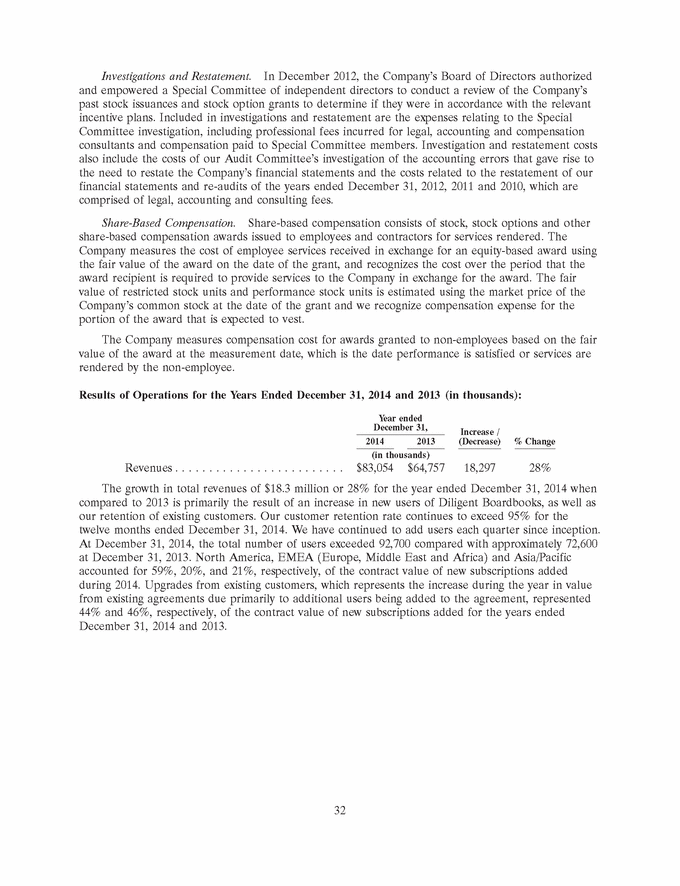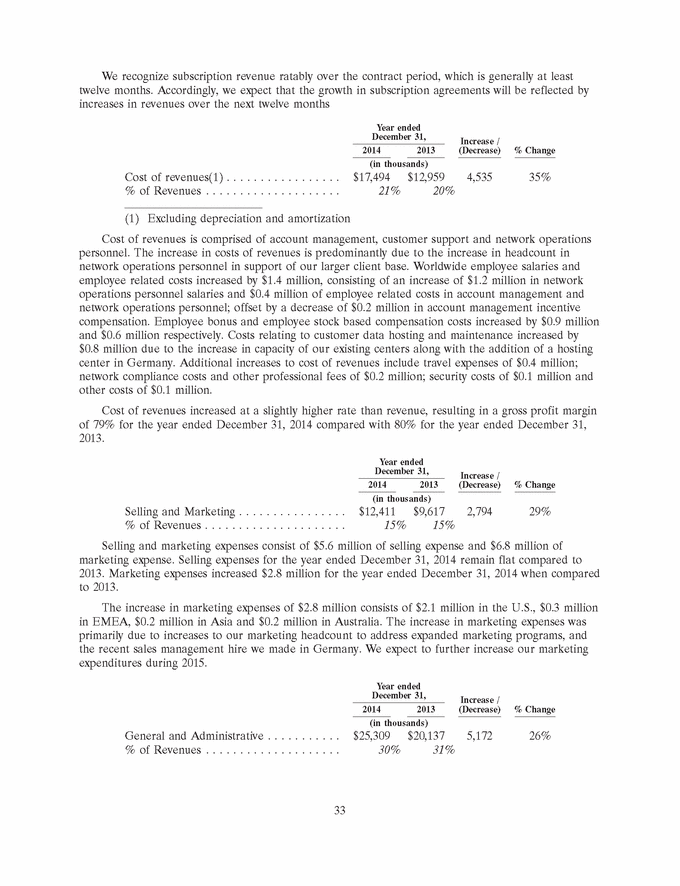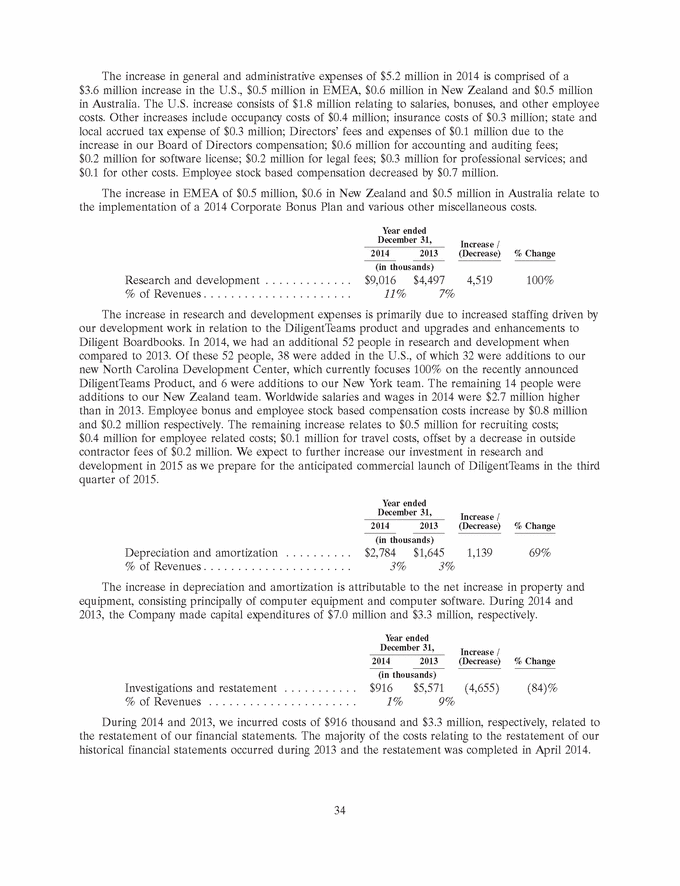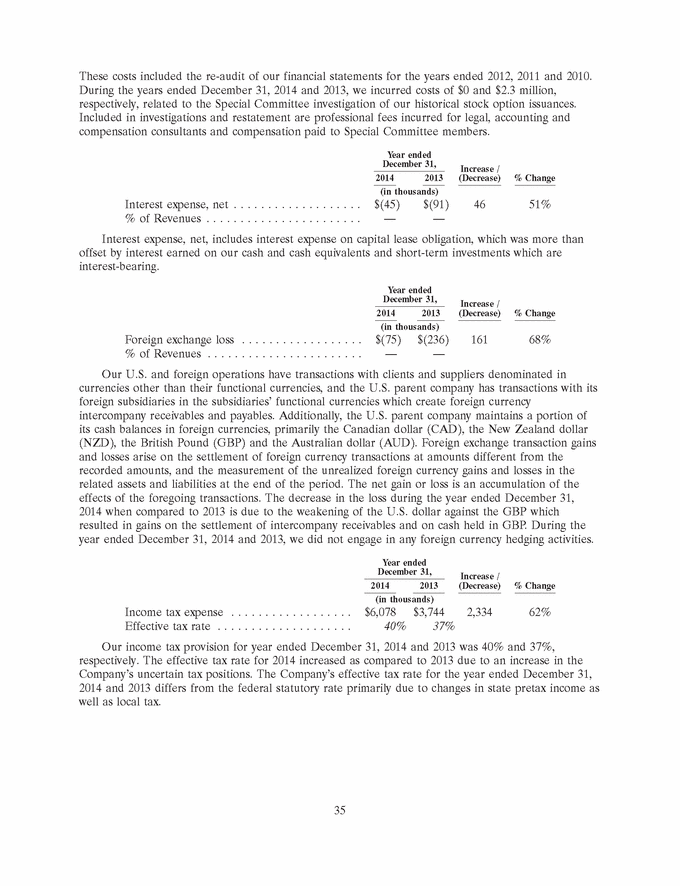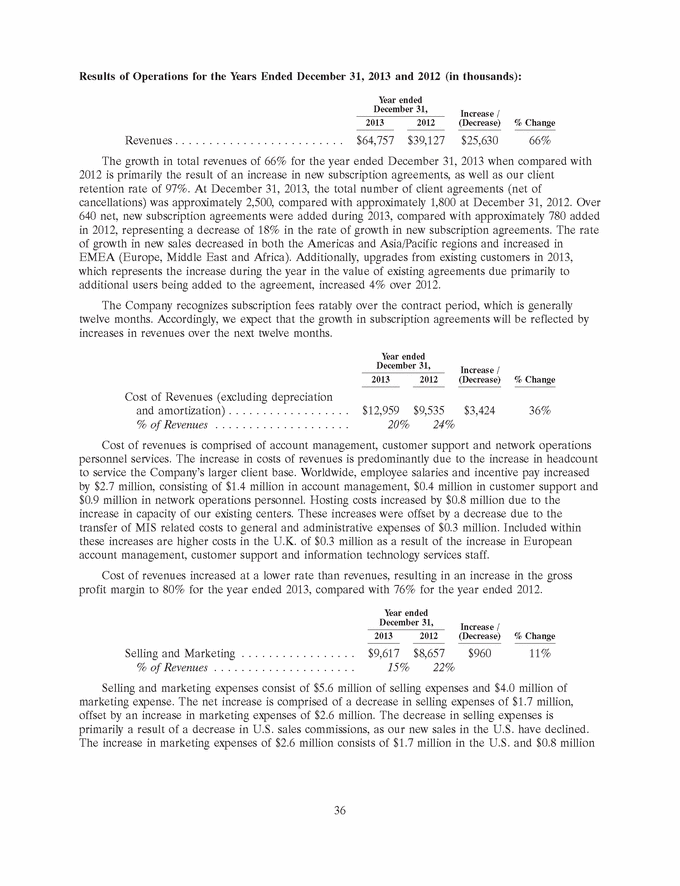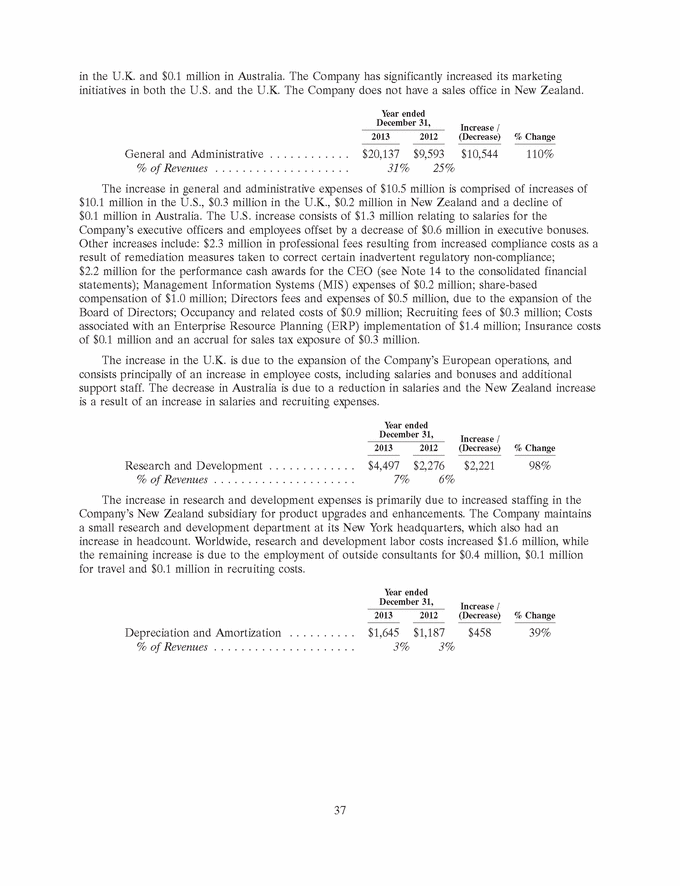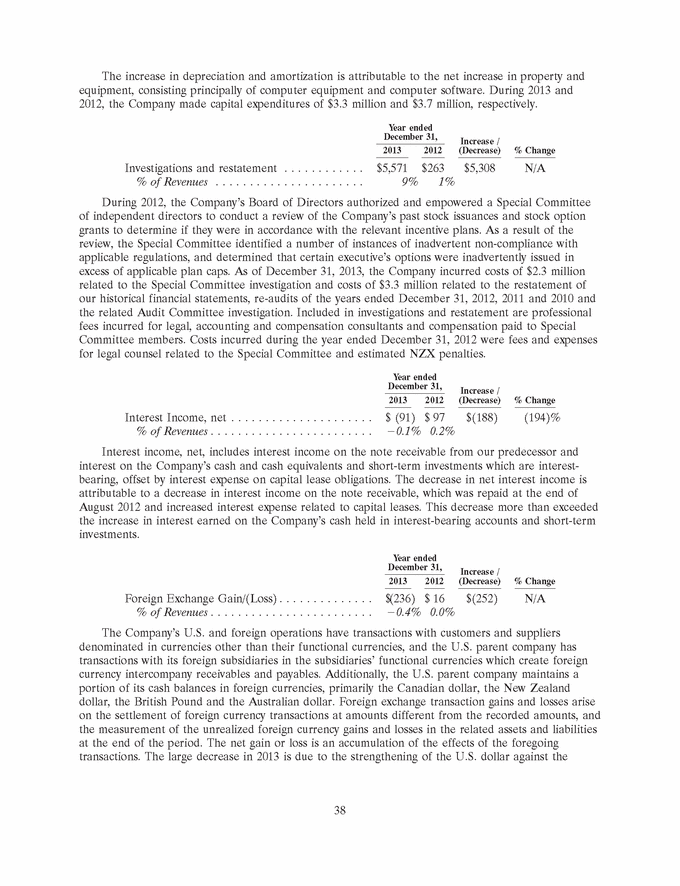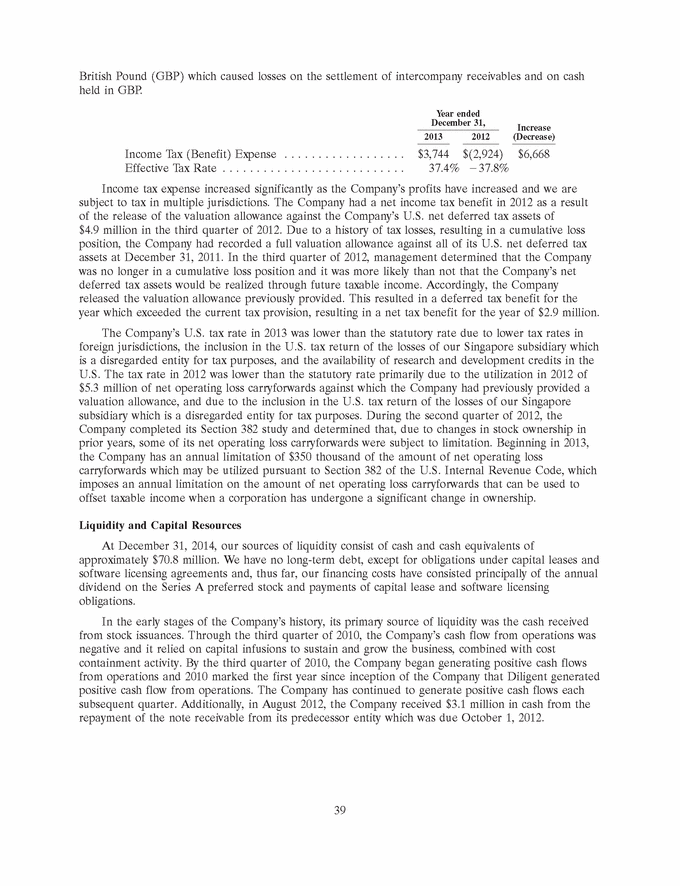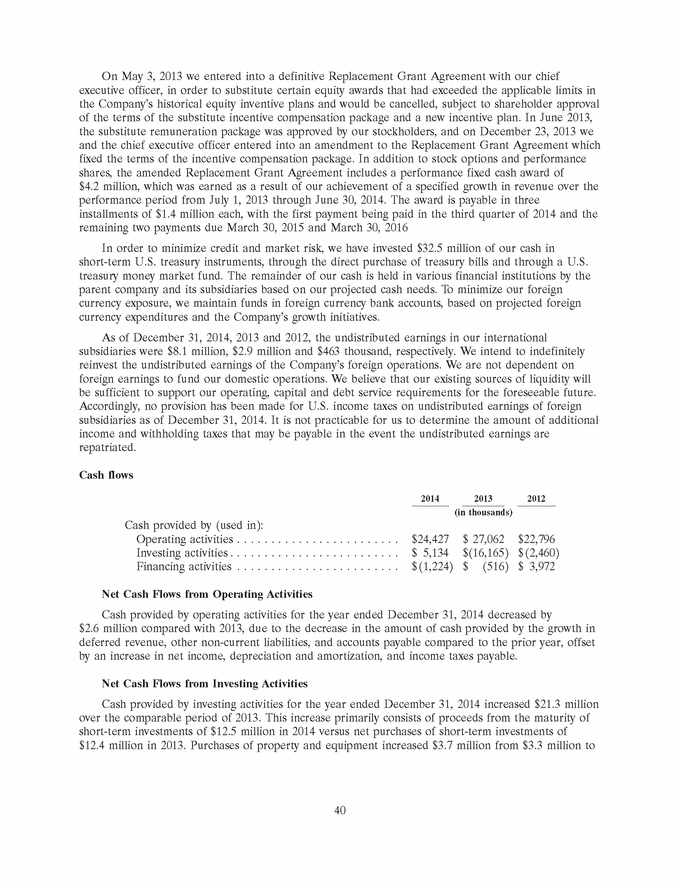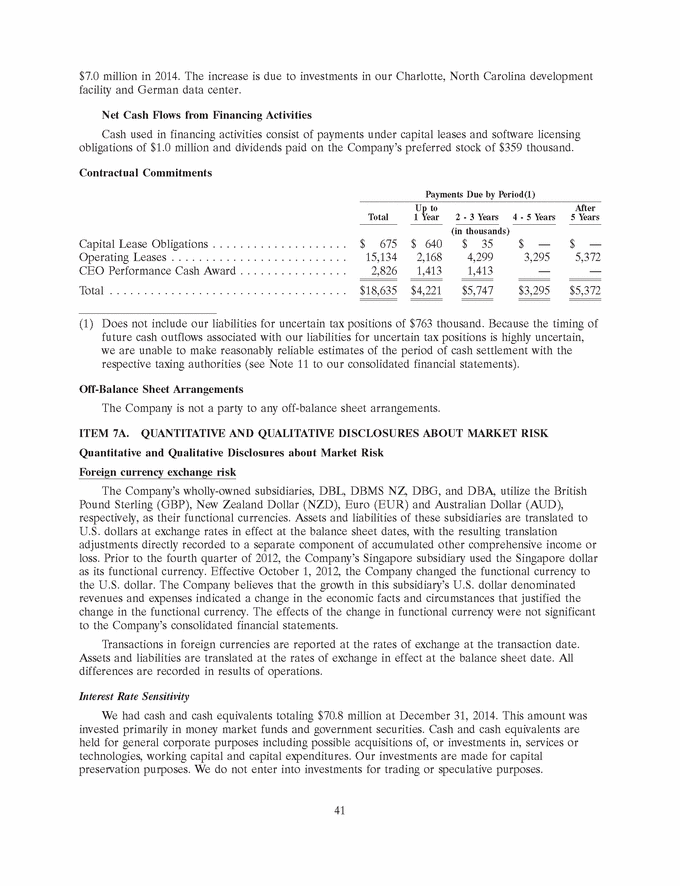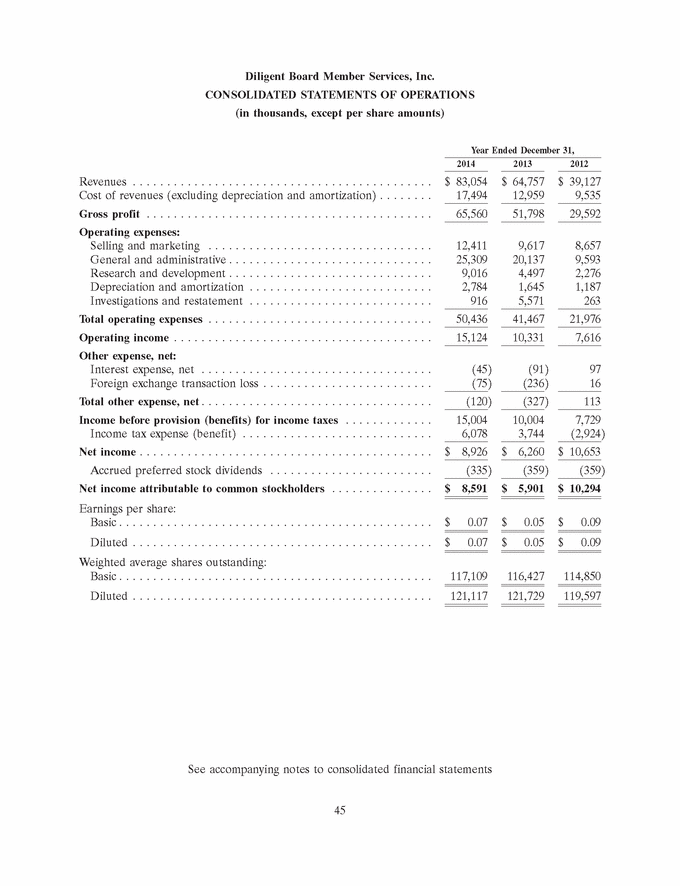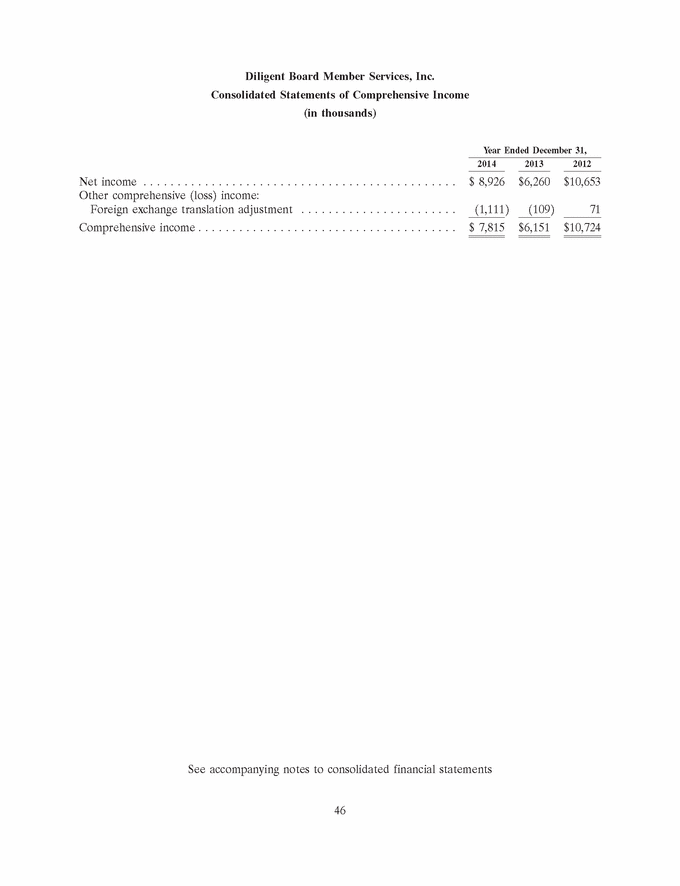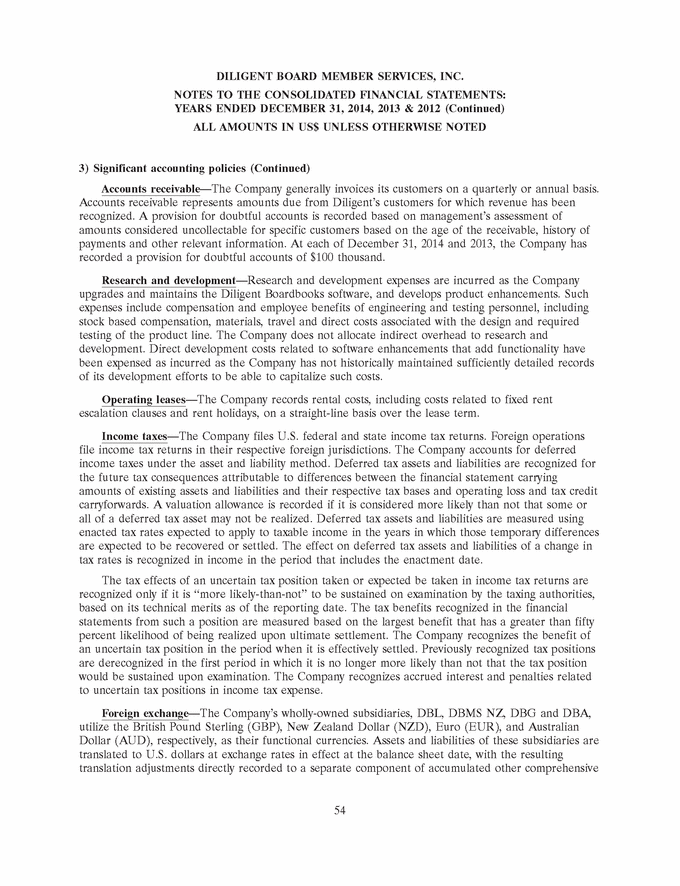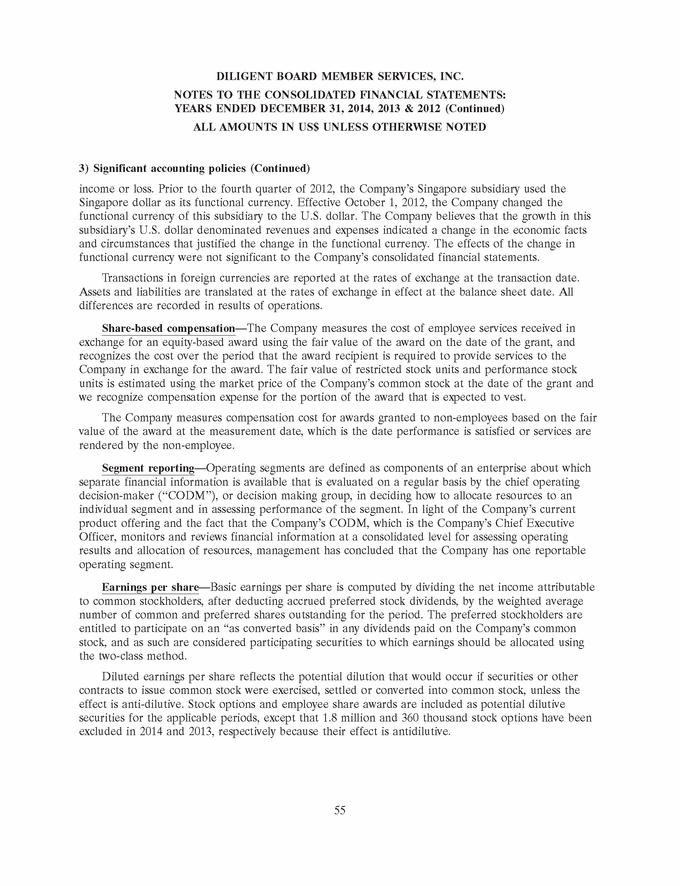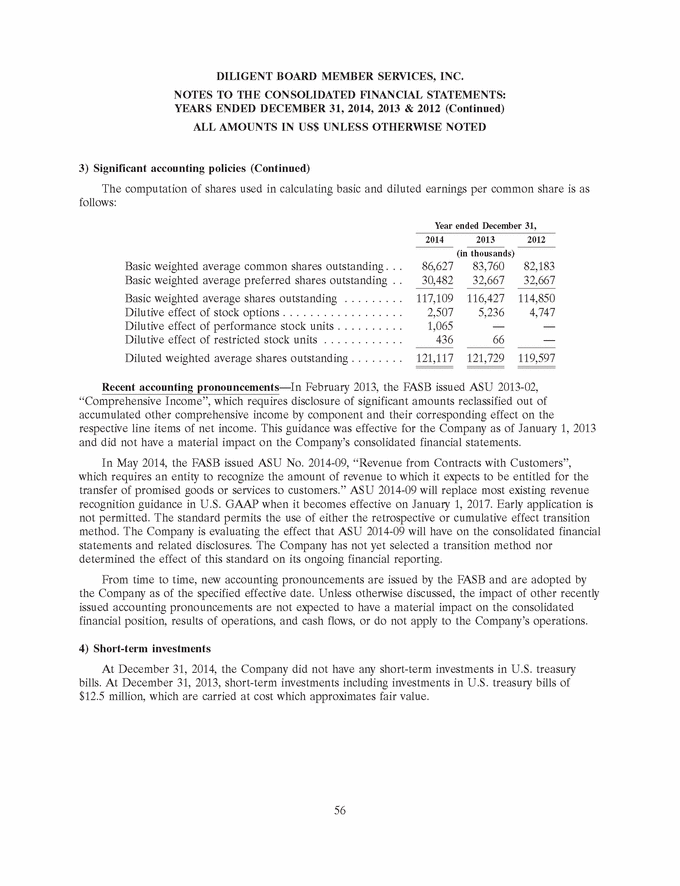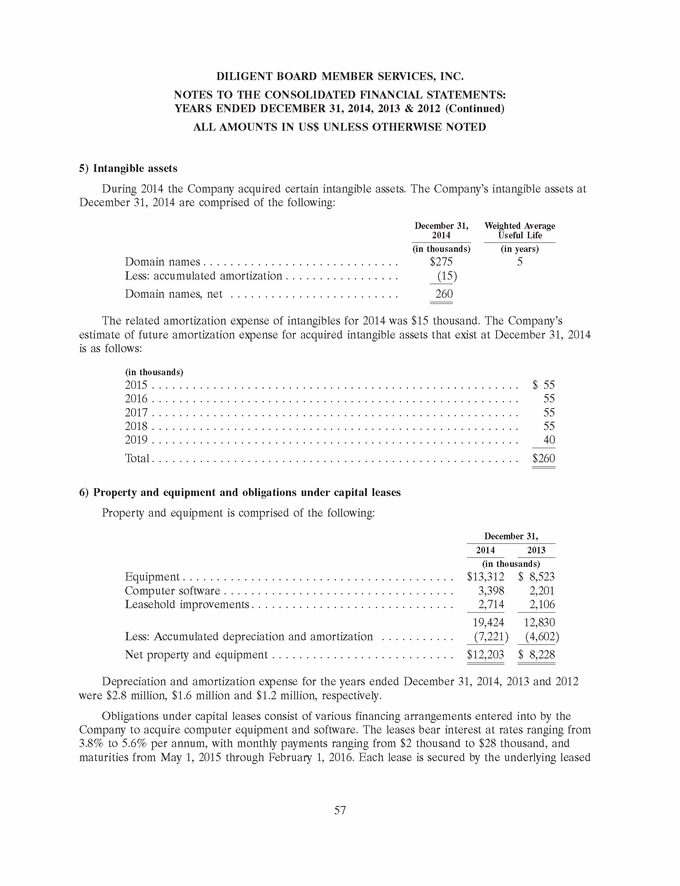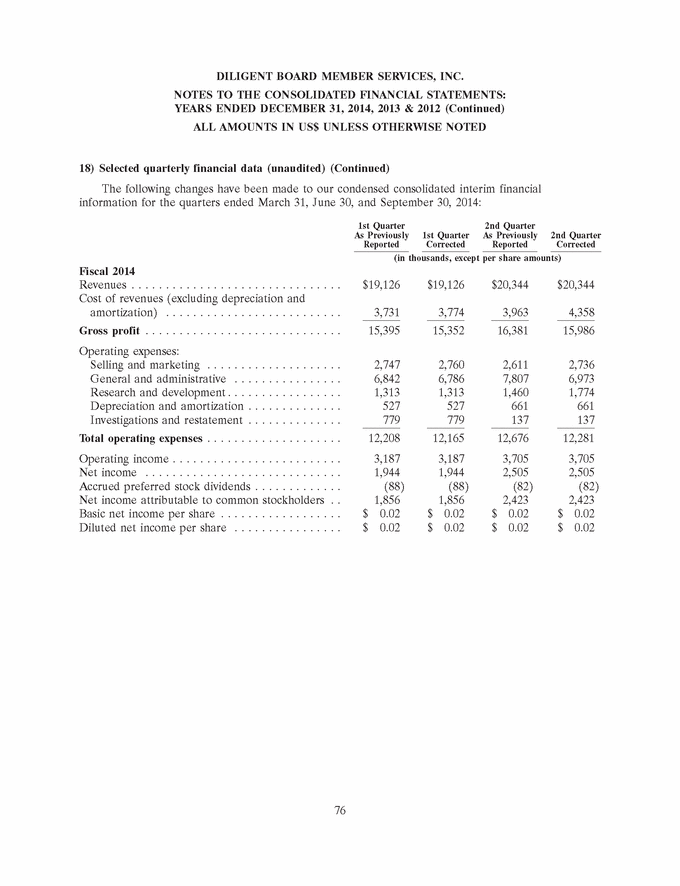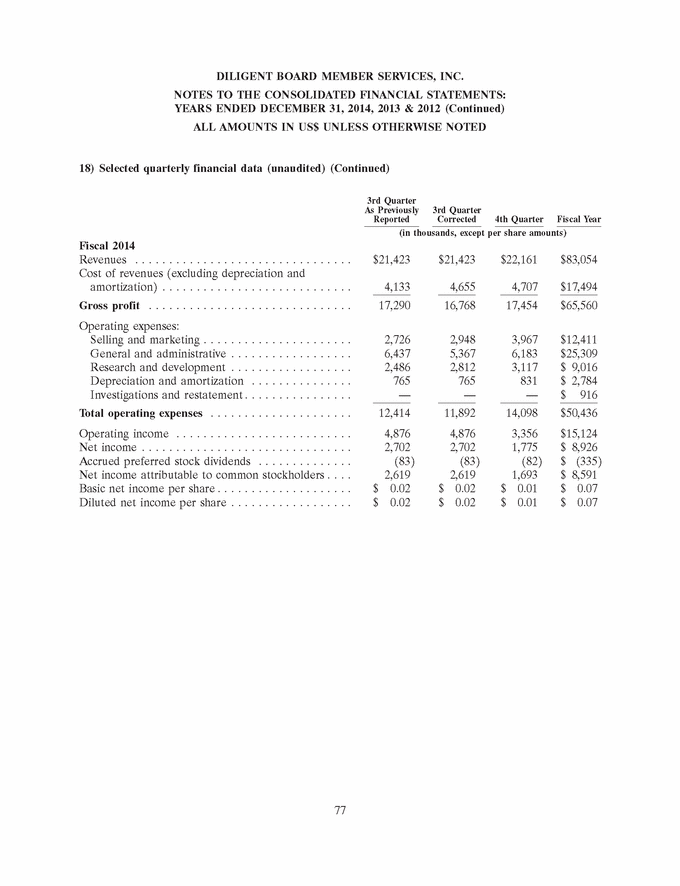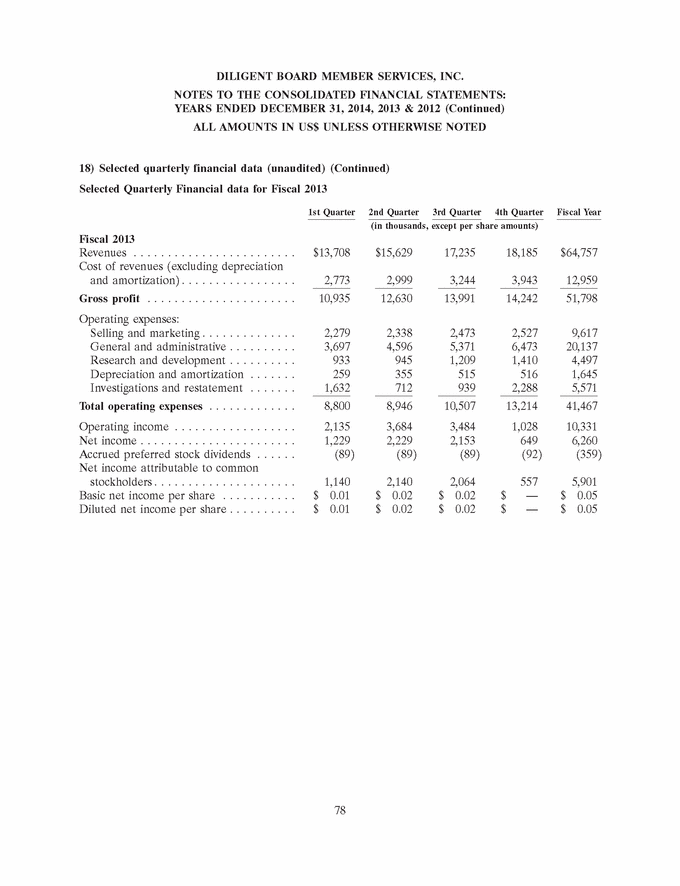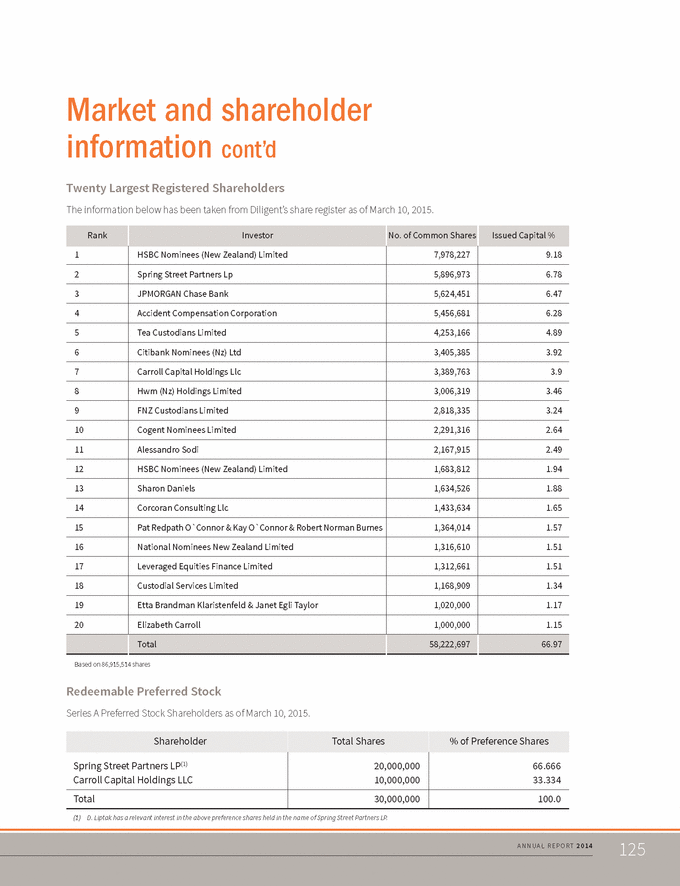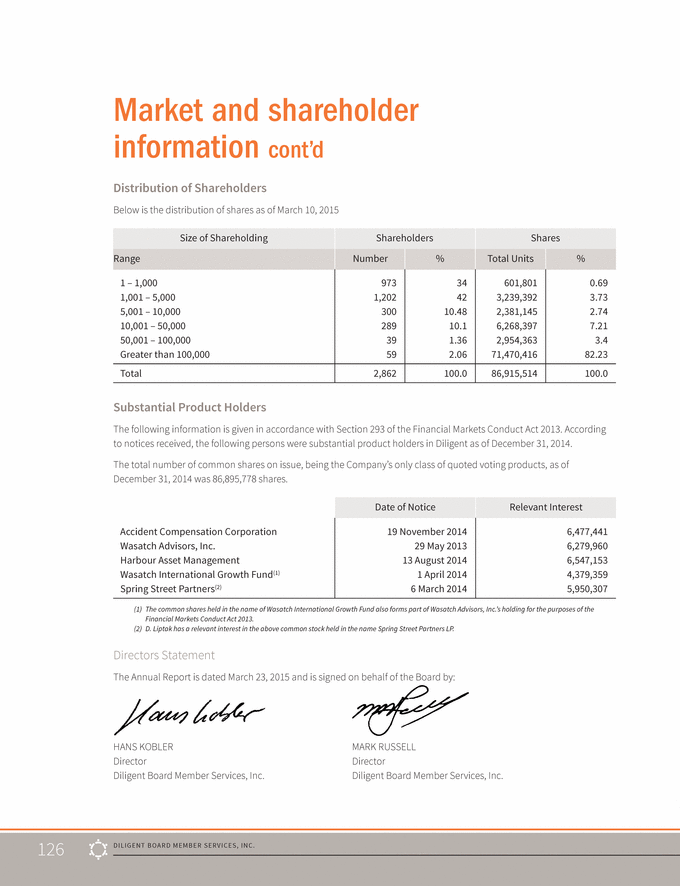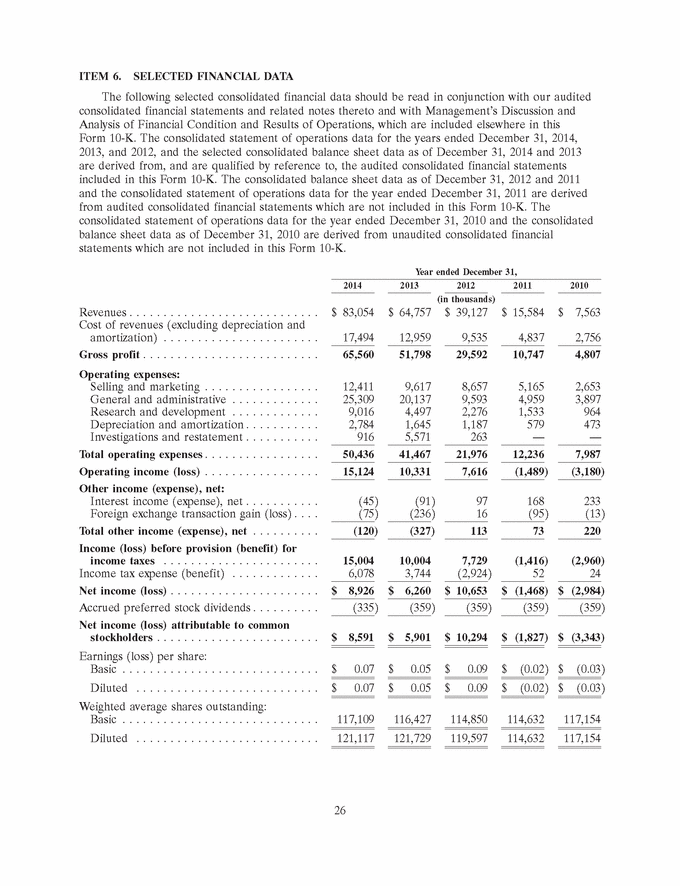
| ITEM 6. SELECTED FINANCIAL DATA The following selected consolidated financial data should be read in conjunction with our audited consolidated financial statements and related notes thereto and with Management’s Discussion and Analysis of Financial Condition and Results of Operations, which are included elsewhere in this Form 10-K. The consolidated statement of operations data for the years ended December 31, 2014, 2013, and 2012, and the selected consolidated balance sheet data as of December 31, 2014 and 2013 are derived from, and are qualified by reference to, the audited consolidated financial statements included in this Form 10-K. The consolidated balance sheet data as of December 31, 2012 and 2011 and the consolidated statement of operations data for the year ended December 31, 2011 are derived from audited consolidated financial statements which are not included in this Form 10-K. The consolidated statement of operations data for the year ended December 31, 2010 and the consolidated balance sheet data as of December 31, 2010 are derived from unaudited consolidated financial statements which are not included in this Form 10-K. Year ended December 31, 2014 2013 2012 2011 2010 (in thousands) Revenues . . . . . . . . . . . . . . . . . . . . . . . . . . . . $ 83,054 $ 64,757 $ 39,127 $ 15,584 $ 7,563 Cost of revenues (excluding depreciation and amortization) . . . . . . . . . . . . . . . . . . . . . . . 17,494 12,959 9,535 4,837 2,756 Gross profit . . . . . . . . . . . . . . . . . . . . . . . . . . 65,560 51,798 29,592 10,747 4,807 Operating expenses: Selling and marketing . . . . . . . . . . . . . . . . . 12,411 9,617 8,657 5,165 2,653 General and administrative . . . . . . . . . . . . . 25,309 20,137 9,593 4,959 3,897 Research and development . . . . . . . . . . . . . 9,016 4,497 2,276 1,533 964 Depreciation and amortization . . . . . . . . . . . 2,784 1,645 1,187 579 473 Investigations and restatement . . . . . . . . . . . 916 5,571 263 — — Total operating expenses . . . . . . . . . . . . . . . . . 50,436 41,467 21,976 12,236 7,987 Operating income (loss) . . . . . . . . . . . . . . . . . 15,124 10,331 7,616 (1,489) (3,180) Other income (expense), net: Interest income (expense), net . . . . . . . . . . . (45) (91) 97 168 233 Foreign exchange transaction gain (loss) . . . . (75) (236) 16 (95) (13) Total other income (expense), net . . . . . . . . . . (120) (327) 113 73 220 Income (loss) before provision (benefit) for income taxes . . . . . . . . . . . . . . . . . . . . . . . 15,004 10,004 7,729 (1,416) (2,960) Income tax expense (benefit) . . . . . . . . . . . . . 6,078 3,744 (2,924) 52 24 Net income (loss) . . . . . . . . . . . . . . . . . . . . . . $ 8,926 $ 6,260 $ 10,653 $ (1,468) $ (2,984) Accrued preferred stock dividends . . . . . . . . . . (335) (359) (359) (359) (359) Net income (loss) attributable to common stockholders . . . . . . . . . . . . . . . . . . . . . . . . $ 8,591 $ 5,901 $ 10,294 $ (1,827) $ (3,343) Earnings (loss) per share: Basic . . . . . . . . . . . . . . . . . . . . . . . . . . . . . $ 0.07 $ 0.05 $ 0.09 $ (0.02) $ (0.03) Diluted . . . . . . . . . . . . . . . . . . . . . . . . . . . $ 0.07 $ 0.05 $ 0.09 $ (0.02) $ (0.03) Weighted average shares outstanding: Basic . . . . . . . . . . . . . . . . . . . . . . . . . . . . . 117,109 116,427 114,850 114,632 117,154 Diluted . . . . . . . . . . . . . . . . . . . . . . . . . . . 121,117 121,729 119,597 114,632 117,154 26 |
