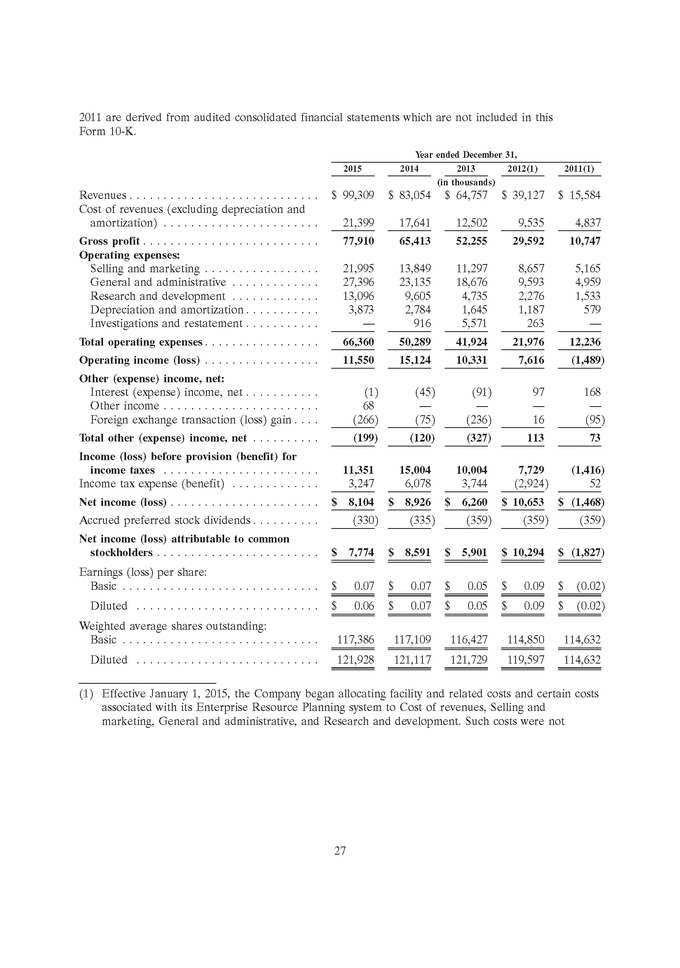
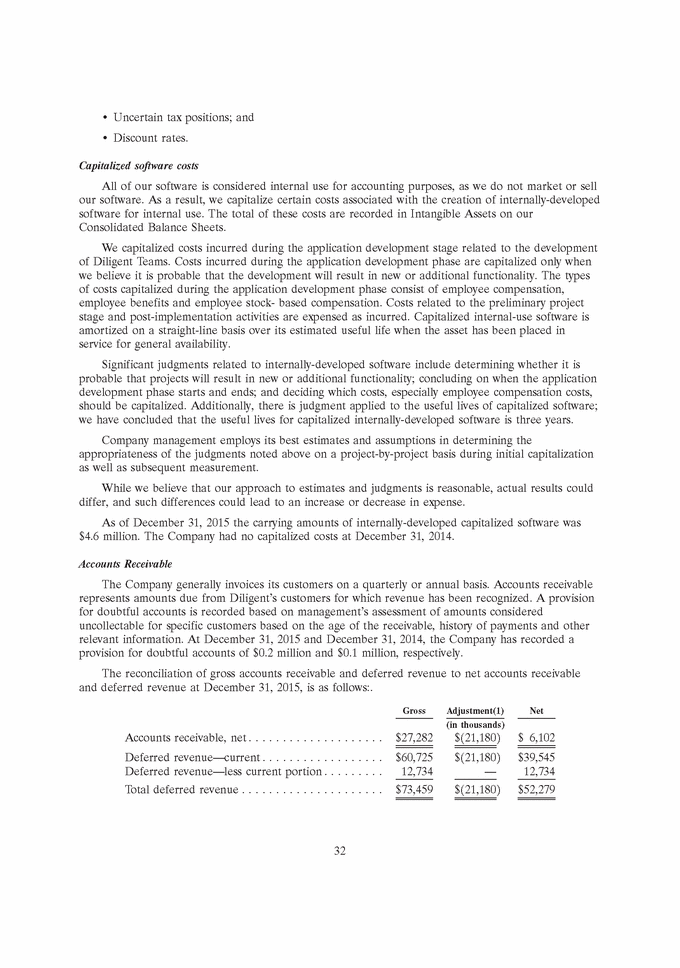
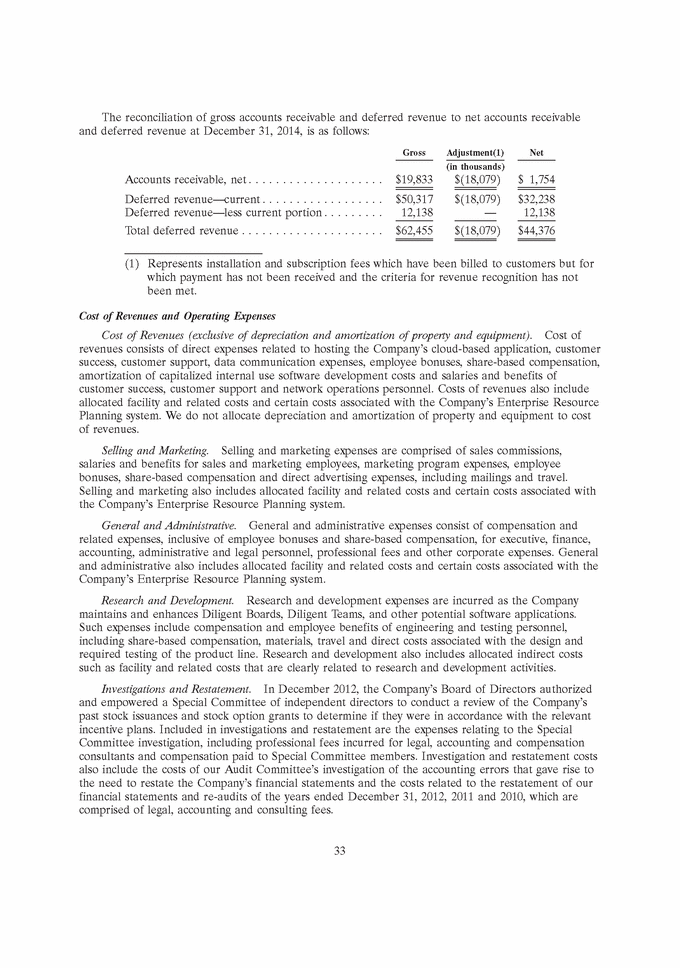
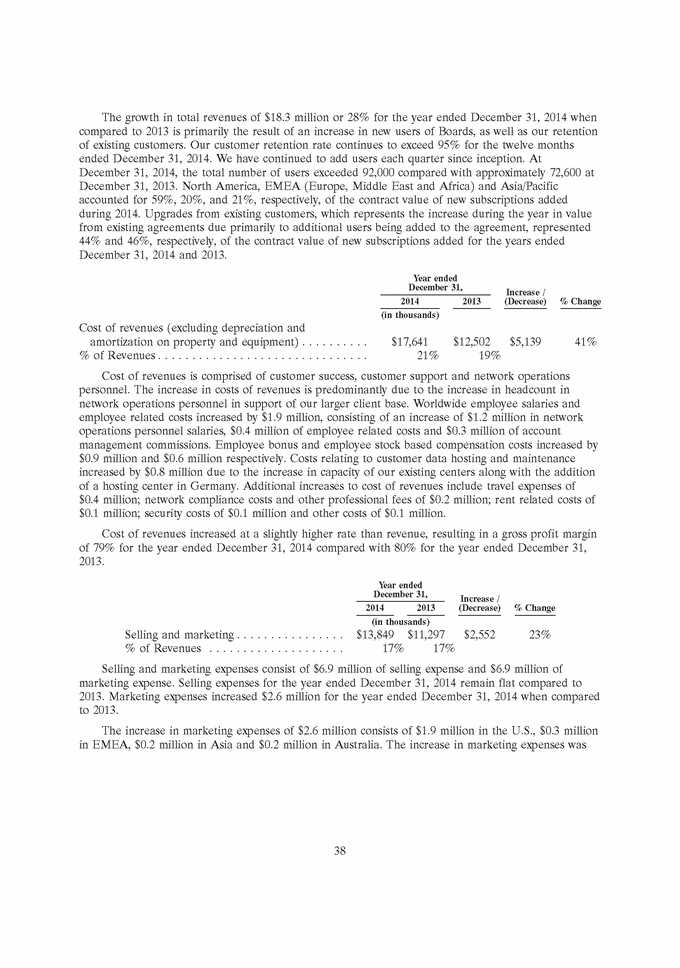
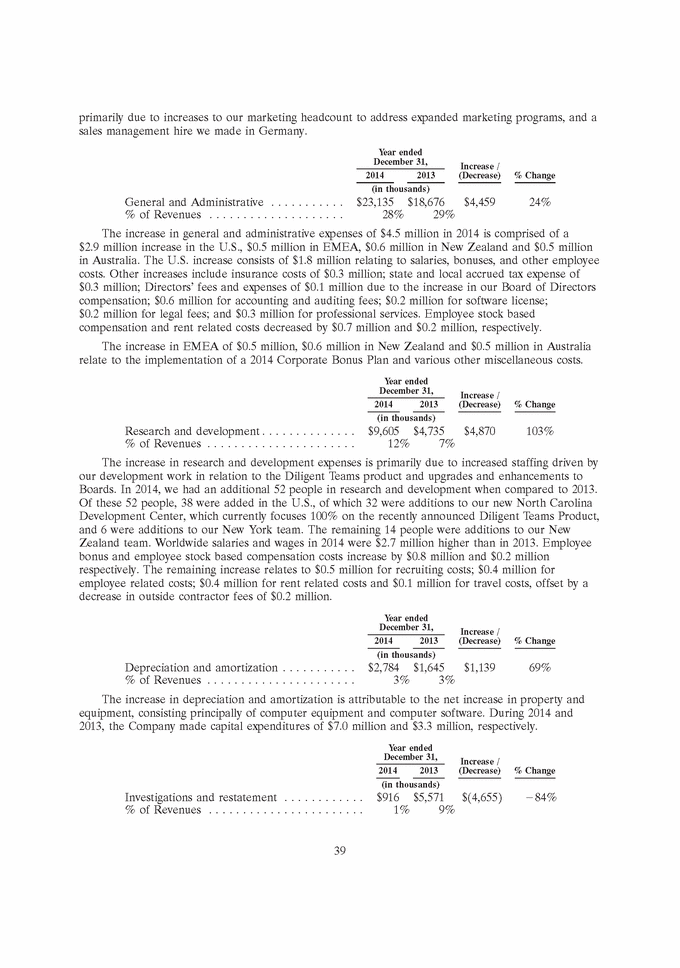
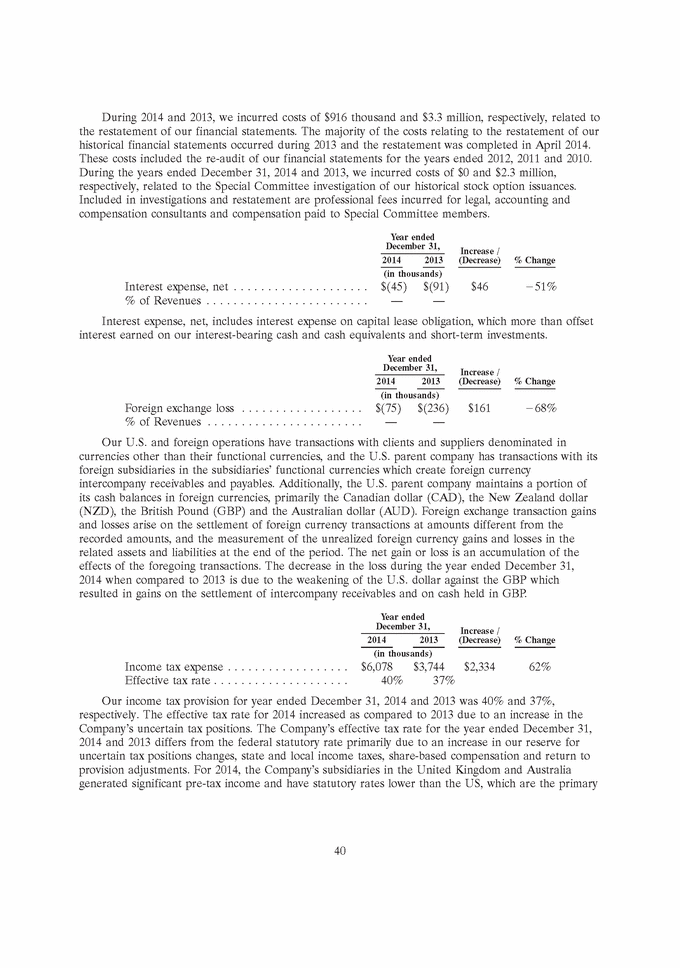
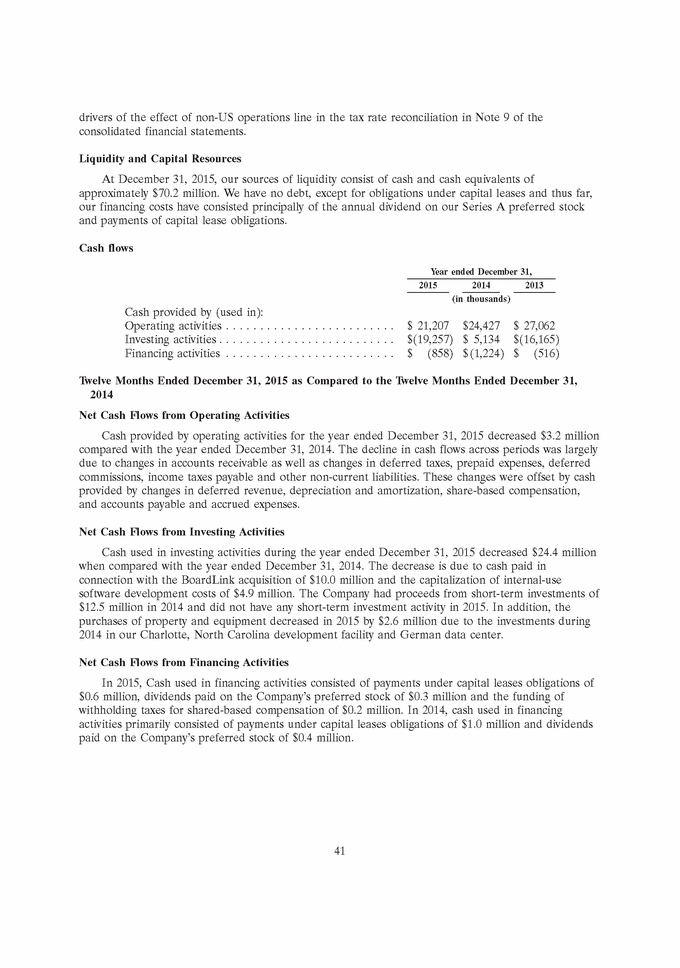
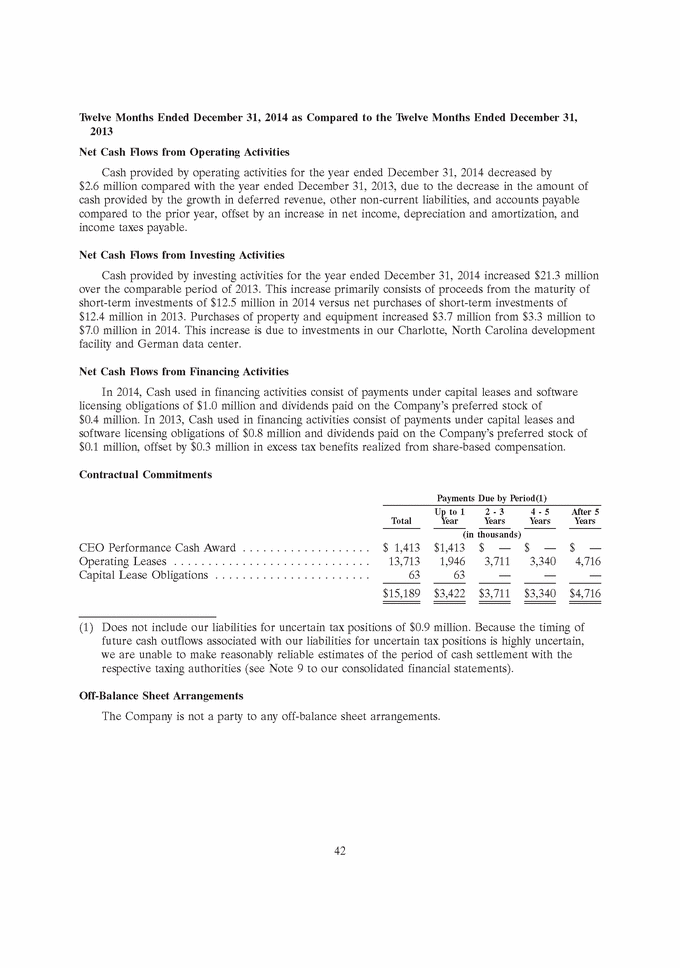
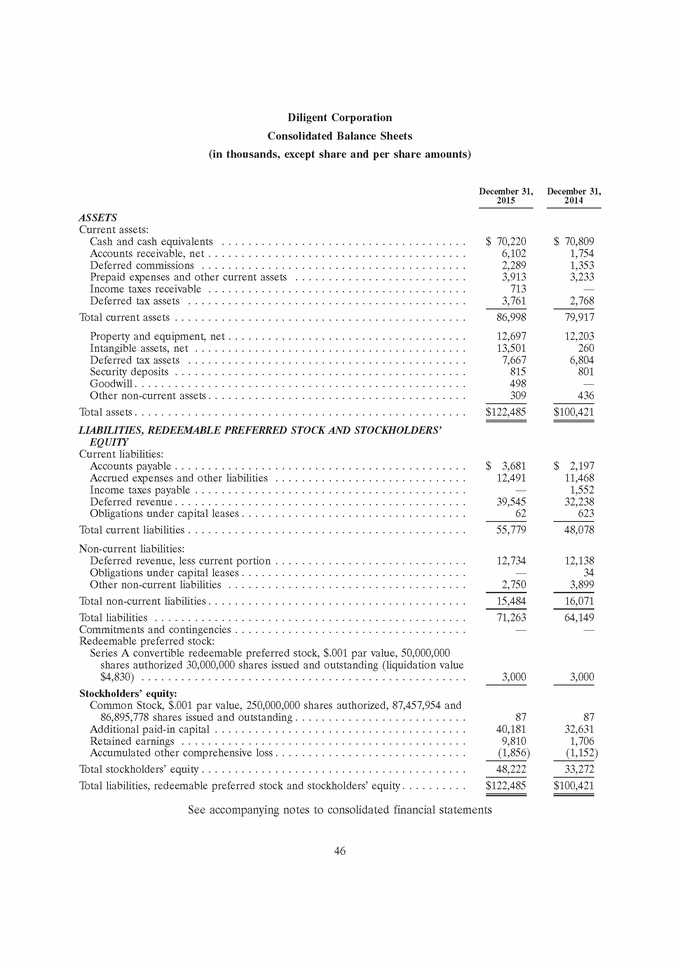
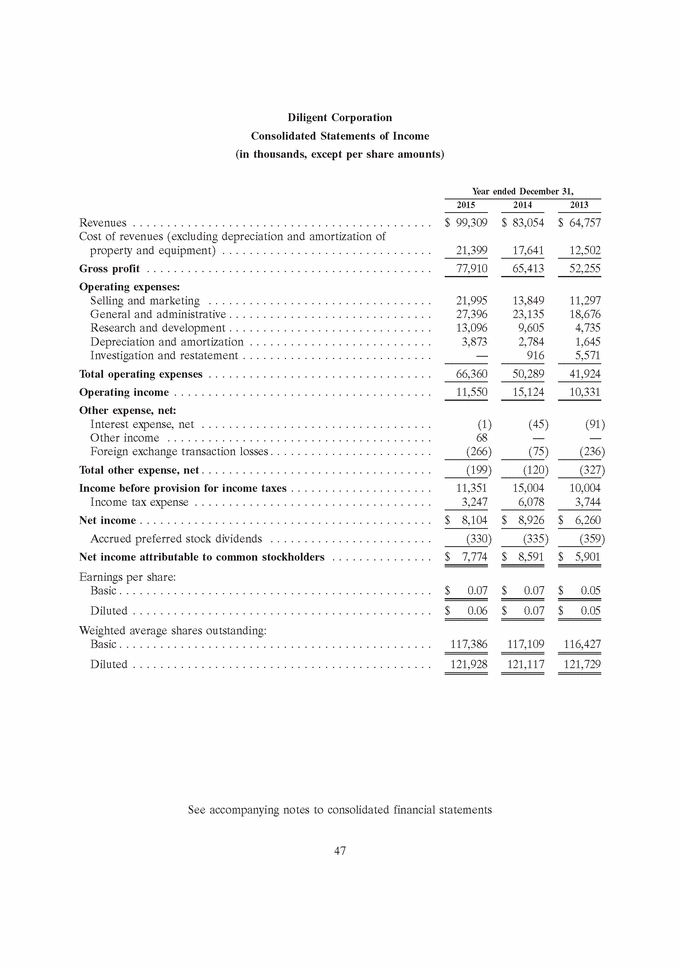
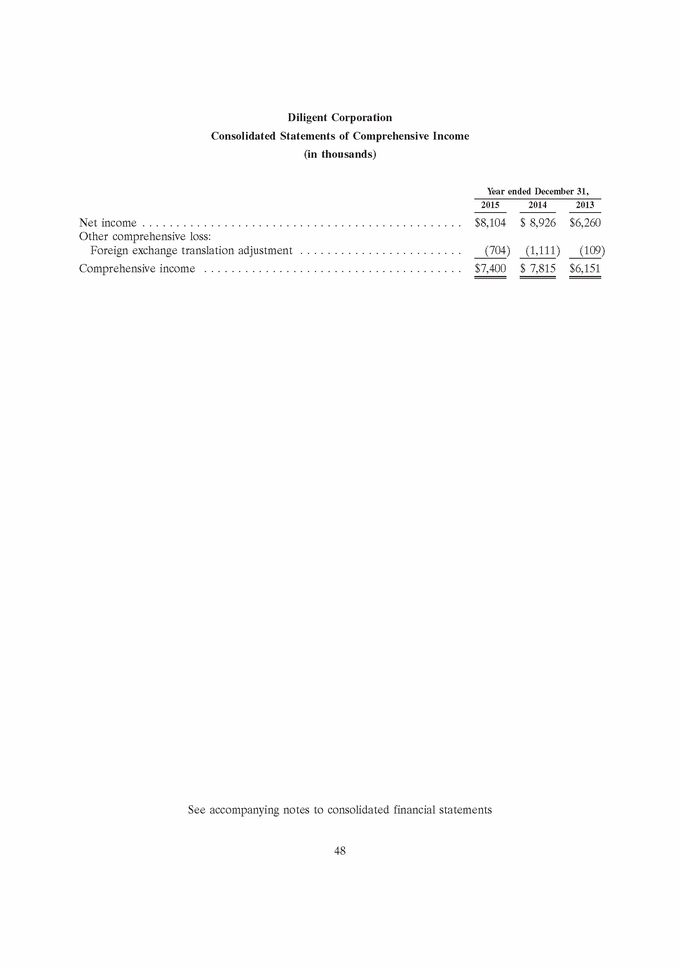
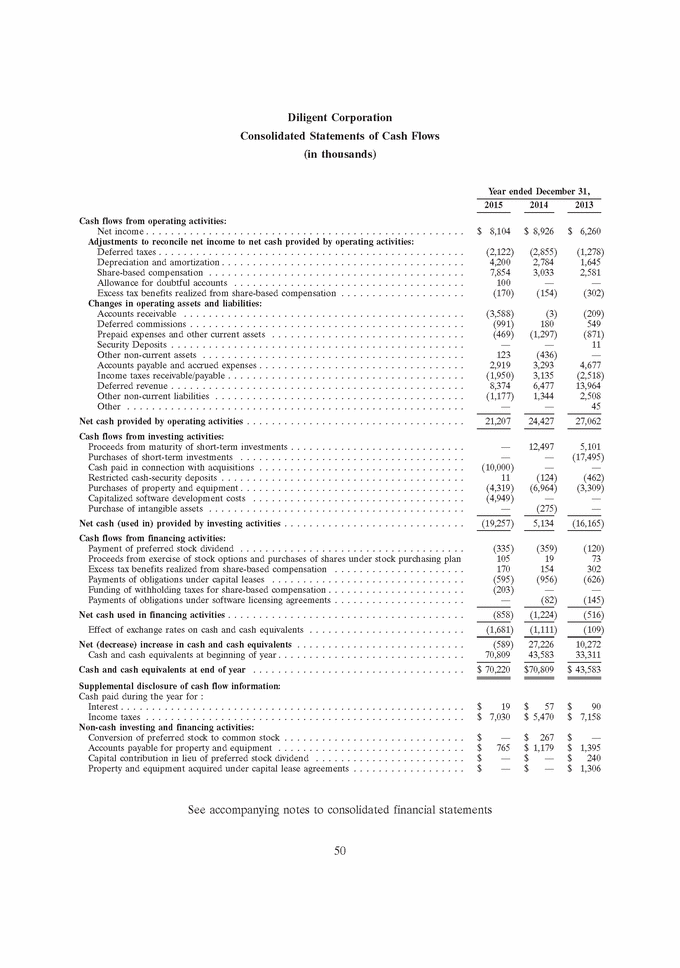
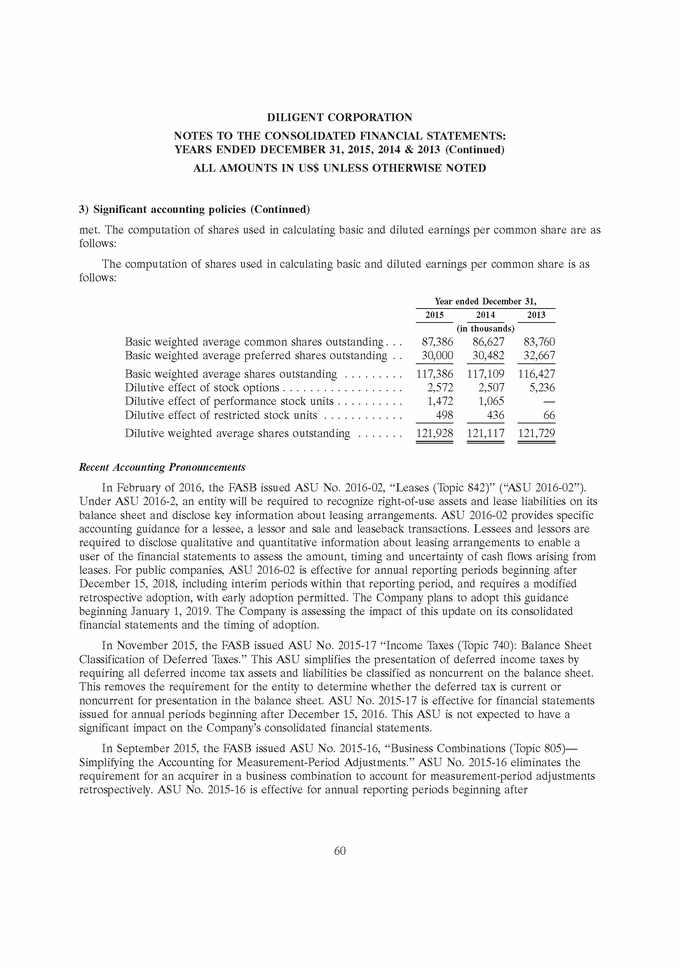
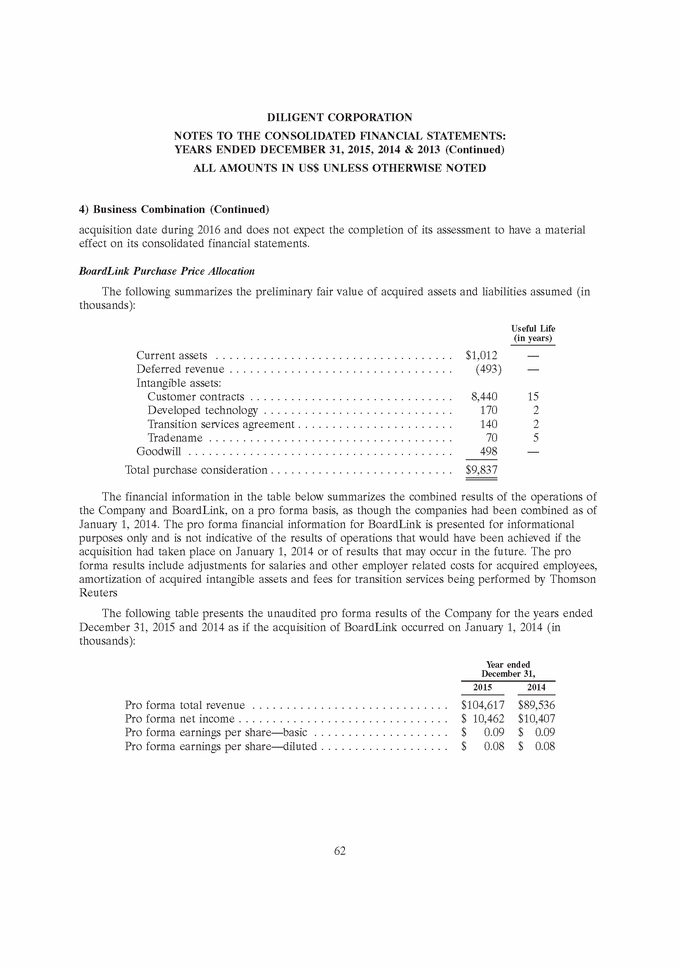
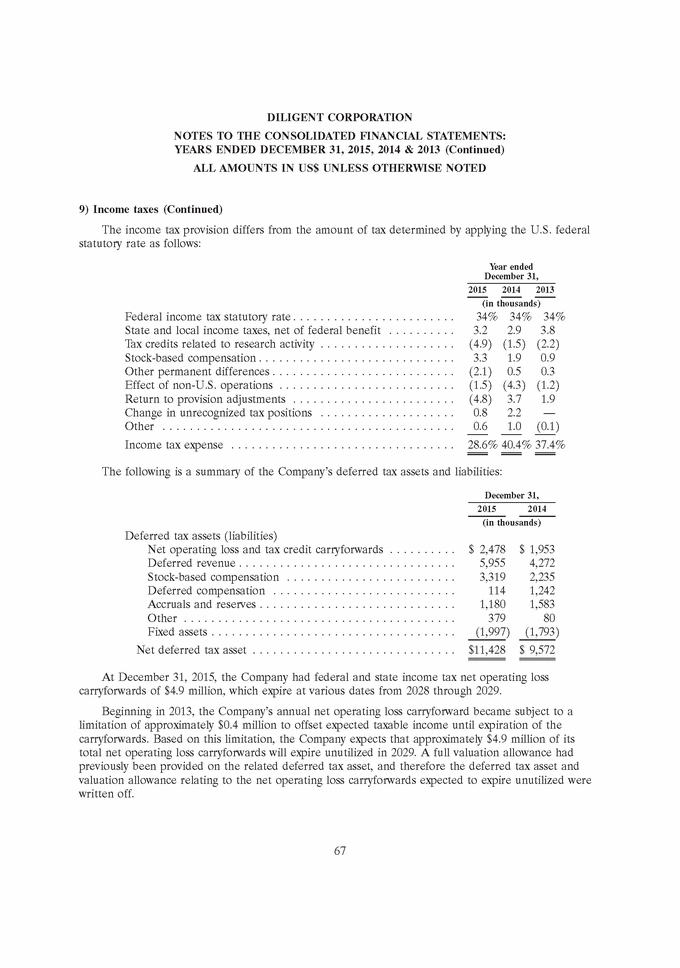
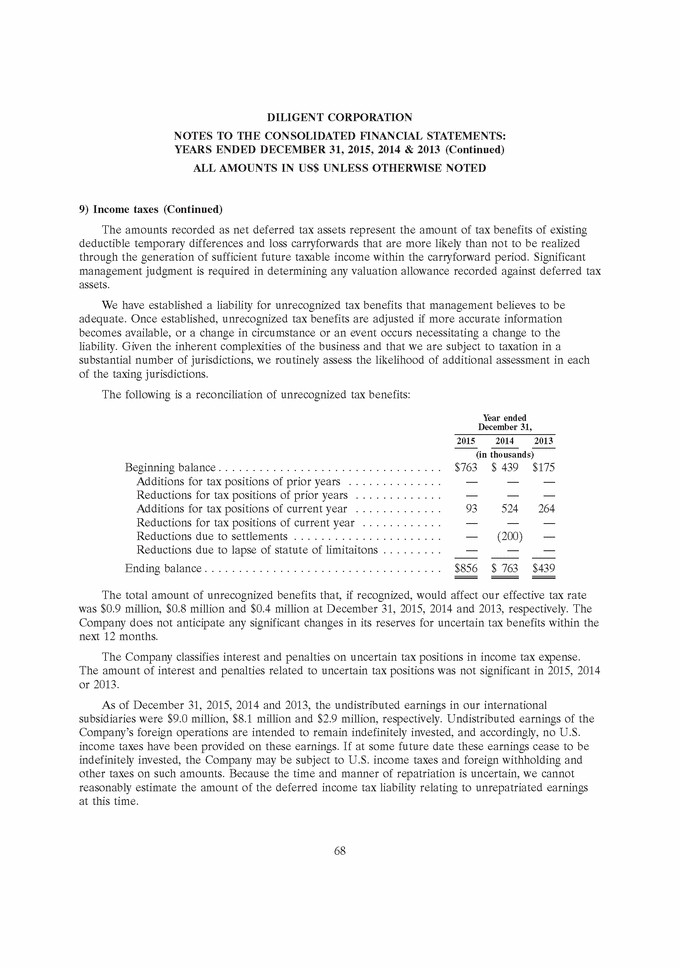
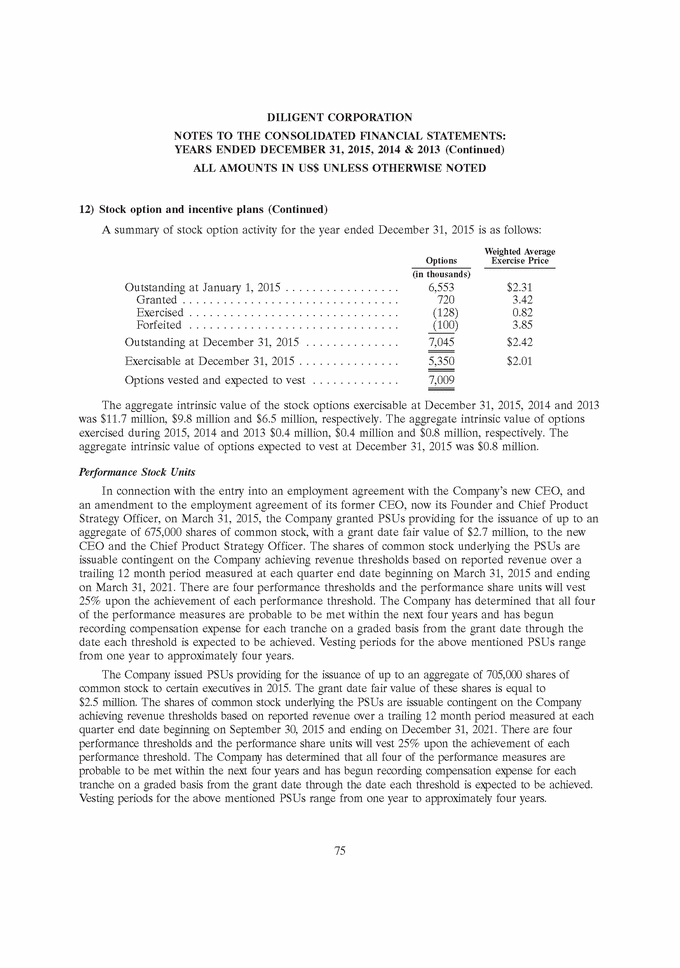
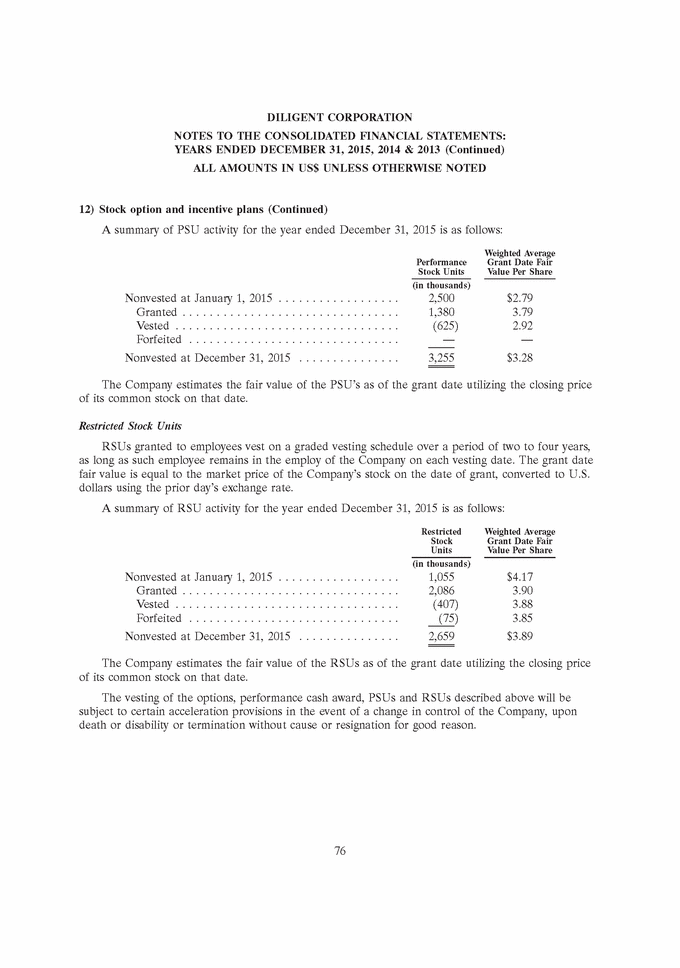
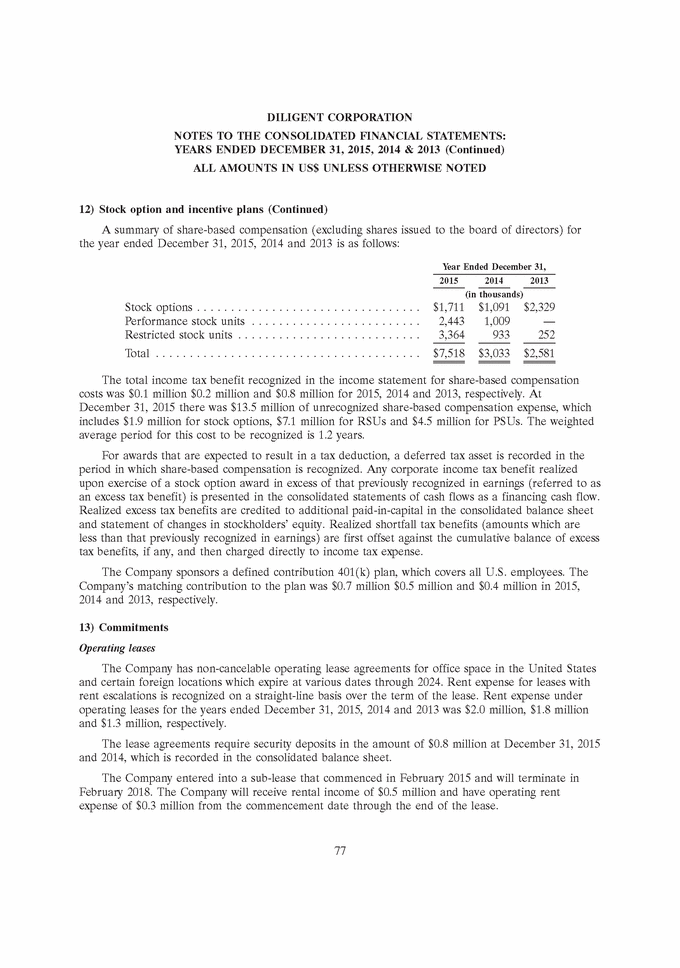
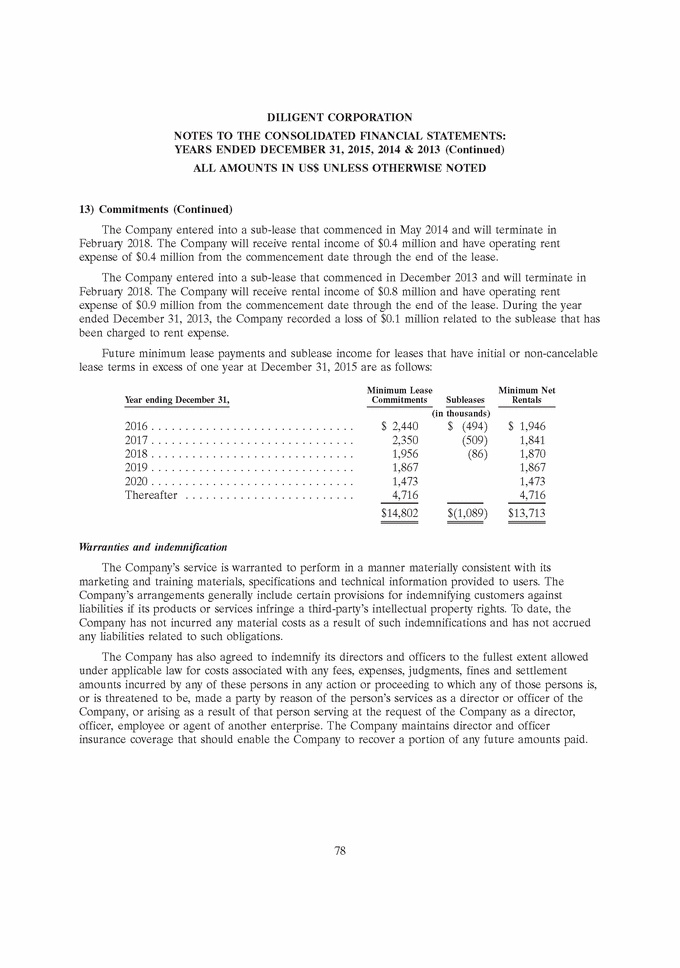
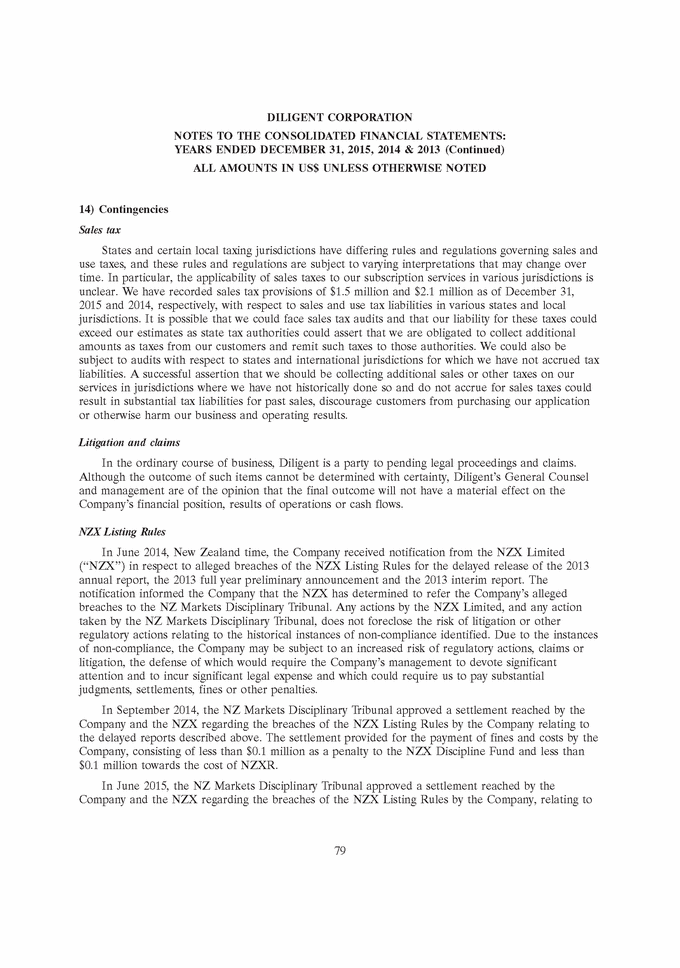
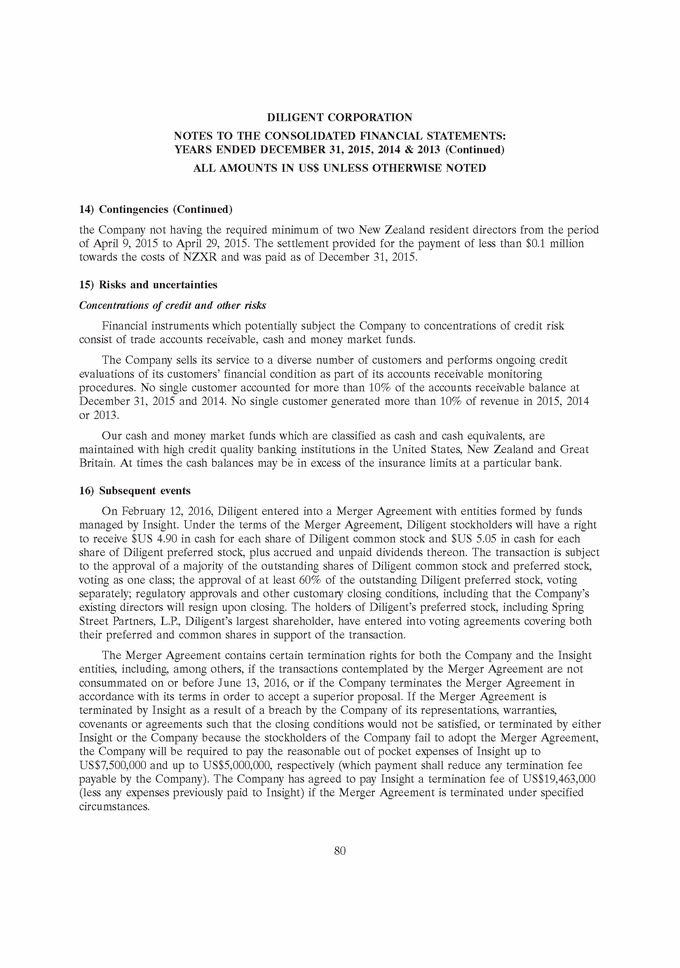
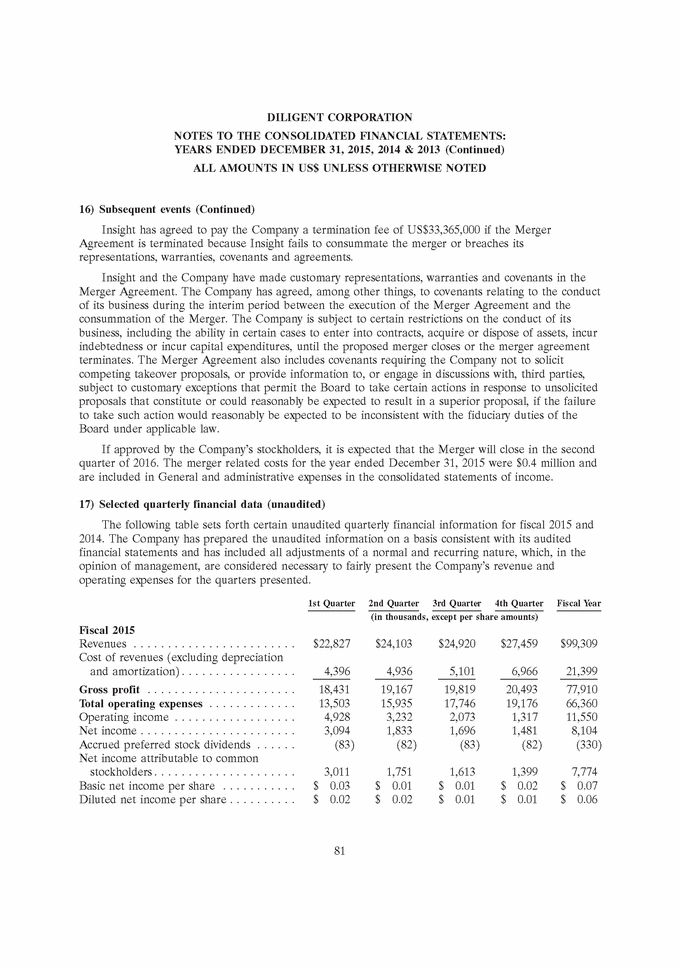
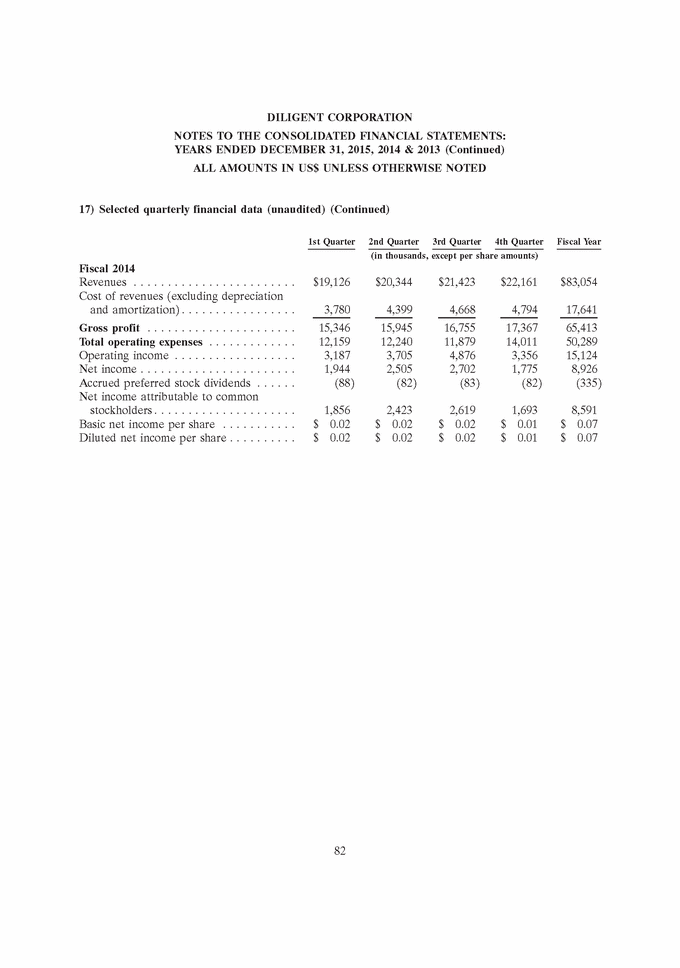
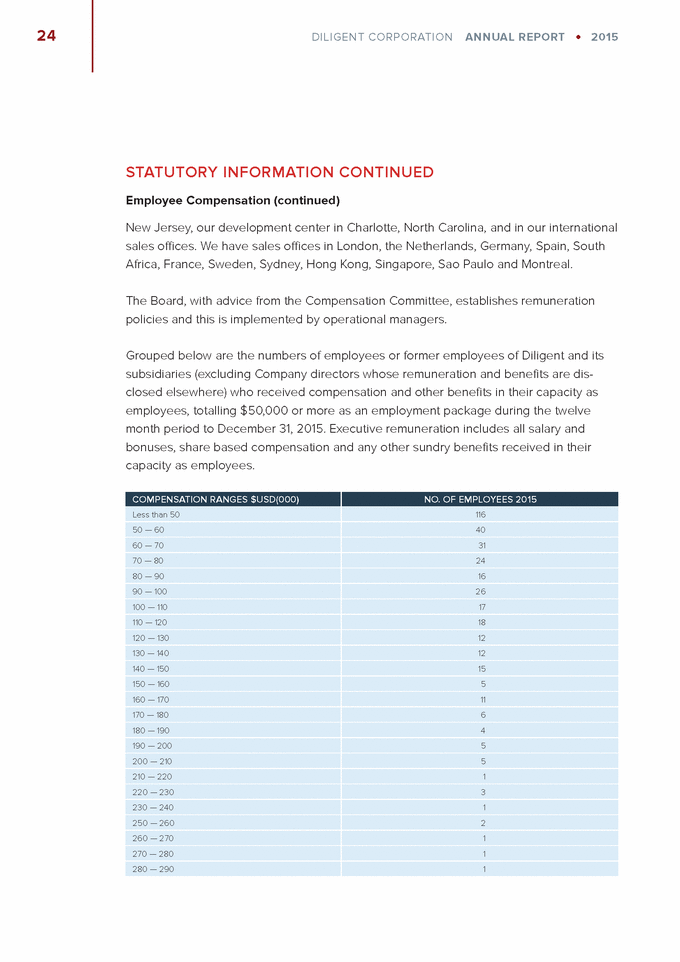
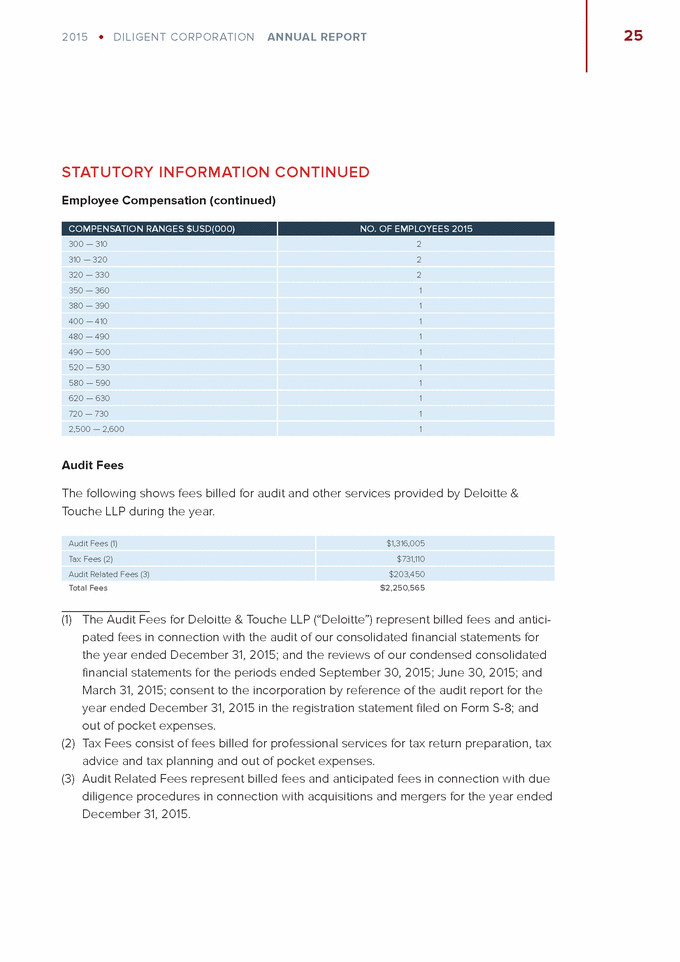
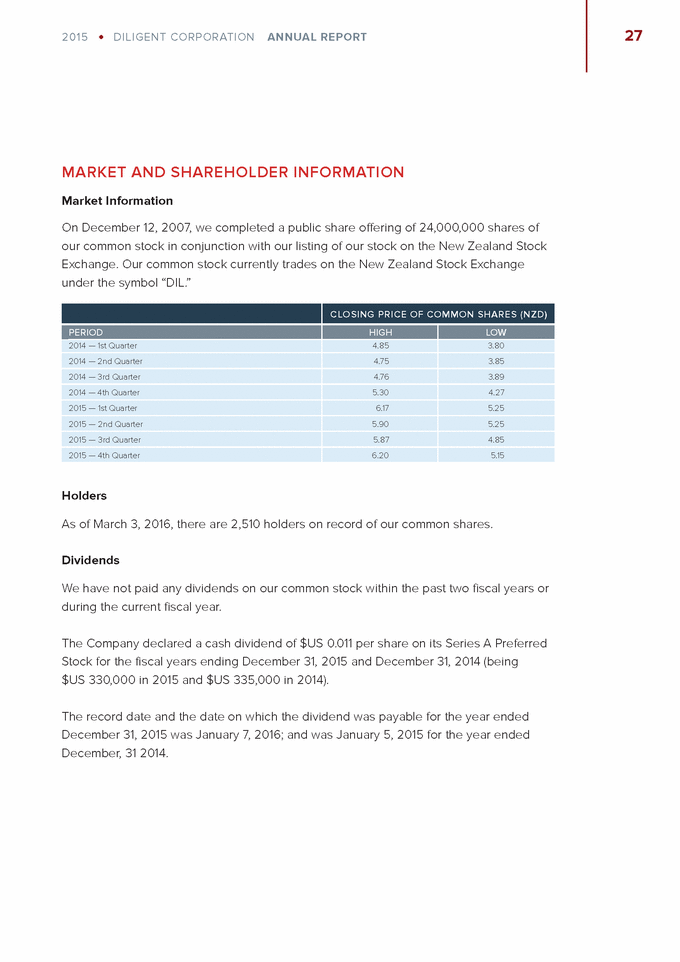
2011 are derived from audited consolidated financial statements which are not included in this Form 10-K. Year ended December 31, 2015 2014 2013 2012(1) 2011(1) (in thousands) $ 64,757 Revenues . . . . . . . . . . . . . . . . . . . . . . . . . . . . Cost of revenues (excluding depreciation and amortization) . . . . . . . . . . . . . . . . . . . . . . . Gross profit . . . . . . . . . . . . . . . . . . . . . . . . . . Operating expenses: Selling and marketing . . . . . . . . . . . . . . . . . General and administrative . . . . . . . . . . . . . Research and development . . . . . . . . . . . . . Depreciation and amortization . . . . . . . . . . . Investigations and restatement . . . . . . . . . . . Total operating expenses . . . . . . . . . . . . . . . . . Operating income (loss) . . . . . . . . . . . . . . . . . Other (expense) income, net: Interest (expense) income, net . . . . . . . . . . . Other income . . . . . . . . . . . . . . . . . . . . . . . Foreign exchange transaction (loss) gain . . . . Total other (expense) income, net . . . . . . . . . . Income (loss) before provision (benefit) for income taxes . . . . . . . . . . . . . . . . . . . . . . . Income tax expense (benefit) . . . . . . . . . . . . . Net income (loss) . . . . . . . . . . . . . . . . . . . . . . Accrued preferred stock dividends . . . . . . . . . . Net income (loss) attributable to common stockholders . . . . . . . . . . . . . . . . . . . . . . . . Earnings (loss) per share: Basic . . . . . . . . . . . . . . . . . . . . . . . . . . . . . Diluted . . . . . . . . . . . . . . . . . . . . . . . . . . . Weighted average shares outstanding: Basic . . . . . . . . . . . . . . . . . . . . . . . . . . . . . Diluted . . . . . . . . . . . . . . . . . . . . . . . . . . . $ 99,309 $ 83,054 $ 39,127 $ 15,584 21,399 17,641 12,502 9,535 4,837 77,910 65,413 52,255 29,592 10,747 21,995 27,396 13,096 3,873 — 13,849 23,135 9,605 2,784 916 11,297 18,676 4,735 1,645 5,571 8,657 9,593 2,276 1,187 263 5,165 4,959 1,533 579 — 66,360 50,289 41,924 21,976 12,236 11,550 15,124 10,331 7,616 (1,489) (1) 68 (266) (45) — (75) (91) — (236) 97 — 16 168 — (95) (199) (120) (327) 113 73 11,351 3,247 15,004 6,078 10,004 3,744 7,729 (2,924) (1,416) 52 $ 8,104 $ 8,926 $ 6,260 $ 10,653 $ (1,468) (330) (335) (359) (359) (359) $ 7,774 $ 8,591 $ 5,901 $ 10,294 $ (1,827) $ 0.07 $ 0.07 $ 0.05 $ 0.09 $ (0.02) $ 0.06 $ 0.07 $ 0.05 $ 0.09 $ (0.02) 117,386 117,109 116,427 114,850 114,632 121,928 121,117 121,729 119,597 114,632 (1) Effective January 1, 2015, the Company began allocating facility and related costs and certain costs associated with its Enterprise Resource Planning system to Cost of revenues, Selling and marketing, General and administrative, and Research and development. Such costs were not 27
