Legal Disclaimer NO OFFER OR SOLICITATION This presentation includes a discussion of a proposed business combination transaction (the “Transaction”) between AM and AMGP. This presentation is for informational purposes only and does not constitute an offer to sell or the solicitation of an offer to buy any securities or a solicitation of any vote or approval, in any jurisdiction, pursuant to the Transaction or otherwise, nor shall there be any sale, issuance, exchange or transfer of the securities referred to in this document in any jurisdiction in contravention of applicable law. No offer of securities shall be made except by means of a prospectus meeting the requirements of Section 10 of the Securities Act of 1933, as amended. IMPORTANT ADDITIONAL INFORMATION In connection with the Transaction, AMGP will file with the U.S. Securities and Exchange Commission (“SEC”) a registration statement on Form S-4, that will include a joint proxy statement of AM and AMGP and a prospectus of AMGP. The Transaction will be submitted to AM’s unitholders and AMGP’s shareholders for their consideration. AM and AMGP may also file other documents with the SEC regarding the Transaction. The definitive joint proxy statement/prospectus will be sent to the shareholders of AMGP and unitholders of AM. This document is not a substitute for the registration statement and joint proxy statement/prospectus that will be filed with the SEC or any other documents that AMGP or AM may file with the SEC or send to shareholders of AMGP or unitholders of AM in connection with the Transaction. INVESTORS AND SECURITY HOLDERS OF ANTERO MIDSTREAM AND AMGP ARE URGED TO READ THE REGISTRATION STATEMENT AND THE JOINT PROXY STATEMENT/PROSPECTUS REGARDING THE TRANSACTION WHEN IT BECOMES AVAILABLE AND ALL OTHER RELEVANT DOCUMENTS THAT ARE FILED OR WILL BE FILED WITH THE SEC, AS WELL AS ANY AMENDMENTS OR SUPPLEMENTS TO THESE DOCUMENTS, CAREFULLY AND IN THEIR ENTIRETY BECAUSE THEY WILL CONTAIN IMPORTANT INFORMATION ABOUT THE TRANSACTION AND RELATED MATTERS. Investors and security holders will be able to obtain free copies of the registration statement and the joint proxy statement/prospectus (when available) and all other documents filed or that will be filed with the SEC by AMGP or AM through the website maintained by the SEC at http://www.sec.gov. Copies of documents filed with the SEC by AM will be made available free of charge on AM’s website at http://investors.anteromidstream.com/investor-relations/AM, under the heading “SEC Filings,” or by directing a request to Investor Relations, Antero Midstream Partners LP, 1615 Wynkoop Street, Denver, Colorado 75219, Tel. No. (303) 357-7310. Copies of documents filed with the SEC by AMGP will be made available free of charge on AMGP’s website at http://investors.anteromidstreamgp.com/Investor-Relations/AMGP or by directing a request to Investor Relations, Antero Midstream GP LP, 1615 Wynkoop Street, Denver, Colorado 75219, Tel. No. (303) 357-7310. PARTICIPANTS IN THE SOLICITATION AMGP, AM, AR and the directors and executive officers of AMGP and AM’s respective general partners and of AR may be deemed to be participants in the solicitation of proxies in respect to the Transaction. Information regarding the directors and executive officers of AM’s general partner is contained in AM’s 2018 Annual Report on Form 10-K filed with the SEC on February 13, 2018, and certain of its Current Reports on Form 8-K. You can obtain a free copy of this document at the SEC’s website at http://www.sec.gov or by accessing AM’s website at http://www.anteromidstream.com. Information regarding the executive officers and directors of AMGP’s general partner is contained in AMGP’s 2018 Annual Report on Form 10-K filed with the SEC on February 13, 2018 and certain of its Current Reports on Form 8-K. You can obtain a free copy of this document at the SEC’s website at www.sec.gov or by accessing the AMGP’s website at http://www.anteromidstream.com. Information regarding the executive officers and directors of AR is contained in AR’s 2018 Annual Report on Form 10-K filed with the SEC on February 13, 2018 and certain of its Current Reports on Form 8-K. You can obtain a free copy of this document at the SEC’s website at www.sec.gov or by accessing the AMGP’s website at http:// www.anteroresources.com. Investors may obtain additional information regarding the interests of those persons and other persons who may be deemed participants in the Transaction by reading the joint proxy statement/prospectus regarding the Transaction when it becomes available. You may obtain free copies of this document as described above. 2
Legal Disclaimer This presentation includes “forward-looking statements.” Such forward-looking statements are subject to a number of risks and uncertainties, many of which are beyond AR’s control. All statements, except for statements of historical fact, made in this presentation regarding activities, events or developments AR expects, believes or anticipates will or may occur in the future, such as the expected sources of funding and timing for completion of the share repurchase program if at all, the expected consideration to be received in connection with the closing of the Transaction, the timing of the consummation of the Transaction, if at all, the extent to which AR will be shielded from tax payments associated with the Transaction, pro forma AM dividend and DCF coverage targets, estimated pro forma AM dividend CAGR and leverage metrics, AR’s expected ability to return capital to investors and targeted leverage metrics, AR’s estimated unhedged EBITDAX multiples, future plans for processing plants and fractionators, AR’s estimated production and the expected impact of Mariner East 2 on AR’s NGL pricing, are forward-looking statements within the meaning of Section 27A of the Securities Act of 1933 and Section 21E of the Securities Exchange Act of 1934. All forward-looking statements speak only as of the date of this presentation. Although AR believes that the plans, intentions and expectations reflected in or suggested by the forward-looking statements are reasonable, there is no assurance that these plans, intentions or expectations will be achieved. Therefore, actual outcomes and results could materially differ from what is expressed, implied or forecast in such statements. AR cautions you that these forward-looking statements are subject to all of the risks and uncertainties, most of which are difficult to predict and many of which are beyond the AR’s control, incident to the exploration for and development, production, gathering and sale of natural gas, NGLs and oil. These risks include, but are not limited to, commodity price volatility, inflation, lack of availability of drilling and production equipment and services, environmental risks, drilling and other operating risks, regulatory changes, the uncertainty inherent in estimating natural gas and oil reserves and in projecting future rates of production, cash flow and access to capital, the timing of development expenditures, and the other risks described under the heading "Item 1A. Risk Factors" in AR’s Annual Report on Form 10-K for the year ended December 31, 2017. This presentation includes certain financial measures that are not calculated in accordance with U.S. generally accepted accounting principles (“GAAP”). These measures include (i) Consolidated Adjusted EBITDAX, (ii) Stand-Alone Adjusted EBITDAX, (iii) Consolidated Adjusted Operating Cash Flow, (iv) Stand-Alone Adjusted Operating Cash Flow, (v) Free Cash Flow. Please see “Antero Definitions” and “Antero Non-GAAP Measures” for the definition of each of these measures as well as certain additional information regarding these measures, including the most comparable financial measures calculated in accordance with GAAP. Antero Resources Corporation is denoted as “AR” in the presentation, Antero Midstream Partners LP is denoted as “AM” and Antero Midstream GP LP is denoted as “AMGP”, which are their respective New York Stock Exchange ticker symbols. 3
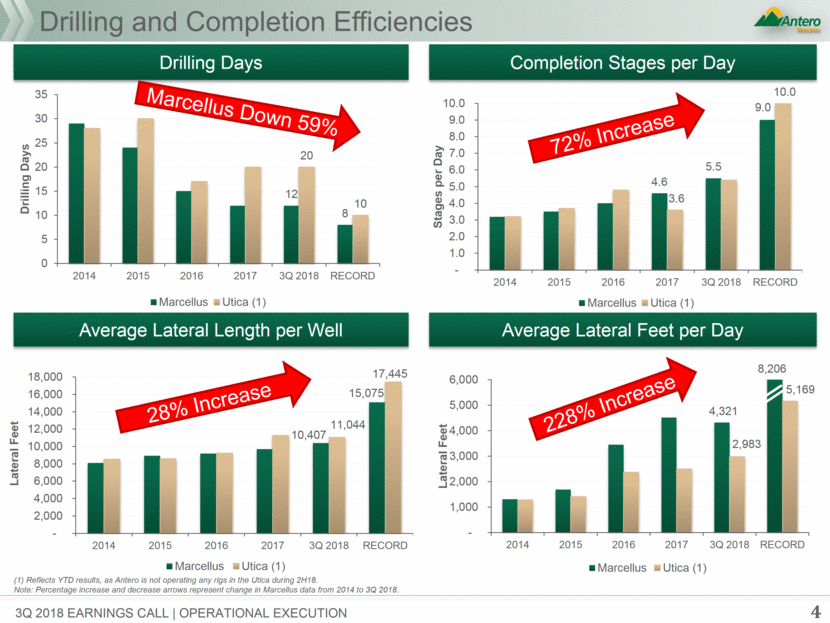
4 Drilling and Completion Efficiencies Average Lateral Feet per Day Drilling Days Average Lateral Length per Well Completion Stages per Day 3q 2018 earnings call operational execution 8,206 72% Increase 28% Increase 228% Increase (1) Reflects YTD results, as Antero is not operating any rigs in the Utica during 2H18. Note: Percentage increase and decrease arrows represent change in Marcellus data from 2014 to 3Q 2018. Marcellus Down 59% 4,321 2,983 5,169 - 1,000 2,000 3,000 4,000 5,000 6,000 2014 2015 2016 2017 3Q 2018 RECORD Lateral Feet Marcellus Utica (1) 10,407 15,075 11,044 17,445 - 2,000 4,000 6,000 8,000 10,000 12,000 14,000 16,000 18,000 2014 2015 2016 2017 3Q 2018 RECORD Lateral Feet Marcellus Utica (1) 4.6 5.5 9.0 3.6 10.0 - 1.0 2.0 3.0 4.0 5.0 6.0 7.0 8.0 9.0 10.0 2014 2015 2016 2017 3Q 2018 RECORD Stages per Day Marcellus Utica (1) 12 8 20 10 0 5 10 15 20 25 30 35 2014 2015 2016 2017 3Q 2018 RECORD Drilling Days Marcellus Utica (1)
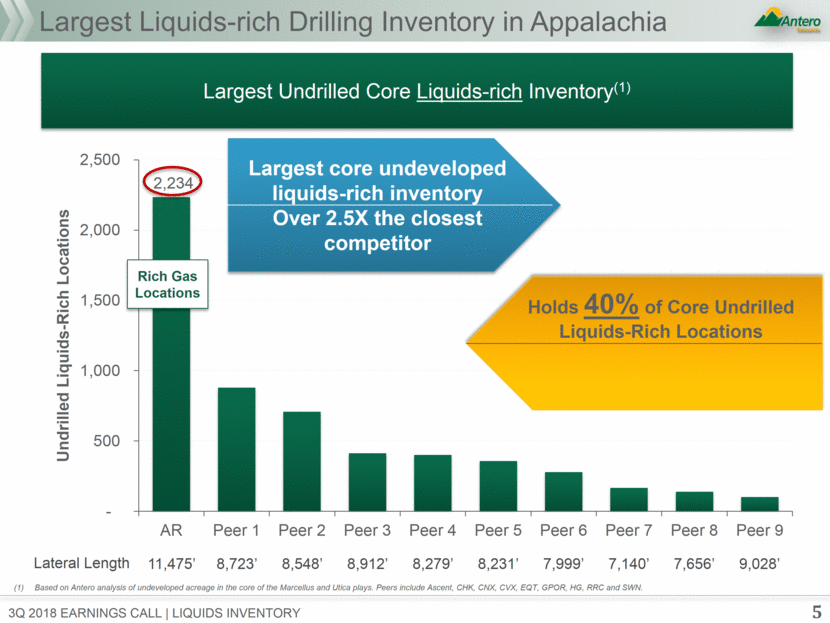
Largest Liquids-rich Drilling Inventory in Appalachia 5 Holds 40% of Core Undrilled Liquids-Rich Locations Based on Antero analysis of undeveloped acreage in the core of the Marcellus and Utica plays. Peers include Ascent, CHK, CNX, CVX, EQT, GPOR, HG, RRC and SWN. Largest core undeveloped liquids-rich inventory Over 2.5X the closest competitor Largest Undrilled Core Liquids-rich Inventory(1) Rich Gas Locations 3Q 2018 Earnings call Liquids inventory 11,475’ 8,723’ 8,548’ 8,912’ 8,279’ 8,231’ 7,999’ 7,140’ 7,656’ 9,028’ Lateral Length 2,234 - 500 1,000 1,500 2,000 2,500 AR Peer 1 Peer 2 Peer 3 Peer 4 Peer 5 Peer 6 Peer 7 Peer 8 Peer 9 Undrilled Liquids - Rich Locations
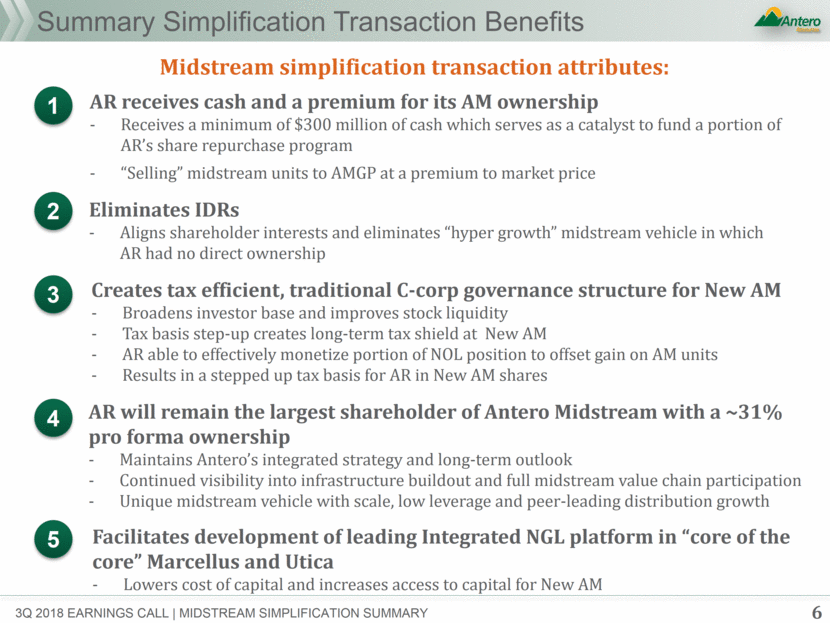
Summary Simplification Transaction Benefits AR will remain the largest shareholder of Antero Midstream with a ~31% pro forma ownership Maintains Antero’s integrated strategy and long-term outlook Continued visibility into infrastructure buildout and full midstream value chain participation Unique midstream vehicle with scale, low leverage and peer-leading distribution growth Creates tax efficient, traditional C-corp governance structure for New AM Broadens investor base and improves stock liquidity Tax basis step-up creates long-term tax shield at New AM AR able to effectively monetize portion of NOL position to offset gain on AM units Results in a stepped up tax basis for AR in New AM shares Eliminates IDRs Aligns shareholder interests and eliminates “hyper growth” midstream vehicle in which AR had no direct ownership 1 2 3 4 AR receives cash and a premium for its AM ownership Receives a minimum of $300 million of cash which serves as a catalyst to fund a portion of AR’s share repurchase program “Selling” midstream units to AMGP at a premium to market price Midstream simplification transaction attributes: Facilitates development of leading Integrated NGL platform in “core of the core” Marcellus and Utica Lowers cost of capital and increases access to capital for New AM 5 6 3q 2018 earnings call MIDSTREAM SIMPLIFICATION SUMMARY
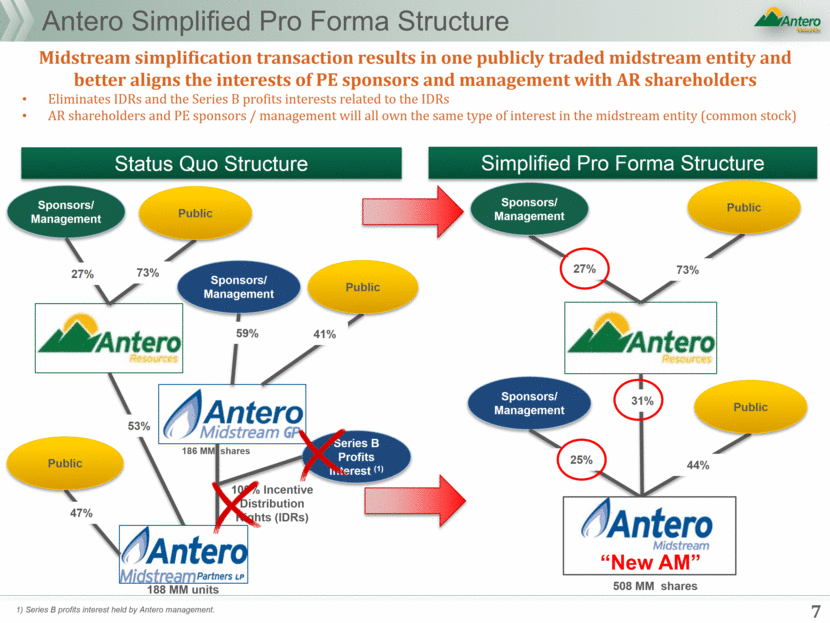
Status Quo Structure Antero Simplified Pro Forma Structure Simplified Pro Forma Structure 53% 100% Incentive Distribution Rights (IDRs) Sponsors/ Management Public Public 27% 73% Sponsors/ Management Public 59% 41% 47% 27% 73% 31% Midstream simplification transaction results in one publicly traded midstream entity and better aligns the interests of PE sponsors and management with AR shareholders Eliminates IDRs and the Series B profits interests related to the IDRs AR shareholders and PE sponsors / management will all own the same type of interest in the midstream entity (common stock) Public Public Sponsors/ Management Sponsors/ Management 25% 7 Series B Profits Interest (1) 44% 1) Series B profits interest held by Antero management. “New AM” 508 MM shares 188 MM units 186 MM shares
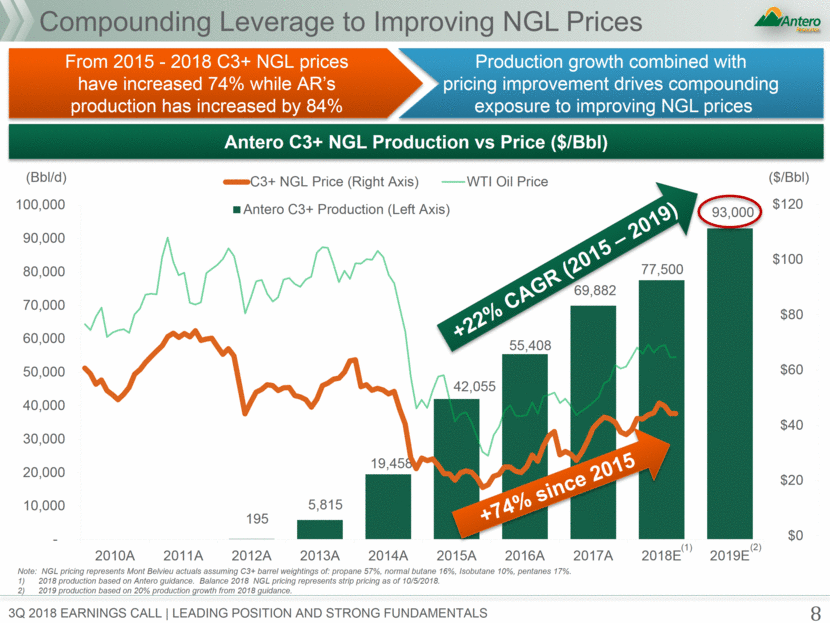
Compounding Leverage to Improving NGL Prices From 2015 - 2018 C3+ NGL prices have increased 74% while AR’s production has increased by 84% Production growth combined with pricing improvement drives compounding exposure to improving NGL prices Antero C3+ NGL Production vs Price ($/Bbl) (Bbl/d) ($/Bbl) (1) (2) Note: NGL pricing represents Mont Belvieu actuals assuming C3+ barrel weightings of: propane 57%, normal butane 16%, Isobutane 10%, pentanes 17%. 2018 production based on Antero guidance. Balance 2018 NGL pricing represents strip pricing as of 10/5/2018. 2019 production based on 20% production growth from 2018 guidance. +22% CAGR (2015 – 2019) +74% since 2015 8 3Q 2018 Earnings call leading position and strong fundamentals 195 5,815 19,458 42,055 55,408 69,882 77,500 93,000 - 10,000 20,000 30,000 40,000 50,000 60,000 70,000 80,000 90,000 100,000 2010A 2011A 2012A 2013A 2014A 2015A 2016A 2017A 2018E 2019E Antero C3+ Production (Left Axis) C3+ NGL Price (Right Axis) WTI Oil Price $0 $20 $40 $60 $80 $100 $120
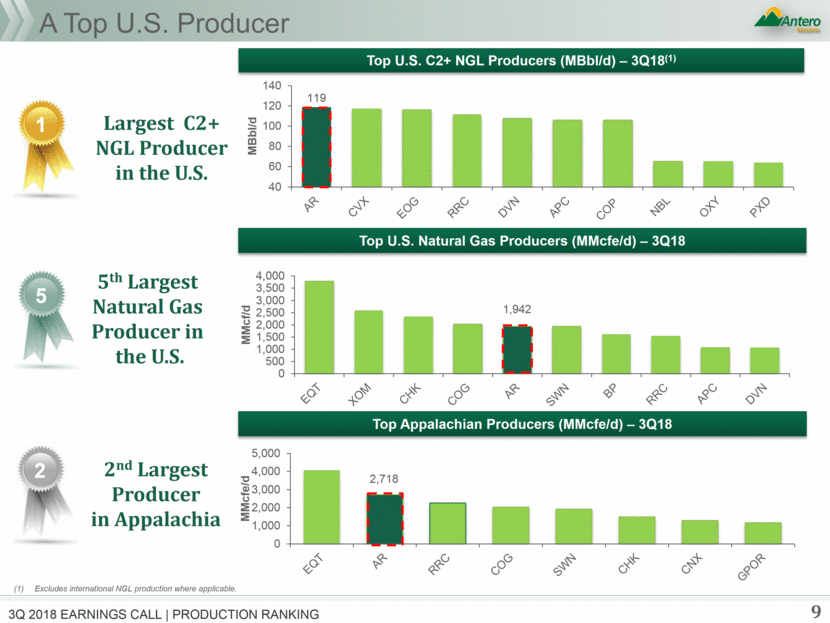
Top U.S. Natural Gas Producers (MMcfe/d) – 3Q18 Top Appalachian Producers (MMcfe/d) – 3Q18 Top U.S. C2+ NGL Producers (MBbl/d) – 3Q18(1) A Top U.S. Producer 9 Excludes international NGL production where applicable. 5th Largest Natural Gas Producer in the U.S. Largest C2+ NGL Producer in the U.S. 2nd Largest Producer in Appalachia 1 2 3Q 2018 EARNINGS CALL PRODUCTION RANKING 5 119 40 60 80 100 120 140 MBbl/d 2,718 0 1,000 2,000 3,000 4,000 5,000 MMcfe/d 0 500 1,000 1,500 2,000 2,500 3,000 3,500 4,000 MMcf/d 1,942
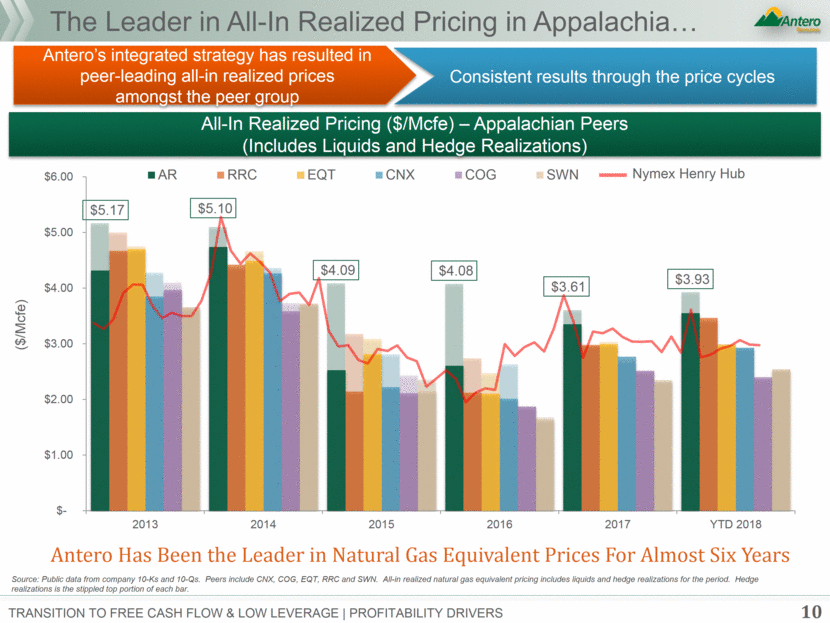
Consistent results through the price cycles Antero’s integrated strategy has resulted in peer-leading all-in realized prices amongst the peer group Source: Public data from company 10-Ks and 10-Qs. Peers include CNX, COG, EQT, RRC and SWN. All-in realized natural gas equivalent pricing includes liquids and hedge realizations for the period. Hedge realizations is the stippled top portion of each bar. The Leader in All-In Realized Pricing in Appalachia 10 Transition to Free Cash Flow & Low Leverage Profitability Drivers Antero Has Been the Leader in Natural Gas Equivalent Prices For Almost Six Years ($/Mcfe) Nymex Henry Hub All-In Realized Pricing ($/Mcfe) – Appalachian Peers (Includes Liquids and Hedge Realizations) $5.17 $5.10 $4.09 $4.08 $3.61 $3.93 $- $1.00 $2.00 $3.00 $4.00 $5.00 $6.00 2013 2014 2015 2016 2017 YTD 2018 AR RRC EQT CNX COG SWN
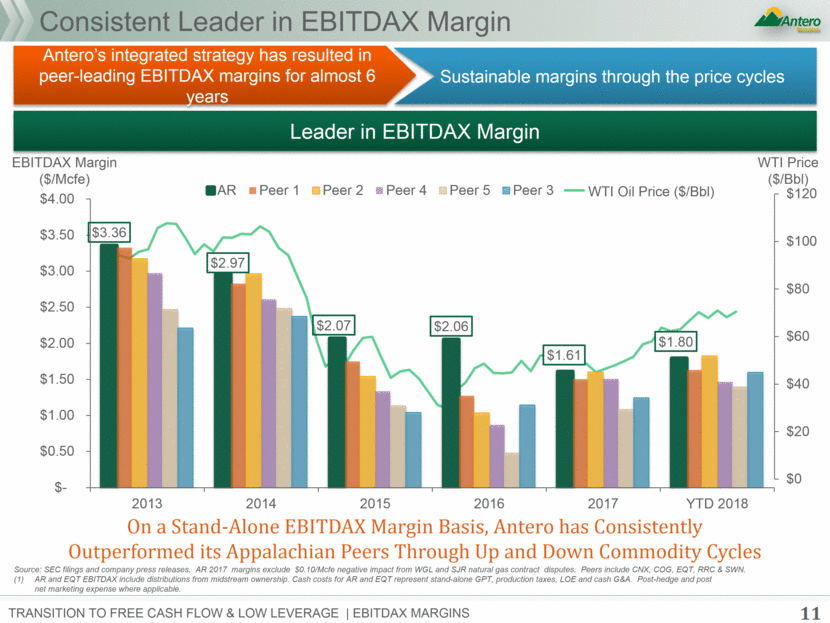
EBITDAX Margin ($/Mcfe) 11 Consistent Leader in EBITDAX Margin On a Stand-Alone EBITDAX Margin Basis, Antero has Consistently Outperformed its Appalachian Peers Through Up and Down Commodity Cycles Source: SEC filings and company press releases. AR 2017 margins exclude $0.10/Mcfe negative impact from WGL and SJR natural gas contract disputes. Peers include CNX, COG, EQT, RRC & SWN. AR and EQT EBITDAX include distributions from midstream ownership. Cash costs for AR and EQT represent stand-alone GPT, production taxes, LOE and cash G&A. Post-hedge and post net marketing expense where applicable. WTI Price ($/Bbl) WTI Oil Price ($/Bbl) Leader in EBITDAX Margin Transition to Free Cash Flow & Low Leverage EBITDAX margins Sustainable margins through the price cycles Antero’s integrated strategy has resulted in peer-leading EBITDAX margins for almost 6 years $3.36 $2.97 $2.07 $2.06 $1.61 $1.80 $- $0.50 $1.00 $1.50 $2.00 $2.50 $3.00 $3.50 $4.00 2013 2014 2015 2016 2017 YTD 2018 AR Peer 1 Peer 2 Peer 4 Peer 5 Peer 3 $0 $20 $40 $60 $80 $100 $120
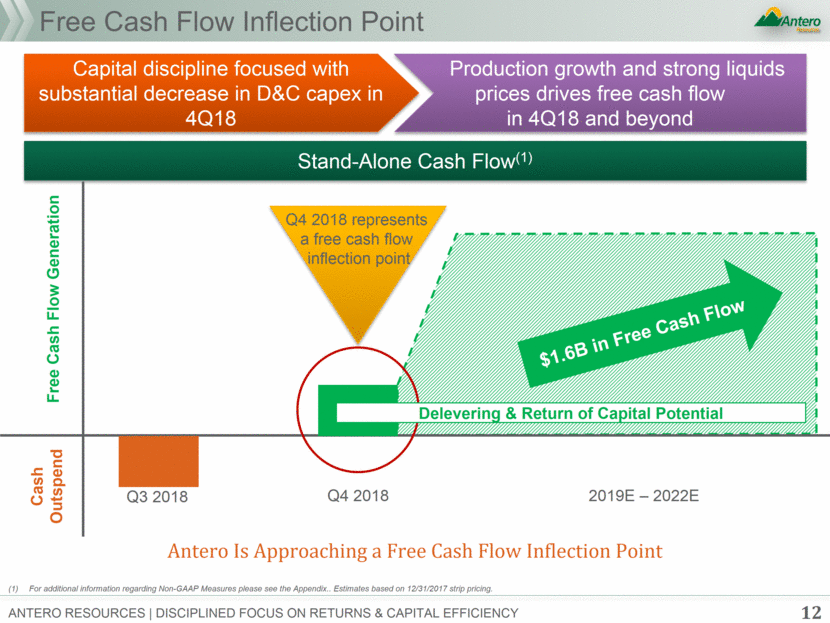
Free Cash Flow Inflection Point 12 Stand-Alone Cash Flow(1) Antero Is Approaching a Free Cash Flow Inflection Point For additional information regarding Non-GAAP Measures please see the Appendix.. Estimates based on 12/31/2017 strip pricing. Capital discipline focused with substantial decrease in D&C capex in 4Q18 Production growth and strong liquids prices drives free cash flow in 4Q18 and beyond Antero Resources disciplined focus on returns & capital efficiency Cash Outspend Free Cash Flow Generation Q4 2018 represents a free cash flow inflection point 2019E – 2022E Q3 2018 Q4 2018 $1.6B in Free Cash Flow Delevering & Return of Capital Potential
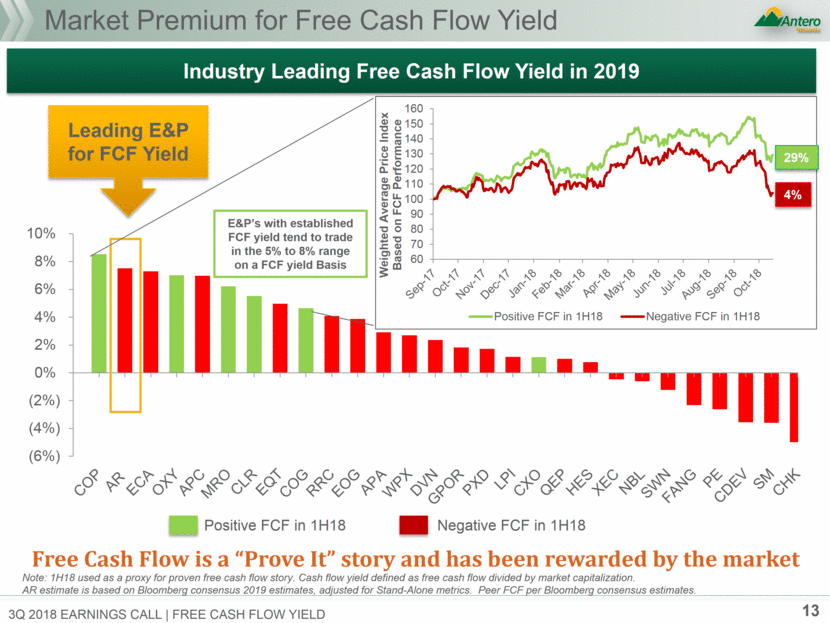
13 Market Premium for Free Cash Flow Yield Industry Leading Free Cash Flow Yield in 2019 Free Cash Flow is a “Prove It” story and has been rewarded by the market 29% 4% Leading E&P for FCF Yield Note: 1H18 used as a proxy for proven free cash flow story. Cash flow yield defined as free cash flow divided by market capitalization. AR estimate is based on Bloomberg consensus 2019 estimates, adjusted for Stand-Alone metrics. Peer FCF per Bloomberg consensus estimates. E&P’s with established FCF yield tend to trade in the 5% to 8% range on a FCF yield Basis 3Q 2018 EARNINGS CALL FREE CASH FLOW YIELD 60 70 80 90 100 110 120 130 140 150 160 Weighted Average Price Index Based on FCF Performance Positive FCF in 1H18 Negative FCF in 1H18 (6%) (4%) (2%) 0% 2% 4% 6% 8% 10% Positive FCF in 1H18 Negative FCF in 1H18
Appendix 14
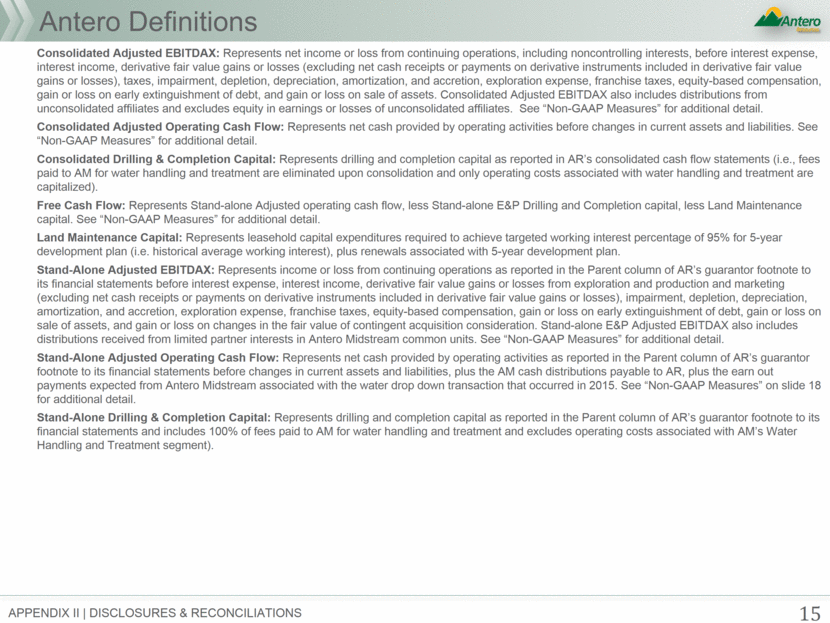
15 Appendix II disclosures & reconciliations Antero Definitions Consolidated Adjusted EBITDAX: Represents net income or loss from continuing operations, including noncontrolling interests, before interest expense, interest income, derivative fair value gains or losses (excluding net cash receipts or payments on derivative instruments included in derivative fair value gains or losses), taxes, impairment, depletion, depreciation, amortization, and accretion, exploration expense, franchise taxes, equity-based compensation, gain or loss on early extinguishment of debt, and gain or loss on sale of assets. Consolidated Adjusted EBITDAX also includes distributions from unconsolidated affiliates and excludes equity in earnings or losses of unconsolidated affiliates. See “Non-GAAP Measures” for additional detail. Consolidated Adjusted Operating Cash Flow: Represents net cash provided by operating activities before changes in current assets and liabilities. See “Non-GAAP Measures” for additional detail. Consolidated Drilling & Completion Capital: Represents drilling and completion capital as reported in AR’s consolidated cash flow statements (i.e., fees paid to AM for water handling and treatment are eliminated upon consolidation and only operating costs associated with water handling and treatment are capitalized). Free Cash Flow: Represents Stand-alone Adjusted operating cash flow, less Stand-alone E&P Drilling and Completion capital, less Land Maintenance capital. See “Non-GAAP Measures” for additional detail. Land Maintenance Capital: Represents leasehold capital expenditures required to achieve targeted working interest percentage of 95% for 5-year development plan (i.e. historical average working interest), plus renewals associated with 5-year development plan. Stand-Alone Adjusted EBITDAX: Represents income or loss from continuing operations as reported in the Parent column of AR’s guarantor footnote to its financial statements before interest expense, interest income, derivative fair value gains or losses from exploration and production and marketing (excluding net cash receipts or payments on derivative instruments included in derivative fair value gains or losses), impairment, depletion, depreciation, amortization, and accretion, exploration expense, franchise taxes, equity-based compensation, gain or loss on early extinguishment of debt, gain or loss on sale of assets, and gain or loss on changes in the fair value of contingent acquisition consideration. Stand-alone E&P Adjusted EBITDAX also includes distributions received from limited partner interests in Antero Midstream common units. See “Non-GAAP Measures” for additional detail. Stand-Alone Adjusted Operating Cash Flow: Represents net cash provided by operating activities as reported in the Parent column of AR’s guarantor footnote to its financial statements before changes in current assets and liabilities, plus the AM cash distributions payable to AR, plus the earn out payments expected from Antero Midstream associated with the water drop down transaction that occurred in 2015. See “Non-GAAP Measures” on slide 18 for additional detail. Stand-Alone Drilling & Completion Capital: Represents drilling and completion capital as reported in the Parent column of AR’s guarantor footnote to its financial statements and includes 100% of fees paid to AM for water handling and treatment and excludes operating costs associated with AM’s Water Handling and Treatment segment).
16 Antero Non-GAAP Measures Consolidated Adjusted EBITDAX, Stand-Alone Adjusted EBITDAX, Consolidated Adjusted Operating Cash Flow, Stand-Alone Adjusted Operating Cash Flow and Free Cash Flow are financial measures that are not calculated in accordance with U.S. generally accepted accounting principles (“GAAP”). The non-GAAP financial measures used by the company may not be comparable to similarly titled measures utilized by other companies. These measures should not be considered in isolation or as substitutes for their nearest GAAP measures. The Stand-alone measures are presented to isolate the results of the operations of Antero apart from the performance of Antero Midstream, which is otherwise consolidated into the results of Antero. Consolidated Adjusted EBITDAX and Stand-Alone Adjusted EBITDAX The GAAP financial measure nearest to Consolidated Adjusted EBITDAX is net income or loss including non-controlling interest that will be reported in Antero’s consolidated financial statements. The GAAP financial measure nearest to Stand-Alone Adjusted EBITDAX is Stand-alone net income or loss that will be reported in the Parent column of Antero’s guarantor footnote to its financial statements. While there are limitations associated with the use of Consolidated Adjusted EBITDAX and Stand-Alone Adjusted EBITDAX described below, management believes that these measures are useful to an investor in evaluating the company’s financial performance because these measures: • are widely used by investors in the oil and gas industry to measure a company’s operating performance without regard to items excluded from the calculation of such term, which can vary substantially from company to company depending upon accounting methods and book value of assets, capital structure and the method by which assets were acquired, among other factors; • helps investors to more meaningfully evaluate and compare the results of Antero’s operations (both on a consolidated and Stand-alone basis) from period to period by removing the effect of its capital structure from its operating structure; and • is used by management for various purposes, including as a measure of Antero’s operating performance (both on a consolidated and Stand-alone basis), in presentations to the company’s board of directors, and as a basis for strategic planning and forecasting. Consolidated Adjusted EBITDAX is also used by the board of directors as a performance measure in determining executive compensation. Consolidated Adjusted EBITDAX, as defined by our credit facility, is used by our lenders pursuant to covenants under our revolving credit facility and the indentures governing the company’s senior notes. There are significant limitations to using Consolidated Adjusted EBITDAX and Stand-Alone Adjusted EBITDAX as measures of performance, including the inability to analyze the effect of certain recurring and non-recurring items that materially affect the company’s net income on a consolidated and Stand-alone basis, the lack of comparability of results of operations of different companies and the different methods of calculating Adjusted EBITDAX reported by different companies. In addition, Consolidated Adjusted EBITDAX and Stand-Alone Adjusted EBITDAX provide no information regarding a company’s capital structure, borrowings, interest costs, capital expenditures, and working capital movement or tax position.
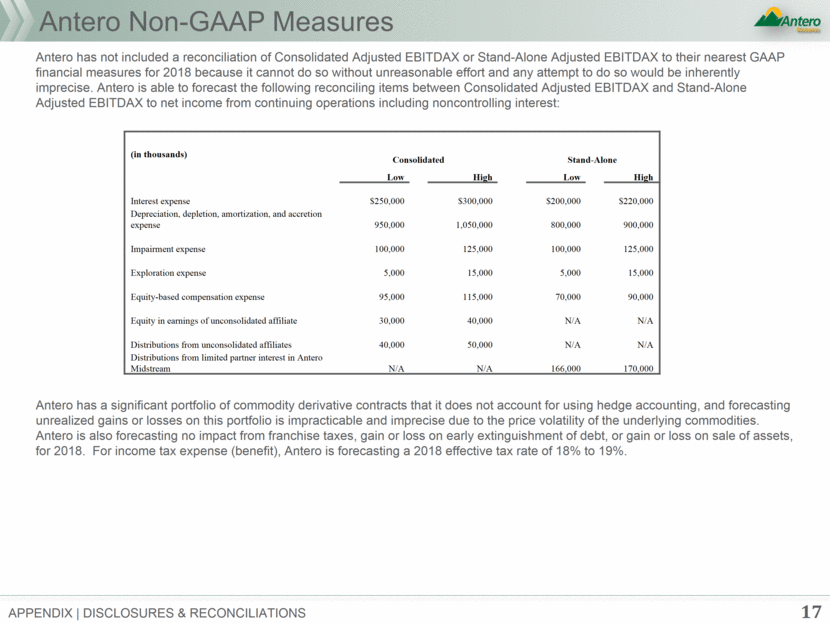
Appendix disclosures & reconciliations Antero Non-GAAP Measures Antero has not included a reconciliation of Consolidated Adjusted EBITDAX or Stand-Alone Adjusted EBITDAX to their nearest GAAP financial measures for 2018 because it cannot do so without unreasonable effort and any attempt to do so would be inherently imprecise. Antero is able to forecast the following reconciling items between Consolidated Adjusted EBITDAX and Stand-Alone Adjusted EBITDAX to net income from continuing operations including noncontrolling interest: Antero has a significant portfolio of commodity derivative contracts that it does not account for using hedge accounting, and forecasting unrealized gains or losses on this portfolio is impracticable and imprecise due to the price volatility of the underlying commodities. Antero is also forecasting no impact from franchise taxes, gain or loss on early extinguishment of debt, or gain or loss on sale of assets, for 2018. For income tax expense (benefit), Antero is forecasting a 2018 effective tax rate of 18% to 19%. (in thousands) Consolidated Stand-Alone Low High Low High Interest expense $250,000 $300,000 $200,000 $220,000 Depreciation, depletion, amortization, and accretion expense 950,000 1,050,000 800,000 900,000 Impairment expense 100,000 125,000 100,000 125,000 Exploration expense 5,000 15,000 5,000 15,000 Equity-based compensation expense 95,000 115,000 70,000 90,000 Equity in earnings of unconsolidated affiliate 30,000 40,000 N/A N/A Distributions from unconsolidated affiliates 40,000 50,000 N/A N/A Distributions from limited partner interest in Antero Midstream N/A N/A 166,000 170,000 17
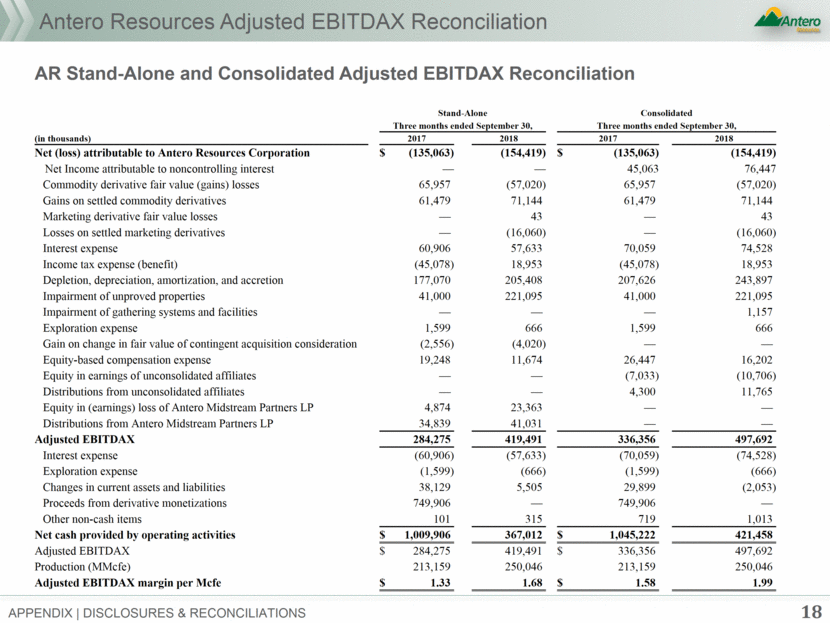
Antero Resources Adjusted EBITDAX Reconciliation Appendix disclosures & reconciliations AR Stand-Alone and Consolidated Adjusted EBITDAX Reconciliation 18 Stand-Alone Consolidated Three months ended September 30, Three months ended September 30, (in thousands) 2017 2018 2017 2018 Net (loss) attributable to Antero Resources Corporation $ (135,063) (154,419) $ (135,063) (154,419) Net Income attributable to noncontrolling interest — — 45,063 76,447 Commodity derivative fair value (gains) losses 65,957 (57,020) 65,957 (57,020) Gains on settled commodity derivatives 61,479 71,144 61,479 71,144 Marketing derivative fair value losses — 43 — 43 Losses on settled marketing derivatives — (16,060) — (16,060) Interest expense 60,906 57,633 70,059 74,528 Income tax expense (benefit) (45,078) 18,953 (45,078) 18,953 Depletion, depreciation, amortization, and accretion 177,070 205,408 207,626 243,897 Impairment of unproved properties 41,000 221,095 41,000 221,095 Impairment of gathering systems and facilities — — — 1,157 Exploration expense 1,599 666 1,599 666 Gain on change in fair value of contingent acquisition consideration (2,556) (4,020) — — Equity-based compensation expense 19,248 11,674 26,447 16,202 Equity in earnings of unconsolidated affiliates — — (7,033) (10,706) Distributions from unconsolidated affiliates — — 4,300 11,765 Equity in (earnings) loss of Antero Midstream Partners LP 4,874 23,363 — — Distributions from Antero Midstream Partners LP 34,839 41,031 — — Adjusted EBITDAX 284,275 419,491 336,356 497,692 Interest expense (60,906) (57,633) (70,059) (74,528) Exploration expense (1,599) (666) (1,599) (666) Changes in current assets and liabilities 38,129 5,505 29,899 (2,053) Proceeds from derivative monetizations 749,906 — 749,906 — Other non-cash items 101 315 719 1,013 Net cash provided by operating activities $ 1,009,906 367,012 $ 1,045,222 421,458 Adjusted EBITDAX $ 284,275 419,491 $ 336,356 497,692 Production (MMcfe) 213,159 250,046 213,159 250,046 Adjusted EBITDAX margin per Mcfe $ 1.33 1.68 $ 1.58 1.99
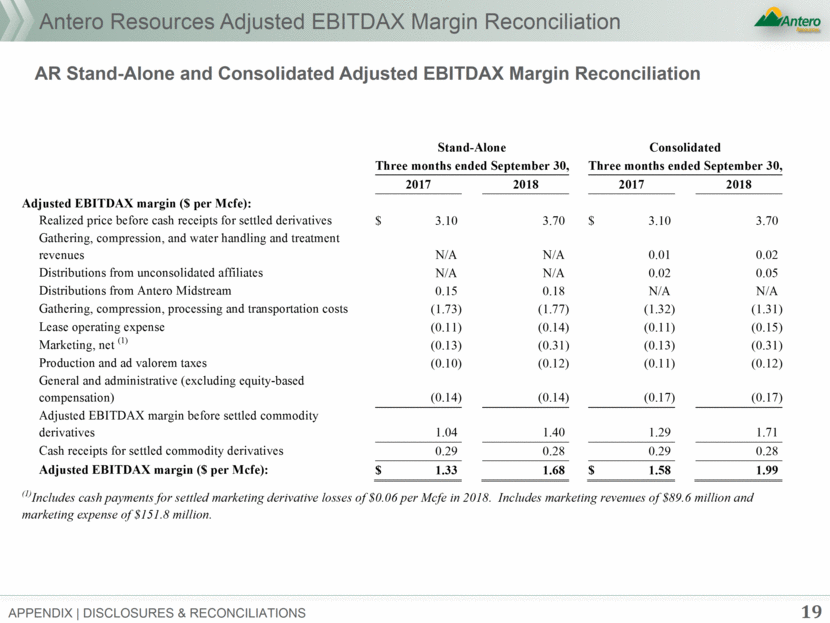
Antero Resources Adjusted EBITDAX Margin Reconciliation Appendix disclosures & reconciliations AR Stand-Alone and Consolidated Adjusted EBITDAX Margin Reconciliation 19 Stand-Alone Consolidated Three months ended September 30, Three months ended September 30, 2017 2018 2017 2018 Adjusted EBITDAX margin ($ per Mcfe): Realized price before cash receipts for settled derivatives $ 3.10 3.70 $ 3.10 3.70 Gathering, compression, and water handling and treatment revenues N/A N/A 0.01 0.02 Distributions from unconsolidated affiliates N/A N/A 0.02 0.05 Distributions from Antero Midstream 0.15 0.18 N/A N/A Gathering, compression, processing and transportation costs (1.73) (1.77) (1.32) (1.31) Lease operating expense (0.11) (0.14) (0.11) (0.15) Marketing, net (1) (0.13) (0.31) (0.13) (0.31) Production and ad valorem taxes (0.10) (0.12) (0.11) (0.12) General and administrative (excluding equity-based compensation) (0.14) (0.14) (0.17) (0.17) Adjusted EBITDAX margin before settled commodity derivatives 1.04 1.40 1.29 1.71 Cash receipts for settled commodity derivatives 0.29 0.28 0.29 0.28 Adjusted EBITDAX margin ($ per Mcfe): $ 1.33 1.68 $ 1.58 1.99 (1)Includes cash payments for settled marketing derivative losses of $0.06 per Mcfe in 2018. Includes marketing revenues of $89.6 million and marketing expense of $151.8 million.
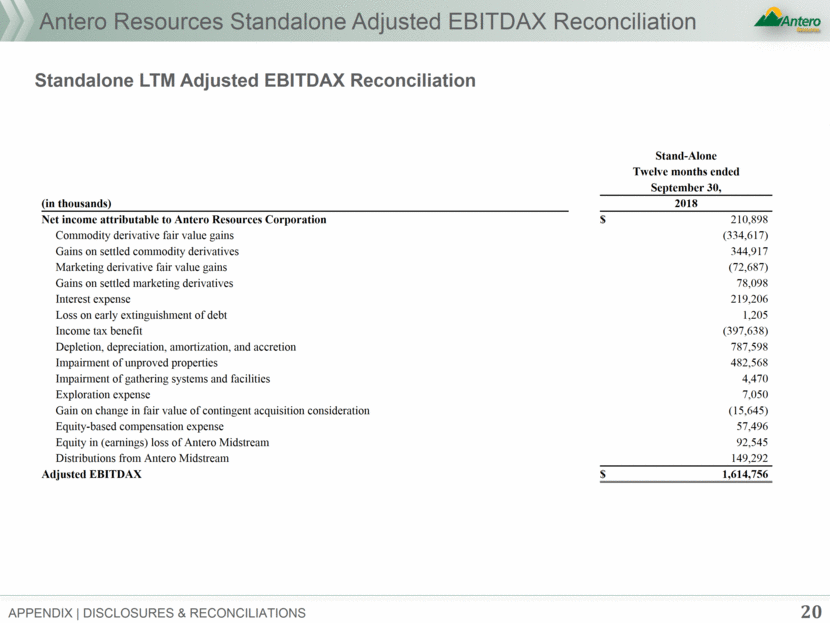
Antero Resources Standalone Adjusted EBITDAX Reconciliation Standalone LTM Adjusted EBITDAX Reconciliation Appendix disclosures & reconciliations 20 Stand-Alone Twelve months ended September 30, (in thousands) 2018 Net income attributable to Antero Resources Corporation $ 210,898 Commodity derivative fair value gains (334,617) Gains on settled commodity derivatives 344,917 Marketing derivative fair value gains (72,687) Gains on settled marketing derivatives 78,098 Interest expense 219,206 Loss on early extinguishment of debt 1,205 Income tax benefit (397,638) Depletion, depreciation, amortization, and accretion 787,598 Impairment of unproved properties 482,568 Impairment of gathering systems and facilities 4,470 Exploration expense 7,050 Gain on change in fair value of contingent acquisition consideration (15,645) Equity-based compensation expense 57,496 Equity in (earnings) loss of Antero Midstream 92,545 Distributions from Antero Midstream 149,292 Adjusted EBITDAX $ 1,614,756