Fiscal Year 2017 Fourth Quarter and Full Year Results Earnings Release Presentation - June 12, 2017
Page 2 Period Highlights • Successfully completed our initial public offering in March 2017, raising $218.5 million in gross proceeds, including the exercise of the underwriters’ over-allotment option • Total asset footprint (assets under management/advisement) reached a record amount of $342 billion, growing 35% over the prior fiscal year • Assets under management and fee-earning assets under management were $42 billion and $27 billion, respectively, as of March 31, 2017, up 11% and 12%, respectively, compared to March 31, 2016. • Declared a quarterly dividend of $0.175 per share of Class A common stock to record holders at the close of business on June 26, 2017 Business Performance Financial Results Dividend Dollars in millions Q4 FY17 vs. Q4 FY16 FY17 vs. FY16 Management and advisory fees $46.4 18% $172.7 10% GAAP net income $0.6 N/A $0.6 N/A GAAP EPS $0.03 N/A $0.03 N/A Non-GAAP EPS1 $0.25 N/A $0.91 N/A Fee Related Earnings1 $18.7 5% $72.3 3% Adjusted EBITDA1 $20.9 2% $83.0 22% 1 Non-GAAP earnings per share, Fee Related Earnings and Adjusted EBITDA are non-GAAP financial measures. For the reconciliations of our non-GAAP financial measures to the most directly comparable GAAP financial measures, see page 10 of the appendix.
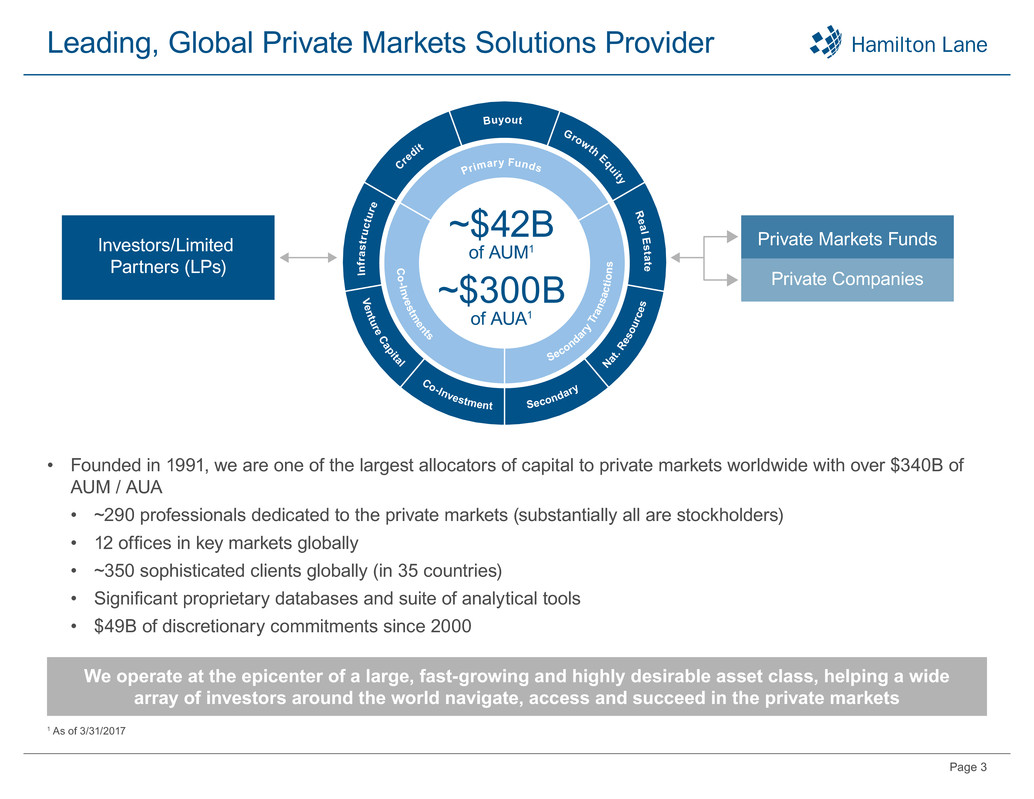
Page 3 Leading, Global Private Markets Solutions Provider • Founded in 1991, we are one of the largest allocators of capital to private markets worldwide with over $340B of AUM / AUA • ~290 professionals dedicated to the private markets (substantially all are stockholders) • 12 offices in key markets globally • ~350 sophisticated clients globally (in 35 countries) • Significant proprietary databases and suite of analytical tools • $49B of discretionary commitments since 2000 We operate at the epicenter of a large, fast-growing and highly desirable asset class, helping a wide array of investors around the world navigate, access and succeed in the private markets 1 As of 3/31/2017 ~$42B of AUM1 ~$300B of AUA1 Buyout Growth Eq uity R eal E state In fr as tr u ct ur e Cr ed it V enture Capital Co-Investment S eco nda ry N at . R es ou rc es C o -Investm ents S e co nd ar y Tr an sa ct io n s Prim ary Funds Private Markets Funds Private Companies Investors/Limited Partners (LPs)
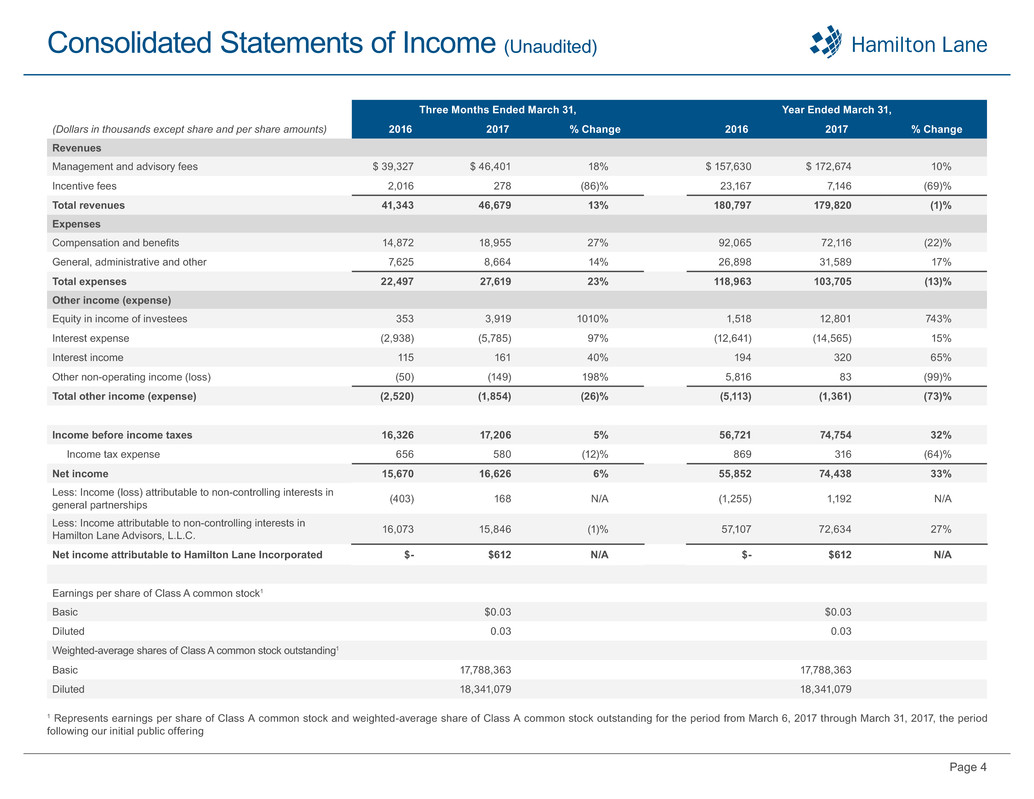
Page 4 Consolidated Statements of Income (Unaudited) Three Months Ended March 31, Year Ended March 31, (Dollars in thousands except share and per share amounts) 2016 2017 % Change 2016 2017 % Change Revenues Management and advisory fees $ 39,327 $ 46,401 18% $ 157,630 $ 172,674 10% Incentive fees 2,016 278 (86)% 23,167 7,146 (69)% Total revenues 41,343 46,679 13% 180,797 179,820 (1)% Expenses Compensation and benefits 14,872 18,955 27% 92,065 72,116 (22)% General, administrative and other 7,625 8,664 14% 26,898 31,589 17% Total expenses 22,497 27,619 23% 118,963 103,705 (13)% Other income (expense) Equity in income of investees 353 3,919 1010% 1,518 12,801 743% Interest expense (2,938) (5,785) 97% (12,641) (14,565) 15% Interest income 115 161 40% 194 320 65% Other non-operating income (loss) (50) (149) 198% 5,816 83 (99)% Total other income (expense) (2,520) (1,854) (26)% (5,113) (1,361) (73)% Income before income taxes 16,326 17,206 5% 56,721 74,754 32% Income tax expense 656 580 (12)% 869 316 (64)% Net income 15,670 16,626 6% 55,852 74,438 33% Less: Income (loss) attributable to non-controlling interests in general partnerships (403) 168 N/A (1,255) 1,192 N/A Less: Income attributable to non-controlling interests in Hamilton Lane Advisors, L.L.C. 16,073 15,846 (1)% 57,107 72,634 27% Net income attributable to Hamilton Lane Incorporated $- $612 N/A $- $612 N/A Earnings per share of Class A common stock1 Basic $0.03 $0.03 Diluted 0.03 0.03 Weighted-average shares of Class A common stock outstanding1 Basic 17,788,363 17,788,363 Diluted 18,341,079 18,341,079 1 Represents earnings per share of Class A common stock and weighted-average share of Class A common stock outstanding for the period from March 6, 2017 through March 31, 2017, the period following our initial public offering

Page 5 Non-GAAP Financial Measures 1 Incentive fee related compensation includes incentive fee compensation expense and bonus and other revenue sharing allocated to carried interest classified as base compensation. 2 Represents accrual of one-time payments to induce members of HLA to exchange their HLA units for HLI Class A common stock in the reorganization in connection with the IPO. 3 Represents write-down of unamortized discount and debt issuance costs due to the $160 million paydown of outstanding indebtedness under the Term Loan with proceeds from the IPO. 4 Represents corporate income taxes at assumed effective tax rate of 40.24% applied to adjusted pre-tax net income. The 40.24% is based on a federal tax statutory rate of 35.00% and a combined state income tax rate net of federal benefits of 5.24%. 5 Assumes the full exchange of Class B and Class C units in HLA for HLI Class A common stock. See page 10 for additional reconcilation to GAAP financial measures Three Months Ended March 31, Year Ended March 31, (Dollars in thousands except share and per share amounts) 2016 2017 % Change 2016 2017 % Change Adjusted EBITDA Management and advisory fees $39,327 $46,401 18% $157,630 $172,674 10% Total expenses 22,497 27,619 23% 118,963 103,705 (13)% Less: Incentive fee related compensation1 (989) 88 N/A (31,714) (3,283) (90)% Management fee related expenses 21,508 27,707 29% 87,249 100,422 15% Fee Related Earnings $17,819 $18,694 5% $70,381 $72,252 3% Incentive fees 2,016 278 (86)% 23,167 7,146 (69)% Incentive fee related compensation1 (989) 88 N/A (31,714) (3,283) (90)% Interest income 115 161 40% 194 320 65% Equity-based compensation 911 1,175 29% 3,730 4,681 25% Depreciation and amortization 501 475 (5)% 2,027 1,915 (6)% Adjusted EBITDA $20,373 $20,871 2% $67,785 $83,031 22% Adjusted EBITDA margin 49% 45% 37% 46% Non-GAAP earnings per share Net income attributable to Hamilton Lane Incorporated $612 $612 Income attributable to non-controlling interests in general partnerships 168 1,192 Income attributable to non-controlling interests in Hamilton Lane Advisors, L.L.C. 15,846 72,634 Income tax expense 580 316 IPO related expenses2 1,935 1,935 Write-off of deferred financing costs3 3,359 3,359 Adjusted pre-tax net income 22,500 80,048 Adjusted income taxes4 (9,054) (32,211) Adjusted net income $13,446 $47,837 Adjusted shares5 52,779,748 52,779,748 Non-GAAP earnings per share $0.25 $0.91
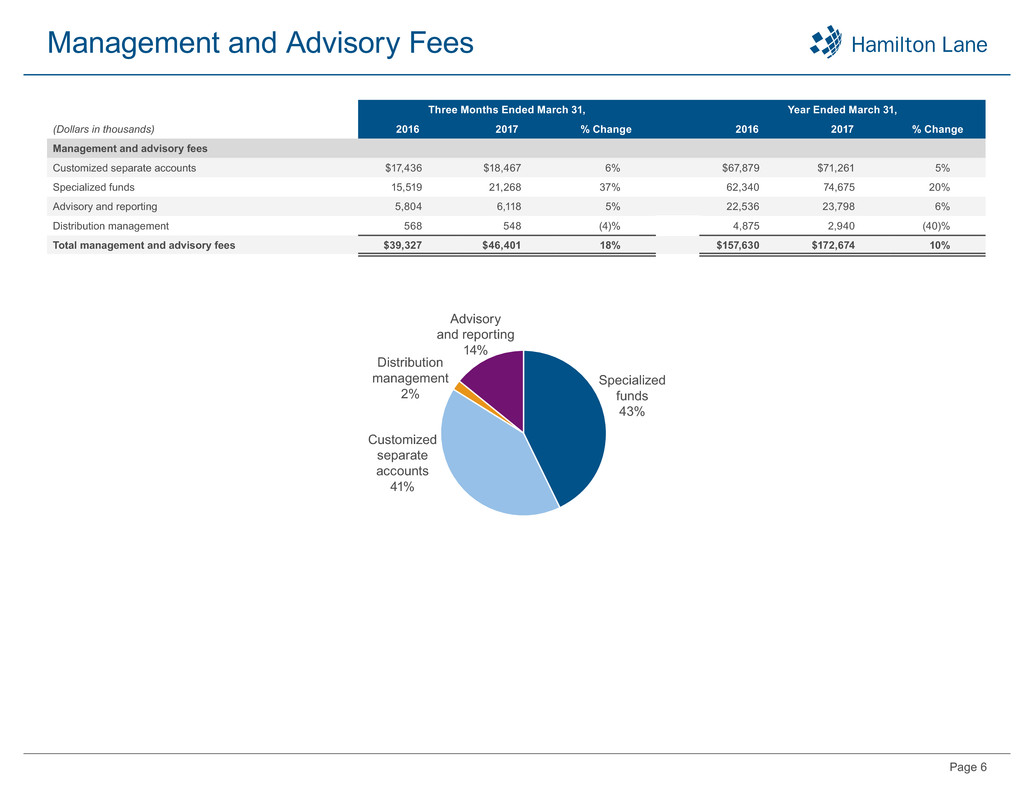
Page 6 Management and Advisory Fees Three Months Ended March 31, Year Ended March 31, (Dollars in thousands) 2016 2017 % Change 2016 2017 % Change Management and advisory fees Customized separate accounts $17,436 $18,467 6% $67,879 $71,261 5% Specialized funds 15,519 21,268 37% 62,340 74,675 20% Advisory and reporting 5,804 6,118 5% 22,536 23,798 6% Distribution management 568 548 (4)% 4,875 2,940 (40)% Total management and advisory fees $39,327 $46,401 18% $157,630 $172,674 10% Specialized funds 43% Customized separate accounts 41% Advisory and reporting 14% Distribution management 2%
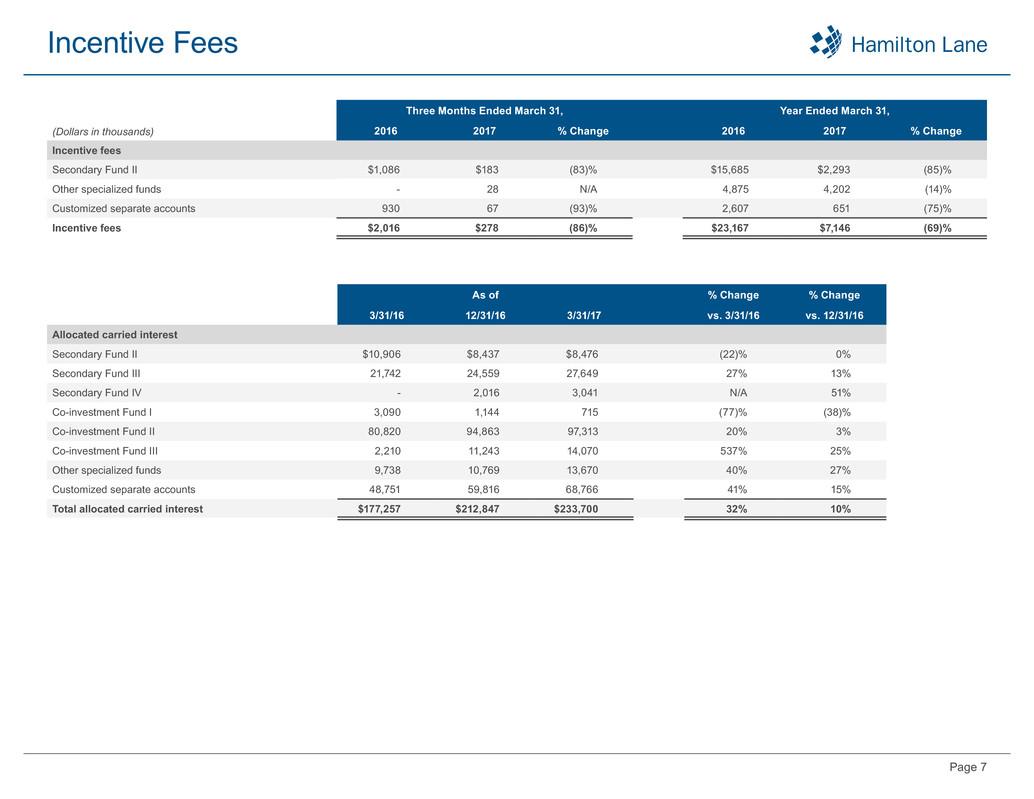
Page 7 Incentive Fees (Dollars in thousands) Three Months Ended March 31, Year Ended March 31, 2016 2017 % Change 2016 2017 % Change Incentive fees Secondary Fund II $1,086 $183 (83)% $15,685 $2,293 (85)% Other specialized funds - 28 N/A 4,875 4,202 (14)% Customized separate accounts 930 67 (93)% 2,607 651 (75)% Incentive fees $2,016 $278 (86)% $23,167 $7,146 (69)% As of % Change % Change 3/31/16 12/31/16 3/31/17 vs. 3/31/16 vs. 12/31/16 Allocated carried interest Secondary Fund II $10,906 $8,437 $8,476 (22)% 0% Secondary Fund III 21,742 24,559 27,649 27% 13% Secondary Fund IV - 2,016 3,041 N/A 51% Co-investment Fund I 3,090 1,144 715 (77)% (38)% Co-investment Fund II 80,820 94,863 97,313 20% 3% Co-investment Fund III 2,210 11,243 14,070 537% 25% Other specialized funds 9,738 10,769 13,670 40% 27% Customized separate accounts 48,751 59,816 68,766 41% 15% Total allocated carried interest $177,257 $212,847 $233,700 32% 10%

Page 8 Assets Under Management As of (Dollars in billions) 3/31/16 12/31/16 3/31/17 % Change vs. 3/31/16 % Change vs. 12/31/16 Assets under management / advisement Assets under management $37.5 $40.4 $41.8 11% 3% Assets under advisement 215.1 292.2 300.4 40% 3% Total assets under management / advisement $252.6 $332.6 $342.2 35% 3% Fee-earning assets under management Separate accounts $17.0 $17.7 $18.0 6% 2% Specialized funds 7.0 8.5 8.8 26% 4% Total fee-earning assets under management $24.0 $26.2 $26.8 12% 2% $17.0 $7.0 $24.0 $5.2 ($2.1) ($0.2) $26.8 $3.2 $18.0 $8.8 ($1.9) ($0.2) ($0.2) 3/31/16 Contributions Distributions 3/31/17FX, Market Value and Other $0.0$2.0 FEAUM Rollforward 3/31/16 to 3/31/17 $17.7 $8.5 $26.2 $1.8 ($1.3) $0.0 $26.8$0.4 $18.0 $8.8 ($1.2) ($0.1) $0.0 12/31/16 Contributions Distributions 3/31/17FX, Market Value and Other $0.0$1.4 FEAUM Rollforward 12/31/16 to 3/31/17 Customized Separate Accounts Specialized Funds

Appendix
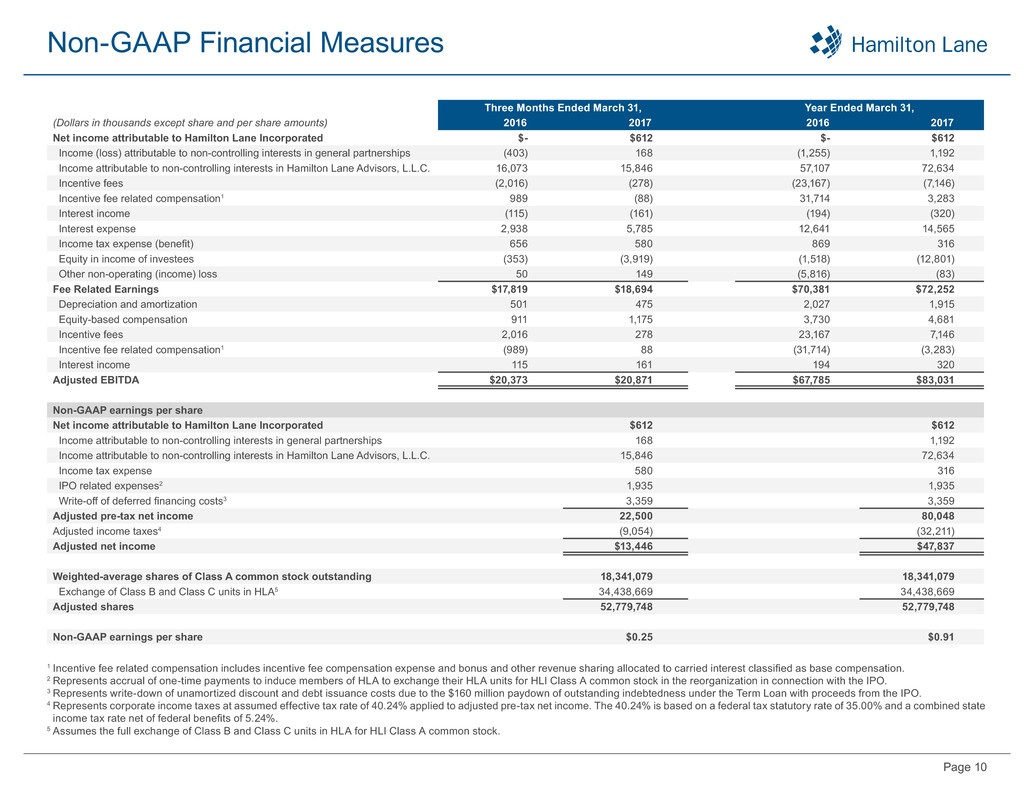
Page 10 Non-GAAP Financial Measures 1 Incentive fee related compensation includes incentive fee compensation expense and bonus and other revenue sharing allocated to carried interest classified as base compensation. 2 Represents accrual of one-time payments to induce members of HLA to exchange their HLA units for HLI Class A common stock in the reorganization in connection with the IPO. 3 Represents write-down of unamortized discount and debt issuance costs due to the $160 million paydown of outstanding indebtedness under the Term Loan with proceeds from the IPO. 4 Represents corporate income taxes at assumed effective tax rate of 40.24% applied to adjusted pre-tax net income. The 40.24% is based on a federal tax statutory rate of 35.00% and a combined state income tax rate net of federal benefits of 5.24%. 5 Assumes the full exchange of Class B and Class C units in HLA for HLI Class A common stock. Three Months Ended March 31, Year Ended March 31, (Dollars in thousands except share and per share amounts) 2016 2017 2016 2017 Net income attributable to Hamilton Lane Incorporated $- $612 $- $612 Income (loss) attributable to non-controlling interests in general partnerships (403) 168 (1,255) 1,192 Income attributable to non-controlling interests in Hamilton Lane Advisors, L.L.C. 16,073 15,846 57,107 72,634 Incentive fees (2,016) (278) (23,167) (7,146) Incentive fee related compensation1 989 (88) 31,714 3,283 Interest income (115) (161) (194) (320) Interest expense 2,938 5,785 12,641 14,565 Income tax expense (benefit) 656 580 869 316 Equity in income of investees (353) (3,919) (1,518) (12,801) Other non-operating (income) loss 50 149 (5,816) (83) Fee Related Earnings $17,819 $18,694 $70,381 $72,252 Depreciation and amortization 501 475 2,027 1,915 Equity-based compensation 911 1,175 3,730 4,681 Incentive fees 2,016 278 23,167 7,146 Incentive fee related compensation1 (989) 88 (31,714) (3,283) Interest income 115 161 194 320 Adjusted EBITDA $20,373 $20,871 $67,785 $83,031 Non-GAAP earnings per share Net income attributable to Hamilton Lane Incorporated $612 $612 Income attributable to non-controlling interests in general partnerships 168 1,192 Income attributable to non-controlling interests in Hamilton Lane Advisors, L.L.C. 15,846 72,634 Income tax expense 580 316 IPO related expenses2 1,935 1,935 Write-off of deferred financing costs3 3,359 3,359 Adjusted pre-tax net income 22,500 80,048 Adjusted income taxes4 (9,054) (32,211) Adjusted net income $13,446 $47,837 Weighted-average shares of Class A common stock outstanding 18,341,079 18,341,079 Exchange of Class B and Class C units in HLA5 34,438,669 34,438,669 Adjusted shares 52,779,748 52,779,748 Non-GAAP earnings per share $0.25 $0.91
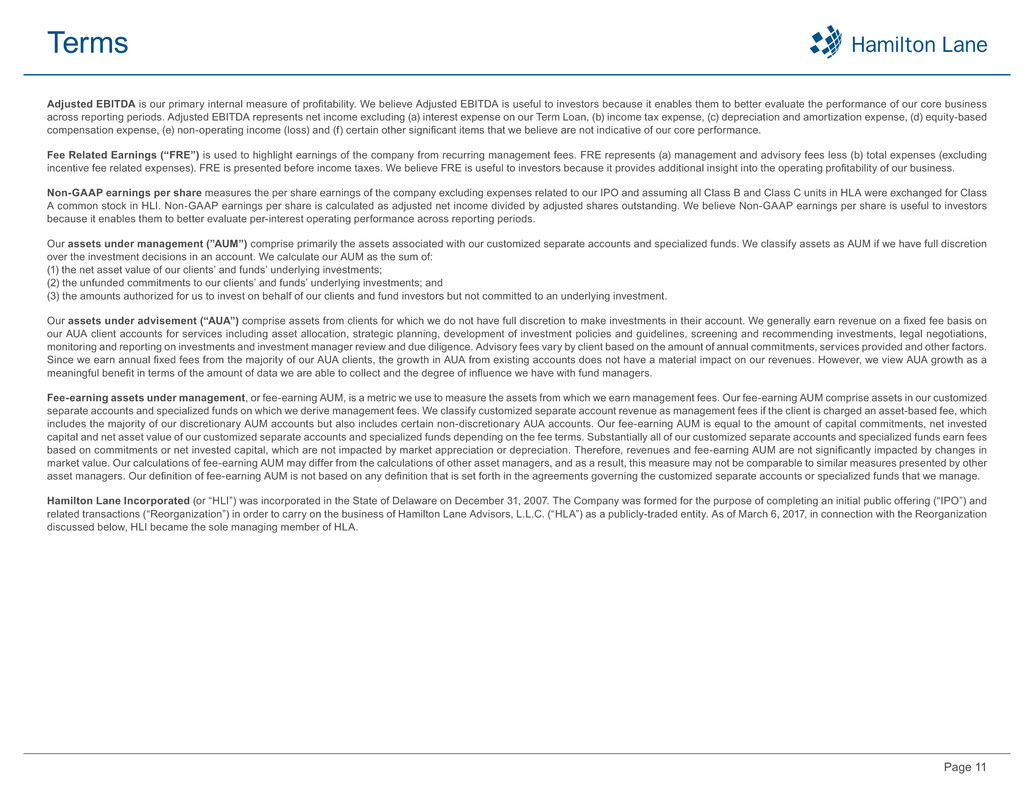
Page 11 Terms Adjusted EBITDA is our primary internal measure of profitability. We believe Adjusted EBITDA is useful to investors because it enables them to better evaluate the performance of our core business across reporting periods. Adjusted EBITDA represents net income excluding (a) interest expense on our Term Loan, (b) income tax expense, (c) depreciation and amortization expense, (d) equity-based compensation expense, (e) non-operating income (loss) and (f) certain other significant items that we believe are not indicative of our core performance. Fee Related Earnings (“FRE”) is used to highlight earnings of the company from recurring management fees. FRE represents (a) management and advisory fees less (b) total expenses (excluding incentive fee related expenses). FRE is presented before income taxes. We believe FRE is useful to investors because it provides additional insight into the operating profitability of our business. Non-GAAP earnings per share measures the per share earnings of the company excluding expenses related to our IPO and assuming all Class B and Class C units in HLA were exchanged for Class A common stock in HLI. Non-GAAP earnings per share is calculated as adjusted net income divided by adjusted shares outstanding. We believe Non-GAAP earnings per share is useful to investors because it enables them to better evaluate per-interest operating performance across reporting periods. Our assets under management (”AUM”) comprise primarily the assets associated with our customized separate accounts and specialized funds. We classify assets as AUM if we have full discretion over the investment decisions in an account. We calculate our AUM as the sum of: (1) the net asset value of our clients’ and funds’ underlying investments; (2) the unfunded commitments to our clients’ and funds’ underlying investments; and (3) the amounts authorized for us to invest on behalf of our clients and fund investors but not committed to an underlying investment. Our assets under advisement (“AUA”) comprise assets from clients for which we do not have full discretion to make investments in their account. We generally earn revenue on a fixed fee basis on our AUA client accounts for services including asset allocation, strategic planning, development of investment policies and guidelines, screening and recommending investments, legal negotiations, monitoring and reporting on investments and investment manager review and due diligence. Advisory fees vary by client based on the amount of annual commitments, services provided and other factors. Since we earn annual fixed fees from the majority of our AUA clients, the growth in AUA from existing accounts does not have a material impact on our revenues. However, we view AUA growth as a meaningful benefit in terms of the amount of data we are able to collect and the degree of influence we have with fund managers. Fee-earning assets under management, or fee-earning AUM, is a metric we use to measure the assets from which we earn management fees. Our fee-earning AUM comprise assets in our customized separate accounts and specialized funds on which we derive management fees. We classify customized separate account revenue as management fees if the client is charged an asset-based fee, which includes the majority of our discretionary AUM accounts but also includes certain non-discretionary AUA accounts. Our fee-earning AUM is equal to the amount of capital commitments, net invested capital and net asset value of our customized separate accounts and specialized funds depending on the fee terms. Substantially all of our customized separate accounts and specialized funds earn fees based on commitments or net invested capital, which are not impacted by market appreciation or depreciation. Therefore, revenues and fee-earning AUM are not significantly impacted by changes in market value. Our calculations of fee-earning AUM may differ from the calculations of other asset managers, and as a result, this measure may not be comparable to similar measures presented by other asset managers. Our definition of fee-earning AUM is not based on any definition that is set forth in the agreements governing the customized separate accounts or specialized funds that we manage. Hamilton Lane Incorporated (or “HLI”) was incorporated in the State of Delaware on December 31, 2007. The Company was formed for the purpose of completing an initial public offering (“IPO”) and related transactions (“Reorganization”) in order to carry on the business of Hamilton Lane Advisors, L.L.C. (“HLA”) as a publicly-traded entity. As of March 6, 2017, in connection with the Reorganization discussed below, HLI became the sole managing member of HLA.


