Filed by John Bean Technologies Corporation
Pursuant to Rule 425 under the Securities Act of 1933
and deemed filed pursuant to Rule 14a-12
under the Securities Exchange Act of 1934
Subject Companies:
John Bean Technologies Corporation
(Commission File No.: 001-34036)
Marel hf.
Investor Presentation May 2024
Forward-Looking and Non-GAAP StatementsThese slides and the accompanying presentation (collectively, the “presentation”) contain forward-looking statements as defined in the Private Securities Litigation Reform Act of 1995. Forward-looking statements are information of a non-historical nature and are subject to risks and uncertainties that are beyond JBT’s ability to control. These forward-looking statements include, among others, statements relating to our business and our results of operations, a potential transaction with Marel, our strategic plans, our restructuring plans and expected cost savings from those plans, and our liquidity. The factors that could cause our actual results to differ materially from expectations include, but are not limited to, the following factors: the occurrence of any event, change or other circumstances that could give rise to the termination or abandonment of the offer for Marel Shares (the “Offer”); the expected timing and likelihood of completion of the proposed transaction with Marel, including the timing, receipt and terms and conditions of any required governmental and regulatory approvals of the offer that could reduce anticipated benefits or cause the parties to abandon the transaction; the possibility that our stockholders may not approve the issuance of new shares of common stock in the offer; the risk that Marel and/or JBT may not be able to satisfy the conditions to the proposed offer in a timely manner or at all; the risk that the proposed offer and its announcement could have an adverse effect on the ability of JBT and Marel to retain customers and retain and hire key personnel and maintain relationships with their suppliers and customers and on their operating results and businesses generally; the risk that problems may arise in successfully integrating the businesses of Marel and JBT, which may result in the combined company not operating as effectively and efficiently as expected; the risk that the combined company may be unable to achieve cost-cutting synergies or that it may take longer than expected to achieve those synergies; fluctuations in our financial results; unanticipated delays or acceleration in our sales cycles; deterioration of economic conditions; including impacts from supply chain delays and reduced material or component availability; inflationary pressures, including increases in energy, raw material, freight, and labor costs; disruptions in the political, regulatory, economic and social conditions of the countries in which we conduct business; changes to trade regulation, quotas, duties or tariffs; fluctuations in currency exchange rates; changes in food consumption patterns; impacts of pandemic illnesses, food borne illnesses and diseases to various agricultural products; weather conditions and natural disasters; the impact of climate change and environmental protection initiatives; acts of terrorism or war, including the ongoing conflicts in Ukraine and the Middle East; termination or loss of major customer contracts and risks associated with fixed-price contracts, particularly during periods of high inflation; customer sourcing initiatives; competition and innovation in our industries; difficulty in implementing our pure play food and beverage strategy, including our ability to execute on strategic investments, merger or acquisition opportunities; our ability to develop and introduce new or enhanced products and services and keep pace with technological developments; difficulty in developing, preserving and protecting our intellectual property or defending claims of infringement; catastrophic loss at any of our facilities and business continuity of our information systems; cyber-security risks such as network intrusion or ransomware schemes; loss of key management and other personnel; potential liability arising out of the installation or use of our systems; our ability to comply with U.S. and international laws governing our operations and industries; increases in tax liabilities; work stoppages; fluctuations in interest rates and returns on pension assets; a systemic failure of the banking system in the United States or globally impacting our customers’ financial condition and their demand for our goods and services; availability of and access to financial and other resources; and other factors described under the captions “Risk Factors” and “Management’s Discussion and Analysis of Financial Condition and Results of Operations” in JBT’s most recent Annual Report on Form 10-K filed with the Securities and Exchange Commission and in any subsequently filed Quarterly Reports on Form 10-Q. JBT cautions shareholders and prospective investors that actual results may differ materially from those indicated by the forward-looking statements. JBT undertakes no obligation to publicly update or revise any forward-looking statements whether as a result of new information, future developments, subsequent events or changes in circumstances or otherwise.JBT provides non-GAAP financial measures in order to increase transparency in our operating results and trends. These non-GAAP measures eliminate certain costs or benefits from, or change the calculation of, a measure as calculated under U.S. GAAP. By eliminating these items, JBT provides a more meaningful comparison of our ongoing operating results, consistent with how management evaluates performance. Management uses these non-GAAP measures in financial and operational evaluation, planning and forecasting. These calculations may differ from similarly-titled measures used by other companies. The non-GAAP financial measures disclosed are not intended to be used as a substitute for, nor should they be considered in isolation of, financial measures prepared in accordance with U.S. GAAP.
Important Additional InformationImportant Notices This presentation is not intended to and does not constitute an offer to sell or the solicitation of an offer to buy any securities or a solicitation of any vote or approval, nor shall there be any sale of securities in any jurisdiction in which such offer, solicitation or sale would be unlawful prior to registration or qualification under the securities laws of any such jurisdiction. In particular, this presentation is not an offer of securities for sale in the United States, Iceland, the Netherlands, or Denmark.Note to U.S. ShareholdersIt is important that U.S. shareholders understand that the offer and any related offer documents are subject to disclosure and takeover laws and regulations in Iceland and other European jurisdictions, which may be different from those of the United States. The offer will be made in compliance with the U.S. tender offer rules, including Regulation 14E under the Exchange Act and any exemption available to JBT in respect of securities of foreign private issuers provided by Rule 14d-1(d) under the Exchange Act. Important Additional InformationNo offer of JBT securities shall be made except by means of a prospectus meeting the requirements of Section 10 of the Securities Act of 1933, as amended, or an exemption from registration, and applicable European regulations, including the Icelandic Prospectus Act no. 14/2020 and the Icelandic Takeover Act no. 108/2007 on takeovers. In connection with the proposed offer, JBT is expected to file with the SEC a Registration Statement on Form S-4, which will contain a proxy statement/prospectus in connection with the proposed offer. Additionally, JBT has filed with the Financial Supervisory Authority of the Central Bank of Iceland (the “FSA)” for approval a draft prospectus in accordance with Regulation (EU) 2017/1129 of the European Parliament and of the Council of 14 June 2017 for the shares to be issued in connection with the proposed offer and for the listing and admission to trading on Nasdaq Iceland of JBT securities (the “prospectus”). JBT has also filed a draft offer document with the FSA. SHAREHOLDERS OF JBT AND MAREL ARE URGED TO READ THE FORM S-4, INCLUDING THE PROXY STATEMENT/ PROSPECTUS CONTAINED THEREIN, THE PROSPECTUS, AND THE OFFER DOCUMENT, AS APPLICABLE, AS WELL AS ANY AMENDMENTS OR SUPPLEMENTS TO THOSE DOCUMENTS AND ANY OTHER RELEVANT DOCUMENTS THAT WILL BE FILED WITH THE SEC OR THE FSA CAREFULLY AND IN THEIR ENTIRETY WHEN THEY BECOME AVAILABLE BECAUSE THEY WILL CONTAIN IMPORTANT INFORMATION. JBT and Marel shareholders will be able to obtain a free copy of the proxy statement/prospectus (when available), as well as other filings containing information about JBT, without charge, at the SEC’s website at www.sec.gov, and on JBT’s website at https://ir.jbtc.com/overview/default.aspx. Following approval by the FSA, you may obtain a free copy of the prospectus on the FSA’s website at www.fme.is and on JBT’s website at www.jbtc.com as well as a free copy of the offer document, which will also be sent in hard copy to all registered shareholders of Marel.Participants in the Solicitation JBT and its directors and executive officers may be deemed to be participants in the solicitation of proxies from the holders of JBT’s common stock in respect of the offer to Marel shareholders. Information about the directors and executive officers of JBT is set forth in the proxy statement for JBT’s 2024 Annual Meeting of Stockholders, which was filed with the SEC on March 28, 2024, and in the other documents filed after the date thereof by JBT with the SEC. Investors may obtain additional information regarding the interests of such participants by reading the proxy statement/prospectus regarding the proposed offer when it becomes available. You may obtain free copies of these documents as described in the preceding paragraph.

Introduction to JBT
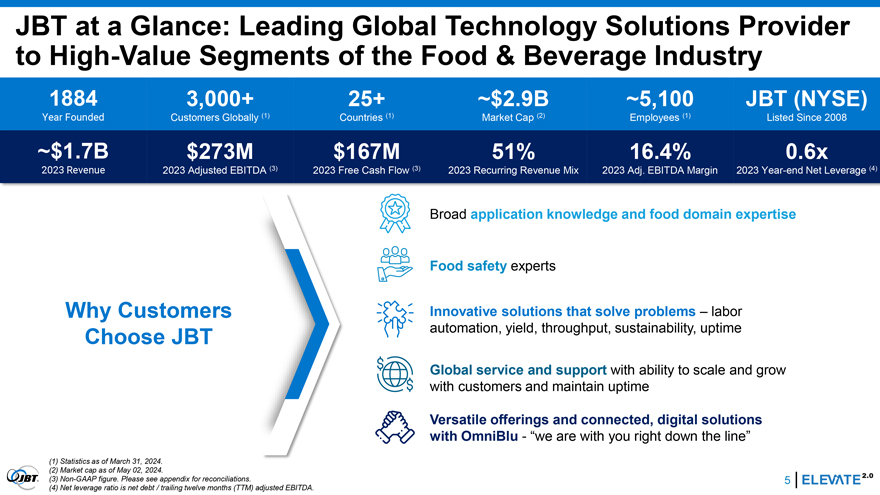
JBT at a Glance: Leading Global Technology Solutions Provider to High-Value Segments of the Food & Beverage Industry 1884 3,000+ 25+ ~$2.9B ~5,100 JBT (NYSEYear Founded Customers Globally (1) Countries (1) Market Cap (2) Employees (1) Listed Since 2008~$1.7B $273M $167M 51% 16.4% 0.6 2023 Revenue 2023 Adjusted EBITDA (3) 2023 Free Cash Flow (3) 2023 Recurring Revenue Mix 2023 Adj. EBITDA Margin 2023 Year-end Net Leverage (4)Why Customers Choose JBTBroad application knowledge and food domain expertiseFood safety expertsInnovative solutions that solve problems – labor automation, yield, throughput, sustainability, uptimeGlobal service and support with ability to scale and grow with customers and maintain uptimeVersatile offerings and connected, digital solutions with OmniBlu—“we are with you right down the line”
6 2
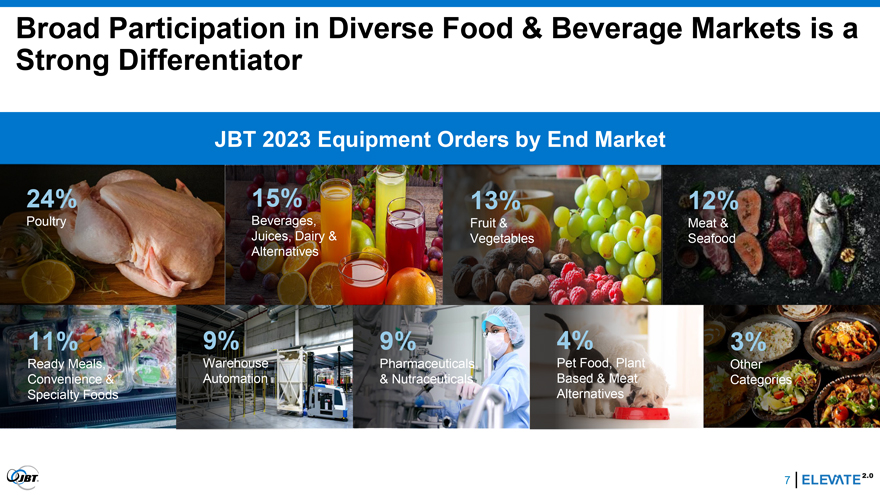
Broad Participation in Diverse Food & Beverage Markets is a Strong Differentiator JBT 2023 Equipment Orders by End Market 24% 15% 13% 12% Poultry Beverages, Fruit & Meat & Juices, Dairy & Vegetables Seafood Alternatives 11% 9% 9% 4% 3% Ready Meals, Warehouse Pharmaceuticals Pet Food, Plant Other Convenience & Automation & Nutraceuticals Based & Meat Categories Specialty Foods Alternatives 7 2
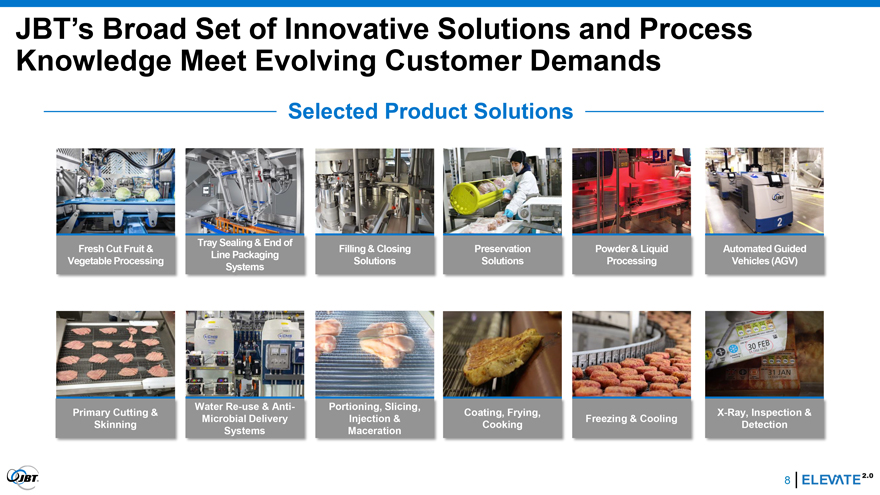
JBT’s Broad Set of Innovative Solutions and Process Knowledge Meet Evolving Customer Demands Selected Product Solutions Tray Sealing & End of Fresh Cut Fruit & Filling & Closing Preservation Powder & Liquid Automated Guided Line Packaging Vegetable Processing Solutions Solutions Processing Vehicles (AGV) Systems Water Re-use & Anti- Portioning, Slicing, Primary Cutting & Coating, Frying, X-Ray, Inspection & Microbial Delivery Injection & Freezing & Cooling Skinning Cooking Detection Systems Maceration 8 2
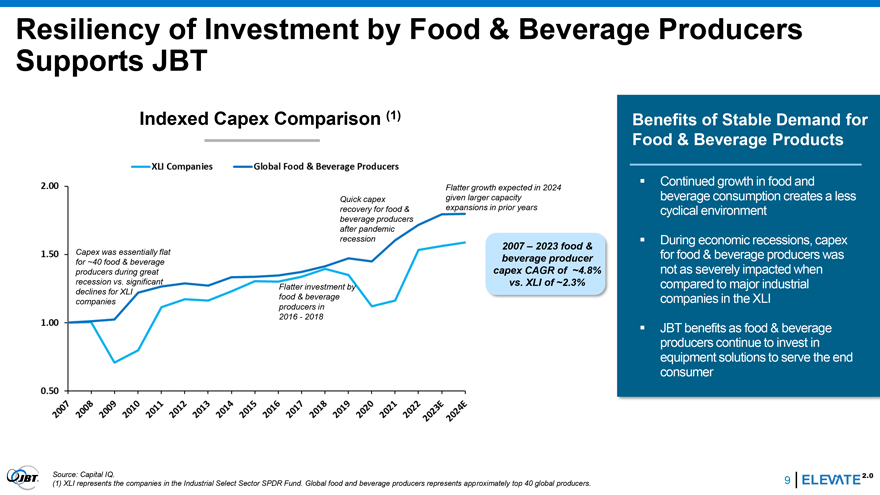
Resiliency of Investment by Food & Beverage Producers Supports JBT Indexed Capex Comparison (1) Benefits of Stable Demand for Food & Beverage Products Continued growth in food and Flatter growth expected in 2024 Quick capex given larger capacity beverage consumption creates a less recovery for food & expansions in prior years cyclical environment beverage producers after pandemic recession During economic recessions, capex 2007 – 2023 food & Capex was essentially flat for food & beverage producers was for ~40 food & beverage beverage producer producers during great capex CAGR of ~4.8% not as severely impacted when recession vs. significant vs. XLI of ~2.3% compared to major industrial Flatter investment by declines for XLI food & beverage companies in the XLI companies producers in 2016 - 2018 JBT benefits as food & beverage producers continue to invest in equipment solutions to serve the end consumer Source: Capital IQ. (1) XLI represents the companies in the Industrial Select Sector SPDR Fund. Global food and beverage producers represents approximately top 40 global producers. 9 2
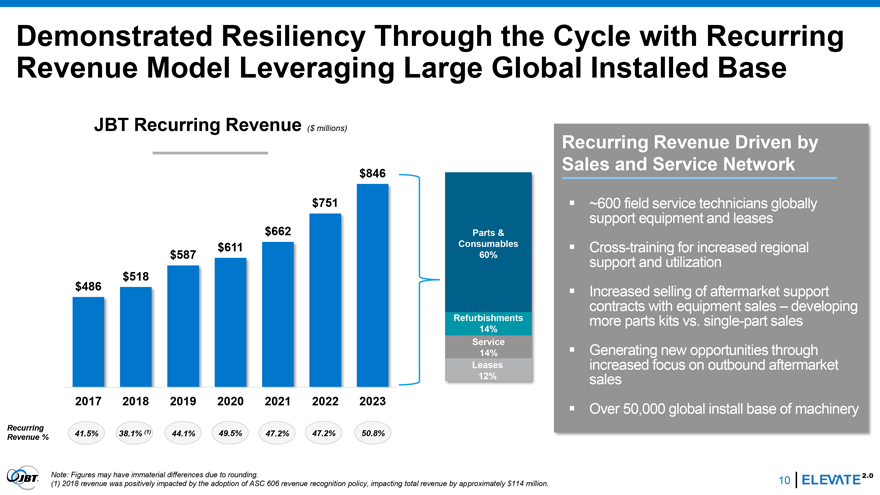
Demonstrated Resiliency Through the Cycle with Recurring Revenue Model Leveraging Large Global Installed Base JBT Recurring Revenue ($ millions) Recurring Revenue Driven by Sales and Service Network $846 $751 ~600 field service technicians globally support equipment and leases $662 Parts & $611 Consumables Cross-training for increased regional $587 60% support and utilization $486 $518 Increased selling of aftermarket support contracts with equipment sales – developing Refurbishments more parts kits vs. single-part sales 14% Service 14% Generating new opportunities through Leases increased focus on outbound aftermarket 12% sales 2017 2018 2019 2020 2021 2022 2023 Over 50,000 global install base of machinery Recurring 41.5% 38.1% (1) 44.1% 49.5% 47.2% 47.2% 50.8% Revenue % Note: Figures may have immaterial differences due to rounding. (1) 2018 revenue was positively impacted by the adoption of ASC 606 revenue recognition policy, impacting total revenue by approximately $114 million. 10 2
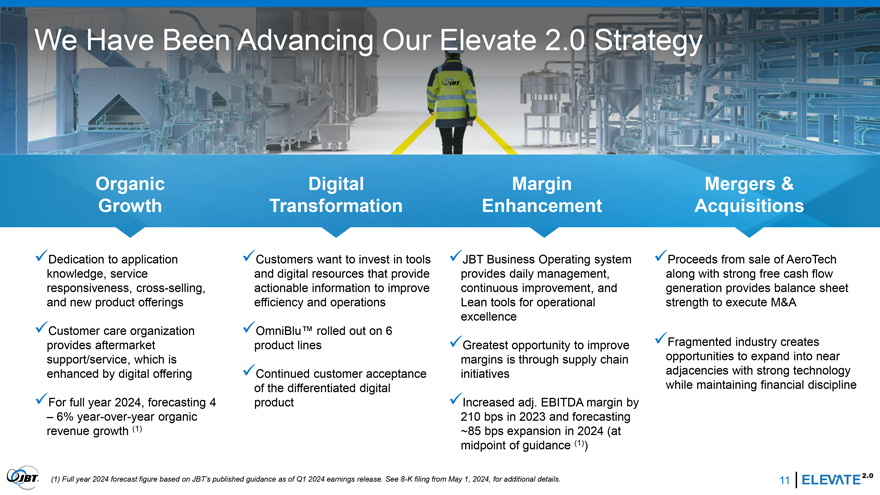
We Have Been Advancing Our Elevate 2.0 Strategy Organic Digital Margin Mergers & Growth Transformation Enhancement Acquisitions ✓Dedication to application ✓Customers want to invest in tools ✓JBT Business Operating system ✓Proceeds from sale of AeroTech knowledge, service and digital resources that provide provides daily management, along with strong free cash flow responsiveness, cross-selling, actionable information to improve continuous improvement, and generation provides balance sheet and new product offerings efficiency and operations Lean tools for operational strength to execute M&A excellence ✓Customer care organization ✓OmniBlu rolled out on 6 provides aftermarket product lines ✓Greatest opportunity to improve ✓Fragmented industry creates support/service, which is margins is through supply chain opportunities to expand into near enhanced by digital offering ✓Continued customer acceptance initiatives adjacencies with strong technology of the differentiated digital while maintaining financial discipline ✓For full year 2024, forecasting 4 product ✓Increased adj. EBITDA margin by – 6% year-over-year organic 210 bps in 2023 and forecasting revenue growth (1) ~85 bps expansion in 2024 (at midpoint of guidance (1)) (1) Full year 2024 forecast figure based on JBT’s published guidance as of Q1 2024 earnings release. See 8-K filing from May 1, 2024, for additional details. 11 2
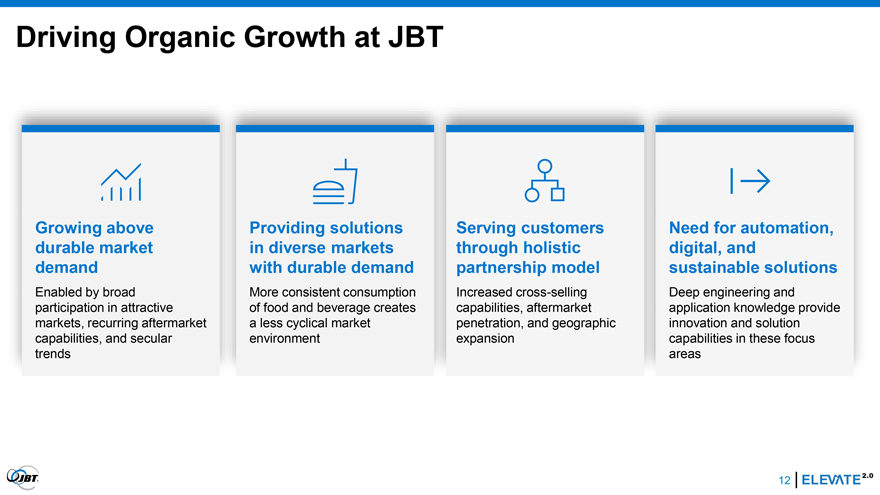
Driving Organic Growth at JBT Growing above Providing solutions Serving customers Need for automation, durable market in diverse markets through holistic digital, and demand with durable demand partnership model sustainable solutions Enabled by broad More consistent consumption Increased cross-selling Deep engineering and participation in attractive of food and beverage creates capabilities, aftermarket application knowledge provide markets, recurring aftermarket a less cyclical market penetration, and geographic innovation and solution capabilities, and secular environment expansion capabilities in these focus trends areas 12 2
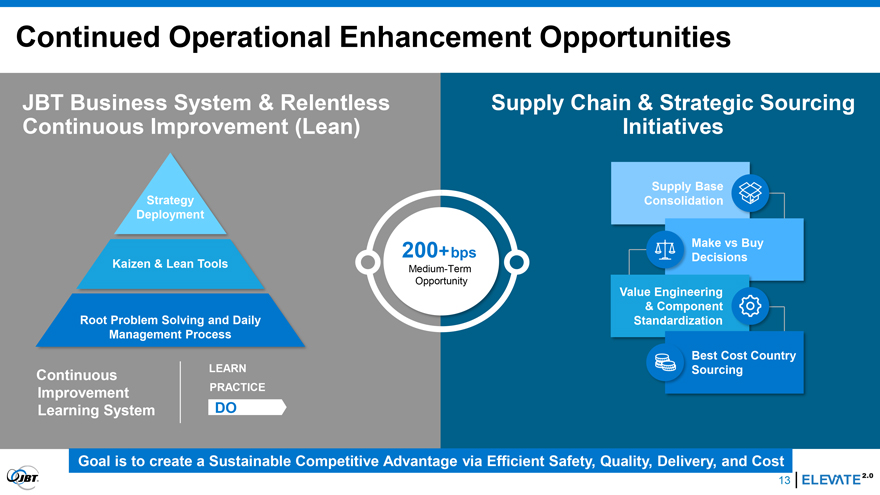
Continued Operational Enhancement Opportunities JBT Business System & Relentless Supply Chain & Strategic Sourcing Continuous Improvement (Lean) Initiatives Supply Base Strategy Consolidation Deployment Make vs Buy Kaizen & Lean Tools 200+ bps Decisions Medium-Term Opportunity Value Engineering & Component Root Problem Solving and Daily Standardization Management Process Best Cost Country Continuous LEARN Sourcing Improvement PRACTICE Learning System DO Goal is to create a Sustainable Competitive Advantage via Efficient Safety, Quality, Delivery, and Cost 13 2
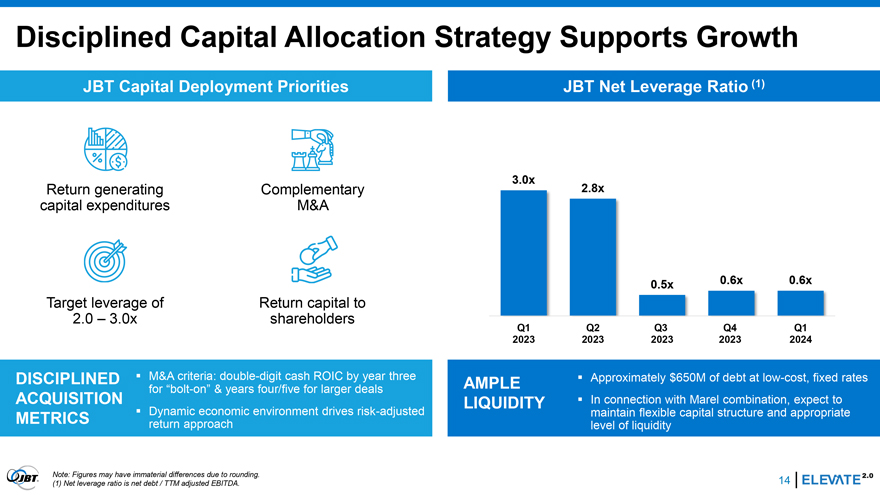
Disciplined Capital Allocation Strategy Supports Growth JBT Capital Deployment Priorities JBT Net Leverage Ratio (1) 3.0x Return generating Complementary 2.8x capital expenditures M&A 0.5x 0.6x 0.6x Target leverage of Return capital to 2.0 – 3.0x shareholders Q1 Q2 Q3 Q4 Q1 2023 2023 2023 2023 2024 DISCIPLINED â–ª M&A criteria: double-digit cash ROIC by year three AMPLE â–ª Approximately $650M of debt at low-cost, fixed rates for “bolt-on” & years four/five for larger deals â–ª In connection with Marel combination, expect to ACQUISITION LIQUIDITY METRICS â–ª Dynamic economic environment drives risk-adjusted maintain flexible capital structure and appropriate return approach level of liquidity Note: Figures may have immaterial differences due to rounding. (1) Net leverage ratio is net debt / TTM adjusted EBITDA. 14 2
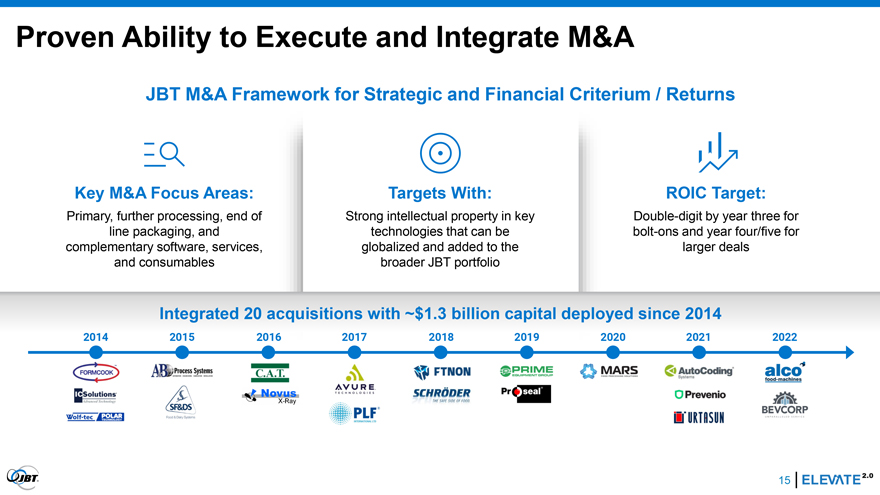
Proven Ability to Execute and Integrate M&A JBT M&A Framework for Strategic and Financial Criterium / Returns Key M&A Focus Areas: Targets With: ROIC Target: Primary, further processing, end of Strong intellectual property in key Double-digit by year three for line packaging, and technologies that can be bolt-ons and year four/five for complementary software, services, globalized and added to the larger deals and consumables broader JBT portfolio Integrated 20 acquisitions with ~$1.3 billion capital deployed since 2014 2014 2015 2016 2017 2018 2019 2020 2021 2022 15
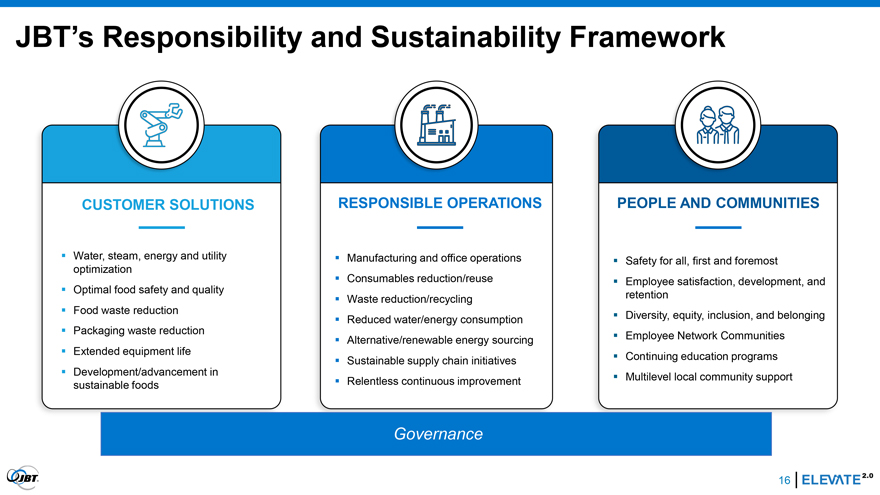
JBT’s Responsibility and Sustainability Framework CUSTOMER SOLUTIONS RESPONSIBLE OPERATIONS PEOPLE AND COMMUNITIES Water, steam, energy and utility Manufacturing and office operations Safety for all, first and foremost optimization Consumables reduction/reuse Employee satisfaction, development, and Optimal food safety and quality Waste reduction/recycling retention Food waste reduction Reduced water/energy consumption Diversity, equity, inclusion, and belonging Packaging waste reduction Alternative/renewable energy sourcing Employee Network Communities Extended equipment life Sustainable supply chain initiatives Continuing education programs Development/advancement in Relentless continuous improvement Multilevel local community support sustainable foods Governance 16 2
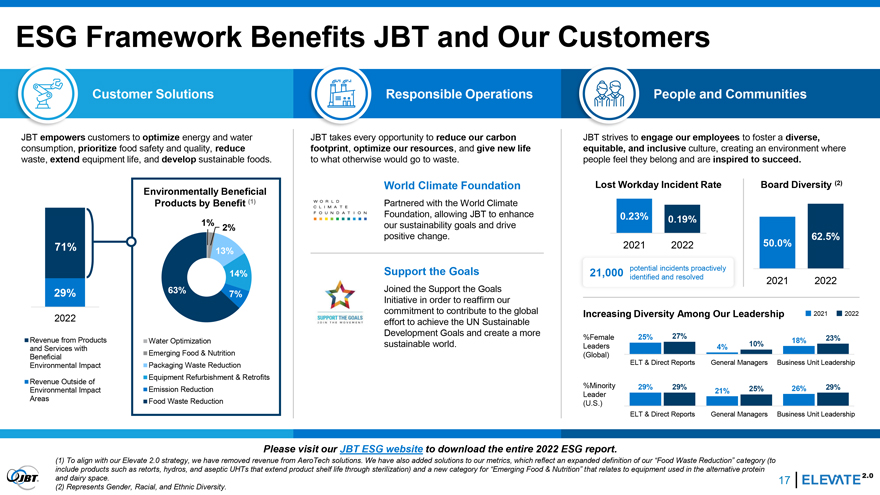
ESG Framework Benefits JBT and Our Customers Customer Solutions Responsible Operations People and Communities JBT empowers customers to optimize energy and water JBT takes every opportunity to reduce our carbon JBT strives to engage our employees to foster a diverse, consumption, prioritize food safety and quality, reduce footprint, optimize our resources, and give new life equitable, and inclusive culture, creating an environment where waste, extend equipment life, and develop sustainable foods. to what otherwise would go to waste. people feel they belong and are inspired to succeed. World Climate Foundation Lost Workday Incident Rate Board Diversity (2) Environmentally Beneficial Products by Benefit (1) Partnered with the World Climate Foundation, allowing JBT to enhance 0.23% 1% 0.19% 2% our sustainability goals and drive positive change. 62.5% 71% 13% 2021 2022 50.0% Support the Goals 21,000 potential incidents proactively 14% identified and resolved Joined the Support the Goals 2021 2022 29% 63% 7% Initiative in order to reaffirm our commitment to contribute to the global Increasing Diversity Among Our Leadership 2021 2022 2022 effort to achieve the UN Sustainable Development Goals and create a more 27% Revenue from Products %Female 25% 23% Water Optimization 18% sustainable world. Leaders 4% 10% and Services with Emerging Food & Nutrition (Global) Beneficial Environmental Impact Packaging Waste Reduction ELT & Direct Reports General Managers Business Unit Leadership Equipment Refurbishment & Retrofits Revenue Outside of %Minority 29% 29% 25% 26% 29% Environmental Impact Emission Reduction 21% Leader Areas Food Waste Reduction (U.S.) ELT & Direct Reports General Managers Business Unit Leadership Please visit our JBT ESG website to download the entire 2022 ESG report. (1) To align with our Elevate 2.0 strategy, we have removed revenue from AeroTech solutions. We have also added solutions to our metrics, which reflect an expanded definition of our “Food Waste Reduction” category (to include products such as retorts, hydros, and aseptic UHTs that extend product shelf life through sterilization) and a new category for “Emerging Food & Nutrition” that relates to equipment used in the alternative protein and dairy space. 17 (2) Represents Gender, Racial, and Ethnic Diversity. 2

Business Combination with Marel

Highly Complementary Merger Would Create a Leading Global Food and Beverage Technology Solutions Company Expected value-creating opportunities Solutions 1 Combining two complementary companies to create a compelling platform to accelerate growth by offering broader solutions, holistic application knowledge, and leveraging of R&D capabilities Service 2 Increased customer focus through enhanced global sales and service technicians to improve customer care reach and service levels Digital 3 Complementary leading digital tools provide insights to improve customers’ operations and efficiency, leading to reduced downtime events Talent 4 Tremendous combined talent representing the best in the industry with depth of knowledge on technology, markets, and applications Sustainability 5 Greater collective impact on sustainability with innovative customer solutions rooted in reducing waste, energy reduction, and improved food traceability Scale 6 Enhanced operational scale to create efficiencies and generate meaningful cost synergies together with anticipated revenue synergies from cross-selling, enhanced service, and an overall improved value proposition 2
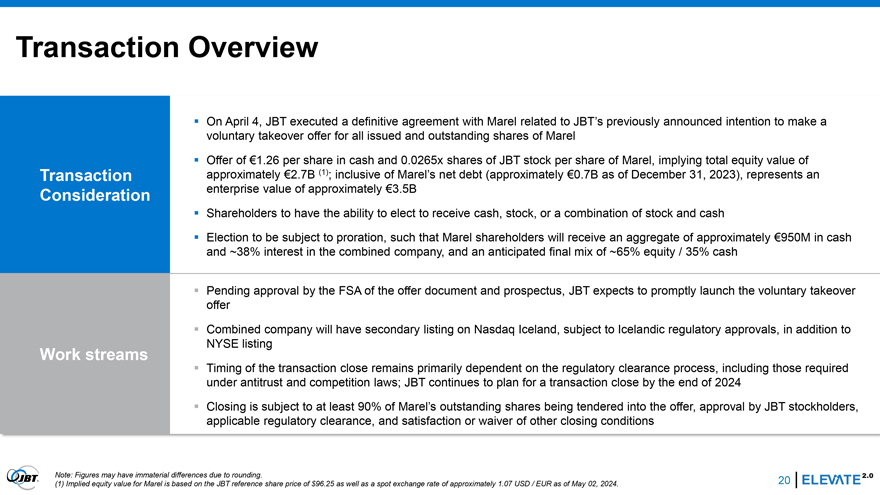
Transaction Overview â–ª On April 4, JBT executed a definitive agreement with Marel related to JBT’s previously announced intention to make a voluntary takeover offer for all issued and outstanding shares of Marel â–ª Offer of €1.26 per share in cash and 0.0265x shares of JBT stock per share of Marel, implying total equity value of Transaction approximately €2.7B (1); inclusive of Marel’s net debt (approximately €0.7B as of December 31, 2023), represents an Consideration enterprise value of approximately €3.5B â–ª Shareholders to have the ability to elect to receive cash, stock, or a combination of stock and cash â–ª Election to be subject to proration, such that Marel shareholders will receive an aggregate of approximately €950M in cash and ~38% interest in the combined company, and an anticipated final mix of ~65% equity / 35% cash â–ª Pending approval by the FSA of the offer document and prospectus, JBT expects to promptly launch the voluntary takeover offer â–ª Combined company will have secondary listing on Nasdaq Iceland, subject to Icelandic regulatory approvals, in addition to NYSE listing Work streams â–ª Timing of the transaction close remains primarily dependent on the regulatory clearance process, including those required under antitrust and competition laws; JBT continues to plan for a transaction close by the end of 2024 â–ª Closing is subject to at least 90% of Marel’s outstanding shares being tendered into the offer, approval by JBT stockholders, applicable regulatory clearance, and satisfaction or waiver of other closing conditions Note: Figures may have immaterial differences due to rounding. (1) Implied equity value for Marel is based on the JBT reference share price of $96.25 as well as a spot exchange rate of approximately 1.07 USD / EUR as of May 02, 2024. 20 2
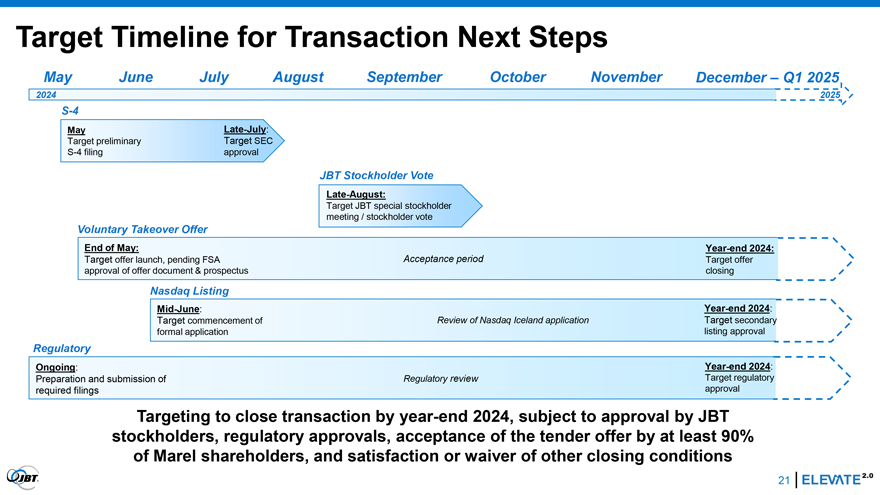
Target Timeline for Transaction Next Steps May June July August September October November December – Q1 2025 2024 2025 S-4 May Late-July: Target preliminary Target SEC S-4 filing approval JBT Stockholder Vote Late-August: Target JBT special stockholder meeting / stockholder vote Voluntary Takeover Offer End of May: Year-end 2024: Target offer launch, pending FSA Acceptance period Target offer approval of offer document & prospectus closing Nasdaq Listing Mid-June: Year-end 2024: Target commencement of Review of Nasdaq Iceland application Target secondary formal application listing approval Regulatory Ongoing: Year-end 2024: Preparation and submission of Regulatory review Target regulatory required filings approval Targeting to close transaction by year-end 2024, subject to approval by JBT stockholders, regulatory approvals, acceptance of the tender offer by at least 90% of Marel shareholders, and satisfaction or waiver of other closing conditions 21 2
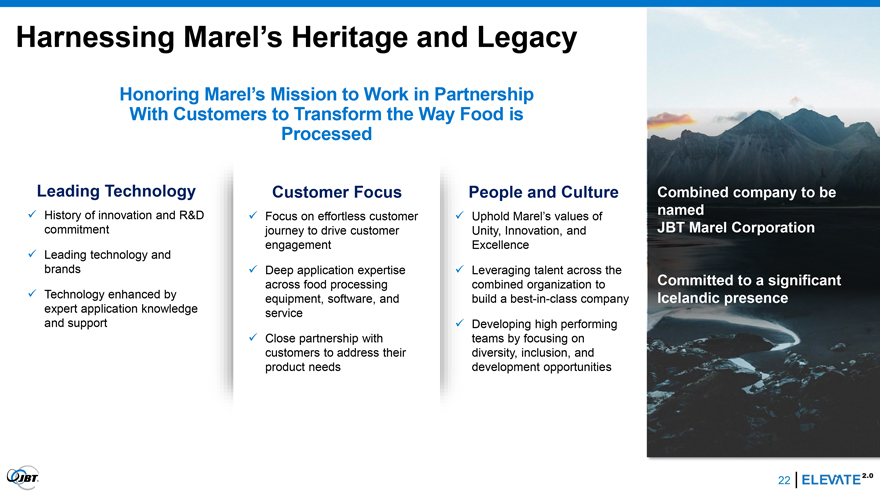
Harnessing Marel’s Heritage and Legacy Honoring Marel’s Mission to Work in Partnership With Customers to Transform the Way Food is Processed Leading Technology Customer Focus People and Culture Combined company to be History of innovation and R&D named Focus on effortless customer Uphold Marel’s values of commitment journey to drive customer Unity, Innovation, and JBT Marel Corporation Leading and engagement Excellence technology brands Deep application expertise Leveraging talent across the across food processing combined organization to Committed to a significant Technology enhanced by equipment, software, and build a best-in-class company Icelandic presence expert application knowledge service and support Developing high performing Close partnership with teams by focusing on customers to address their diversity, inclusion, and product needs development opportunities 22 2
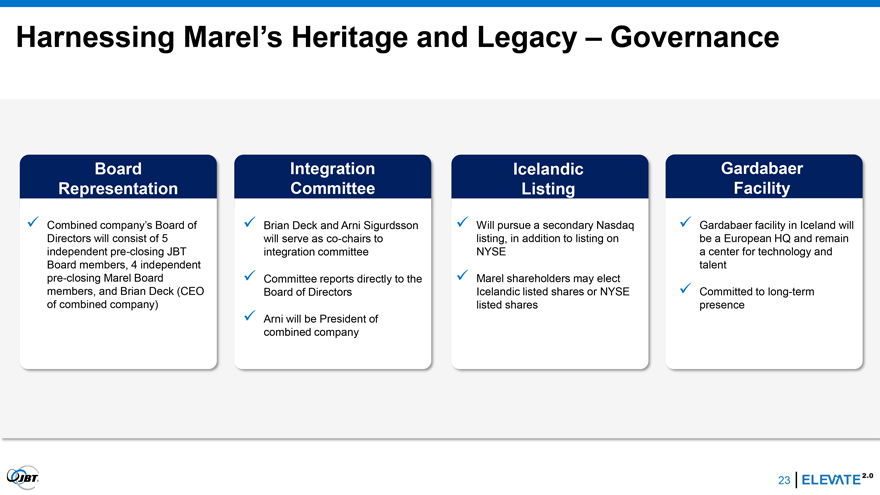
Harnessing Marel’s Heritage and Legacy – Governance Board Integration Icelandic Gardabaer Representation Committee Listing Facility Combined company’s Board of Brian Deck and Arni Sigurdsson Will pursue a secondary Nasdaq Gardabaer facility in Iceland will Directors will consist of 5 will serve as co-chairs to listing, in addition to listing on be a European HQ and remain independent pre-closing JBT integration committee NYSE a center for technology and Board members, 4 independent talent pre-closing Marel Board Committee reports directly to the Marel shareholders may elect members, and Brian Deck (CEO Board of Directors Icelandic listed shares or NYSE Committed to long-term of combined company) listed shares presence Arni will be President of combined company 23 2
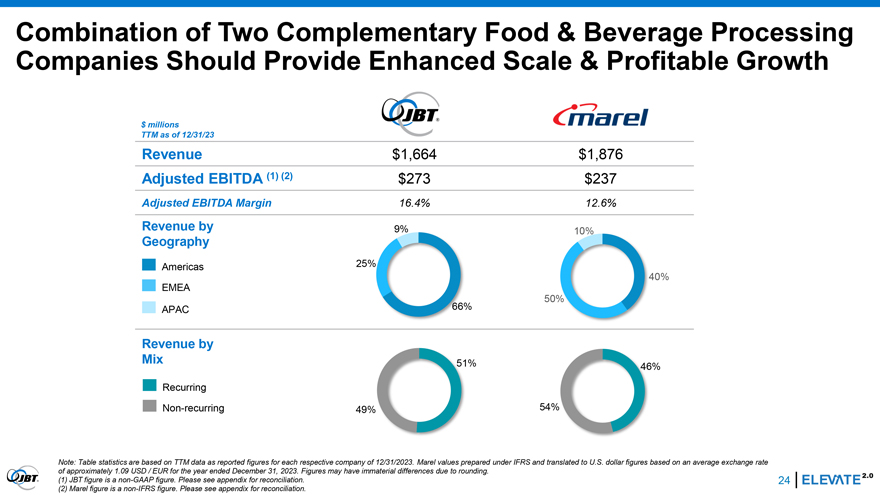
Combination of Two Complementary Food & Beverage Processing Companies Should Provide Enhanced Scale & Profitable Growth $ millions TTM as of 12/31/23 Revenue $1,664 $1,876 Adjusted EBITDA (1) (2) $273 $237 Adjusted EBITDA Margin 16.4% 12.6% Revenue by 9% 10% Geography Americas 25% 40% EMEA 50% APAC 66% Revenue by Mix 51% 46% Recurring Non-recurring 49% 54% Note: Table statistics are based on TTM data as reported figures for each respective company of 12/31/2023. Marel values prepared under IFRS and translated to U.S. dollar figures based on an average exchange rate of approximately 1.09 USD / EUR for the year ended December 31, 2023. Figures may have immaterial differences due to rounding. (1) JBT figure is a non-GAAP figure. Please see appendix for reconciliation. 24 (2) Marel figure is a non-IFRS figure. Please see appendix for reconciliation. 2
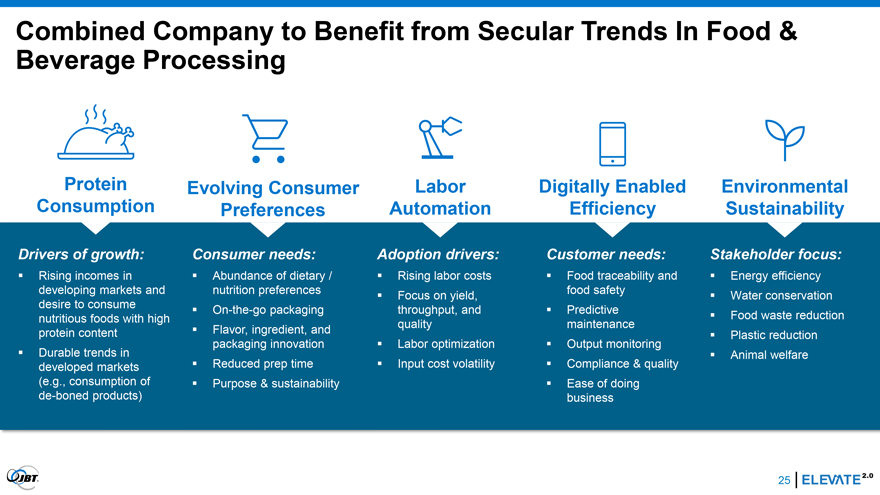
Combined Company to Benefit from Secular Trends In Food & Beverage Processing Protein Evolving Consumer Labor Digitally Enabled Environmental Consumption Preferences Automation Efficiency Sustainability Drivers of growth: Consumer needs: Adoption drivers: Customer needs: Stakeholder focus: â–ª Rising incomes in â–ª Abundance of dietary / â–ª Rising labor costs â–ª Food traceability and â–ª Energy efficiency developing markets and nutrition preferences food safety â–ª Focus on yield, â–ª Water conservation desire to consume â–ª On-the-go packaging throughput, and â–ª Predictive nutritious foods with high â–ª Food waste reduction quality maintenance protein content â–ª Flavor, ingredient, and â–ª Plastic reduction packaging innovation â–ª Labor optimization â–ª Output monitoring â–ª Durable trends in â–ª Animal welfare developed markets â–ª Reduced prep time â–ª Input cost volatility â–ª Compliance & quality (e.g., consumption of â–ª Purpose & sustainability â–ª Ease of doing de-boned products) business 25 2
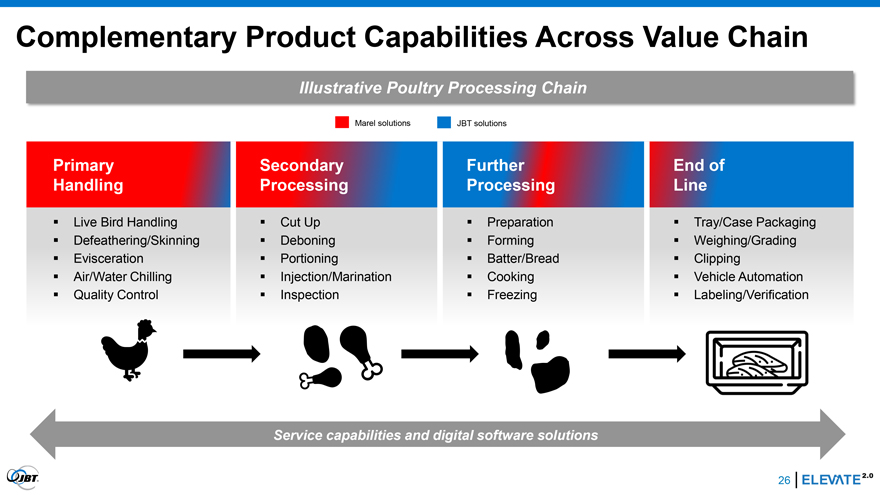
Complementary Product Capabilities Across Value Chain Illustrative Poultry Processing Chain Marel solutions JBT solutions Primary Secondary Further End of Handling Processing Processing Line Live Bird Handling Cut Up Preparation Tray/Case Packaging Defeathering/Skinning Deboning Forming Weighing/Grading Evisceration Portioning Batter/Bread Clipping Air/Water Chilling Injection/Marination Cooking Vehicle Automation Quality Control Inspection Freezing Labeling/Verification Service capabilities and digital software solutions 26 2
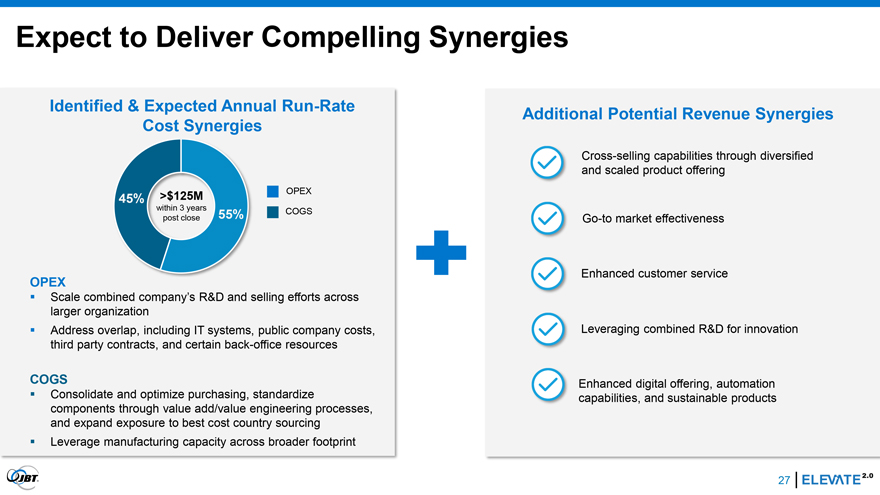
Expect to Deliver Compelling Synergies Identified & Expected Annual Run-Rate Additional Potential Revenue Synergies Cost Synergies Cross-selling capabilities through diversified and scaled product offering >$125M OPEX 45% within 3 years COGS post close 55% Go-to market effectiveness Enhanced customer service OPEX Scale combined company’s R&D and selling efforts across larger organization Address overlap, including IT systems, public company costs, Leveraging combined R&D for innovation third party contracts, and certain back-office resources COGS Enhanced digital offering, automation Consolidate and optimize purchasing, standardize capabilities, and sustainable products components through value add/value engineering processes, and expand exposure to best cost country sourcing Leverage manufacturing capacity across broader footprint 27 2
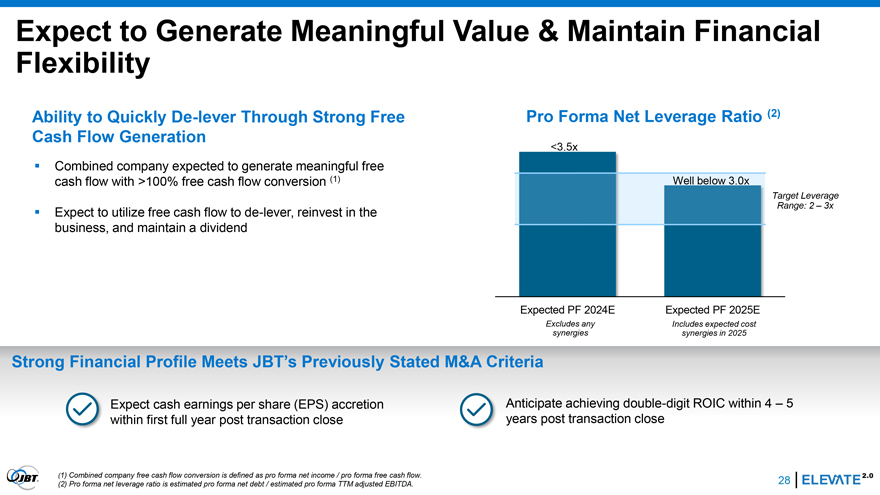
Expect to Generate Meaningful Value & Maintain Financial Flexibility Ability to Quickly De-lever Through Strong Free Pro Forma Net Leverage Ratio (2) Cash Flow Generation <3.5x â–ª Combined company expected to generate meaningful free cash flow with >100% free cash flow conversion (1) Well below 3.0x Target Leverage Range: 2 – 3x â–ª Expect to utilize free cash flow to de-lever, reinvest in the business, and maintain a dividend Expected PF 2024E Expected PF 2025E Excludes any Includes expected cost synergies synergies in 2025 Strong Financial Profile Meets JBT’s Previously Stated M&A Criteria Expect cash earnings per share (EPS) accretion Anticipate achieving double-digit ROIC within 4 – 5 within first full year post transaction close years post transaction close (1) Combined company free cash flow conversion is defined as pro forma net income / pro forma free cash flow. 28 (2) Pro forma net leverage ratio is estimated pro forma net debt / estimated pro forma TTM adjusted EBITDA. ( 2
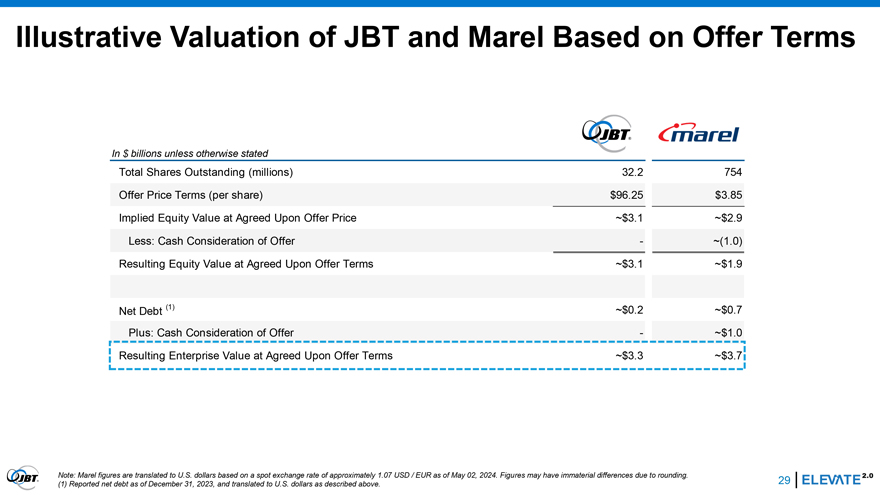
Illustrative Valuation of JBT and Marel Based on Offer Terms In $ billions unless otherwise stated Total Shares Outstanding (millions) 32.2 754 Offer Price Terms (per share) $96.25 $3.85 Implied Equity Value at Agreed Upon Offer Price ~$3.1 ~$2.9 Less: Cash Consideration of Offer - ~(1.0) Resulting Equity Value at Agreed Upon Offer Terms ~$3.1 ~$1.9 Net Debt (1) ~$0.2 ~$0.7 Plus: Cash Consideration of Offer - ~$1.0 Resulting Enterprise Value at Agreed Upon Offer Terms ~$3.3 ~$3.7 Note: Marel figures are translated to U.S. dollars based on a spot exchange rate of approximately 1.07 USD / EUR as of May 02, 2024. Figures may have immaterial differences due to rounding. 29 (1) Reported net debt as of December 31, 2023, and translated to U.S. dollars as described above.( 2
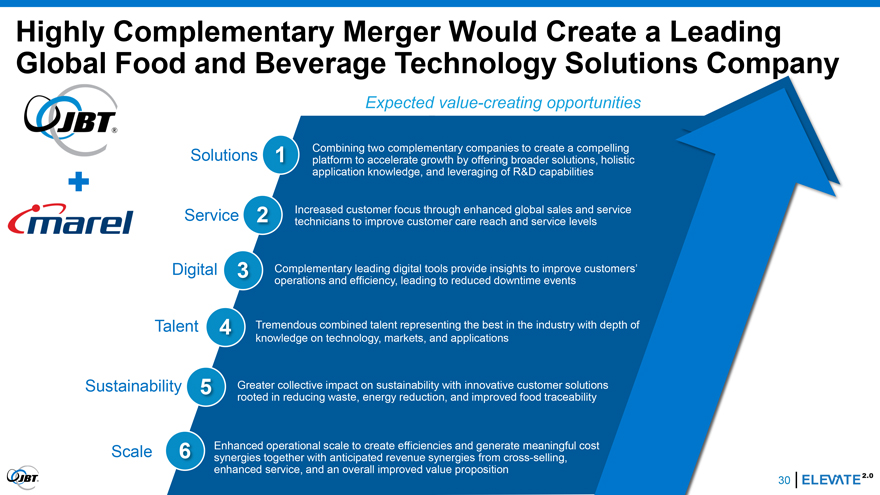
Highly Complementary Merger Would Create a Leading Global Food and Beverage Technology Solutions Company Expected value-creating opportunities Solutions 1 Combining two complementary companies to create a compelling platform to accelerate growth by offering broader solutions, holistic application knowledge, and leveraging of R&D capabilities Service 2 Increased customer focus through enhanced global sales and service technicians to improve customer care reach and service levels Digital 3 Complementary leading digital tools provide insights to improve customers’ operations and efficiency, leading to reduced downtime events Talent 4 Tremendous combined talent representing the best in the industry with depth of knowledge on technology, markets, and applications Sustainability 5 Greater collective impact on sustainability with innovative customer solutions rooted in reducing waste, energy reduction, and improved food traceability Scale 6 Enhanced operational scale to create efficiencies and generate meaningful cost synergies together with anticipated revenue synergies from cross-selling, enhanced service, and an overall improved value proposition 2

Appendix Non-GAAP Reconciliations
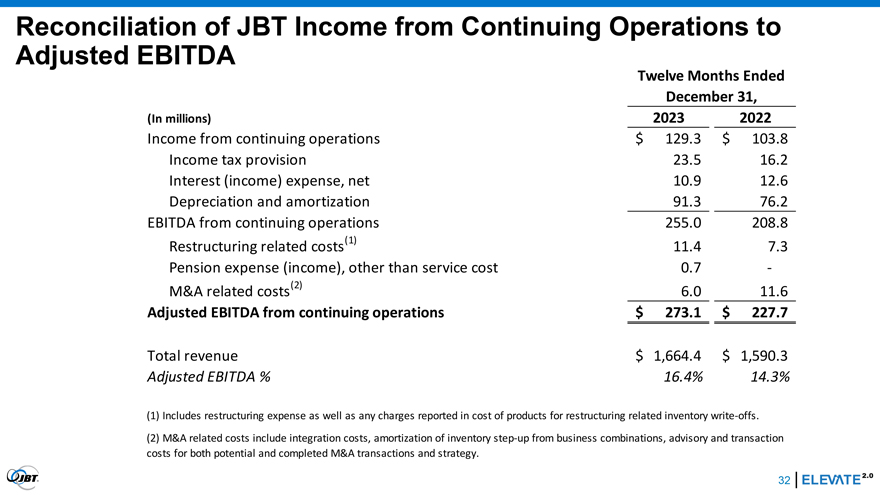
Reconciliation of JBT Income from Continuing Operations to Adjusted EBITDA Twelve Months Ended December 31, (In millions) 2023 2022 Income from continuing operations $ 129.3 $ 103.8 Income tax provision 23.5 16.2 Interest (income) expense, net 10.9 12.6 Depreciation and amortization 91.3 76.2 EBITDA from continuing operations 255.0 208.8 (1) Restructuring related costs 11.4 7.3 Pension expense (income), other than service cost 0.7 - (2) M&A related costs 6.0 11.6 Adjusted EBITDA from continuing operations $ 273.1 $ 227.7 Total revenue $ 1,664.4 $ 1,590.3 Adjusted EBITDA % 16.4% 14.3% (1) Includes restructuring expense as well as any charges reported in cost of products for restructuring related inventory write-offs. (2) M&A related costs include integration costs, amortization of inventory step-up from business combinations, advisory and transaction costs for both potential and completed M&A transactions and strategy. 32 2
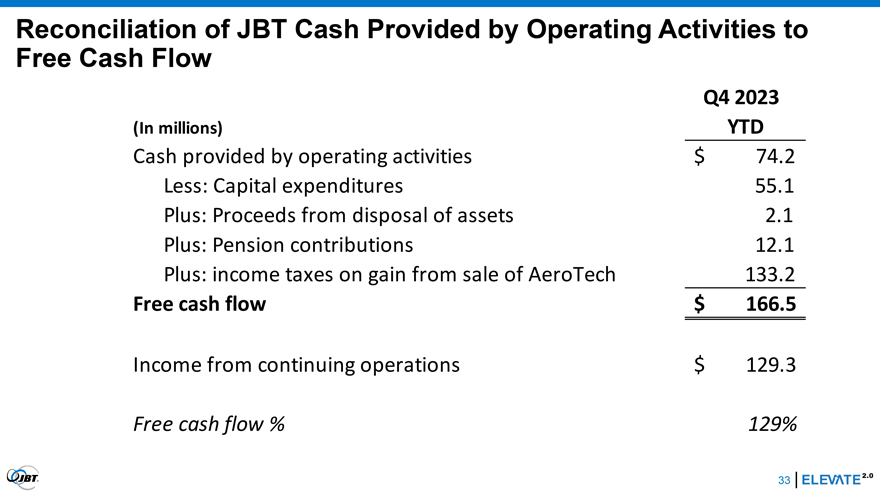
Reconciliation of JBT Cash Provided by Operating Activities to Free Cash Flow Q4 2023 (In millions) YTD Cash provided by operating activities $ 74.2 Less: Capital expenditures 55.1 Plus: Proceeds from disposal of assets 2.1 Plus: Pension contributions 12.1 Plus: income taxes on gain from sale of AeroTech 133.2 Free cash flow $ 166.5 Income from continuing operations $ 129.3 Free cash flow % 129% 33 2
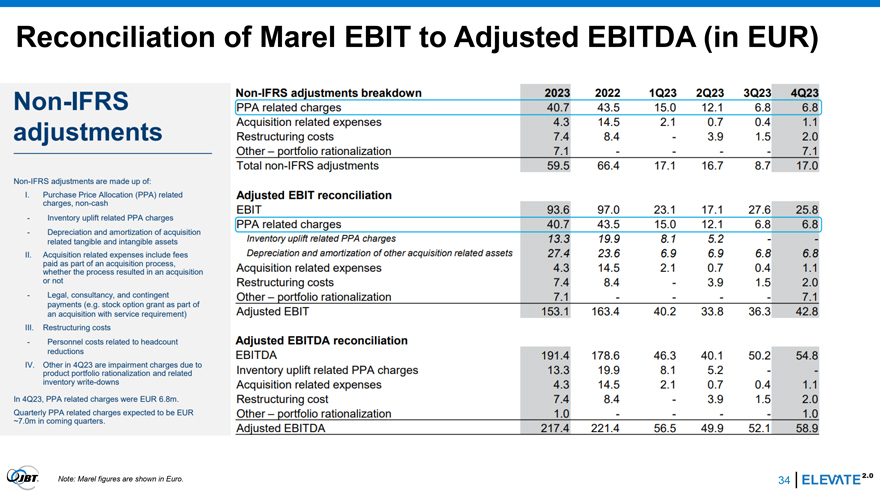
Reconciliation of Marel EBIT to Adjusted EBITDA (in EUR) Note: Marel figures are shown in Euro. 34 2