
JBT 2016 Investor Day November 3, 2016

These slides and the accompanying presentation contain “forward-looking” statements which represent management’s best judgment as of the date hereof, based on currently available information. Actual results may differ materially from those contained in such forward-looking statements. JBT Corporation’s (the “Company”) most recent filings with the Securities and Exchange Commission include information concerning factors that may cause actual results to differ from those anticipated by these forward- looking statements. The Company undertakes no obligation to update or revise these forward-looking statements to reflect new events or uncertainties. Although the Company reports its results using US GAAP, the Company uses non-GAAP measures when management believes those measures provide useful information for its stockholders. The appendices to this presentation provide reconciliations to US GAAP for any non-GAAP measures referenced in this presentation. Forward-Looking Statements 2016 Investor Day2
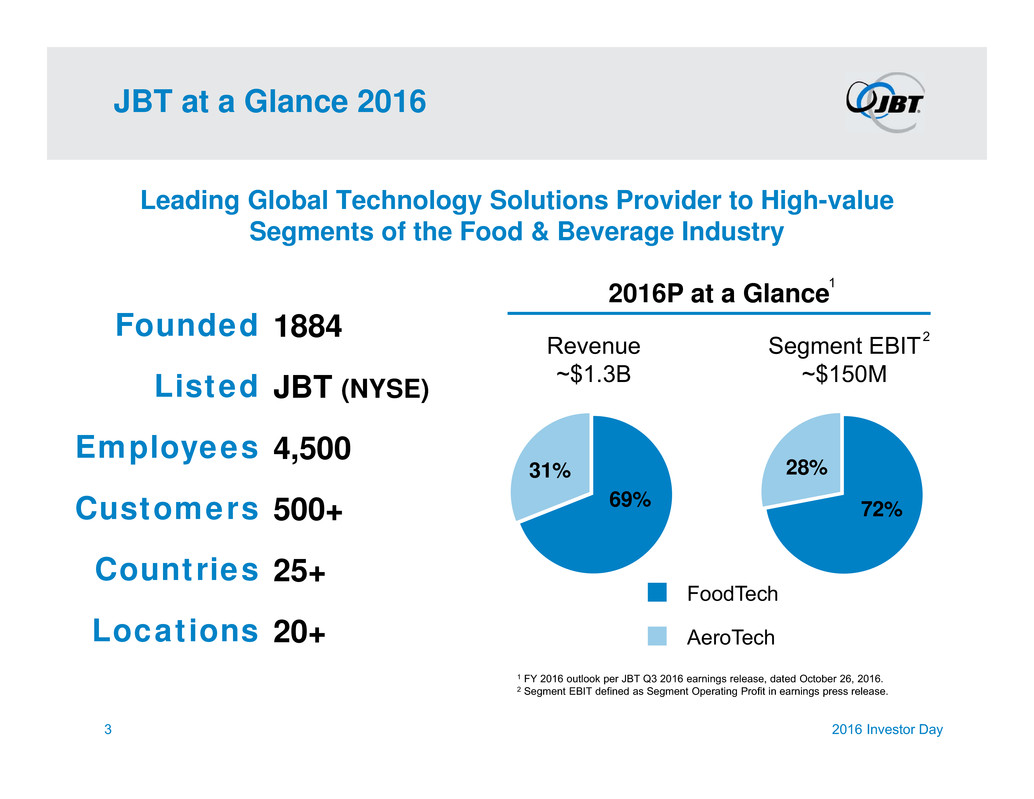
JBT at a Glance 2016 Leading Global Technology Solutions Provider to High-value Segments of the Food & Beverage Industry 2016 Investor Day 69% 31% Revenue ~$1.3B Segment EBIT ~$150M 72% 28% 2016P at a Glance AeroTech FoodTech 1 FY 2016 outlook per JBT Q3 2016 earnings release, dated October 26, 2016. 2 Segment EBIT defined as Segment Operating Profit in earnings press release. 3 Founded Listed Employees Customers Countries Locations 1884 JBT (NYSE) 4,500 500+ 25+ 20+ 1 2
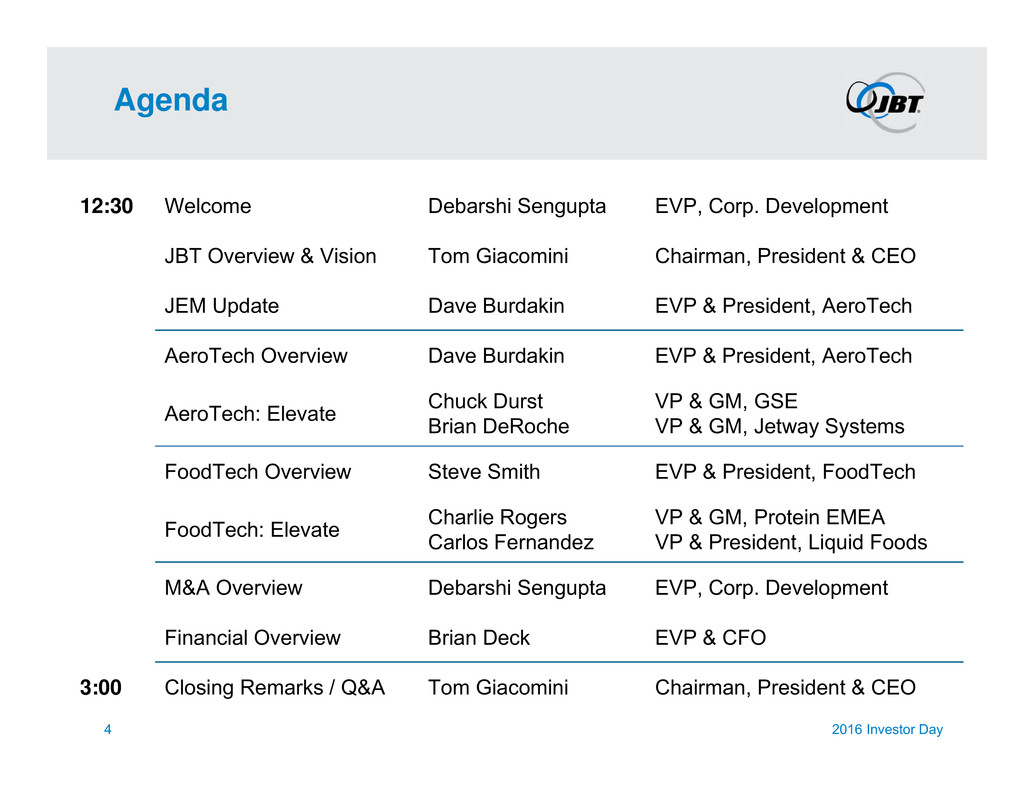
Agenda 4 12:30 Welcome Debarshi Sengupta EVP, Corp. Development JBT Overview & Vision Tom Giacomini Chairman, President & CEO JEM Update Dave Burdakin EVP & President, AeroTech AeroTech Overview Dave Burdakin EVP & President, AeroTech AeroTech: Elevate Chuck DurstBrian DeRoche VP & GM, GSE VP & GM, Jetway Systems FoodTech Overview Steve Smith EVP & President, FoodTech FoodTech: Elevate Charlie RogersCarlos Fernandez VP & GM, Protein EMEA VP & President, Liquid Foods M&A Overview Debarshi Sengupta EVP, Corp. Development Financial Overview Brian Deck EVP & CFO 3:00 Closing Remarks / Q&A Tom Giacomini Chairman, President & CEO 2016 Investor Day

JBT Overview & Vision Tom Giacomini Chairman, President & CEO

If you ate or drank something today… There’s a good chance JBT technology played a critical role in its preparation.
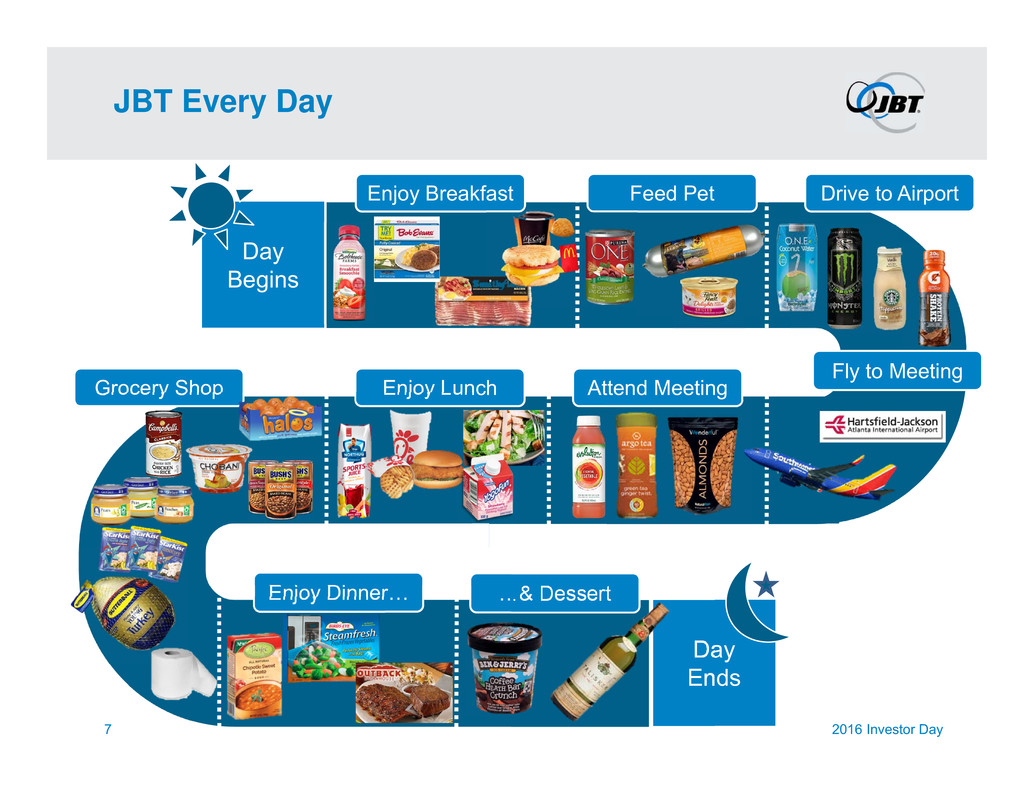
JBT Every Day Enjoy Lunch Day Ends Drive to Airport Day Begins Enjoy Dinner… …& Dessert 7 2016 Investor Day Fly to Meeting Feed Pet Grocery Shop Attend Meeting Enjoy Breakfast

Durable Shareholder Value Creation Sustainable Growth (Organic & Acquisitions) Margin Expansion Reinvest for Organic Growth Strong ROIC Double-Digit EPS Growth Durable Shareholder Value Creation 2016 Investor Day8
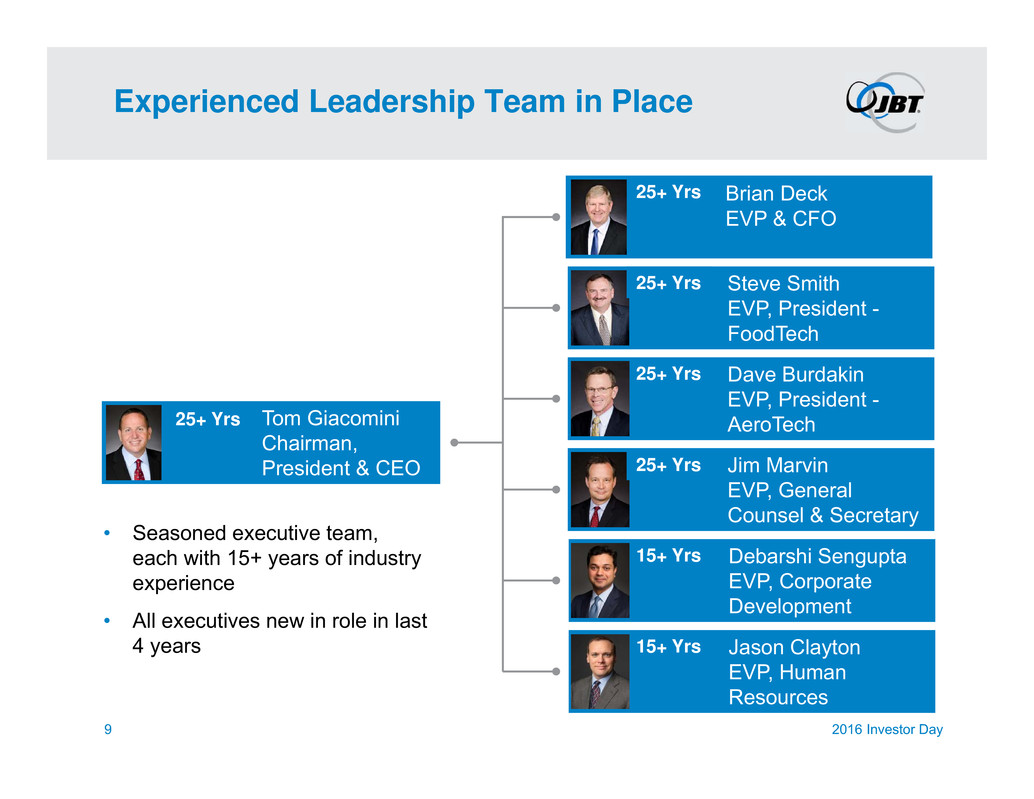
Debarshi Sengupta EVP, Corporate Development Jason Clayton EVP, Human Resources Experienced Leadership Team in Place Jim Marvin EVP, General Counsel & Secretary Brian Deck EVP & CFO Dave Burdakin EVP, President - AeroTechTom Giacomini Chairman, President & CEO 25+ Yrs Steve Smith EVP, President - FoodTech 2016 Investor Day • Seasoned executive team, each with 15+ years of industry experience • All executives new in role in last 4 years 9 15+ Yrs 25+ Yrs 25+ Yrs 25+ Yrs 25+ Yrs 15+ Yrs
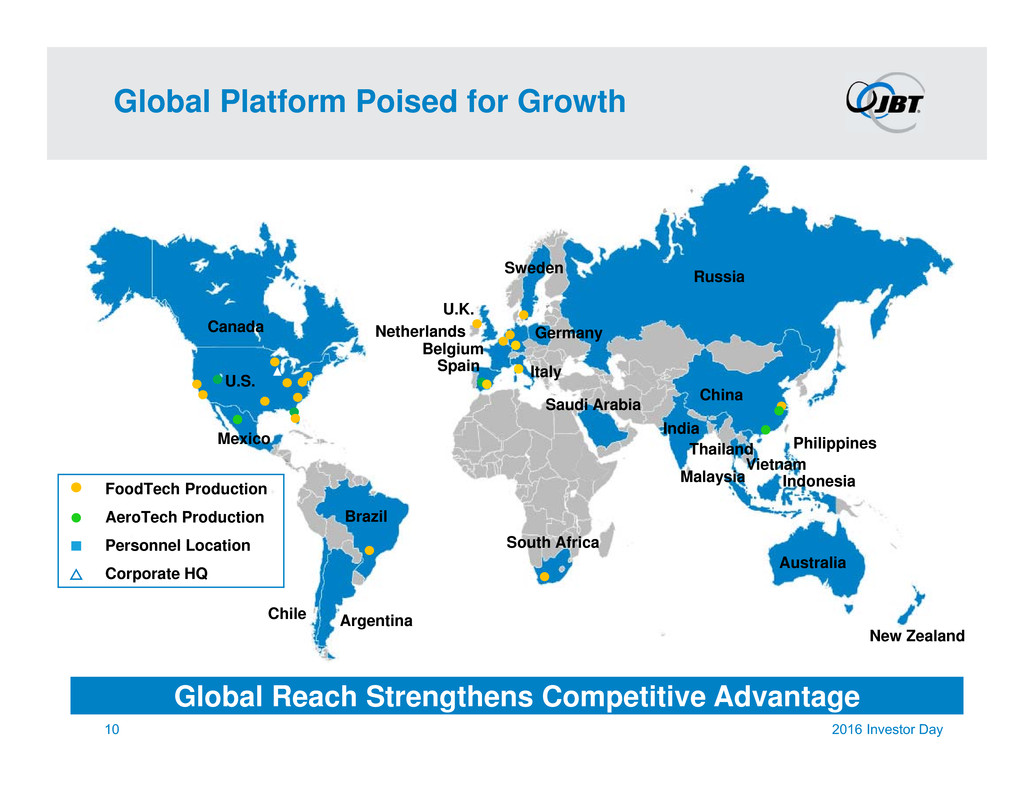
Canada U.S. Mexico Brazil Chile Argentina U.K. Belgium Spain Sweden Germany Italy South Africa Saudi Arabia Russia India Malaysia Philippines Australia New Zealand Netherlands China Vietnam Thailand Indonesia Global Platform Poised for Growth Global Reach Strengthens Competitive Advantage 2016 Investor Day10 FoodTech Production AeroTech Production Personnel Location Corporate HQ

One JBT: A Sustainable Growth Culture ONE Purpose & Set of Values Across the Entire Organization 2016 Investor Day11
JBT Next Level Tom Giacomini Chairman, President & CEO
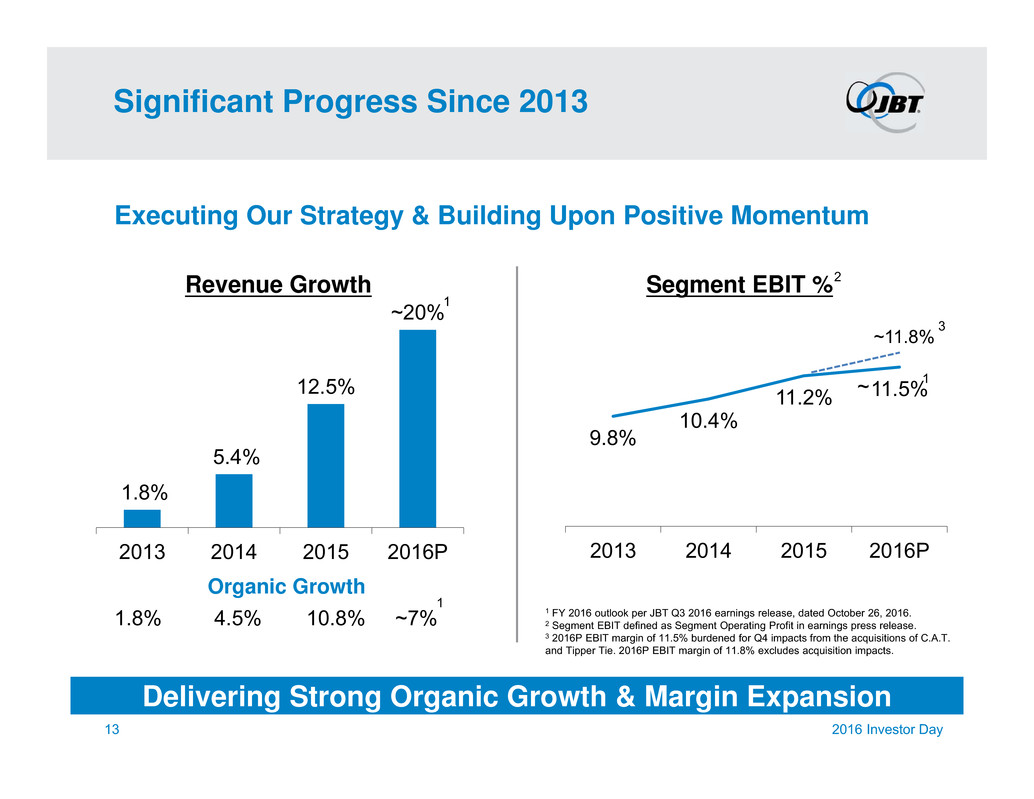
Significant Progress Since 2013 Executing Our Strategy & Building Upon Positive Momentum Delivering Strong Organic Growth & Margin Expansion 1.8% 5.4% 12.5% ~20% 2013 2014 2015 2016P Revenue Growth 9.8% 10.4% 11.2% 11.5% 2013 2014 2015 2016P Segment EBIT % 13 2016 Investor Day 1.8% 4.5% 10.8% ~7% Organic Growth ~ 1 1 1 1 FY 2016 outlook per JBT Q3 2016 earnings release, dated October 26, 2016. 2 Segment EBIT defined as Segment Operating Profit in earnings press release. 3 2016P EBIT margin of 11.5% burdened for Q4 impacts from the acquisitions of C.A.T. and Tipper Tie. 2016P EBIT margin of 11.8% excludes acquisition impacts. ~11.8% 3 2
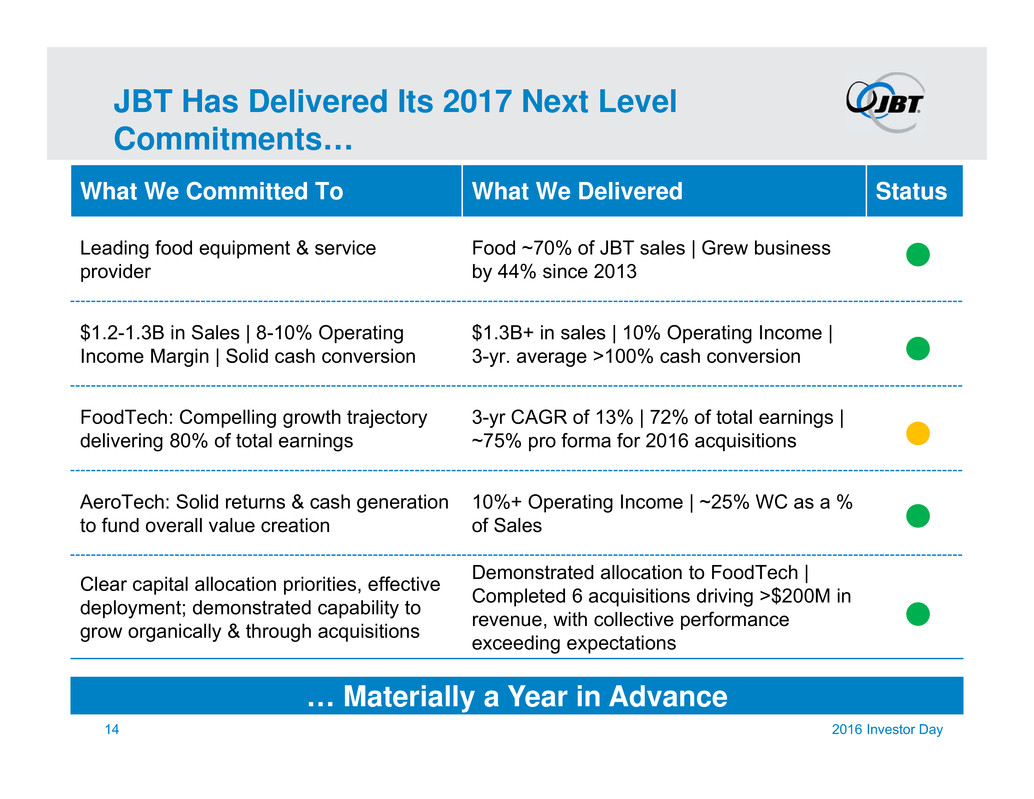
JBT Has Delivered Its 2017 Next Level Commitments… What We Committed To What We Delivered Status Leading food equipment & service provider Food ~70% of JBT sales | Grew business by 44% since 2013 $1.2-1.3B in Sales | 8-10% Operating Income Margin | Solid cash conversion $1.3B+ in sales | 10% Operating Income | 3-yr. average >100% cash conversion FoodTech: Compelling growth trajectory delivering 80% of total earnings 3-yr CAGR of 13% | 72% of total earnings | ~75% pro forma for 2016 acquisitions AeroTech: Solid returns & cash generation to fund overall value creation 10%+ Operating Income | ~25% WC as a % of Sales Clear capital allocation priorities, effective deployment; demonstrated capability to grow organically & through acquisitions Demonstrated allocation to FoodTech | Completed 6 acquisitions driving >$200M in revenue, with collective performance exceeding expectations 2016 Investor Day14 … Materially a Year in Advance

JBT 41% 0 50 100 150 200 250 300 350 400 450 500 (60) (40) (20) 0 20 40 60 80 1st Quartile 16% 2nd Quartile 8% 3rd Quartile 0% …Resulting in Significant Value Creation Annualized TSR Company Rank Annualized TSR (Jan 2014 - Oct 2016) Background Curve: S&P 500; Based on data ending 10/21/16. TSRs use company reporting currency. Source: Factset $1.26 $1.56 $1.88 $2.35 2013 2014 2015 2016P Adj. EPS 14.4% 14.6% 15.2% 16% 2013 2014 2015 2016P ROIC CAGR 23% 2016 Investor Day15 Avg. 14.6% 1 14% 1 Guidance as provided in JBT Q3 2016 earnings release, dated October 26, 2016. See Appendix for reconciliation with GAAP EPS. 2 ~16% ROIC excluding impact of acquisitions completed in 2016. 2 ~ ~ ~

The Elevate Plan 2016 – 2019 Strategy

JBT Is Positioned to Leverage Positive Macro Drivers … 17 Growing Middle Class Global middle class expected to double by 2030, with Asia a significant consumer of value-added nutritional food Consolidating Food Industry Food industry increasingly served by fewer global producers, spanning multiple food verticals and channels Demand for Air Travel In 2015, global passenger traffic grew 6.5%, well above 10-year average annual growth of 5.5%; underscoring continued expansion of global air networks Strong position in China (engineering, manufacturing & innovation center) complemented by co-located regional sales & service delivers competitive advantage JBT Advantage 2016 Investor Day Global footprint & comprehensive offering provides significant operational benefits to global food companies Pre-positioning Jetway PBBs & high-speed Ranger cargo loaders that airlines need to efficiently & safely move high volume of passengers & freight
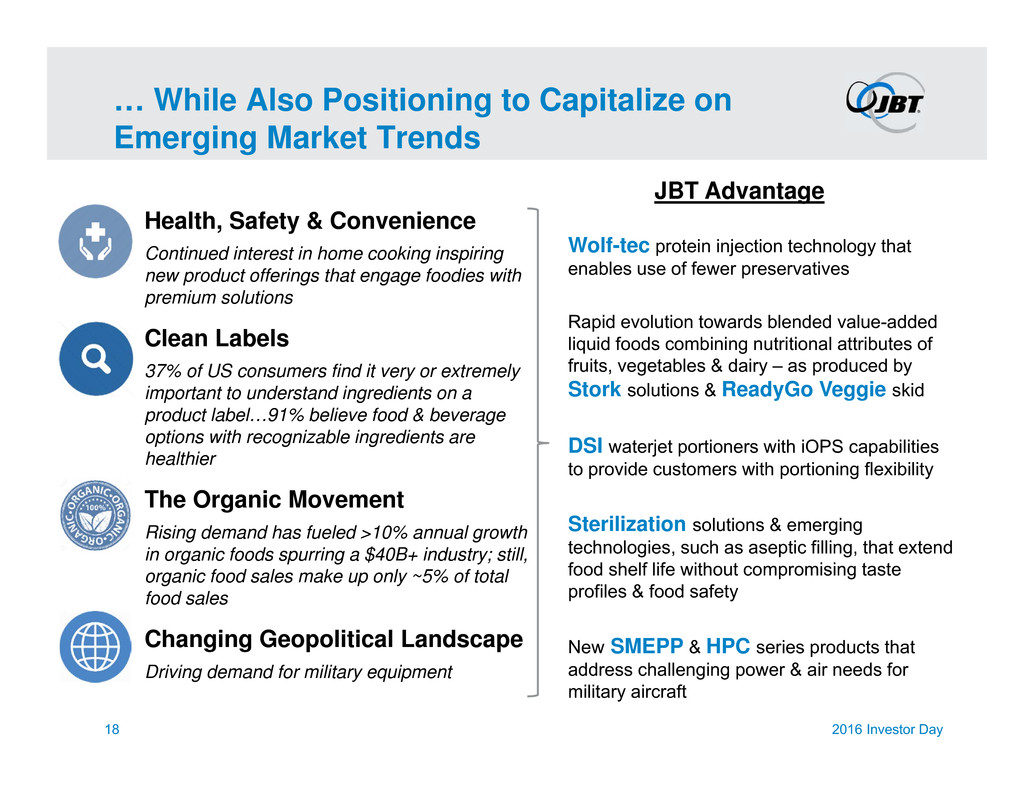
… While Also Positioning to Capitalize on Emerging Market Trends 18 Health, Safety & Convenience Continued interest in home cooking inspiring new product offerings that engage foodies with premium solutions Clean Labels 37% of US consumers find it very or extremely important to understand ingredients on a product label…91% believe food & beverage options with recognizable ingredients are healthier The Organic Movement Rising demand has fueled >10% annual growth in organic foods spurring a $40B+ industry; still, organic food sales make up only ~5% of total food sales Changing Geopolitical Landscape Driving demand for military equipment Wolf-tec protein injection technology that enables use of fewer preservatives Rapid evolution towards blended value-added liquid foods combining nutritional attributes of fruits, vegetables & dairy – as produced by Stork solutions & ReadyGo Veggie skid DSI waterjet portioners with iOPS capabilities to provide customers with portioning flexibility Sterilization solutions & emerging technologies, such as aseptic filling, that extend food shelf life without compromising taste profiles & food safety New SMEPP & HPC series products that address challenging power & air needs for military aircraft JBT Advantage 2016 Investor Day

JBT Portfolio Strategy Maximizes TSR 19 2016 Investor Day Grow FoodTech Improve AeroTech Further Investment & Growth • $25B+ global market with long-term positive drivers & trends • JBT increasingly commands advantaged position • Highly engineered technology critical to food production & customer profitability • Significant organic & M&A growth potential • Low cyclicality Drive Returns With Growth • Substantial improvement opportunities remain • Generated cash flow funds capital allocation priorities, fueling internal & M&A investments • Historical low asset base could compress net proceeds from any exit considerations FoodTech a Key Growth Driver

Elevate Strategy Delivering Growth & Margin Expansion Four-pronged Approach 20 2016 Investor Day Grow Recurring Revenue Disciplined Acquisition Program Accelerate New Product & Service Development Execute Impact Initiatives Innovate to provide customers with comprehensive solutions that enhance their profitability Capitalize on extensive installed base to strengthen customer relationships Select organic growth initiatives that move the needle Employ strategic & metrics-driven approach

Benefits to Customers • Increased yield, throughput & uptime • Preventative maintenance reduces lifetime total cost of ownership (TCO) • Data analytics package provides powerful, actionable insights Benefits to JBT • Improved customer retention • Enhanced ability to offer differentiated equipment & services • Increases aftermarket share • Recurring revenue stream from data analytics • User-centered information ecosystem to aid new product development Introducing: JBT iOPS JBT’s Internet of Things (IOT) Initiative 21 2016 Investor Day Automated Guided Vehicles DSI Portioner Stein Fryers Frigo Freezers JBT X- Vision Cloud Services Database & Servers Multi- Tenant Web App JBT Wolf-tec

$405 $413 $413 $438 $455 $500 2011 2012 2013 2014 2015 2016P Grow Recurring Revenue 2016 Investor Day Stable Base with New Opportunities to Drive Growth FoodTech Aftermarket Revenue Growth (2016P vs. 2015) ~15% Aftermarket Share of Customer Wallet 30% - 35% 42% 45% 44% 45% Recurring Revenue as a % of Total Sales Aftermarket Parts & Services 41% Equipment Leases, Airport Services 22 38% Recent acquisitions have lower recurring revenue mix future opportunity ~ CAGR 9%
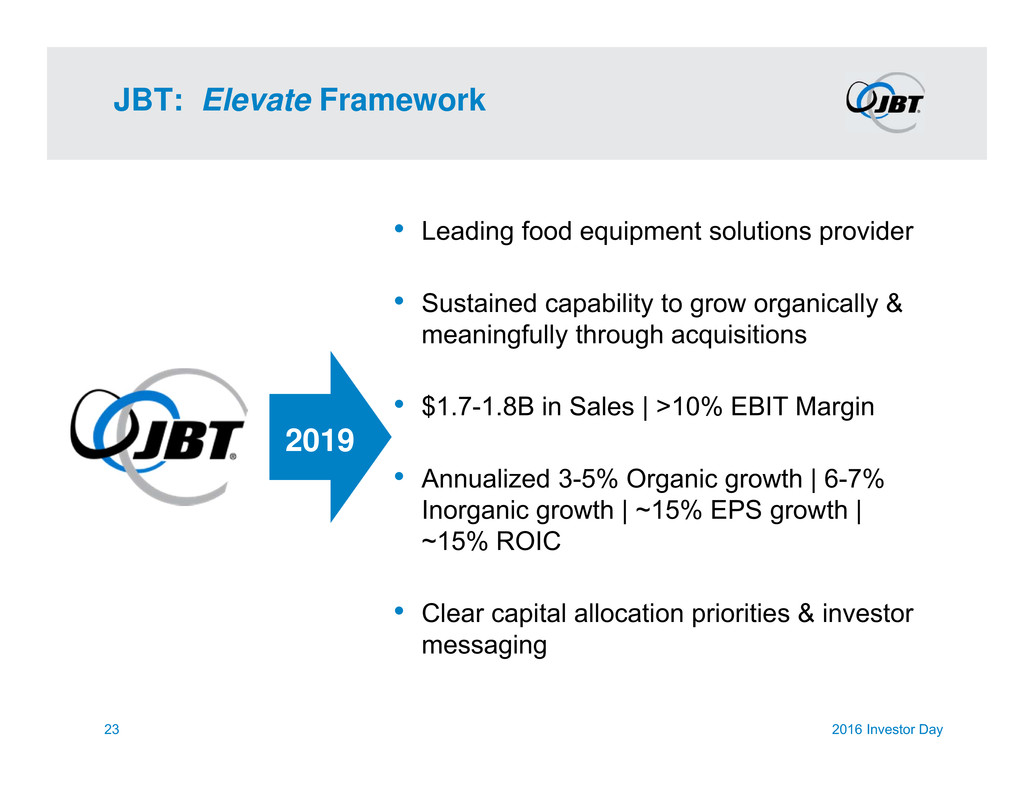
JBT: Elevate Framework 2019 • Leading food equipment solutions provider • Sustained capability to grow organically & meaningfully through acquisitions • $1.7-1.8B in Sales | >10% EBIT Margin • Annualized 3-5% Organic growth | 6-7% Inorganic growth | ~15% EPS growth | ~15% ROIC • Clear capital allocation priorities & investor messaging 2016 Investor Day23
JEM Update Dave Burdakin EVP & President, AeroTech

JEM Framework 2016 Investor Day ONE JBT Customer First Relentless Continuous Improvement (RCI) Acquisitions Engine of Execution, Day In & Day Out • Integrity & accountability • Compete as one team • Solve problems & create value for our customers • Provide comprehensive suite of our solutions • Safety, Quality, Delivery, Cost (SQDC) • Strategic sourcing • Strategic & disciplined • Create value for our customers & shareholders 25
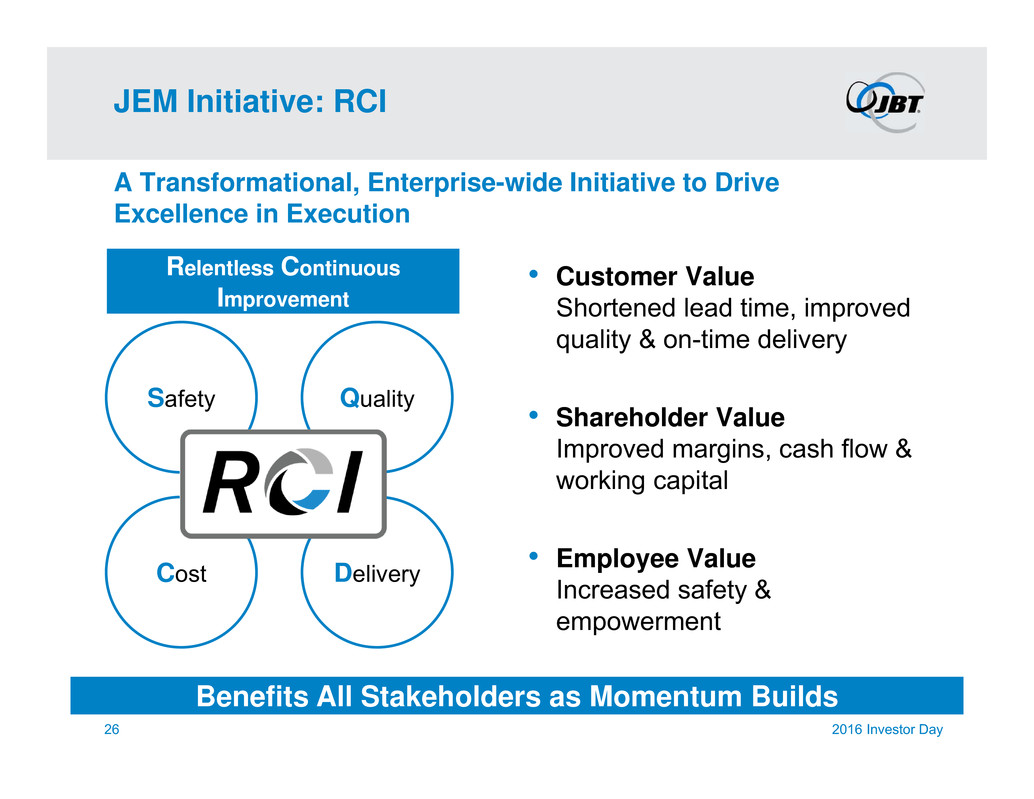
JEM Initiative: RCI A Transformational, Enterprise-wide Initiative to Drive Excellence in Execution 26 2016 Investor Day • Customer Value Shortened lead time, improved quality & on-time delivery • Shareholder Value Improved margins, cash flow & working capital • Employee Value Increased safety & empowerment DeliveryCost QualitySafety Relentless Continuous Improvement Benefits All Stakeholders as Momentum Builds

RCI: What It Is 27 2016 Investor Day 2014 - 2016 Vision at Maturity Rolling out Lean with a focus on production facilities • Lean leader training • 5-S • Metrics-based targets • Visual management • Daily Gemba Walks • Value stream mapping • Flow • Kaizen events Started the Journey with the Basics Lean Enterprise, “RCI” Culture • All employees engaged in continuous improvement • Recognized for operational excellence by customers • Sustained improvement in metrics • Lean practices in place beyond manufacturing • Continual RCI assessments Goal: Flawless Execution across Enterprise

RCI Taking Root Across JBT Significant Progress Achieved Since Introduction in 2014 • Comprehensive training over & beyond Lean principles − 17 Lean Leader Training sessions completed − 325+ leaders from 40 locations trained • 750+ Kaizen events conducted • Cross functional, cross- business unit participation driving “One JBT” culture • RCI assessments underway across manufacturing locations 28 2016 Investor Day Representative Metric Results Achieved 2013-1016 Safety JBT TRIR of 0.82 (vs. industry avg. of 3.5) Quality 20%+ reduction in warranty costs Mfr. Productivity 4-6% annual gains Working Capital ~700 bps reduction in AeroTech WC as % of sales
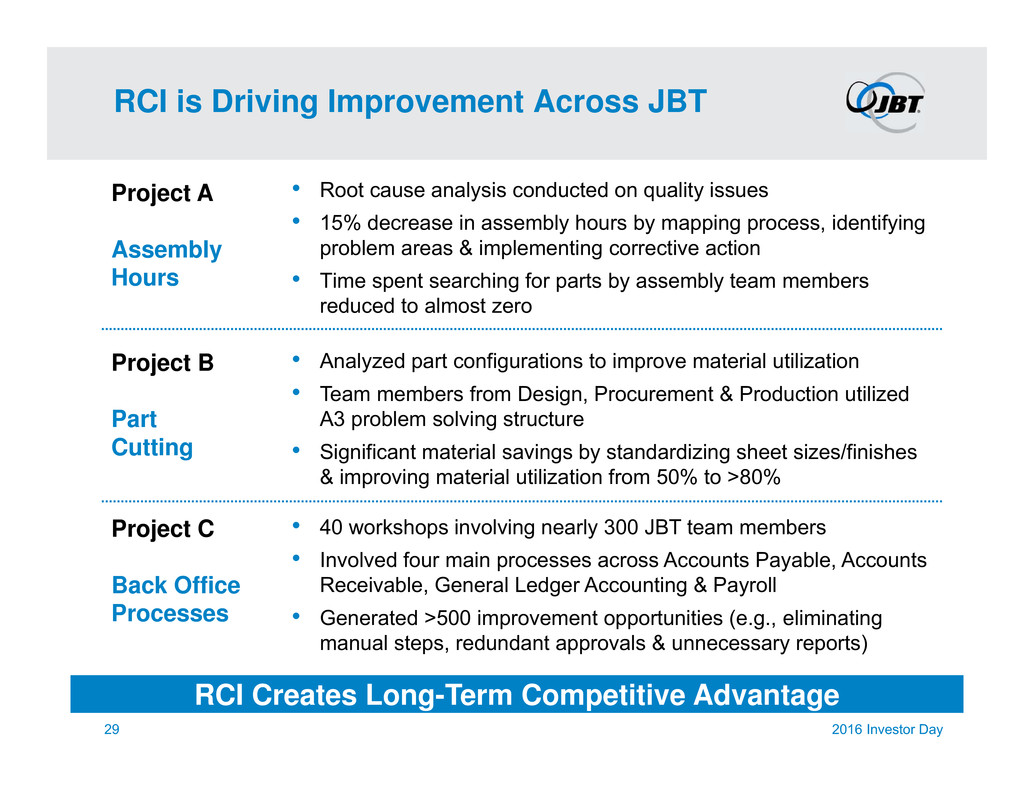
RCI is Driving Improvement Across JBT 29 2016 Investor Day RCI Creates Long-Term Competitive Advantage • Root cause analysis conducted on quality issues • 15% decrease in assembly hours by mapping process, identifying problem areas & implementing corrective action • Time spent searching for parts by assembly team members reduced to almost zero • Analyzed part configurations to improve material utilization • Team members from Design, Procurement & Production utilized A3 problem solving structure • Significant material savings by standardizing sheet sizes/finishes & improving material utilization from 50% to >80% • 40 workshops involving nearly 300 JBT team members • Involved four main processes across Accounts Payable, Accounts Receivable, General Ledger Accounting & Payroll • Generated >500 improvement opportunities (e.g., eliminating manual steps, redundant approvals & unnecessary reports) Project A Assembly Hours Project B Part Cutting Project C Back Office Processes

65% 35% JEM Initiative: Strategic Sourcing 30 2016 Investor Day Direct Indirect 7-Step Strategic Sourcing Process 67% 33% Direct Indirect Targeting 2-3% in Annualized Net Savings by 2019 Total Suppliers ~5,000 Total Material Spend ~$600M Key Initiatives • Streamline supply chain with fewer, stronger suppliers • Take RCI to supply chain • Upgrade sourcing team • Selectively insource • Partnering on new product development Strategic Sourcing as a One JBT Competitive Advantage Monitor Results Select Suppliers & Implement Analyze Results & Negotiate Request Supplier Quotes Develop Sourcing Strategy Research Supply Market Assess Opportunities

JEM Key Takeaways • One purpose & set of values across the entire organization • JEM creates long-term competitive advantage • Significant progress achieved since introduction in 2014; more to come 2016 Investor Day31
AeroTech Dave Burdakin EVP & President, AeroTech

• Growth in global aviation markets offers attractive opportunities • Increased investments in new product development & customer care beginning to pay off • RCI improvements underway; driving shareholder returns & competitive advantage Key Messages 2016 Investor Day33

Addressing Multiple Needs Across the Ground Support Spectrum Fixed Equipment • Passenger Boarding Bridges • Fixed Ground Power & Air Mobile Equipment • Cargo Loaders & Transporters • Deicers • Aircraft Tractors • Mobile Ground Power & Air Airport Services • Gate Systems • Baggage Handling Systems (BHS) • Ground Support Equipment (GSE) • Airport Facilities Technology 34 2016 Investor Day

% of Portfolio Mobile Equipment 46% Fixed Equipment 34% Airport Services 20% Leading Market Position • Long-term customer relationships bolstered by technology leadership • Aftermarket & service support on large installed base • Improving product competitiveness through value engineering & NPD JBT Advantage 35 2016 Investor Day 2010 – 2013 Revenue CAGR: 1% 2013 – 2016P Revenue CAGR: ~9% 1 Based on FY 2015 actuals. 1
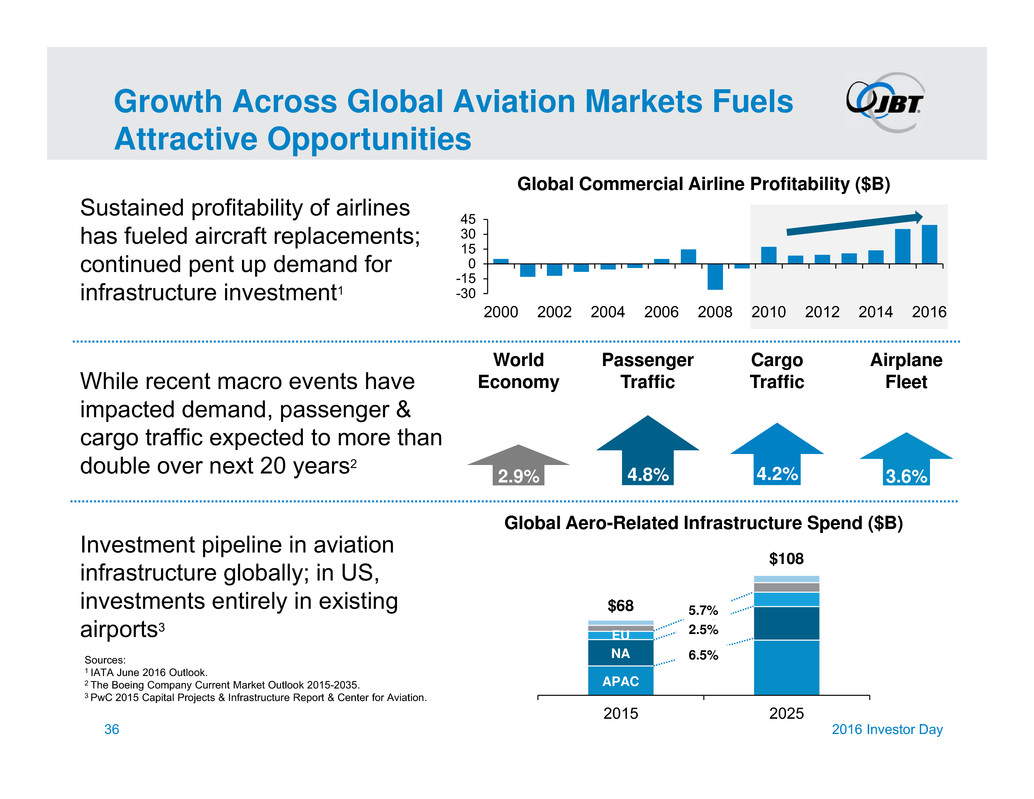
Growth Across Global Aviation Markets Fuels Attractive Opportunities Sources: 1 IATA June 2016 Outlook. 2 The Boeing Company Current Market Outlook 2015-2035. 3 PwC 2015 Capital Projects & Infrastructure Report & Center for Aviation. Sustained profitability of airlines has fueled aircraft replacements; continued pent up demand for infrastructure investment1 -30 -15 0 15 30 45 2000 2002 2004 2006 2008 2010 2012 2014 2016 Global Commercial Airline Profitability ($B) 4.2%4.8%2.9% World Economy Passenger Traffic Cargo TrafficWhile recent macro events have impacted demand, passenger & cargo traffic expected to more than double over next 20 years2 3.6% Airplane Fleet Global Aero-Related Infrastructure Spend ($B) Investment pipeline in aviation infrastructure globally; in US, investments entirely in existing airports3 2016 Investor Day36 2015 2025 6.5%NA EU APAC 2.5% 5.7%$68 $108

AeroTech Financials: Recent Performance Has Been Positive 37 Executing & Building Upon Positive Momentum 2016 Investor Day $323 $350 $383 ~$415 2013 2014 2015 2016P Revenue ($M) 8.2% 8.6% 10.0% 10.4% 2013 2014 2015 2016P Segment EBIT % (1%) 8% 9% ~8% 32% 29% 25% 25% Avg. Working Capital % Rev.Organic Growth ~ 1 1 1 1 FY 2016 outlook per JBT Q3 2016 earnings call, dated October 27, 2016.

• The world’s premium provider of Ground Support Equipment & Passenger Boarding Bridges with a strong North American airport services business −Continued growth with positive economic returns −Market leading products & services • Recognized for operational excellence −RCI culture − Improved working capital efficiency • Growth initiatives − Accelerate new product development −Grow recurring revenue −Grow military sales AeroTech Vision c. 2019 Leading Aviation Support Equipment & Service Provider 2016 Investor Day38
AeroTech Elevate Initiatives Chuck Durst VP & GM, GSE Brian DeRoche VP & GM, Jetway Systems

AeroTech Elevate Initiatives 40 2016 Investor Day Grow global market share through NPD, value engineering & regional manufacturing Enhance margin profile through Customer Care initiatives, iOPS & value-added airport services Develop advanced military product offering & leading customer support capability Deploy JEM framework to strengthen long- term competitive advantage Grow Recurring Revenue Accelerate New Product & Service Development Grow Military Sales JBT Excellence Model

Accelerate New Product & Service Development Grow global market share in core commercial product line through NPD, value engineering & regional manufacturing 41 2016 Investor Day Over 3 YearsNear-term • Ramp up introduction of new conventional tractors (B250/B350) for narrow body aircraft • Build on solid initial reception of Ranger cargo loader for ground handler market • Complete upgrade of ground power & preconditioned air product lines • Finalize value engineering & 80/20 cost optimization initiatives • Increase R&D spend as a % of sales by 50 – 100 bps over 3 years • Refresh core products to “new” JBT performance levels • Further develop regional manufacturing capabilities • Integrate iOPS with JBT product lines & expand to competitive products

Grow Recurring Revenue Enhance margin profile through Customer Care (aftermarket) initiatives & airport services technology 42 2016 Investor Day Over 3 YearsNear-term • Invest in additional resources in Customer Care • Provide additional value-added services to our airport maintenance customers • Add technical resources to improve iOPS capability • Expand Customer Care business with regional rebuild capability & select global investments in personnel • Enhance baggage handling systems controls capability through partnerships & internal development

Grow Military Sales Build & develop advanced military product offering & leading customer support capability 43 2016 Investor Day Over 3 YearsNear-term • Execute SMEPP contract • Leverage Support Equipment Requirements Documentation (SERD) for F-16 PCA support products • Increase investment in Military R&D − Introduce new products for additional fighter aircraft − Expand launch of stand-alone mobile combination units • Reinforce marketing partnership to penetrate EU market • Upgrade fighter support product family • Introduce complete suite of F-35 on- ground products • Launch new products in 2017 & 2018 − Expanded Power offerings with new technology introductions − New PCAir and Power products for Western airframes • Proactively target future military programs − Work campaigns to target procurement bases − Partner with OEM’s on new and refurbishment contracts
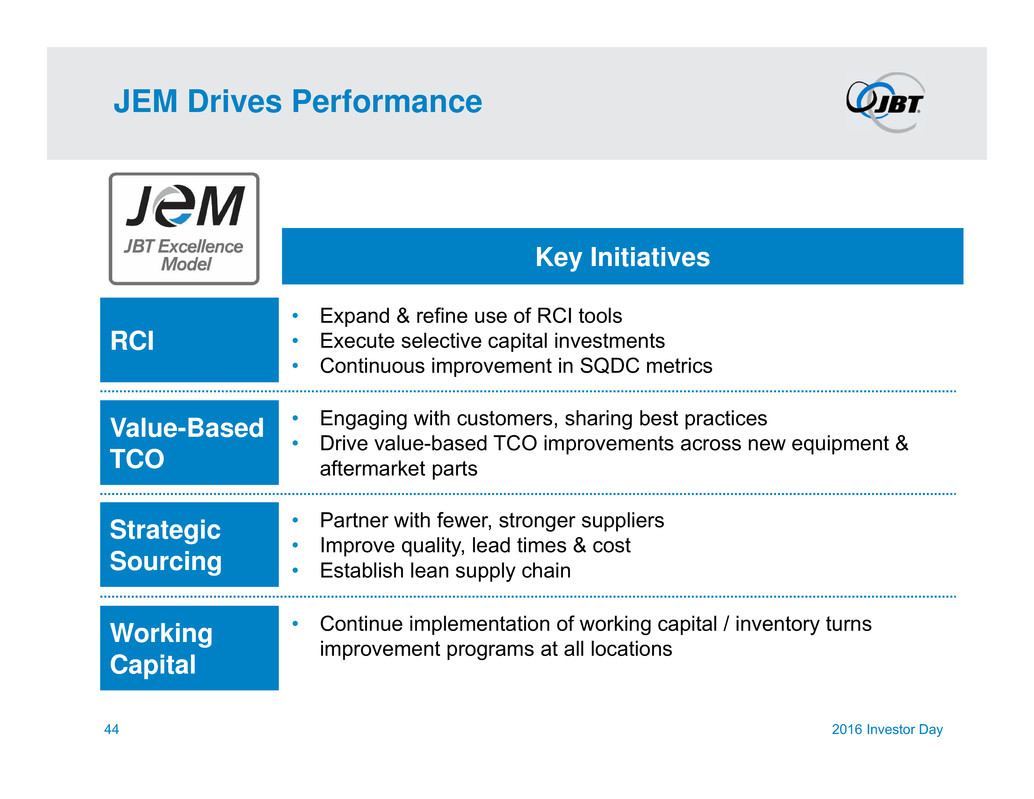
JEM Drives Performance 2016 Investor Day44 Key Initiatives RCI Value-Based TCO Strategic Sourcing Working Capital • Expand & refine use of RCI tools • Execute selective capital investments • Continuous improvement in SQDC metrics • Engaging with customers, sharing best practices • Drive value-based TCO improvements across new equipment & aftermarket parts • Partner with fewer, stronger suppliers • Improve quality, lead times & cost • Establish lean supply chain • Continue implementation of working capital / inventory turns improvement programs at all locations
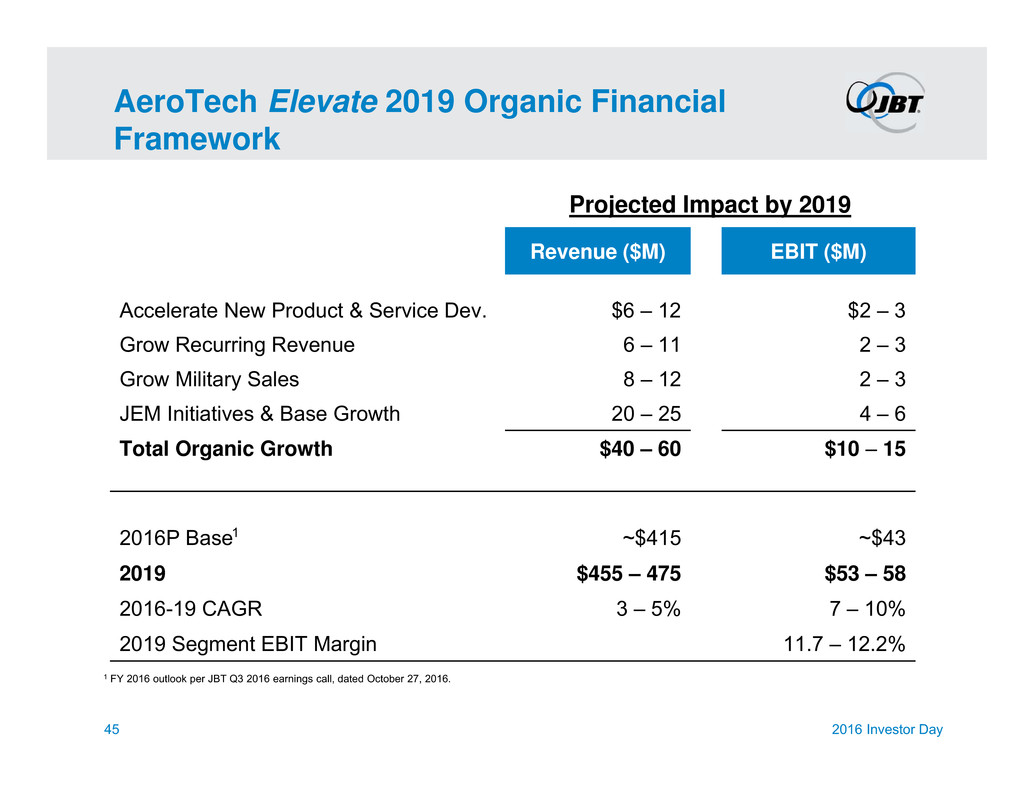
AeroTech Elevate 2019 Organic Financial Framework 45 Projected Impact by 2019 Revenue ($M) EBIT ($M) Accelerate New Product & Service Dev. $6 – 12 $2 – 3 Grow Recurring Revenue 6 – 11 2 – 3 Grow Military Sales 8 – 12 2 – 3 JEM Initiatives & Base Growth 20 – 25 4 – 6 Total Organic Growth $40 – 60 $10 – 15 2016P Base ~$415 ~$43 2019 $455 – 475 $53 – 58 2016-19 CAGR 3 – 5% 7 – 10% 2019 Segment EBIT Margin 11.7 – 12.2% 2016 Investor Day 1 1 FY 2016 outlook per JBT Q3 2016 earnings call, dated October 27, 2016.
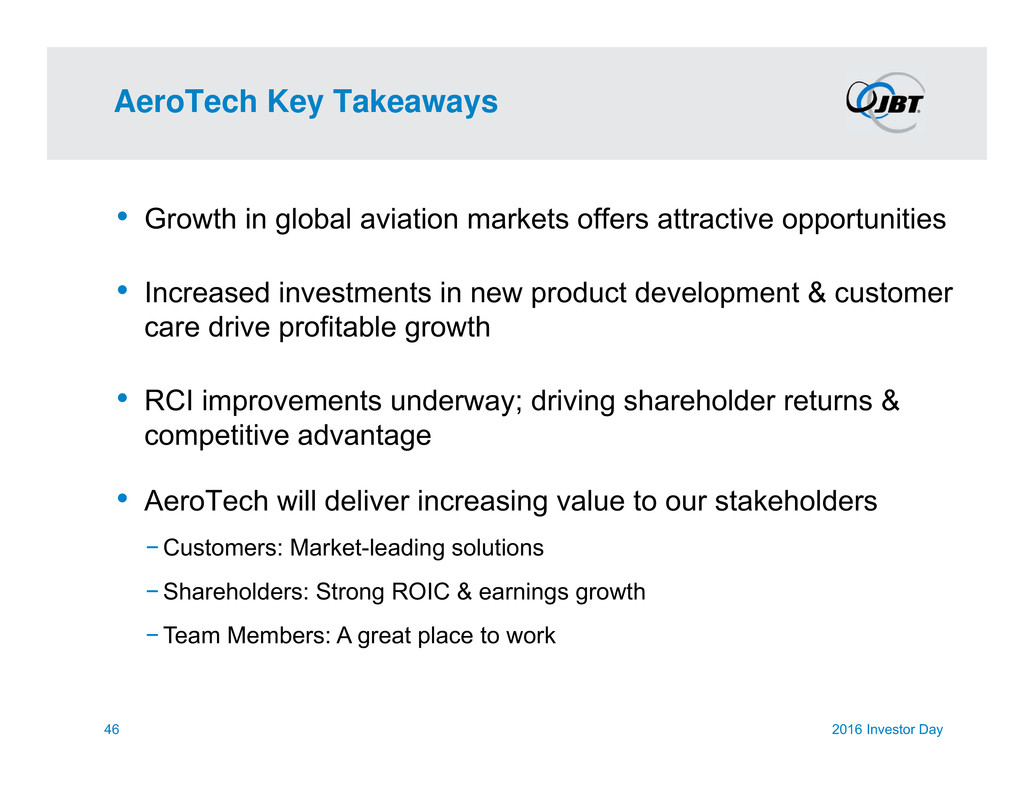
• Growth in global aviation markets offers attractive opportunities • Increased investments in new product development & customer care drive profitable growth • RCI improvements underway; driving shareholder returns & competitive advantage • AeroTech will deliver increasing value to our stakeholders −Customers: Market-leading solutions −Shareholders: Strong ROIC & earnings growth −Team Members: A great place to work AeroTech Key Takeaways 2016 Investor Day46

FoodTech Steve Smith EVP & President, FoodTech

• Through strategic investments & acquisitions since 2013, significantly increased participation in global Protein & Liquid Foods markets with strong growth drivers • Transforming into a full-line technology solutions & service provider of choice to globalizing food companies • Continuing focus on developing new products that deliver best-in-class yield, productivity & efficiency • Team has undergone dramatic cultural change with demonstrated energy & passion to grow their businesses Key Messages 2016 Investor Day48
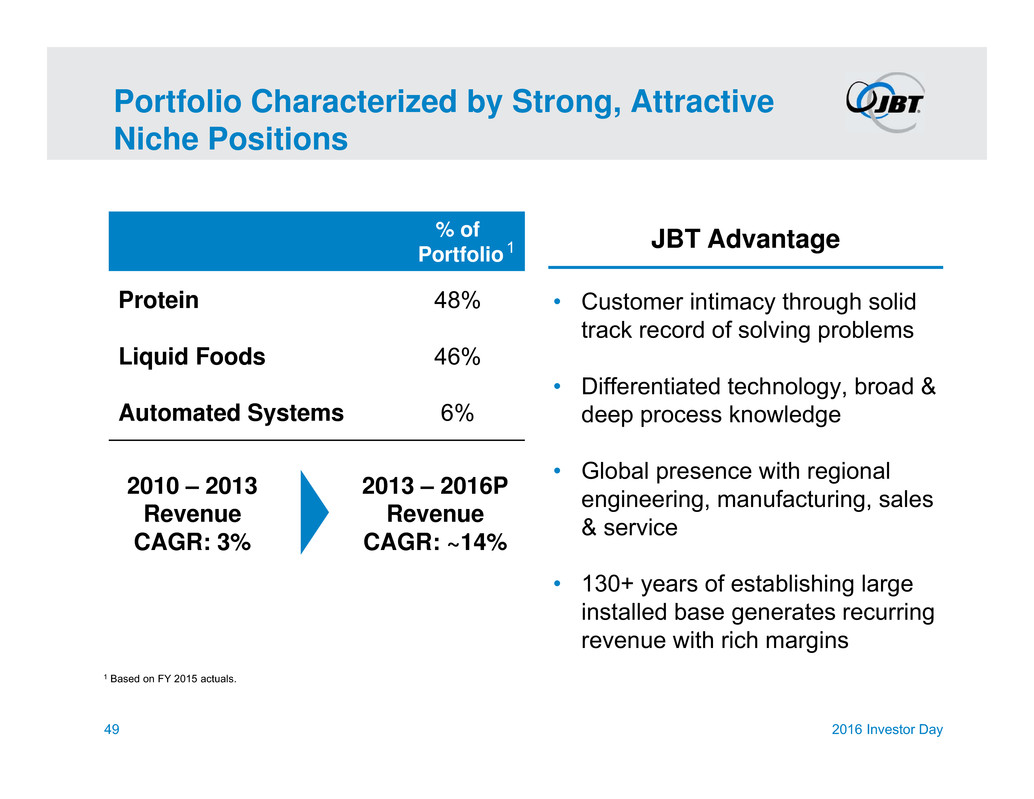
% of Portfolio Protein 48% Liquid Foods 46% Automated Systems 6% Portfolio Characterized by Strong, Attractive Niche Positions • Customer intimacy through solid track record of solving problems • Differentiated technology, broad & deep process knowledge • Global presence with regional engineering, manufacturing, sales & service • 130+ years of establishing large installed base generates recurring revenue with rich margins JBT Advantage 2010 – 2013 Revenue CAGR: 3% 2013 – 2016P Revenue CAGR: ~14% 49 2016 Investor Day 1 Based on FY 2015 actuals. 1

Large, Scalable Global Footprint 2016 Investor Day50 Manufacturing / Assembly Location Personnel Location Corporate HQ Canada U.S. Mexico Brazil Chile Argentina U.K. Belgium Spain Sweden Italy South Africa Saudi Arabia Russia India Malaysia Philippines Australia Netherlands China Vietnam Thailand Indonesia New Zealand 2015 Sales NA 48% EMEA 28% APAC 13% LatAm 11% Germany
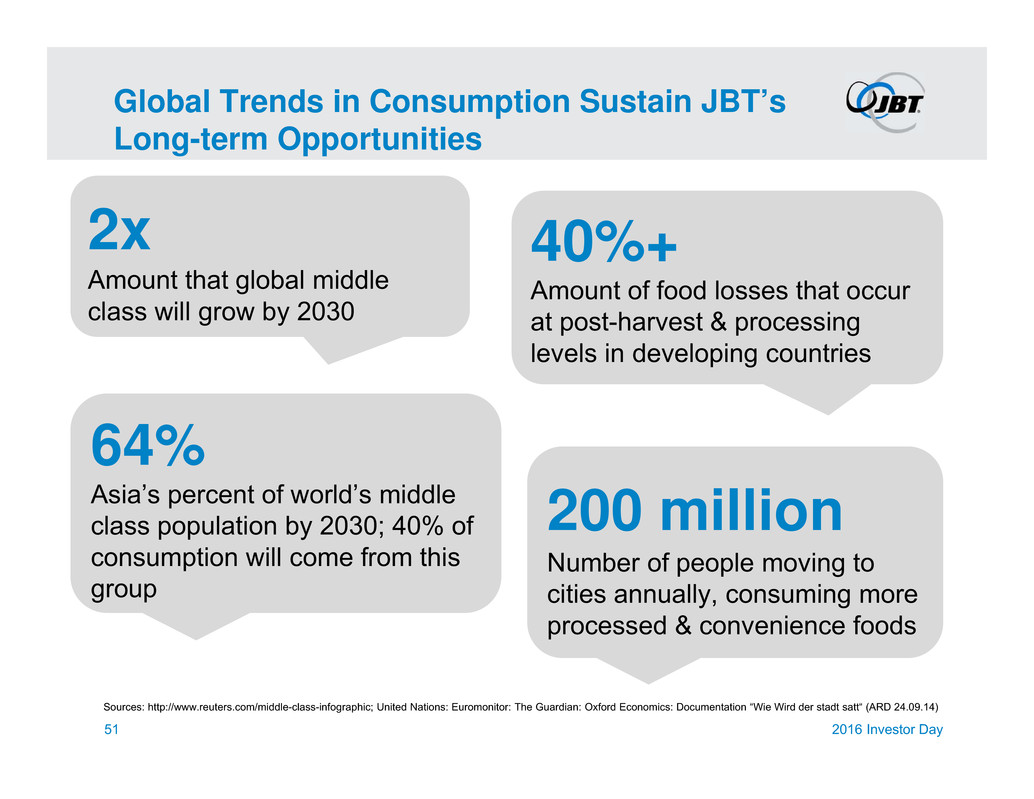
Global Trends in Consumption Sustain JBT’s Long-term Opportunities Sources: http://www.reuters.com/middle-class-infographic; United Nations: Euromonitor: The Guardian: Oxford Economics: Documentation “Wie Wird der stadt satt“ (ARD 24.09.14) 64% Asia’s percent of world’s middle class population by 2030; 40% of consumption will come from this group 2x Amount that global middle class will grow by 2030 2016 Investor Day51 200 million Number of people moving to cities annually, consuming more processed & convenience foods 40%+ Amount of food losses that occur at post-harvest & processing levels in developing countries
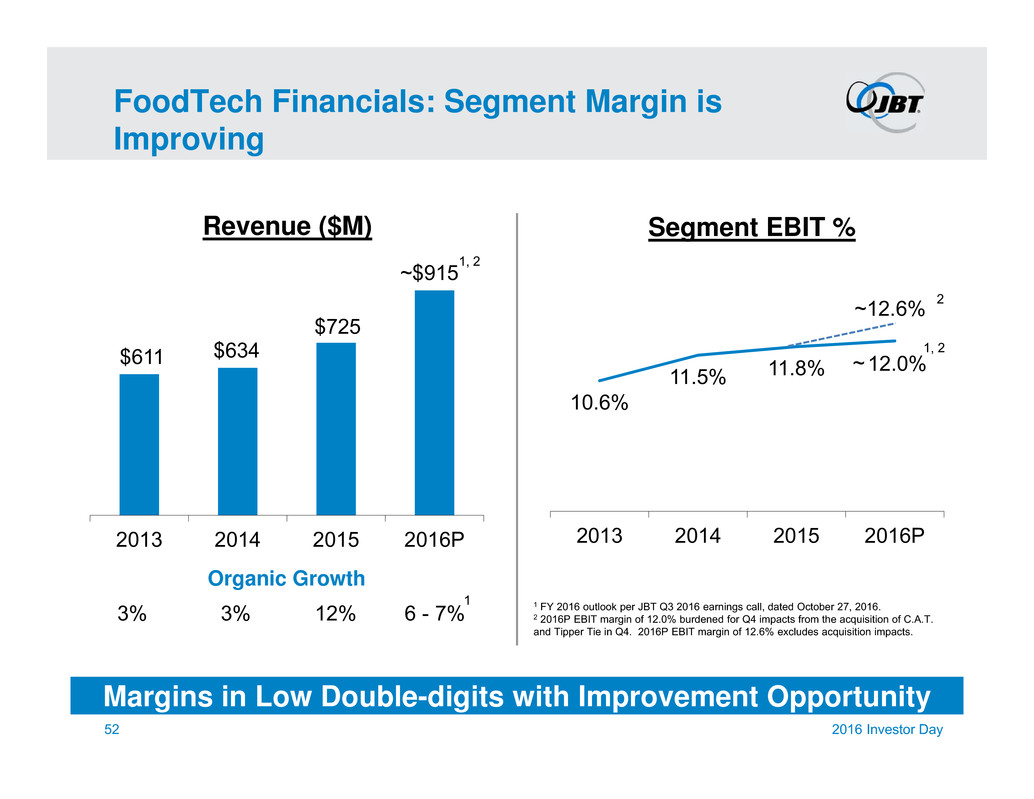
FoodTech Financials: Segment Margin is Improving 52 Margins in Low Double-digits with Improvement Opportunity 2016 Investor Day $611 $634 $725 ~$915 2013 2014 2015 2016P Revenue ($M) 1, 2 10.6% 11.5% 11.8% 12.0% 2013 2014 2015 2016P Segment EBIT % 3% 3% 12% 6 - 7% Organic Growth ~ 1 FY 2016 outlook per JBT Q3 2016 earnings call, dated October 27, 2016. 2 2016P EBIT margin of 12.0% burdened for Q4 impacts from the acquisition of C.A.T. and Tipper Tie in Q4. 2016P EBIT margin of 12.6% excludes acquisition impacts. 1, 2 1 ~12.6% 2

• Highly profitable global full-line technology solutions & service provider to the world’s premier food companies − Best-in-class yield, productivity & resource efficiency − Most valued global supplier enabling customer success − Customer Care program & iOPS strengthening customer relationships • Culture of innovation & excellence − Active R&D program fueling new product development − Global Innovation Centers bolstering status as valued technology partner • Demonstrated growth – organically & through disciplined acquisitions − 3% - 5% organic growth annually − Continue smart, aggressive & disciplined acquisition program − Deliver strong margin improvement every year FoodTech Vision c. 2019 Premier Technology Solutions Provider 2016 Investor Day53
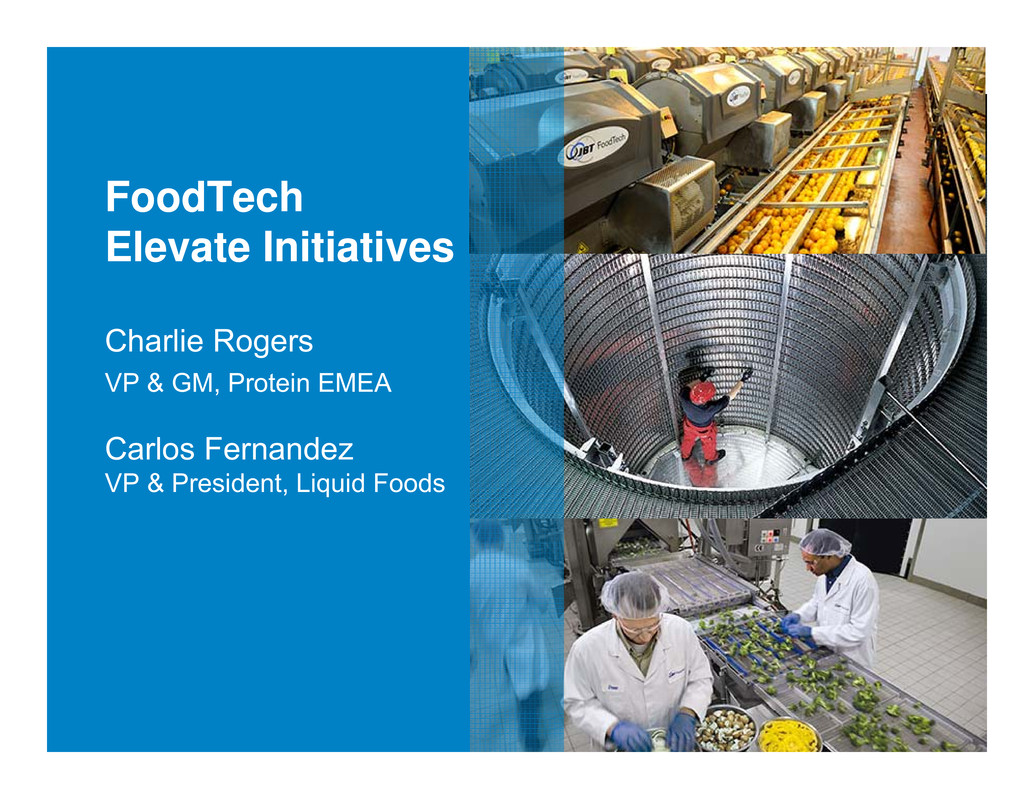
FoodTech Elevate Initiatives Charlie Rogers VP & GM, Protein EMEA Carlos Fernandez VP & President, Liquid Foods

FoodTech Elevate Initiatives 55 2016 Investor Day Establish rapid R&D program that strengthens JBT’s position as a valued innovation partner Expand service network to maximize share of aftermarket parts, service & refurbishment sales Grow business through localization of targeted products, cross-selling & upgraded skill sets Deploy JEM framework to strengthen long- term competitive advantage Drive organic growth via globalization of products balanced with strategic cross selling of core products Grow Recurring Revenue Accelerate New Product & Service Development Execute Impact Initiatives Build Asia Pacific Business JBT Excellence Model
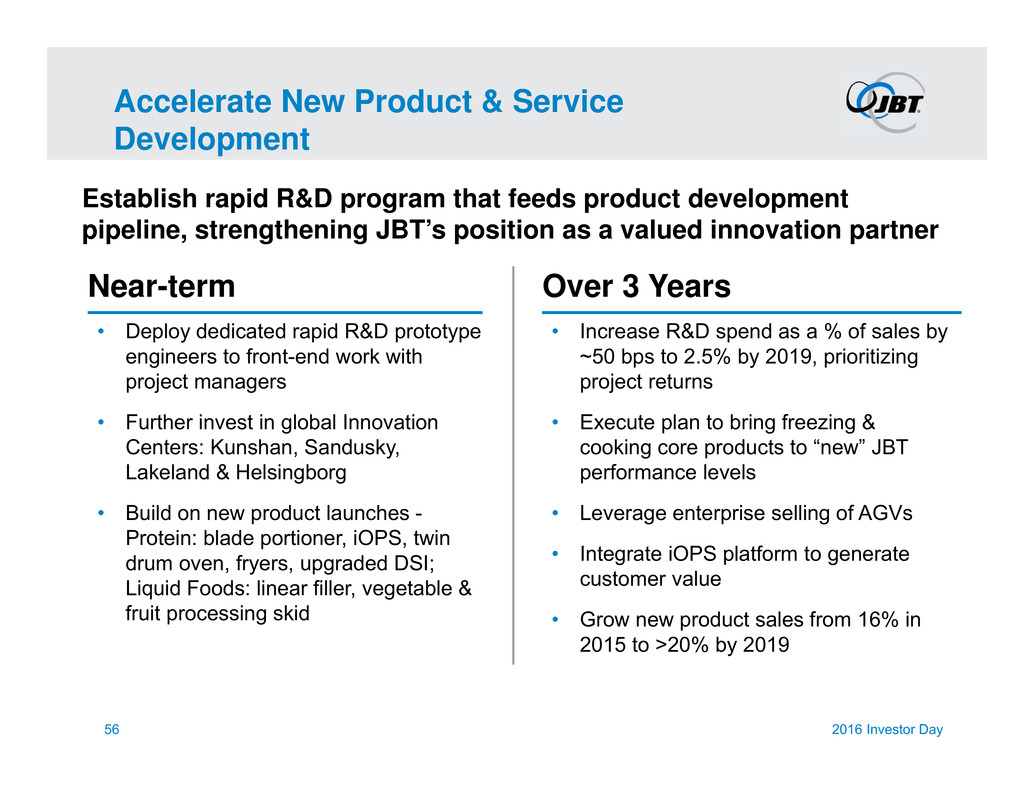
Accelerate New Product & Service Development Establish rapid R&D program that feeds product development pipeline, strengthening JBT’s position as a valued innovation partner 56 2016 Investor Day Over 3 YearsNear-term • Deploy dedicated rapid R&D prototype engineers to front-end work with project managers • Further invest in global Innovation Centers: Kunshan, Sandusky, Lakeland & Helsingborg • Build on new product launches - Protein: blade portioner, iOPS, twin drum oven, fryers, upgraded DSI; Liquid Foods: linear filler, vegetable & fruit processing skid • Increase R&D spend as a % of sales by ~50 bps to 2.5% by 2019, prioritizing project returns • Execute plan to bring freezing & cooking core products to “new” JBT performance levels • Leverage enterprise selling of AGVs • Integrate iOPS platform to generate customer value • Grow new product sales from 16% in 2015 to >20% by 2019
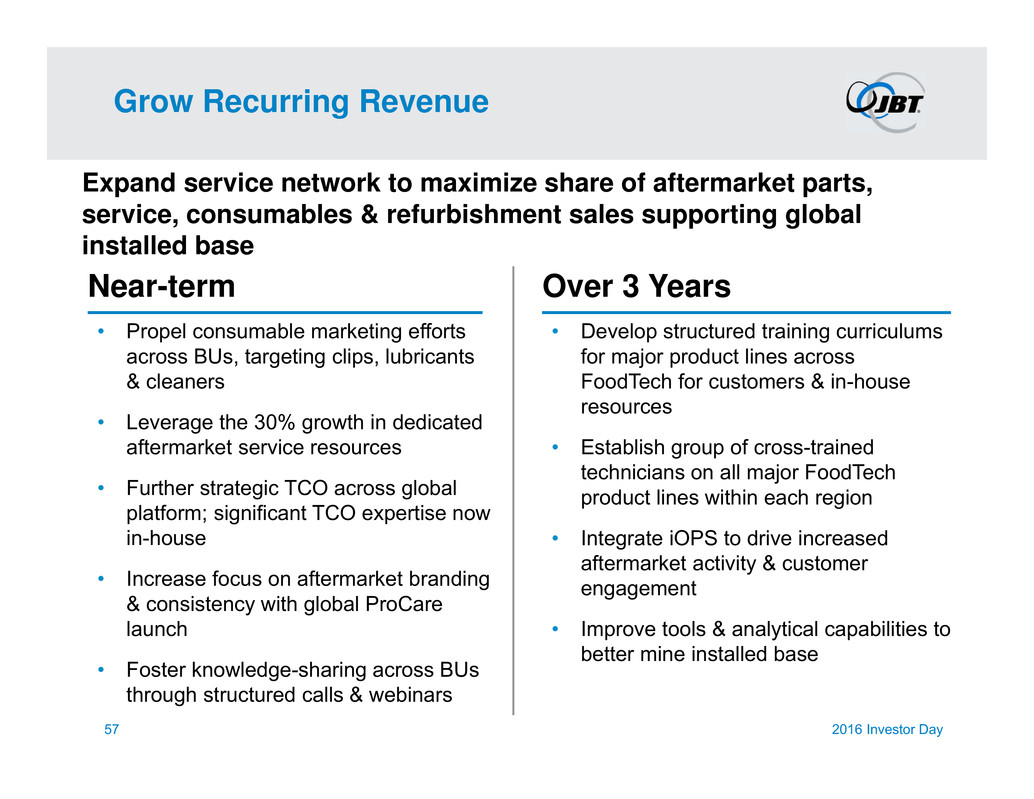
Grow Recurring Revenue Expand service network to maximize share of aftermarket parts, service, consumables & refurbishment sales supporting global installed base 57 2016 Investor Day Over 3 YearsNear-term • Propel consumable marketing efforts across BUs, targeting clips, lubricants & cleaners • Leverage the 30% growth in dedicated aftermarket service resources • Further strategic TCO across global platform; significant TCO expertise now in-house • Increase focus on aftermarket branding & consistency with global ProCare launch • Foster knowledge-sharing across BUs through structured calls & webinars • Develop structured training curriculums for major product lines across FoodTech for customers & in-house resources • Establish group of cross-trained technicians on all major FoodTech product lines within each region • Integrate iOPS to drive increased aftermarket activity & customer engagement • Improve tools & analytical capabilities to better mine installed base
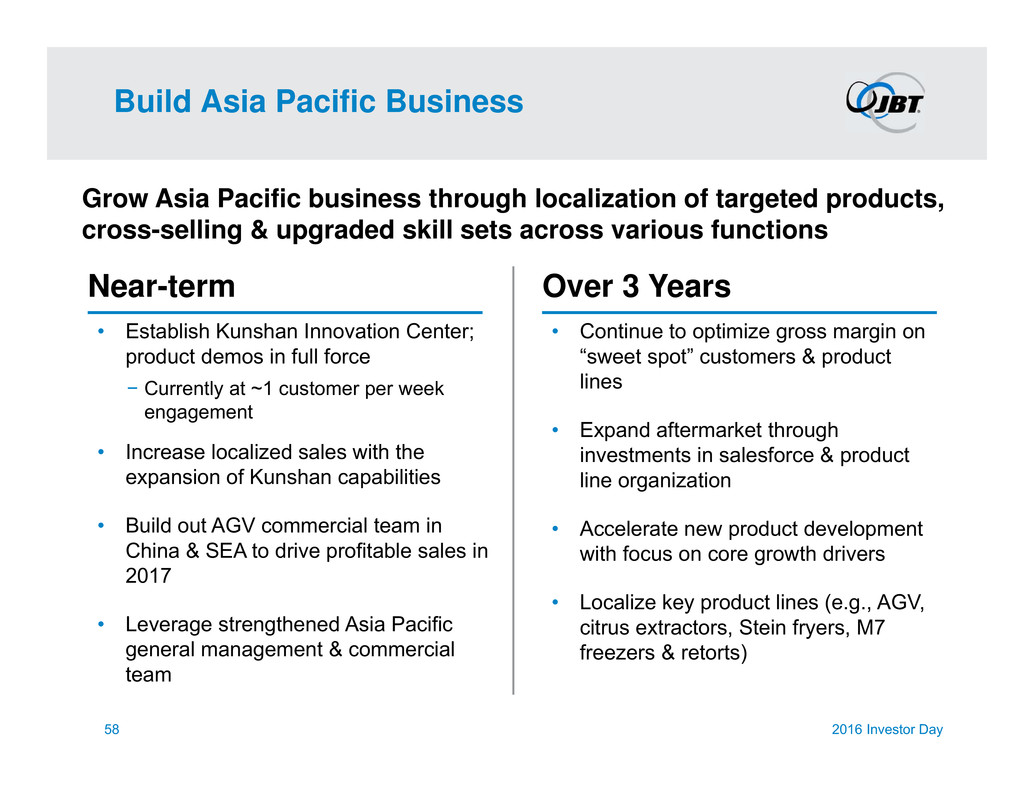
Build Asia Pacific Business Grow Asia Pacific business through localization of targeted products, cross-selling & upgraded skill sets across various functions 58 2016 Investor Day Over 3 YearsNear-term • Establish Kunshan Innovation Center; product demos in full force − Currently at ~1 customer per week engagement • Increase localized sales with the expansion of Kunshan capabilities • Build out AGV commercial team in China & SEA to drive profitable sales in 2017 • Leverage strengthened Asia Pacific general management & commercial team • Continue to optimize gross margin on “sweet spot” customers & product lines • Expand aftermarket through investments in salesforce & product line organization • Accelerate new product development with focus on core growth drivers • Localize key product lines (e.g., AGV, citrus extractors, Stein fryers, M7 freezers & retorts)
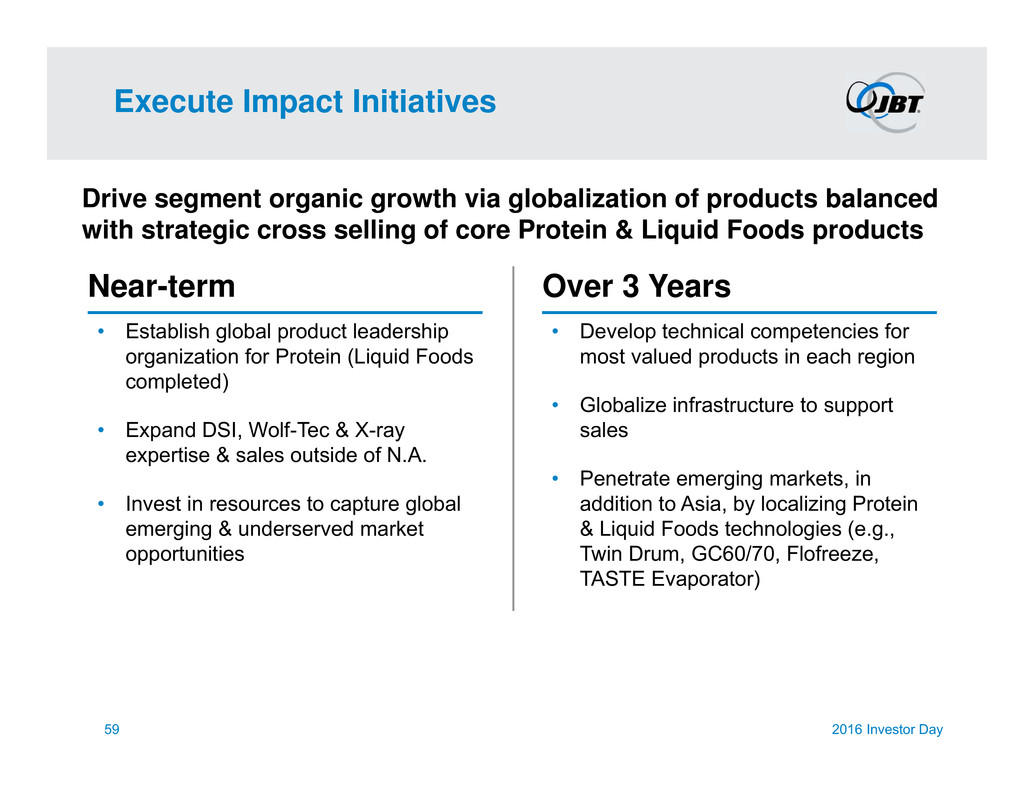
Execute Impact Initiatives Drive segment organic growth via globalization of products balanced with strategic cross selling of core Protein & Liquid Foods products 59 2016 Investor Day Over 3 YearsNear-term • Establish global product leadership organization for Protein (Liquid Foods completed) • Expand DSI, Wolf-Tec & X-ray expertise & sales outside of N.A. • Invest in resources to capture global emerging & underserved market opportunities • Develop technical competencies for most valued products in each region • Globalize infrastructure to support sales • Penetrate emerging markets, in addition to Asia, by localizing Protein & Liquid Foods technologies (e.g., Twin Drum, GC60/70, Flofreeze, TASTE Evaporator)

JEM Drives Performance 2016 Investor Day60 Key Initiatives RCI Value-Based TCO Strategic Sourcing Optimization Plan • Expand & refine RCI tools & tracking • Use capital investments to increase productivity • Drive lean culture from office to plant floor • Conduct internal audits to fine-tune application • Share best practices across JBT • Implement value-based TCO program at acquisitions • Leverage regional buys • Standardize best procurement processes • Insource to low-cost JBT locations • Further institutionalize functional & manufacturing rationalization across Protein & Liquid Foods • Organizational simplification in Asia & Brazil
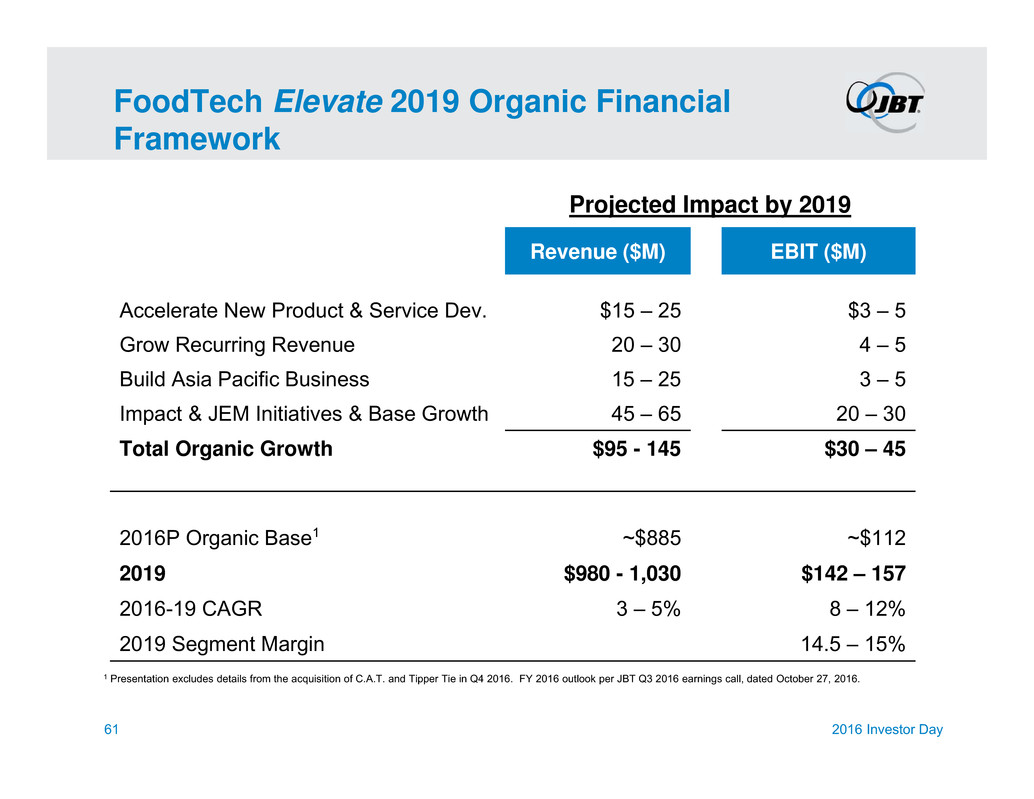
FoodTech Elevate 2019 Organic Financial Framework 61 Projected Impact by 2019 Revenue ($M) EBIT ($M) Accelerate New Product & Service Dev. $15 – 25 $3 – 5 Grow Recurring Revenue 20 – 30 4 – 5 Build Asia Pacific Business 15 – 25 3 – 5 Impact & JEM Initiatives & Base Growth 45 – 65 20 – 30 Total Organic Growth $95 - 145 $30 – 45 2016P Organic Base ~$885 ~$112 2019 $980 - 1,030 $142 – 157 2016-19 CAGR 3 – 5% 8 – 12% 2019 Segment Margin 14.5 – 15% 2016 Investor Day 1 1 Presentation excludes details from the acquisition of C.A.T. and Tipper Tie in Q4 2016. FY 2016 outlook per JBT Q3 2016 earnings call, dated October 27, 2016.
• Global demographic & economic trends will propel solid growth in FoodTech’s markets • Through further strategic investments & acquisitions, JBT will strengthen presence in attractive global Protein & Liquid Foods markets • Significant RCI opportunities remain in sourcing, productivity, quality, centralization & engineering standardization • FoodTech rapidly transforming into a solutions & service provider of choice to globalizing food companies FoodTech Key Takeaways 2016 Investor Day62
M&A Overview Debarshi Sengupta EVP, Corporate Development
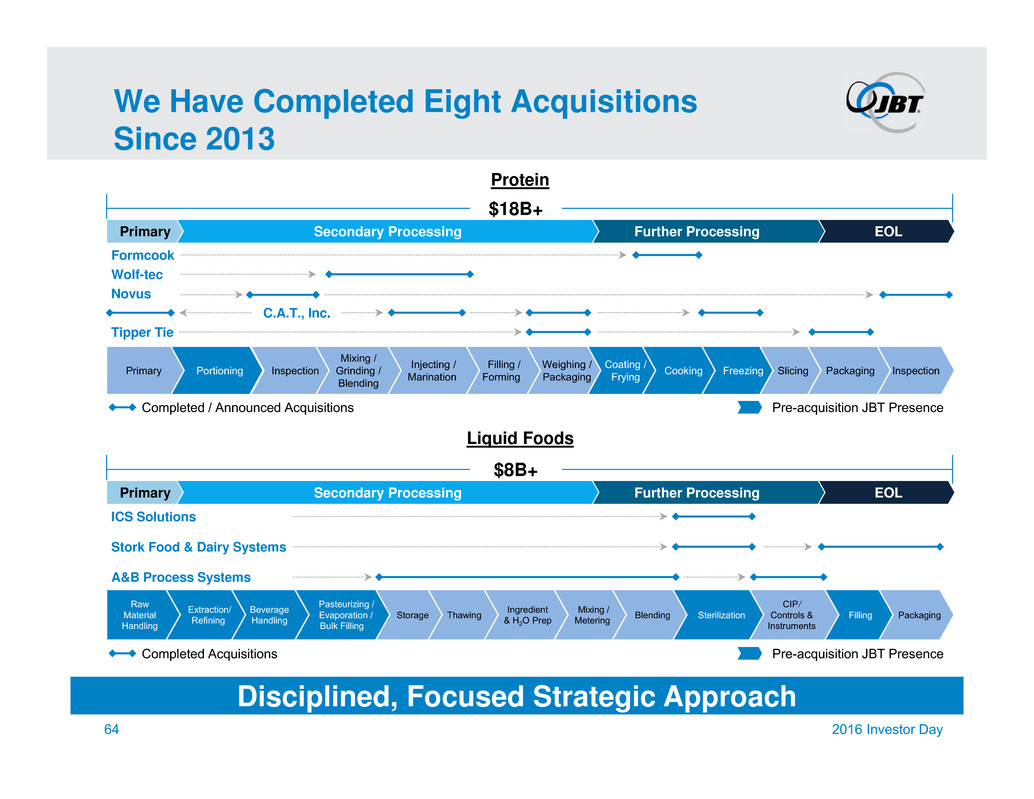
We Have Completed Eight Acquisitions Since 2013 2016 Investor Day64 EOLFurther Processing $18B+ Liquid Foods PackagingFilling CIP/ Controls & Instruments SterilizationBlendingMixing / Metering Ingredient & H2O Prep ThawingStorage Pasteurizing / Evaporation / Bulk Filling Beverage Handling Extraction/ Refining Raw Material Handling ICS Solutions Wolf-tec Formcook A&B Process Systems Stork Food & Dairy Systems Novus Secondary Processing Tipper Tie Primary Protein C.A.T., Inc. Primary Portioning Weighing / Packaging Coating / Frying Cooking Freezing Filling / Forming Slicing Injecting / MarinationInspection Packaging Inspection Mixing / Grinding / Blending EOLFurther Processing $8B+ Secondary ProcessingPrimary Disciplined, Focused Strategic Approach Completed / Announced Acquisitions Pre-acquisition JBT Presence Completed Acquisitions Pre-acquisition JBT Presence
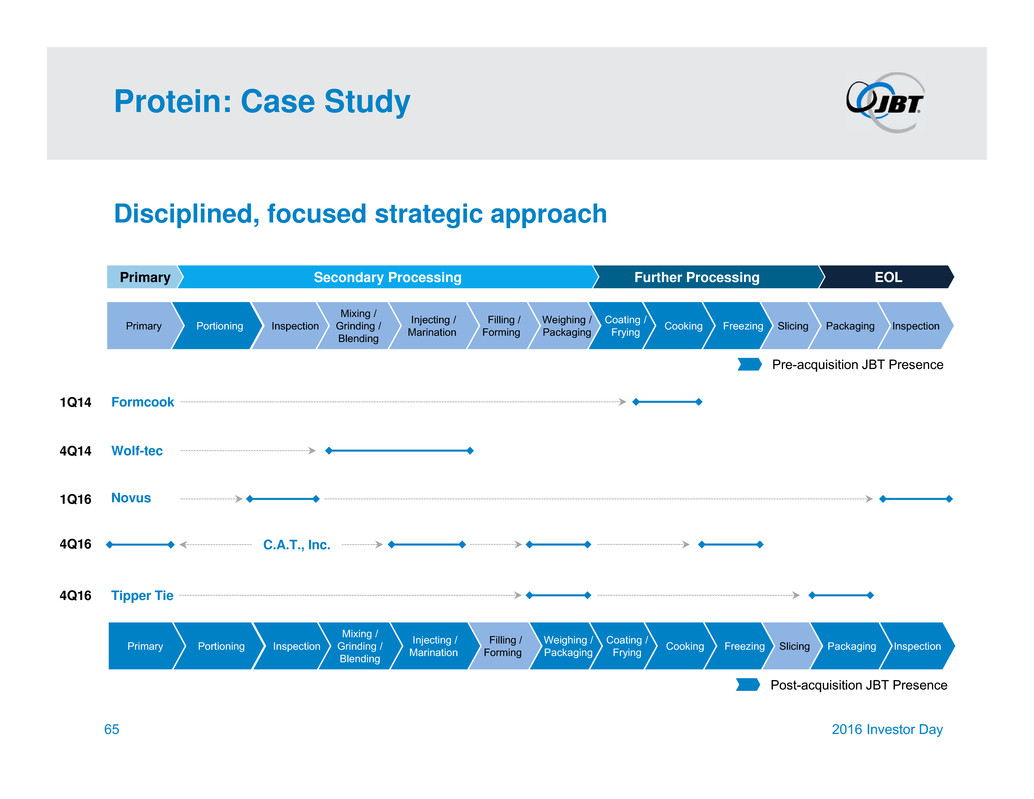
Protein: Case Study Disciplined, focused strategic approach 65 2016 Investor Day EOLFurther Processing Wolf-tec Formcook Novus Secondary Processing Tipper Tie Primary Primary Portioning Weighing / Packaging Coating / Frying Cooking Freezing Filling / Forming Slicing Injecting / MarinationInspection Packaging Inspection Mixing / Grinding / Blending 1Q14 4Q14 1Q16 4Q16 4Q16 C.A.T., Inc. Pre-acquisition JBT Presence Primary Portioning Weighing / Packaging Coating / Frying Cooking Freezing Filling / Forming Slicing Injecting / MarinationInspection Packaging Inspection Mixing / Grinding / Blending Post-acquisition JBT Presence

JBT’s M&A Process is Methodical & Approach is Disciplined 2016 Investor Day66 Deal Phase Ownership Deliverable LEAD the Process • Deal Board − CEO, CFO, Gen. Counsel, Corp. Controller • Executive Sponsor − Segment President & CFO • Provide strategic vision, values & business direction DRIVE the Process • Transaction Management Office − BU Deal Champion, Corp. Dev. Team • Coordinate, plan & track effort • Establish focus & schedule • Oversee quality of deliverables • Identify & resolve issues CARRY OUT the Process • BU Functional Teams • Corporate Functional Teams • External Advisors • Provide subject matter expertise • Develop activities, conduct analyses, evaluate complexities • Formulate conclusions & recommendations INTEGRATE the Deal • Integration Management Office − BU Integration Leader, Functional Area Teams • Execute & track to pre-defined scorecards

Post-Merger Integration Process is Extensive 67 Integration Planning Due Diligence Post-close Execution • Dedicated Integration Leader assigned prior to transaction close; responsible for framework development, leading Integration Management Office & execution • Extensive post-merger integration framework by functional area developed with defined milestones for Day 1, 30, 60, 100, 180, 360 • Scorecards tracked & presented at milestone points to Deal Board & quarterly to JBT Board of Directors • Develop integration framework • Initiate pre-close communications • Launch integration teams • Develop prioritized integration plans − People & culture − Synergy capture − Functional transition • Prepare for Day 1 • First-30 days business stabilization • Implement people, synergy, functional transformation plan • Transition to business owner 2016 Investor Day

Robust Synergy Identification & Execution… 2016 Investor Day68 Synergy Categories Form-cook ICS Wolf- tec Stork A&B Novus C.A.T. Tipper Tie C o s t RCI Framework Deployment Strategic Global Sourcing Value-based TCO Shared Services Center Other Operational Efficiency Focus Footprint / Workforce Rationalization Revenu e Globalize Sales Pull-through Sales New Products / Customers / Markets Grow Recurring Revenue

…Resulting in Strong Value Creation 69 2016 Investor Day Acquisition Purchase Price ~Annualized Revenue EPS Impact FY16 FY17 FY18 Stork & A&B 2015 $164M $170M $0.15 - $0.20 $0.30 - $0.40 - C.A.T. 4Q16 $90M $50M ($0.03 - $0.05) $0.05 - $0.10 $0.15 - $0.20 Tipper Tie 4Q16 $160M $90M ($0.03 - $0.05) $0.08 - $0.12 $0.23 - $0.28 • Acquisition performance collectively in line with expectations • Key metrics include IRR, ROIC & cash-on-cash payback
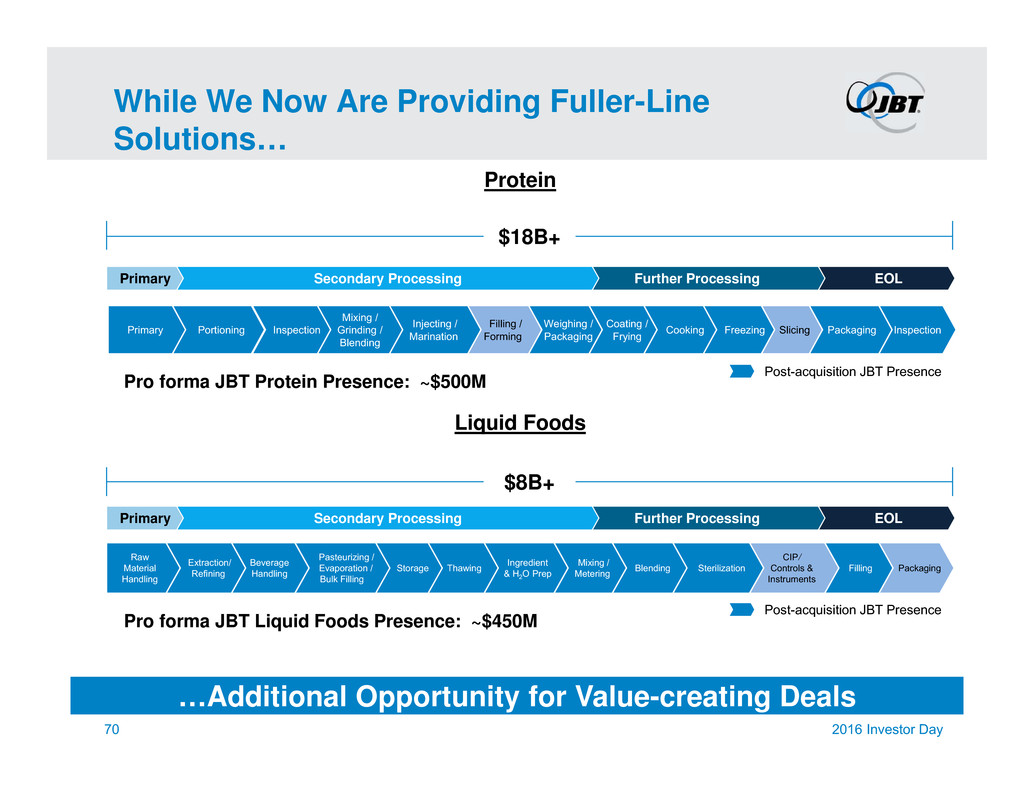
While We Now Are Providing Fuller-Line Solutions… 2016 Investor Day70 EOLFurther Processing Liquid Foods PackagingFilling CIP/ Controls & Instruments SterilizationBlendingMixing / Metering Ingredient & H2O Prep ThawingStorage Pasteurizing / Evaporation / Bulk Filling Beverage Handling Extraction/ Refining Raw Material Handling Secondary ProcessingPrimary Protein EOLFurther ProcessingSecondary ProcessingPrimary Primary Portioning Weighing / Packaging Coating / Frying Cooking Freezing Filling / Forming Slicing Injecting / MarinationInspection Packaging Inspection Mixing / Grinding / Blending Pro forma JBT Protein Presence: ~$500M Pro forma JBT Liquid Foods Presence: ~$450M …Additional Opportunity for Value-creating Deals Post-acquisition JBT Presence Post-acquisition JBT Presence $18B+ $8B+

• Disciplined, focused strategic approach • 8 acquisitions completed contributing over $350M in revenue, significantly strengthening JBT’s position in Protein & Liquid Foods • Significant Post-Merger Integration (PMI) planning conducted prior to transaction close; focused execution over 12 – 24 months • Continued focus on Protein & Liquid Foods, with robust pipeline of opportunities; selective, small acquisitions to be considered in AeroTech Key Messages 2016 Investor Day71
Financial Framework Brian Deck EVP & CFO
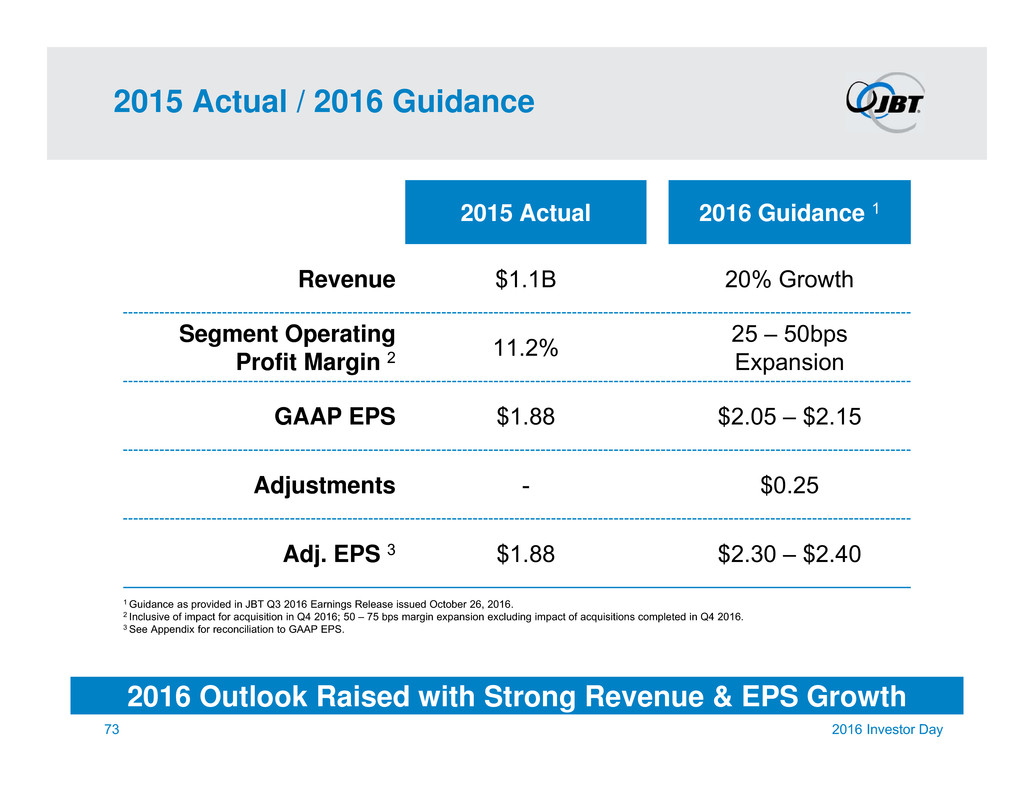
2015 Actual / 2016 Guidance 2015 Actual 2016 Guidance 1 Revenue $1.1B 20% Growth Segment Operating Profit Margin 2 11.2% 25 – 50bps Expansion GAAP EPS $1.88 $2.05 – $2.15 Adjustments - $0.25 Adj. EPS 3 $1.88 $2.30 – $2.40 2016 Investor Day 1 Guidance as provided in JBT Q3 2016 Earnings Release issued October 26, 2016. 2 Inclusive of impact for acquisition in Q4 2016; 50 – 75 bps margin expansion excluding impact of acquisitions completed in Q4 2016. 3 See Appendix for reconciliation to GAAP EPS. 2016 Outlook Raised with Strong Revenue & EPS Growth 73

14% 15% 15% 14% 2013 2014 2015 2016P Historical Results 1 2014 Adj. Operating Income excludes impact of $14.5M in restructuring charges recorded in the year. 2016P Adj. Operating Income excludes impact of expected $12.0M in restructuring charges expected in the year. 2 Return on Invested Capital (ROIC) defined as net income from continuing operations plus net after tax interest expense divided by average invested capital; average invested capital defined as the average of the beginning & ending (1) owners’ equity plus (2) long-term debt plus (3) AOCL pension & less (4) cash & cash equivalents. 3 15% ROIC excluding impact of acquisitions completed in 2016. Note: All 2016P financials as per guidance provided in JBT Q3 2016 Earnings Release issued October 26, 2016. $934 $984 $1,107 $1,330 2013 2014 2015 2016P Revenue ($M) $91 $103 $124 ~$150 2013 2014 2015 2016P $55 $65 $89 ~$110 2013 2014 2015 2016P ROIC 2Adj. Operating Income ($M)1 Segment Operating Profit ($M) CAGR 13% CAGR 18% CAGR 26% 74 2016 Investor Day ~ 16% 3~ ~
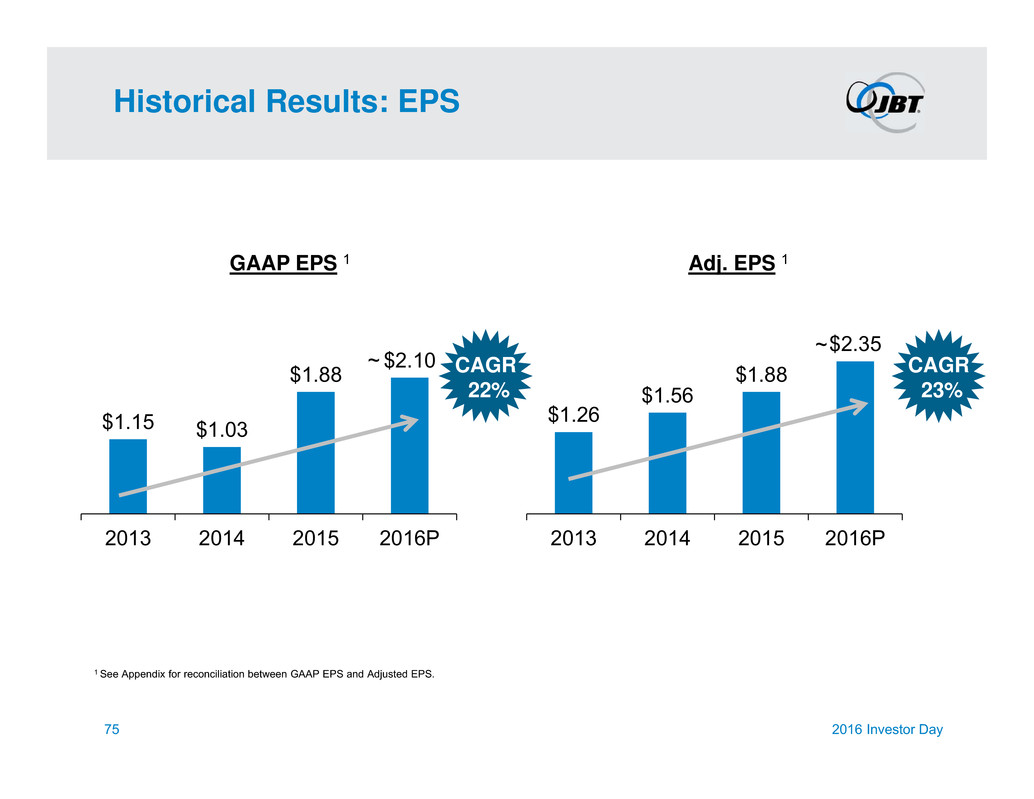
Historical Results: EPS 2016 Investor Day $1.26 $1.56 $1.88 $2.35 2013 2014 2015 2016P GAAP EPS 1 $1.15 $1.03 $1.88 $2.10 2013 2014 2015 2016P Adj. EPS 1 75 CAGR 22% CAGR 23% 1 See Appendix for reconciliation between GAAP EPS and Adjusted EPS. ~ ~

Balance Sheet ($M) 12/31/15 9/30/16 Cash $37 $48 Current Assets 359 425 Non-Current Assets 480 488 Total Assets $876 $961 Current Liabilities, excl. short-term debt $351 $385 Non-Current Liabilities 112 101 Debt 283 306 Equity 130 169 Total Liabilities & Equity $876 $961 Total Capital Deployed (ex Cash) $376 $427 Net Debt / Adj. EBITDA1 2.1x 1.8x Pro Forma Bank Leverage 3.2x Strong B/S Affords Capacity to Execute Elevate Strategy 2016 Investor Day76 1 See Appendix for Net Debt / Adj. EBITDA reconciliation. 2 Pro forma bank leverage including impact of C.A.T. and Tipper Tie acquisitions. 2

Leverage Profile Leverage 27% 62% 38% 38%19% 8% 8% Capital Structure Debt Profile Estimated 2017-2019 65% 35% 2016 Variable Fixed 0.0x 1.0x 2.0x 3.0x $0 $100 $200 $300 $400 2014 2015 2016 Net Debt ($M) 2017 - 2019 2016 Investor Day Other Assets Intangibles Goodwill Property, Plant, Equipment Net WC Equity Debt + LT Liabilities Net Debt Leverage 77 Optimal Leverage Range

Capital Allocation Priorities Cash Flow Deployment Priorities • Investing in high ROI capex − 2016: ~$40M • Strategic acquisitions • Pay a dividend −Maintain current level • Share buyback to offset management share dilution Buy Back Dividend M&A CapEx 2017 - 2019 Growth Return to Shareholders Capital Allocation Designed to Fuel Growth & Returns 2016 Investor Day78

79 Projected Impact by 2019 Revenue ($M) EBIT ($M) Accelerate New Product & Service Dev. $21 – 37 $5 – 8 Grow Recurring Revenue 26 – 41 6 – 8 Build Asia Pacific Business 15 – 25 3 – 5 Grow Military Sales 8 – 12 2 – 3 Impact & JEM Initiatives, & Base Growth 65 – 90 24 – 36 Total Organic Growth $135 - 205 $40 – 60 Total Acquisitions 250 – 300 30 – 40 Total $385 – 505 $70 – $100 2016P Base1 ~$1,300 ~$110 2019 $1,685 – 1,805 $180 – 210 2016 – 19 CAGR 9 – 12% 18 – 24% 2019 Consolidated EBIT Margin 11 – 12% The Elevate 2019 Financial Framework 2016 Investor Day 1 FY 2016 guidance as provided in JBT Q3 2016 earnings release dated October 26, 2016.
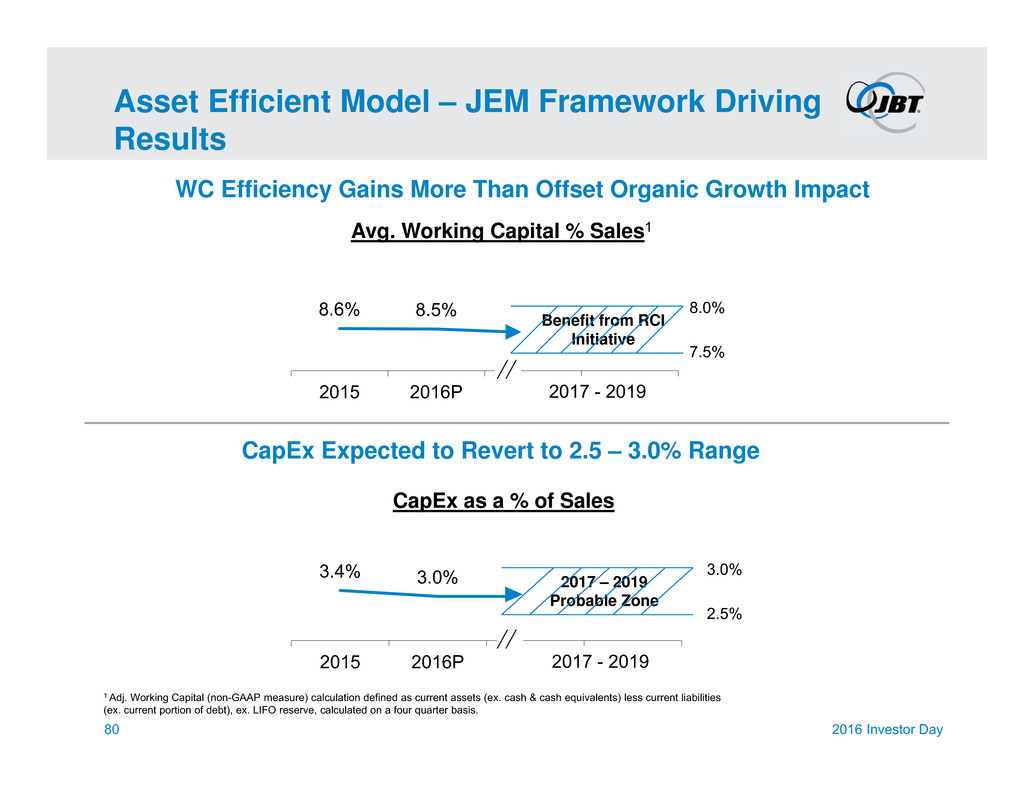
Asset Efficient Model – JEM Framework Driving Results 2016 Investor Day WC Efficiency Gains More Than Offset Organic Growth Impact CapEx Expected to Revert to 2.5 – 3.0% Range 8.6% 8.5% 2015 2016P Avg. Working Capital % Sales1 2017 - 2019 8.0% 7.5% Benefit from RCI Initiative 3.4% 3.0% 2015 2016P CapEx as a % of Sales 2017 - 2019 2017 – 2019 Probable Zone 3.0% 2.5% 80 1 Adj. Working Capital (non-GAAP measure) calculation defined as current assets (ex. cash & cash equivalents) less current liabilities (ex. current portion of debt), ex. LIFO reserve, calculated on a four quarter basis.

2016 2019 FCF 1 Growth & Margin Expansion 1 FCF defined as cash flow from operations less capex & ex-pension impacts. 2 Projected FCF for 2016 at ~$54M. Normalized for run rate considerations, projected FCF of ~$63M. 2016 2019 Revenue $1.3B ~$1.7 – 1.8B 2016 2019 Segment EBIT $150M ~$220 – $250M 2016 2019 Consolidated EBIT 9% 11 - 12%$110M ~$180 – $210M FCF Conversion >100% 12% 13 - 14% 2016 Investor Day CAGR 9% - 12% CAGR 25% - 30% CAGR 18% - 24% CAGR 14% - 19% 81 ~$63M 2 ~$125 – $140M FCF Conversion ~80%
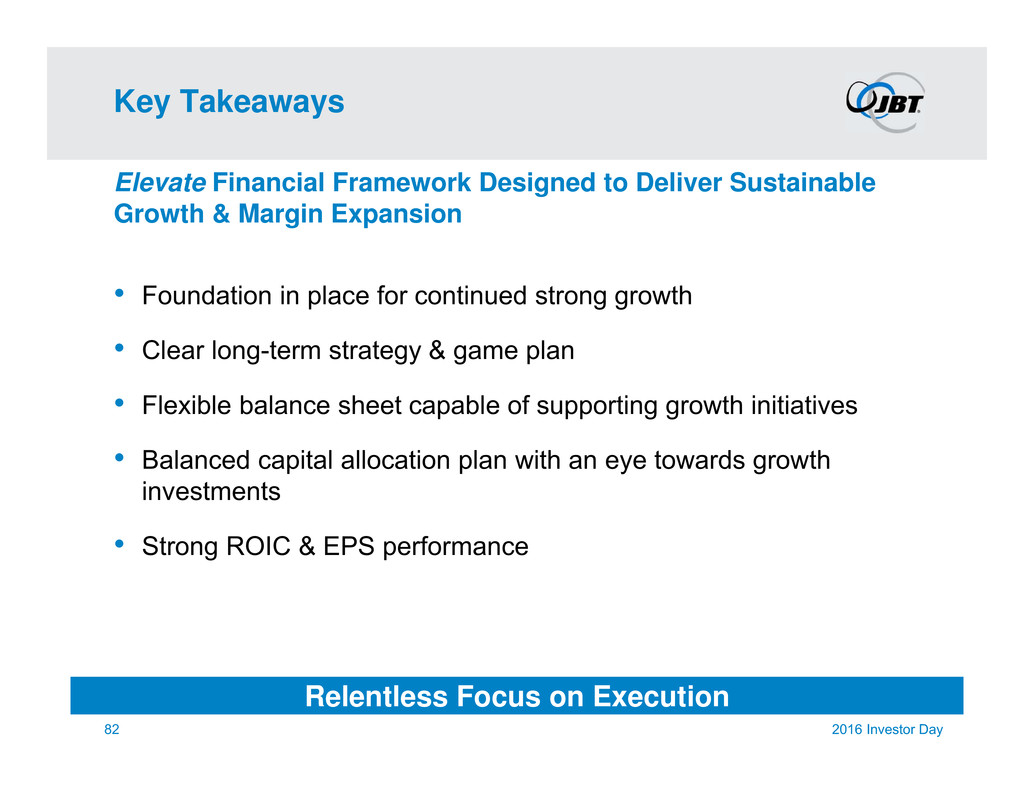
Key Takeaways Elevate Financial Framework Designed to Deliver Sustainable Growth & Margin Expansion • Foundation in place for continued strong growth • Clear long-term strategy & game plan • Flexible balance sheet capable of supporting growth initiatives • Balanced capital allocation plan with an eye towards growth investments • Strong ROIC & EPS performance Relentless Focus on Execution 2016 Investor Day82

The Elevate Plan Tom Giacomini Chairman, President & CEO
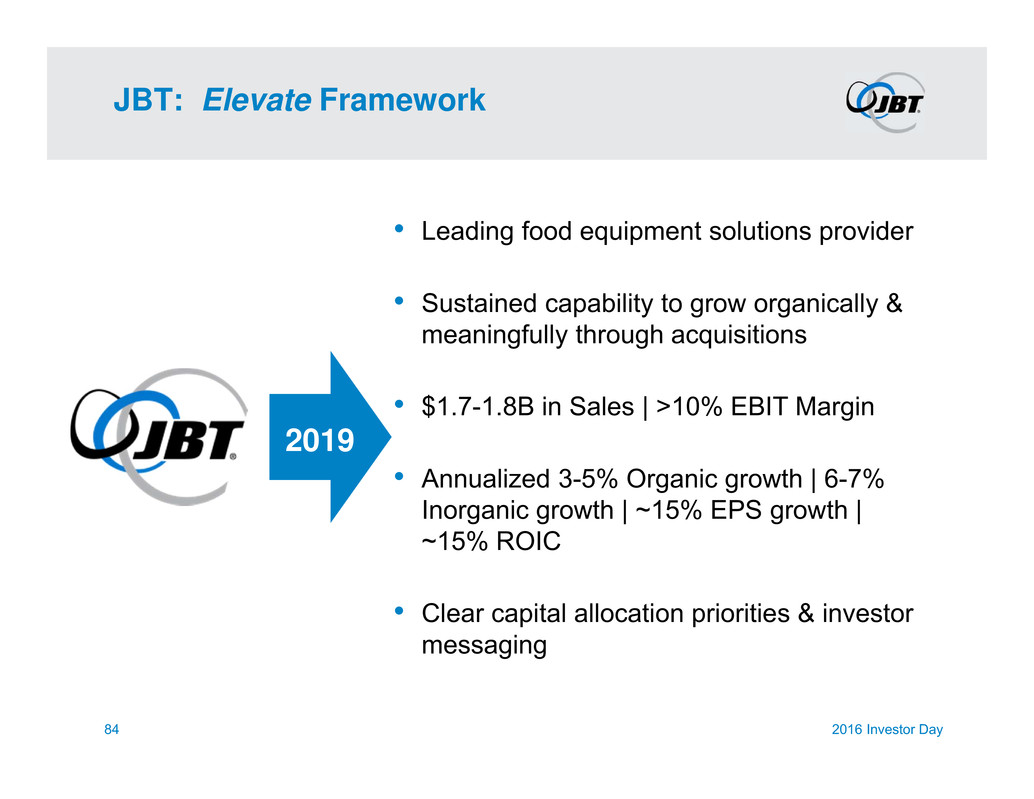
JBT: Elevate Framework 2019 • Leading food equipment solutions provider • Sustained capability to grow organically & meaningfully through acquisitions • $1.7-1.8B in Sales | >10% EBIT Margin • Annualized 3-5% Organic growth | 6-7% Inorganic growth | ~15% EPS growth | ~15% ROIC • Clear capital allocation priorities & investor messaging 2016 Investor Day84
Q&A November 3, 2016
Appendix November 3, 2016
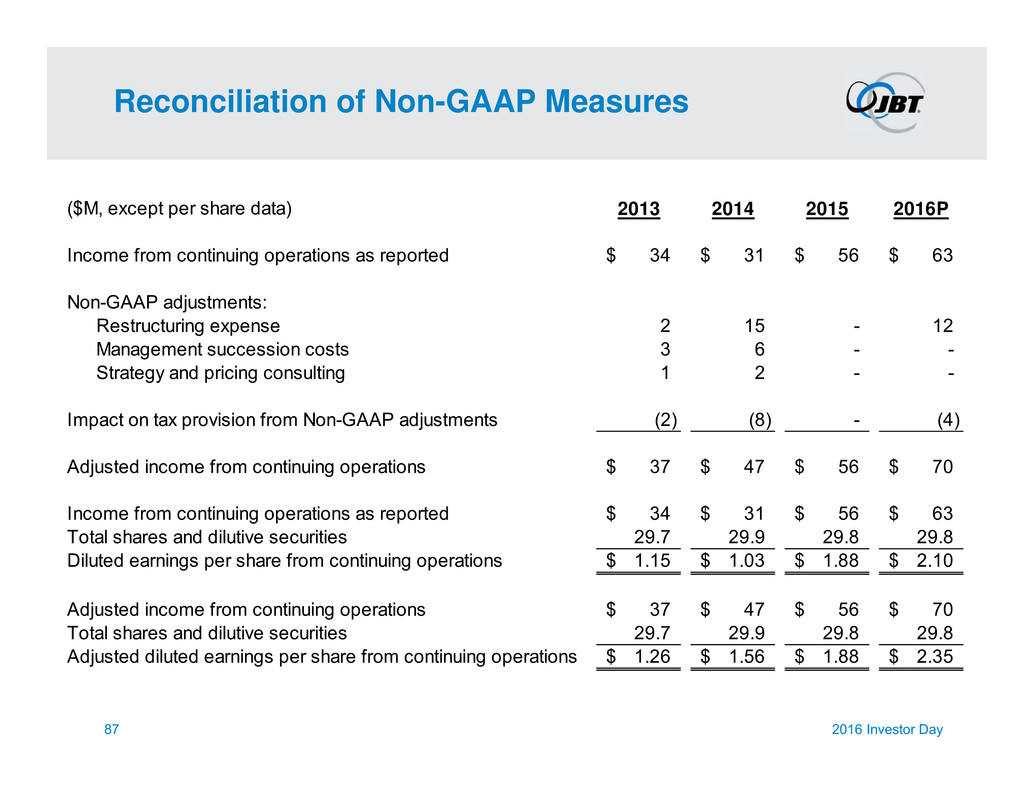
Reconciliation of Non-GAAP Measures 87 2016 Investor Day ($M, except per share data) 2013 2014 2015 2016P Income from continuing operations as reported 34$ 31$ 56$ 63$ Non-GAAP adjustments: Restructuring expense 2 15 - 12 Management succession costs 3 6 - - Strategy and pricing consulting 1 2 - - Impact on tax provision from Non-GAAP adjustments (2) (8) - (4) Adjusted income from continuing operations 37$ 47$ 56$ 70$ Income from continuing operations as reported 34$ 31$ 56$ 63$ Total shares and dilutive securities 29.7 29.9 29.8 29.8 Diluted earnings per share from continuing operations 1.15$ 1.03$ 1.88$ 2.10$ Adjusted income from continuing operations 37$ 47$ 56$ 70$ Total shares and dilutive securities 29.7 29.9 29.8 29.8 Adjusted diluted earnings per share from continuing operations 1.26$ 1.56$ 1.88$ 2.35$
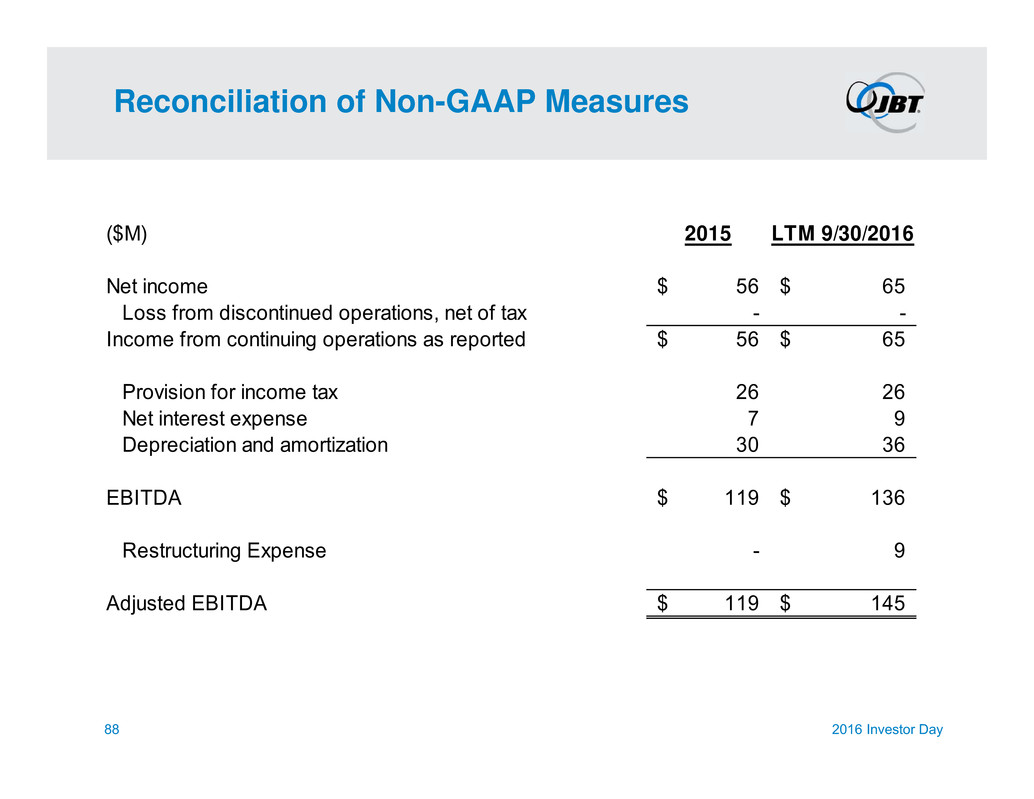
Reconciliation of Non-GAAP Measures 88 2016 Investor Day ($M) 2015 LTM 9/30/2016 Net income 56$ 65$ Loss from discontinued operations, net of tax - - Income from continuing operations as reported 56$ 65$ Provision for income tax 26 26 Net interest expense 7 9 Depreciation and amortization 30 36 EBITDA 119$ 136$ Restructuring Expense - 9 Adjusted EBITDA 119$ 145$
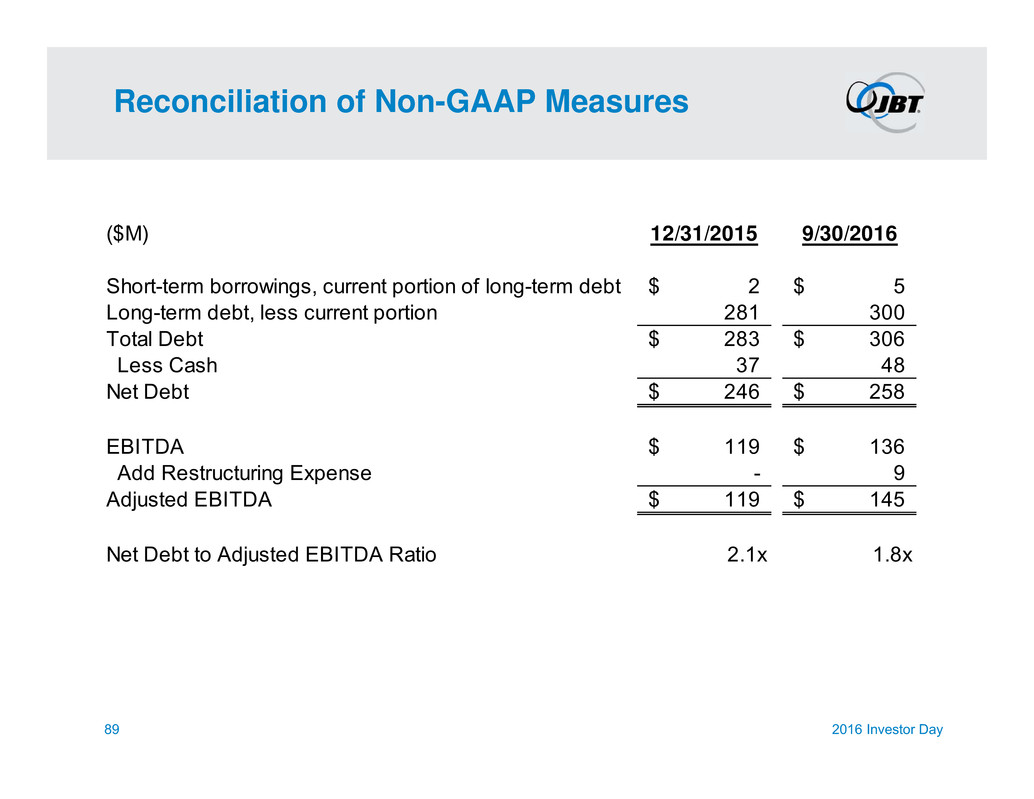
Reconciliation of Non-GAAP Measures 89 2016 Investor Day ($M) 12/31/2015 9/30/2016 Short-term borrowings, current portion of long-term debt 2$ 5$ Long-term debt, less current portion 281 300 Total Debt 283$ 306$ Less Cash 37 48 Net Debt 246$ 258$ EBITDA 119$ 136$ Add Restructuring Expense - 9 Adjusted EBITDA 119$ 145$ Net Debt to Adjusted EBITDA Ratio 2.1x 1.8x

Reconciliation of Non-GAAP Measures 90 2016 Investor Day ($M) 2015 Four Quarter 2015 average Current Assets 377$ Less: Four Quarter 2015 Cash and Cash Equivalents 29 Less: Four Quarter 2015 average Current Liabilities 300 Plus: Four Quarter 2015 average Short-Term Debt - Plus: Four Quarter 2015 average LIFO 47 Total Four Quarter 2015 average working capital 95$ 2015 Revenue 1,107$ Avg. Working Capital % Sales 8.6%
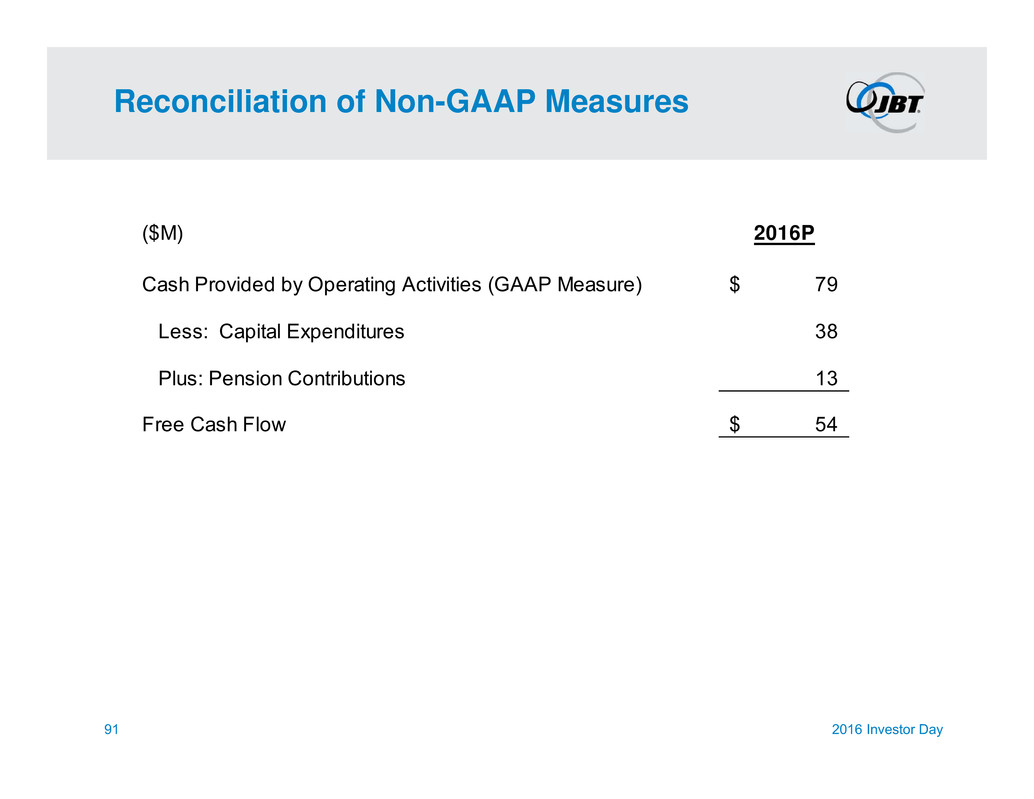
Reconciliation of Non-GAAP Measures 91 2016 Investor Day ($M) 2016P Cash Provided by Operating Activities (GAAP Measure) 79$ Less: Capital Expenditures 38 Plus: Pension Contributions 13 Free Cash Flow 54$

JBT Investor Day November 3, 2016