Exhibit 99.1
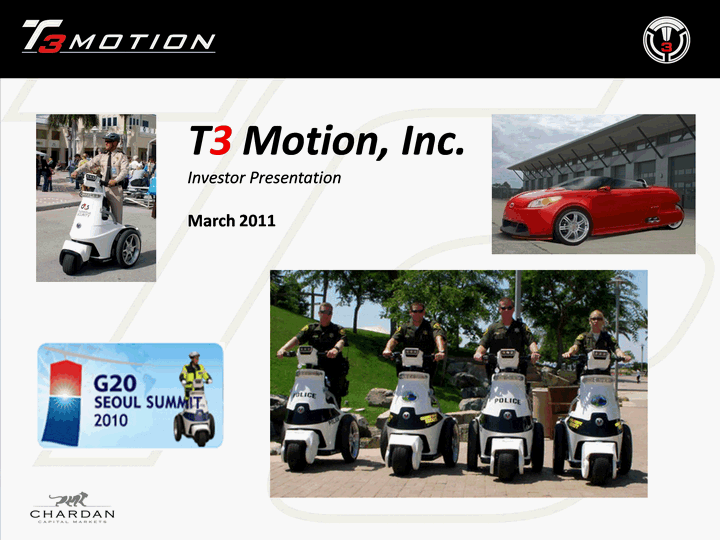
T3 Motion, Inc.Investor PresentationMarch 2011 |
Safe Harbor Statement Some of the statements that we make in this presentation may constitute forward- looking statements. These statements reflect management's expectations about our business, operating plans and performance and speak only as of the date hereof. These forward-looking statements involve a number of risks and uncertainties that could cause actual results to differ materially from those anticipated by these forward-looking statements. For a full discussion of the risks and uncertainties that could cause actual results to differ materially from those expressed or implied by any of these forward- looking statements please review the "Risk Factors" section in the prospectus, as filed with the Securities and Exchange Commission. We undertake no obligation to update publicly or revise these forward-looking statements for any reason even if experience or future changes make it clear that any projected results expressed or implied therein will not be realized. 2 |
Transaction Summary 3 |
http://www.youtube.com/watch?v=XOs0s23nfh0 (T3- Media Compilation)http://www.youtube.com/watch?v=UvlXR_4QDnE&feature=r elated (T3- Coconut Creek)http://www.youtube.com/watch?v=p5OVsvj2HrQ (T3- Super Bowl Commercial)http://www.youtube.com/watch?v=YXLtWAGczpc&feature=re lated (T3- NYPD) Media Links |
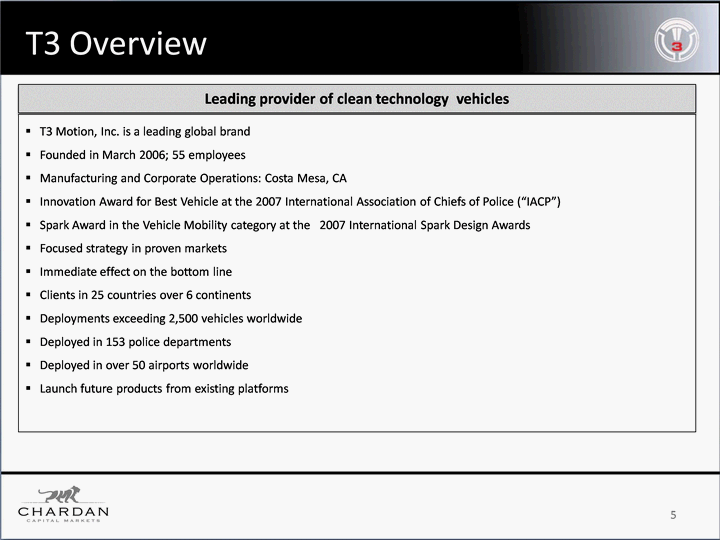
5 T3 Overview Leading provider of clean technology vehicles T3 Motion, Inc. is a leading global brandFounded in March 2006; 55 employeesManufacturing and Corporate Operations: Costa Mesa, CAInnovation Award for Best Vehicle at the 2007 International Association of Chiefs of Police ("IACP") Spark Award in the Vehicle Mobility category at the 2007 International Spark Design AwardsFocused strategy in proven marketsImmediate effect on the bottom lineClients in 25 countries over 6 continentsDeployments exceeding 2,500 vehicles worldwideDeployed in 153 police department sDeployed in over 50 airports worldwideLaunch future products from existing platforms |
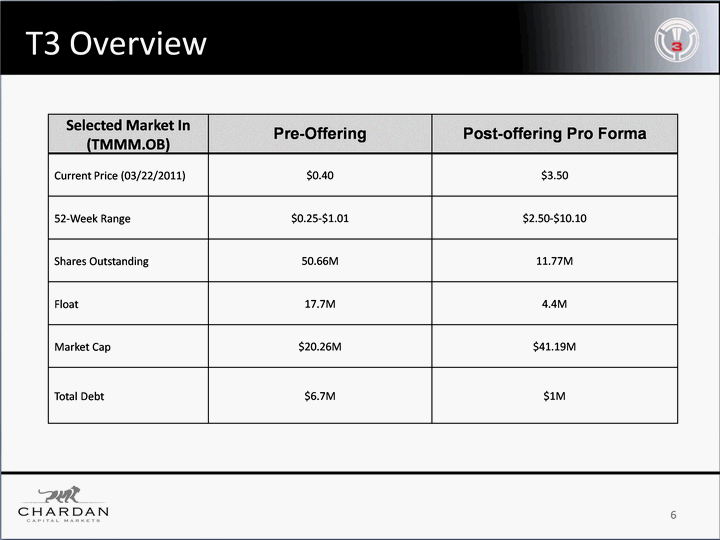
6 T3 Overview Selected Market In (TMMM.OB) Pre-Offering Post-offering Pro Forma Current Price (03/22/2011) $0.40 $3.50 52-Week Range $0.25-$1.01 $2.50-$10.10 Shares Outstanding 50.66M 11.77M Float 17.7M 4.4M Market Cap $20.26M $41.19M Total Debt $6.7M $1M |
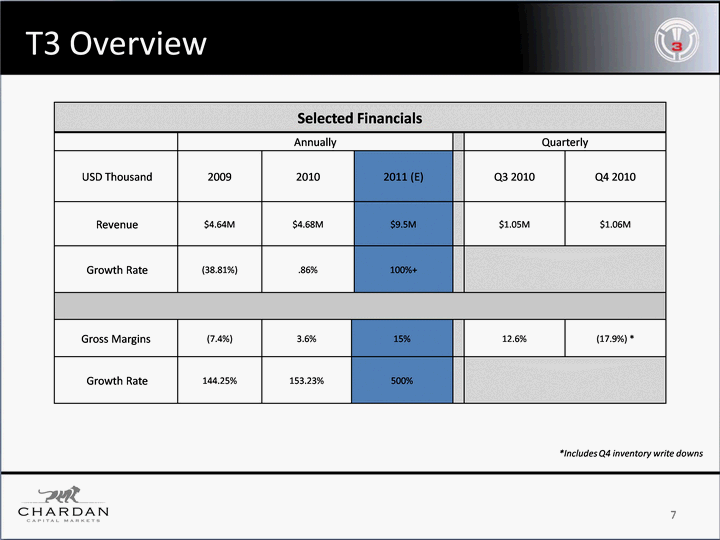
7 T3 Overview Selected Financials Selected Financials Selected Financials Selected Financials Selected Financials Selected Financials Selected Financials Selected Financials Annually Annually Annually Annually Quarterly Quarterly USD Thousand 2009 2010 2010 2011 (E) Q3 2010 Q4 2010 Revenue $4.64M $4.68M $4.68M $9.5M $1.05M $1.06M Growth Rate (38.81%) .86% .86% 100%+ Gross Margins (7.4%) 3.6% 15% 15% 12.6% (17.9%) * Growth Rate 144.25% 153.23% 500% 500% *Includes Q4 inventory write downs |
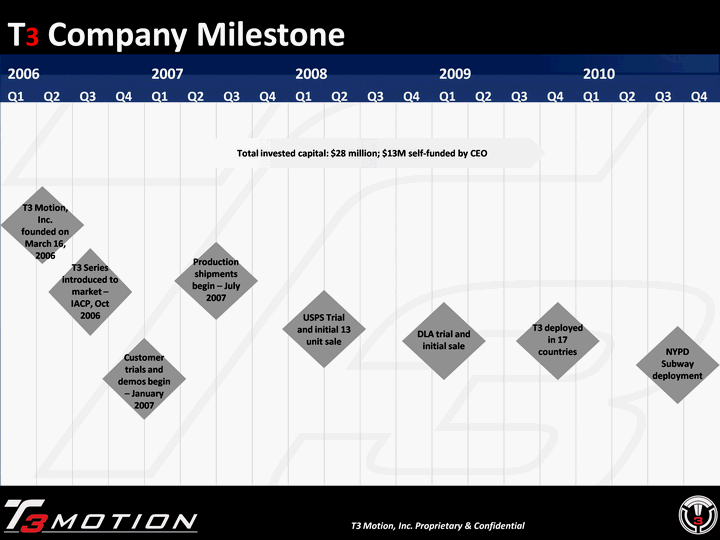
T3 Company Milestone T3 Motion, Inc. Proprietary & Confidential Q2 Q3 Q4 Q1 Q2 Q3 Q4 2007 Q1 Q2 Q3 Q4 2008 Q1 Q2 Q3 Q4 2009 Q1 Q2 Q3 Q4 2010 T3 Motion, Inc. founded on March 16, 2006 T3 Series introduced to market - IACP, Oct 2006 Customer trials and demos begin - January 2007 Production shipments begin - July 2007 2006 Q1 Total invested capital: $28 million; $13M self-funded by CEO USPS Trial and initial 13 unit sale DLA trial and initial sale NYPD Subway deployment T3 deployed in 17 countries |
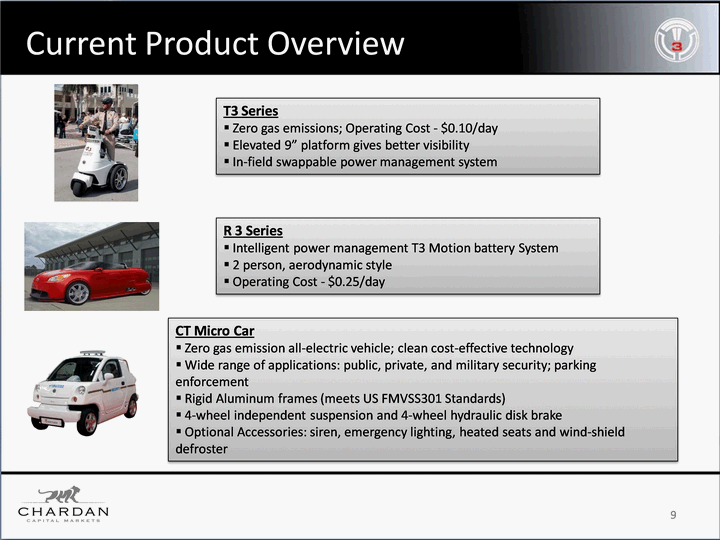
9 T3 Series Zero gas emissions; Operating Cost - $0.10/day Elevated 9" platform gives better visibility In-field swappable power management system R 3 Series Intelligent power management T3 Motion battery System 2 person, aerodynamic style Operating Cost - $0.25/day CT Micro Car Zero gas emission all-electric vehicle; clean cost-effective technology Wide range of applications: public, private, and military security; parking enforcement Rigid Aluminum frames (meets US FMVSS301 Standards) 4-wheel independent suspension and 4-wheel hydraulic disk brake Optional Accessories: siren, emergency lighting, heated seats and wind-shield defroster Current Product Overview |
T3 Series 10 |
Why T3 Series? Since October '06, we have deployed over 2,500 T3 Series ESVs worldwide Cost effective- Significant ROI (6 months)Efficiency- Reduces man hours in covering large areasResponse Time- First responders able to respond rapidly to dynamic situations in large geographical areasMarket paradigm shift to security markets 11 |
Operations CapacityCorporate and Manufacturing Facility ~ 50,000 sq ft in Costa Mesa, CAExpandable by an additional ~ 30,000 sq ftProduction - up to 750 T3 vehicles per month 12 Raw Materials and Supply Chain70% suppliers are local; as sales increase, T3 will expand into other global alternativesSupply chain could include material sourcing and sub-assembly operations from China, South Korea and MexicoFinal assembly, testing and inspection in Costa Mesa, CACT Micro Car developed and manufactured by CT&T, a Korean electric car manufacturer |
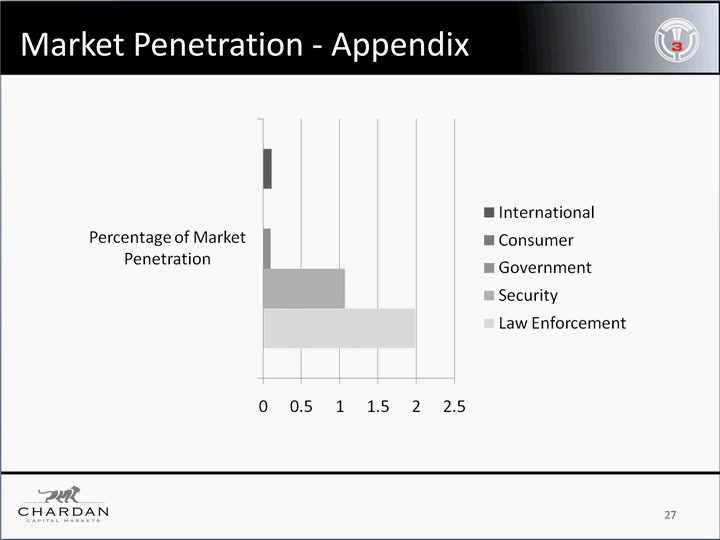
Market and Industry Overview 13 Industry Overview: Billion dollar market potential for Personal Transport Vehicles T3 Motion provides rapid response in a cost effective manner Increased awareness in global warming and a post 9/11 world creates a unique opportunity for clean security technologies US: post 9/11 increase in homeland security spending Department of Homeland Security (DHS) granted $1.7b to municipalities for equipment acquisition and emergency preparedness Market Overview Total Agencies Agencies with T3s Penetration Miscellaneous Average units/agency (assumption) Estimated Market potential* Law Enforcement (include campus police) 5,956 153 2.57% 1,017,984 Personnel 2 $107,208,000 Airports 5,202 public use airports (U.S.) 50+ 0.96% 5 $234,090,000 Malls 48,000 303 0.63% 3 $1,296,000,000 Manufacturing and Industrial Firms 293,919 6b Sq. Ft. Space 2 $5,290,542,000 Private Security Companies 13,000 22 0.17% 13.3m Employees 1 $117,000,000 Government Bases 5,311 3 0.06% $13b Industry 2 $95,598,000 Government Buildings 10,000 7 0.07% 1.2m Security Personnel 2 $180,000,000 Total $7,320,438,000 |
Selected T3 Series Customers 14 |
Market Competition 15 |
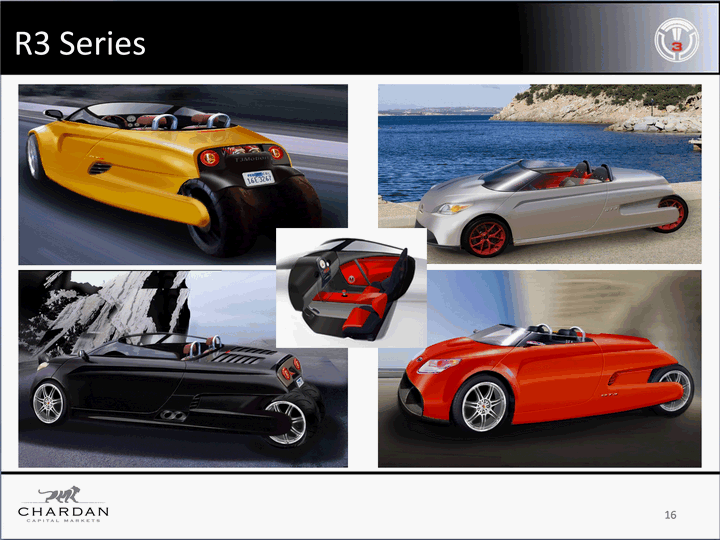
16 R3 Series |
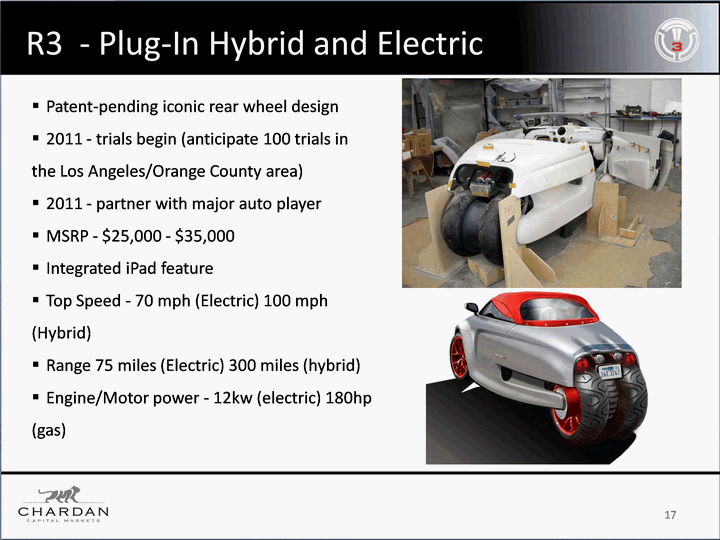
R3 - Plug-In Hybrid and Electric Patent-pending iconic rear wheel design2011 - trials begin (anticipate 100 trials in the Los Angeles/Orange County area)2011 - partner with major auto playerMSRP - $25,000 - $35,000Integrated iPad featureTop Speed - 70 mph (Electric) 100 mph (Hybrid)Range 75 miles (Electric) 300 miles (hybrid)Engine/Motor power - 12kw (electric) 180hp (gas) 17 |
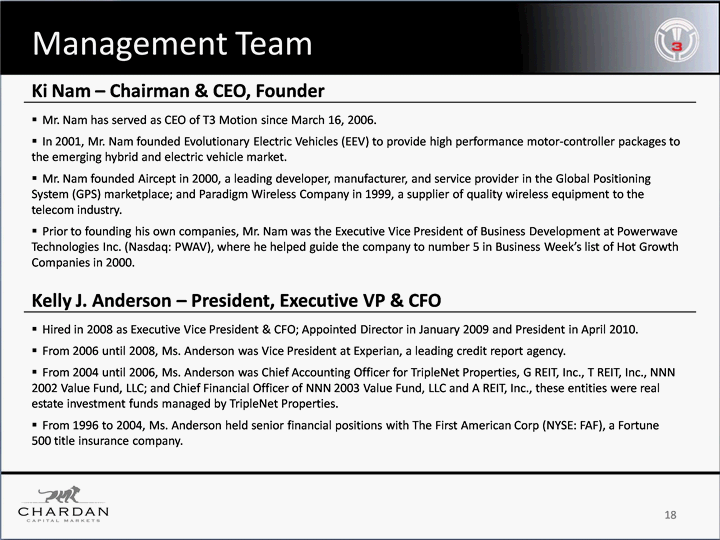
Ki Nam - Chairman & CEO, Founder Mr. Nam has served as CEO of T3 Motion since March 16, 2006. In 2001, Mr. Nam founded Evolutionary Electric Vehicles (EEV) to provide high performance motor-controller packages to the emerging hybrid and electric vehicle market.Mr. Nam founded Aircept in 2000, a leading developer, manufacturer, and service provider in the Global Positioning System (GPS) marketplace; and Paradigm Wireless Company in 1999, a supplier of quality wireless equipment to the telecom industry. Prior to founding his own companies, Mr. Nam was the Executive Vice President of Business Development at Powerwave Technologies Inc. (Nasdaq: PWAV), where he helped guide the company to number 5 in Business Week's list of Hot Growth Companies in 2000. 18 Management Team Kelly J. Anderson - President, Executive VP & CFO Hired in 2008 as Executive Vice President & CFO; Appointed Director in January 2009 and President in April 2010. From 2006 until 2008, Ms. Anderson was Vice President at Experian, a leading credit report agency. From 2004 until 2006, Ms. Anderson was Chief Accounting Officer for TripleNet Properties, G REIT, Inc., T REIT, Inc., NNN 2002 Value Fund, LLC; and Chief Financial Officer of NNN 2003 Value Fund, LLC and A REIT, Inc., these entities were real estate investment funds managed by TripleNet Properties. From 1996 to 2004, Ms. Anderson held senior financial positions with The First American Corp (NYSE: FAF), a Fortune 500 title insurance company. |
19 Current Capitalization Table Pre-Deal Pre-Deal Pre-Deal Pre-Deal Pre-Deal Pre-Deal Pre-Deal Pre-Deal Pre-Deal Shareholders Common Stock Ownership % Preferred Stock Stock Options Warrants Stock option grants Q1-11 Fully Diluted Total Fully Diluted Ownership % Executive Ki Nam (beneficially owned) 28,955,230 57.16% 976,865 1,200,000 2,228,504 1,300,000 35,637,464 37.89% Other Executive - 0.00% - 1,000,000 - 1,000,000 2,000,000 2.13% Employees - 0.00% - 4,240,895 - 1,000,000 5,240,895 5.57% Non-Executive Other Investors 13,855,274 27.35% 1,155,000 - 6,310,000 - 22,475,274 23.90% Vision Capital 5,996,104 11.84% 9,370,698 - - - 24,737,500 26.30% Immersive Media 1,851,852 3.66% - - 1,987,639 - 3,839,491 4.08% Other Warrant Holders - 0.00% - - 120,000 - 120,000 0.13% Total 50,658,460 100.00% 11,502,563 6,440,895 10,646,143 3,300,000 94,050,624 100.00% |
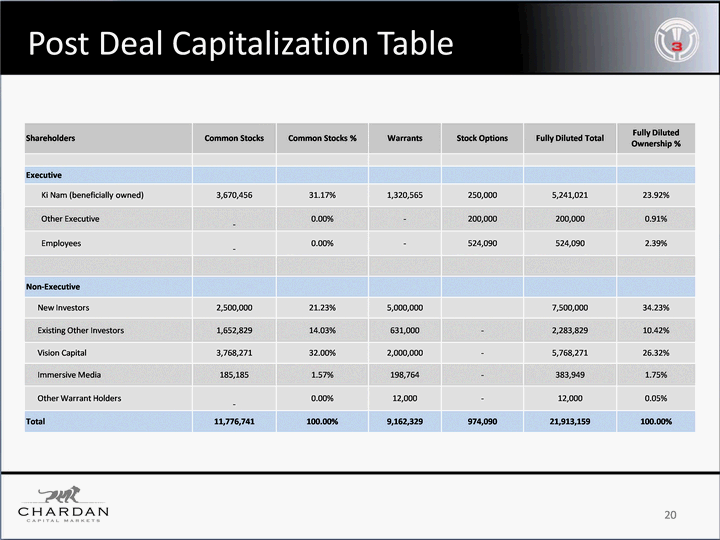
20 Post Deal Capitalization Table Shareholders Common Stocks Common Stocks % Warrants Stock Options Fully Diluted Total Fully Diluted Ownership % Executive Ki Nam (beneficially owned) 3,670,456 31.17% 1,320,565 250,000 5,241,021 23.92% Other Executive - 0.00% - 200,000 200,000 0.91% Employees - 0.00% - 524,090 524,090 2.39% Non-Executive New Investors 2,500,000 21.23% 5,000,000 7,500,000 34.23% Existing Other Investors 1,652,829 14.03% 631,000 - 2,283,829 10.42% Vision Capital 3,768,271 32.00% 2,000,000 - 5,768,271 26.32% Immersive Media 185,185 1.57% 198,764 - 383,949 1.75% Other Warrant Holders - 0.00% 12,000 - 12,000 0.05% Total 11,776,741 100.00% 9,162,329 974,090 21,913,159 100.00% |
Balance Sheet Highlights 21 December 31, 2010 December 31, 2010 ASSETS Pro Forma - Post Deal Cash $ 123,861 $ 7,001,643 Restricted Cash 10,000 10,000- Accounts Receivable 595,261 595,261 Related Party Receivables 35,722 35,722 Inventory 1,064,546 1,064,546 Prepaid Expenses and Other Current Assets 251,467 251,467 Total Current Assets 2,080,857 8,958,639 PPE 564,700 564,700 Deposits 934,359 934,359 Total Assets $ 3,579,916 $ 10,457,698 LIABILITIES Accounts Payable and Accrued Expenses $ 2,870,954 $ 2,384,239 Notes Payable, net of debt discount 4,634,589 - Derivatives Liability 9,633,105 778,239 Total Current Liabilities 17,138,648 3,164,478 Notes Payable - Long Term 2,121,000 1,000,000 Total Liabilities $ 19,259,648 $ 4,164,478 STOCKHOLDERS' (DEFICIT) EQUITY Common Stock (pro forma reflects reverse stock split) 50,659 11,919 Preferred Stock 11,503 - Additional Paid In Capital 29,373,947 55,890,886 Accumulated Deficit (45,120,210) (49,613,953) Comprehensive Income 4,369 4,369 Total stockholders' (deficit) equity (15,679,732) 6,293,221 Total liabilities and stockholders' (deficit) equity $ 3,579,916 $ 10,457,698 |
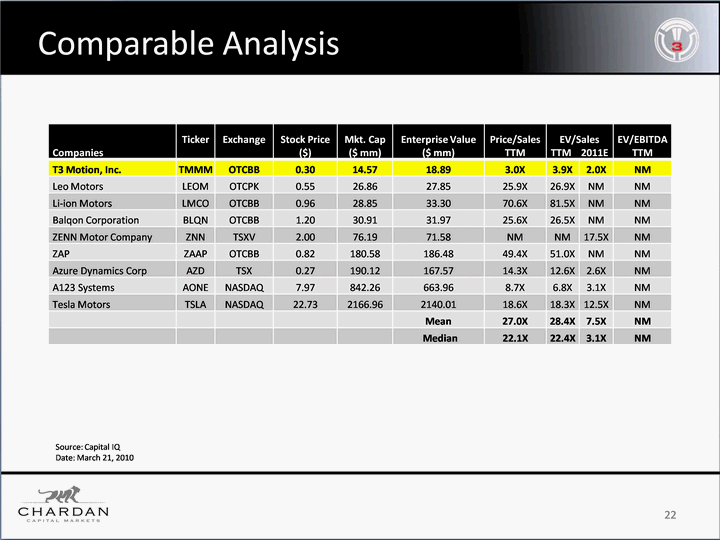
22 Companies Ticker Exchange Stock Price ($) Mkt. Cap ($ mm) Enterprise Value ($ mm) Price/Sales TTM EV/Sales TTM 2011E EV/Sales TTM 2011E EV/EBITDA TTM T3 Motion, Inc. TMMM OTCBB 0.30 14.57 18.89 3.0X 3.9X 2.0X NM Leo Motors LEOM OTCPK 0.55 26.86 27.85 25.9X 26.9X NM NM Li-ion Motors LMCO OTCBB 0.96 28.85 33.30 70.6X 81.5X NM NM Balqon Corporation BLQN OTCBB 1.20 30.91 31.97 25.6X 26.5X NM NM ZENN Motor Company ZNN TSXV 2.00 76.19 71.58 NM NM 17.5X NM ZAP ZAAP OTCBB 0.82 180.58 186.48 49.4X 51.0X NM NM Azure Dynamics Corp AZD TSX 0.27 190.12 167.57 14.3X 12.6X 2.6X NM A123 Systems AONE NASDAQ 7.97 842.26 663.96 8.7X 6.8X 3.1X NM Tesla Motors TSLA NASDAQ 22.73 2166.96 2140.01 18.6X 18.3X 12.5X NM Mean 27.0X 28.4X 7.5X NM Median 22.1X 22.4X 3.1X NM Comparable Analysis Source: Capital IQ Date: March 21, 2010 |
Short-TermSign on strategic partners to help quickly penetrate the consumer marketInternational market penetration - Europe, Asia and South AmericaMilitary market penetrationEBITDA positiveBegin trials of R3 consumer productLaunch consumer rental productPenetrate sales of T3 into existing law enforcement and security markets Long-TermCapitalize in broader private security opportunitiesIncrease branding in Law EnforcementExpand T3 series product line for broader commercial market - delivery service, property management, utility and maintenance providersLeverage brand name to enter consumer market Launch R3 to the consumer market 23 Growth Strategy |
24 Investment Highlights Deal TermsA unit consists of 1 common share and 2 warrantsBoth classes of warrants are publicly traded Post deal the Company will be fully funded for current operationsOver $25mil invested in private rounds ($13 MM from CEO)Support of early investors in current deal Company HighlightsRecord Backlog of ~$2.2 mil70% of revenue from repeat customersDeveloped production facilityOver 2,500 vehicles in the field Total worldwide market for T3 is around 200,000 vehiclesPatented power management system technologyDom inates the market with very little to no competitionProviding products to niche markets with real demand Contracts with customers such as NYPD, LAPD, Pentagon, FBI, Disney, Google, Target, DOD, Simon, Securitas, etc. |
25 Investment Highlights Capitalize on Green Does not rely on government funding for sustainabilityOne of the few green companies with positive gross marginsGreen that is economically viableMarketBrand presence in the US: Recognition in the security and industrial EV marketInternational Presence: Distribute to 25 countries in 6 continents. Products will be found in Dubai, Johannesburg, Hong Kong, Seoul, Paris, London, Santiago, Bogota Increasing market penetration: The goal is to be the dominant brand in the security and industrial EV markets. Competition such as Cushman, Westwood and Segway is losing market shareStrong management team with proven track recordMr. Ki Nam founded and self-funded two companies and managed Powerwave Technologies Inc. (Nasdaq: PWAV) (was second largest holder of PWAV when he left)Ki Nam is fully (and personally) tied to this company's success |
Appendix |
Market Penetration - Appendix 27 |
Media 28 |
Locations around the U.S. 29 |
Locations around the World - Appendix 30 |
Operating Costs = 10 Cents Per Day* - Price per mile is less than 1 cent on average* Equivalent of over 500 miles per gallon* Save over $25,000 per year over gas-powered vehicles* Clean Energy = "Green" Results *Based on 1 kilowatt usage per day at an average cost of 10 cents per kilowatt/200 pound average rider/Li-Poly batteries/U.S. average cost of $4.00 per gallon/Daily operation range of 15-20 miles 31 |
Noel Cherowbrier - Vice President International Sales David Fusco was named Vice President of Domestic Sales in October 2010. Over the past 25 years David has held senior executive sales management positions at Texas Instruments, Compaq Computer, and Hewlett-Packard. In 2006 David founded Andal Holdings, LLC, and provided sales and management consulting services to a variety of companies. David holds a Bachelor of Science degree from Miami University in Oxford, OH. 32 David Fusco - Vice President Domestic Sales Noel Cherowbrier has been Vice President of International Sales since 2007.Mr. Cherowbrier was the President from 2004 to 2007 of Tecan UK and US, technology company located in the UK, and Executive VP from 1995 to 2004.Noel holds 20 years of global sales management experience: from 1989-1995 he was the Global Sales Manager at Homark; and from 1986-1995 he was the Sales and Marketing Regional Manager at Fast Moving Consumer Goods. Management Team |
33 CT Micro Car - Appendix |
Consumer Market - Appendix 34 |
35 Contact T3 Motion, Inc. (TMMM.OB)Corporate Headquarters2290 Air Avenue Suite ACosta Mesa, CA 92626P (714) 619-3600F (949) 269-0155Investor Relations investor@t3motion.com Los Angeles8900 Wilshire Blvd.Third FloorBeverly Hills, CA 90211(646).465.9040 BeijingNo.2260, A ZoneChaowai SOHONo. 6B Chaowai StreetChaoyang DistrictBeijing 100021, China(+86).10.5900.2666 Kelly J. AndersonPresident, CFO2290 Airway AvenueBuilding ACosta Mesa, CA 92626(714) 619-3600kanderson@t3motion.com Ki NamChief Executive Officer 2990 Airway Avenue, Building A Costa Mesa, CA 92626 (714) 619-3600knam@t3motion.com Chardan Capital Markets, LLC New York17 State StreetSuite 1600New York, NY 10004(646).465.9000 SydneyLevel 13, 167 Macquarie StreetSydney NSW2000Australia(+612).8667.3198 |