Exhibit 99.2
ANNUAL REPORT SANDSTORM GOLD ROYALTIES
SECTION 1 Company Profile 2021 Q4 A BRIGHTER WAY TO INVEST IN GOLDTM Corporate & Shareholder Information Stock Exchange Listings Toronto Stock Exchange TSX: SSL New York Stock Exchange NYSE: SAND Transfer Agent Computershare Investor Services 2nd Floor, 510 Burrard Street Vancouver, British Columbia V6C 3B9 T 604 661 9400 Corporate Secretary Christine Gregory Auditors PricewaterhouseCoopers LLP PricewaterhouseCoopers Place Suite 1400, 250 Howe Street Vancouver, British Columbia V6C 3S7 T 604 806 7000 F 604 806 7806 Board of Directors Andrew T. Swarthout David Awram David E. De Witt John P. A. Budreski Mary L. Little Nolan Watson Vera Kobalia Corporate Offices Vancouver Head Office Suite 1400, 400 Burrard Street Vancouver, British Columbia V6C 3A6 T 604 689 0234 F 604 689 7317 info@sandstormgold.com www.sandstormgold.com Toronto Office Suite 503, 36 Lombard Street Toronto, Ontario M5C 2X3 02
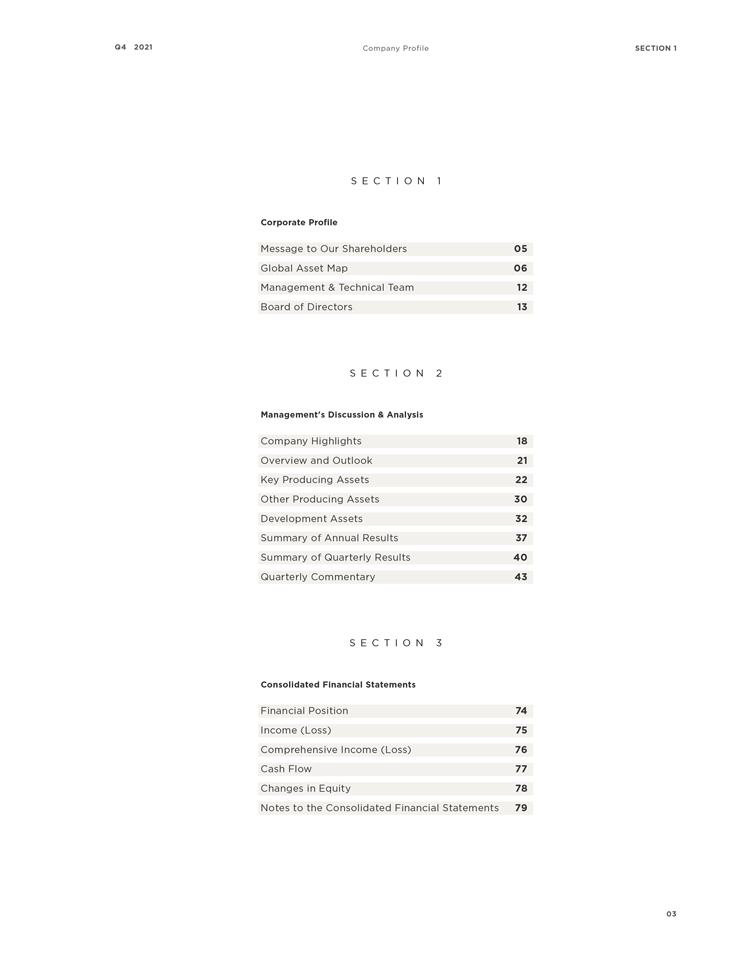
Q4 2021 Company Profile SECTION 1 SECTION 1 Corporate Profile Message to Our Shareholders 05 Global Asset Map 06 Management & Technical Team 12 Board of Directors 13 SECTION 2 Management’s Discussion & Analysis Company Highlights 18 Overview and Outlook 21 Key Producing Assets 22 Other Producing Assets 30 Development Assets 32 Summary of Annual Results 37 Summary of Quarterly Results 40 Quarterly Commentary 43 SECTION 3 Consolidated Financial Statements Financial Position 74 Income (Loss) 75 Comprehensive Income (Loss) 76 Cash Flow 77 Changes in Equity 78 Notes to the Consolidated Financial Statements 79 03

SECTION 1 Company Profile 2021 Q4 3 2 1 “ I BELIEVE GOLD IS WELL - POSITIONED TO FULFILL ITS ROLE AS A RELIABLE STORE OF VALUE OVER THE COMING DECADE .” 04

Q4 2021 Company Profile SECTION 1 A MESSAGE FROM PRESIDENT & CEO NOLAN WATSON At the outset of 2021, I spoke about what I considered to be three major catalysts for Sandstorm’s growth: 1) new cash-flowing deals, 2) share buybacks and potential dividends, and 3) the
de-risking
of Hod Maden. I am pleased to say that we achieved all three goals during the year. Despite these accomplishments, the gold market has struggled to realize meaningful gains over the past 18 months following an impressiverun-up
in early 2020. I continue to be a firm believer that the fundamentals for gold are favourable— perhaps the most favourable I’ve seen over the course of my 20+ year career. Hyperinflation, stratospheric levels of global debt, and continued uncertainty amongst world governments have investors actively pursuing new venues to store their wealth. With ballooning cryptocurrency markets, real estate valuations, and other real assets, I believe gold is well-positioned to fulfill its role as a reliable store of value over the coming decade. The question is—how can we best take advantage of a rising gold market? 05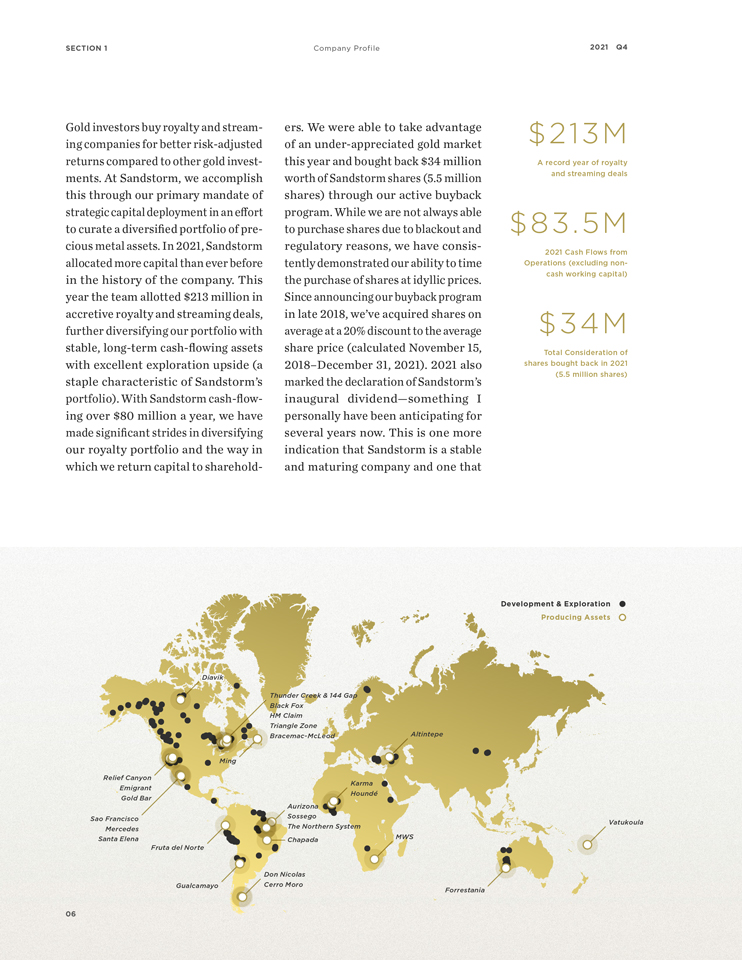
SECTION 1 Company Profile 2021 Q4 Gold investors buy royalty and streaming companies for better risk-adjusted returns compared to other gold investments. At Sandstorm, we accomplish this through our primary mandate of strategic capital deployment in an effort to curate a diversified portfolio of precious metal assets. In 2021, Sandstorm allocated more capital than ever before in the history of the company. This year the team allotted $213 million in accretive royalty and streaming deals, further diversifying our portfolio with stable, long-term cash-flowing assets with excellent exploration upside (a staple characteristic of Sandstorm’s portfolio). With Sandstorm cash-flowing over $80 million a year, we have made significant strides in diversifying our royalty portfolio and the way in which we return capital to shareholders. We were able to take advantage of an under-appreciated gold market this year and bought back $34 million worth of Sandstorm shares (5.5 million shares) through our active buyback program. While we are not always able to purchase shares due to blackout and regulatory reasons, we have consistently demonstrated our ability to time the purchase of shares at idyllic prices. Since announcing our buyback program in late 2018, we’ve acquired shares on average at a 20% discount to the average share price (calculated November 15, 2018–December 31, 2021). 2021 also marked the declaration of Sandstorm’s inaugural dividend—something I personally have been anticipating for several years now. This is one more indication that Sandstorm is a stable and maturing company and one that $213M A record year of royalty and streaming deals $83.5M 2021 Cash Flows from Operations (excluding
non-cash
working capital) $34M Total Consideration of shares bought back in 2021 (5.5 million shares) Development & Exploration Producing Assets Diavik Relief Canyon Emigrant Gold Bar Sao Francisco Mercedes Santa Elena Fruta del Norte Gualcamayo Ming Thunder Creek & 144 Gap Black Fox HM Claim Triangle Zone BracemacMcLeod Aurizona Sossego The Northern System Chapada Don Nicolas Cerro Moro Karma Houndé Altintepe MWS Forrestania Vatukoula 06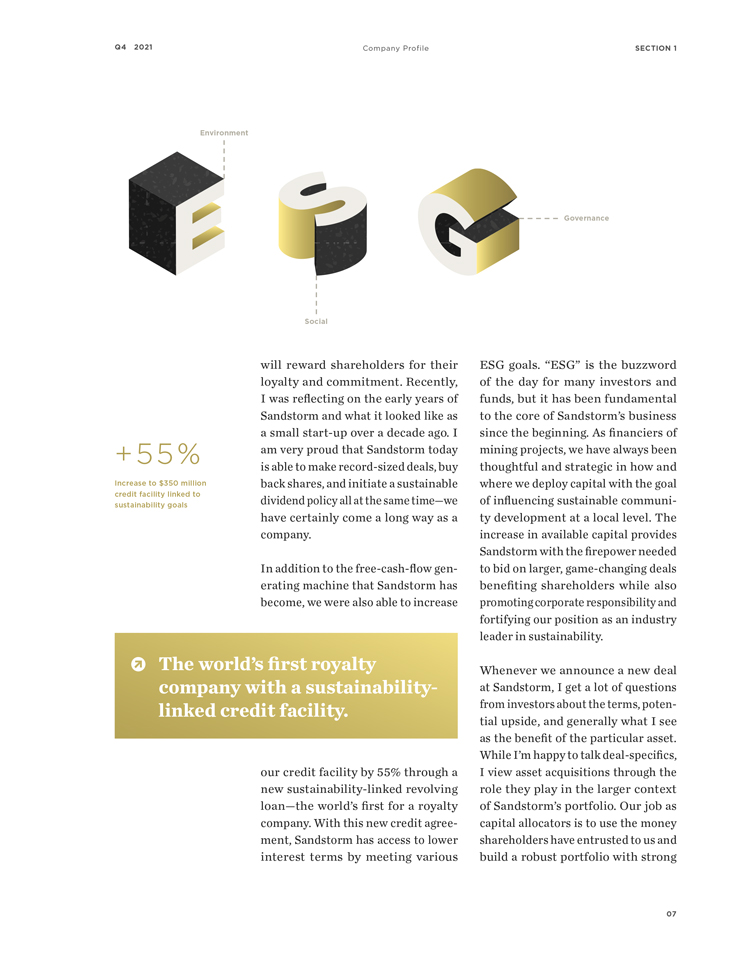
Q4 2021 Company Profile SECTION 1 Environment Social Governance +55% Increase to $350 million credit facility linked to sustainability goals The world’s first royalty company with a sustainability-linked credit facility. will reward shareholders for their loyalty and commitment. Recently, I was reflecting on the early years of Sandstorm and what it looked like as a small
start-up
over a decade ago. I am very proud that Sandstorm today is able to makerecord-sized
deals, buy back shares, and initiate a sustainable dividend policy all at the same time—we have certainly come a long way as a company. In addition to the free-cash-flow generating machine that Sandstorm has become, we were also able to increase our credit facility by 55% through a new sustainability-linked revolving loan—the world’s first for a royalty company. With this new credit agreement, Sandstorm has access to lower interest terms by meeting various ESG goals. “ESG” is the buzzword of the day for many investors and funds, but it has been fundamental to the core of Sandstorm’s business since the beginning. As financiers of mining projects, we have always been thoughtful and strategic in how and where we deploy capital with the goal of influencing sustainable community development at a local level. The increase in available capital provides Sandstorm with the firepower needed to bid on larger, game-changing deals benefiting shareholders while also promoting corporate responsibility and fortifying our position as an industry leader in sustainability. Whenever we announce a new deal at Sandstorm, I get a lot of questions from investors about the terms, potential upside, and generally what I see as the benefit of the particular asset. While I’m happy to talk deal-specifics, I view asset acquisitions through the role they play in the larger context of Sandstorm’s portfolio. Our job as capital allocators is to use the money shareholders have entrusted to us and build a robust portfolio with strong 07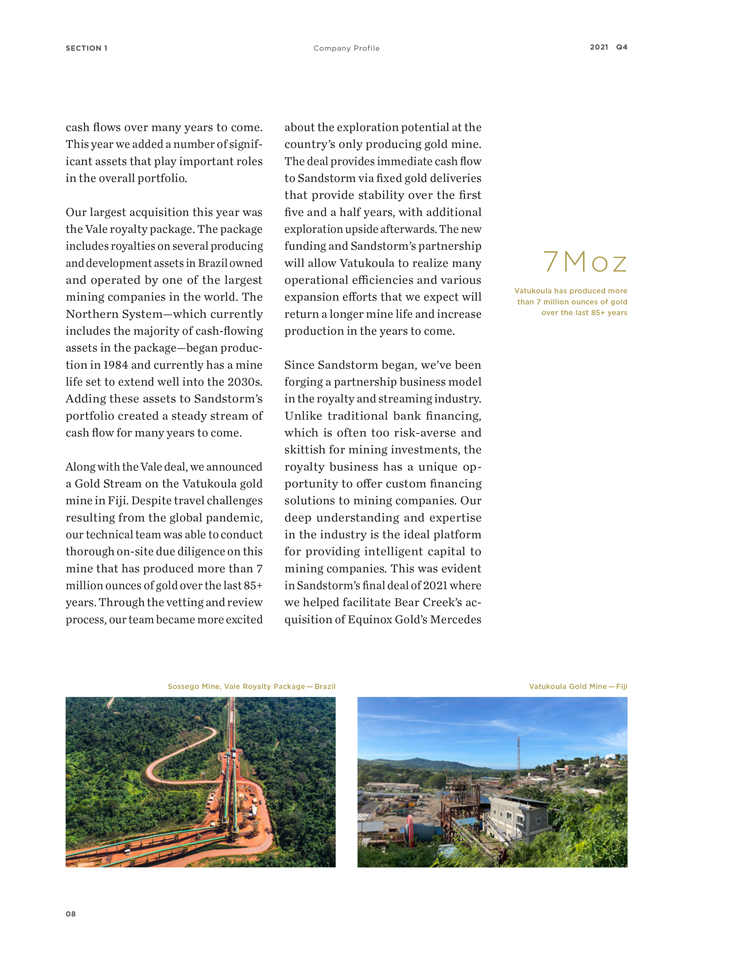
SECTION 1 Company Profile 2021 Q4 cash flows over many years to come. This year we added a number of significant assets that play important roles in the overall portfolio. Our largest acquisition this year was the Vale royalty package. The package includes royalties on several producing and development assets in Brazil owned and operated by one of the largest mining companies in the world. The Northern System—which currently includes the majority of cash-flowing assets in the package—began production in 1984 and currently has a mine life set to extend well into the 2030s. Adding these assets to Sandstorm’s portfolio created a steady stream of cash flow for many years to come. Along with the Vale deal, we announced a Gold Stream on the Vatukoula gold mine in Fiji. Despite travel challenges resulting from the global pandemic, our technical team was able to conduct thorough
on-site
due diligence on this mine that has produced more than 7 million ounces of gold over the last 85+ years. Through the vetting and review process, our team became more excited about the exploration potential at the country’s only producing gold mine. The deal provides immediate cash flow to Sandstorm via fixed gold deliveries that provide stability over the first five and a half years, with additional exploration upside afterwards. The new funding and Sandstorm’s partnership will allow Vatukoula to realize many operational efficiencies and various expansion efforts that we expect will return a longer mine life and increase production in the years to come. Since Sandstorm began, we’ve been forging a partnership business model in the royalty and streaming industry. Unlike traditional bank financing, which is often too risk-averse and skittish for mining investments, the royalty business has a unique opportunity to offer custom financing solutions to mining companies. Our deep understanding and expertise in the industry is the ideal platform for providing intelligent capital to mining companies. This was evident in Sandstorm’s final deal of 2021 where we helped facilitate Bear Creek’s acquisition of Equinox Gold’s Mercedes 7Moz Vatukoula has produced more than 7 million ounces of gold over the last 85+ years Sossego Mine, Vale Royalty Package — Brazil Vatukoula Gold Mine — Fiji 08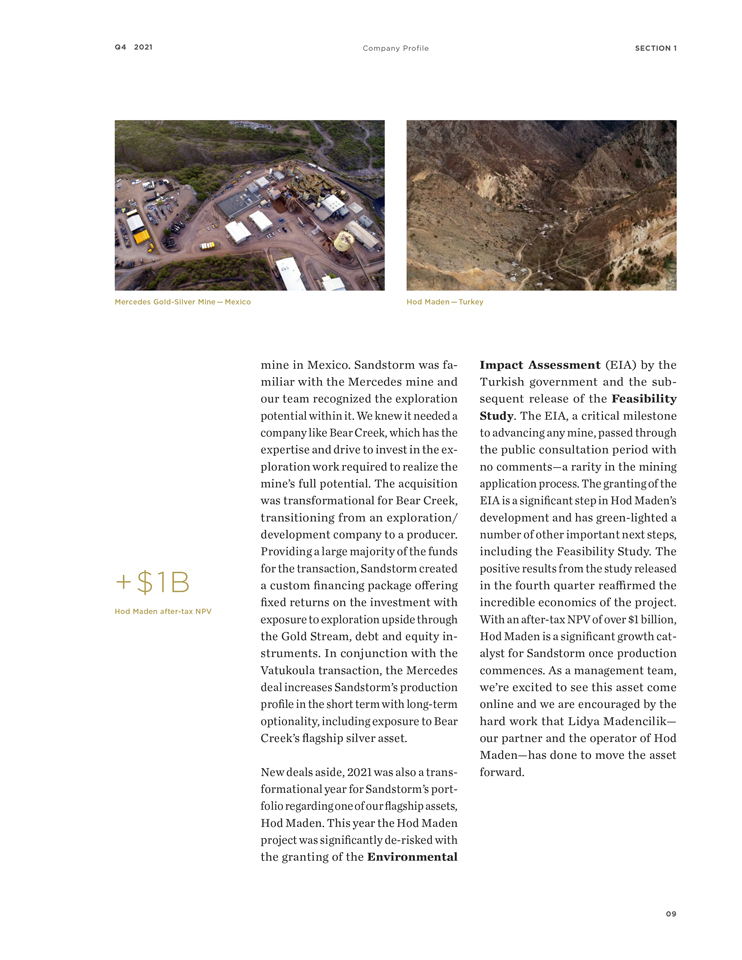
Q4 2021 Company Profile SECTION 1 Mercedes Gold-Silver Mine — Mexico Hod Maden — Turkey +$1B Hod Maden
after-tax
NPV mine in Mexico. Sandstorm was familiar with the Mercedes mine and our team recognized the exploration potential within it. We knew it needed a company like Bear Creek, which has the expertise and drive to invest in the exploration work required to realize the mine’s full potential. The acquisition was transformational for Bear Creek, transitioning from an exploration/ development company to a producer. Providing a large majority of the funds for the transaction, Sandstorm created a custom financing package offering fixed returns on the investment with exposure to exploration upside through the Gold Stream, debt and equity instruments. In conjunction with the Vatukoula transaction, the Mercedes deal increases Sandstorm’s production profile in the short term with long-term optionality, including exposure to Bear Creek’s flagship silver asset. New deals aside, 2021 was also a transformational year for Sandstorm’s portfolio regarding one of our flagship assets, Hod Maden. This year the Hod Maden project was significantlyde-risked
with the granting of the Environmental Impact Assessment (EIA) by the Turkish government and the subsequent release of the Feasibility Study. The EIA, a critical milestone to advancing any mine, passed through the public consultation period with no comments—a rarity in the mining application process. The granting of the EIA is a significant step in Hod Maden’s development and has green-lighted a number of other important next steps, including the Feasibility Study. The positive results from the study released in the fourth quarter reaffirmed the incredible economics of the project. With anafter-tax
NPV of over $1 billion, Hod Maden is a significant growth catalyst for Sandstorm once production commences. As a management team, we’re excited to see this asset come online and we are encouraged by the hard work that Lidya Madencilik— our partner and the operator of Hod Maden—has done to move the asset forward. 09
SECTION 1 Company Profile 2021 Q4 “ A YEAR OF SIGNIFICANT CHANGE AT SANDSTORM THAT WILL INVOLVE A NUMBER OF MOVING PARTS . ” 10
Q4 2021 Company Profile SECTION 1 If Sandstorm is to continue to grow, we need to think bigger. For a royalty company, we recognize the unique nature of Hod Maden’s ownership structure. Since we acquired the asset in 2017, we’ve explored various options to transform our interest in Hod Maden into a more traditional Gold Stream. Along with this annual report, our team is excited to announce that we have taken the first steps in converting Hod Maden into a Gold Stream with the launch of a strategic base metals partner. We believe this will help realize the full value of this extraordinary asset for shareholders and streamline Sandstorm as a pure-play streaming and royalty company. The transformation of Sandstorm’s net profits interest in Hod Maden into a stream is part of a larger strategy for the Company—unlocking unrealized value. Over the years we’ve built the company to include assets of tremen- dous value, but we understand that not everything is given appropriate value by the market. Going forward, our management team is working on ways to realize this value for share- holders, including thinking of new and innovative ways to grow the company. Over the last 18 months, it has become increasingly clear that if Sandstorm is to continue to grow, we need to think bigger. In 2022, we’re working harder than ever to close larger accretive deals, streamline our portfolio to reflect a robust pure-play royalty company, and ensure that Sandstorm is a company shareholders are proud to own. Earlier I considered the question of how we take advantage of a rising gold market. Everything we’ve done to date—new accretive deals, initiating a dividend, buying back shares—is to ensure Sandstorm is “spring-loaded” and ready to pop when the gold industry comes back in favour. However, we’re not waiting for the gold market—the time to grow is now. This will be a year of significant change at Sandstorm that will involve a number of moving parts and big moves. I can assure you that your management team is focused on growing Sandstorm in responsible, creative and exciting ways. We’re thrilled that you are a part of this company, and we can’t wait to show you what’s in store for 2022 and beyond. 11

Section 1 Company Profile 2021 Q4 MANAGEMENT & TECHNICAL TEAM 1 NOLAN WATSON FCPA, FCA, CFA PRESIDENT & CEO 2 DAVID AWRAM B.Sc, Geologist SENIOR EXECUTIVE VP 3 ERFAN KAZEMI CPA, CA, CFA CFO 4 TOM BRUINGTON P.E., M.Sc. EXECUTIVE VP, PROJECT EVALUATION 5 RON HO CPA, CA, CFA SENIOR VP, FINANCE 6 IMOLA GÖTZ M.Sc., P.Eng. VP, MINING & ENGINEERING 7 KEITH LASKOWSKI Mining Geologist, MSc, QP VP, GEOLOGY 8 LIVIA DANILA CPA, CA VP, CORPORATE CONTROLLER 9 SARAH FORD CPA, CA, CFA VP, FINANCIAL PLANNING & ANALYSIS 10 KIM BERGEN CFA VP, CAPITAL MARKETS 11 IAN GRUNDY CPA, CA, CFA VP, CORPORATE DEVELOPMENT 12

Q4 2021 Company Profile SECTION 1 BOARD OF DIRECTORS 1 DAVID E. DE WITT CHAIRMAN 2 MARY L. LITTLE DIRECTOR 3 JOHN P. A. BUDRESKI DIRECTOR 4 VERA KOBALIA DIRECTOR 5 ANDREW T. SWARTHOUT DIRECTOR 6 NOLAN WATSON DIRECTOR 7 DAVID AWRAM DIRECTOR 13

2021 Q4 THIS PAGE INTENTIONALLY LEFT BLANK 14
FINANCIAL REPORTS Q4 Annual Report 2021 SANDSTORM GOLD LTD. DECEMBER 31ST, 2021

THIS PAGE INTENTIONALLY LEFT BLANK 16

Q4 | 2021 | |
Management’s Discussion and Analysis
FOR THE YEAR ENDED DECEMBER 31, 2021
This management’s discussion and analysis (“MD&A”) for Sandstorm Gold Ltd. and its subsidiary entities (collectively “Sandstorm”, “Sandstorm Gold” or the “Company”) should be read in conjunction with the audited consolidated financial statements of Sandstorm for the year ended December 31, 2021 and related notes thereto which have been prepared in accordance with International Financial Reporting Standards as issued by the International Accounting Standards Board (“IFRS”). The information contained within this MD&A is current to February 17, 2022 and all figures are stated in U.S. dollars unless otherwise noted.
17
Company Highlights
Record Operating Results
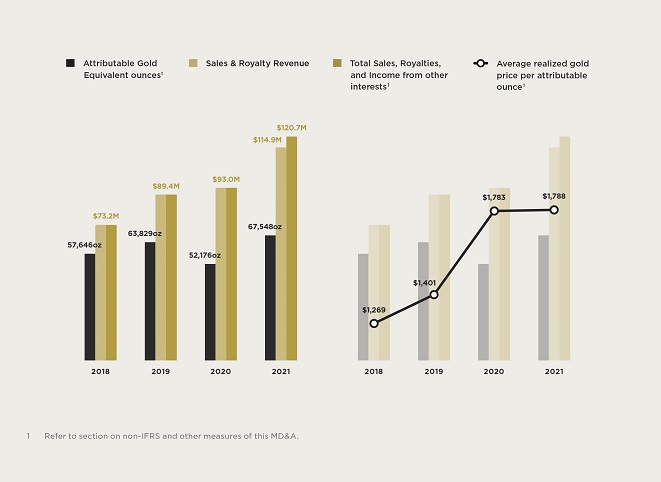
Another record year in terms of net income, revenue, cash flow and Attributable Gold Equivalent
1
ounces.
| · | Net income for the three months and year ended December 31, 2021 was $7.4 million and $27.6 million, respectively, compared with net income of $10.5 million and $13.8 million for the comparable periods in 2020. Net income for the most recently completed year represented a record for the Company. |
| · | Attributable Gold Equivalent ounces 1 |
| · | Revenue for the three months and year ended December 31, 2021 was $29.8 million and $114.9 million, respectively, compared with $29.7 million and $93.0 million for the comparable periods in 2020. Revenue for the most recently completed year represented a record for the Company. |
| · | Total Sales, Royalties and Income from other interests 1 (as defined hereinafter) for the three months and year ended December 31, 2021 was $29.8 million and $120.7 million, respectively, compared with $29.7 million and $93.0 million for the comparable periods in 2020. Total Sales, Royalties and Income from other interests1 for the most recently completed year represented a record for the Company. |
| · | Cash flows from operating activities, excluding changes in non-cash working capital1 , for the three months and year ended December 31, 2021 were $22.1 million and $83.5 million, respectively, compared with $22.5 million and $68.3 million for the comparable periods in 2020. Cash flows from operating activities, excluding changes innon-cash working capital1 for the most recently completed year represented a record for the Company. |
| · | Cost of sales, excluding depletion, for the three months and year ended December 31, 2021 were $3.7 million and $16.8 million, respectively, compared with $3.9 million and $14.0 million for the comparable periods in 2020. |
| · | Average cash costs 1 |
18
| · | Cash operating margins 1 |
| 1 | Refer to section on non-IFRS and other measures of this MD&A. |
Significant Acquisitions
Over $150 million in transactions on cash flowing assets:
| · | In May 2021, the Company acquired a package of royalties for consideration of $7 million. The package includes 21 royalties on development, advanced exploration and exploration stage projects located in Nevada and Montana. |
| · | In June 2021, the Company acquired a diverse package of Vale Royalties which provide holders with life of mine net sales royalties on certain of Vale’s producing and exploration assets. The royalties provide exposure to several of Vale’s long-life, low-cost assets and are expected to contribute to Sandstorm’s portfolio for several decades. |
| · | In June 2021, the Company agreed to acquire a Gold Stream on the operating Vatukoula gold mine in Fiji in exchange for a $30 million upfront deposit. The stream entitles Sandstorm to purchase 25,920 ounces of gold over a 5.5-year period and thereafter2.55%-2.9% of the gold produced from the mine for ongoing per ounce cash payments equal to 20% of the spot price of the gold. In addition to the Gold Stream, Sandstorm will also receive an effective 0.45% NSR on certain prospecting licenses. |
| · | In December 2021, the Company announced a $60 million financing package with Bear Creek Mining to facilitate its acquisition of the producing Mercedes gold-silver mine in Mexico from Equinox Gold Corp. The financing package includes a $37.5 million Gold Stream and a $22.5 million convertible debenture. The transaction is expected to close by March 31, 2022 and gold deliveries to Sandstorm will commence immediately thereafter. |
Hod Maden Milestones and Conversion to Gold Stream
With Hod Maden’s recent approval of the Environmental Impact Assessment and the release of the feasibility study, the Company has entered into an agreement to sell its interest and receive a flagship Gold Stream.
| · | In October 2021, the Hod Maden project received the final approval of the Environmental Impact Assessment for the project from the Ministry of Environment and Urbanization of Turkey. The approval marks the next development phase and triggers several key catalysts including the application for the final permits and initiating long-lead construction items. |
| · | In November 2021, the Company announced the results of the Hod Maden Feasibility Study, for which Sandstorm holds a 30% interest. The study projects a pre-tax net present value (5% discount rate) of $1.3 billion and an internal rate of return of 41%. The study also outlines total production of more than 2.5 million gold equivalent ounces over a 13 year mine life and it is expected that gold will be produced at anall-in sustaining cost on aby-product basis of $334 per ounce1 |
19
| · | Subsequent to year end, the Company announced that it had reached an agreement with Royalty North Partners Ltd. to sell its 30% interest in Hod Maden and its equity interest in Entrée. In consideration, Sandstorm will receive a flagship Gold Stream on Hod Maden and a portion of debt and equity in the resulting New-Co. The transaction is subject to various closing conditions and is expected to close in the second half of 2022. With this transaction, Sandstorm intends to unlock additional value in Hod Maden through there-rating of the asset as a Gold Stream in its portfolio and further repositions Sandstorm as a pure-play precious metals royalty and streaming company. |
| 1 | Refer to section on non-IFRS and other measures of this MD&A. |
Inaugural Dividend and Other
Increased lending capacity and an inaugural dividend.
| · | On October 6, 2021, Sandstorm amended its revolving credit agreement allowing the Company to borrow up to $350 million, and incorporated sustainability-linked performance targets to become the first royalty company to establish an Environment, Social, and Governance linked credit facility. The ESG Revolving Facility incorporates sustainability-linked incentive pricing terms that allow Sandstorm to reduce borrowing costs as the Company’s sustainability performance targets are met. The tenure of the facility is four years and is extendable by mutual consent of Sandstorm and the banking syndicate. |
| · | On December 15, 2021 Sandstorm declared its inaugural dividend of CAD$0.02 per share, paid on January 28, 2022 and each quarter thereafter, subject to annual increases. |
| · | During the year ended December 31, 2021 and under the Company’s normal course issuer bid, the Company purchased and cancelled approximately 5.5 million common shares for total consideration of $34.2 million. |
20
Overview
Sandstorm is a growth-focused company that seeks to acquire royalties and gold and other metals purchase agreements (“Gold Streams” or “Streams”) from companies that have advanced stage development projects or operating mines. In return for making upfront payments to acquire a Stream, Sandstorm receives the right to purchase, at a fixed price per ounce or at a fixed percentage of the spot price, a percentage of a mine’s gold, silver, or other commodity (“Gold Equivalent” as further defined herein)
1
production for the life of the mine. Sandstorm helps other companies in the resource industry grow their businesses, while acquiring attractive assets in the process. The Company is focused on acquiring Streams and royalties from mines with low production costs, significant exploration potential and strong management teams. The Company currently has 230 Streams and royalties, of which 29 of the underlying mines are producing.| 1 | Refer to section on non-IFRS and other measures of this MD&A. |
Outlook
Based on the Company’s existing Streams and royalties, attributable Gold Equivalent ounces (individually and collectively referred to as “Attributable Gold Equivalent”) are forecasted to be between 65,000–70,000 ounces in 2022. Subject to the conversion of the Hod Maden interest into a Gold Stream, the Company is forecasting Attributable Gold Equivalent production to be over 100,000 ounces in 2025.
21
Key Producing Assets
Yamana Silver Stream
Yamana Gold Inc.
The Company has a silver stream on Yamana Gold Inc.’s (“Yamana”) gold-silver Cerro Moro mine, located in Santa Cruz, Argentina (the “Cerro Moro Mine” or “Cerro Moro”). Under the terms of the Yamana silver stream, Sandstorm has agreed to purchase for ongoing per ounce cash payments equal to 30% of the spot price of silver, an amount of silver from Cerro Moro equal to 20% of the silver produced (up to an annual maximum of 1.2 million ounces of silver), until Yamana has delivered to Sandstorm 7.0 million ounces of silver; then 9% of the silver produced thereafter.
Based on the cumulative ounces of silver purchased
to-date,
the Company’s current silver entitlement is 20%.The Cerro Moro Mine, which commenced commercial production in 2018, is located approximately 70 kilometres southwest of the coastal port city of Puerto Deseado in the Santa Cruz province of Argentina. Cerro Moro contains several high-grade epithermal gold and silver deposits, some of which will be mined via open pit and some via underground mining methods.
Chapada Copper Stream
Lundin Mining Corporation
The Company has a copper stream on Lundin Mining Corporation’s (“Lundin Mining”) open pit copper-gold Chapada mine located 270 kilometres northwest of Brasília in Goiás State, Brazil (“Chapada” or the “Chapada Mine”). Under the terms of the Lundin Mining copper stream, Sandstorm has agreed to purchase, for ongoing per pound cash payments equal to 30% of the spot price of copper, an amount of copper from the Chapada Mine equal to:
| i. | 4.2% of the copper produced (up to an annual maximum of 3.9 million pounds of copper) until the mine has delivered 39 million pounds of copper to Sandstorm; then |
| ii. | 3.0% of the copper produced until, on a cumulative basis, the mine has delivered 50 million pounds of copper to Sandstorm; then |
| iii. | 1.5% of the copper produced thereafter, for the life of the mine. |
Based on the cumulative pounds of copper purchased
to-date,
the Company’s current copper entitlement is 4.2%.22
Chapada has been in production since 2007 and is a relatively
low-cost
South American copper-gold operation. The ore is treated through a flotation plant with processing capacity of 24 million tonnes (“Mt”) of ore per annum. In October 2019, an updated technical report was filed which outlines production through 2050. For more information, visit the Lundin Mining website at www.lundinmining.com.Vale Royalties
Vale S.A.
Sandstorm holds a diverse package of royalties on several of Vale S.A.’s (“Vale”) assets located in Brazil. These royalties provide holders with life of mine net sales royalties on seven producing mines and several exploration properties covering a total area of interest of 15,564 square kilometres (the “Vale Royalties” or the “Vale Royalty Package”). Sandstorm’s attributable portion of the Vale Royalty Package is as follows:
Copper and Gold
| · | 0.03% net sales royalty on the Sossego copper-gold mine; and |
| · | 0.06% net sales royalty on copper and gold and a 0.03% net sales royalty on all other minerals from certain assets. |
Iron Ore
| · | 0.05% net sales royalty on iron ore sales from the Northern System; and |
| · | 0.05% net sales royalty on iron ore sales from a portion of the Southeastern System (subject to certain thresholds described below). |
Other
| · | 0.03% of net sales proceeds in the event of an underlying asset sale on certain assets. |
Vale is one of the world’s largest
low-cost
iron mining companies, contributing approximately 15% of global iron ore supply. Vale’s iron ore production is in the first quartile of the cost curve and the Northern and Southeastern Systems have reserve weighted mine lives of 30 years.NORTHERN SYSTEM
The Northern System is comprised of three mining complexes: Serra Sul, Serra Norte, and Serra Leste located in the Carajas District. In 2020, the Northern System produced 192 Mt of iron ore. Production capacity was 206 Mt at the end of 2020.
23
Vale expects that production capacity will reach a long-term target of 240 to 260 Mt, which would be achieved via the approved expansion at Serra Sul and other growth projects.
Mining commenced in 1984 at Serra Norte and, based on current Mineral Reserves, is currently expected to run through the late-2030s. Serra Sul began production in 2016 and is expected to produce through the late-2050s.
SOUTHEASTERN SYSTEM
The Southeastern System is comprised of three mining complexes: Itabira, Minas Centrais, and Mariana located in Minas Gerais. These complexes will start contributing to the Vale Royalties once a cumulative sales threshold of 1.7 billion tonnes of iron ore has been reached, which Vale most recently estimated would occur in 2024 or 2025. Sandstorm estimates that approximately 70% of iron sales from the Southeastern System are covered by the Vale Royalties. Vale expects production capacity to increase to 93 Mt by the end of 2022 from current levels of 70 Mt in 2021.
Houndé Royalty
Endeavour Mining Corporation
The Company has a 2% net smelter returns royalty (“NSR”) based on the production from the Houndé gold mine located in Burkina Faso, West Africa (“Houndé” or the “Houndé Mine”) which is owned and operated by Endeavour Mining Corporation (“Endeavour”).
The royalty covers the Kari North and Kari South tenements (the “Houndé Tenements”), representing approximately 500 square kilometres of the Houndé property package. The Houndé Tenements host a Proven and Probable Mineral Reserve containing 2.1 million ounces of gold within 39.2 million tonnes of ore with an average grade of 1.7 grams per tonne gold. This Reserve is based on an economic
cut-off
grade of 0.5 grams per tonne gold. The Reserve Estimate is effective as of December 31, 2019 and includes the Vindaloo deposit, Kari West, stockpiles and the Bouéré deposit.Houndé is an open pit gold mine with a 4.0 million tonne per year processing plant using a gravity circuit and aplant. Endeavour announced an updated Inclusive Resource on November 12, 2020, which includes 3.3 million ounces of Measured and Indicated Resources contained in 61.6 million tonnes of ore with an average grade of 1.75 grams per tonne gold and 0.45 million ounces of Inferred Resources contained in 7.6 million tonnes of ore with an average grade of 1.9 grams per tonne gold at the Vindaloo, Kari Center, Kari Gap, Kari South, Kari West, Bouéré and stockpile areas combined, all of which are included within the Houndé
carbon-in-leach
24
Tenements (based on a 0.5 grams per tonneand Vindaloo South of 262,000 ounces of Measured and Indicated Resources contained in 18.9 million tonnes of ore with an average grade of 1.28 grams per tonne gold and 11,000 ounces of Inferred Resources contained in 0.2 million tonnes of ore with an average grade of 1.41 grams per tonne gold (based on a 0.5 grams per tonne gold
cut-off
grade). On January 17, 2022, Endeavour announced Mineral Resource additions at KariCentre-Gap-South
cut-off
grade). See www.endeavourmining.com for more information.Santa Elena Gold Stream
First Majestic Silver Corp.
The Company has a Gold Stream to purchase 20% of the life of mine gold produced from First Majestic Silver Corp.’s (“First Majestic”) open pit and underground Santa Elena mine, located in Mexico (the “Santa Elena Mine”), for a per ounce cash payment equal to the lesser of $468 and the then prevailing market price of gold.
The Santa Elena Mine was successfully transitioned from an open pit heap leach operation to an underground mining and milling operation and commercial production for the 3,000 tonne per day processing plant was declared in 2014. On November 24, 2021, First Majestic released an updated Technical Report for the Santa Elena Mine. The updated mine plan incorporates production from both the Santa Elena Mine and the nearby Ermitaño project, the latter of which is not subject to the Company’s Gold Stream.
Aurizona Gold Royalty
Equinox Gold Corp.
The Company has a 3%–5% sliding scale NSR on the production from Equinox Gold Corp.’s (“Equinox”) open pit Aurizona mine, located in Brazil (“Aurizona” or the “Aurizona Mine”) which achieved commercial production in 2019. At gold prices less than or equal to $1,500 per ounce, the royalty is a 3% NSR. At gold prices between $1,500 and $2,000 per ounce, the royalty is a 4% NSR. At gold prices above $2,000 per ounce, the royalty is a 5% NSR. The royalty is calculated based on sales for the month and the average monthly gold price. In addition, Sandstorm holds a 2% NSR on Equinox’s greenfields exploration ground. At any time prior to the commencement of commercial production at the greenfields exploration ground, Equinox can purchase
one-half
of the greenfields NSR for a cash payment of $10 million.On September 20, 2021, Equinox announced a positive
Pre-Feasibility
Study for an expansion to the Aurizona mine through the development of an underground mine which could be operated concurrently with the existingopen-pit
mine and is subject to the Company’s 3%–5% sliding scale NSR. The assessment outlines25
total production of 1.5 million ounces of gold over an eleven-year mine life and includes estimated Proven and Probable Mineral Reserves of 1.66 million ounces of gold (contained in 32.3 million tonnes at 1.6 grams per tonne gold with a
cut-off
grade of0.35-0.47
grams per tonne foropen-pit
and 1.8 grams per tonne gold for underground) with an expected average annual production of 137,000 ounces. ThePre-Feasibility
Study also includes an updated Mineral Resource estimate whereby the total Measured & Indicated Resources (exclusive of reserves) increased to an estimated 868,000 ounces contained in 18.1 million tonnes at 1.5 grams per tonne gold(cut-off
grade of 0.3 grams per tonne for open pit and 1.0 grams per tonne for underground resources). For more information refer to www.equinoxgold.com.Fruta del Norte Royalty
Lundin Gold Inc.
The Company has a 0.9% NSR on the precious metals produced from Lundin Gold Inc.’s (“Lundin Gold”) Fruta del Norte gold mine located in Ecuador (“Fruta del Norte” or “Fruta del Norte Mine”), which commenced commercial production in February 2020.
The royalty covers approximately 646 square kilometres, including all 29 mining concessions held by Lundin Gold. The Fruta del Norte Mineral Reserve contains an estimated 5.24 million ounces of gold in 20.3 million tonnes of ore with an average grade of 8.03 grams per tonne, as of December 31, 2020, ranking it amongst the highest-grade gold projects in the world (based on
cut-off
grade of 3.8 grams per tonne and 4.4 grams per tonne depending on mining method).In 2021, Lundin Gold commenced an
11,000-metre
drill program at Barbasco and Puente Princesa. Both targets are located south of Fruta del Norte within the same geological structure known as the Suarez Pull-Apart Basin and are located within the area of interest of the Company’s royalty. Recently, Lundin Gold announced that it had completed a plant expansion which increased the mill’s throughput from 3,500 tonnes per day to 4,200 tonnes per dayVatukoula Gold Stream
Vatukoula Gold Mines PTE Limited
In December 2021, the Company closed its previously announced gold purchase agreement which entitles it to purchase 25,920 ounces of gold over a
5.5-year
period (the “Fixed Delivery Period”) and thereafter 2.55%–2.9% of the gold produced from Vatukoula Gold Mines PTE Limited’s (“VGML”) underground gold mine located in Fiji (“Vatukoula” or the “Vatukoula Mine”) for ongoing per ounce cash26
payment equal to 20% of the spot price of the gold. In addition to the Gold Stream, Sandstorm will also receive an effective 0.45% NSR on certain prospecting licenses plus a five-kilometre area of interest.
Under the terms of the agreement, during the first 1.5 years of the Fixed Delivery Period, Sandstorm will receive 3,040 ounces of gold per year, increasing to 5,340 ounces of gold per year during the final four years of the Fixed Delivery Period. After which, Sandstorm will receive a variable proportion of gold produced from the Vatukoula Mine for the life of the mine.
As of the date of this MD&A, the Company had remitted $27 million of the $30 million purchase price, with the remaining amount subject to various milestones.
The Vatukoula Mine has produced more than 7 million ounces of gold over the last 85 years. Since 2013, annual mine production has averaged 30,000–40,000 ounces per year. With a portion of the stream proceeds, VGML plans to expand underground operations with a production target of 50,000–70,000 ounces per year in the next three to five years.
Mercedes Gold Stream
Bear Creek Mining Corporation
In December 2021, the Company entered into a $60 million financing package with Bear Creek Mining Corporation (“Bear Creek”) to facilitate Bear Creek’s acquisition of the producing Mercedes gold-silver mine in Sonora, Mexico (“Mercedes” or the “Mercedes Mine”) from Equinox. The financing package includes a $37.5 million Gold Stream on the Mercedes Mine and a $22.5 million convertible debenture, both of which are payable on closing.
Under the terms of the Gold Stream, Sandstorm has agreed to purchase 25,200 ounces of gold over a 3.5 year period (the “Fixed Delivery Term”) and thereafter 4.4% of the gold produced from Mercedes Mine. During the Fixed Delivery Term, Sandstorm will make ongoing per ounce cash payment equal to 7.5% of the spot price of the gold. After the receipt of the fixed deliveries, the ongoing per ounce cash payment will increase to 25% of the spot price of the gold.
The $22.5 million convertible debenture bears an interest rate of 6% per annum and has a term of 3 years. Sandstorm has the right to convert the principal amount of the debenture into common shares of Bear Creek, at any time prior to the maturity date, at a 35% premium, or as approved by the
TSX-V,
to Bear Creek’s share price on closing of the transaction.27
The transaction, which is expected to close by March 31, 2022, is subject to various closing conditions and the Fixed Delivery Term will begin on the earlier of the closing date or April 2022.
The Mercedes district has been the focus of mining activities dating back to the 1880s. Commercial production commenced at the Mercedes Mine in 2011 and the mine has produced over 800,000 ounces of gold. The Mercedes’ mill has a current capacity of 2,000 tonnes per day, with gold recoveries averaging approximately 95% over the past five years. Proven and Probable Reserves as at December 2020 totaled 2.6 million tonnes grading 3.9 grams per tonne gold and 29.2 grams per tonne silver, containing 325,000 ounces of gold and 2.45 million ounces of silver (based on a 2.1 grams per tonne gold
cut-off
grade, except Diluvio which is based on a 2.0 grams per tonne goldcut-off
grade). Mercedes has a strong track record of reserve replacement and Bear Creek intends on expanding its exploration program.Relief Canyon Gold Stream
Americas Gold and Silver Corporation
The Company has a precious metal stream on the Relief Canyon gold project in Nevada, U.S.A. (“Relief Canyon” or the “Relief Canyon Mine”), which is owned and operated by Americas Gold and Silver Corporation (“Americas Gold”). Under the terms of the Stream, Sandstorm is entitled to receive 32,022 ounces of gold over a 5.5 year period which began in the second quarter of 2020 (the “Fixed Deliveries”). After receipt of the Fixed Deliveries, the Company has agreed to purchase 4% of the gold and silver produced from the Relief Canyon Mine for ongoing per ounce cash payments equal to 30%–65% of the spot price of gold or silver, with the range dependent on the concession’s existing royalty obligations. In addition, Sandstorm will also receive a 1.4%–2.8% NSR on the area surrounding the Relief Canyon mine.
Americas Gold may elect to reduce the 4% Stream and NSR on the Relief Canyon mine by delivering 4,000 ounces of gold to Sandstorm (the “Purchase Option”). The Purchase Option may be exercised by Americas Gold at any time and is subject to a 10% annual premium. Upon exercising the Purchase Option, the 4% Stream will decrease to 2% and the NSR will decrease to 1%.
In January 2021, Americas Gold announced that it had achieved commercial production at the Relief Canyon Mine. Since then, the ramp up of operations has been challenging and the operation has proceeded withheap leaching with continued efforts to resolve metallurgical challenges. The mine is located in Nevada, U.S.A. at the southern end of the Pershing Gold and Silver Trend, which hosts other projects such as Coeur Mining Inc.’s Rochester mine.
run-of-mine
28
Black Fox Gold Stream
McEwen Mining Inc.
The Company has a Gold Stream to purchase 8% of the life of mine gold produced from McEwen Mining Inc.’s (“McEwen”) open pit and underground Black Fox mine, located in Ontario, Canada (the “Black Fox Mine”), and 6.3% of the life of mine gold produced from McEwen’s Black Fox Extension, which includes a portion of McEwen’s Pike River concessions, for a per ounce cash payment equal to the lesser of $577 and the spot price of gold.
The Black Fox Mine began operating as an open pit mine in 2009 (depleted in 2015) and transitioned to underground operations in 2011. McEwen continues to invest in an exploration program which includes surface and underground drilling. For more information refer to www.mcewenmining.com.
Karma Gold Stream
Endeavour Mining Corporation
The Company has a Gold Stream which entitles it to purchase 25,000 ounces of gold over a five-year period and thereafter 1.625% of the gold produced from Endeavour’s open pit heap leach Karma gold mine located in Burkina Faso, West Africa (“Karma” or the “Karma Mine”) for ongoing per ounce cash payment equal to 20% of the spot price of gold. The Gold Stream, which on a gross basis requires Endeavour to deliver 100,000 ounces of gold over a five-year period starting March 31, 2016 and thereafter 6.5% of the equivalent gold production at the Karma Mine, is syndicated 75% and 25% between Franco-Nevada Corp. and Sandstorm, respectively. With the conclusion, in March 2021, of the five-year delivery period, Sandstorm’s Gold Stream entitlement is now at 1.625%.
Bracemac-McLeod Royalty
Glencore PLC
Sandstorm has a 3% NSR based on 100% of the production from the Bracemac-McLeod property located in Matagami, Quebec, Canada (“Bracemac-McLeod” or the “Bracemac-McLeod Mine”) which is owned and operated by a subsidiary of Glencore PLC (“Glencore”).
The Bracemac-McLeod Mine is a high-grade volcanogenic massive sulphide deposit located in the historic and prolific Matagami mining district of Quebec. Continuous mining and milling operations have been active in the Matagami district for over fifty years with ten previously operating mines and one other currently producing mine. The Bracemac-McLeod Mine began initial production in the second half of 2013 and mining is scheduled to conclude in 2022.
29
Diavik Diamond Royalty
Rio Tinto PLC
The Company has a 1% gross proceeds royalty based on the production from the Diavik mine located in Lac de Gras, Northwest Territories, Canada (“Diavik” or the “Diavik Mine”) which is owned and operated by Rio Tinto PLC (“Rio Tinto”).
The Diavik Mine is Canada’s largest diamond mine. The mine began producing diamonds in January 2003 and has since produced more than 100 million carats from three kimberlite pipes (A154 South, A154 North, and A418). In the fourth quarter of 2018, Rio Tinto announced that it had achieved commercial production at its fourth open pit diamond pipe (A21).
Other Producing Assets
Ming Gold Stream
Rambler Metals & Mining PLC
The Company has a Gold Stream to purchase approximately 25% of the first 175,000 ounces of gold produced and 12% of the life of mine gold produced thereafter, from Rambler Metals & Mining PLC’s (“Rambler”) Ming copper-gold mine, located in Newfoundland, Canada (“Ming” or the “Ming Mine”). There are no ongoing per ounce payments required by Sandstorm in respect of the Ming Mine Gold Stream. In the event that the metallurgical recoveries of gold at the Ming Mine are below 85%, the percentage of gold that Sandstorm shall be entitled to purchase shall be increased proportionally. Based on 2020 metallurgical recoveries, Sandstorm’s 2021 gold purchase entitlement was adjusted to 31%.
The Ming Mine has been in operation since 2012 and continued production is expected from both the high-grade Massive Sulphide Zone and the Lower Footwall Zone. For more information refer to www.ramblermines.com.
Gualcamayo Royalty
Mineros S.A.
The Company has a 1% NSR on the Gualcamayo gold mine (the “Gualcamayo Mine”) which is located in San Juan province, Argentina and is owned and operated by Mineros S.A. (“Mineros”). The Gualcamayo Mine is an open pit, heap leach operation. Mineros is a Latin American gold producer with operations in Argentina, Colombia, and Nicaragua.
30
Thunder Creek Royalty
Pan American Silver Corp.
The Company has a 1% NSR on the gold produced from the Thunder Creek and 144 properties (“Thunder Creek” or the “Thunder Creek Mine”) which are part of the Timmins West mine complex in Ontario, Canada which is owned and operated by Pan American Silver Corp. Thunder Creek is an underground mine that has been in production since 2010 and has produced more than 500,000 ounces of gold.
Mine Waste Solutions Royalty
Harmony Gold Mining Company Limited
The Company has a 1% NSR on the gold produced from Mine Waste Solutions tailings recovery operation (“MWS”) which is located near Stilfontein, South Africa, and is owned and operated by Harmony Gold Mining Company Limited. MWS is a gold and uranium tailings recovery operation. The operation
re-processes
multiple tailings dumps in the area through three production modules, the last of which was commissioned in 2011.HM Claim
Agnico Eagle Mines Limited
The Company has a 2% NSR on a part of the Macassa mine complex located in Kirkland Lake, Ontario, Canada (“HM Claim”), which is owned and operated by Agnico Eagle Mines Limited. The Kirkland Lake mining camp has been a prolific gold producer since mining began there in 1914. The HM Claim is an area that hosts the easterly extension of the south mine complex and is located southeast of the #2 shaft at the Macassa mine.
Triangle Zone
Eldorado Gold Corp.
The Company has a 2% NSR on a part of the Triangle zone located within the Lamaque gold project located in Quebec, Canada (“Triangle Zone”), which is owned and operated by Eldorado Gold Corp. (“Eldorado”). The Triangle Zone is an Archean greenstone-hosted orogenic lode gold deposit and the royalty covers a portion of the Triangle Zone’s reserves and resources. Eldorado achieved commercial production in March 2019.
31
Emigrant Springs Royalty
Newmont Corporation
The Company has a 1.5% NSR, payable by Newmont Corporation (“Newmont”), on a portion of the Emigrant Springs gold mine (the “Emigrant Springs Mine”) which is located in the Carlin Trend in Nevada, U.S.A. The Emigrant Springs Mine is owned by Nevada Gold Mines LLC which is a joint venture owned 61.5% by Barrick Gold Corporation (“Barrick”) and 38.5% by Newmont and operated by Barrick. The Emigrant Springs Mine is an open pit, heap leach operation that has been in production since the third quarter of 2012.
Development Assets
Hod Maden
Lidya Madencilik Sanayi ve Ticaret A.S.
The Company has a 30% net profits interest and a 2% NSR on the Hod Maden gold-copper project, which is located in Artvin Province, northeastern Turkey (the “Hod Maden Project” or “Hod Maden”). The project is operated and
co-owned
by a Turkish partner, Lidya Madencilik Sanayi ve Ticaret A.S. (“Lidya”), which owns the remaining interest in the project. Lidya is a strong local partner with experience exploring, developing, permitting, and operating projects in Turkey. Lidya is part of a large Turkish conglomerate called Çalik Holding and is currently involved in several projects in Turkey including a partnership with SSR Mining Inc. on the producing Çöpler mine.In October 2021, the Hod Maden project received the final approval of the Environmental Impact Assessment (“EIA”) for the project from the Ministry of Environment and Urbanization of Turkey.
In November 2021, a Feasibility Study was released. The results of which demonstrate a Proven and Probable Mineral Reserve of 2.5 million ounces of gold and 129,000 tonnes of copper being mined over a
13-year
mine life (8.7 million tonnes at 8.8 grams per tonne gold and 1.5% copper or 11.1 grams per tonne gold equivalent using a breakevencut-off
value of $82/tonne and incrementalcut-off
values of $63 per tonne for stopes and $40 per tonne for development). The study projects apre-tax
net present value (5% discount rate) of $1.3 billion and an internal rate of return of 41%. It is estimated that gold will be produced at anall-in
sustaining cost on aby-product
basis1
of $334 per ounce. For more information refer to www.sandstormgold.com.With the approval of the EIA and release of the Feasibility Study, Hod Maden moves into the next stage of development including the application for the final permits and initiating long-lead construction items.
32
Subsequent to year end, the Company announced that it had reached an agreement with Royalty North Partners Ltd. to sell its 30% interest in Hod Maden and its equity interest in Entrée. In consideration, Sandstorm will receive a flagship Gold Stream on Hod Maden and a portion of debt and equity in the resulting issuer
(“New-Co”).
The transaction is subject to various closing conditions and is expected to close in the second half of 2022. The accounting for the transaction will be finalized on closing based on the facts and circumstances at that time. With this transaction, Sandstorm intends to unlock additional value in Hod Maden through there-rating
of the asset as a Gold Stream in its portfolio and further repositions Sandstorm as a pure-play precious metals royalty and streaming company.New-Co
will become a strategic partner to Sandstorm that will allow both companies to collaborate on future acquisitions.New-Co’s
business intent is to actively grow its existing portfolio of assets, with a focus on base metal projects. The two companies may partner together whereby Sandstorm purchases streams on the precious metalby-products
from the base metal project acquisitions made byNew-Co.
| 1 | Refer to section on non-IFRS and other measures of this MD&A. |
Hugo North Extension & Heruga Gold Stream
Entrée Resources Ltd.
The Company has a Gold Stream with Entrée Resources Ltd. (“Entrée”) to purchase an amount equal to 5.62% and 4.26%, respectively, of the gold and silver produced from the Hugo North Extension and Heruga deposits located in Mongolia, (the “Hugo North Extension” and “Heruga”, respectively) for per ounce cash payments equal to the lesser of $220 per ounce of gold and $5 per ounce of silver and the then prevailing market price of gold and silver, respectively. Additionally, Sandstorm has a copper stream to purchase an amount equal to 0.42% of the copper produced from Hugo North Extension and Heruga for per pound cash payments equal to the lesser of $0.50 per pound of copper and the then prevailing market price of copper.
The Company is not required to contribute any further capital, exploration, or operating expenditures to Entrée.
The Hugo North Extension is a copper-gold porphyry deposit and Heruga is a copper-gold-molybdenum porphyry deposit. Both projects are located in the South Gobi Desert of Mongolia, approximately 570 kilometres south of the capital city of Ulaanbaatar and 80 kilometres north of the border with China. The Hugo North Extension and Heruga are part of the Oyu Tolgoi mining complex and are managed by Oyu Tolgoi LLC, a subsidiary of Turquoise Hill Resources Ltd. and the Government of Mongolia, and its project manager Rio Tinto PLC. Entrée retains a 20% interest in the Hugo North Extension and Heruga.
33
Entrée recently announced the completion of an updated Feasibility Study on its interest in the Entrée/Oyu Tolgoi joint venture property. The updated report aligns Entrée’s disclosure with that of other Oyu Tolgoi project stakeholders on development of the first lift of the underground mine. Entrée further announced that optimization studies on Panel 1 are currently underway which have the potential to further improve Lift 1 economics for the Entrée/Oyu Tolgoi joint venture.
Hackett River Royalty
Glencore PLC
The Company has a 2% NSR on the Hackett River property located in Nunavut, Canada (the “Hackett River Project” or “Hackett River”) which is owned by a subsidiary of Glencore.
Hackett River is a silver-rich volcanogenic massive sulphide deposit and is one of the largest undeveloped projects of its kind. The property contains four massive sulphide bodies that occur over a 6.6 kilometre strike length. A Preliminary Economic Assessment updated in 2010 evaluated a possible large-scale open pit and underground operation, processing up to 12,000 tonnes per day. The most recent Glencore Reserves and Resources statement, effective December 31, 2020, reported 27.1 million tonnes of Indicated Resources containing 4.5% zinc and 130.0 grams per tonne silver plus 60.0 million tonnes of Inferred Resources with 4.0% zinc and 150.0 grams per tonne silver. For more information refer to www.glencore.com and the Technical Report dated July 26, 2010 under Sabina Gold & Silver Corp.’s profile on www.sedar.com.
Lobo-Marte Royalty
Kinross Gold Corporation
The Company has a 1.05% NSR on production from the Lobo-Marte project located in the Maricunga gold district of Chile (the “Lobo-Marte Project” or “Lobo-Marte”) which is owned by Kinross Gold Corporation (“Kinross”).
In the fourth quarter of 2021, Kinross announced the results of a Feasibility Study for the Lobo-Marte Project. The study estimates a new Probable Mineral Reserve of 6.7 million ounces contained in 160.7 million tonnes at an average grade of 1.3 grams per tonne gold with additional Indicated Resources of 2.4 million ounces contained in 99.4 million tonnes at an average grade of 0.7 grams per tonne gold and Inferred Resources of 0.4 million ounces contained in 18.5 million tonnes at an average grade of 0.75 grams per tonne gold. Kinross estimates a total life of mine production of approximately 4.7 million gold ounces during a
16-year
mine life, which includes34
14 years of mining followed by two years of residual processing. Reserves and Resources are estimated based on appropriate
cut-off
grades calculated using $1,200 per ounce gold prices. For more information refer to www.kinross.com.Agi Dagi & Kirazli Royalty
Alamos Gold Inc.
The Company has a $10 per ounce royalty based on the production from the Agi Dagi and the Kirazli gold development projects located in the Çanakkale Province of northwestern Turkey (“Agi Dagi” and “Kirazli”, respectively) which are both owned by Alamos Gold Inc. (“Alamos Gold”). The royalty is payable by Newmont and is subject to a maximum of 600,000 ounces from Agi Dagi and a maximum of 250,000 ounces from Kirazli.
A 2017 Feasibility Study on Agi Dagi and a 2017 Feasibility Study on Kirazli contemplated both projects as stand-alone open pit, heap leach operations. Under the respective studies, Agi Dagi is expected to produce an average of 177,600 ounces of gold per year over a
6-year
mine life while Kirazli is expected to produce an average of 104,000 ounces of gold per year over a5-year
mine life. For more information refer to www.alamosgold.com.Prairie Creek Royalty
NorZinc Ltd.
The Company has a 1.2% NSR on the Prairie Creek project (the “Prairie Creek Project”) located in the Northwest Territories, Canada and owned by NorZinc Ltd. (“NorZinc”). The Prairie Creek Project is a zinc, silver and lead project that is 100%-owned by NorZinc and based on a 2017 Feasibility Study has an estimated Proven and Probable Mineral Reserve of 8.1 million tonnes containing 8.6% zinc, 124.2 grams per tonne silver and 8.1% lead. For more information, refer to www.norzinc.com.
Mt. Hamilton Royalty
Waterton Precious Metals Fund II Cayman, LP
The Company has a 2.4% NSR on the Mt. Hamilton gold project (the “Mt. Hamilton Project”). The Mt. Hamilton Project is located in White Pine County, Nevada, U.S.A. and is owned by Waterton Precious Metals Fund II Cayman, LP.
35
Revolving Credit Facility
In October 2021, Sandstorm amended its revolving credit agreement, allowing the Company to borrow up to $350 million and incorporating sustainability-linked performance targets to establish an Environment, Social, and Governance (“ESG”) linked credit facility (“ESG Revolving Facility”). The ESG Revolving Facility is for general corporate purposes, from a syndicate of banks including The Bank of Nova Scotia, Bank of Montreal, National Bank of Canada, Canadian Imperial Bank of Commerce, and Royal Bank of Canada (the “Syndicate”). The term of the ESG Revolving Facility is for four years and is extendable by mutual consent of Sandstorm and the Syndicate. The amounts drawn on the ESG Revolving Facility are subject to interest at LIBOR plus 1.875%–3.0% per annum, and the undrawn portion of the ESG Revolving Facility is subject to a standby fee of 0.422%–0.675% per annum, both of which are dependent on the Company’s leverage ratio.
The ESG Revolving Facility incorporates sustainability-linked incentive pricing terms that allow Sandstorm to reduce the borrowing costs from the interest rates described above as the Company’s ESG performance targets are met. These targets focus on increasing the Company’s producing assets which report under sustainability and climate related standards as well as maintaining and improving the Company’s own external ESG rating and ensuring diverse representation at the senior management and board levels. As of the date of the MD&A, there are no amounts drawn under the ESG Revolving Facility and the full $350 million remains available.
36
Summary of Annual Results
YEAR ENDED
In $000s (except for per share and per ounce amounts) | Dec. 31, 2021 | Dec. 31, 2020 | Dec. 31, 2019 | |||||||||
Total revenue | $ | 114,860 | $ | 93,025 | $ | 89,434 | ||||||
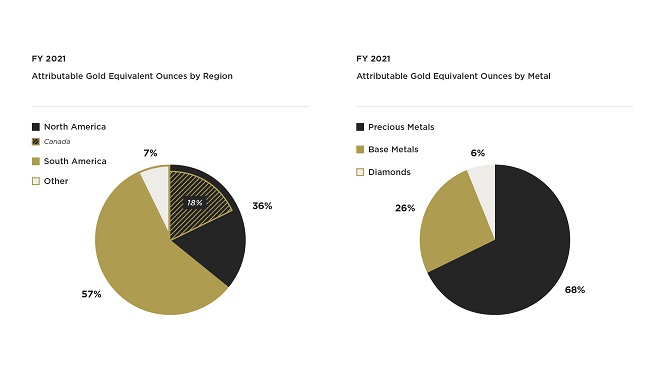
Attributable Gold Equivalent ounces 1 | 67,548 | 52,176 | 63,829 | |||||||||
Sales | $ | 71,722 | $ | 58,660 | $ | 63,602 | ||||||
Royalty revenue | 43,138 | 34,365 | 25,832 | |||||||||
Average realized gold price per attributable ounce 1 | 1,788 | 1,783 | 1,401 | |||||||||
Average cash cost per attributable ounce 1 | 249 | 269 | 286 | |||||||||
Cash flows from operating activities | 81,139 | 65,616 | 57,339 | |||||||||
Net income | 27,622 | 13,817 | 16,397 | |||||||||
Basic income per share | 0.14 | 0.07 | 0.09 | |||||||||
Diluted income per share | 0.14 | 0.07 | 0.09 | |||||||||
Total assets | 620,858 | 649,921 | 623,175 | |||||||||
Total long-term liabilities | 20,873 | 8,345 | 48,414 | |||||||||
| 1 | Refer to section on non-IFRS and other measures of this MD&A. |
37
The Company’s operating segments for the year ended December 31, 2021 are summarized in the table below:
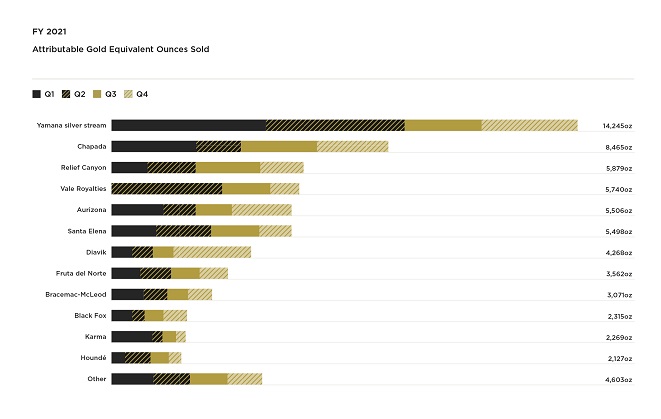
In $000s (except for ounces sold) | Product | Attributable Gold Equivalent ounces | Sales and royalty revenues | Cost of sales excluding depletion | Depletion expense | Stream, Royalty and Other Interests Impairments | Gain on Vale Royalties financial instrument | Income (loss) before taxes | Cash flows from operating activities | |||||||||||||||||||||||||||
Aurizona | Gold | 5,506 | $ | 9,844 | $ | - | $ | 815 | $ | - | $ | - | $ | 9,029 | $ | 9,444 | ||||||||||||||||||||
Black Fox | Gold | 2,315 | 4,154 | 1,309 | 1,888 | - | - | 957 | 2,845 | |||||||||||||||||||||||||||
Bracemac-McLeod 1 | Various | 3,071 | 5,487 | - | 1,545 | - | - | 3,942 | 4,995 | |||||||||||||||||||||||||||
Chapada | Copper | 8,465 | 15,118 | 4,541 | 2,963 | - | - | 7,614 | 10,577 | |||||||||||||||||||||||||||
Diavik | Diamonds | 4,268 | 7,647 | - | 3,372 | - | - | 4,275 | 7,097 | |||||||||||||||||||||||||||
Fruta del Norte | Gold | 3,562 | 6,367 | - | 2,304 | - | - | 4,063 | 4,465 | |||||||||||||||||||||||||||
Houndé | Gold | 2,127 | 3,803 | - | 1,610 | - | - | 2,193 | 3,802 | |||||||||||||||||||||||||||
Karma | Gold | 2,269 | 4,065 | 824 | 1,935 | - | - | 1,306 | 3,241 | |||||||||||||||||||||||||||
Relief Canyon | Gold | 5,879 | 10,499 | - | 4,711 | - | - | 5,788 | 10,499 | |||||||||||||||||||||||||||
Santa Elena | Gold | 5,498 | 9,786 | 2,568 | 280 | - | - | 6,938 | 7,357 | |||||||||||||||||||||||||||
Vale Royalties | Iron Ore | 5,740 | 4,398 | - | 1,444 | - | (5,887 | ) | 8,841 | 198 | ||||||||||||||||||||||||||
Yamana silver stream | Silver | 14,245 | 25,460 | 7,603 | 10,415 | - | - | 7,442 | 17,857 | |||||||||||||||||||||||||||
Other 2 | Various | 4,603 | 8,232 | - | 2,422 | 408 | - | 5,402 | 8,658 | |||||||||||||||||||||||||||
Corporate | - | - | - | - | - | - | (22,937 | ) | (9,896 | ) | ||||||||||||||||||||||||||
Consolidated | 67,548 | $ | 114,860 | $ | 16,845 | $ | 35,704 | $ | 408 | $ | (5,887 | ) | $ | 44,853 | $ | 81,139 | ||||||||||||||||||||
| 1 | Royalty revenue from Bracemac-McLeod consists of $2.8 million from copper and $2.7 million from zinc. |
| 2 | Includes royalty revenue from gold of $7.6 million and other base metals of $0.6 million. |
The Company’s operating segments for the year ended December 31, 2020 are summarized in the table below:
In $000s (except for ounces sold) | Product | Attributable Gold Equivalent ounces | Sales and royalty revenues | Cost of sales excluding depletion | Depletion expense | Stream, Royalty and Other Interests Impairments | Other | Income (loss) before taxes | Cash flows from operating activities | |||||||||||||||||||||||||||
Aurizona | Gold | 4,958 | $ | 8,850 | $ | - | $ | 1,067 | $ | - | $ | - | $ | 7,783 | $ | 7,950 | ||||||||||||||||||||
Black Fox | Gold | 2,137 | 3,693 | 1,194 | 1,014 | - | - | 1,485 | 2,500 | |||||||||||||||||||||||||||
Bracemac-McLeod 1 | Various | 1,634 | 2,946 | - | 1,485 | - | - | 1,461 | 3,234 | |||||||||||||||||||||||||||
Chapada | Copper | 5,585 | 9,904 | 3,021 | 2,914 | - | - | 3,969 | 6,883 | |||||||||||||||||||||||||||
Diavik | Diamonds | 1,489 | 2,716 | - | 2,085 | 7,862 | 392 | (7,623 | ) | 3,075 | ||||||||||||||||||||||||||
Fruta del Norte | Gold | 1,815 | 3,302 | - | 1,256 | - | - | 2,046 | 1,408 | |||||||||||||||||||||||||||
Houndé | Gold | 4,874 | 8,740 | - | 3,816 | - | - | 4,924 | 6,633 | |||||||||||||||||||||||||||
Karma | Gold | 4,584 | 8,184 | 1,619 | 3,843 | - | - | 2,722 | 6,438 | |||||||||||||||||||||||||||
Relief Canyon | Gold | 3,819 | 7,096 | - | 2,820 | - | - | 4,276 | 7,096 | |||||||||||||||||||||||||||
Santa Elena | Gold | 5,526 | 9,749 | 2,552 | 312 | - | - | 6,885 | 7,100 | |||||||||||||||||||||||||||
Yamana silver stream | Silver | 10,912 | 19,199 | 5,660 | 10,119 | - | - | 3,420 | 13,540 | |||||||||||||||||||||||||||
Other 2 | Various | 4,843 | 8,646 | - | 2,393 | 1,015 | - | 5,238 | 7,553 | |||||||||||||||||||||||||||
Corporate | - | - | - | - | - | 135 | (12,310 | ) | (7,794 | ) | ||||||||||||||||||||||||||
Consolidated | 52,176 | $ | 93,025 | $ | 14,046 | $ | 33,124 | $ | 8,877 | $ | 527 | $ | 24,276 | $ | 65,616 | |||||||||||||||||||||
| 1 | Royalty revenue from Bracemac-McLeod consists of $1.4 million from copper and $1.5 million from zinc. |
| 2 | Includes royalty revenue from gold of $8.1 million and other base metals of $0.5 million. |
38
39
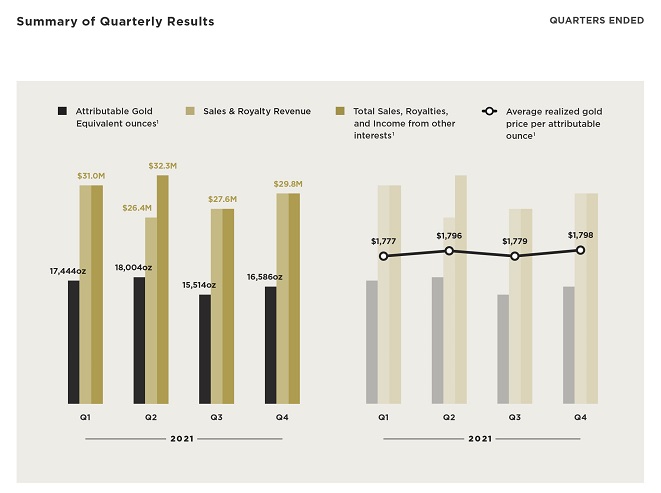
Summary of Quarterly Results
QUARTERS ENDED
In $000s (except for per share and per ounce amounts) | Dec. 31, 2021 | Sep. 30, 2021 | Jun. 30, 2021 | Mar. 31, 2021 | ||||||||||||
Total revenue | $ | 29,821 | $ | 27,596 | $ | 26,446 | $ | 30,997 | ||||||||
Attributable Gold Equivalent ounces 1 | 16,586 | 15,514 | 18,004 | 17,444 | ||||||||||||
Sales | $ | 15,772 | $ | 16,879 | $ | 17,487 | $ | 21,584 | ||||||||
Royalty revenue | 14,049 | 10,717 | 8,959 | 9,413 | ||||||||||||
Average realized gold price per attributable ounce 1 | 1,798 | 1,779 | 1,796 | 1,777 | ||||||||||||
Average cash cost per attributable ounce 1 | 224 | 238 | 227 | 307 | ||||||||||||
Cash flows from operating activities | 19,505 | 17,914 | 19,998 | 23,722 | ||||||||||||
Net income | 7,395 | 6,622 | 8,636 | 4,969 | ||||||||||||
Basic income per share | 0.04 | 0.03 | 0.04 | 0.03 | ||||||||||||
Diluted income per share | 0.04 | 0.03 | 0.04 | 0.03 | ||||||||||||
Total assets | 620,858 | 640,920 | 648,741 | 638,659 | ||||||||||||
Total long-term liabilities | 20,873 | 17,425 | 14,342 | 10,723 | ||||||||||||
In $000s (except for per share and per ounce amounts) | Dec. 31, 2020 | Sep. 30, 2020 | Jun. 30, 2020 | Mar. 31, 2020 | ||||||||||||
Total revenue | $ | 29,696 | $ | 23,267 | $ | 18,730 | $ | 21,332 | ||||||||
Attributable Gold Equivalent ounces 1 | 15,795 | 12,068 | 10,920 | 13,393 | ||||||||||||
Sales | $ | 17,560 | $ | 14,187 | $ | 12,580 | $ | 14,333 | ||||||||
Royalty revenue | 12,136 | 9,080 | 6,150 | 6,999 | ||||||||||||
Average realized gold price per attributable ounce 1 | 1,880 | 1,928 | 1,715 | 1,593 | ||||||||||||
Average cash cost per attributable ounce 1 | 248 | 258 | 257 | 314 | ||||||||||||
Cash flows from operating activities | 19,806 | 18,085 | 12,351 | 15,374 | ||||||||||||
Net income (loss) | 10,504 | 6,518 | 7,137 | (10,342 | ) | |||||||||||
Basic income (loss) per share | 0.05 | 0.03 | 0.04 | (0.06 | ) | |||||||||||
Diluted income (loss) per share | 0.05 | 0.03 | 0.04 | (0.06 | ) | |||||||||||
Total assets | 649,921 | 608,748 | 607,471 | 576,316 | ||||||||||||
Total long-term liabilities | 8,345 | 3,638 | 3,096 | 53,221 | ||||||||||||
| 1 | Refer to section on non-IFRS and other measures of this MD&A. |
40
| 1 | Refer to section on non-IFRS and other measures of this MD&A. |
Changes in sales, net income, and cash flows from operating activities from quarter to quarter are affected primarily by fluctuations in production at the mines, the timing of shipments, changes in the price of commodities, as well as acquisitions of Streams and royalty interests and the commencement of operations of mines under construction. For more information refer to the quarterly commentary below.
41
The Company’s operating segments for the three months ended December 31, 2021 are summarized in the table below:
In $000s (except for ounces sold) | Product | Attributable Gold Equivalent ounces | Sales and royalty revenues | Cost of sales excluding depletion | Depletion expense | Income (loss) before taxes | Cash flows from operating activities | |||||||||||||||||||
Aurizona | Gold | 1,833 | $ | 3,297 | $ | - | $ | 188 | $ | 3,109 | $ | 2,347 | ||||||||||||||
Black Fox | Gold | 730 | 1,321 | 414 | 595 | 312 | 907 | |||||||||||||||||||
Bracemac-McLeod 1 | Various | 727 | 1,307 | - | 454 | 853 | 1,261 | |||||||||||||||||||
Chapada | Copper | 2,183 | 3,924 | 1,179 | 747 | 1,998 | 2,745 | |||||||||||||||||||
Diavik | Diamonds | 2,366 | 4,254 | - | 639 | 3,615 | 4,184 | |||||||||||||||||||
Fruta del Norte | Gold | 872 | 1,567 | - | 569 | 998 | 1,152 | |||||||||||||||||||
Houndé | Gold | 376 | 675 | - | 264 | 411 | 94 | |||||||||||||||||||
Karma | Gold | 299 | 538 | 107 | 256 | 175 | 431 | |||||||||||||||||||
Relief Canyon | Gold | 1,334 | 2,388 | - | 1,130 | 1,258 | 2,388 | |||||||||||||||||||
Santa Elena | Gold | 986 | 1,774 | 461 | 50 | 1,263 | 1,810 | |||||||||||||||||||
Vale Royalties | Iron Ore | 890 | 1,600 | - | 666 | 934 | 198 | |||||||||||||||||||
Yamana silver stream | Silver | 2,930 | 5,268 | 1,546 | 2,323 | 1,399 | 3,722 | |||||||||||||||||||
Other | Gold | 1,060 | 1,908 | - | 472 | 1,436 | 1,907 | |||||||||||||||||||
Corporate | - | - | - | - | (6,164 | ) | (3,641 | ) | ||||||||||||||||||
Consolidated | 16,586 | $ | 29,821 | $ | 3,707 | $ | 8,353 | $ | 11,597 | $ | 19,505 | |||||||||||||||
| 1 | Royalty revenue from Bracemac-McLeod consists of $0.7 million from copper and $0.6 million from zinc. |
The Company’s operating segments for the three months ended December 31, 2020 are summarized in the table below:
In $000s (except for ounces sold) | Product | Attributable Gold Equivalent ounces | Sales and royalty revenues | Cost of sales excluding depletion | Depletion expense | Income (loss) before taxes | Cash flows from operating activities | |||||||||||||||||||
Aurizona | Gold | 1,445 | $ | 2,716 | $ | - | $ | 226 | $ | 2,490 | $ | 2,516 | ||||||||||||||
Black Fox | Gold | 555 | 1,037 | 312 | 263 | 462 | 727 | |||||||||||||||||||
Bracemac-McLeod 1 | Various | 454 | 853 | - | 394 | 459 | 1,123 | |||||||||||||||||||
Chapada | Copper | 1,550 | 2,914 | 875 | 778 | 1,261 | 2,039 | |||||||||||||||||||
Diavik | Diamonds | 612 | 1,149 | - | 12 | 1,137 | 1,000 | |||||||||||||||||||
Fruta del Norte | Gold | 1,040 | 1,955 | - | 648 | 1,307 | 680 | |||||||||||||||||||
Houndé | Gold | 1,580 | 2,970 | - | 1,058 | 1,912 | 2,231 | |||||||||||||||||||
Karma | Gold | 834 | 1,566 | 304 | 698 | 564 | 1,104 | |||||||||||||||||||
Relief Canyon | Gold | 1,667 | 3,152 | - | 1,238 | 1,914 | 3,152 | |||||||||||||||||||
Santa Elena | Gold | 1,080 | 2,025 | 500 | 61 | 1,464 | 1,445 | |||||||||||||||||||
Yamana silver stream | Silver | 3,405 | 6,401 | 1,931 | 2,715 | 1,755 | 4,471 | |||||||||||||||||||
Other 2 | Various | 1,573 | 2,958 | - | 438 | 2,520 | 2,085 | |||||||||||||||||||
Corporate | - | - | - | - | (1,331 | ) | (2,767 | ) | ||||||||||||||||||
Consolidated | 15,795 | $ | 29,696 | $ | 3,922 | $ | 8,529 | $ | 15,914 | $ | 19,806 | |||||||||||||||
| 1 | Royalty revenue from Bracemac-McLeod consists of $0.5 million from copper and $0.4 million from zinc. |
| 2 | Includes royalty revenue from gold of $2.9 million and other base metals of $0.1 million. |
42
Three Months Ended December 31, 2021 Compared to the
Three Months Ended December 31, 2020
For the three months ended December 31, 2021, net income and cash flows from operating activities were $7.4 million and $19.5 million, respectively, compared with $10.5 million and $19.8 million for the comparable period in 2020. The decrease in net income is primarily attributable to:
| · | A $3.1 million decrease in the gains recognized on the revaluation of the Company’s investments; whereby, a loss of $0.2 million was recognized by the Company during the three months ended December 31, 2021; while during the three months ended December 31, 2020 the Company recognized a gain of $2.9 million mostly driven by an increase in the fair value of the Americas Gold convertible debenture. |
For the three months ended December 31, 2021, revenue was $29.8 million compared with $29.7 million for the comparable period in 2020. The increase is attributable to a 5% increase in Attributable Gold Equivalent Ounces sold partially offset by an 4% decrease in the average realized selling price of gold. In particular, the increase in revenue was driven by:
| · | A $3.1 million increase in revenue attributable to the Diavik mine largely due to diamond price increases, the receipt of previously unrecognized royalty payments and the timing of sales; |
| · | A $1.6 million increase in revenue attributable to the Vale Royalties, which were purchased in June 2021; and |
| · | A $1.0 million increase in revenue attributable to the Chapada copper stream primarily due to an increase in the average realized selling price of copper which increased from an average of $2.96 per pound during the three months ended December 31, 2020 to an average of $4.16 per pound during the equivalent period in 2021; |
Partially offset by:
| · | A $2.3 million decrease in revenue attributable to the Houndé Mine largely driven by a 76% decrease in the number of Attributable Gold Equivalent ounces sold. The decrease is primarily due to mine sequencing whereby Endeavour is currently mining areas of the Houndé Mine not subject to the Company’s royalty; |
43
| · | A $1.1 million decrease in revenue attributable to the Yamana silver stream primarily due to a 15% decrease in the number of silver ounces sold, as well as a decrease in the average realized selling price of silver which decreased from an average of $23.83 per ounce during the three months ended December 31, 2020 to an average of $23.05 per ounce during the equivalent period in 2021; and |
| · | A $1.0 million decrease in revenue attributable to the Karma Mine largely driven by an 64% decrease in the number of Attributable Gold Equivalent Ounces sold. The decrease is primarily due to the conclusion of the five-year fixed delivery period in accordance with the terms of the Gold Stream in the first quarter of 2021, reducing Sandstorm’s Gold Stream entitlement to 1.625% of production. In contrast, in the fourth quarter of 2020, Sandstorm’s entitlement was 1,250 ounces per quarter. |
Year Ended December 31, 2021 Compared to the
Year Ended December 31, 2020
For the year ended December 31, 2021, net income and cash flows from operating activities were $27.6 million and $81.1 million, respectively, compared with net income and cash flows from operating activities of $13.8 million and $65.6 million for the comparable period in 2020. The increase in net income is attributable to an increase in revenue (described in greater detail below) as well as:
| · | An $8.5 million decrease in non-cash impairment charges; whereby, the Company recorded a $0.4 million impairment related to certain royalties within the Company’s Other segment during the year ended December 31, 2021; while for the comparable period in 2020 the Company recorded an impairment of $8.9 million related to the Company’s Diavik royalty and certain other royalties within the Company’s Other segment; and |
| · | A $5.9 million gain on the revaluation of the Company’s financial instrument related to the Vale Royalties which was both entered into and disposed of during the year ended December 31, 2021; |
Partially offset by:
| · | An increase in tax expense of $6.8 million primarily as a result of the increase in net income; |
44
| · | A $5.5 million decrease in the gains recognized on the revaluation of the Company’s investments; whereby, a loss of $1.7 million was recognized by the Company during the year ended December 31, 2021, primarily driven by the change in fair value of the Americas Gold convertible; while during the year ended December 31, 2020 the Company recognized a gain of $3.8 million primarily driven by the change in fair value of the Company’s Equinox warrants; |
| · | A $2.8 million increase in cost of sales, excluding depletion partly due to an increase in Attributable Gold Equivalent ounces sold; and |
| · | A $2.6 million increase in depletion expense also partly due to an increase in Attributable Gold Equivalent ounces sold. |
For the year ended December 31, 2021, revenue was $114.9 million compared with $93.0 million for the comparable period in 2020. The increase is largely attributable to a 29% increase in Attributable Gold Equivalent ounces sold. In particular, the increase in revenue was driven by:
| · | A $6.3 million increase in revenue attributable to the Yamana silver stream primarily due to an increase in the average realized selling price of silver which increased from an average of $19.18 per ounce during the year ended December 31, 2020 to an average of $24.84 per ounce during the equivalent period in 2021; |
| · | A $5.2 million increase in revenue attributable to the Chapada copper stream primarily due to an increase in the average realized selling price of copper which increased from an average of $2.73 per pound during the year ended December 31, 2020 to an average of $4.04 per pound during the equivalent period in 2021; |
| · | A $4.9 million increase in royalty revenue attributable to the Diavik mine largely due to diamond price increases and the timing of sales; |
| · | A $4.4 million increase in revenue attributable to the Vale Royalties, which was acquired in June 2021; |
| · | A $3.4 million increase in sales revenue attributable to the Relief Canyon Gold Stream which commenced making fixed deliveries to Sandstorm in May 2020; |
| · | A $3.1 million increase in revenue attributable to the Fruta del Norte Mine largely driven by a 96% increase in the Attributable Gold Equivalent ounces sold. The increase in ounces is attributable to the fact that during the year |
45
ended December 31, 2020, production at Fruta del Norte was impacted by a temporary suspension of operations due to concerns over the spread of COVID-19 as well as the initial ramp up to commercial production; whereas in the comparable period in 2021, the mine was operating with fewerCOVID-19 related disruptions and with the benefit of optimization efforts undertaken in 2021 by Lundin Gold; and |
| · | A $2.5 million increase in royalty revenue attributable to the Bracemac-McLeod mine largely due to commodity price increases; |
Partially offset by:
| · | A $4.9 million decrease in revenue attributable to the Houndé Mine largely driven by a 56% decrease in the number of Attributable Gold Equivalent ounces sold. The decrease is primarily due to mine sequencing whereby Endeavour is currently mining areas of the Houndé mine not subject to the Company’s royalty; and |
| · | A $4.1 million decrease in revenue attributable to the Karma Mine largely driven by a 51% decrease in the number of gold ounces sold. The decrease is primarily due to the conclusion of the five-year fixed delivery period in accordance with the terms of the Gold Stream in the first quarter of 2021, reducing Sandstorm’s Gold Stream entitlement to 1.625% of production. In contrast, during the year ended December 31, 2020, Sandstorm’s entitlement was 1,250 ounces per quarter. |
Three Months Ended December 31, 2021 Compared to the
Other Quarters Presented
When comparing net income of $7.4 million and cash flow from operating activities of $19.5 million for the three months ended December 31, 2021 with net income/loss and cash flow from operating activities for the other quarters presented, the following items impact comparability:
| · | An $8.9 million non-cash impairment charge relating to the Company’s Diavik royalty and certain other royalties within its Other segment was recognized during the three months ended March 31, 2020. |
| · | A $5.9 million gain on the revaluation of the Company’s financial instrument related to the Vale Royalties which was both entered into and disposed of during the three months ended June 30, 2021. |
46
| · | A $2.4 million non-cash impairment charge relating to the Company’s Diavik royalty was recognized during the three months ended December 31, 2019. |
| · | The Company recognized gains and losses with respect to the revaluation of its investments, which were primarily driven by changes in the fair value of the Equinox and Americas Gold convertible debentures. These gains/losses were recognized as follows: |
| ◾ | During the three months ended December 31, 2021, a loss of $0.2 million was recognized; |
| ◾ | During the three months ended September 30, 2021, a gain of $0.2 million was recognized; |
| ◾ | During the three months ended June 30, 2021, a gain of $0.1 million was recognized; |
| ◾ | During the three months ended March 31, 2021, a loss of $1.8 million was recognized; |
| ◾ | During the three months ended December 31, 2020, a gain of $2.9 million was recognized; |
| ◾ | During the three months ended September 30, 2020, a gain of $1.7 million was recognized; |
| ◾ | During the three months ended June 30, 2020, a gain of $5.1 million was recognized; and |
| ◾ | During the three months ended March 31, 2020, a loss of $5.9 million was recognized. |
| · | With the exception of 2020, Attributable Gold Equivalent ounces had seen an overall increase as a result of the acquisition of various assets including the Vale Royalty acquisition during the three months ended June 30, 2021, the Houndé royalty acquisition during the three months ended March 31, 2018, the Teck Resources Limited royalty package which consists of 52 royalties and was purchased during the three months ended March 31, 2016 and the Yamana silver stream and Chapada copper stream which were acquired in the three months ended December 31, 2015. In 2020, Attributable Gold Equivalent ounces decreased as a result of COVID-19 related temporary suspensions at the mines from which Sandstorm receives royalty revenue or deliveries under its Streams. |
Change in Total Assets
Total assets decreased by $20.1 million from September 30, 2021 to December 31, 2021 as a result of (i) repurchases of the Company’s shares in accordance with its normal course issuer bid; (ii) depletion expense; and (iii) a decrease in the Hod Maden interest due to the depreciation of the Turkish Lira, which is the functional currency of the entity that holds the Hod Maden interest, relative to the U.S. dollar, which is the presentation currency of Sandstorm Gold Ltd; partially offset by cash flow from operating activities. The depreciation in the Turkish Lira as well as a decrease in the valuation of investments were largely responsible for the losses recognized
47
through other comprehensive income for the three months ended December 31, 2021. Total assets decreased by $7.8 million from June 30, 2021 to September 30, 2021 as a result of (i) repurchases of the Company’s shares in accordance with its normal course issuer bid; (ii) depletion expense; (iii) a decrease in the valuation of investments; and (iv) a decrease in the Hod Maden interest due to the depreciation of the Turkish Lira; partially offset by cash flow from operating activities. The depreciation in the Turkish Lira as well as a decrease in the valuation of investments were largely responsible for the losses recognized through other comprehensive income for the three months ended September 30, 2021. Total assets increased by $10.1 million from March 31, 2021 to June 30, 2021 as a result of cash flow from operating activities partially offset by (i) a decrease in the Hod Maden interest due to the depreciation of the Turkish Lira; and (ii) depletion expense. The depreciation in the Turkish Lira as well as a decrease in the valuation of investments were largely responsible for the losses recognized through other comprehensive income for the three months ended June 30, 2021. Total assets decreased by $11.3 million from December 31, 2020 to March 31, 2021 as a result of (i) a decrease in the valuation of investments; (ii) a decrease in the Hod Maden interest due to the depreciation of the Turkish Lira; (iii) depletion expense and (iv) repurchases of the Company’s shares in accordance with its normal course issuer bid; partially offset by cash flow from operating activities. The depreciation in the Turkish Lira as well as a decrease in the valuation of investments were largely responsible for the losses recognized through other comprehensive income for the three months ended March 31, 2021. Total assets increased by $41.2 million from September 30, 2020 to December 31, 2020 as a result of (i) cash flow from operating activities and (ii) an increase in the Hod Maden interest due to the appreciation of the Turkish Lira; partially offset by depletion expense. The appreciation in the Turkish Lira as well as an increase in the valuation of investments were largely responsible for the gains recognized through other comprehensive income for the three months ended December 31, 2020. Total assets increased by $1.3 million from June 30, 2020 to September 30, 2020 as a result of cash flow from operating activities; partially offset by (i) a decrease in the Hod Maden interest due to a devaluation of the Turkish Lira; and (ii) depletion expense. The depreciation in the Turkish Lira was largely responsible for the loss recognized through other comprehensive income for the three months ended September 30, 2020. Total assets increased by $31.2 million from March 31, 2020 to June 30, 2020 as a result of (i) $50.3 million in cash received upon the exercise of warrants as a result of the early warrant exercise incentive program; and (ii) an increase in the valuation of investments; partially offset by (i) a decrease in the Hod Maden interest due to a devaluation of the Turkish Lira; and (ii) depletion expense. The depreciation in the Turkish Lira, partially offset by the increase in the valuation of investments, was largely responsible for the loss recognized through other comprehensive income for the three months ended June 30, 2020.
48
Non-IFRS
and Other MeasuresThe Company has included, throughout this document, certain performance measures, including (i) total sales, royalties and income from other interests, (ii) average cash cost per Attributable Gold Equivalent ounce, (iii) average realized gold price per Attributable Gold Equivalent ounce, (iv) cash operating margin, (v) cash flows from operating activities excluding changes in
non-cash
working capital and(vi) all-in
sustaining cost (“AISC”) per gold ounce on aby-product
basis. The presentation of thesenon-IFRS
measures is intended to provide additional information and should not be considered in isolation or as a substitute for measures of performance prepared in accordance with IFRS. Thesenon-IFRS
measures do not have any standardized meaning prescribed by IFRS, and other companies may calculate these measures differently.| i. | Total Sales, Royalties and Income from Other Interests is a new non-IFRS measure in the year and is calculated by taking total revenue which includes Sales and Royalty Revenue, and adding contractual income relating to royalties, streams and other interests excluding gains and losses on dispositions. The Company presents Total Sales, Royalties and Income from other interests as it believes that certain investors use this information to evaluate the Company’s performance in comparison to other streaming and royalty companies in the precious metals mining industry.Figure 1.1 |
Figure 1.1 | ||||||||||||||||
In $000s | 3 Months Ended Dec. 31, 2021 | 3 Months Ended Dec. 31, 2020 | Year Ended Dec. 31, 2021 | Year Ended Dec. 31, 2020 | ||||||||||||
Total Revenue | $ | 29,821 | $ | 29,696 | $ | 114,860 | $ | 93,025 | ||||||||
Add: | ||||||||||||||||
Gain on revaluation of Vale Royalties financial instrument 1 | - | - | 5,887 | - | ||||||||||||
Equals: | ||||||||||||||||
Total Sales, Royalties, and Income from other interests | $ | 29,821 | $ | 29,696 | $ | 120,747 | $ | 93,025 | ||||||||
| 1 | During the year ended December 31, 2021, the Company entered into and disposed of certain derivative financial instruments relating to the market value of the Vale Royalties, resulting in fair value gains of $5.9 million recognized within net income. |
| ii. | Average cash cost per Attributable Gold Equivalent ounce is calculated by dividing the Company’s cost of sales, excluding depletion by the number of Attributable Gold Equivalent ounces. The Company presents average cash cost per Attributable Gold Equivalent ounce as it believes that certain investors use this information to evaluate the Company’s performance in comparison to other streaming and royalty companies in the precious metals mining industry who present results on a similar basis. Figure 1.2 |
49
Figure 1.2 | ||||||||||||||||
In $000s (except for ounces and per ounce amounts) | 3 Months Ended Dec. 31, 2021 | 3 Months Ended Dec. 31, 2020 | Year Ended Dec. 31, 2021 | Year Ended Dec. 31, 2020 | ||||||||||||
Cost of Sales, excluding depletion 1 | $ | 3,707 | $ | 3,922 | $ | 16,845 | $ | 14,046 | ||||||||
Divided by: | ||||||||||||||||
Total Attributable Gold Equivalent ounces 2 | 16,586 | 15,795 | 67,548 | 52,176 | ||||||||||||
Equals: | ||||||||||||||||
Average cash cost (per Attributable Gold Equivalent ounce) | $ | 224 | $ | 248 | $ | 249 | $ | 269 | ||||||||
| 1 | Cost of Sales, excluding depletion, includes cash payments made for Gold Equivalent ounces associated with commodity streams. |
| 2 | The Company’s royalty and other commodity stream revenue, including adjustments for contractual income relating to those interests (see item i above), is converted to an Attributable Gold Equivalent ounce basis by dividing the royalty and other commodity revenue, including adjustments for contractual income relating to those interests, for that period by the average realized gold price per ounce from the Company’s Gold Streams for the same respective period. These Attributable Gold Equivalent ounces, when combined with the gold ounces sold from the Company’s Gold Streams, equal total Attributable Gold Equivalent ounces. |
| iii. | Average realized gold price per Attributable Gold Equivalent ounce is calculated by dividing the Company’s Total Sales, Royalties, and Income from other interests (described further in item i above) by the number of Attributable Gold Equivalent ounces. The Company presents average realized gold price per Attributable Gold Equivalent ounce as it believes that certain investors use this information to evaluate the Company’s performance in comparison to other streaming and royalty companies in the precious metals mining industry that present results on a similar basis. Figure 1.3 |
Figure 1.3 | ||||||||||||||||
In $000s (except for ounces and per ounce amounts) | 3 Months Ended Dec. 31, 2021 | 3 Months Ended Dec. 31, 2020 | Year Ended Dec. 31, 2021 | Year Ended Dec. 31, 2020 | ||||||||||||
Total Sales, Royalties, and Income from other interests 1 | $ | 29,821 | $ | 29,696 | $ | 120,747 | $ | 93,025 | ||||||||
Divided by: | ||||||||||||||||
Total Attributable Gold Equivalent ounces | 16,586 | 15,795 | 67,548 | 52,176 | ||||||||||||
Equals: | ||||||||||||||||
Average realized gold price (per Attributable Gold Equivalent ounce) | $ | 1,798 | $ | 1,880 | $ | 1,788 | $ | 1,783 | ||||||||
| 1 | Prior to June 30, 2021, average realized gold price was calculated by dividing Total Revenue, rather than Total Sales, Royalties and Income from other interests, by Total Attributable Gold Equivalent ounces. The change in the measure did not result in a change to prior periods. |
50
| iv. | Cash operating margin is calculated by subtracting the average cash cost per Attributable Gold Equivalent ounce from the average realized gold price per Attributable Gold Equivalent ounce. The Company presents cash operating margin as it believes that certain investors use this information to evaluate the Company’s performance in comparison to other streaming and royalty companies in the precious metals mining industry that present results on a similar basis. |
| v. | Cash flows from operating activities excluding changes in non-cash working capital is calculated by adding back the decrease or subtracting the increase in changes innon-cash working capital to or from cash provided by (used in) operating activities. The Company presents cash flows from operating activities excluding changes innon-cash working capital as it believes that certain investors use this information to evaluate the Company’s performance in comparison to other streaming and royalty companies in the precious metals mining industry that present results on a similar basis.Figure 1.4 non-cash working capital. |
Figure 1.4 | ||||||||||||||||
In $000s | 3 Months Ended Dec. 31, 2021 | 3 Months Ended Dec. 31, 2020 | Year Ended Dec. 31, 2021 | Year Ended Dec. 31, 2020 | ||||||||||||
Cash flows from operating activities | $ | 19,505 | $ | 19,806 | $ | 81,139 | $ | 65,616 | ||||||||
Add: | ||||||||||||||||
Changes in non-cash working capital | 2,586 | 2,725 | 2,341 | 2,722 | ||||||||||||
Equals: | ||||||||||||||||
Cash flows from operating activities excluding changes in non-cash working capital | $ | 22,091 | $ | 22,531 | $ | 83,480 | $ | 68,338 | ||||||||
| vi. | The Company has also used the non-IFRS measure ofall-in sustaining cost per gold ounce on aby-product basis. With respect to the Hod Maden project,all-in sustaining cost per gold ounce on aby-product basis is calculated by deducting copper revenue from the summation of certain costs (operating costs, royalties, treatment, refining & transport costs, sustaining capital, G&A, and other costs). The resulting figure is then divided by the payable gold ounces produced. The Company presentsall-in sustaining cost per gold ounce on aby-product basis as it believes that certain investors use this information to evaluate the Company’s performance in comparison to other companies in the precious metals mining industry that present results on a similar basis. The calculation of the measure is shown below. |
[Operating Costs ($678 million) + Royalties ($349 million) + Treatment, Refining and Transport Costs ($193 million) + Sustaining Capital ($116 million) + G&A ($96 million) + Other Costs ($57 million) - Copper Revenue ($812 million)] / Payable Gold Ounces (2,027k oz) = $334 AISC per ounce.
51
Liquidity and Capital Resources
As of December 31, 2021, the Company had cash and cash equivalents of $16.2 million (December 31, 2020 — $113.8 million) and working capital (current assets less current liabilities) of $26.3 million (December 31, 2020 — $120.9 million). As of the date of the MD&A, the Company has no bank debt and the entire $350 million revolving credit facility remains available for future acquisitions and general corporate purposes.
During the year ended December 31, 2021, the Company generated cash flows from operating activities of $81.1 million compared with $65.6 million during the comparable period in 2020. When comparing the change, the primary drivers were an increase in the number of Attributable Gold Equivalent ounces sold and an increase in the average realized selling price of silver and copper.
During the year ended December 31, 2021, the Company had net cash outflows from investing activities of $143.9 million which were primarily the result of (i) the acquisition of stream, royalty and other interests including the Vale Royalties, the Vatukoula Gold Stream, and other royalties; and (ii) the acquisition of $13.0 million in investments and other; partially offset by $22.4 million of proceeds from the sale and redemption of a portion of the Company’s debt and equity investments. During the year ended December 31, 2020, the Company had net cash inflows from investing activities of $33.7 million which were primarily the result of the proceeds from the sale and redemption of a portion of the Company’s debt and equity investments including the Company’s convertible debenture due from Equinox; partially offset by (i) the acquisition of $15.9 million in investments and other and (ii) a $3.3 million investment in the Company’s Hod Maden interest.
During the year ended December 31, 2021, the Company had net cash outflows from financing activities of $34.2 million primarily related to the redemption of the Company’s common shares under the Company’s normal course issuer bid (“NCIB”). During the year ended December 31, 2020, the Company had net cash inflows from financing activities of $7.7 million primarily related to (i) a $41.0 million draw down on its revolving credit facility and (ii) $77.6 million in proceeds from the exercise of warrants and stock options; partially offset by (i) the subsequent repayment of $86.0 million under the same revolving credit facility as well as $1.4 million in related interest expense; and (ii) $23.5 million related to the redemption of the Company’s common shares under the NCIB.
52
Commitments and Contingencies
In connection with its Streams, the Company has committed to purchase the following:
Stream | % of Life of Mine Gold or Relevant Commodity 5,6,7,8,9,10 | Per Ounce Cash Payment: lesser of amount below and the then prevailing market price of commodity (unless otherwise noted) 1, 2, 3,4 | ||
Black Fox | 8% | $577 | ||
Chapada | 4.2% | 30% of copper spot price | ||
Entrée | 5.62% on Hugo North Extension and 4.26% on Heruga | $220 | ||
Karma | 1.625% | 20% of gold spot price | ||
Relief Canyon | 32,022 ounces over 5.5 years and 4% thereafter | Varies | ||
Santa Elena | 20% | $468 | ||
Vatukoula | 25,920 ounces over 5.5 years and 2.9% thereafter | 20% of gold spot price | ||
Yamana silver stream | 20% | 30% of silver spot price | ||
| 1 | Subject to an annual inflationary adjustment. |
| 2 | For the Relief Canyon stream, after receipt of 32,022 gold ounces (the cost of which is nil), the Company is entitled to purchase 4.0% of the gold and silver produced from the Relief Canyon Mine for ongoing per ounce cash payments equal to 30%–65% of the spot price of gold or silver, with the range dependent on the concession’s existing royalty obligations. |
| 3 | For the Entrée Gold Stream, after approximately 8.6 million ounces of gold have been produced from the joint venture property, the price increases to $500 per gold ounce. |
| 4 | For the Entrée silver stream, percentage of life of mine is 5.62% on Hugo North Extension and 4.26% on Heruga which the Company can purchase for the lesser of the prevailing market price and $5 per ounce of silver until 40.3 million ounces of silver have been produced from the entire joint venture property. Thereafter, the purchase price will increase to the lesser of the prevailing market price and $10 per ounce of silver. |
| 5 | For the Entrée Gold and silver stream, percentage of life of mine is 5.62% on Hugo North Extension and 4.26% on Heruga if the minerals produced are contained below 560 metres in depth. |
| 6 | For the Entrée Gold and silver stream, percentage of life of mine is 8.43% on Hugo North Extension and 6.39% on Heruga if the minerals produced are contained above 560 metres in depth. |
| 7 | For the Entrée copper stream, the Company has committed to purchase an amount equal to 0.42% of the copper produced from the Hugo North Extension and Heruga deposits. If the minerals produced are contained above 560 metres in depth, then the commitment increases to 0.62% for both the Hugo North Extension and Heruga deposits. Sandstorm will make ongoing per pound cash payments equal to the lesser of $0.50 and the then prevailing market price of copper, until 9.1 billion pounds of copper have been produced from the entire joint venture property. Thereafter, the ongoing per pound payments will increase to the lesser of $1.10 and the then prevailing market price of copper. |
| 8 | For the Chapada copper stream, the Company has committed to purchase an amount equal to 4.2% of the copper produced (up to an annual maximum of 3.9 million pounds of copper) until the mine has delivered 39 million pounds of copper to Sandstorm; then 3.0% of the copper produced until, on a cumulative basis, the mine has delivered 50 million pounds of copper to Sandstorm; then 1.5% of the copper produced thereafter, for the life of the mine. |
| 9 | Under the terms of the Yamana silver stream, Sandstorm has agreed to purchase an amount of silver from Cerro Moro equal to 20% of the silver produced (up to an annual maximum of 1.2 million ounces of silver), until Yamana has delivered to Sandstorm 7.0 million ounces of silver; then 9.0% of the silver produced thereafter. |
| 10 | Under the terms of the Vatukoula stream, after receipt of 25,920 gold ounces (the cost of which is 20% of the spot price), the Company is entitled to purchase 2.9% for the first 100,000 ounces of gold produced in a calendar year, and 2.55% for the volume of production above 100,000 ounces. |
53
As previously disclosed, Sandstorm became aware that a third party commenced legal proceedings against it in a Brazilian court. The proceedings involve severance owed to former employees of Colossus Mineração Ltda., a Brazilian subsidiary company of Colossus Minerals Inc. (an entity with which Sandstorm entered into a Stream). Since these severance claims, estimated to be approximately $8 million, remain outstanding, the claimants are seeking to recoup their claims from Sandstorm. Sandstorm intends on defending itself as it believes the case is without merit.
Subject to certain milestones, the Company has $3 million remaining to remit with respect to the Vatukoula Gold Stream agreement. The Vatukoula Gold Stream is further discussed in the Key Producing Assets section of this MD&A.
Sandstorm entered into an agreement to subscribe for shares of Americas Gold in an amount up to $10.8 million in 2022, at the option of Americas Gold.
In December 2021, the Company announced a $60 million financing package with Bear Creek Mining to facilitate its acquisition of the producing Mercedes gold-silver mine in Mexico from Equinox Gold Corp. The financing package includes a $37.5 million Gold Stream and a $22.5 million convertible debenture. The transaction is expected to close by March 31, 2022 and gold deliveries to Sandstorm will commence immediately thereafter.
Share Capital
As of February 17, 2022, the Company had 191,807,882 common shares outstanding. As disclosed previously, the funds from the issuance of share capital have been used to finance the acquisition of Streams and royalties (recent acquisitions are described earlier in greater detail) and pay down debt.
Under the Company’s NCIB, the Company is able, until April 6, 2022, to purchase up to 19.1 million common shares. The NCIB provides the Company with the option to purchase its common shares from time to time. Under the Company’s previous and current NCIB and during the year ended December 31, 2021, the Company purchased and cancelled approximately 5.5 million common shares for $34.2 million.
The Company has anequity program (the “ATM Program”) whereby it is permitted to issue up to an aggregate of $140 million worth of common shares from treasury at prevailing market prices to the public through the Toronto Stock Exchange, the New York Stock Exchange, or any other marketplace on which the common shares are listed, quoted or otherwise trade. The volume and timing of distributions under the ATM Program is determined at the Company’s sole discretion,
at-the-market
54
subject to applicable regulatory limitations. The ATM Program is effective until May 2022, unless terminated prior to such date by the Company.
To-date,
the Company has not utilized or sold any shares under the ATM Program.In December 2021 the Company declared its inaugural dividend of CAD$0.02 per share. The full amount of the dividend of $3.1 million was paid in cash in January 2022.
A summary of the Company’s share purchase options as of February 17, 2022 is as follows:
Year of expiry | Number outstanding | Vested | Exercise price per share (range) (CAD) 1 | Weighted average exercise price per share (CAD) 1 | ||||
2022 | 760,582 | 760,582 | 5.50–15.00 | 5.53 | ||||
2023 | 3,118,332 | 3,118,332 | 5.92 | 5.92 | ||||
2024 | 1,427,000 | 951,338 | 8.89 | 8.89 | ||||
2025 | 2,812,000 | 937,340 | 9.43 | 9.43 | ||||
2026 | 2,968,000 | - | 7.18 | - | ||||
11,085,914 | 5,767,592 | 6.93 | ||||||
1 | Weighted average exercise price of options that are exercisable. |
As of February 17, 2022, the Company had 1,991,500 restricted share rights outstanding.
Key Management Compensation
The remuneration of directors and those persons having authority and responsibility for planning, directing, and controlling activities of the Company is as follows:
In $000s | Year Ended December 31, 2021 | Year Ended December 31, 2020 | ||||||
Salaries and benefits | $ | 2,588 | $ | 1,561 | ||||
Share-based payments | 4,368 | 4,068 | ||||||
Total key management compensation expense | $ | 6,956 | $ | 5,629 | ||||
55
Financial Instruments
The Company’s financial instruments consist of cash and cash equivalents, trade receivables and other, short-term and long-term investments, loans receivable which are included in other current assets, and trade and other payables. The Company’s short and long-term investments are initially recorded at fair value and subsequently revalued to their fair market value at each period end based on inputs such as equity prices. Investments are acquired for strategic purposes and may be disposed of from time to time. The fair value of the Company’s other financial instruments, which include cash and cash equivalents, trade receivables and other, loans receivable which are included in other assets, and trade and other payables, approximate their carrying values at December 31, 2021.
Credit Risk
The Company’s credit risk is limited to cash and cash equivalents, loans receivable which are included in other assets, trade and other receivables and the Company’s investments in convertible debentures. The Company’s trade and other receivables are subject to the credit risk of the counterparties who own and operate the mines underlying Sandstorm’s royalty portfolio. In order to mitigate its exposure to credit risk, the Company closely monitors its financial assets and maintains its cash deposits in several high-quality financial institutions. The impact of expected credit losses on trade receivables and financial assets held at amortized cost is not material.
Currency Risk
Financial instruments that impact the Company’s net income (loss) or other comprehensive income (loss) due to currency fluctuations include cash and cash equivalents, trade and other receivables and trade and other payables denominated in Canadian dollars. Based on the Company’s Canadian dollar denominated monetary assets and monetary liabilities at December 31, 2021, a 10% increase (decrease) of the value of the Canadian dollar relative to the United States dollar would not have a material impact on net income or other comprehensive income.
Other Risks
Sandstorm holds common shares, convertible debentures, warrants and investments of other companies with a combined fair market value as at December 31, 2021 of $24.1 million (December 31, 2020 — $46.9 million). In addition, Sandstorm also
56
holds common shares of Entrée with a fair value as at December 31, 2021 of $31.7 million which are classified as an investment in associate and accounted for using the equity method. The daily exchange traded volume of these shares, including the shares underlying the warrants, may not be sufficient for the Company to liquidate its position in a short period of time without potentially affecting the market value of the shares. The Company is subject to default risk with respect to any debt instruments. The Company is exposed to equity price risk as a result of holding these investments in other mining companies. The Company does not actively trade these investments. Based on the Company’s investments held as at December 31, 2021, a 10% increase (decrease) in the equity prices of these investments would not have a material impact on net income and would increase (decrease) other comprehensive income by $2.1 million.
Other Risks to Sandstorm
The primary risk factors affecting the Company are set forth below. For additional discussion of risk factors, please refer to the Company’s Annual Information Form dated March 30, 2021, which is available on www.sedar.com.
The Chapada Mine, the Cerro Moro Mine, the Diavik Mine, the Aurizona Mine, the Fruta del Norte Mine, the Relief Canyon Mine, the Santa Elena Mine, the Karma Mine, the Ming Mine, the Black Fox Mine, the Hugo North Extension and Heruga deposits, the Mt. Hamilton Project, the Gualcamayo Mine, the Emigrant Springs Mine, the Thunder Creek Mine, MWS, HM Claim, Triangle Zone, the Prairie Creek Project, the Bracemac-McLeod Mine, the Hod Maden Project, the Hackett River Project, the Lobo-Marte Project, Agi Dagi and Kirazli, the Houndé Mine, Vatukoula Mine, the Vale Royalty Package, the Mercedes Mine, and other royalties and commodity streams in Sandstorm’s portfolio are hereafter referred to as the “Mines”.
Risks Relating to Mineral Projects
To the extent that they relate to the production of gold or an applicable commodity from, or the operation of, the Mines, the Company will be subject to the risk factors applicable to the operators of such Mines. Whether the Mines will be commercially viable depends on a number of factors, including cash costs associated with extraction and processing, the particular attributes of the deposit, such as size, grade, and proximity to infrastructure, as well as metal prices which are highly cyclical and government regulations, including regulations relating to prices, taxes, royalties, land tenure, land use, importing and exporting of minerals and environmental protection. The Mines are also subject to other risks that could lead to their shutdown and
57
closure including flooding and weather related events, the failure to receive permits or having existing permits revoked, collapse of mining infrastructure including tailings pond, as well as community or social related issues. The exact effect of these factors cannot be accurately predicted, but the combination of these factors may result in the Mines becoming uneconomic resulting in their shutdown and closure. The Company is not entitled to purchase gold, other commodities, receive royalties or receive economic benefit from its interest in the Hod Maden Project, if no gold or applicable commodity is produced from the Mines.
No Control Over Mining Operations
With respect to its Streams and royalties, the Company has no contractual rights relating to the operation or development of the Mines. Except for any payments which may be payable in accordance with applicable completion guarantees or cash flow guarantees, the Company will not be entitled to any material compensation if these mining operations do not meet their forecasted gold or other production targets in any specified period or if the Mines shut down or discontinue their operations on a temporary or permanent basis. The Mines may not commence commercial production within the time frames anticipated, if at all, and there can be no assurance that the gold or other production from such properties will ultimately meet forecasts or targets. At any time, any of the operators of the Mines or their successors may decide to suspend or discontinue operations. The Company is subject to the risk that the Mines shut down on a temporary or permanent basis due to issues including, but not limited to economics, lack of financial capital, floods, fire, mechanical malfunctions, social unrest, expropriation, and other risks. There are no guarantees the Mines will achieve commercial production,
ramp-up
targets, or complete expansion plans. These issues are common in the mining industry and can occur frequently.Government Regulations
The Mines are subject to various foreign laws and regulations governing prospecting, exploration, development, production, exports, taxes, labour standards, waste disposal, protection and remediation of the environment, reclamation, historic and cultural resources preservation, mine safety and occupational health, handling, storage and transportation of hazardous substances and other matters. It is possible that the risks of expropriation, cancellation or dispute of licenses could result in substantial costs, losses, and liabilities in the future. The costs of discovering, evaluating, planning, designing, developing, constructing, operating, and closing the Mines in compliance with such laws and regulations are significant. It is possible that the costs and delays associated with compliance of such laws and regulations
58
could become such that the owners or operators of the Mines would not proceed with the development of or continue to operate the Mines. Moreover, it is possible that future regulatory developments, such as increasingly strict environmental protection laws, regulations, and enforcement policies thereunder, and claims for damages to property and persons resulting from the Mines could result in substantial costs and liabilities in the future.
International Operations
The operations with respect to the Company’s gold, other precious metals and other interests are conducted in Canada, Mexico, the United States, Mongolia, Burkina Faso, Ecuador, South Africa, Ghana, Botswana, Cote D’Ivoire, Argentina, Brazil, Chile, Peru, Egypt, Ethiopia, Guyana, Paraguay, French Guiana, Turkey, Sweden, Fiji and Australia and as such, the Mines are exposed to various levels of political, economic and other risks and uncertainties. These risks and uncertainties include, but are not limited to, terrorism, international sanctions, hostage taking, military repression, crime, political instability, currency controls, extreme fluctuations in currency exchange rates, high rates of inflation, labour unrest, the risks of war or civil unrest, expropriation and nationalization, renegotiation or nullification of existing concessions, licenses, permits, approvals and contracts, illegal mining, changes in taxation policies, restrictions on foreign exchange and repatriation, changing political conditions, and governmental regulations. Changes, if any, in mining or investment policies or shifts in political attitude may adversely affect the operations or profitability of the Mines in these countries. Operations may be affected in varying degrees by government regulations with respect to, but not limited to, restrictions on production, price controls, export controls, currency remittance, income taxes, expropriation of property, foreign investment, maintenance of claims, environmental legislation, land use, land claims of local people, water use, mine safety and the rewarding of contracts to local contractors or require foreign contractors to employ citizens of, or purchase supplies from, a particular jurisdiction. Any adverse developments with respect to Lidya, its cooperation or in its exploration, development, permitting and operation of the Hod Maden Project in Turkey may adversely affect the Company’s 30% net profits interest in the project. There are no assurances that the Company will be able to successfully convert its 30% interest in the Hod Maden Project into a commodity stream or royalty nor are there any assurances that the Company may be able to maintain its interest in Hod Maden if sanctions are imposed on Turkey or Lidya and its related entities. Any changes or unfavorable assessments with respect to (i) the validity, ownership, or existence of the Entrée concessions; as well as (ii) the validity or enforceability of Entrée’s joint venture agreement with Oyu Tolgoi LLC may adversely affect the Company’s profitability or profits realized under the Entrée Stream and the Entrée investment
59
in associate. The Serra Pelada royalty cash flow or profitability may be adversely impacted if the Cooperative de Mineração dos Garimpeiros de Serra Pelada, which hold a 25% interest in the Serra Pelada Mine, continue to take unfavorable actions. In addition, Colossus Minerals Inc.’s Brazilian subsidiary has payables in excess of $30 million and accordingly, there is a risk that they may be unable to repay their debts, resulting in insolvency and loss of any rights to the Serra Pelada mine. A failure to comply strictly with applicable laws, regulations and local practices relating to mineral right applications and tenure, could result in loss, reduction or expropriation of entitlements, or the imposition of additional local or foreign parties as joint venture partners with carried or other interests. The occurrence of these various factors and uncertainties cannot be accurately predicted and could have an adverse effect on the Mines.
Income Taxes
No assurance can be given that new taxation rules will not be enacted or that existing rules will not be applied in a manner which could result in the Company’s past and future profits being subject to increased levels of income tax. The Company’s prior years’ Canadian tax returns may be audited by the Canada Revenue Agency (“CRA”), and no assurances can be given that tax matters, if they so arise, will be resolved favorably. The CRA completed an audit of Sandstorm Gold Ltd.’s 2009 — June 2015 tax returns and issued a corresponding finalization letter in February 2019. Based on the letter received, there would be no adverse implications for the Company’s financial statements if the Company accepted the CRA’s proposed adjustments. The majority of the Company’s Streams and royalties have been entered into directly by Canadian based subsidiaries and are therefore subject to Canadian tax.
Commodity Prices for Metals Produced from the Mines
The price of the Company’s common shares and the Company’s financial results may be significantly adversely affected by a decline in the price of gold, silver, copper, and/or iron ore (collectively, the “Metals”). The price of the Metals fluctuates widely, especially in recent years, and is affected by numerous factors beyond the Company’s control, including but not limited to, the sale or purchase of the Metals by various central banks and financial institutions, interest rates, exchange rates, inflation or deflation, fluctuation in the value of the U.S. dollar and foreign currencies, global and regional supply and demand, and the political and economic conditions of major gold, silver, copper and iron ore producing countries throughout the world.
60
In the event that the prevailing market price of the Metals are at or below the price at which the Company can purchase such commodities pursuant to the terms of the Stream agreements associated with the metal interests, the Company will not generate positive cash flow or earnings. Declines in market prices could cause an operator to reduce, suspend or terminate production from an operating project or construction work at a development project, which may result in a temporary or permanent reduction or cessation of revenue from those projects, and the Company might not be able to recover the initial investment in Streams and royalties.
Diamond Prices and Demand for Diamonds
The price of the Company’s common shares and the Company’s financial results may be significantly adversely affected by a decline in the price and demand for diamonds. Diamond prices fluctuate and are affected by numerous factors beyond the control of the Company, including worldwide economic trends, worldwide levels of diamond discovery and production, and the level of demand for, and discretionary spending on, luxury goods such as diamonds. Low or negative growth in the worldwide economy, renewed or additional credit market disruptions, natural disasters or the occurrence of terrorist attacks or similar activities creating disruptions in economic growth could result in decreased demand for luxury goods such as diamonds, thereby negatively affecting the price of diamonds. Similarly, a substantial increase in the worldwide level of diamond production or the release of stocks held back during recent periods of lower demand could also negatively affect the price of diamonds. In each case, such developments could have a material adverse effect on the Company’s results of operations.
Information Systems and Cyber Security
The Company’s information systems, and those of its counterparties under the precious metal purchase agreements and vendors, are vulnerable to an increasing threat of continually evolving cybersecurity risks. Unauthorized parties may attempt to gain access to these systems or the Company’s information through fraud or other means of deceiving the Company’s counterparties.
The Company’s operations depend, in part, on how well the Company and its suppliers, as well as counterparties under the commodity purchase and royalty agreements, protect networks, equipment, information technology systems and software against damage from a number of threats. The failure of information systems or a component of information systems could, depending on the nature of any such failure, adversely impact the Company’s reputation and results of operations.
61
Although to date the Company has not experienced any material losses relating to cyber-attacks or other information security breaches, there can be no assurance that the Company will not incur such losses in the future. The Company’s risk and exposure to these matters cannot be fully mitigated because of, among other things, the evolving nature of these threats. As a result, cyber security and the continued development and enhancement of controls, processes and practices designed to protect systems, computers, software, data and networks from attack, damage or unauthorized access remain an area of attention.
Key Management
The Company is dependent upon the services of a small number of key management personnel who are highly skilled and experienced. The Company’s ability to manage its activities will depend in large part on the efforts of these individuals. The Company faces intense competition for qualified personnel, and there can be no assurance that the Company will be able to attract and retain such personnel. The loss of the services of one or more of such key management personnel could have a material adverse effect on the Company.
Environmental
All phases of mining and exploration operations are subject to environmental regulation pursuant to a variety of government laws and regulations. Environmental legislation is becoming stricter, with increased fines and penalties for
non-compliance,
more stringent environmental assessments of proposed projects and heightened responsibility for companies and their officers, directors, and employees. Continuing issues with tailings dam failures at other companies’ operations may increase the likelihood that these stricter standards and enforcement mechanisms will be implemented in the future. There can be no assurance that possible future changes in environmental regulation will not adversely affect the operations at the Mines, and consequently, the results of Sandstorm’s operations. Failure by the operators of the Mines to comply with these laws, regulations and permitting requirements may result in enforcement actions, including orders issued by regulatory or judicial authorities causing operations to cease or be curtailed, and may include corrective measures requiring capital expenditures, installation of additional equipment, or remedial actions. The occurrence of any environmental violation or enforcement action may have an adverse impact on the operations at the Mines, Sandstorm’s reputation and could adversely affect Sandstorm’s results of operations.62
Government regulation relating to emission levels (such as carbon taxes) and energy efficiency is becoming more prevalent and stringent. While some of the costs associated with reducing emissions may be offset by increased energy efficiency and technological innovation, Sandstorm expects that increased government regulation will result in increased costs at some operations at the Mines if the current regulatory trend continues. All of Sandstorm’s mining interests are exposed to climate-related risks through the operations at the Mines. Climate change could result in challenging conditions and extreme weather that may adversely affect the operations at the Mines and there can be no assurances that mining operations will be able to predict, respond to, measure, monitor or manage the risks posed as a result of climate change factors.
Solvency Risk of Counterparties
The price of the common shares and the Company’s financial results may be significantly affected by the Mines operators’ ability to continue as a going concern and have access to capital. The lack of access to capital could result in these companies entering bankruptcy proceedings and as a result, Sandstorm may not be able to realize any value from its respective Streams or royalties.
As the Company’s revolving facility is secured against the Company’s assets, to the extent Sandstorm defaults on its debt or related covenants, the lenders may seize on their security interests. The realization of security or default could materially affect the price of the Company’s common shares and financial results.
The Company’s Vale Royalties are publicly traded on Brazil’s National Debenture System. The daily exchange traded volume of the Vale Royalties may not be sufficient for the Company to liquidate its position in a short period of time without potentially affecting their market value.
Health Crises and Other
Global markets have been adversely impacted by emerging infectious diseases and/or the threat of outbreaks of viruses, other contagions, or epidemic diseases, including currently, the novel
COVID-19.
A significant new outbreak or continued outbreaks ofCOVID-19
could result in a widespread crisis that could adversely affect the economies and financial markets of many countries, resulting in an economic downturn which could adversely affect the Company’s business and the market price of the common shares. Many industries, including the mining industry, have been impacted by these market conditions. If increased levels of volatility continue or63
in the event of a rapid destabilization of global economic conditions, it may result in a material adverse effect on commodity prices, demand for metals, availability of credit, investor confidence, and general financial market liquidity, all of which may adversely affect the Company’s business and the market price of the Company’s securities. In addition, there may not be an adequate response to emerging infectious diseases, or significant restrictions may be imposed by a government, either of which may impact mining operations. There are potentially significant economic and social impacts, including labour shortages and shutdowns, delays and disruption in supply chains, social unrest, government or regulatory actions or inactions, including quarantines, declaration of national emergencies, permanent changes in taxation or policies, decreased demand or the inability to sell and deliver concentrates and resulting commodities, declines in the price of commodities, delays in permitting or approvals, suspensions or mandated shut downs of operations, governmental disruptions or other unknown but potentially significant impacts. At this time, the Company cannot accurately predict what effects these conditions will have on its operations or financial results, due to uncertainties relating to the ultimate geographic spread, the duration of the outbreak, and the length restrictions or responses that have been or may be imposed by the governments. Given the global nature of the Company’s operations, the Company may not be able to accurately predict which operations will be impacted or if those impacted will resume operations. Any new outbreaks or the continuation of the existing outbreaks or threats of any additional outbreaks of a contagion or epidemic disease could have a material adverse effect on the Company, its business and operational results.
Other
Critical Accounting Estimates
The preparation of consolidated financial statements in conformity with IFRS requires management to make estimates and assumptions that affect the reported amount of assets and liabilities and disclosure of contingent liabilities at the date of the consolidated financial statements, and the reported amounts of revenues and expenditures during the periods presented. Notes 2 and 3 of the Company’s 2021 annual consolidated financial statements describe all of the significant accounting policies as well as the significant judgments and estimates.
64
Disclosure Controls and Procedures
Disclosure controls and procedures are designed to provide reasonable assurance that all relevant information is gathered and reported to senior management, including the Company’s Chief Executive Officer and the Chief Financial Officer, on a timely basis so that appropriate decisions can be made regarding public disclosure. The Company’s system of disclosure controls and procedures includes, but is not limited to, the Disclosure Policy, the Code of Conduct, the Stock Trading Policy, Corporate Governance, the effective functioning of the Audit Committee and procedures in place to systematically identify matters warranting consideration of disclosure by the Audit Committee.
As at the end of the period covered by this Management’s Discussion and Analysis, management of the Company, with the participation of the Chief Executive Officer and the Chief Financial Officer, evaluated the effectiveness of the Company’s disclosure controls and procedures as required by National InstrumentCertification of Disclosure in Issuers’ Annual and Interim Filings (“NI
52-109
in Canada (“NI52-109”)
and under the Securities Exchange Act of 1934, as amended, in the United States. The evaluation included documentation review, enquiries and other procedures considered by management to be appropriate in the circumstances. Based on that evaluation, the Chief Executive Officer and the Chief Financial Officer have concluded that, as of December 31, 2021, the disclosure controls and procedures (as defined in National Instrument52-109-
52-109”)
and Rules13(a)-15(e)
under the Securities Exchange Act of 1934, as amended) were effective to provide reasonable assurance that information required to be disclosed in the Company’s annual and interim filings and other reports filed or submitted under applicable securities laws, is recorded, processed, summarized and reported within time periods specified by those laws and that material information is accumulated and communicated to management of the Company, including the Chief Executive Officer and the Chief Financial Officer, as appropriate to allow timely decisions regarding required disclosure.Management’s Report on Internal Control Over Financial Reporting
Management of the Company is responsible for establishing and maintaining effective internal control over financial reporting as such term is defined in the rules of the National Instrument
52-109
in Canada and under the Securities Exchange Act of 1934, as amended, in the United States. The Company’s internal control over financial reporting is designed to provide reasonable assurance regarding the reliability of the Company’s financial reporting for external purposes in accordance with IFRS.65
The Company’s internal control over financial reporting includes:
| · | Maintaining records, that in reasonable detail, accurately and fairly reflect our transactions and dispositions of the assets of the Company; |
| · | Providing reasonable assurance that transactions are recorded as necessary for preparation of the consolidated financial statements in accordance with IFRS; |
| · | Providing reasonable assurance that receipts and expenditures are made in accordance with authorizations of management and the directors of the Company; and |
| · | Providing reasonable assurance that unauthorized acquisition, use or disposition of Company assets that could have a material effect on the Company’s consolidated financial statements would be prevented or detected on a timely basis. |
The Company’s internal control over financial reporting may not prevent or detect all misstatements because of inherent limitations. Additionally, projections of any evaluation of effectiveness to future periods are subject to the risk that controls may become inadequate because of changes in conditions or deterioration in the degree of compliance with the Company’s policies and procedures. Management assessed the effectiveness of the Company’s internal control over financial reporting as of December 31, 2021 based on the criteria set forth in Internal Control - Integrated Framework (2013) issued by the Committee of Sponsoring Organizations of the Treadway Commission (COSO). Based on this assessment, management has concluded that, as of December 31, 2021, the Company’s internal control over financial reporting is effective and no material weaknesses were identified.
Changes in Internal Controls
There were no changes in internal controls of the Company during the year ended December 31, 2021 that have materially affected, or are likely to materially affect, the Company’s internal control over financial reporting.
66
Limitations of Controls and Procedures
The Company’s management, including the Chief Executive Officer and the Chief Financial Officer, believe that any disclosure controls and procedures or internal controls over financial reporting, no matter how well conceived and operated, can provide only reasonable, not absolute, assurance that the objectives of the control system are met. Further, the design of a control system must reflect the fact that there are resource constraints, and the benefits of controls must be considered relative to their costs. Because of the inherent limitations in all control systems, they cannot provide absolute assurance that all control issues and instances of fraud, if any, within the Company have been prevented or detected. These inherent limitations include the realities that judgments in decision-making can be faulty, and that breakdowns can occur because of simple error or mistake. Additionally, controls can be circumvented by the individual acts of some persons, by collusion of two or more people, or by unauthorized override of the control. The design of any systems of controls also is based in part upon certain assumptions about the likelihood of future events, and there can be no assurance that any design will succeed in achieving its stated goals under all potential future conditions. Accordingly, because of the inherent limitations in a cost-effective control system, misstatements due to error or fraud may occur and not be detected.
New and Amended Accounting Policies
The following new IFRS was effective and implemented for the annual period as of January 1, 2021. Pronouncements that are not applicable to the Company have been excluded from this note.
Interest Rate Benchmark Reform – Phase 2
In August 2020, the International Accounting Standards Board issued Interest Rate Benchmark Reform – Phase 2 (Amendments to IFRS 9, IAS 39, IFRS 7, IFRS 4 and IFRS 16) (“IBOR Amendments”), which is applied to potential changes in contractual cash flows of a financial asset or financial liability as a result of replacing an interest rate benchmark with an alternative benchmark rate. The Company has adopted the IBOR Amendments retrospectively. The new standard did not have a material impact on the Company’s annual financial statements.
67
Forward Looking Statements
This MD&A and any exhibits attached hereto and incorporated herein, if any, contain “forward-looking statements”, within the meaning of the U.S. Securities Act of 1933, as amended, the U.S. Securities Exchange Act of 1934, as amended, the United States Private Securities Litigation Reform Act of 1995, and applicable Canadian and other securities legislation, concerning the business, operations and financial performance and condition of Sandstorm. Forward-looking information is provided as of the date of this MD&A and Sandstorm does not intend, and does not assume any obligation, to update this forward-looking information, except as required by law.
Generally, forward-looking information can be identified by the use of forward-looking terminology such as “plans”, “expects” or “does not expect”, “is expected”, “budget”, “scheduled”, “estimates”, “forecasts”, “intends”, “anticipates” or “does not anticipate”, or “believes”, or variations of such words and phrases or statements that certain actions, events or results “may”, “could”, “would”, “might” or “will be taken”, “occur” or “be achieved”. Forward-looking information is based on reasonable assumptions that have been made by Sandstorm as at the date of such information and is subject to known and unknown risks, uncertainties and other factors that may cause the actual results, level of activity, performance or achievements of Sandstorm to be materially different from those expressed or implied by such forward-looking information, including but not limited to: the impact of general business and economic conditions; the Chapada Mine, the Cerro Moro Mine, the Houndé Mine, the Ming Mine, the Gualcamayo Mine, the Fruta del Norte Mine, the Santa Elena Mine, the Black Fox Mine, the Aurizona Mine, the Relief Canyon Mine, the Karma Mine, the Emigrant Springs Mine, the Thunder Creek Mine, MWS, HM Claim, Triangle Zone, the Hugo North Extension and Heruga deposits, the mines underlying the Sandstorm portfolio of royalties, the Diavik Mine, the Mt. Hamilton Project, the Prairie Creek Project, the Hod Maden Project, the Hackett River Project, the Lobo-Marte Project, Agi Dagi and Kirazli, the Vatukoula Mine, the Vale Royalty Package, the Mercedes Mine, or the Bracemac-McLeod Mine; the absence of control over mining operations from which Sandstorm will purchase gold or other commodities, or receive royalties from and risks related to those mining operations, including risks related to international operations, government and environmental regulation, actual results of current exploration activities, conclusions of economic evaluations and changes in project parameters as plans continue to be refined; problems inherent to the marketability of minerals; industry conditions, including fluctuations in the price of metals, fluctuations in foreign exchange rates and fluctuations in interest rates; government entities interpreting existing tax legislation or enacting new tax legislation in a way which adversely affects Sandstorm; the aggregate value of common shares which may be issued pursuant to the ATM Program, the Company’s expected use of the net proceeds of the ATM Program, the number or aggregate value of common shares which may be purchased under the NCIB, audits being conducted by the CRA and available remedies, the expectation that the various closing conditions of the Hod Maden transaction will be met, the expectation that the Hod Maden transaction with
New-Co
will close, management’s expectations regarding Sandstorm’s growth; stock market volatility; competition; as well as those factors discussed in the section entitled “Risks to Sandstorm” herein and those risks described in the section entitled “Risk Factors” contained in Sandstorm’s most recent Annual Information Form for the year ended December 31, 2020 available at www.sedar.com and www.sec.gov and incorporated by reference herein.Forward-looking information in this MD&A includes, among other things, disclosure regarding: the impact of
COVID-19
on the business, the aggregate value of common shares which may be issued pursuant to the ATM Program, the Company’s expected use of the net proceeds of the ATM Program, audits being conducted by the CRA and available remedies, management’s expectations regarding Sandstorm’s growth, Sandstorm’s existing Gold Streams and royalties as well as its future outlook, the Mineral Reserve and Mineral Resource estimates for each of the Chapada Mine, the Cerro Moro Mine, the Houndé Mine, the Ming Mine, the Gualcamayo Mine, the Fruta del Norte Mine, the Santa Elena Mine, the Black Fox Mine, the Aurizona Mine, the Relief Canyon Mine, the Karma Mine, the Emigrant Springs Mine, the Thunder Creek Mine, MWS, HM Claim, Triangle Zone, the Hugo North Extension and Heruga deposits, the mines underlying the Sandstorm portfolio of royalties, the Diavik Mine, the Mt. Hamilton Project, the Prairie Creek Project, the Hod Maden Project, the Hackett River Project, the Lobo-Marte Project, Agi Dagi and Kirazli, the Vatukoula Mine, the Vale Royalty Package, the Mercedes Mine, and the Bracemac-McLeod Mine. Forward-looking information is based on assumptions management believes to be reasonable, including but not limited to the continued operation of the mining operations from which Sandstorm will purchase gold, other commodities or receive royalties from, no material adverse change in the market price of commodities, that the mining operations will operate in accordance with their public statements and achieve their stated production outcomes, and such other assumptions and factors as set out therein.Although Sandstorm has attempted to identify important factors that could cause actual actions, events or results to differ materially from those contained in forward-looking information, there may be other factors that cause actions, events or results not to be as anticipated, estimated or intended. There can be no assurance that such information will prove to be accurate, as actual results and future events could differ materially from those anticipated in such information. Accordingly, readers should not place undue reliance on forward-looking information.
68
Management’s Responsibility for Financial Reporting
The accompanying consolidated financial statements of Sandstorm Gold Ltd. and all the information in this annual report are the responsibility of management and have been approved by the Board of Directors.
The consolidated financial statements have been prepared by management on a going concern basis in accordance with International Financial Reporting Standards as issued by the International Accounting Standards Board (“IFRS”). When alternative accounting methods exist, management has chosen those it deems most appropriate in the circumstances. Financial statements are not exact since they include certain amounts based on estimates and judgments. Management has determined such amounts on a reasonable basis in order to ensure that the financial statements are presented fairly, in all material respects. Management has prepared the financial information presented elsewhere in the annual report and has ensured that it is consistent with that in the financial statements.
Sandstorm Gold Ltd. maintains systems of internal accounting and administrative controls in order to provide, on a reasonable basis, assurance that the financial information is relevant, reliable and accurate and that the Company’s assets are appropriately accounted for and adequately safeguarded.
The Board of Directors is responsible for ensuring that management fulfills its responsibilities for financial reporting and is ultimately responsible for reviewing and approving the financial statements. The Board carries out this responsibility principally through its Audit Committee.
The Audit Committee is appointed by the Board, and all of its members are independent directors. The Audit Committee meets at least four times a year with management, as well as the external auditors, to discuss internal controls over the financial reporting process, auditing matters and financial reporting issues, to satisfy itself that each party is properly discharging its responsibilities, and to review the quarterly and the annual reports, the financial statements and the external auditors’ report. The Audit Committee reports its findings to the Board for consideration when approving the financial statements for issuance to the shareholders. The Audit Committee also considers, for review by the Board and approval by the shareholders, the engagement or reappointment of the external auditors. The consolidated financial statements have been audited by PricewaterhouseCoopers LLP, Chartered Professional Accountants, in accordance with the standards of the Public Company Accounting Oversight Board (United States) on behalf of the shareholders. PricewaterhouseCoopers LLP has full and free access to the Audit Committee.
“Nolan Watson” | “Erfan Kazemi” | |
President & Chief Executive Officer | Chief Financial Officer | |
| February 17, 2022 | ||
69
Report of Independent Registered Public Accounting Firm
To the
Shareholders and Board of Directors of Sandstorm Gold Ltd.
Opinions on the Financial Statements and Internal Control over Financial Reporting
We have audited the accompanying consolidated statements of financial position of Sandstorm Gold Ltd. and its subsidiaries (together, the Company) as of December 31, 2021 and 2020, and the related consolidated statements of income (loss), comprehensive income (loss), cash flow and changes in equity for the years then ended, including the related notes (collectively referred to as the consolidated financial statements). We also have audited the Company’s internal control over financial reporting as of December 31, 2021, based on criteria established in(2013) issued by the Committee of Sponsoring Organizations of the Treadway Commission (COSO).
Internal Control - Integrated Framework
In our opinion, the consolidatedand the results of its financial performance and its cash flows for years then ended in conformity with International Financial Reporting Standards as issued by the International Accounting Standards Board. Also in our opinion, the Company maintained, in all material respects, effective internal control over financial reporting as of December 31, 2021, based on criteria established in(2013) issued by the COSO.
financial statements referred to above present fairly, in all material respects, the financial position of the Company as of December 31, 2021 and 2020
,
Internal Control - Integrated Framework
Basis for Opinions
The Company’s management is responsible for these consolidated financial statements, for maintaining effective internal control over financial reporting, and for its assessment of the effectiveness of internal control over financial reporting, included in the accompanying Management’s Report on Internal Control over Financial Reporting. Our responsibility is to express opinions on the Company’s consolidated
financial statements and on the Company’s internal control over financial reporting based on our audits. We are a public accounting firm registered with the Public Company Accounting Oversight Board (United States) (PCAOB) and are required to be independent with respect to the Company in accordance with the U.S. federal securities laws and the applicable rules and regulations of the Securities and Exchange Commission and the PCAOB.
We conducted our audits in accordance with the standards of the PCAOB. Those standards require that we plan and perform the audits to obtain reasonable assurance about whether the consolidated
financial statements are free of material misstatement, whether due to error or fraud, and whether effective internal control over financial reporting was maintained in all material respects.
Our audits of the consolidated
financial statements included performing procedures to assess the risks of material misstatement of the consolidated
financial statements, whether due to error or fraud, and performing procedures that respond to those risks. Such procedures included examining, on a test basis, evidence regarding the amounts and disclosures in the consolidated
financial statements. Our audits also included evaluating the
70
accounting principles used and significant estimates made by management, as well as evaluating the overall presentation of the consolidated
financial statements. Our audit of internal control over financial reporting included obtaining an understanding of internal control over financial reporting, assessing the risk that a material weakness exists, and testing and evaluating the design and operating effectiveness of internal control based on the assessed risk. Our audits also included performing such other procedures as we considered necessary in the circumstances. We believe that our audits provide a reasonable basis for our opinions.
Definition and Limitations of Internal Control over Financial Reporting
A company’s internal control over financial reporting is a process designed to provide reasonable assurance regarding the reliability of financial reporting and the preparation of financial statements for external purposes in accordance with generally accepted accounting principles. A company’s internal control over financial reporting includes those policies and procedures that (i) pertain to the maintenance of records that, in reasonable detail, accurately and fairly reflect the transactions and dispositions of the assets of the company; (ii) provide reasonable assurance that transactions are recorded as necessary to permit preparation of financial statements in accordance with generally accepted accounting principles, and that receipts and expenditures of the company are being made only in accordance with authorizations of management and directors of the company; and (iii) provide reasonable assurance regarding prevention or timely detection of unauthorized acquisition, use, or disposition of the company’s assets that could have a material effect on the financial statements.
Because of its inherent limitations, internal control over financial reporting may not prevent or detect misstatements. Also, projections of any evaluation of effectiveness to future periods are subject to the risk that controls may become inadequate because of changes in conditions, or that the degree of compliance with the policies or procedures may deteriorate.
Critical Audit Matters
The critical audit matter communicated below is a matter arising from the current period audit of the consolidated financial statements that was communicated or required to be communicated to the audit committee and that (i) relates to accounts or disclosures that are material to the consolidated financial statements and (ii) involved our especially challenging, subjective, or complex judgments. The communication of critical audit matters does not alter in any way our opinion on the consolidated financial statements, taken as a whole, and we are not, by communicating the critical audit matter below, providing a separate opinion on the critical audit matter or on the accounts or disclosures to which it relates.
71
Assessment of impairment indicators of stream, royalty and other interests and of the Hod Maden and other investments in associates
As described in Notes 3, 5 and 6 to the consolidated financial statements, the Company’s stream, royalty and other interests carrying amount was $473.7 million and the Hod Maden and other investments in associates carrying amount was $84.6 million as of December 31, 2021. Management assesses whether any indication of impairment exists at the end of each reporting period for each stream, royalty and other interest and for the Hod Maden and other investments in associates, including assessing whether there are observable indications that the asset’s value has declined during the period. If such an indication exists, the recoverable amount of the interest is estimated in order to determine the extent of the impairment (if any). Management uses judgment when assessing whether there are indicators of impairment, such as significant changes in future commodity prices, discount rates, operator reserve and resource estimates or other relevant information received from the operators that indicates production from the interests will not likely occur or may be significantly reduced in the future.
The principal considerations for our determination that performing procedures relating to the assessment of impairment indicators of stream, royalty and other interests and of the Hod Maden and other investments in associates is a critical audit matter are (i) the judgment by management when assessing whether there were indicators of impairment related to significant changes in future commodity prices, discount rates, operator reserve and resource estimates or other relevant information received from the operators that indicates production from the interests will not likely occur or may be significantly reduced in the future; (ii) a high degree of auditor judgment, subjectivity and effort in performing procedures and evaluate audit evidence related to management’s assessment of impairment indicators of stream, royalty and other interests and of the Hod Maden and other investments in associates.
Addressing the matter involved performing procedures and evaluating audit evidence in connection with forming our overall opinion on the consolidated financial statements. These procedures included testing the effectiveness of controls relating to management’s review of the assessment of impairment indicators of stream, royalty and other interests and of the Hod Maden and other investments in associates.
These procedures also included, among others, evaluating the reasonableness of management’s assessment of indicators of impairment for a sample of stream, royalty and other interests and of the Hod Maden and other investments in associates, related to significant changes in future commodity prices, discount rates, operator reserve and resource estimates or other relevant information received from the operators that indicates production from the interests will not likely occur or may be significantly reduced in the future, by considering (i) the current and past performance of the underlying mining operation associated with the interest; (ii) external market and industry data; (iii) the publicly disclosed information by operators of the underlying mining operation associated with the interests; and (iv) consistency with evidence obtained in other areas of the audit.
/S/ PricewaterhouseCoopers LLP
Chartered Professional Accountants
Vancouver, Canada
February 17, 2022
We have served as the Company’s auditor since 2016.
72
Q4 | 2021 | |
Consolidated Financial Statements
FOR THE YEAR ENDED DECEMBER 31, 2021
73
Consolidated Statements of Financial Position | Expressed in U.S. Dollars ($000s) |
— ASSETS | Note | December 31, 2021 | December 31, 2020 | |||||||
Current | ||||||||||
Cash and cash equivalents | $ | 16,166 | $ | 113,776 | ||||||
Trade and other receivables | 12,144 | 8,011 | ||||||||
Other current assets | 5,294 | 737 | ||||||||
Short-term investments | 7 | 0 | 1,852 | |||||||
$ | 33,604 | $ | 124,376 | |||||||
Non-Current | ||||||||||
Stream, royalty and other interests | 5 | $ | 473,651 | $ | 356,612 | |||||
Hod Maden and other investments in associates | 6 | 84,589 | 112,906 | |||||||
Investments | 7 | 24,056 | 45,084 | |||||||
Other long-term assets | 4,958 | 10,943 | ||||||||
Total assets | $ | 620,858 | $ | 649,921 | ||||||
— LIABILITIES | ||||||||||
Current | ||||||||||
Trade and other payables | $ | 7,347 | $ | 3,434 | ||||||
Non-Current | ||||||||||
Deferred income tax liabilities | 10 | $ | 18,294 | $ | 5,477 | |||||
Lease liabilities and other | 2,579 | 2,868 | ||||||||
$ | 28,220 | $ | 11,779 | |||||||
— EQUITY | ||||||||||
Share capital | 9 | $ | 694,675 | $ | 719,730 | |||||
Reserves | 18,903 | 18,902 | ||||||||
Retained earnings | 35,569 | 10,951 | ||||||||
Accumulated other comprehensive loss | (156,509 | ) | (111,441 | ) | ||||||
$ | 592,638 | $ | 638,142 | |||||||
Total liabilities and equity | $ | 620,858 | $ | 649,921 | ||||||
Commitments and contingencies (note 14)
Subsequent Event (note 16)
On Behalf of the Board:
“Nolan Watson”, Director “David De Witt”, Director
The accompanying notes are an integral part of these consolidated financial statements.
74
Consolidated Statements of Income (Loss) | Expressed in U.S. Dollars ($000s) Except for per share amounts | |||||||||
Note | Year Ended December 31, 2021 | Year Ended December 31, 2020 | ||||||||
Sales | 15 | $ | 71,722 | $ | 58,660 | |||||
Royalty revenue | 15 | 43,138 | 34,365 | |||||||
$ | 114,860 | $ | 93,025 | |||||||
Cost of sales, excluding depletion | 15 | $ | 16,845 | $ | 14,046 | |||||
Depletion | 15 | 35,704 | 33,124 | |||||||
Total cost of sales | $ | 52,549 | $ | 47,170 | ||||||
Gross profit | $ | 62,311 | $ | 45,855 | ||||||
Expenses and other (income) | ||||||||||
Administration expenses 1 | 11 | $ | 10,198 | $ | 8,335 | |||||
Project evaluation 1 | 11 | 7,770 | 5,533 | |||||||
Gain on revaluation of Vale Royalties financial instrument | 7 | (5,887) | - | |||||||
Loss (gain) on revaluation of investments | 7 | 1,659 | (3,830) | |||||||
Finance expense | 2,135 | 2,107 | ||||||||
Finance income | (481) | (315) | ||||||||
Other | 1,011 | 527 | ||||||||
Stream, royalty and other interests impairments | 5 | 408 | 8,877 | |||||||
Foreign exchange loss | 645 | 345 | ||||||||
Income before taxes | $ | 44,853 | $ | 24,276 | ||||||
Current income tax expense | 10 | $ | 3,029 | $ | 2,864 | |||||
Deferred income tax expense | 10 | 14,202 | 7,595 | |||||||
$ | 17,231 | $ | 10,459 | |||||||
Net income for the year | $ | 27,622 | $ | 13,817 | ||||||
Basic earnings per share | $ | 0.14 | $ | 0.07 | ||||||
Diluted earnings per share | $ | 0.14 | $ | 0.07 | ||||||
Weighted average number of common shares outstanding | ||||||||||
Basic | 9 (d) | 193,974,313 | 187,507,754 | |||||||
Diluted | 9 (d) | 197,823,480 | 196,907,840 | |||||||
1. Equity settled share-based compensation (a non-cash item) is included in administration expenses and project evaluation | $ | 6,002 | $ | 5,652 | ||||||
The accompanying notes are an integral part of these consolidated financial statements.
75
Consolidated Statements of Comprehensive Income (Loss) | Expressed in U.S. Dollars ($000s) | |||||||||
Note | Year Ended December 31, 2021 | Year Ended December 31, 2020 | ||||||||
Net income for the year | $ | 27,622 | $ | 13,817 | ||||||
Other Comprehensive Loss for the Year | ||||||||||
Items that may subsequently be reclassified to net income: | ||||||||||
Currency translation differences | $ | (34,541) | $ | (23,052) | ||||||
Items that will not subsequently be reclassified to net income: | ||||||||||
(Loss) gain on FVTOCI investments | 7 | (11,847) | 18,212 | |||||||
Tax recovery (expense) on FVTOCI investments | 1,320 | (2,346) | ||||||||
Total other comprehensive loss for the year | $ | (45,068) | $ | (7,186) | ||||||
Total comprehensive (loss) income for the year | $ | (17,446) | $ | 6,631 | ||||||
The accompanying notes are an integral part of these consolidated financial statements.
76
Consolidated Statements of Cash Flow | Expressed in U.S. Dollars ($000s) | |||||||||||
Cash flow from (used in): | Note | Year Ended December 31, 2021 | Year Ended December 31, 2020 | |||||||||
— OPERATING ACTIVITIES | ||||||||||||
Net income for the year | $ | 27,622 | $ | 13,817 | ||||||||
Items not affecting cash: | ||||||||||||
Depletion and depreciation | $ | 36,177 | $ | 33,611 | ||||||||
Deferred income tax expense | 14,202 | 7,595 | ||||||||||
Share-based payments | 6,002 | 5,652 | ||||||||||
Gain on revaluation of Vale Royalties financial instrument | 7 | (5,887) | - | |||||||||
Loss (gain) on revaluation of investments | 1,659 | (3,830) | ||||||||||
Stream, royalty and other interests impairments | 5 | 408 | 8,877 | |||||||||
Interest expense and financing amortization | 2,072 | 1,935 | ||||||||||
Unrealized foreign exchange loss | 589 | 346 | ||||||||||
Other | 636 | 335 | ||||||||||
Changes in non-cash working capital | 12 | (2,341) | (2,722) | |||||||||
$ | 81,139 | $ | 65,616 | |||||||||
— INVESTING ACTIVITIES | ||||||||||||
Acquisition of stream, royalty, and other interests | 5 | $ | (152,697) | $ | (3,476) | |||||||
Proceeds from disposal of investments and other | 22,362 | 56,381 | ||||||||||
Acquisition of investments and other assets | (13,018) | (15,916) | ||||||||||
Investment in Hod Maden interest | 6 | (559) | (3,312) | |||||||||
$ | (143,912) | $ | 33,677 | |||||||||
— FINANCING ACTIVITIES | ||||||||||||
Redemption of common shares (normal course issuer bid) | 9 (a ) | $ | (34,173) | $ | (23,524) | |||||||
Interest paid | (1,169) | (1,361) | ||||||||||
Proceeds on exercise of warrants, options and other | 1,122 | 77,579 | ||||||||||
Bank debt drawn | 0 | 41,000 | ||||||||||
Bank debt repaid | 0 | (86,000) | ||||||||||
$ | (34,220) | $ | 7,694 | |||||||||
Effect of exchange rate changes on cash and cash equivalents | $ | (617) | $ | (182) | ||||||||
Net (decrease) increase in cash and cash equivalents | $ | (97,610) | $ | 106,805 | ||||||||
Cash and cash equivalents — beginning of the year | 113,776 | 6,971 | ||||||||||
Cash and cash equivalents — end of the year | $ | 16,166 | $ | 113,776 | ||||||||
| 1 | Supplemental cash flow information (note 12) |
The accompanying notes are an integral part of these consolidated financial statements.
77
Consolidated Statements of Changes in Equity | Expressed in U.S. Dollars ($000s) |
SHARE CAPITAL | RESERVES | |||||||||||||||||||||||||||||||
Note | Number | Amount | Share Options and Restricted Share Rights | Share Purchase Warrants | Retained Earnings (Deficit) | Accumulated Other Comprehensive Loss | Total | |||||||||||||||||||||||||
At January 1, 2020 | 177,227,941 | $ | 657,551 | $ | 15,796 | $ | 4,670 | $ | (2,866) | $ | (104,255) | $ | 570,896 | |||||||||||||||||||
Options exercised | 9 (b) | 1,253,430 | 5,421 | (1,334) | - | - | - | 4,087 | ||||||||||||||||||||||||
Warrants exercised and expired | 21,091,325 | 82,105 | - | (6,739) | - | - | 75,366 | |||||||||||||||||||||||||
Vesting of restricted share rights | 279,567 | 1,212 | (1,212) | - | - | - | - | |||||||||||||||||||||||||
Acquisition and cancellation of common shares (normal course issuer bid) | (4,599,020) | (23,524) | - | - | - | - | (23,524) | |||||||||||||||||||||||||
Share-based payments | - | - | 5,652 | - | - | - | 5,652 | |||||||||||||||||||||||||
Share issuance costs | - | (3,035) | - | 2,069 | - | - | (966) | |||||||||||||||||||||||||
Total comprehensive income (loss) | - | - | - | - | 13,817 | (7,186) | 6,631 | |||||||||||||||||||||||||
At December 31, 2020 | 195,253,243 | $ | 719,730 | $ | 18,902 | $ | - | $ | 10,951 | $ | (111,441) | $ | 638,142 | |||||||||||||||||||
Options exercised | 9 (b) | 855,761 | 4,386 | (1,046) | - | - | - | 3,340 | ||||||||||||||||||||||||
Vesting of restricted share rights | 995,865 | 4,955 | (4,955) | - | - | - | - | |||||||||||||||||||||||||
Acquisition and cancellation of common shares (normal course issuer bid) | 9 (a) | (5,451,415) | (34,173) | - | - | - | - | (34,173) | ||||||||||||||||||||||||
Share-based payments | - | - | 6,002 | - | - | - | 6,002 | |||||||||||||||||||||||||
Share issuance costs | - | (223) | - | - | - | - | (223) | |||||||||||||||||||||||||
Dividends declared | - | - | - | - | (3,004) | (3,004) | ||||||||||||||||||||||||||
Total comprehensive income (loss) | - | - | - | - | 27,622 | (45,068) | (17,446) | |||||||||||||||||||||||||
At December 31, 2021 | 191,653,454 | $ | 694,675 | $ | 18,903 | $ | - | $ | 35,569 | $ | (156,509) | $ | 592,638 | |||||||||||||||||||
The accompanying notes are an integral part of these consolidated financial statements.
78
Notes to the Consolidated
Financial Statements
DECEMBER 31, 2021 | EXPRESSED IN U.S. DOLLARS
1 – Nature of Operations
Sandstorm Gold Ltd. was incorporated under the Business Corporations Act of British Columbia on March 23, 2007. Sandstorm Gold Ltd. and its subsidiary entities (collectively “Sandstorm”, “Sandstorm Gold” or the “Company”) is a resource-based company that seeks to acquire gold and other metals purchase agreements (“Gold Streams” or “Streams”) and royalties from companies that have advanced stage development projects or operating mines. In return for making an upfront payment to acquire a Stream or royalty, Sandstorm receives the right to purchase, at a fixed price per unit or at a fixed percentage of the spot price, a percentage of a mine’s production for the life of the mine (in the case of a Stream) or a portion of the revenue generated from the mine (in the case of a royalty).
The head office, principal address and registered office of the Company are located at Suite 1400, 400 Burrard Street, Vancouver, British Columbia, V6C 3A6.
These consolidated financial statements were authorized for issue by the Board of Directors of the Company on February 17, 2022.
2 – Summary of Significant Accounting Policies
A. | Statement of Compliance |
These consolidated financial statements, including comparatives, have been prepared in accordance with International Financial Reporting Standards as issued by the International Accounting Standards Board (“IFRS”).
B. | Basis of Presentation |
These consolidated financial statements have been prepared on a historical cost basis except for certain financial instruments, which are measured at fair value.
The consolidated financial statements are presented in United States dollars, and all values are rounded to the nearest thousand except as otherwise indicated.
C. | Principles of Consolidation |
These consolidated financial statements include the accounts of the Company and its subsidiaries (all wholly owned), Sandstorm Gold (Canada) Ltd., Bridgeport Gold Inc., Inversiones Mineras
79
Australes Holdings (BVI) Inc., Inversiones Mineras Australes S.A., Premier Royalty U.S.A. Inc., SA Targeted Investing Corp., Sandstorm Metals & Energy (Canada) Holdings Ltd., Sandstorm Metals & Energy (Canada) Ltd., Sandstorm Metals & Energy (US) Inc., Mariana Resources Limited and Mariana Turkey Limited. Subsidiaries are fully consolidated from the date the Company obtains control and continue to be consolidated until the date that control ceases. Control is achieved when the Company is exposed to, or has rights to, variable returns from its involvement with the entity and has the ability to affect those returns through its power over the entity.
All intercompany balances, transactions, revenues and expenses have been eliminated on consolidation.
D. | Business Combinations |
On the acquisition of a business, the acquisition method of accounting is used, whereby the purchase consideration is allocated to the identifiable assets and liabilities on the basis of fair value at the date of acquisition. Provisional fair values allocated at a reporting date are finalized as soon as the relevant information is available, within a period not to exceed twelve months from the acquisition date with retrospective restatement of the impact of adjustments to those provisional fair values effective as at the acquisition date. Incremental costs related to acquisitions are expensed as incurred.
When the amount of purchase consideration is contingent on future events, the initial cost of the acquisition recorded includes an estimate of the fair value of the contingent amounts expected to be payable in the future. When the fair value of contingent consideration as at the date of acquisition is finalized before the purchase price allocation is finalized, the adjustment is allocated to the identifiable assets and liabilities acquired. Subsequent changes to the estimated fair value of contingent consideration are recorded in the Consolidated Statements of Income (Loss).
When the cost of the acquisition exceeds the fair values of the identifiable net assets acquired, the difference is recorded as goodwill. If the fair value attributable to the Company’s share of the identifiable net assets exceeds the cost of acquisition, the difference is recognized as a gain in the Consolidated Statements of Income (Loss).
Non-controlling
interests represent the fair value of net assets in subsidiaries, as at the date of acquisition, which are not held by the Company and are presented in the equity section of the Consolidated Statements of Financial Position.E. | Investments in Associates |
An associate is an entity over which the Company has significant influence and is neither a subsidiary nor a joint arrangement. The Company has significant influence when it has the power to participate in the financial and operating policy decisions of the associate but does not have control or joint control over those policies.
The Company accounts for its investments in associates using the equity method. Under the equity method, the Company’s investments in associates are initially recognized at cost when acquired and subsequently increased or decreased to recognize the Company’s share of net income and losses of the associate, after any adjustments necessary to give effect to uniform accounting policies, any other movement in the associate’s reserves, and for impairment losses after the initial recognition date. The Company’s share of income and losses of the
80
associate is recognized in net income during the period. Dividends received from the associate are accounted for as a reduction in the carrying amount of the Company’s investment.
F. | Goodwill |
The Company allocates goodwill arising from business combinations to each cash-generating unit or group of cash-generating units that are expected to receive the benefits from the business combination. Irrespective of any indication of impairment, the recoverable amount of the cash-generating unit or group of cash-generating units to which goodwill has been allocated is tested annually for impairment and when there is an indication that the goodwill may be impaired. Any impairment is recognized as an expense immediately. Any impairment of goodwill is not subsequently reversed.
G. | Stream, Royalty and Other Interests |
Stream, royalty and other interests consist of acquired royalty and stream metal purchase agreements. These interests are recorded at cost and capitalized as long term assets with finite lives. They are subsequently measured at cost less accumulated depletion and accumulated impairment losses, if any. Project evaluation costs that are not related to a specific agreement are expensed in the period incurred.
Stream, royalty and other interests related to producing mines are depleted using themethod over the life of the property to which the agreement relates, which is estimated using available information of proven and probable reserves and the portion of resources expected to be classified as mineral reserves at the mine corresponding to the specific interest.
units-of-production
On acquisition of a stream, royalty or other interest, an allocation of its cost is attributed to the exploration potential of the interest and is recorded as a
non-depletable
asset on the acquisition date. The value of the exploration potential is accounted for by reference to IFRS 6, Exploration and Evaluation of Mineral Resources and is not depleted until such time as the technical feasibility and commercial viability have been established at which point the value of the asset is accounted for by reference to IAS 16, Property, Plant and Equipment.H. | Impairment of Stream, Royalty and Other Interests |
Evaluation of the carrying values of each stream, royalty and other interest is undertaken when events or changes in circumstances indicate that the carrying values may not be recoverable and at each reporting period. If any indication of impairment exists, the recoverable amount is estimated to determine the extent of any impairment loss. The recoverable amount is the higher of the fair value less costs of disposal and value in use.
Fair value is the price that would be received from selling an asset in an orderly transaction between market participants at the measurement date. Costs of disposal are incremental costs directly attributable to the disposal of an asset. Fair value less costs of disposal is usually estimated using a discounted cash flow approach. Estimated future cash flows are calculated using estimated production, sales prices, and a discount rate. Estimated production is determined using current reserves and the portion of resources expected to be classified as mineral reserves as well as exploration potential expected to be converted into resources. Estimated sales prices are determined by reference to an average of
81
long-term metal price forecasts by analysts and management’s expectations. The discount rate is estimated using an average discount rate incorporating analyst views to value precious metal royalty companies. Value in use is determined as the future value of present cash flows expected to be derived from continuing use of an asset in its present form for those assets where value in use exceeds fair value less costs of disposal. If it is determined that the recoverable amount is less than the carrying value, then an impairment is recognized within net income (loss) immediately.
An assessment is made at each reporting period if there is any indication that a previous impairment loss may no longer exist or has decreased. If any indications are present, the carrying amount of the stream, royalty and other interest is increased to the revised estimate of its recoverable amount, but so that the increased carrying amount does not exceed the carrying amount net of depletion that would have been determined had no impairment loss been recognized for the stream, royalty and other interest in previous periods.
| I. | Exploration Assets |
All costs incurred prior to obtaining the legal right to undertake exploration and evaluation activities on a project are expensed in the period incurred. Exploration and evaluation costs arising following the acquisition of an exploration license are capitalized on abasis. Costs incurred include appropriate technical and administrative overheads. Exploration assets are carried at historical cost less any impairment losses recognized. Exploration and evaluation activity includes geological and geophysical studies, exploratory drilling and sampling and resource development.
project-by-project
Upon demonstration of the technical feasibility and commercial viability of a project, any past exploration and evaluation costs related to that project are subject to an impairment test and are reclassified in accordance with IAS 16, Property Plant and Equipment.
Management assesses exploration assets for impairment at each reporting period or when facts and circumstances suggest that the carrying value of capitalized exploration costs may not be recoverable.
J. | Revenue Recognition |
Revenue is comprised of revenue earned in the period from contracts with customers under each of its royalty and stream interests. The Company has determined that each unit of a commodity that is delivered to a customer under a royalty and stream interest is a performance obligation for the delivery of a good that is separate from each other unit of the commodity to be delivered under the same arrangement. In accordance with IFRS 15, the Company recognizes revenue to depict the transfer of the relevant commodity to customers in an amount that reflects the consideration to which the Company expects to be entitled in exchange for those commodities.
For Stream interests, revenue recognition occurs when the relevant commodity received from the stream operator is transferred by the Company to its third-party customers.
For royalty interests, revenue recognition occurs when the relevant commodity is transferred to the end customer by the operator of the royalty property. Revenue is measured at the fair value of the consideration received or receivable when management can reliably estimate the amount, pursuant to the terms of the royalty agreement.
82
In some instances, the Company will not have access to sufficient information to make a reasonable estimate of consideration to which it expects to be entitled and, accordingly, revenue recognition is deferred until management can make a reasonable estimate. Differences between estimates and actual amounts are adjusted and recorded in the period that the actual amounts are known.
K. | Foreign Currency Translation |
The functional currency of the Company and its subsidiaries is the principal currency of the economic environment in which they operate. For the Company and its subsidiaries Sandstorm Gold (Canada) Ltd., Bridgeport Gold Inc., Inversiones Mineras Australes S.A., Inversiones Mineras Australes Holdings (BVI) Inc., Premier Royalty U.S.A. Inc., SA Targeted Investing Corp., Sandstorm Metals & Energy (Canada) Holdings Ltd., Sandstorm Metals & Energy (Canada) Ltd., Sandstorm Metals & Energy (US) Inc., Mariana Resources Limited, Mariana Turkey Limited and the Company’s Entrée Resources Ltd. associate, the functional currency is th
e
U.S. dollar.The functional currency of the Company’s Hod Maden interest in associate is the Turkish Lira. To translate the Hod Maden interest to the presentation currency of the U.S. dollar, all assets and liabilities are translated using the exchange rate as of the reporting date and all income and expenses are translated using the average exchange rates during the period. All resulting exchange differences are recognized in other comprehensive income (loss).
Transactions in foreign currencies are initially recorded in the entity’s functional currency as the rate on the date of the transaction. Monetary assets and liabilities denominated in foreign currencies are translated using the closing rate as at the reporting date.
L. | Financial Instruments |
The Company’s financial instruments consist of cash and cash equivalents, trade receivables and other, short and long-term investments, loans receivable which are included in other assets, trade and other payables and bank debt. All financial instruments are initially recorded at fair value and designated as follows:
Cash and cash equivalents, trade receivables and other, and loans receivable which are included in other assets are classified as financial assets at amortized cost and trade and other payables and bank debt are classified as financial liabilities at amortized cost. Both financial assets at amortized cost and financial liabilities at amortized cost are measured at amortized cost using the effective interest method.
The Company’s
financial assets which are subject to credit risk include cash and cash equivalents, trade receivables and other and loans receivable which are included in other assets. Application of the expected credit loss model at the date of adoption did not have a significant impact on the Company’s financial assets because the Company determined that the expected credit losses on its financial assets were nominal. There were 0 material impairment losses recognized on financial assets during the years ended December 31, 2021 and December 31, 2020.Investments in common shares are held for long-term strategic purposes and not for trading. The Company has made an irrevocable election to designate all these investments as fair value through other comprehensive income (“FVTOCI”)
83
in order to provide a more meaningful presentation based on management’s intention, rather than reflecting changes in fair value in net income. Such investments are measured at fair value at the end of each reporting period, with any gains or losses arising on
re-measurement
recognized as a component of other comprehensive income under the classification of gain (loss) on revaluation of investments. Cumulative gains and losses are not subsequently reclassified to profit or loss.Investments in warrants and convertible debt instruments are classified as fair value through profit or loss (“FVTPL”). These warrants and convertible debt instruments are measured at fair value at the end of each reporting period, with any gains or losses arising on
re-measurement
recognized as a component of net income (loss) under the classification of gain (loss) on revaluation of investments.Transaction costs on initial recognition of financial instruments classified as FVTPL are expensed as incurred. Transaction costs incurred on initial recognition of financial instruments classified as loans and receivables, FVTOCI and other financial liabilities are recognized at their fair value amount and offset against the related loans and receivables or capitalized when appropriate.
Financial assets are derecognized when the contractual rights to the cash flows from the asset expire. Financial liabilities are derecognized only when the Company’s obligations are discharged, cancelled or they expire. On derecognition, the difference between the carrying amount (measured at the date of derecognition) and the consideration received (including any new asset obtained less any new liability obtained) is recognized in profit or loss.
In August 2020, the International Accounting Standards Board issued Interest Rate Benchmark Reform – Phase 2 (Amendments to IFRS 9, IAS 39, IFRS 7, IFRS 4 and IFRS 16) (“IBOR Amendments”), which is applied to potential changes in contractual cash flows of a financial asset or financial liability as a result of replacing an interest rate benchmark with an alternative benchmark rate. The Company has adopted the IBOR Amendments retrospectively. The new standard did not have a material impact on the Company’s consolidated financial statements.
M. | Inventory |
When refined gold or the applicable commodity, under the Stream agreement, is delivered to the Company, it is recorded as inventory. The amount recognized for inventory includes both the cash payment and the related depletion associated with the related Stream interest.
N. | Cash and Cash Equivalents |
Cash and cash equivalents include cash on account, demand deposits and money market investments with maturities from the date of acquisition of
threemonths or less, which are readily convertible to known amounts of cash and are subject to insignificant changes in value.
O. | Income Taxes |
Current income tax assets and liabilities are measured at the amount expected to be recovered from or paid to the taxation authorities. The tax rates and tax laws used are those that are substantively enacted at the reporting date.
Deferred income taxes are provided for using the liability method on temporary differences at the reporting date between the tax bases of
84
assets and liabilities and their carrying amounts for accounting. The change in the net deferred income tax asset or liability is included in income except for deferred income tax relating to equity items which is recognized directly in equity, and relating to investments in common shares designated as FVTOCI which is recognized in other comprehensive income. The income tax effects of differences in the periods when revenue and expenses are recognized in accordance with Company accounting practices, and the periods they are recognized for income tax purposes are reflected as deferred income tax assets or liabilities. Deferred income tax assets and liabilities are measured using the substantively enacted statutory income tax rates which are expected to apply to taxable income in the years in which the assets are realized or the liabilities settled. A deferred tax asset is recognized for unused tax losses, tax credits and deductible temporary differences to the extent that it is probable that future taxable profits will be available for utilization.
Deferred income tax assets and liabilities are offset only if a legally enforceable right exists to offset current tax assets against liabilities and the deferred tax assets and liabilities relate to income taxes levied by the same taxation authority on the same taxable entity and are intended to be settled on a net basis.
The determination of current and deferred taxes requires interpretations of tax legislation, estimates of expected timing of reversal of deferred tax assets and liabilities, and estimates of future earnings.
P. | Share Capital and Share Purchase Warrants |
The proceeds from the issue of units are allocated between common shares and share purchase warrants (with an exercise price denominated in U.S. dollars) on a
pro-rata
basis based on relative fair values at the date of issuance. The fair value of common shares is based on the market closing price on the date the units are issued and the fair value of share purchase warrants is determined using the quoted market price or if the warrants are not traded, using the Black-Scholes Model (“BSM”) as of the date of issuance. Equity instruments issued to agents as financing costs are measured at their fair value at the date the services were provided. Upon exercise, the original consideration is reallocated from share purchase warrants reserve to issued share capital along with the associated exercise price. Original consideration associated with expired share purchase warrants is reallocated to issued share capital.Q. | Earnings Per Share |
Basic earnings per share is computed by dividing the net income available to common shareholders by the weighted average number of common shares issued and outstanding during the period. Diluted earnings per share is calculated assuming that outstanding share options and share purchase warrants, with an average market price that exceeds the average exercise prices of the options and warrants for the year, are exercised and the proceeds are used to repurchase shares of the Company at the average market price of the common shares for the year.
85
R. | Share Based Payments |
The Company recognizes share based compensation expense for all share purchase options and restricted share rights (“RSRs”) awarded to employees, officers and directors based on the fair values of the share purchase options and RSRs at the date of grant. The fair values of share purchase options and RSRs at the date of grant are expensed over the vesting periods of the share purchase options and RSRs, respectively, with a corresponding increase to equity. The fair value of share purchase options is determined using the BSM with market related inputs as of the date of grant. Share purchase options with graded vesting schedules are accounted for as separate grants with different vesting periods and fair values. The fair value of RSRs is the market value of the underlying shares at the date of grant. At the end of each reporting period, the Company
re-assesses
its estimates of the number of awards that are expected to vest and recognizes the impact of any revisions to this estimate in the Consolidated Statements of Income (Loss).The BSM requires management to estimate the expected volatility and expected term of the equity instrument, the risk-free rate of return over the term, expected dividends, and the number of equity instruments expected to ultimately vest. The Company uses its competitors market data with respect to expected volatility and expected dividend yield to the extent these factors are indicative of the Company’s future expectations. The expected term is estimated using historical exercise data, and the number of equity instruments expected to vest is estimated using historical forfeiture data.
S. | Related Party Transactions |
Parties are considered related if one party has the ability, directly or indirectly, to control the other party or exercise significant influence over the other party. Parties are also considered related if they are subject to common control or significant influence. A transaction is considered a related party transaction when there is a transfer of resources or obligations between related parties.
T. | Segment Reporting |
An operating segment is a component of the Company that engages in business activities from which it may earn revenues and incur expenses. The Company’s operating segments are components of the Company’s business for which discrete financial information is available and which are reviewed regularly by the Company’s Chief Executive Officer to make decisions about resources to be allocated to the segment and assess its performance.
U. | Leases |
Upon lease commencement, the Company recognizes aasset, which is initially measured at the amount of the lease liability plus any direct costs incurred, which is then amortized over the life of the lease on a straight-line basis. The lease liability is initially measured at the present value of the lease payments payable over the lease term, discounted at the rate implicit in the lease; if the implicit lease rate cannot be determined, the incremental borrowing rate is used. Payments against the lease are then offset against the lease liability. The lease liability andasset are subsequently
right-of-use
right-of-use
re-measured
to reflect changes to the terms of the lease. Assets and liabilities are recognized for all leases unless the lease term is twelve months or less or the underlying asset has a low value.86
3 | – Key Sources of Estimation Uncertainty and Critical Accounting Judgments |
The preparation of the Company’s consolidated financial statements in conformity with IFRS requires management to make judgments, estimates and assumptions that affect the reported amounts of assets, liabilities and contingent liabilities at the date of the consolidated financial statements and reported amounts of revenues and expenses during the reporting period. Estimates and assumptions are continuously evaluated and are based on management’s experience and other factors, including expectations of future events that are believed to be reasonable under the circumstances. However, actual outcomes can differ from these estimates.
Information about significant sources of estimation uncertainty and judgments made by management in preparing the consolidated financial statements are described below.
A. | Attributable Reserve and Resource Estimates |
Stream, royalty and other interests are a significant class of assets of the Company, with a carrying value of $473.7 million at December 31, 2021 (2020 — $356.6 million). This amount represents the capitalized expenditures related to the acquisition of the stream, royalty and other interests net of accumulated depletion and any impairments. The Company estimates the reserves and resources relating to each interest. Reserves and Resources are estimates of the amount of minerals that can be economically and legally extracted from the mining properties at which the Company has Stream and royalty interests, adjusted where applicable to reflect the Company’s percentage entitlement to minerals produced from such mines.
The public disclosures of Reserves and Resources that are released by the operators of the interests involve assessments of geological and geophysical studies and economic data and the reliance on a number of assumptions, including commodity prices and production costs. The estimates of Reserves and Resources may change based on additional knowledge gained subsequent to the initial assessment. Changes in the estimates of Reserves or Resources may impact the carrying value of the Company’s stream, royalty and other interests and depletion charges.
The Company’s stream and royalty interests are depleted on abasis, with estimated recoverable Reserves and Resources being used to determine the depletion rate for each of the Company’s stream and royalty interests. These calculations require determination of the amount of recoverable Resources to be converted into Reserves. Changes to depletion rates are accounted for prospectively.
units-of-production
B. | Investments |
In the normal course of operations, the Company invests in equity interests of other entities. In such circumstances, management considers whether the facts and circumstances pertaining to each such investment result in the Company obtaining control, joint control or significant influence over the investee entity. In some cases, the determination of whether or not the Company controls, jointly controls or significantly influences the investee entities requires the application of significant management judgment to consider individually and collectively such factors as:
· | The purpose and design of the investee entity. |
· | The ability to exercise power, through substantive rights, over the activities of the investee entity that significantly affect its returns. |
87
· | The size of the Company’s equity ownership and voting rights, including potential voting rights. |
· | The size and dispersion of other voting interests, including the existence of voting blocks. |
· | Other investments in or relationships with the investee entity including, but not limited to, current or possible board representation, royalty and/or stream investments, loans and other types of financial support, material transactions with the investee entity, interchange of managerial personnel or consulting positions. |
· | Other relevant and pertinent factors. |
If it is determined that the Company neither has control, joint control or significant influence over an investee entity, the Company accounts for the corresponding investment in equity interest at fair value through other comprehensive income as further described in note 2.
C. | Income Taxes |
The interpretation of existing tax laws or regulations in Canada, the United States of America, Australia, Argentina, Ecuador, Turkey, Guernsey, Mexico, Brazil or any of the countries in which the mining operations are located or to which shipments of gold and other metals are made requires the use of judgment. Differing interpretation of these laws or regulations could result in an increase in the Company’s taxes, or other governmental charges, duties or impositions. To the extent there are uncertain tax provisions, the Company measures the impact of the uncertainty using the method that best predicts the resolution of the uncertainty. The judgements and estimates made to recognize and measure the effect of uncertain tax treatments are reassessed whenever circumstances change or when there is new information that affects those judgements. In addition, the recoverability of deferred income tax assets, including expected periods of reversal of temporary differences and expectations of future taxable income, are assessed by management at the end of each reporting period and adjusted, as necessary, on a prospective basis. Refer to note 10 for more information.
D. | Impairment of Assets |
There is judgment required to determine whether any indication of impairment exists at the end of each reporting period for each stream, royalty and other interest and the Hod Maden interest and other investments in associates, including assessing whether there are observable indications that the asset’s value has declined during the period. Management uses judgment when assessing whether there are indicators of impairment, such as significant changes in future commodity prices, discount rates, operator reserve and resource estimates or other relevant information received from the operators that indicates production from stream and royalty interests will not likely occur or may be significantly reduced in the future. If such an indication exists, the recoverable amount of the interest is estimated in order to determine the extent of the impairment (if any). The recoverable amount is the higher of the fair value less costs of disposal and value in use. The calculation of the recoverable amount requires the use of estimates and assumptions such as long-term commodity prices, discount rates, and operating performance.
The recoverable amount is determined by calculating the present value of expected future cash flows. The discount rate is based on the Company’s weighted average cost of capital, adjusted for various risks. The expected future cash flows are management’s best estimates of expected future revenues and costs. Under each method, expected future revenues reflect the estimated future production for each mine
88
at which the Company has a Stream or royalty based on detailed life of mine plans received from each of the mine operators. Included in these forecasts is the production of mineral resources that do not currently qualify for inclusion in proven and probable ore reserves where there is a high degree of confidence in its economic extraction. This is consistent with the methodology that is used to measure value beyond proven and probable reserves when determining the fair value attributable to acquired stream and royalty interests. Expected future revenues also reflect management’s estimated long term metal prices, which are determined based on current prices, forward pricing curves and forecasts of expected long-term metal prices prepared by analysts. These estimates often differ from current price levels, but are consistent with how a market participant would assess future long-term metal prices. Estimated future cash costs are established based on the terms of each Stream, royalty and other interest, as disclosed in note 14 to the financial statements.
E. | Accounting for Acquisition of Assets and Stream, Royalty and Other Interests |
The Company’s business is the acquisition of Streams, royalties and other interests. Each Stream, royalty and other interest has its own unique terms and judgement is required to assess the appropriate accounting treatment. The determination of whether an acquisition should be accounted for as a Stream, royalty and other interest or a financial instrument requires the consideration of factors such as (i) the terms of the agreement; (ii) the applicability of the own use exemption under IFRS 9; (iii) whether there is a contractual commitment to repay amounts under the Stream; and (iv) the expected timing and amount of future deliveries of gold, silver and other commodities under the Stream with reference to the existing mine plan.
The assessment of whether an acquisition meets the definition of a business or whether assets are acquired is another area of key judgement. If deemed to be a business combination, applying the acquisition method to business combinations requires each identifiable asset and liability to be measured at its acquisition date fair value. The excess, if any, of the fair value of the consideration over the fair value of the net identifiable assets acquired is recognized as goodwill. The determination of the acquisition date fair values often requires management to make assumptions and estimates about future events. The assumptions and estimates with respect to determining the fair value of Stream, royalty and other interests generally require a high degree of judgement, and include estimates of mineral reserves and resources acquired, future metal prices, discount rates and conversion of reserves and resources. Changes in any of the assumptions or estimates used in determining the fair value of acquired assets and liabilities could impact the amounts assigned to assets and liabilities.
F. | Functional Currency |
The functional currency for each of the Company’s subsidiaries and associates is the currency of the primary economic environment in which the entity operates. Determination of functional currency may involve certain judgments to determine the primary economic environment and the Company reconsiders the functional currency of its entities if there is a change in events and conditions which determine the primary economic environment.
G. | COVID-19 Estimation Uncertainty |
In
March 2020, the World Health Organization declared a global pandemic related to
COVID-19.
The current and future impact on global commerce is
far-reaching.
To date there has been
89
significant stock market volatility, significant volatility in commodity and foreign exchange markets, restrictions on the conduct of business in many jurisdictions including the temporary suspension of mining activities and mine development, and the global movement of people and some goods has become restricted. There is significant ongoing uncertainty surrounding
COVID-19
and the extent and duration of the impacts that it may have on demand and prices for the commodities relating to the Company’s Streams and royalties, on the operations of its partners, on its employees and on global financial markets. As a result of this uncertainty, there is heightened potential for impairments or impairment reversals. In the current environment, assumptions about future commodity prices, exchange rates, and interest rates are subject to greater variability than normal, which could in future significantly affect the valuation of th
e
Company’s assets, both financial andnon-financial.
4 | – Financial Instruments |
A. | Capital Risk Management |
The Company manages its capital such that it endeavors to continue as a going concern while maximizing the return to stakeholders through the optimization of the debt and equity balance. At December 31, 2021, the capital structure of the Company consists of $592.6 million (
2020 —
$638.1 million) of equity attributable to common shareholders, comprising issued share capital (note 9), accumulated reserves, retained earnings and accumulated other comprehensive loss. The Company was not subject to any externally imposed capital requirements with the exception of complying with certain covenants under the ESG Revolving Facility agreement governing bank debt. The Company was in compliance with the debt covenants described in note 8 as at December 31, 2021.
B. | Fair Value Estimation |
The fair value hierarchy establishes three levels to classify the inputs of valuation techniques used to measure fair value. As required by IFRS
13, assets and liabilities are classified in their entirety based on the lowest level of input that is significant to the fair value measurement. The three levels of the fair value hierarchy are described below:
Level
1
|
Level
2
|
Level
3
|
90
The following table sets forth the Company’s financial assets and liabilities measured at fair value on a recurring basis by level within the fair value hierarchy as at December 31, 2021 and December 31, 2020.
As at December 31, 2021:
In $000s | Total | Quoted prices in active markets for identical assets (Level 1) | Significant other observable inputs (Level 2) | Significant unobservable inputs (Level 3) | ||||||||||||
Long-term investments | ||||||||||||||||
Common shares held | $ | 21,486 | $ | 21,486 | $ | 0 | $ | 0 | ||||||||
| Warrants and other | 1,666 | 0 | 1,666 | 0 | ||||||||||||
| Convertible debt | 904 | 0 | 904 | 0 | ||||||||||||
$ | 24,056 | $ | 21,486 | $ | 2,570 | $ | 0 | |||||||||
As at December 31, 2020: | ||||||||||||||||
In $000s | Total | Quoted prices in active markets for identical assets (Level 1) | Significant other observable inputs (Level 2) | Significant unobservable inputs (Level 3) | ||||||||||||
Short-term investments | ||||||||||||||||
| Convertible debt | $ | 1,852 | $ | 0 | $ | 1,852 | $ | 0 | ||||||||
Long-term investments | ||||||||||||||||
| Common shares held | $ | 28,416 | $ | 28,416 | $ | 0 | $ | 0 | ||||||||
| Warrants and other | 1,143 | 0 | 1,143 | 0 | ||||||||||||
| Convertible debt | 15,525 | 0 | 15,525 | 0 | ||||||||||||
$ | 46,936 | $ | 28,416 | $ | 18,520 | $ | 0 | |||||||||
The fair value of the Company’s
other financial instruments, which include cash and cash equivalents, trade and other receivables, loans receivable which are included in other current assets, and trade and other payables, approximate their carrying values at December 31, 2021 and December 31, 2020 due to their short-term nature. There were no transfers between the levels of the fair value hierarchy during the years ended December 31, 2021 and
December 31, 2020.
91
C. | Credit Risk |
The Company’s credit risk is limited to cash and cash equivalents, loans receivable which are included in other assets, trade and other receivables, and the Company’s investments in convertible debentures. The Company’s trade and other receivables are subject to the credit risk of the counterparties who own and operate the mines underlying Sandstorm’s royalty portfolio. In order to mitigate its exposure to credit risk, the Company closely monitors its financial assets and maintains its cash deposits in several high-quality financial institutions. The impact of expected credit losses on trade receivables and financial assets held at amortized cost is not material.
D. | Currency Risk |
Financial instruments that impact th
31e
Company’s net income or other comprehensive income due to currency fluctuations include: cash and cash equivalents, trade and other receivables and trade and other payables denominated in Canadian dollars. Based on the Company’s Canadian dollar denominated monetary assets and monetary liabilities at December ,
2021a
10% increase (decrease) of the value of the Canadian dollar relative to the United States dollar would not have a material impact on net income or other comprehensive income.
E. | Liquidity Risk |
The Company has in place a planning and budgeting process to help determine the funds required to support the Company’s normal operating requirements on an ongoing basis. In managing liquidity risk, the Company takes into account the amount available under the Company’s revolving credit facility, anticipated cash flows from operating activities and its holding of cash and cash equivalents. As at December 31, 2021, the Company had cash and cash equivalents of $16.2 million (December 31, 2020 — $113.8 million). Sandstorm holds common shares, convertible debentures, and warrants and other of other companies with a combined fair market value as at December 31, 2021 of $24.1 million (December 31, 2020 — $46.9 million). In addition, Sandstorm also holds common shares of Entrée Resources Ltd. with a fair value of $31.7 million at December 31, 2021 which are classified as an investment in associate and accounted for using the equity method. The daily exchange traded volume of these shares, including the shares underlying the warrants, may not be sufficient for the Company to liquidate its position in a short period of time without potentially affecting the market value of the shares.
F. | Other Price Risk |
The Company is exposed to equity price risk as a result of holding investments in other mining companies. The Company does not actively trade these investments. The equity prices of long-term investments are impacted by various underlying factors including commodity prices and the volatility in global markets as a result of
COVID-19.
Based on the Company’s investments held as at December 31, 2021, a 10% increase (decrease) in the equity prices of these investments would increase (decrease) other comprehensive income by $2.1 million and would not have a material impact on net income.92
5 | – Stream, Royalty and Other Interests |
A. | Carrying Amount |
As of and for the year ended December 31, 2021:
COST | ACCUMULATED DEPLETION | |||||||||||||||||||||||||||||||||||
In $000s | Opening | Net Additions (Disposals) | Ending | Opening | Depletion 1 | Depletion in Ending Inventory | Impairment | Ending | Carrying Amount | |||||||||||||||||||||||||||
Aurizona, Brazil | $ | 11,091 | $ | 0 | $ | 11,091 | $ | 2,052 | $ | 815 | $ | 0 | $ | 0 | $ | 2,867 | $ | 8,224 | ||||||||||||||||||
Black Fox, Canada | 37,817 | 1 | 37,818 | 30,426 | 1,888 | 0 | 0 | 32,314 | 5,504 | |||||||||||||||||||||||||||
Bracemac-McLeod, Canada | 21,495 | 0 | 21,495 | 19,584 | 1,545 | 0 | 0 | 21,129 | 366 | |||||||||||||||||||||||||||
Chapada, Brazil | 69,554 | 0 | 69,554 | 16,882 | 2,963 | 0 | 0 | 19,845 | 49,709 | |||||||||||||||||||||||||||
Diavik, Canada | 53,134 | 0 | 53,134 | 43,220 | 3,372 | 0 | 0 | 46,592 | 6,542 | |||||||||||||||||||||||||||
Fruta del Norte, Ecuador | 33,267 | 1 | 33,268 | 1,290 | 2,304 | 0 | 0 | 3,594 | 29,674 | |||||||||||||||||||||||||||
Hod Maden, Turkey | 5,818 | 0 | 5,818 | 0 | 0 | 0 | 0 | 0 | 5,818 | |||||||||||||||||||||||||||
Houndé, Burkina Faso | 45,120 | 0 | 45,120 | 12,331 | 1,610 | 0 | 0 | 13,941 | 31,179 | |||||||||||||||||||||||||||
Hugo North Extension and Heruga, Mongolia | 35,352 | 0 | 35,352 | 0 | 0 | 0 | 0 | 0 | 35,352 | |||||||||||||||||||||||||||
Karma, Burkina Faso | 26,289 | 0 | 26,289 | 17,440 | 1,586 | 0 | 0 | 19,026 | 7,263 | |||||||||||||||||||||||||||
Relief Canyon, United States | 26,441 | 0 | 26,441 | 2,907 | 4,624 | 0 | 0 | 7,531 | 18,910 | |||||||||||||||||||||||||||
Santa Elena, Mexico | 23,354 | 0 | 23,354 | 21,932 | 270 | 0 | 0 | 22,202 | 1,152 | |||||||||||||||||||||||||||
Vale Royalties, Brazil | 0 | 117,787 | 117,787 | 0 | 1,444 | 0 | 0 | 1,444 | 116,343 | |||||||||||||||||||||||||||
Vatukoula, Fiji | 0 | 27,590 | 27,590 | 0 | 0 | 0 | 0 | 0 | 27,590 | |||||||||||||||||||||||||||
Yamana silver stream, Argentina | 74,252 | 0 | 74,252 | 25,883 | 10,415 | 0 | 0 | 36,298 | 37,954 | |||||||||||||||||||||||||||
Other 2 | 257,994 | 7,326 | 265,320 | 170,419 | 2,422 | 0 | 408 | 173,249 | 92,071 | |||||||||||||||||||||||||||
Total 3 | $ | 720,978 | $ | 152,705 | $ | 873,683 | $ | 364,366 | $ | 35,258 | $ | 0 | $ | 408 | $ | 400,032 | $ | 473,651 | ||||||||||||||||||
| 1 | Depletion during the period in the Consolidated Statements of Income (loss) of $35.7 million is comprised of depletion expense for the period of $35.3 million, and $0.4 million from depletion in ending inventory as at December 31, 2020. |
| 2 | Includes Mt. Hamilton, Prairie Creek, Gualcamayo, Emigrant Springs, Mine Waste Solutions, Thunder Creek, Hackett River, Lobo-Marte, Agi Dagi & Kirazli, HM Claim, Ming, and others. |
| 3 | Stream, Royalty and Other Interests includes non-depletable assets of $53.9 million and depletable assets of $419.8 million. |
93
As of and for the year ended December 31,
2
020: COST | ACCUMULATED DEPLETION | |||||||||||||||||||||||||||||||||||
In $000s | Opening | Net Additions (Disposals) | Ending | Opening | Depletion | Depletion in Ending Inventory | Impairment | Ending | Carrying Amount | |||||||||||||||||||||||||||
Aurizona, Brazil | $ | 11,091 | $ | 0 | $ | 11,091 | $ | 985 | $ | 1,067 | $ | 0 | $ | 0 | $ | 2,052 | $ | 9,039 | ||||||||||||||||||
Black Fox, Canada | 37,817 | 0 | 37,817 | 29,412 | 1,014 | 0 | 0 | 30,426 | 7,391 | |||||||||||||||||||||||||||
Bracemac-McLeod, Canada | 21,495 | 0 | 21,495 | 18,099 | 1,485 | 0 | 0 | 19,584 | 1,911 | |||||||||||||||||||||||||||
Chapada, Brazil | 69,554 | 0 | 69,554 | 13,968 | 2,914 | 0 | 0 | 16,882 | 52,672 | |||||||||||||||||||||||||||
Diavik, Canada | 53,111 | 23 | 53,134 | 33,273 | 2,085 | 0 | 7,862 | 43,220 | 9,914 | |||||||||||||||||||||||||||
Fruta del Norte, Ecuador | 33,259 | 8 | 33,267 | 34 | 1,256 | 0 | 0 | 1,290 | 31,977 | |||||||||||||||||||||||||||
Hod Maden, Turkey | 5,818 | 0 | 5,818 | 0 | 0 | 0 | 0 | 0 | 5,818 | |||||||||||||||||||||||||||
Houndé, Burkina Faso | 45,101 | 19 | 45,120 | 8,515 | 3,816 | 0 | 0 | 12,331 | 32,789 | |||||||||||||||||||||||||||
Hugo North Extension and Heruga, Mongolia | 35,351 | 1 | 35,352 | 0 | 0 | 0 | 0 | 0 | 35,352 | |||||||||||||||||||||||||||
Karma, Burkina Faso | 26,289 | 0 | 26,289 | 13,248 | 3,843 | 349 | 0 | 17,440 | 8,849 | |||||||||||||||||||||||||||
Relief Canyon, United States | 26,416 | 25 | 26,441 | 0 | 2,820 | 87 | 0 | 2,907 | 23,534 | |||||||||||||||||||||||||||
Santa Elena, Mexico | 23,354 | 0 | 23,354 | 21,610 | 312 | 10 | 0 | 21,932 | 1,422 | |||||||||||||||||||||||||||
Yamana silver stream, Argentina | 74,252 | 0 | 74,252 | 15,764 | 10,119 | 0 | 0 | 25,883 | 48,369 | |||||||||||||||||||||||||||
Other 1 | 254,544 | 3,450 | 257,994 | 167,011 | 2,393 | 0 | 1,015 | 170,419 | 87,575 | |||||||||||||||||||||||||||
Total 2 | $ | 717,452 | $ | 3,526 | $ | 720,978 | $ | 321,919 | $ | 33,124 | $ | 446 | $ | 8,877 | $ | 364,366 | $ | 356,612 | ||||||||||||||||||
| 1 | Includes Mt. Hamilton, Prairie Creek, Gualcamayo, Emigrant Springs, Mine Waste Solutions, Thunder Creek, Hackett River, Lobo-Marte, Agi Dagi & Kirazli, HM Claim, Ming, and others. |
| 2 | Stream, Royalty and Other Interests includes non-depletable assets of $58.4 million and depletable assets of $298.2 million. |
94
B. | Significant Acquisitions |
VALE ROYALTY PACKAGE
On June 29, 2021, the Company acquired a diverse package of royalties on several of Vale S.A.’s (“Vale”) assets located in Brazil for consideration of $109.1 million. During the third quarter of 2021, the Company made an additional $8.7 million investment in the Vale Royalties on similar
pro-rata
terms. These royalties provide holders with life of mine net sales royalties on seven producing mines and several exploration properties covering a total area of interest of 15,564 square kilometres (the “Vale Royalties”). Under the terms of the Vale Royalties, the Company is entitled to:Copper and Gold
| · | 0.03% net sales royalty on the Sossego copper-gold mine; and |
| · | 0.06% net sales royalty on copper and gold and a 0.03% net sales royalty on all other minerals from certain assets. |
Iron Ore
| · | 0.05% net sales royalty on iron ore sales from the Northern System; and |
| · | 0.05% net sales royalty on iron ore sales from a portion of the Southeastern System after a cumulative threshold of 1.7 billion tonnes of iron ore has been met. |
Other
| · | 0.03% of net sales proceeds in the event of an underlying asset sale on certain assets. |
Royalty payments are made on a semi-annual basis on March 31 and September 30 of each year reflecting sales in the preceding half calendar year period. The payment for the first half of 2021 was paid to the Company on October 1, 2021, reflecting a net sales royalty for the period January 1, 2021 to June 30, 2021. As the majority of these sales occurred prior to Sandstorm’s acquisition of the Vale Royalties, the Company has recognized these accrued amounts as a
pre-acquisition
receivable and made a corresponding reduction to the cost base of the royalty.WATERTON ROYALTY PACKAGE
In May 2021, Sandstorm acquired a package of royalties from an affiliate of Waterton Precious Metals Fund II Cayman, LP (“Waterton”) for consideration of $7 million, with an additional $1 million payment contingent on certain advancement milestones on the Converse property. The package includes 21 royalties on development, advanced exploration and exploration stage projects located in Nevada and
Montana.
VATUKOULA GOLD STREAM AND ROYALTY
In December 2021, the Company closed its previously announced gold purchase agreement which entitles it to purchase
25,920ounces of gold over an approximate 5.5-year period (the “Fixed Delivery Period”) and thereafter
2.55%-2.90%
of the gold produced from Vatukoula Gold Mines PTE Limited’s (“VGML”) underground gold mine located in Fiji (“Vatukoula” or the “Vatukoula Mine”) for ongoing per ounce cash payment equal to
20%of
the spot price of the gold. In addition to this Gold Stream, Sandstorm received an effective
0.45%net smelter return royalty on certain prospecting licenses, plus a five-kilometre area of
interest.
95
Under the terms of the agreement, during the first 1.5 years of the Fixed Delivery Period, Sandstorm will receive
3,040ounces of gold per year, increasing to
5,340 ounces of gold per year during the final four years of the Fixed Delivery Period. After the Fixed Delivery Period, Sandstorm will receive a variable proportion of gold produced from the Vatukoula Mine for the life of the mine. As at December 31, 2021, the Company has remitted
$27 million of the $30 million purchase price, with the remaining amount subject to various milestones.
MERCEDES GOLD STREAM
In December 2021, the Company entered into a $60 million financing package with Bear Creek Mining Corporation (“Bear Creek”) to facilitate Bear Creek’s acquisition of the producing Mercedes gold-silver mine in Sonora, Mexico (“Mercedes” or the “Mercedes Mine”) from Equinox. The financing package includes a $37.5 million Gold Stream on the Mercedes Mine and a $22.5 million convertible debenture, both of which are payable on closing.
Under the terms of the Gold Stream, Sandstorm has agreed to purchase 25,200 ounces of gold over a 3.5 year period (the “Fixed Delivery Term”) and thereafter 4.4% of the gold produced from Mercedes Mine. During the Fixed Delivery Term, Sandstorm will make ongoing per ounce cash payment equal to 7.5% of the spot price of the gold. After the receipt of the fixed deliveries, the ongoing per ounce cash payment will increase to 25% of the spot price of the gold.
The $22.5 million convertible debenture bears an interest rate of 6% per annum and has a term of 3 years. Sandstorm has the right to convert the principal amount of the debenture into common shares of Bear Creek, at any time prior to the maturity date, at a 35% premium, or as approved by the
TSX-V,
to Bear Creek’s share price on closing of the transaction.The transaction, which is expected to close by March 31, 2022, is subject to various closing conditions and the Fixed Delivery Term will begin on the earlier of the closing date or April 2022.
C. | Impairment |
DURING THE YEAR ENDED DECEMBER 31, 2020:
Due to adverse diamond market conditions, partly exacerbated by the
COVID-19
pandemic, the Company estimated the recoverable amount of the Diavik royalty and, during the year ended December 31, 2020, recorded an impairment charge of $7.9 million. The recoverable amount of $11.3 million was determined using a discounted cash flow model in estimating the fair value less costs of disposal. This is a level 3 measurement due to the unobservable inputs in the model. Key assumptions used in the cash flow forecast were: a mine life of approximately three years, a diamond price ranging from $55–$90 per carat and a 4% discount rate. The recoverable amount of Diavik is most sensitive to changes in diamond prices and mine life. In isolation, a 10% decrease in diamond prices would result in a reduction in the recoverable amount of approximately $1.2 million and a one year reduction in mine life would result in a reduction in the recoverable amount of approximately $3.5 million.96
6 – Hod Maden and Other Investments in Associates
In $000s | As at December 31, 2021 | As at December 31, 2020 | ||||||
| Hod Maden interest | $ | 63,313 | $ | 96,666 | ||||
| Entrée Resources Ltd. | 21,276 | 16,240 | ||||||
$ | 84,589 | $ | 112,906 | |||||
A. | Hod Maden Interest |
The Company has a 30% net profits interest in Artmin Madencilik Sanayi ve Ticaret A.S, incorporated in Turkey which owns and operates the Hod Maden project. This interest is accounted for using the equity method and its financial results are adjusted, where appropriate, to give effect to uniform accounting policies.
The following table summarizes the changes in the carrying amount of the Company’s Hod Maden interest:
In $000s | Year Ended December 31, 2021 | Year Ended December 31, 2020 | ||||||
| Beginning of Year | $ | 96,666 | $ | 116,585 | ||||
| Company’s share of net loss of associate | (253 | ) | (360 | ) | ||||
| Capital investment | 672 | 3,579 | ||||||
Currency translation adjustments | (33,772 | ) | (23,138 | ) | ||||
End of Year | $ | 63,313 | $ | 96,666 | ||||
Summarized financial information for the Company’s investment in this associate, on a 100% basis and reflecting adjustments made by the Company, including fair value adjustments made at the time of acquisition and adjustments for differences in accounting policies is as
follows:
In $000s | Year Ended December 31, 2021 | Year Ended December 31, 2020 | ||||||
Administration expenses | $ | (994 | ) | $ | (1,387 | ) | ||
Other income | 151 | 187 | ||||||
Total net loss | $ | (843 | ) | $ | (1,200 | ) | ||
Company’s share of net loss of associate | $ | (253 | ) | $ | (360 | ) | ||
97
In $000s | As at December 31, 2021 | As at December 31, 2020 | ||||||
Current Assets | $ | 181 | $ | 765 | ||||
Non-current Assets | 207,032 | 318,710 | ||||||
Total Assets | $ | 207,213 | $ | 319,475 | ||||
Current Liabilities | 366 | 518 | ||||||
Non-current Liabilities | 0 | 0 | ||||||
Total Liabilities | $ | 366 | $ | 518 | ||||
Net Assets | $ | 206,847 | $ | 318,957 | ||||
Company’s share of net assets of associate | $ | 62,054 | $ | 95,687 | ||||
Adjustments for differences in accounting policies and other | 1,259 | 979 | ||||||
Carrying amount of investment in associate | $ | 63,313 | $ | 96,666 | ||||
B. | Entrée Resources Ltd. |
The Company holds a position in Entrée Resources Ltd. (“Entrée”), a Canadian mining company with a carried joint venture interest in the Hugo North Extension and Heruga deposits located in Mongolia. As at December 31, 2021, this position represents approximately 26% of the common shares of Entrée on a
non-diluted
basis and is accounted for using the equity method. The Company records its share of Entrée’s profit or loss including adjustments, where appropriate, to give effect to uniform accounting policies. Using the quoted price of Entrée’s common shares, the fair value of Sandstorm’s interest was $31.7 million as at December 31, 2021.The following table summarizes the changes in the carrying amount of the Company’s Entrée interest:
In $000s | Year Ended December 31, 2021 | Year Ended December 31, 2020 1 | ||||||
Beginning of Year | $ | 16,240 | $ | 0 | ||||
Acquisition of investment in associate | 0 | 16,339 | ||||||
Additions | 6,220 | - | ||||||
Company’s share of net loss of associate | (690 | ) | (99 | ) | ||||
Currency translation adjustments | (494 | ) | - | |||||
End of Year | $ | 21,276 | $ | 16,240 | ||||
| 1 | Information is for the reconstructed period November 20, 2020 to December 31, 2020. |
Summarized financial information for the Company’s investment in this associate,
on
a 100% basis and reflecting adjustments made by the Company, including fair value adjustments made at the time of acquisition and adjustments for differences in accounting policies is as follows:98
In $000s | Year Ended December 31, 2021 | Year Ended December 31, 2020 1 | ||||||
Administration expenses | $ | (2,632 | ) | $ | (123 | ) | ||
Other (expense) income | (154 | ) | (333 | ) | ||||
Total net loss | $ | (2,786 | ) | $ | (456 | ) | ||
Company’s share of net loss of associate | $ | (690 | ) | $ | (99 | ) | ||
| 1 | Information is for the reconstructed period November 20, 2020 to December 31, 2020. |
In $000s | As at December 31, 2021 | As at December 31, 2020 | ||||||
Current Assets | $ | 6,922 | $ | 7,651 | ||||
Non-current Assets | 167,304 | 152,133 | ||||||
Total Assets | $ | 174,226 | $ | 159,784 | ||||
Current Liabilities | 199 | 184 | ||||||
Non-current Liabilities | 92,295 | 84,831 | ||||||
Total Liabilities | $ | 92,494 | $ | 85,015 | ||||
Net Assets | $ | 81,732 | $ | 74,769 | ||||
Company’s share of net assets of associate | $ | 21,276 | $ | 16,240 | ||||
7 – Investments
As of and for the year ended December
31, 2021:
In $000s | Jan. 1, 2021 | Additions | Disposals | Fair Value Adjustment | Dec. 31, 2021 | |||||||||||||||
Short-term investments | ||||||||||||||||||||
Convertible debt instruments 1 | $ | 1,852 | $ | 0 | $ | (1,722 | ) | $ | (130 | ) | $ | 0 | ||||||||
Total short-term investments | $ | 1,852 | $ | 0 | $ | (1,722 | ) | $ | (130 | ) | $ | 0 | ||||||||
Non-current investments | ||||||||||||||||||||
Common shares 2 | $ | 28,416 | $ | 20,799 | $ | (15,882 | ) | $ | (11,847 | ) | $ | 21,486 | ||||||||
Vale Royalties financial instrument | 0 | 0 | (5,887 | ) | 5,887 | 0 | ||||||||||||||
Warrants and other 1 | 1,143 | 0 | (99 | ) | 622 | 1,666 | ||||||||||||||
Convertible debt instruments 1 | 15,525 | 0 | (12,470 | ) | (2,151 | ) | 904 | |||||||||||||
Total non-current investments | $ | 45,084 | $ | 20,799 | $ | (34,338 | ) | $ | (7,489 | ) | $ | 24,056 | ||||||||
Total investments | $ | 46,936 | $ | 20,799 | $ | (36,060 | ) | $ | (7,619 | ) | $ | 24,056 | ||||||||
| 1 | Fair value adjustment recorded within net income for the year. |
| 2 | Fair value adjustment recorded within Other Comprehensive Income (loss) for the year. |
99
During the year ended December 31, 2021, as part of the Company’sloss on conversion of $2.3 million was recognized within
ongoing
efforts to monetize itsnon-core
assets, Sandstorm disposed of common shares of other mining companies with a fair value on disposition of $15.9 million. During the year
, the Company acquired and disposed of certain derivative financial instruments relating to the market value of the Vale Royalties, classified as a level 2 fair value measurement, resulting in fair value gains of $5.9 million recognized withinn
eti
ncome. Also, during theyear
, the majority of the Company’s convertible debentures were redeemed for common shares. The resultingmark-to-market
net income.
As of and for the year ended December 31, 2020:
In $000s | Jan. 1, 2020 | Additions | Disposals | Transfers | Fair Value Adjustment | Dec. 31, 2020 | ||||||||||||||||||
Short-term investments | ||||||||||||||||||||||||
Convertible debt instruments 1 | $ | 10,801 | $ | 0 | $ | (11,006 | ) | $ | 556 | $ | 1,501 | $ | 1,852 | |||||||||||
Total short-term investments | $ | 10,801 | $ | 0 | $ | (11,006 | ) | $ | 556 | $ | 1,501 | $ | 1,852 | |||||||||||
Non-current investments | ||||||||||||||||||||||||
Common shares 2 | $ | 52,325 | $ | 11,456 | $ | (37,238 | ) | $ | (16,339 | ) | $ | 18,212 | $ | 28,416 | ||||||||||
Warrants and other 1 | 4,623 | 52 | (5,732 | ) | 0 | 2,200 | 1,143 | |||||||||||||||||
Convertible debt instruments 1 | 15,892 | 60 | 0 | (556 | ) | 129 | 15,525 | |||||||||||||||||
Total non-current investments | $ | 72,840 | $ | 11,568 | $ | (42,970 | ) | $ | (16,895 | ) | $ | 20,541 | $ | 45,084 | ||||||||||
Total investments | $ | 83,641 | $ | 11,568 | $ | (53,976 | ) | $ | (16,339 | ) | $ | 22,042 | $ | 46,936 | ||||||||||
| 1 | Fair value adjustment recorded within net income (loss) for the year. |
| 2 | Fair value adjustment recorded within Other Comprehensive Income (loss) for the year. |
8 – Revolving Facility and Deferred Financing Costs
In October 2021, Sandstorm amended its revolving credit agreement, allowing the Company to borrow up to $350 million and incorporating sustainability-linked performance targets to establish an Environment, Social, and Governance (“ESG”) linked credit facility (“ESG Revolving Facility”). The ESG Revolving Facility is for general corporate purposes, from a syndicate of banks including The Bank of Nova Scotia, Bank of Montreal, National Bank of Canada, Canadian Imperial Bank of Commerce, and Royal Bank of Canada (the “Syndicate”). The term of the ESG Revolving Facility is for four years and is extendable by mutual consent of Sandstorm and the Syndicate. The amounts drawn on the ESG Revolving Facility are subject to interest at LIBOR plus 1.875%–3.0% per annum, and the undrawn portion of the ESG Revolving Facility is subject to a standby fee of 0.422%–0.675% per annum, both of which are dependent on the Company’s leverage ratio.
The ESG Revolving Facility incorporates sustainability-linked incentive pricing terms that allow Sandstorm to reduce the borrowing costs from the interest rates described above as the Company’s ESG performance targets are met. These targets focus on increasing the Company’s producing assets which report under sustainability and climate related standards as well as maintaining and improving the Company’s
100
own external ESG rating and ensuring diverse representation at the senior management and board levels.
Under the credit agreement, the Company is required to maintain a leverage ratio of net debt divided by EBITDA (as defined in the credit facility agreement) of less than or equal to 4.00:1.00 for each fiscal quarter. The Company must also maintain an interest coverage ratio of greater than or equal to 3.00:1.00 for each fiscal quarter. The ESG Revolving Facility is secured against the Company’s assets, including the Company’s stream, royalty and other interests and investments.
As of December 31, 2021, the Company was in compliance with the covenants and there was 0 balance drawn on the ESG Revolving Facility.
Deferred financing costs are amortized on a straight-line basis over the term of the ESG Revolving Facility. At December 31, 2021, deferred financing costs, net of accumulated amortization, were $2.6 million (December 31, 2020 — $1.7 million).
9 – Share Capital and Reserves
A. | Authorized Share Capital |
The Company is authorized to issue an unlimited number of common shares without par value.
Under the Company’s normal course issuer bid (“NCIB”), the Company is able, until April 6, 2022, to purchase up to 19.1 million common shares. The NCIB provides the Company with the option to purchase its common shares from time to time.
During the year ended December 31, 2021, the Company, utilizing its current and previous NCIB, purchased and cancelled approximately 5.5 million common shares.
The Company has anequity program (the “ATM Program”) whereby it is permitted to issue up to an aggregate of $140 million worth of common shares from treasury at prevailing market prices to the public through the Toronto Stock Exchange, the New York Stock Exchange or any other marketplace on which the common shares are listed, quoted or otherwise trade. The volume and timing of distributions under the ATM Program is determined at the Company’s sole discretion, subject to applicable regulatory limitations. The ATM Program is effective until May 2022, unless terminated prior to such date by the Company. The Company has 0t utilized or sold any shares under the ATM Program.
at-the-market
The Company declared a dividend of
CAD
$0.02 per share on December 15, 2021. The full amount of the dividend was recorded as a payable and included within trade and other payables as at December 31, 2021
.
B. | Stock Options of the Company |
The Company has an incentive stock option plan (the “Option Plan”) whereby the Company may grant share options to eligible employees, officers, directors and consultants at an exercise price, expiry date, and vesting conditions to be determined by the Board of Directors. The maximum expiry date is five years from the grant date. All options are equity settled. The Option Plan permits the issuance of options which, together with the Company’s other share compensation arrangements, may not exceed 8.5% of the Company’s issued common shares as at the date of the grant.
101
During the year ended December 31, 2021, the Company granted
options with a weighted average exercise price of CAD
$
7.18and a fair value of $
3.3 million or $
1.11per option. The fair value of the options granted was determined using a
BSMusing the following weighted average assumptions: grant date share price and exercise price of CAD$
7.18, expected volatility of
30%, risk-free interest rate of
0.95%, dividend yield of
1.11%, and an expected life of
3years. Expected volatility was determined by considering the trailing
3year historical average share price volatility of similar companies in the same industry and business model.
A summary of the Company’s options and the changes for the period is as follows:
Number of options | Weighted average exercise price per share (CAD) 1 | |||||||
Options outstanding at December 31, 2019 | 7,568,533 | 6.06 | ||||||
Granted | 2,812,000 | 9.43 | ||||||
Exercised | (1,253,430 | ) | (4.42 | ) | ||||
Options outstanding at December 31, 2020 | 9,127,103 | 7.33 | ||||||
Granted | 2,968,000 | 7.18 | ||||||
Exercised | (855,761 | ) | (4.96 | ) | ||||
Options outstanding at December 31, 2021 | 11,239,342 | 7.47 | ||||||
| 1 | For options exercisable in British Pounds Sterling (“GBP”), exercise price is translated to Canadian Dollars (“CAD”) using the period end exchange rate. |
The weighted average remaining
contractual life of the options as at December 31, 2021 was 3.26 years (year ended December 31, 2020 — 3.41 years). The weighted average share price, at the time of exercise, for those shares that were exercised during the year ended December 31, 2021 was CAD
$
7.74 per share (year ended December 31, 2020 — CAD$
11.65). A summary of the Company’s options as of December 31, 2021 is as follows:
Year of expiry | Number outstanding | Vested | Exercise price per share (range) (CAD) 1 | Weighted average exercise price per share (CAD) 1, 2 | ||||
2022 | 914,010 | 914,010 | 4.94–15.00 | 5.43 | ||||
2023 | 3,118,332 | 3,118,332 | 5.92 | 5.92 | ||||
2024 | 1,427,000 | 951,338 | 8.89 | 8.89 | ||||
2025 | 2,812,000 | 937,340 | 9.43 | 9.43 | ||||
2026 | 2,968,000 | 0 | 7.18 | 0 | ||||
11,239,342 | 5,921,020 | 6.88 | ||||||
| 1 | For options exercisable in GBP, exercise price is translated to CAD using the period end exchange rate. |
| 2 | Weighted average exercise price of options that are exercisable. |
102
C. | Restricted Share Rights |
The Company has a restricted share plan (the “Restricted Share Plan”) whereby the Company may grant restricted share rights (“RSRs”) to eligible employees, officers, directors and consultants at an expiry date to be determined by the Board of Directors. Each restricted share right entitles the holder to receive a common share of the Company without any further consideration. The Restricted Share Plan permits the issuance of up to a maximum of 4,500,000 restricted share rights.
During the year ended December 31, 2021, the Company granted 343,200 RSRs with a
grant date
fair value of $1.9 million, a three year vesting term, and a weighted average grant date fair value of $5.64 per unit. As of December 31, 2021, the Company had 1,992,500 RSRs outstanding.D. | Diluted Earnings Per Share |
Diluted earnings per share is calculated based on the following:
In $000s (except for shares and per share amounts) | Year Ended December 31, 2021 | Year Ended December 31, 2020 | ||||||
Net income for the year | $ | 27,622 | $ | 13,817 | ||||
Basic weighted average number of shares | 193,974,313 | 187,507,754 | ||||||
Basic earnings per share | $ | 0.14 | $ | 0.07 | ||||
Effect of dilutive securities | ||||||||
Stock options | 1,684,992 | 2,732,900 | ||||||
Warrants | 0 | 4,318,675 | ||||||
Restricted share rights | 2,164,175 | 2,348,511 | ||||||
Diluted weighted average number of common shares | 197,823,480 | 196,907,840 | ||||||
Diluted earnings per share | $ | 0.14 | $ | 0.07 | ||||
The following table lists the number
of potentially dilutive
securities excluded from the computation of diluted earnings per share because the exercise prices exceeded the average market value of the common shares of CAD
$
8.76 during the year ended December 31, 2021 (December 31, 2020 — CAD$
10.48).Year Ended December 31, 2021 | Year Ended December 31, 2020 | |||||||
Stock options | 4,241,250 | 217,376 | ||||||
103
10 – | Income Taxes |
The income tax expense differs from the amount that would result from applying the federal and provincial income tax rate to the net income before income taxes.
These differences result from the following items:
In $000s | Year Ended December 31, 2021 | Year Ended December 31, 2020 | ||||||
Income before income taxes | $ | 44,853 | $ | 24,276 | ||||
| Canadian federal and provincial income tax rates | 27% | 27% | ||||||
Income tax expense based on the above rates | $ | 12,110 | $ | 6,555 | ||||
Increase (decrease) due to: | ||||||||
Non-deductible expenses and permanent differences | $ | 1,627 | $ | 1,525 | ||||
Non-taxable portion of capital gain or loss | 348 | (433) | ||||||
Withholding taxes | 2,178 | 1,940 | ||||||
Change in unrecognized temporary differences and other | 968 | 872 | ||||||
Income tax expense | $ | 17,231 | $ | 10,459 | ||||
The deferred tax liabilities are shown below:
In $000s | As at December 31, 2021 | As at December 31, 2020 | ||||||
Deferred Income Tax Liabilities | ||||||||
Non-capital losses | $ | 17,405 | $ | 24,922 | ||||
Investments and other | 274 | (735) | ||||||
Stream, royalty and other interests | (35,973) | (29,664) | ||||||
Total deferred income tax liabilities | $ | (18,294) | $ | (5,477) | ||||
Deferred tax assets and liabilities have been offset where they relate to income taxes levied by the same taxation authority and the Company has the legal right and intent to offset.
Non-capital
losses have been recognized as a deferred income tax asset to the extent there will be future taxable income against which the Company can utilize the benefit prior to their expiration. The Company recognized deferred tax assets in respect of tax losses as at December 31, 2021 of $64.5 million (2020 — $92.3 million) as it is probable that there will be future taxable profits to recover the deferred tax assets.104
The movement in net deferred income taxes is shown below:
In $000s | Year Ended December 31, 2021 | Year Ended December 31, 2020 | ||||||
Balance, beginning of the year | $ | (5,477 | ) | $ | 4,107 | |||
Recognized in net income (loss) for the year | (14,202 | ) | (7,595 | ) | ||||
Recognized in equity | 65 | 357 | ||||||
Recognized in other comprehensive income (loss) for the year | 1,320 | (2,346 | ) | |||||
Balance, end of year | $ | (18,294 | ) | $ | (5,477 | ) | ||
The Company has deductible unused tax losses, for which a deferred tax asset has been recognized, expiring as follows:
In $000s | Location | Amount | Expiration | |||||||
Non-capital loss carry-forwards | Canada | $ | 64,465 | 2030–2036 | ||||||
The aggregate
amount of deductible temporary differences associated with capital losses and other items, for which deferred income tax assets have not been recognized as at December 31, 2021 are $15.1 million (2020 — $13.0 million). No deferred tax asset is recognized in respect of these items because it is not probable that future taxable capital gains or taxable income will be available against which the Company can utilize the benefit.
11 – Administration and Project Evaluation Expenses
The administration expenses for the Company are as follows:
In $000s | Year Ended December 31, 2021 | Year Ended December 31, 2020 | ||||||
Corporate administration | $ | 3,198 | $ | 2,128 | ||||
Employee benefits and salaries | 2,824 | 2,276 | ||||||
Professional fees | 983 | 924 | ||||||
Administration expenses before share-based compensation | $ | 7,005 | $ | 5,328 | ||||
Equity settled share-based compensation (a non-cash expense) | 3,193 | 3,007 | ||||||
Total administration expenses | $ | 10,198 | $ | 8,335 | ||||
Project evaluation expenses consists of employee benefits and salaries of $2.9 million (2020 — $2.5 million), share-based compensation of $2.8 million (2020 — $2.6 million), and other of $2.1 million (2020 — $0.4 million).
105
12 – | Supplemental Cash Flow Information |
In $000s | Year Ended December 31, 2021 | Year Ended December 31, 2020 | ||||||
Change in non-cash working capital: | ||||||||
Trade receivables and other | $ | (4,213 | ) | $ | (553 | ) | ||
Trade and other payables | 1,872 | (2,169 | ) | |||||
Net (decrease) increase in cash | $ | (2,341 | ) | $ | (2,722 | ) | ||
Common shares received on conversion of convertible debentures | $ | 13,965 | $ | 0 | ||||
13 – Key Management Compensation
The remuneration of directors and those persons having authority and responsibility for planning, directing and controlling activities of the Company are as follows:
In $000s | Year Ended December 31, 2021 | Year Ended December 31, 2020 | ||||||
Salaries and benefits | $ | 2,588 | $ | 1,561 | ||||
Share-based payments | 4,368 | 4,068 | ||||||
Total key management compensation expense | $ | 6,956 | $ | 5,629 | ||||
106
14 – | Commitments and Contingencies |
In connection with its Streams, the Company has committed to purchase the following:
Stream | % of Life of Mine Gold or Relevant Commodity 5,6,7,8,9,10 | Per Ounce Cash Payment: lesser of amount below and the then prevailing market price of commodity (unless otherwise noted) 1,2,3,4 | ||
Black Fox | 8% | $566 | ||
Chapada | 4.2% | 30% of copper spot price | ||
Entrée | 5.62% on Hugo North Extension and 4.26% on Heruga | $220 | ||
Karma | 1.625% | 20% of gold spot price | ||
Relief Canyon | 32,022 ounces over 5.5 years and 4% thereafter | Varies | ||
Santa Elena | 20% | $468 | ||
Vatukoula | 25,920 ounces over 5.5 years and 2.9% thereafter | 20% of gold spot price | ||
Yamana silver stream | 20% | 30% of silver spot price | ||
| 1 | Subject to an annual inflationary adjustment. |
| 2 | For the Relief Canyon stream, after receipt of 32,022 gold ounces (the cost of which is NaN), the Company is entitled to purchase 4.0% of the gold and silver produced from the Relief Canyon Project for ongoing per ounce cash payments equal to 30%–65% of the spot price of gold or silver, with the range dependent on the concession’s existing royalty obligations. |
| 3 | For the Entrée Gold Stream, after approximately 8.6 million ounces of gold have been produced fr o m the joint venture property, the price increases to $500 per gold ounce. |
| 4 | For the Entrée silver stream, percentage of life of mine is 5.62% on Hugo North Extension and 4.26% on Heruga which the Company can purchase for the lesser of the prevailing market price and $5 per ounce of silver until 40.3 million ounces of silver have been produced from the entire joint venture property. Thereafter, the purchase price will increase to the lesser of the prevailing market price and $10 per ounce of silver. |
| 5 | For the Entrée Gold and silver stream, percentage of life of mine is 5.62% on Hugo North Extension and 4.26% on Heruga if the minerals produced are contained below 560 metres in depth. |
| 6 | For the Entrée Gold and silver stream, percentage of life of mine is 8.43% on Hugo North Extension and 6.39% on Heruga if the minerals produced are contained above 560 metres in depth. |
| 7 | For the Entrée copper stream, the Company has committed to purchase an amount equal to 0.42% of the copper produced from the Hugo North Extension and Heruga deposits. If the minerals produced are contained above 560 metres in depth, then the commitment increases to 0.62% for both the Hugo North Extension and Heruga deposits. Sandstorm will make ongoing per pound cash payments equal to the lesser of $0.50 and the then prevailing market price of copper, until 9.1 billion pounds of copper have been produced from the entire joint venture property. Thereafter, the ongoing per pound payments will increase to the lesser of $1.10 and the then prevailing market price of copper. |
| 8 | For the Chapada copper stream, the Company has committed to purchase an amount equal to 4.2% of the copper produced (up to an annual maximum of 3.9 million pounds of copper) until the mine has delivered 39 million pounds of copper to Sandstorm; then 3.0% of the copper produced until, on a cumulative basis, the mine has delivered 50 million pounds of copper to Sandstorm; then 1.5% of the copper produced thereafter, for the life of the mine. |
| 9 | Under the terms of the Yamana silver stream, Sandstorm has agreed to purchase an amount of silver from Cerro Moro equal to 20% of the silver produced (up to an annual maximum of 1.2 million ounces of silver), until Yamana has delivered to Sandstorm 7.0 million ounces of silver; then 9.0% of the silver produced thereafter. |
| 10 | Under the terms of the Vatukoula stream, after receipt of 25,920 gold ounces (the cost of which is 20% of the spot price), the Company is entitled to purchase 2.9% for the first 100,000 ounces of gold produced in a calendar year, and 2.55% for the volume of production above 100,000 ounces. |
107
As previously disclosed, Sandstorm became aware that a third party commenced legal proceedings against it in a Brazilian court. The proceedings involve severance owed to former employees of Colossus Mineração Ltda., a Brazilian subsidiary company of Colossus Minerals Inc. (an entity with which Sandstorm entered into a Stream). Since these severance claims, estimated to be approximately
million, remain outstanding, the claimants are seeking to recoup their claims from Sandstorm. Sandstorm intends on defending itself as it believes the case is without merit.
Subject to certain milestones, the Company has $3 million remaining to remit with respect to the Vatukoula Gold Stream agreement. The Vatukoula Gold Stream is further discussed in note 5 (b).
Sandstorm entered into an agreement to subscribe for shares of Americas Gold in an amount up to $10.8 million in 2022, at the option of Americas Gold.
In December 2021, the Company announced a $60 million financing package with Bear Creek Mining to facilitate its acquisition of the producing Mercedes gold-silver mine in Mexico from Equinox Gold Corp. The financing package includes a $37.5 million Gold Stream and a $22.5 million convertible debenture. The transaction is expected to close by March 31, 2022 and gold deliveries to Sandstorm will commence immediately thereafter.
15 – Segmented Information
The Company’s reportable operating segments, which are components of the Company’s business where separate financial information is available and which are evaluated on a regular basis by the Company’s Chief Executive Officer, who is the Company’s chief operating decision maker, for the purpose of assessing performance, are summarized in the tables below:
108
For the year ended December 31, 2021:
In $000s | Product | Sales | Royalty revenue | Cost of sales excluding depletion | Depletion | Stream, royalty and other interests impairments | Gain on revaluation of Vale Royalties financial instrument | Income (loss) before taxes | Cash flows from operating activities | |||||||||||||||||||||||||||
Aurizona, Brazil | Gold | $ | 0 | $ | 9,844 | $ | 0 | $ | 815 | $ | 0 | $ | 0 | $ | 9,029 | $ | 9,444 | |||||||||||||||||||
Black Fox, Canada | Gold | 4,154 | 0 | 1,309 | 1,888 | 0 | 0 | 957 | 2,845 | |||||||||||||||||||||||||||
Bracemac-McLeod, Canada 1 | Various | 0 | 5,487 | 0 | 1,545 | 0 | 0 | 3,942 | 4,995 | |||||||||||||||||||||||||||
Chapada, Brazil | Copper | 15,118 | 0 | 4,541 | 2,963 | 0 | 0 | 7,614 | 10,577 | |||||||||||||||||||||||||||
Diavik, Canada | Diamonds | 0 | 7,647 | 0 | 3,372 | 0 | 0 | 4,275 | 7,097 | |||||||||||||||||||||||||||
Fruta del Norte, Ecuador | Gold | 0 | 6,367 | 0 | 2,304 | 0 | 0 | 4,063 | 4,465 | |||||||||||||||||||||||||||
Houndé, Burkina Faso | Gold | 0 | 3,803 | 0 | 1,610 | 0 | 0 | 2,193 | 3,802 | |||||||||||||||||||||||||||
Karma, Burkina Faso | Gold | 4,065 | 0 | 824 | 1,935 | 0 | 0 | 1,306 | 3,241 | |||||||||||||||||||||||||||
Relief Canyon, United States | Gold | 10,499 | 0 | 0 | 4,711 | 0 | 0 | 5,788 | 10,499 | |||||||||||||||||||||||||||
Santa Elena, Mexico | Gold | 9,786 | 0 | 2,568 | 280 | 0 | 0 | 6,938 | 7,357 | |||||||||||||||||||||||||||
Vale Royalties, Brazil | Iron Ore | 0 | 4,398 | 0 | 1,444 | 0 | (5,887 | ) | 8,841 | 198 | ||||||||||||||||||||||||||
Yamana silver stream, Argentina | Silver | 25,460 | 0 | 7,603 | 10,415 | 0 | 0 | 7,442 | 17,857 | |||||||||||||||||||||||||||
Other 2 | Various | 2,640 | 5,592 | 0 | 2,422 | 408 | 0 | 5,402 | 8,658 | |||||||||||||||||||||||||||
Total Segments | $ | 71,722 | $ | 43,138 | $ | 16,845 | $ | 35,704 | $ | 408 | $ | (5,887 | ) | $ | 67,790 | $ | 91,035 | |||||||||||||||||||
Corporate: | ||||||||||||||||||||||||||||||||||||
Administration & Project evaluation expenses | $ | 0 | $ | 0 | $ | 0 | $ | 0 | $ | 0 | $ | 0 | $ | (17,968 | ) | $ | (11,492 | ) | ||||||||||||||||||
Foreign exchange loss | 0 | 0 | 0 | 0 | 0 | 0 | (645 | ) | 0 | |||||||||||||||||||||||||||
Loss on revaluation of investments | 0 | 0 | 0 | 0 | 0 | 0 | (1,659 | ) | 0 | |||||||||||||||||||||||||||
Finance (expense) income, net | 0 | 0 | 0 | 0 | 0 | 0 | (1,654 | ) | 38 | |||||||||||||||||||||||||||
Other | 0 | 0 | 0 | 0 | 0 | 0 | (1,011 | ) | 1,558 | |||||||||||||||||||||||||||
Total Corporate | $ | 0 | $ | 0 | $ | 0 | $ | 0 | $ | 0 | $ | 0 | $ | (22,937 | ) | $ | (9,896 | ) | ||||||||||||||||||
Consolidated | $ | 71,722 | $ | 43,138 | $ | 16,845 | $ | 35,704 | $ | 408 | $ | (5,887 | ) | $ | 44,853 | $ | 81,139 | |||||||||||||||||||
| 1 | Royalty revenue from Bracemac-McLeod consists of $2.8 million from copper and $2.7 million from zinc. |
| 2 | Where a stream and royalty interest represents less than 10% of the Company’s sales, gross margin or aggregate asset book value and represents an interest on gold, silver or other metal, the interest has been summarized under Other. Other includes revenue from Gualcamayo, Emigrant Springs, Mine Waste Solutions, Thunder Creek, HM Claim, Triangle Zone, Ming and others. Includes revenue from interests located in Canada of $4.9 million, Argentina of $1.0 million and other of $2.3 million. Includes revenue from gold of $7.6 million and other base metals of $0.6 million. |
1
09
For the year ended December 31, 2020
:
In $000s | Product | Sales | Royalty revenue | Cost of sales excluding depletion | Depletion | Stream, royalty and other interests impairments | Other | Income (loss) before taxes | Cash flows from operating activities | |||||||||||||||||||||||||||
Aurizona, Brazil | Gold | $ | 0 | $ | 8,850 | $ | 0 | $ | 1,067 | $ | 0 | $ | 0 | $ | 7,783 | $ | 7,950 | |||||||||||||||||||
Black Fox, Canada | Gold | 3,693 | 0 | 1,194 | 1,014 | 0 | 0 | 1,485 | 2,500 | |||||||||||||||||||||||||||
Bracemac-McLeod, Canada 1 | Various | 0 | 2,946 | 0 | 1,485 | 0 | 0 | 1,461 | 3,234 | |||||||||||||||||||||||||||
Chapada, Brazil | Copper | 9,904 | 0 | 3,021 | 2,914 | 0 | 0 | 3,969 | 6,883 | |||||||||||||||||||||||||||
Diavik, Canada | Diamonds | 0 | 2,716 | 0 | 2,085 | 7,862 | 392 | (7,623 | ) | 3,075 | ||||||||||||||||||||||||||
Fruta del Norte, Ecuador | Gold | 0 | 3,302 | 0 | 1,256 | 0 | 0 | 2,046 | 1,408 | |||||||||||||||||||||||||||
Houndé, Burkina Faso | Gold | 0 | 8,740 | 0 | 3,816 | 0 | 0 | 4,924 | 6,633 | |||||||||||||||||||||||||||
Karma, Burkina Faso | Gold | 8,184 | 0 | 1,619 | 3,843 | 0 | 0 | 2,722 | 6,438 | |||||||||||||||||||||||||||
Relief Canyon, United States | Gold | 7,096 | 0 | 0 | 2,820 | 0 | 0 | 4,276 | 7,096 | |||||||||||||||||||||||||||
Santa Elena, Mexico | Gold | 9,749 | 0 | 2,552 | 312 | 0 | 0 | 6,885 | 7,100 | |||||||||||||||||||||||||||
Yamana silver stream, Argentina | Silver | 19,199 | 0 | 5,660 | 10,119 | 0 | 0 | 3,420 | 13,540 | |||||||||||||||||||||||||||
Other 2 | Various | 835 | 7,811 | 0 | 2,393 | 1,015 | 0 | 5,238 | 7,553 | |||||||||||||||||||||||||||
Total Segments | $ | 58,660 | $ | 34,365 | $ | 14,046 | $ | 33,124 | $ | 8,877 | $ | 392 | $ | 36,586 | $ | 73,410 | ||||||||||||||||||||
Corporate: | ||||||||||||||||||||||||||||||||||||
Administration & Project evaluation expenses | $ | 0 | $ | 0 | $ | 0 | $ | 0 | $ | 0 | $ | 0 | $ | (13,868 | ) | $ | (7,728 | ) | ||||||||||||||||||
Foreign exchange loss | 0 | 0 | 0 | 0 | 0 | 0 | (345 | ) | 0 | |||||||||||||||||||||||||||
Gain on revaluation of investments | 0 | 0 | 0 | 0 | 0 | 0 | 3,830 | 0 | ||||||||||||||||||||||||||||
Finance (expense) income, net | 0 | 0 | 0 | 0 | 0 | 0 | (1,792 | ) | 94 | |||||||||||||||||||||||||||
Other | 0 | 0 | 0 | 0 | 0 | 135 | (135 | ) | (160 | ) | ||||||||||||||||||||||||||
Total Corporate | $ | 0 | $ | 0 | $ | 0 | $ | 0 | $ | 0 | $ | 135 | $ | (12,310 | ) | $ | (7,794 | ) | ||||||||||||||||||
Consolidated | $ | 58,660 | $ | 34,365 | $ | 14,046 | $ | 33,124 | $ | 8,877 | $ | 527 | $ | 24,276 | $ | 65,616 | ||||||||||||||||||||
| 1 | Royalty revenue from Bracemac-McLeod consists of $1.4 million from copper and $1.5 million from zinc. |
| 2 | Where a stream and royalty interest represents less than 10% of the Company’s sales, gross margin or aggregate asset book value and represents an interest on gold, silver or other metal, the interest has been summarized under Other. Other includes royalty revenue from Gualcamayo, Emigrant Springs, Mine Waste Solutions, San Andres, Thunder Creek, Ming and others. Includes royalty revenue from royalty interests located in Canada of $4.0 million, the United States of $0.6 million, Argentina of $1.1 million, Honduras of $1.0 million and other of $1.9 million. Includes royalty revenue from gold of $8.1 million and other base metals of $0.5 million. |
110
Total assets as of:
In $000s | December 31, 2021 | December 31, 2020 | ||||||
Aurizona | $ | 11,124 | $ | 11,539 | ||||
Black Fox | 5,504 | 7,391 | ||||||
Bracemac-McLeod | 1,089 | 2,142 | ||||||
Chapada | 49,709 | 52,672 | ||||||
Diavik | 7,742 | 10,564 | ||||||
Fruta del Norte | 31,174 | 33,377 | ||||||
Hod Maden 1 | 69,131 | 102,484 | ||||||
Houndé | 31,179 | 33,374 | ||||||
Hugo North Extension and Heruga 2 | 56,628 | 51,592 | ||||||
Karma | 7,263 | 9,356 | ||||||
Relief Canyon | 18,910 | 23,621 | ||||||
Santa Elena | 1,152 | 1,511 | ||||||
Vale Royalties | 120,543 | 0 | ||||||
Vatukoula | 27,716 | - | ||||||
Yamana silver stream | 37,954 | 48,369 | ||||||
Other 3 | 93,221 | 89,724 | ||||||
Total Segments | $ | 570,039 | $ | 477,716 | ||||
Corporate: | ||||||||
Cash and cash equivalents | $ | 16,166 | $ | 113,776 | ||||
Investments | 24,056 | 46,936 | ||||||
Other assets | 10,597 | 11,493 | ||||||
Total Corporate | $ | 50,819 | $ | 172,205 | ||||
Consolidated | $ | 620,858 | $ | 649,921 | ||||
| 1 | Includes royalty interest of $5.8 million and investment in associate of $63.3 million at December 31, 2021. Includes royalty interest of $5.8 million and investment in associate of $96.7 million at December 31, 2020. |
| 2 | Includes stream interest of $35.4 million and investment in associate of $21.3 million at December 31, 2021. Includesstream interest of $35.4 million and investment in associate of $16.2 million at December 31, 2020. |
| 3 | Where a stream and royalty interest represents less than 10% of the Company’s sales, gross margin or aggregate asset book value and represents an interest on gold, silver or other metal, the interest has been summarized under Other. Includes Mt. Hamilton, Prairie Creek, Gualcamayo, Emigrant Springs, Mine Waste Solutions, Thunder Creek, Hackett River, Lobo-Marte, Agi Dagi & Kirazli, HM Claim, Triangle Zone, Ming, and others. |
111
Non-current
assets by geographical region as of: In $000s | December 31, 2021 1 | December 31, 2020 1 | ||||||
North America | ||||||||
Canada | $ | 45,917 | $ | 54,013 | ||||
USA | 41,660 | 39,113 | ||||||
Mexico | 4,034 | 4,598 | ||||||
South & Central America | ||||||||
Argentina | $ | 51,627 | $ | 62,039 | ||||
Brazil | 177,640 | 65,075 | ||||||
Ecuador | 29,675 | 31,977 | ||||||
French Guiana | 5,160 | 5,160 | ||||||
Chile | 2,460 | 2,460 | ||||||
Africa | ||||||||
Burkina Faso | $ | 38,565 | $ | 41,749 | ||||
South Africa | 2,745 | 2,980 | ||||||
Other | ||||||||
Turkey | $ | 72,917 | $ | 106,402 | ||||
Mongolia | 57,271 | 52,235 | ||||||
Fiji | 27,590 | - | ||||||
Australia | 3,220 | 3,401 | ||||||
Other | 2,717 | 4,258 | ||||||
Consolidated | $ | 563,198 | $ | 475,460 | ||||
| 1 | Includes Stream, royalty and other interests (note 5) and Investment in associate (note 6). |
16 – Subsequent Event
Subsequent to year end, the Company announced that it had reached an agreement with Royalty North Partners Ltd. to sell its 30% interest in Hod Maden and its equity interest in Entrée. In consideration, Sandstorm will receive a flagship Gold Stream on Hod Maden and a portion of debt and equity in the resulting issuer. The transaction is subject to various closing conditions and is expected to close in the second half of 2022. The accounting for the transaction will be finalized on closing based on the facts and circumstances at that time. With this transaction, Sandstorm intends to unlock additional value in Hod Maden through the
re-rating
of the asset as a Gold Stream in its portfolio and further repositions Sandstorm as a pure-play precious metals royalty and streaming company.112