Exhibit 99.1
Interval Leisure Group June 2016 Investor Presentation 1
2 Cautionary Language Concerning Forward-Looking Statements This presentation may contain “forward-looking statements” within the meaning of the Private Securities Litigation Reform Act of 1995. These forward-looking statements include statements relating to the anticipated financial performance, business prospects, new developments, and similar matters of/relating to Interval Leisure Group, Inc. (“ILG”), and/or statements that use words such as “anticipates,” “estimates,” “expects,” “intends,” “plans,” “believes,” and similar expressions. These forward-looking statements are based on management’s current expectations and assumptions, which are inherently subject to uncertainties, risks, and changes in circumstances that are difficult to predict. Actual results could differ materially from those contained in the forward-looking statements included herein for a variety of reasons, including, among others: adverse trends in economic conditions generally or in the vacation ownership, vacation rental, and travel industries; adverse changes to, or interruptions in, relationships with third parties; lack of available financing for, or insolvency or consolidation of developers; decreased demand from prospective purchasers of vacation interests; travel-related health concerns; changes in our senior management; regulatory changes; our ability to compete effectively and successfully introduce new products and services; our ability to successfully manage and integrate acquisitions; our ability to market vacation ownership interest successfully and comply with applicable Hyatt, Westin and Sheraton brand standards; a change of control under the Master License Agreements with Hyatt and Starwood; impairments of assets, the restrictive covenants in our revolving credit facility, adverse trends in key vacation destinations; business interruptions in connection with our technology systems; ability of managed homeowners’ associations to collect sufficient maintenance fees; third parties not repaying loans or extensions of credit; and our ability to expand successfully in international markets and manage risks related to international operations. Certain of these and other risks and uncertainties are discussed in ILG’s filings with the Securities and Exchange Commission, including in its reports on Form 10-K and Form 10-Q. Other unknown or unpredictable factors also could have a material adverse effect on ILG’s business, financial condition, and results of operations. In light of these risks and uncertainties, these forward-looking statements may not occur. Accordingly, you should not place undue reliance on these forward-looking statements, which only reflect the views of ILG management as of the date of this presentation. ILG does not undertake to update these forward-looking statements. . Safe harbor
Presentation overview 3 Part 1 Overview of ILG and the industry PART 1 Overview of ILG and the industry Part 2 Exchange and Rental Appendix Part 3 Vacation Ownership Part 4 Our diversified business platform
ILG evolution: Platform of business leaders ILG Spinoff 2007 Acquired 2010 Acquired 2007 Founded 1976 Acquired 2012 Acquired 2013 Acquired 2013 Acquired 2014 Spin-off from IAC in 2008 Founded 1968 Founded 1973 Founded 1981 Founded 1984 Founded 2001 Founded 1994 4 Acquired 2016 Founded 1980 60’s 70’s 80’s 90’s 2008 2009 2010 2011 2012 2013 2015 2014 2007 2016
5 ILG today: A leading provider of professionally delivered vacation experiences Development & Financing Sales & Marketing Vacation Rentals Resort Management Exchange Club Services Exchange & Rental Vacation Ownership Engages in sales, marketing and financing of vacation ownership interests and in the management of vacation ownership resorts (Management) Offers access to vacation accommodations and other travel-related transactions and services to leisure travelers through: timeshare exchange, vacation rental, membership services, and developer services (Exchange)
6 The VO industry has enjoyed decades of strong growth and the receivable portfolios exhibited resilience during the financial crisis The industry recorded strong growth through all cycles since 1974, other than during the financial crisis of 2008 During the financial crisis receivables financing was largely unavailable, leading to a decrease in sales and developer bankruptcies In 2015 the industry exhibited strong growth in total sales volume and average sales price Annualized Growth 1974-1984 38% Annualized Growth 1984-1994 7% Annualized Growth 1994-2004 17% $8.6B U.S. Vacation Ownership Sales since 19751 Consumer ABS 60+ Day Delinquencies2 (1) State of the Vacation Timeshare Industry: United States Study, 2016 Edition, ARDA (2) Standard and Poor’s Financial Services LLC (3) Per interval or interval equivalent 2014 2015 % Change Sales Volume ($ in billions) $7.9 $8.6 9% Occupancy 78.3% 79.9% 2% Avg. sales price3 $20,020 $22,240 11% U.S. Industry Metrics1 Annualized Growth 2009-2015 6% $0.0 $2.0 $4.0 $6.0 $8.0 $10.0 $12.0 0% 1% 2% 3% 4% 5% 6% Dec-05 Oct-06 Aug-07 Jun-08 Apr-09 Feb-10 Dec-10 Oct-11 Aug-12 Jun-13 Apr-14 Feb-15 Dec-15 Timeshare Loans Auto Loans (Prime) Auto Loans (Subprime) Credit Cards
7 Vacation ownership provides a wide array of benefits and services versus peer-to-peer accommodations Activities Safety/Security In-house services Ownership Living space Additional benefits Quality standards X – X – X – X – X X X – X – Vacation ownership Peer-to-peer accommodations
New timeshare owners are younger, more affluent and more diverse Timeshare Owner Demographics 2014 All 2014 New1 Median Age 51 39 Own Primary Residence 90% 91% Married/Partnership 78% 79% % w/ Children Residing at Home 34% 51% College Graduate 67% 72% Median Household Income $89,500 $94,800 Ethnicity White Caucasian 71% 49% Black/African American 12% 23% Hispanic 13% 19% Asian/Asian American 6% 11% (1) Owners who purchased in the prior 3 years Source: ARDA, Owner’s Report- Shared Vacation Ownership 2014 More diverse, younger owners 39% are GenXers and 30% are Millennials Highly educated and employed full-time More disposable income Strong advocacy 71% likely to recommend timeshare ownership in general 75% likely to recommend home resort or vacation ownership club 8 New Owners
Presentation overview 9 Part 2 Exchange and Rental segment Part 1 Overview of ILG and the industry Part 2 Exchange and Rental Appendix Part 3 Vacation Ownership Part 4 Our diversified business platform
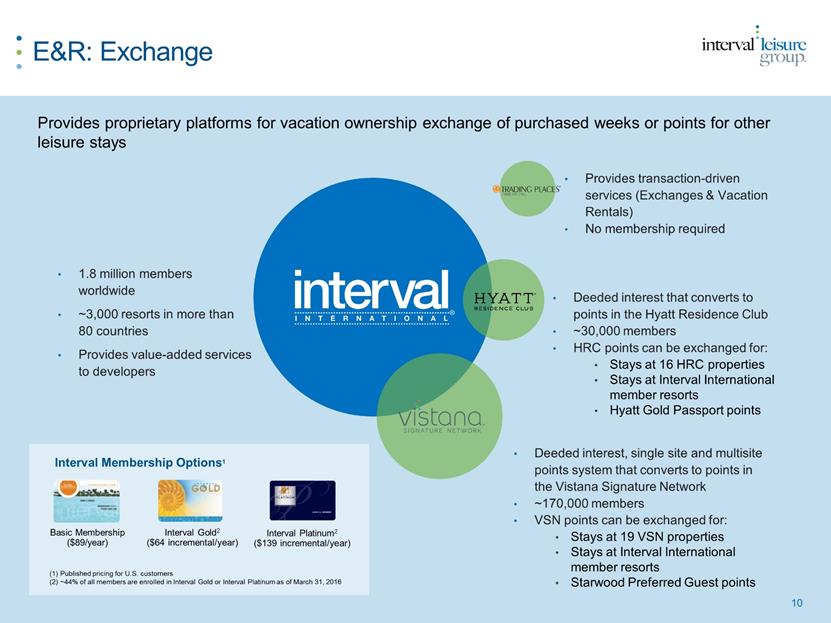
10 E&R: Exchange Provides proprietary platforms for vacation ownership exchange of purchased weeks or points for other leisure stays 1.8 million members worldwide ~3,000 resorts in more than 80 countries Provides value-added services to developers Deeded interest that converts to points in the Hyatt Residence Club ~30,000 members HRC points can be exchanged for: Stays at 16 HRC properties Stays at Interval International member resorts Hyatt Gold Passport points Provides transaction-driven services (Exchanges & Vacation Rentals) No membership required Interval Membership Options1 Basic Membership ($89/year) Interval Gold2 ($64 incremental/year) Interval Platinum2 ($139 incremental/year) (1) Published pricing for U.S. customers (2) ~44% of all members are enrolled in Interval Gold or Interval Platinum as of March 31, 2016 Deeded interest, single site and multisite points system that converts to points in the Vistana Signature Network ~170,000 members VSN points can be exchanged for: Stays at 19 VSN properties Stays at Interval International member resorts Starwood Preferred Guest points
11 E&R: Rentals Hawaii Lodging Statistics1 One of the largest operators of resorts in Hawaii Hawaii’s ADR and occupancy rates are higher than those for the U.S. market1 2015 ADR: Hawaii $243.93 vs. U.S. $120.01 2015 Occupancy: Hawaii 78.8% vs. U.S. 65.6% ~ 50 resorts under management in Hawaii, Orlando and other locations Fee-based model for rental services and related management of hotels, condominium resorts and HOAs Related services provided: Sales, marketing & revenue management Accounting Purchasing support Interior decoration and renovation (1) Source: Smith Travel Research $140 $160 $180 $200 $220 $240 $260 60% 62% 64% 66% 68% 70% 72% 74% 76% 78% 80% 2009 2010 2011 2012 2013 2014 2015 Occupancy ADR
Presentation overview 12 Part 3 Vacation Ownership segment Part 1 Overview of ILG and the industry Part 2 Exchange and Rental Appendix Part 3 Vacation Ownership Part 4 Our diversified business platform
13 Vacation Ownership Resort and Vacation Network Management Rental Operations and Ancillary Services Consumer Financing 22 resorts in 8 states/territories in 3 countries Exclusive global license for Westin and Sheraton in VO 18 sales centers Developed 5,000+ units Manage 77 HOAs Ownership base of 220,000+ owner-families (~170,000 members of VSN) Cost-plus management contracts Rental revenue from VO resorts, fractional residence properties and Transferred hotels Ancillary services including sales at restaurants, spas, golf courses and other retail/service outlets at resorts Five Transferred hotels with 1,484 rooms Plans to complete phased conversions of hotel keys over time to VO units Portfolio of unsecuritized receivables $463M at 3/31/16 Average FICO score on originated loans 730 Actual default rate 3.5% Weighted average interest rate 13% 16 resorts in 8 states/territories Exclusive global license for Hyatt in VO 7 sales centers Developed 1,000+ units Manage 17 HOAs ~30,000 owner-families/members of HRC Cost-plus management contracts Rental revenue from VO resorts, fractional residences and the Hyatt Carmel Highlands Hotel Ancillary services including sales at restaurants, spas, golf courses and other retail/service outlets at resorts Portfolio of unsecuritized receivables $33M at 3/31/16 Average FICO score on originated loans 716 Actual default rate 3.8% Weighted average interest rate 14% Note: Information as of 12/31/15, unless otherwise noted Vistana Signature Experiences (VSE) Hyatt Vacation Ownership (HVO) Vacation ownership: Overview of Vistana Signature Experiences and Hyatt Vacation Ownership
14 Vacation ownership: Attractive and growing resort portfolio (1) “Completed Inventory” yield based on pricing as of year-end 2015, and includes inventory on hand, projected returns due to mortgage receivable defaults in the future, as well as projected purchases through 2018 from existing third-party agreements and other third-party sources for Vistana. (2) Projections for “In Development and Future Phases” and “Transferred Hotels” are based on inventory from build out of current active development projects and future conversion of transferred properties. Projected yield for these categories include 2 percent annual price growth and excludes future returns pursuant to GAAP accounting methodology. Yield projections are subject to change due to market dynamics, ongoing review of development, and operational performance within mortgage portfolio, sales and marketing, and resort business lines. (3) Artist rendering (4) The Westin Resort and Spa, Los Cabos, is currently not operational. Transferred Hotels Completed Inventory1 In Development and Future Phases2 THE WESTIN NANEA OCEAN VILLAS3 THE WESTIN ST. JOHN RESORT AND VILLAS SHERATON BROADWAY PLANTATION THE WESTIN NANEA OCEAN VILLAS 3 SHERATON VISTANA VILLAGES HYATT WILD OAK RANCH HYATT COCONUT PLANTATION RESORT SHERATON KAUA’I RESORT THE WESTIN RESORT & SPA, CANCUN THE WESTIN RESORT & SPA, PUERTO VALLARTA HYATT KA’ANAPALI BEACH, A HYATT RESIDENCE CLUB RESORT WESTIN LAGUNAMAR OCEAN RESORT VILLAS & SPA, CANCUN SHERATON VISTANA RESORT Expected sales value of inventory $6.7 Billion $3.8 Billion $1.7 Billion $1.2 Billion SHERATON STEAMBOAT RESORT THE WESTIN RESORT & SPA, LOS CABOS 4

15 Vacation ownership: Snapshot of 2013 - 2016 resort development Projects(1) 2013 2014 2015 2016E(2) 2017E (2) 2018E+(2) Westin St. John St. John, US VI ----- 18 36 Westin Desert Willow Palm Desert, CA 22 16 22 Westin Nanea Maui, HI ----- ----- Westin Los Cabos(3) Los Cabos, MX ----- ----- ----- Westin Cancun Cancun, MX ----- ----- ----- Hyatt Ka’anapali Beach JV Maui, HI ----- 131 ----- ----- ----- ----- Hyatt Coconut Plantation Bonita Springs, FL ----- ----- ----- Hyatt Wild Oak Ranch San Antonio, TX ----- ----- ----- Conversion of 96 rooms 1st Phase 2017 390 units total 1st Phase 2017 Conversion of 243 rooms Phased conversion of 379 rooms (1) For 2013-2015 represents the number of units which received a certificate of occupancy in the year. For 2016 and beyond represents the number of units expected to receive a certificate of occupancy, or the hotel rooms expected to be converted over time, according to the 2016 development plan. (2) Estimates as of May 9, 2016 (3) Property currently closed Sales Galleries 2013 2014 2015 2016E(2) 2017E(2) 2018E+(2) Number of sales galleries at year-end 20 21 25 25 28 28 Recently opened and planned galleries Westin Cancun Westin Nanea Westin Maui Westin Los Cabos Sheraton Kauai Hyatt Key West Sheraton Steamboat Phased build-out of 144 units Phased build-out of 264 units Phased build-out of 192 units
Note: Cash Flows exclude acquisition cost. (1) Assumes annual securitization from year 2 forward Illustrative example of project life cycle for “Future Phases” Phased build out of additional units at existing resort to improve capital efficiency and returns Pre-sales generate sufficient cash flow to fund development after year 1 VOI sales fully ramped-up after year 4 and generate significant cash flow via securitizations1 Leverages existing common areas and facilities for first 6 years Additional amenities and infrastructure (i.e. club house, check-in facility, parking) built year 7 to support increased number of units Creates stable, recurring fee streams and future sales opportunities from new owners Target pre-tax unlevered IRR >20% Sample project: Phased build out at existing resort 16 Annual Cash Flow Cumulative Cash Flow EBITDA Margin 3 15% 17% 21% 22% 26% 31% 32% 33% 33% 36% Units Completed 0% 9% 17% 25% 36% 47% 60% 74% 88% 100% Time 0 Year 1 Year 2 Year 3 Year 4 Year 5 Year 6 Year 7 Year 8 Year 9 Year 10 Terminal Time 0 Year 1 Year 2 Year 3 Year 4 Year 5 Year 6 Year 7 Year 8 Year 9 Year 10 Ongoing Developer Developer (pre-sale) Financing Resort (incl Club and Mgt) Capital Net Cash Flow
Note: Cash Flows exclude acquisition cost. (1) Assumes yearly securitization from year 3 forward. Year 1 developer cash flow is negative due to timing of securitization. Sample project: Hotel conversion Illustrative example of project life cycle for “Transferred Hotels” Phased conversion to improve capital efficiency and returns Existing hotel converted to vacation ownership units in phases to limit disruption of hotel operations and better match sales pace VOI sales fully ramped-up after year 2 and generate significant cash flow via securitizations1 60% of investment through year 3 is to improve amenities and infrastructure which benefits entire project and supports sales pace Creates stable, recurring fee streams and future sales opportunities from new owners Target pre-tax unlevered IRR >20% 17 Annual Cash Flow Cumulative Cash Flow Time 0 Year 1 Year 2 Year 3 Year 4 Year 5 Year 6 Year 7 Year 8 Year 9 Year 10 Ongoing Developer Developer (pre-sale) Financing Resort (incl Club and Mgt) Capital Net Cash Flow
Vacation ownership: Resort management ~ 175 resorts managed Fee for service, predictable revenues VRI/TPI manages resorts in the U.S., Mexico and Canada VRIE is a JV with CLC World to manage European timeshare resorts Spain, England, France and Portugal 18
Presentation overview 19 Part 4 Our diversified business platform Part 1 Overview of ILG and the industry Part 2 Exchange and Rental Appendix Part 3 Vacation Ownership Part 4 Our diversified business platform
20 Diversified & complementary businesses (1) Revenue net of pass-throughs. Derived from Unaudited pro forma condensed combined Income Statement in ILG’s Form S-4 filed with the SEC (Registration statement No. 333-208567) (2) Reflects the elimination of intercompany revenue and expenses between ILG entities and Vistana and an adjustment to consumer financing revenue to convert interest income recognition to the level-yield method. Service and membership revenue is largely recurring and predictable Fee-for-service model for membership and exchange business “Sticky” cost-plus resort management contracts tied to the Hyatt®, Sheraton® and Westin® brands in vacation ownership Rental fee for service income dependent on transient occupancy Long term European management contracts Fee for service model for other vacation ownership management contracts Sales of vacation ownership driven by strong pipeline and infrastructure 3 upper upscale brands Embedded sales value of inventory $5.5B for Vistana $1.3B for HVO Sales centers 18 for Vistana 7 for HVO Rental and ancillary is dependent on transient occupancy Consumer financing provides a profitable income stream linked to sales growth Revenue FY ended December 31, 20151 38% 28% 28% 6% Pro forma combined Service and membership Sales of VO Rental and ancilliary Consumer financing $1,275M 2 78% 6% 15% 1% ILG $545M 9% 44% 36% 11% Vistana $743M
Combined company guidance 2016 2016 Guidance (in millions) ILG plus 8 months of Vistana1 Low High Consolidated Revenues2 $1,350 $1,450 Adjusted EBITDA $282 $302 Adjusted free cash flow $155 $185 21 $350M securitization 2H 2016 $463M unsecuritized receivables at 3/31/16 Net proceeds to fund Vistana’s development activity through mid 2017 (including Westin Nanea, rebuilding Westin Los Cabos and beginning of Westin Cancun) Reflects the estimated impact of purchase accounting on revenue ILG’s 2016 Adjusted EBITDA expected to be relatively consistent with 2015 Reflects investment in revenue-producing initiatives at Interval International and HVO’s sales and marketing platform which are anticipated to drive contributions in future periods Includes partial first year synergies as well as additional corporate expenses associated with the combined company Key assumptions Note: Guidance given as of May 9, 2016 except for the exclusion of an adjustment for percentage of completion accounting in Adjusted EBITDA following the SEC’s publication of compliance and disclosure interpretations related to non-GAAP financial measures on May 17, 2016. See Appendix for reconciliation. These expectations of future performance are for continuing operations and exclude the impact of any potential acquisitions or restructuring activities. Our full year numbers will not reflect a full 8 months of Vistana as the transaction closed on May 11, 2016 Includes an estimated $300 million of pass-throughs
22 Capacity for growth Low leverage and significant portfolio available for securitizations (1) In connection with the transaction, ILG purchased certain assets from Starwood for ~$123 million in cash, subject to adjustment (2) Excludes receivables securitizations (3) See Appendix for reconciliation (4) Based on mid-point of guidance. See Appendix for reconciliation ($ in millions) ILG stand-alone Transaction-related adjustments Combined company following transaction-related adjustments As of 3/31/16 Unsecuritized receivables $33 $463 $496 Cash $97–$97 Debt $600M Credit Facility $62 $1231 $185 5.625% Sr. Notes due 2023 350 350 Total Debt $412 $123 $5352 Net Debt $315 $123 $4382 Leverage calculation 2015 ILG Adj. EBITDA3 $185 2016 ILG + 8mo. of Vistana Adj. EBITDA4 $292 Pro forma Net Leverage 1.7x 1.5x
23 Strategic initiatives: Drive long term growth from diverse foundation Increase efficiency and velocity of VO sales Build-out Vistana and HVO embedded inventory in capital efficient manner Ramp-up recently-opened sales centers and expand number of distribution points Launch HVO pure points club Evaluate opportunities for asset-light structures (e.g. just-in-time inventory and fee-for-service) Implement new products and services leveraging IT and marketing infrastructure in Interval Network Execute on integration activities and realize synergies from Vistana acquisition Evaluate tuck-in acquisitions in complementary businesses Consistent and periodic securitization of receivables to fund development plan
24 Leading position across all businesses Exclusive global master license to the Hyatt®, Westin® and Sheraton® brands in vacation ownership Experienced management team and Board of Directors Diversified revenue streams, with meaningful contribution from fee-for-service and other recurring, predictable sources Significant growth opportunities with over $6.7 billion of embedded sales value of inventory Strong balance sheet and cash flow profile Key investment highlights Scale, financial strength and product portfolio to drive growth
Appendix 25
26 Recent financial performance SELECTED DATA ($MM except EPS) March 31, 2016 March 31, 2015 Year Over Year % Change Year Ended December 31, 2015 Year Ended December 31, 2014 Year Over Year % Change Exchange and Rental revenue $133.9 $135.6 (1.2)% $501.3 $483.4 3.7% Vacation Ownership revenue 52.0 48.9 6.3% 196.1 131.0 49.7% Total Revenue 185.9 184.6 0.7% 697.4 614.4 13.5% Revenue excluding pass-throughs 147.6 146.6 0.7% 545.6 502.2 8.7% Gross profit 103.2 102.2 1.0% 380.7 349.9 8.8% Interest expense 6.2 2.8 126.4% 21.4 7.1 199.4% Net income attributable to common stockholders 22.2 25.3 (12.2)% 73.3 78.9 (7.1)% Adjusted net income 23.7 25.0 (5.1)% 76.4 80.3 (4.9)% Adjusted EBITDA 54.8 53.2 3.0% 184.9 172.7 7.1% Diluted EPS $0.38 $0.44 (13.6)% $1.26 $1.36 (7.4)% Adjusted diluted EPS $0.41 $0.43 (4.7)% $1.32 $1.39 (5.0)% BALANCE SHEET DATA Cash and cash equivalents $96.9 $93.1 Debt 403.0 415.7 CASH FLOW DATA Net cash provided by operating activities $40.1 $64.7 (38.0)% $142.7 $110.7 29.0% Free cash flow 33.5 59.9 (44.0)% 122.4 91.6 33.7%
27 Non-GAAP reconciliation - 2016 outlook (1) (2) (2) (3) Note: Guidance given as of May 9, 2016 except for the exclusion of an adjustment for percentage of completion accounting (unfavorable $17M in Adjusted EBITDA in both scenarios) following the SEC’s publication of compliance and disclosure interpretations related to non-GAAP financial measures on May 17, 2016. Guidance reflects the estimated impact of purchase accounting on revenue. Other effects of purchase accounting are still under review and are not reflected in the guidance. These expectations of future performance are for continuing operations and exclude the impact of any potential acquisitions or restructuring activities. (1) Our full year numbers will not reflect a full 8 months of Vistana as the transaction closed on May 11, 2016 Low High Adjusted EBITDA 282 $ 302 $ Non-cash compensation expense (17) (17) Acquisition related and restructuring costs (8) (8) Depreciation and amortization (64) (64) Interest, net (24) (24) Income tax provision (64) (71) Net income attributable to common stockholders 105 $ 118 $ Net cash provided by operating activities 138 $ 153 $ Securitization proceeds net of debt issuance costs and repayments of securitized debt 170 170 Changes in restricted cash (14) (14) Transaction related expenses 18 18 Less: Capital expenditures (157) (142) Adjusted free cash flow 155 $ 185 $ Current Guidance (In millions) ILG plus 8 months of Vistana 1
Operating metrics: Exchange and Rental 28 Source: Company management (1) Refer to definitions contained in the Glossary of terms 2016 1Q 2Q 3Q 4Q FY 1Q 2Q 3Q 4Q FY 1Q Key Metrics (1) Exchange and Rental Revenue Total Exchange & Rental revenue (MM) $ 130.1 $ 116.8 $ 120.2 $ 116.3 $ 483.4 $ 135.6 $ 124.6 $ 124.9 $ 116.2 $ 501.3 $ 133.9 % of Consolidated Revenue 82.8% 81.4% 82.0% 69.6% 78.7% 73.5% 71.7% 71.8% 70.4% 71.9% 72.0% Exchange Transaction revenue (MM) $ 56.1 $ 47.3 $ 46.9 $ 42.9 $ 193.2 $ 56.3 $ 47.1 $ 46.7 $ 42.0 $ 192.2 $ 57.8 Membership fee revenue (MM) $ 31.8 $ 31.6 $ 32.0 $ 32.0 $ 127.4 $ 32.3 $ 31.6 $ 31.3 $ 31.1 $ 126.2 $ 30.6 Total active members (MM) 1.82 1.82 1.81 1.80 1.80 1.81 1.82 1.82 1.81 1.81 1.82 Average revenue per member $ 49.30 $ 44.36 $ 44.57 $ 42.23 $ 180.55 $ 49.87 $ 44.17 $ 43.83 $ 40.82 $ 178.76 $ 49.36 Rental Rental management revenue (MM) $ 13.9 $ 10.0 $ 13.0 $ 11.2 $ 48.1 $ 14.2 $ 11.4 $ 13.6 $ 11.1 $ 50.4 $ 12.5 Available room nights (000) 762 775 761 796 3,095 774 793 754 734 3,054 682 RevPAR $ 130.76 $ 103.24 $ 124.46 $ 106.97 $ 116.20 $ 127.98 $ 106.01 $ 123.86 $ 121.48 $ 119.70 $ 136.00 Year-to-Year Change Exchange and Rental Revenue Total Exchange & Rental revenue (MM) 6.6% 3.5% 12.8% 15.2% 9.3% 4.3% 6.7% 3.9% (0.1%) 3.7% (1.2%) Exchange Transaction revenue (MM) (8.2%) (5.7%) 1.8% 3.2% (2.9%) 0.4% (0.4%) (0.3%) (2.1%) (0.5%) 2.6% Membership fee revenue (MM) (4.6%) (14.2%) (0.8%) (2.3%) (5.8%) 1.4% (0.1%) (2.2%) (2.8%) (0.9%) (5.1%) Total active members (MM) (0.5%) (0.2%) (0.2%) (0.9%) (0.9%) (0.4%) 0.1% 0.6% 0.7% 0.7% 0.7% Average revenue per member (6.6%) (8.7%) 1.2% 1.4% (3.5%) 1.2% (0.4%) (1.7%) (3.3%) (1.0%) (1.0%) Rental Rental management revenue (MM) 60.2% 60.8% 61.4% 60.6% 60.7% 2.0% 13.7% 5.0% (0.6%) 4.6% (12.0%) Available room nights (000) 118.3% 112.9% 99.7% 80.2% 101.4% 1.6% 2.3% (0.9%) (7.8%) (1.3%) (11.9%) RevPAR (21.4%) (20.1%) (14.5%) (10.5%) (16.3%) (2.1%) 2.7% (0.5%) 13.6% 3.0% 6.3% 2014 2015
Operating metrics: Vacation Ownership 29 Source: Company management Refer to definitions contained in the Glossary of terms Previously reported figures have been recast pursuant to a refinement in the definition of contract sales. 1Q 2Q 3Q 4Q FY 1Q 2Q 3Q 4Q FY 1Q Key Metrics (1) Vacation Ownership Total Vacation Ownership revenue (MM) $ 27.0 $ 26.7 $ 26.5 $ 50.8 $ 131.0 $ 48.9 $ 49.1 $ 49.2 $ 48.9 $ 196.1 $ 52.0 % of Consolidated Revenue 17.2% 18.6% 18.0% 30.4% 21.3% 26.5% 28.3% 28.2% 29.6% 28.1% 28.0% Management Management fee revenue (MM) $ 22.7 $ 22.3 $ 22.1 $ 24.9 $ 92.0 $ 25.1 $ 24.9 $ 25.8 $ 23.9 $ 99.6 $ 24.6 Pass - through revenue (MM) $ 4.3 $ 4.4 $ 4.3 $ 16.5 $ 29.5 $ 15.3 $ 13.4 $ 14.4 $ 14.4 $ 57.5 $ 15.4 Sales and Financing Sales and financing revenue (MM) - - - $ 9.5 $ 9.5 $ 8.6 $ 10.9 $ 9.0 $ 10.6 $ 39.0 $ 12.0 - - - Contract sales (MM) (2) - - - $ 26.2 $ 26.2 $ 28.1 $ 23.0 $ 25.6 $ 23.0 $ 99.8 $ 25.9 - - - Average transaction price - - - $ 34,438 $ 34,438 $ 40,951 $ 31,745 $ 32,457 $ 33,517 $ 34,169 $ 35,314 - - - Volume per guest - - - $ 3,581 $ 3,581 $ 4,348 $ 3,117 $ 3,374 $ 3,442 $ 3,554 $ 4,094 Year-to-Year Change Vacation Ownership Total Vacation Ownership revenue (MM) 109.5% 120.9% 109.8% 139.2% 122.6% 81.5% 83.9% 85.7% (3.9%) 49.7% 6.3% Management Management fee revenue (MM) 159.1% 181.3% 170.8% 48.7% 121.2% 10.5% 11.4% 16.4% (4.0%) 8.2% (2.0%) Pass - through revenue (MM) 3.9% 6.0% (2.3%) 264.9% 71.1% 257.7% 203.7% 231.4% (12.4%) 95.0% 1.1% 2016 2014 2015
30 Non-GAAP reconciliation Exchange and Rental Vacation Ownership Consolidated Exchange and Rental Vacation Ownership Consolidated Adjusted EBITDA 47,533 $ 7,245 $ 54,778 $ 45,872 $ 7,322 $ 53,194 $ Non-cash compensation expense (2,830) (778) (3,608) (2,748) (774) (3,522) Other non-operating income (expense), net 525 31 556 926 (5) 921 Acquisition related and restructuring costs (323) (2,604) (2,927) (102) (105) (207) Impact of purchase accounting - (160) (160) - (376) (376) EBITDA 44,905 3,734 48,639 43,948 6,062 50,010 Amortization expense of intangibles (2,001) (1,200) (3,201) (2,155) (1,346) (3,501) Depreciation expense (4,207) (461) (4,668) (3,826) (443) (4,269) Less: Net income attributable to noncontrolling interests 5 568 573 9 518 527 Less: Other non-operating income (expense), net (525) (31) (556) (926) 5 (921) Equity in earnings in unconsolidated entities 11 (1,253) (1,242) (15) (1,509) (1,524) Operating income 38,188 $ 1,357 $ 39,545 37,035 $ 3,287 $ 40,322 Interest income 284 267 Interest expense (6,233) (2,753) Other non-operating income, net 556 921 Equity in earnings in unconsolidated entities 1,242 1,524 Income tax provision (12,639) (14,492) Net income 22,755 25,789 Net income attributable to noncontrolling interests (573) (527) Net income attributable to common stockholders 22,182 $ 25,262 $ Three Months Ended March 31, 2016 2015 (Dollars in thousands)
31 Non-GAAP reconciliation Exchange and Rental Vacation Ownership Consolidated Exchange and Rental Vacation Ownership Consolidated Adjusted EBITDA 156,310 $ 28,578 $ 184,888 $ 151,508 $ 21,197 $ 172,705 $ Non-cash compensation expense (10,735) (2,735) (13,470) (9,510) (1,853) (11,363) Other non-operating income (expense), net 3,666 (108) 3,558 2,203 (191) 2,012 Acquisition related and restructuring costs (963) (6,622) (7,585) (2,693) (4,365) (7,058) Impact of purchase accounting - (1,150) (1,150) (566) (961) (1,527) Other special items (129) (24) (153) - 3,962 3,962 EBITDA 148,149 17,939 166,088 140,942 17,789 158,731 Amortization expense of intangibles (8,578) (5,376) (13,954) (7,058) (5,243) (12,301) Depreciation expense (15,688) (1,761) (17,449) (14,683) (1,029) (15,712) Less: Net income attributable to noncontrolling interest 21 1,912 1,933 31 2,987 3,018 Less: Other non-operating income (expense), net (3,666) 108 (3,558) (2,203) 191 (2,012) Equity in earnings in unconsolidated entities (72) (4,844) (4,916) (64) (4,566) (4,630) Operating income 120,166 $ 7,978 $ 128,144 116,965 $ 10,129 $ 127,094 Interest income 1,118 412 Interest expense (21,401) (7,149) Other non-operating income, net 3,558 2,012 Equity in earnings in unconsolidated entities 4,916 4,630 Income tax provision (41,087) (45,051) Net income 75,248 81,948 Net income attributable to noncontrolling interests (1,933) (3,018) Net income attributable to common stockholders 73,315 $ 78,930 $ Year Ended December 31, 2015 2014 (Dollars in thousands)
32 Non-GAAP reconciliation Three Months Ended March 31, 2016 2015 Net income attributable to common stockholders 22,182 $ 25,262 $ Acquisition related and restructuring costs 2,927 207 Other non-operating foreign currency remeasurements (620) (1,076) Impact of purchase accounting 160 376 Income tax impact of adjusting items 1 (971) 192 Adjusted net income 23,678 $ 24,961 $ Adjusted earnings per share: Basic 0.41 $ 0.44 $ Diluted 0.41 $ 0.43 $ 1 Tax rate utilized is the applicable effective tax rate respective to the period to the extent amounts are deductible. (Dollars in thousands, except per share data) Three Months Ended March 31, 2016 2015 Net cash provided by operating activities 40,107 $ 64,705 $ Less: Capital expenditures (6,576) (4,804) Free cash flow 33,531 $ 59,901 $ (Dollars in thousands)
33 Years Ended December 31, 2015 2014 Net income attributable to common stockholders 73,315 $ 78,930 $ Acquisition related and restructuring costs 7,585 7,058 Other non-operating foreign currency remeasurements (3,768) (2,303) Impact of purchase accounting 1,150 1,527 Other special items 153 (3,962) Income tax impact of adjusting items 1 (2,016) (904) Adjusted net income 76,419 $ 80,346 $ Adjusted earnings per share: Basic 1.33 $ 1.40 $ Diluted 1.32 $ 1.39 $ 1 Tax rate utilized is the applicable effective tax rate respective to the period to the extent amounts are deductible. (Dollars in thousands, except per share data) Years Ended December 31, 2015 2014 (Dollars in thousands) Net cash provided by operating activities 142,722 $ 110,658 $ Less: Capital expenditures (20,297) (19,087) Free cash flow 122,425 $ 91,571 $
34 Units (1) Resort Name Location Completed Units Planned Units (2)(3) Total Units Sheraton Vistana Resort Orlando, FL 1,566 — 1,566 Sheraton Vistana Villages Orlando, FL 892 734 1,626 Vistana’s Beach Club Jensen Beach, FL 76 — 76 Sheraton PGA Vacation Resort Port St. Lucie, FL 30 — 30 The Westin Nanea Ocean Villas (4) Maui, HI — 390 390 The Westin Ka’anapali Ocean Resort Villas Maui, HI 280 — 280 The Westin Ka’anapali Ocean Resort Villas North Maui, HI 258 — 258 The Westin Princeville Ocean Resort Villas Kauai, HI 173 — 173 The Westin Lagunamar Ocean Resort Villas & Spa Cancun, MX 290 — 290 The Westin St. John Resort & Villas St. John, USVI 200 52 252 Harborside Resort at Atlantis (5) Nassau, Bahamas 198 — 198 Sheraton Broadway Plantation Myrtle Beach, SC 342 160 502 The Westin Mission Hills Resort Villas Rancho Mirage, CA 158 — 158 The Westin Desert Willow Villas, Palm Desert Palm Desert, CA 156 144 300 The Westin Kierland Villas Scottsdale, AZ 149 — 149 Sheraton Desert Oasis Villas Scottsdale, AZ 150 — 150 Sheraton Mountain Vista Vail Valley, CO 78 — 78 The Westin Riverfront Mountain Villas Vail Valley, CO 34 — 34 Lakeside Terrace Villas Vail Valley, CO 23 — 23 Sheraton Steamboat Resort Steamboat Springs, CO 53 — 53 Total 5,106 1,480 6,586 Vistana Signature Network Properties - Vacation Ownership Resorts ILG’s vacation ownership proprietary club portfolio As of December 31, 2015 These properties are entitled for vacation ownership use and are currently in either development, planning or evaluation stages. Excludes additional developable land in Florida, Hawaii, St. John, Mexico and Colorado, which are not included in Vistana’s near term development plans but are under evaluation for longer-term inventory needs. Currently under construction. Unconsolidated joint venture that is materially sold out. Vistana continues to manage an on-site sales operation on behalf of the joint venture.
35 Units (1) Resort Name Location Completed Units Planned Units Total Units The Phoenician Residences, The Luxury Collection Residence Club Scottsdale, AZ 6 — 6 The St. Regis Residence Club, Aspen Aspen, CO 25 — 25 The St. Regis Residence Club, New York New York, NY 31 — 31 Total 62 — 62 Vistana Signature Network - Fractional Residence Properties Resort Name Location Hotel Rooms The Westin Resort & Spa, Cancun Cancun, MX 379 The Westin Resort & Spa, Puerto Vallarta Puerto Vallarta, MX 280 The Westin Resort & Spa, Los Cabos (2) Los Cabos, MX 243 Sheraton Kauai Resort Kauai, HI 394 Sheraton Steamboat Resort Steamboat Springs, CO 188 Total 1,484 Vistana Signature Network – Transferred hotels (1) As of December 31, 2015 (2) Under construction ILG’s vacation ownership proprietary club portfolio
36 ILG’s vacation ownership proprietary club portfolio Hyatt Residence Club Properties Units (1) Resort Name Location Completed Units Planned Units(2) Total Units Hyatt Grand Aspen Aspen, CO 53 — 53 Hyatt Piñon Pointe Sedona, AZ 109 — 109 Highlands Inn Carmel, CA 94 — 94 Northstar Lodge Truckee, CA 2 — 2 Hyatt Mountain Lodge Avon, CO 50 — 50 The Residences at Park Hyatt Beaver Creek Avon, CO 15 — 15 Hyatt Main Street Station Breckenridge, CO 51 — 51 Hyatt Coconut Plantation Bonita Springs, FL 72 264 336 Hyatt Beach House Key West, FL 74 — 74 Hyatt Sunset Harbor Key West, FL 40 — 40 Hyatt Windward Pointe Key West, FL 93 — 93 Hyatt Siesta Key Beach Siesta Key, FL 11 — 11 Hyatt Ka’anapali Beach Maui, HI 131 — 131 Hyatt High Sierra Lodge Incline Village, NV 60 — 60 Hyatt Hacienda del Mar Dorado, PR 81 — 81 Hyatt Wild Oak Ranch San Antonio, TX 96 192 288 1,032 456 1,488 As of December 31, 2015 These properties are entitled for vacation ownership use and are currently in either development, planning or evaluation stages.

37 Glossary of terms Acquisition related and restructuring costs - Represents transaction fees, costs incurred in connection with performing due diligence, subsequent adjustments to our initial estimate of contingent consideration obligations associated with business acquisitions, and other direct costs related to acquisition activities. Additionally, this item includes certain restructuring charges primarily related to workforce reductions, costs associated with integrating acquired businesses and estimated costs of exiting contractual commitments. Adjusted earnings per share (EPS) - Adjusted net income divided by the weighted average number of shares of common stock outstanding during the period for basic EPS and, additionally, inclusive of dilutive securities for diluted EPS. Adjusted EBITDA - EBITDA, excluding, without duplication, if applicable: (1) non-cash compensation expense, (2) goodwill and asset impairments, (3) acquisition related and restructuring costs, (4) other non-operating income and expense, (5) the impact of the application of purchase accounting, and (6) other special items. The Company's presentation of adjusted EBITDA may not be comparable to similarly-titled measures used by other companies. Adjusted net income - Net income attributable to common stockholders, excluding without duplication, (1) acquisition related and restructuring costs, (2) other non-operating foreign currency remeasurements, (3) the impact of the application of purchase accounting, and (4) other special items. Ancillary member revenue - Other Interval Network member related revenue including insurance and travel related services. Available room nights - Number of nights available for rental by Aqua-Aston at managed vacation properties during the period, which excludes all rooms under renovation. Average revenue per member - Membership fee revenue, transaction revenue and ancillary member revenue for the Interval Network and Hyatt Residence Club for the applicable period, divided by the monthly weighted average number of Interval Network active members during the applicable period. Hyatt Residence Club revenue is included herein only since its October 1, 2014 acquisition. Average transaction price – Contract Sales divided by the net number of transactions during the period subsequent to HVO’s October 1, 2014 acquisition.
38 Glossary of terms Constant currency – Represents current period results of operations determined by translating the functional currency results into U.S. dollars (the reporting currency) using the actual blended rate of translation from the comparable prior period. Management believes that the presentation of results of operations excluding the effect of foreign currency translations serves to enhance the understanding of ILG’s performance and improves period to period comparability of results from business operations. Contract sales – Total vacation ownership interests sold at consolidated and unconsolidated projects pursuant to purchase agreements, net of actual cancellations and rescissions, where we have met a minimum threshold amounting to a 10% down payment of the contract purchase price during the period. Contract sales are included herein only since HVO’s October 1, 2014 acquisition. Consumer financing – Includes interest income on vacation ownership mortgages receivable, as well as fees from servicing the existing securitized portion of Vistana’s receivables portfolio. EBITDA - Net income attributable to common stockholders excluding, if applicable: (1) non-operating interest income and interest expense, (2) income taxes, (3) depreciation expense, and (4) amortization expense of intangibles. Free cash flow - Cash provided by operating activities less capital expenditures. Gross lodging revenue - Total room revenue collected from all Aqua-Aston managed occupied rooms during the period. Management fee revenue – Represents vacation ownership property management revenue earned by our Vacation Ownership segment exclusive of pass-through revenue. Membership fee revenue – Represents fees paid for membership in the Interval Network and Hyatt Residence Club. Net leverage – The principal amount outstanding of long term debt, less cash and cash equivalents divided by adjusted EBITDA. Other special items – Consist of other items that we believe are not related to our core business operations. For 2015, such item relates to the settlement of a certain legal proceedings. For 2014, such item relates to the recognition of prior period (pre-acquisition) sales at the Hyatt Vacation Ownership business’ Maui joint venture upon receiving the temporary certificate of occupancy in the fourth quarter of 2014.
39 Glossary of terms Other revenue – Includes revenue related primarily to exchange and rental transaction activity and membership programs outside of the Interval Network and Hyatt Residence Club, sales of marketing materials primarily for point-of-sale developer use, and certain financial services-related fee income. Pass-through revenue – Represents the compensation and other employee-related costs directly associated with managing properties that are included in both revenue and expenses that are passed on to the property owners or homeowner associations without mark-up. Pass-through revenue of the Vacation Ownership segment also includes reimbursement of sales and marketing expenses, without mark-up, pursuant to contractual arrangements. Management believes presenting gross margin without these expenses provides management and investors a relevant period-over-period comparison. Rental and ancillary – Includes revenue from rental by ILG’s businesses of their inventory and Vistana’s Resort Operations and Ancillary Services Revenue. Rental management revenue – Represents rental management revenue earned by our vacation rental businesses within our Exchange and Rental segment, exclusive of pass-through revenue. RevPAR – Gross Lodging Revenue divided by Available Room Nights for Aqua-Aston. Sales of vacation ownership – Includes sales of vacation ownership products, net, for HVO and Vistana. Service and membership revenue – Includes ILG’s membership-related and exchange revenue as well as fee-for-service rental and vacation ownership management revenue, excluding pass-throughs, and Vistana’s Resort and Vacation Network Management Revenue Total active members – Active members of the Interval Network as of the end of the period. Active members are members in good standing that have paid membership fees and any other applicable charges in full as of the end of the period or are within the allowed grace period. All Hyatt Residence Club members are also members of the Interval Network. Hyatt Residence Club revenue is included herein only since its October 1, 2014 acquisition. Transaction revenue – Interval Network and Hyatt Residence Club transactional and service fees paid primarily for exchanges, Getaways, reservation servicing and related transactions. Volume per guest – Contract sales divided by the total number of tours during the period subsequent to HVO’s October 1, 2014 acquisition.