Table of Contents
Index to Financial Statements
UNITED STATES
SECURITIES AND EXCHANGE COMMISSION
WASHINGTON, D.C. 20549
Form 10-K
(Mark One)
| þ | ANNUAL REPORT PURSUANT TO SECTION 13 OR 15(d) OF THE SECURITIES EXCHANGE ACT OF 1934 |
For the fiscal year ended December 31, 2008
OR
| ¨ | TRANSITION REPORT PURSUANT TO SECTION 13 OR 15(d) OF THE SECURITIES EXCHANGE ACT OF 1934 |
Commission file number 333-150853-4
Forbes Energy Services Ltd.
(Exact name of registrant as specified in its charter)
| Bermuda | 98-0581100 | |
(State or other jurisdiction of incorporation or organization) | (I.R.S. Employer Identification No.) | |
3000 South Business Highway 281 Alice, Texas | 78332 | |
| (Address of principal executive offices) | (Zip Code) | |
Registrant’s telephone number, including area code: (361) 664-0549
Securities registered pursuant to Section 12(b) or Section 12(g) of the Act: None
Indicate by check mark whether the registrant is a well-known seasoned issuer, as defined in Rule 405 of the Securities Act. ¨ Yes þ No
Indicate by check mark if the registrant is not required to file reports pursuant to Section 13 or Section 15(d) of the Act. þ Yes ¨ No
Indicate by check mark whether the registrant (1) has filed all reports required to be filed by Section 13 or 15(d) of the Securities Exchange Act of 1934 during the preceding 12 months (or for such shorter period that the registrant was required to file such reports), and (2) has been subject to such filing requirements for the past 90 days. þ Yes ¨ No
Indicate by check mark if disclosure of delinquent filers pursuant to Item 405 of Regulation S-K is not contained herein and will not be contained, to the best of the registrant’s knowledge, in definitive proxy or information statements incorporated by reference in Part III of this Form 10-K or any amendment to this Form 10-K. ¨
Indicate by check mark whether the registrant is a large accelerated filer, an accelerated filer, a non-accelerated filer or a smaller reporting company. See the definitions of “large accelerated filer,” “accelerated filer” and “smaller reporting company” in Rule 12b-2 of the Exchange Act.
¨ Large Accelerated Filer | ¨ Accelerated Filer | |
þ Non-Accelerated Filer | ¨ Smaller Reporting Company |
Indicate by check mark whether the registrant is a shell company (as defined in Exchange Act Rule 12b-2). ¨ Yes þ No
The aggregate market value of the voting stock held by non-affiliates of the registrant as of the last business day of the most recently completed second fiscal quarter, June 30, 2008, was approximately CDN$196,911,153 based on the closing sales price of the registrant’s common stock as reported by the Toronto Stock Exchange on June 30, 2008 of $7.99 per share.
Indicate the number of common shares outstanding of each of the registrant’s classes of common shares, as of the latest
practicable date.
At March 20, 2009, there were 32,611,200 common shares outstanding and 29,500,000 Class B non-voting shares outstanding.
Table of Contents
Index to Financial Statements
FORBES ENERGY SERVICES LTD. AND SUBSIDIARIES (a/k/a the “Forbes Group”)
i
Table of Contents
Index to Financial Statements
FORWARD-LOOKING STATEMENTS
This Annual Report on Form 10-K and any oral statements made in connection with it include certain forward-looking statements within the meaning of the federal securities laws. You can generally identify forward-looking statements by the appearance in such a statement of words like “anticipate,” “believe,” “continue,” “could,” “estimate,” “expect,” “intend,” “may,” “plan,” “potential,” “predict,” “project,” “should” or “will” or other comparable words or the negative of these words. When you consider our forward-looking statements, you should keep in mind the risk factors we describe and other cautionary statements we make in this Annual Report on Form 10-K. Our forward-looking statements are only predictions based on expectations that we believe are reasonable. Our actual results could differ materially from those anticipated in, or implied by, these forward-looking statements as a result of known risks and uncertainties set forth below and elsewhere in this Annual Report on Form 10-K. These factors include or relate to the following:
| • | supply and demand for oilfield services and industry activity levels in the current depressed market; |
| • | uncertainty in the global financial markets and worldwide economic downturn; |
| • | spending on the oil and natural gas industry given the recent worldwide economic downturn; |
| • | our level of indebtedness in the current depressed market; |
| • | impairment of our long-term assets; |
| • | our ability to maintain stable pricing; |
| • | potential for excess capacity in the current depressed market; |
| • | competition; |
| • | substantial capital requirements; |
| • | significant operating and financial restrictions under our indenture and credit facility; |
| • | technological obsolescence of operating equipment; |
| • | dependence on certain key employees; |
| • | concentration of customers; |
| • | substantial costs of compliance with reporting obligations, including the Sarbanes-Oxley Act; |
| • | material weaknesses in internal controls over financial reporting; |
| • | environmental and other governmental regulation; |
| • | risks inherent in our operations; |
| • | market response to global demands to curtail use of oil and natural gas; |
| • | change of control over us; |
| • | conflicts of interest between the principal equity investors and noteholders; |
| • | results of legal proceedings; |
| • | ability to fully integrate future acquisitions; |
| • | variation from projected operating and financial data; |
| • | variation from budgeted and projected capital expenditures; and |
| • | the other factors discussed under “Risk Factors.” |
ii
Table of Contents
Index to Financial Statements
We undertake no obligation to update or revise any forward-looking statements, whether as a result of new information, future events or otherwise. To the extent these risks, uncertainties and assumptions give rise to events that vary from our expectations, the forward-looking events discussed in this Annual Report on Form 10-K may not occur. All forward-looking statements attributable to us are qualified in their entirety by this cautionary statement.
Available Information
Information regarding the Company can be found on our internet website athttp://www.forbsenergyservices.com. In addition, our annual reports on Form 10-K, quarterly reports on Form 10-Q and amendments to those reports filed or furnished pursuant to Sections 13 or 15(d) of the Securities Exchange Act of 1934 are made available free of charge on our internet website as soon as reasonably practicable after these reports have been electronically filed with, or furnished to, the Securities and Exchange Commission (“SEC”). Information filed with the SEC may be read or copied at the SEC’s Public Reference Room at 100 F Street, N.E., Washington, D.C. 20549. Information on operation of the Public Reference Room may be obtained by calling the SEC at 1-800-SEC-0330. The SEC also maintains an internet website (http://www.sec.gov) that contains reports, proxy and information statements, and other information regarding issuers that file electronically.
iii
Table of Contents
Index to Financial Statements
Overview
We are an independent oilfield services contractor that provides a broad range of onshore drilling-related and production-related services to oil and natural gas companies, primarily onshore in Texas. The services we provide are used to help oil and natural gas companies develop and enhance the production of oil and natural gas, and include fluid hauling, fluid disposal, well maintenance, completion services, workovers and recompletions, plugging and abandonment, and tubing testing. We believe we operate one of the youngest fleets of well servicing rigs, including those commonly referred to as workover rigs, in Texas.
We believe that our broad range of services, which extends from initial drilling, through production, to eventual abandonment, is fundamental to establishing and maintaining the flow of oil and natural gas throughout the life cycle of our customers’ wells. We derive a majority of our revenues from services that support production from existing oil and natural gas operations.
Since our inception in September 2003, we have grown organically from a small South Texas operational base with two well servicing rigs and eight vacuum trucks to a major regional provider of an integrated offering of production and well services. We have successfully executed an aggressive organic growth strategy focused on fleet expansion with the construction of new equipment in a segment of the oilfield services industry characterized by competitors with aging fleets. We believe that our new well servicing rigs and equipment, with an average age of less than 2 years, significantly differentiate us from our competitors.
As of December 31, 2008, we operated from 27 locations across Texas and also operated out of one location in Mississippi and one in Mexico. We currently provide a wide range of services to a diverse group of over 730 companies. Our blue-chip customer base includes ConocoPhillips Company, Apache Corporation, Chesapeake Energy Corporation, Devon Energy Corporation, Dominion Resources, Inc., EOG Resources, Inc., and Penn Virginia Corporation, among others. John E. Crisp and Charles C. Forbes, our senior management team, have cultivated deep and ongoing relationships with these customers during their average of over 30 years of experience in the oilfield services industry. For the year ended December 31, 2008, we generated revenues of approximately $360.9 million.
We currently conduct our operations through the following two business segments:
| • | Well Servicing. The well servicing segment accounted for 52.6% of our revenues for the year ended December 31, 2008. As of December 31, 2008, the well servicing segment utilized our fleet of 170 well servicing rigs, which included 162 workover rigs and 8 swabbing rigs and related assets and equipment. These assets are used to provide well maintenance, including remedial repairs and removal and replacement of downhole production equipment, well workovers, including significant downhole repairs, re-completions and re-perforations, completion and swabbing activities, and plugging and abandoning services. In addition, as of December 31, 2008, we had a fleet of six tubing testing units that are used to conduct pressure testing of oil and natural gas production tubing. |
| • | Fluid Logistics. The fluid logistics segment accounted for 47.4% of our revenues for the year ended December 31, 2008. The fluid logistics segment utilizes our modern fleet of fluid transport trucks and related assets, including specialized vacuum, high-pressure pump and tank trucks, frac tanks, water wells, proprietary salt water disposal wells and facilities, and related equipment. These assets are used to provide, transport, store, and dispose of a variety of drilling and produced fluids used in, and generated by, oil and natural gas production. These services are required in most workover and completion projects and are routinely used in daily producing well operations. |
We believe that our two business segments are complementary and create synergies in terms of selling opportunities. Our multiple lines of service allow us to capitalize on our existing customer base to grow within existing markets, generate more business from existing customers, and increase operating profits. By offering customers the ability to reduce the number of vendors they use, we believe it helps improve the efficiency of our customers. This is demonstrated by the fact that 81.9% of our revenues for the year ended December 31, 2008, were from customers that utilized services of both of our business segments. Further, by having multiple service offerings that span the life cycle of the well, we believe that we have a competitive advantage over smaller competitors offering more limited services.
1
Table of Contents
Index to Financial Statements
The following table summarizes the major components of our equipment fleet at the dates indicated.
| December 31, | ||||||||||
| 2008 | 2007 | 2006 | 2005 | 2004 | ||||||
Locations | 27 | 18 | 12 | 7 | 4 | |||||
Well Servicing Segment | ||||||||||
Workover rigs(1) | 162 | 95 | 41 | 17 | 11 | |||||
Swabbing rigs | 8 | 6 | 2 | — | — | |||||
Tubing testing units | 6 | 6 | 4 | 4 | 4 | |||||
Fluid Logistics Segment | ||||||||||
Vacuum trucks(1) | 294 | 205 | 147 | 99 | 26 | |||||
High-pressure pump trucks | 19 | 14 | 7 | 4 | 2 | |||||
Other heavy trucks | 57 | 43 | 25 | 16 | 6 | |||||
Frac tanks(1) | 1,370 | 951 | 568 | 241 | 105 | |||||
Salt water disposal wells | 15 | 14 | 9 | 6 | 4 | |||||
| (1) | At December 31, 2008, 26 of the vacuum trucks, 10 of the workover rigs and 143 of the frac tanks were leased. |
Corporate Structure
Forbes Energy Services Ltd. is a Bermuda company created to be the holding company for Forbes Energy Services LLC and its subsidiaries. Forbes Energy Services LLC is a Delaware limited liability company and the U.S. holding company for our operating entities. We operate primarily through the following four subsidiaries which are all Delaware limited liability companies directly owned by Forbes Energy Services LLC: C.C. Forbes, LLC; TX Energy Services, LLC; Superior Tubing Testers, LLC; and Forbes Energy International, LLC. Forbes Energy International, LLC was formed to hold Forbes Energy Services México, S. de R.L. de C.V., a Mexican company that conducts our Mexican operations. Forbes Energy Services LLC also holds Forbes Energy Capital Inc., a Delaware corporation created solely to be a co-issuer of our senior secured notes. The following chart graphically illustrates our current structure:
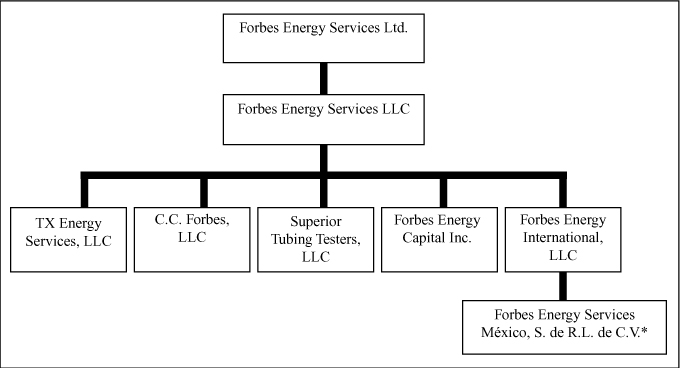
| * | Forbes Energy Services México, S. de R.L. de C.V. is 99.99% owned by Forbes Energy International, LLC and 0.01% owned by Forbes Energy Services LLC. |
2
Table of Contents
Index to Financial Statements
Reorganizations
Effective January 1, 2008, the members of each of C.C. Forbes, LLC, TX Energy Services, LLC and Superior Tubing Testers, LLC (which included Messrs. John Crisp and Charles Forbes and Ms. Janet Forbes) transferred all of the membership interests they held in such companies to Forbes Energy Services LLC in exchange for all of the outstanding membership interests in Forbes Energy Services LLC (the “Delaware Reorganization”).
In connection with a reorganization completed on May 29, 2008, (the “Bermuda Reorganization”) each of these members transferred 63% of their respective membership interests in Forbes Energy Services LLC to Forbes Energy Services Ltd. in exchange for Class B Shares. Of the proceeds from the Canadian initial public offering and simultaneous U.S. private placement of 24,644,500 common shares by Forbes Energy Services Ltd. in May 2008 (the “Initial Equity Offering”), $120 million was contributed by Forbes Energy Services Ltd. as additional capital to Forbes Energy Services LLC and used to pay the cash consideration for the repurchase by Forbes Energy Services LLC of the remaining membership interests held by the individuals who were members of such company. The purchase price for such transaction was determined on the basis of the price per common share under the initial public offering. Mr. John E. Crisp, the Chairman of the Board, President and Chief Executive Officer of Forbes Energy Services Ltd., Mr. Charles C. Forbes, the Executive Vice President and Chief Operating Officer of Forbes Energy Services Ltd., and Ms. Janet L. Forbes, a director of Forbes Energy Services Ltd., each received approximately $36 million from Forbes Energy Services LLC upon the repurchase of their remaining membership interests, or approximately 20.9% each of the gross proceeds of the Initial Equity Offering.
In connection with the Bermuda Reorganization, John E. Crisp, our President and Chief Executive Officer, Charles C. Forbes, our Executive Vice President and Chief Operating Officer, and Janet L. Forbes, one of our directors, who were the founders of the Forbes Group and were also the three largest owners of each of the entities comprising the original Forbes Group, along with all of the other members of Forbes Energy Services LLC, received Class B shares of Forbes Energy Services Ltd. The Class B shares are convertible at any time at the discretion of each holder into common shares. The Class B shares generally have no voting rights, but are permitted to approve certain actions.
Upon completion of the Bermuda Reorganization, Forbes Energy Services LLC became the wholly owned subsidiary of Forbes Energy Services Ltd. Our headquarters and executive offices are located at 3000 South Business Hwy 281, Alice, Texas 78332. We can be reached by phone at (361) 664-0549.
3
Table of Contents
Index to Financial Statements
Our Competitive Strengths
We believe that the following competitive strengths position us well within the oilfield services industry:
| • | Young and Modern Fleet. We believe we operate one of the youngest and most modern fleets of well servicing rigs among the large well-servicing companies, based on an average age of well servicing rigs. We believe over 80% of the active U.S. well servicing rig fleet was built prior to 1982, resulting in an average age in excess of 20 years. By contrast, approximately 89.4% of our 170 well servicing rigs at December 31, 2008 were built in the last three years. Many of our customers tell us that a younger and more modern fleet is more attractive to them because newer well servicing rigs require less down time for maintenance and generally are more reliable than older equipment. In addition, we believe that the level of our business is not subject to the same fluctuations as may be experienced by our competitors who operate primarily older equipment because new equipment is typically the first to be deployed and the last to be idled. As part of our strategy, we have undertaken to enhance our design specifications to improve the operational and safety characteristics of our equipment compared with older equipment. |
| • | Exposure to Revenue Streams Throughout the Life Cycle of the Well. Our maintenance and workover services expose us to demand from our customers throughout the life cycle of a well, from drilling through production and eventual abandonment. Each new well that is drilled provides us a potential multi-year stream of well services revenue, as our customers attempt to maximize and maintain a well’s productivity. Accordingly, demand for our services is generally driven by the total number of producing wells in a region and is generally less volatile than demand for new well drilling services. |
| • | High Level of Customer Retention with a Blue Chip Customer Base. Our top customers include many of the largest integrated and independent oil and natural gas companies operating onshore in the United States. We believe we have been successful in growing in our existing markets as well as expanding to new markets with existing customers due to the quality of our well servicing rigs, our personnel and our safety record. For example, members of our senior management have maintained excellent working relationships for over 20 years with our top customer. We believe the complementary nature of our two business segments also helps retain customers because of the efficiency we offer a customer that has multiple needs at the wellsite. Notably, 81.9% of our revenues from the year ended December 31, 2008 were from customers that utilize services of both of our business segments. |
| • | Industry-Leading Safety Record. For 2008, we had approximately 81.5 % fewer incidents than the industry average. Our customers tell us that our safety record and reputation are critical factors to purchasing and operations managers in their decision-making process. Over several years, we have developed a strong safety culture based on our training programs and safety seminars for our employees and customers. For example, for several years, members of our senior management have played an integral part in monthly joint safety training meetings with customer personnel. In addition, our purchase and deployment of new well servicing rigs with enhanced safety features has contributed to our strong safety record and reputation. |
| • | Experienced Senior Management Team and Operations Staff. Our senior management team of John E. Crisp and Charles C. Forbes has over 64 years of combined experience within the oilfield services industry. In addition, our next level of management, which includes our location managers, has an average of approximately 22 years of experience in the industry. |
Our Business Strategy
Our strategy is to continue to do the following:
| • | Focus on Proven and Established Oil and Natural Gas Basins. We focus our operations on customers that operate in well-established basins which have proven production histories and that have maintained a higher level of activity throughout various oil and natural gas pricing environments. Given the current depressed markets, we believe that this creates a more stable revenue stream for us as the production related services we provide our customers are tied more to ongoing production from proven wells and less to exploratory activity that has been negatively influenced by the recent precipitous decreases in oil and natural gas prices. Our experience shows that production-related services have generally withstood the current depressed economic conditions better than exploratory services. This allows us to improve or maintain utilization and margins for our fleet of assets. |
4
Table of Contents
Index to Financial Statements
| • | Establish and Maintain Leadership Position in Core Operating Areas. Based on our estimates, we believe that we have a majority market share in well servicing and fluid logistics in South Texas. We strive to establish and maintain market leadership positions within all of our core operating areas. To achieve this goal, we maintain close customer relationships and offer high-quality services and the newest equipment for our customers. In addition, our significant presence in our core operating areas facilitates employee retention and hiring and brand recognition. |
| • | Maintain a Disciplined Growth Strategy. Through the third quarter of 2008, we grew our business by following our customers to new locations which have been in reasonably close proximity to our existing locations. In 2007, we expanded from our initial presence in the Cotton Valley with a location in Marshall to Kilgore and Carthage, Texas. We have followed the same strategy in the Permian Basin, where we established an initial presence in Ozona and subsequently expanded to San Angelo, Monahans, Odessa and Big Spring, Texas. We believe that this growth strategy allows us to create synergies in geographic areas and then permits us to expand profitably from those geographic areas in which we have created a critical mass. During 2008, we expanded our field locations with operations to Mississippi and Mexico. During the fourth quarter of 2008, we severely curtailed our expansion due to the economic downturn that negatively impacted the energy industry. We have minimal capital expenditures planned for 2009 which primarily relate to our Mexico operation. These could be curtailed if the market deteriorates further. Timing of future expansion will be dictated by the recovery of exploration activity. |
Business Segments
Well Servicing Segment
Through a modern fleet of 170 well servicing rigs, as of December 31, 2008, situated in 16 locations across Texas, one in Mississippi and one in Mexico, we provide a comprehensive offering of well servicing activities to oil and natural gas companies in Texas and our other locations, including completions of newly drilled oil and natural gas wells, wellbore maintenance, workovers and re-completions, tubing testing, and plugging and abandonment services. Our well servicing rig fleet has an average age of approximately 2 years. As part of our operational strategy, we enhanced our design specifications to improve the operational and safety characteristics of our equipment compared with older equipment operated by others in the industry. These include increased derrick height and weight ratings, and increased mud pump horsepower. We believe these enhanced features translate into increased demand for our equipment and services along with better pricing for our equipment and personnel. In addition, we augment our well servicing rig fleet with auxiliary equipment, such as mud pumps, power swivels, mud plants, mud tanks, blow-out preventers, lighting plants, generators, pipe racks, and tongs, which results in incremental rental revenue and increases the profitability of a typical well service job.
We provide the following services in our well servicing segment:
| • | Completions. Utilizing our well servicing rig fleet, we perform completion services, which involve perforating and/or stimulating a wellbore to allow it to flow oil or natural gas, along with swabbing operations that are utilized to clean a wellbore prior to production. Completion operations are generally shorter term in nature and involve our equipment operating on a site for a period of two to three days. |
| • | Maintenance. Through our fleet of well servicing rigs, we provide for the removal and repair of sucker rods, downhole pumps and other production equipment, the repair of failed production tubing, and the removal of sand, paraffin and other downhole production-related byproducts that impair well productivity. These operations typically involve our well servicing rigs operating on a wellsite for five to seven days. |
| • | Workovers and Re-completions. We provide workover and re-completion services for existing wellbores. These services are designed to significantly enhance productivity by re-perforating to initiate or re-establish productivity from an oil and natural gas wellbore. In addition, we provide major downhole repairs such as casing repair, production tubing replacement, and deepening and sidetracking operations used to extend a wellbore laterally or vertically. These operations are typically longer term in nature and involve our well servicing rigs operating on a wellsite for one to two weeks at a time. |
| • | Tubing Testing. Through a fleet of six downhole testing units, we provide downhole tubing testing services that allow operators to verify tubing integrity. Tubing testing services are performed as production tubing is run into a new wellbore or on older wellbores as production tubing is replaced during a workover operation. Tubing testing services are complementary to our other service offerings and provide a significant opportunity for cross-selling. |
5
Table of Contents
Index to Financial Statements
| • | Plugging and Abandonment. Our well servicing rigs are also used in the process of permanently closing oil and natural gas wells that are no longer capable of producing in economic quantities. Plugging and abandonment work can be performed with a well servicing rig along with wireline and cementing equipment; however, this service is typically provided by companies that specialize in plugging and abandonment work. Many well operators bid this work on a “turnkey” basis, requiring the service company to perform the entire job, including the sale or disposal of equipment salvaged from the well as part of the compensation received, and complying with state regulatory requirements. We perform plugging and abandonment work in conjunction with equipment provided by other service companies. |
Fluid Logistics Segment
Our fluid logistics segment provides an integrated array of oilfield fluid sales, transportation, storage, and disposal services that are required on most workover, drilling, and completion projects and are routinely used in daily operation of producing wells by oil and natural gas producers. We have a substantial operational footprint with 19 fluid logistics locations across Texas as of December 31, 2008, and an extensive fleet of transportation trucks, high-pressure pump trucks, frac tanks, and proprietary disposal wells. This combination of services enables us to provide a one-stop source for oil and natural gas companies. We believe that the vast majority of our smaller competitors in this segment can provide some, but not all, of the equipment and services required by customers, thereby requiring them to use several companies to meet their requirements and increasing their administrative burden. In addition, by pursuing an integrated approach to service, we experience increased asset utilization rates, as multiple assets are usually required to provide a given service.
We provide the following services in our fluid logistics segment:
| • | Fluid Hauling. At December 31, 2008, we owned or leased 370 fluid service vacuum trucks and trailers equipped with a fluid hauling capacity of up to 150 barrels per unit. Each fluid service truck unit is equipped to pump fluids from or into wells, pits, tanks, and other on-site storage facilities. The majority of our fluid service truck units are also used to transport water to fill frac tanks on well locations, including frac tanks provided by us and others, to transport produced salt water to disposal wells, including injection wells owned and operated by us, and to transport drilling and completion fluids to and from well locations. In conjunction with the rental of frac tanks, we use fluid service trucks to transport water for use in fracturing operations. Following completion of fracturing operations, our fluid service trucks are used to transport the flowback produced as a result of the fracturing operations from the wellsite to disposal wells. |
| • | Disposal Services. Most oil and natural gas wells produce varying amounts of salt water throughout their productive lives. Under Texas law, oil and natural gas wastes and salt water produced from oil and natural gas wells are required to be disposed of in authorized facilities, including permitted salt water disposal wells. Injection wells are licensed by state authorities and are completed in permeable formations below the fresh water table. At December 31, 2008, we operated 15 disposal wells in 12 locations across Texas, with injection capacity of over 120,000 barrels per day, that are permitted to dispose of salt water and incidental non-hazardous oil and natural gas wastes throughout our operational bases in Texas. Our transport trucks frequently transport fluids that are disposed of in these salt water disposal wells. The disposal wells have injection capacities ranging up to 15,000 barrels per day. The salt water disposal wells are strategically located in close proximity to the producing wells of our customers. We maintain separators at all 15 disposal wells, which permits us to salvage residual crude oil that is used in operations or later sold. |
| • | Equipment Rental. At December 31, 2008, we owned or leased a fleet of 1370 fluid storage tanks that can store up to 500 barrels of fluid each. This equipment is used by oilfield operators to store various fluids at the wellsite, including fresh water, brine and acid for frac jobs, flowback, temporary production, and mud storage. We transport the tanks on our trucks to well locations that are usually within a 75-mile radius of our nearest location. Frac tanks are used during all phases of the life of a producing well. A typical fracturing operation can be completed within four days using five to 25 or more frac tanks. We believe we maintain one of the youngest storage tank fleets in the industry with an average equipment age of approximately 3 years. |
| • | Fluid Sales. We sell and transport a variety of fluids used in drilling, completion and workover operations for oil and natural gas wells. Although a relatively small percentage of our overall business, the provision of these fluids drives asset utilization rates and revenue from associated equipment. Through these services, we provide fresh water used in fracturing fluid, completion fluids, cement, and drilling mud. In addition, we provide potassium chloride for completion fluids, brine water, and water-based drilling mud. |
6
Table of Contents
Index to Financial Statements
Seasonality
Our operations are impacted by seasonal factors. Please see “Item 1A Risk Factors – Activity in the oilfield services industry is seasonal and may affect our revenues during certain periods” in this Form 10-K for additional information.
Sales and Marketing
Sales and marketing functions are performed at two levels: at the field level and through our sales representatives and executives. At the field level, our operations and rig supervisors are in constant contact with their counterparts at our customers. This contact includes working closely in the field, problem resolution efforts, and 24-hour availability. Employees of our customers become accustomed to working closely with and depending on our personnel for assistance, guidance, advice, and in other areas where teams typically interact. Our objective is for our customers to see our employees as an extension of the customers’ employees and resources. These relationships not only secure business long-term, but also generate additional business as new opportunities arise.
Our sales representatives and executives perform more traditional sales activities such as calling on customers, sending proposals, and following up on jobs to ensure customer satisfaction. This includes heavy participation in customer safety programs where our executives and sales staff either participate in or teach safety classes at various customer locations. From a sales standpoint, this close involvement and support is key to establishing and maintaining long-term relationships with the major oil and natural gas companies.
We operate a decentralized sales and marketing organization, where local management teams are largely responsible for developing stronger relationships with customers at the field level. Our customers typically are relationship driven, make decisions at the local level, and are willing to pay higher rates for responsiveness and quality services.
We cross-market our well servicing rigs along with our fluid logistics services, thereby offering our customers the ability to minimize vendors, which we believe improves the efficiency of our customers. This is demonstrated by the fact that 81.9% of our revenues for the year ended December 31, 2008 were from customers that utilized services of both of our business segments.
Employees
At December 31, 2008, we had 1,876 employees. We have made significant investments to recruit employees, provide comprehensive employee training, and implement recognized standards for health and safety. None of our employees are represented by a union or employed pursuant to a collective bargaining agreement or similar arrangement. We have not experienced any strikes or work stoppages, and we believe we have good relations with our employees. Since December 31, 2008, as a result of the current depressed market conditions, we have reduced our workforce by approximately 34%, and reduced pay rates by approximately 17%.
Continued retention of existing qualified management and field employees and availability of additional qualified management and field employees will be a critical factor in our continued success as we work to gain operating efficiencies in the current depressed market.
Competition
Our competition includes small regional service providers as well as larger companies with operations throughout the continental United States and internationally. Our four largest competitors are Basic Energy Services, Inc., Complete Production Services, Inc., Key Energy Services, Inc., and Nabors Industries Ltd. We believe that these larger competitors primarily have centralized management teams that direct their operations and decision-making primarily from corporate and regional headquarters. In addition, because of their size, these companies market a large portion of their work to the major oil and natural gas companies. We compete primarily on the basis of the young age and quality of our equipment, our safety record, the quality and expertise of our employees, and our responsiveness to customer needs.
Customers
We served in excess of 730 customers during the year ended December 31, 2008. For this same time period, our largest customer comprised approximately 8.5% of our combined revenues, our five largest customers comprised approximately 30.3% of our combined revenues, and our ten largest customers comprised approximately 42.9% of our combined revenues. Through the third
7
Table of Contents
Index to Financial Statements
quarter of 2008, we had been expanding our market base and adding new customers, however, our expansion was scaled back in the fourth quarter due to the general decrease in activity in the oil and natural gas industry. The loss of our top customer or of several of the customers in the top ten would materially adversely affect our revenues and results of operations. We believe that customers lost could be replaced with other customers, but there can be no assurance that lost revenues could be replaced in a timely manner or at all, especially given the current market conditions.
Our business segments charge customers by the hour, day or project for services, equipment and personnel.
We have master service agreements in place with most of our customers, under which projects are awarded on the basis of price, type of service, location of equipment, and the experience level of work crews.
Suppliers
We purchase or lease our well servicing rigs from several third-party suppliers. The following table provides information regarding our largest rig providers during the year ended December 31, 2008:
Rig Suppliers | Percentage of Purchases For the Year Ended December 31, 2008 | ||
Dragon Rig Sales and Service | 63.2 | % | |
Lanco Well Services Corp.* | 35.3 | % | |
Other | 1.5 | % |
| * | During 2008, Dragon Rig Sales and Service’s parent company acquired Lanco Well Services Corp. |
We have a strong and flexible working relationship with our principal well servicing rig suppliers who have verbally provided us with a right of first refusal on well servicing rigs under construction. We believe these verbal assurances permit us to delay any commitment to purchase a rig until such time as we are in need of the rig while effectively preventing our competitors from having access to such well servicing rigs unless we decline to accept them upon completion of construction.
We purchase well servicing chemicals, drilling fluids, and related supplies from various third-party suppliers. We purchase potassium chloride from two suppliers. For all other well servicing products, such as barite, surfactants, and drilling fluids, we purchase from various suppliers of well servicing products when needed.
Although we do not have written agreements with any of our suppliers (other than leases with respect to certain of our rigs and equipment), we have not historically suffered from an inability to purchase or lease equipment or purchase raw materials.
Insurance
Our operations are subject to risks inherent in the oilfield services industry, such as equipment defects, malfunctions, failures and natural disasters. In addition, hazards such as unusual or unexpected geological formations, pressures, blow-outs, fires or other conditions may be encountered in drilling and servicing wells, as well as the transportation of fluids and our assets between locations. We have obtained insurance coverage against certain of these risks which we believe is customary in the industry, including $1 million in general liability per occurrence, $25 million in umbrella coverage, and $25 million of excess liability coverage. Such insurance is subject to coverage limits and exclusions and may not be available for all of the risks and hazards to which we are exposed. In addition, no assurance can be given that such insurance will be adequate to cover our liabilities or will be generally available in the future or, if available, that premiums will be commercially justifiable. If we incur substantial liability and such damages are not covered by insurance or are in excess of policy limits, or if we incur such liability at a time when we are not able to obtain liability insurance, our business, results of operations and financial condition could be materially and adversely affected.
Environmental Regulations
Our operations are subject to various federal, state, and local laws and regulations pertaining to health, safety and the environment. Laws and regulations protecting the environment have become more stringent over the years, and in certain circumstances may impose strict liability, rendering us liable for environmental damage without regard to negligence or fault on our part. Moreover, cleanup costs, penalties, and other damages arising as a result of new, or changes to existing, environmental laws and regulations could be substantial and could have a material adverse effect on our financial condition, results of operations and cash flows. We believe that we conduct our operations in substantial compliance with current federal, state and local requirements related to health, safety and the environment.
8
Table of Contents
Index to Financial Statements
The following is a summary of the more significant existing environmental, health and safety laws and regulations to which our operations are subject and for which compliance may have a material adverse effect on our results of operation or financial position. See “Item 1A Risk Factors - Due to the nature of our business, we may be subject to environmental liability” in this Form 10-K for further details.
Hazardous Substances and Waste
TheComprehensive Environmental Response, Compensation, and Liability Act, as amended, or CERCLA, and comparable state laws impose liability without regard to fault or the legality of the original conduct on certain defined persons, including current and prior owners or operators of the site where a release of hazardous substances occurred and entities that disposed or arranged for the disposal of the hazardous substances found at the site. Under CERCLA, these responsible persons may be liable for the costs of cleaning up the hazardous substances, for damages to natural resources, and for the costs of certain health studies. In the course of our operations, we generate materials that are regulated as hazardous substances and, as a result, may incur CERCLA liability for cleanup costs. Also, claims may be filed for personal injury and property damage allegedly caused by the release of hazardous substances or other pollutants.
We also generate solid wastes that are subject to the requirements of theResource Conservation and Recovery Act, as amended, or RCRA, and comparable state statutes. Certain materials generated in the exploration, development, or production of crude oil and natural gas are excluded from RCRA’s hazardous waste regulation, but these wastes, which include wastes currently generated during our operations, could be designated as “hazardous wastes” in the future and become subject to more rigorous and costly disposal requirements. Any such changes in the laws and regulations could have a material adverse effect on our operating expenses.
Although we have used operating and disposal practices that were standard in the industry at the time, hydrocarbons or other wastes may have been released at properties owned or leased by us now or in the past, or at other locations where these hydrocarbons and wastes were taken for treatment or disposal. Under CERCLA, RCRA and analogous state laws, we could be required to clean up contaminated property (including contaminated groundwater), perform remedial activities to prevent future contamination, or pay for associated natural resource damages.
Water Discharges
We operate facilities that are subject to requirements of theClean Water Act, as amended, or CWA, and analogous state laws that impose restrictions and controls on the discharge of pollutants into navigable waters. Pursuant to these laws, permits must be obtained to discharge pollutants into state waters or waters of the United States, including to discharge storm water runoff from certain types of facilities. Spill prevention, control, and countermeasure requirements under the CWA require implementation of measures to help prevent the contamination of navigable waters in the event of a hydrocarbon spill. The CWA can impose substantial civil and criminal penalties for non-compliance.
Employee Health and Safety
We are subject to the requirements of the federalOccupational Safety and Health Act, as amended, or OSHA, and comparable state laws that regulate the protection of employee health and safety. OSHA’s hazard communication standard requires that information about hazardous materials used or produced in our operations be maintained and provided to employees, state and local government authorities, and citizens. We believe that our operations are in substantial compliance with OSHA requirements.
Other Laws and Regulations
We operate salt water disposal wells that are subject to the CWA,Safe Drinking Water Act, and state and local laws and regulations, including those established by the Environmental Protection Agency’s Underground Injection Control Program which establishes the minimum program requirements. Our salt water disposal wells are located in Texas, which requires us to obtain a permit to operate each of these wells. We have such permits for each of our salt water disposal wells. The Texas regulatory agency may suspend or modify any of these permits if such well operation is likely to result in pollution of fresh water, substantial violation of permit conditions or applicable rules, or leaks to the environment. We maintain insurance against some risks associated with our well service activities, but there can be no assurance that this insurance will continue to be commercially available or available at premium levels that justify its purchase by us. The occurrence of a significant event that is not fully insured or indemnified could have a materially adverse effect on our financial condition and operations.
9
Table of Contents
Index to Financial Statements
The following information describes certain significant risks and uncertainties inherent in our business. You should take these risks into account in evaluating us. This section does not describe all risks applicable to us, our industry or our business, and it is intended only as a summary of certain material risks. You should carefully consider such risks and uncertainties together with the other information contained in this Form 10-K. If any of such risks or uncertainties actually occurs, our business, financial condition or operating results could be harmed substantially and could differ materially from the plans and other forward-looking statements included in the section titled “Management’s Discussion and Analysis of Financial Condition and Results of Operations,” and elsewhere in this Form 10-K.
The industry in which we operate is highly volatile, and there can be no assurance that demand for our services will improve from recent depressed levels.
The demand, pricing and terms for oilfield services in our existing or future service areas largely depend upon the level of exploration and development activity for both crude oil and natural gas in the United States. Oil and natural gas industry conditions are influenced by numerous factors over which we have no control, including oil and natural gas prices, expectations about future oil and natural gas prices, levels of consumer demand, the cost of exploring for, producing and delivering oil and natural gas, the expected rates of declining current production, the discovery rates of new oil and natural gas reserves, available pipeline and other oil and natural gas transportation capacity, weather conditions, political, regulatory and economic conditions, and the ability of oil and natural gas companies to raise equity capital or debt financing.
The level of activity in the oil and natural gas industry in the United States is volatile and has recently experienced a significant downturn. No assurance can be given that trends in oil and natural gas exploration and production activities will improve or, if so, when such improvement will occur. Continuation of the recent substantial reduction in oil and natural gas prices will likely continue to have a negative effect on oil and natural gas production levels and therefore affect the demand for drilling and well services by oil and natural gas companies. Any addition to, or elimination or curtailment of, government incentives for companies involved in the exploration for and production of oil and natural gas could have a significant effect on the oilfield services industry in the United States. Lower oil and natural gas prices could also cause our customers to seek to terminate, renegotiate or fail to honor our services contracts, affect the fair market value of our equipment fleet which in turn could trigger a write down of our assets for accounting purposes, affect our ability to retain skilled oilfield services personnel, and affect our ability to obtain access to capital to fund and grow our business. In connection with the preparation of our 2008 year-end financial statements, it was determined that our goodwill was fully impaired and it was fully written off effective in the fourth quarter of 2008. A further material decline in crude oil or natural gas prices or industry activity could have a material adverse effect on our business, financial condition, results of operations and cash flows.
We may be adversely affected by uncertainty in the global financial markets and worldwide economic downturn.
Our future results may be impacted by the worldwide economic downturn, continued volatility or further deterioration in the debt and equity capital markets, inflation, deflation, or other adverse economic conditions that may negatively affect us or parties with whom we do business resulting in their non-payment or inability to perform obligations owed to us such as the failure of customers to honor their commitments, the failure of major suppliers to complete orders or the failure by Citibank, N.A. to provide expected funding under our revolving credit agreement. Additionally, credit market conditions may slow our collection efforts as customers experience increased difficulty in obtaining requisite financing, potentially leading to lost revenue and higher than normal accounts receivable. This could result in greater expense associated with collection efforts and increased bad debt expense.
The cost of raising money in the debt and equity capital markets has increased substantially during the current financial crisis while the availability of funds from those markets has diminished significantly. The current global economic downturn may adversely impact our ability to issue additional debt and institutional investors have responded to their customers by increasing interest rates, enacting tighter lending standards and refusing to refinance existing debt upon maturity or on terms similar to expiring debt. Even though we completed a private placement of 7,966,500 shares of our common stock for aggregate net proceeds of $30.0 million in the fourth quarter of 2008, we may require additional capital in the future. However, due to the above listed factors, we cannot be certain that additional funding will be available if needed and, to the extent required, on acceptable terms.
10
Table of Contents
Index to Financial Statements
Our business depends on domestic spending by the oil and natural gas industry, and this spending and our business may be adversely affected by industry and financial market conditions that are beyond our control.
We depend on our customers’ willingness to make operating and capital expenditures to explore, develop and produce oil and natural gas in the United States. Customers’ expectations for lower market prices for oil and natural gas, as well as the availability of capital for operating and capital expenditures, may curtail spending thereby reducing demand for our services and equipment.
Industry conditions are influenced by numerous factors over which we have no control, such as the supply of and demand for oil and natural gas, domestic and worldwide economic conditions, political instability in oil and natural gas producing countries and merger and divestiture activity among oil and natural gas producers. The volatility of the oil and natural gas industry and the consequent impact on exploration and production activity could adversely impact the level of drilling and workover activity by some of our customers. This reduction may cause a decline in the demand for our services or adversely affect the price of our services. In addition, reduced discovery rates of new oil and natural gas reserves in our market areas also may have a negative long-term impact on our business, even in an environment of stronger oil and natural gas prices, to the extent existing production is not replaced and the number of producing wells for us to service declines.
Recent adverse changes in capital markets have also caused a number of oil and natural gas producers to announce reductions in capital budgets for future periods. Limitations on the availability of capital, or higher costs of capital, for financing expenditures may cause these and other oil and natural gas producers to make additional reductions to capital budgets in the future even if commodity prices remain at historically high levels.
These same economic factors impact our customers’ ability to pay amounts due to us on a timely basis. This may impact some customers more severely causing them to be unable to pay their vendors for extended periods, if at all. This could have a negative impact on our cash flow.
Our indebtedness could restrict our operations and make us more vulnerable to adverse economic conditions.
As of December 31, 2008, our long-term debt, including current maturities, was $212.2 million. In the event the downturn continues or worsens, our level of indebtedness may adversely affect operations and limit our growth. Our level of indebtedness may affect our operations in several ways, including the following:
| • | by increasing our vulnerability to general adverse economic and industry conditions; |
| • | due to the fact that the covenants that are contained in the agreements governing our indebtedness limit our ability to borrow funds, dispose of assets, pay dividends and make certain investments; |
| • | due to the fact that any failure to comply with the financial or other covenants of our debt could result in an event of default, which could result in some or all of our indebtedness becoming immediately due and payable; and |
| • | due to the fact that our level of debt may impair our ability to obtain additional financing in the future for working capital, capital expenditures, acquisitions or other general corporate purposes. |
Under our Credit Facility, an event of default will be deemed to have occurred if there is a change in control over us or if a material adverse change occurs with regards to our financial position, our consolidated business, assets, operations, properties or prospects, our ability to timely pay the obligations under the Credit Facility or the enforceability of the material terms of any material loan document against us. The lender under the Credit Facility could at some future date make a determination that such a material adverse change had occurred, which is outside our control. Due to cross-default provisions in our Credit Facility and the indenture governing our Senior Secured Notes, a default and acceleration of outstanding debt under one debt agreement would result in the default and possible acceleration of outstanding debt under our other agreement. Accordingly, a default under a material adverse change clause or otherwise could result in all or a portion of our outstanding debt becoming immediately due and payable. If this occurred, we might not be able to obtain waivers or secure alternative financing to satisfy all of our obligations simultaneously. These events could have a material adverse effect on our business, financial position, results of operations and cash flows and the ability to satisfy the obligations under our debt agreements.
11
Table of Contents
Index to Financial Statements
Impairment of our long-term assets may adversely impact our financial position and results of operations.
We evaluate our long-term assets including property, equipment, identifiable intangible assets and goodwill in accordance with generally accepted accounting principles in the U.S. We used estimated future cash flows in assessing recoverability of our long-lived assets and an impairment of goodwill. The cash flow projections are based on our current operating plan, estimates and judgmental assessments. We perform this assessment of potential impairment at least annually, but also whenever facts and circumstances indicate that the carrying value of the net assets may not be recoverable due to various external or internal factors, termed a “triggering event.” We have recorded goodwill impairment charges of $4.4 million for the year ended December 31, 2008. If we determine that our estimates of future cash flows were inaccurate or our actual results for 2009 are materially different than expected, we could record additional impairment charges at interim periods during 2009 or in future years, which could have a material adverse effect on our financial position and results of operations.
We may be unable to maintain pricing on our core services.
Through the first three quarters of 2008, we were able to maintain consistent pricing for our services given the high level of demand through such period. However, as a result of pressures stemming from deteriorating market conditions and falling commodity prices, it has become increasingly difficult to maintain our prices. We have and will likely continue to face pricing pressure from our customers and our competitors. We have made price concessions, and may be compelled to make further price concessions, in order to maintain market share. The inability to maintain our pricing or further reductions in our pricing may have a material negative impact on our financial position, operating results, and cash flows.
Industry capacity may adversely affect our business.
Through the first three quarters of 2008, we had excellent utilization rates. As a result of the current worldwide economic downturn and decline in U.S. onshore exploration and production activities, demand in the industry generally is much lower than in the past which also means that neither we nor our competitors are utilizing significant portions of our respective rig fleets and related equipment. Lower utilization of our fleet has led to reduced pricing for our services. Capacity that exceeds current demand in the industry has further exacerbated the pricing pressure for our services. Although oilfield service companies are not likely to add significant new capacity under current market conditions, in light of current market conditions and the deteriorating demand for our services, the excess capacity could cause us to experience continued pressure on the pricing of our services and our utilization. This could have a material negative impact on our financial position, operating results, and cash flows.
The industry in which we operate is highly competitive.
The oilfield services industry is highly competitive and we compete with a substantial number of companies, some of which have greater technical and financial resources than we have. Our four largest competitors are Basic Energy Services, Inc., Complete Production Services, Inc., Key Energy Services Inc. and Nabors Industries Ltd. Our ability to generate revenues and earnings depends primarily upon our ability to win bids in competitive bidding processes and to perform awarded projects within estimated times and costs. There can be no assurance that competitors will not substantially increase the resources devoted to the development and marketing of products and services that compete with ours, or that new or existing competitors will not enter the various markets in which we are active. In certain aspects of our business, we also compete with a number of small and medium-sized companies that, like us, have certain competitive advantages such as low overhead costs and specialized regional strengths. In addition, reduced levels of activity in the oil and natural gas industry could intensify competition and the pressure on competitive pricing and may result in lower revenues or margins to us.
We anticipate having substantial capital requirements that, if not met, may slow our operations.
Our business strategy is based in part upon the continued expansion of our fleet through the purchase of new well servicing rigs, vacuum trucks, and related equipment. In order to continue to implement our business strategy, we will be required to expend substantial sums for any such purchases. We expect to pay for these capital expenditures through cash flow from operations, borrowings under the Credit Facility, short-term equipment vendor financings, and other permitted financings. To continue to fund future growth, including making additional capital expenditures to purchase additional equipment and, over the longer term, to remain competitive, we may need to obtain additional financings, some of which may be secured, and/or to raise capital through the sale of additional debt or equity securities. Our ability to obtain financing or to access the capital markets for future offerings may be limited by the restrictive covenants in our current and future debt agreements, by our future financial condition, and by adverse market conditions resulting from, among other things, general economic conditions and contingencies and uncertainties beyond our control.
12
Table of Contents
Index to Financial Statements
In light of the current market conditions and the deteriorating demand for our services, capital requirements for new equipment purchases are not currently an issue. However, an upturn in the market would renew the risks discussed in this risk factor.
The indenture governing the Senior Secured Notes and the credit agreement governing the Credit Facility impose significant operating and financial restrictions on us that may prevent us from pursuing certain business opportunities and restrict our ability to operate our business.
The indenture governing the Senior Secured Notes and the credit agreement governing the Credit Facility contain covenants that restrict our ability to take various actions, such as
| • | incurring or guaranteeing additional indebtedness or issuing disqualified capital stock; |
| • | creating or incurring liens; |
| • | engaging in business other than our current business and reasonably related extensions thereof; |
| • | making loans and investments; |
| • | paying certain dividends, distributions, redeeming subordinated indebtedness or making other restricted payments; |
| • | incurring dividend or other payment restrictions affecting certain subsidiaries; |
| • | transferring or selling assets; |
| • | entering into transactions with affiliates; |
| • | making capital expenditures; |
| • | entering into sale/leaseback transactions; and |
| • | consummating a merger, consolidation or sale of all or substantially all of our assets. |
In addition, the credit agreement requires us to comply with specified financial ratios, including regarding minimum net worth, fixed charge coverage and similar such ratios.
Our ability to comply with these covenants will likely be affected by events beyond our control, and we cannot assure that we will satisfy those requirements.
The restrictions contained in the indenture and the credit agreement could also limit our ability to plan for or react to market conditions, meet capital needs or otherwise restrict our activities or business plans and adversely affect our ability to fund our operations, enter into acquisitions or to engage in other business activities that would be in our interest.
We are subject to the risk of technological obsolescence.
Our ability to maintain our current business and win new business will depend upon continuous improvements in operating equipment, among other things. There can be no assurance that we will be successful in our efforts in this regard or that we will have the resources available to continue to support this need to have our equipment remain technologically up to date and competitive. Our failure to do so could have a material adverse effect on us. No assurances can be given that competitors will not achieve technological advantages over us.
We are highly dependent on certain of our officers and key employees.
Our success is dependent upon our key management, technical and field personnel, especially John E. Crisp, our President and Chief Executive Officer, Charles C. Forbes, our Executive Vice President and Chief Operating Officer, and other key executive officers. Any loss of the services of any one of such officers or a sufficient number of other employees could have a material adverse effect on our business and operations. Our ability to expand our services is dependent upon our ability to attract and retain additional qualified employees. The ability to secure the services of additional personnel may be constrained in times of strong industry activity.
13
Table of Contents
Index to Financial Statements
Our customer base is concentrated within the oil and natural gas production industry and loss of a significant customer could cause our revenue to decline substantially.
We served in excess of 730 customers for the year ended December 31, 2008. For this same time period, our largest customer comprised approximately 8.5% of our combined revenues, our five largest customers comprised approximately 30.3% of our combined revenues, and our top ten customers comprised approximately 42.9% of our combined revenues. Although we have been continually expanding our market base and adding new customers since inception, these customers currently represent a large portion of our combined revenues. The loss of our top customer or of several of our top customers would adversely affect our revenues and results of operations. We may be able to replace customers lost with other customers, but there can be no assurance that lost revenues could be replaced in a timely manner, with the same margins or at all.
We will continue to incur significant costs as a result of being obligated to comply with Securities Exchange Act reporting requirements, the Sarbanes-Oxley Act and Canadian reporting requirements, and our management will be required to devote substantial time to compliance matters.
Under our indenture, we are required to file reports under the Securities Exchange Act of 1934, as amended, with the Securities and Exchange Commission, or the Commission. In addition, the Sarbanes-Oxley Act of 2002, as well as rules subsequently implemented by the Commission have imposed various requirements on public companies, including the establishment and maintenance of effective disclosure controls and procedures, internal controls and corporate governance practices. We are also required to comply with the rules and regulations applicable to public companies in Canada and to file reports with the Canadian securities administrators. Accordingly, we will continue to incur significant legal, accounting and other expenses. Our management and other personnel will continue to devote a substantial amount of time and resources to comply with these requirements. These rules and regulations will increase our legal and financial compliance costs.
The Sarbanes-Oxley Act of 2002 requires, among other things, that we maintain effective internal controls for financial reporting and disclosure. In particular, commencing in fiscal 2009, we will be required to perform system and process evaluation and testing of our internal controls over financial reporting to allow management and our independent registered public accounting firm to report on the effectiveness of our internal controls over financial reporting, as required by Section 404 of the Sarbanes-Oxley Act of 2002. Our testing, or the subsequent testing by our independent registered public accounting firm, may reveal deficiencies in our internal controls over financial reporting that are deemed to be material weaknesses or significant deficiencies in addition to the ones discussed below. We expect to continue to incur significant expense and devote substantial management effort toward ensuring compliance in particular with Section 404. Moreover, if we are not able to comply with the requirements of Section 404 in a timely manner, if we identify possible future deficiencies in our internal controls in addition to the ones discussed below that are deemed to be material weaknesses or if we fail to adequately address existing and future deficiencies, we could be subject to sanctions or investigations by the SEC or other regulatory authorities, which would entail expenditure of additional financial and management resources.
We face several risks relating to material weaknesses in our internal control over financial reporting.
In connection with the preparation of the Forbes Group’s combined financial statements for the years ended December 31, 2006 and 2007 and our consolidated financial statements for the year ended December 31, 2008, we identified control deficiencies that constitute material weaknesses in the design and operation of our internal control over financial reporting. A material weakness is a deficiency, or combination of deficiencies, in internal control over financial reporting, such that there is a reasonable possibility that a material misstatement of our annual or interim financial statements will not be prevented or detected on a timely basis. The following material weaknesses were present at December 31, 2008.
| • | We did not maintain an appropriate accounting and financial reporting organizational structure to support the activities of the Forbes Group. Specifically, we did not maintain a sufficient complement of personnel with an appropriate level of accounting knowledge, experience and training to ensure the proper selection, application and implementation of GAAP. |
| • | We did not maintain effective controls over the preparation and review of the consolidated/combined financial statements and disclosures. |
| • | We did not design or maintain effective controls over purchase accounting. Specifically, we did not design and maintain effective controls over the accuracy and completeness of the purchase price allocation associated with the January 1, 2008 Delaware Reorganization. This material weakness resulted in the requirement to restate the Company’s unaudited condensed consolidated financial statements issued and filed for the quarters ended June 30, 2008 and September 30, 2008 (as well as the issued but unfiled financial statements for the quarter ended March 31, 2008). |
14
Table of Contents
Index to Financial Statements
| • | We did not design and maintain effective controls over the review of the accuracy and completeness of the income tax provision. This material weakness resulted in the requirement to restate the Company’s unaudited condensed consolidated financial statements issued and filed for the quarters ended June 30, 2008 and September 30, 2008. |
These material weaknesses could result in a future material misstatement to substantially all the accounts and disclosures that would result in a material misstatement to the annual or interim consolidated financial statements that would not be prevented or detected. Accordingly we have determined that each of the above control deficiencies represents a material weakness.
Internal control deficiencies could cause investors to lose confidence in our reported financial information. In addition, even if we are successful in strengthening our controls and procedures, our controls and procedures may not be adequate to prevent or identify irregularities or errors or to facilitate the fair presentation of our financial statements. We can give no assurance that the measures we have taken to date, or any future measures we may take, will remediate the material weaknesses identified or that any additional material weaknesses and significant deficiencies or additional restatements of financial results will not arise in the future due to a failure to implement and maintain adequate internal control over financial reporting or circumvention of these controls.
Activity in the oilfield services industry is seasonal and may affect our revenues during certain periods.
Our operations are impacted by seasonal factors. Historically, our business has been negatively impacted during the winter months due to inclement weather, fewer daylight hours and holidays. Our well servicing rigs are mobile, and we operate a significant number of oilfield vehicles. During periods of heavy snow, ice or rain, we may not be able to move our equipment between locations, thereby reducing our ability to generate rig or truck hours. In addition, the majority of our well servicing rigs work only during daylight hours. In the winter months when daylight time becomes shorter, this reduces the amount of time that the well servicing rigs can work and therefore has a negative impact on total hours worked. Finally, we historically have experienced significant slowdown during the Thanksgiving and Christmas holiday seasons.
We rely heavily on our suppliers and do not maintain written agreements with any such suppliers.
Our ability to compete and grow will be dependent on our access to equipment, including well servicing rigs, parts and components, among other things, at a reasonable cost and in a timely manner. We do not maintain written agreements with any of our suppliers (other than operating leases for certain equipment), and we are therefore dependent on the relationships we maintain with them. Failure of suppliers to deliver such equipment, parts and components at a reasonable cost and in a timely manner would be detrimental to our ability to maintain existing customers and obtain new customers. No assurance can be given that we will be successful in maintaining our required supply of such items.
We rely heavily on two suppliers for potassium chloride, a principal raw material that is critical for our operations. While the materials are generally available, if we were to have a problem sourcing raw materials or transporting these materials from one of these two vendors, our ability to provide some of our services could be limited. Alternate suppliers exist for all other raw materials. The source and supply of materials has been consistent in the past, however, in periods of high industry activity, periodic shortages of certain materials have been experienced and costs have been affected. We do not have contracts with, but we do maintain relationships with, a number of suppliers in an attempt to mitigate this risk. However, if current or future suppliers are unable to provide the necessary raw materials, or otherwise fail to deliver products in the quantities required, any resulting delays in the provision of services to our customers could have a material adverse effect on our business, results of operations, financial condition and cash flows.
We do not maintain written agreements with respect to some of our salt water disposal wells.
Our ability to continue to provide well maintenance services depends on our continued access to salt water disposal wells. Four of our 14 salt water disposal wells are located on the premises of third parties who have not entered into a written lease with us. We do not maintain written surface leases or right of way agreements with these third parties and we are therefore dependent on the relationships we maintain with them. Failure to maintain relationships with these third parties could impair our ability to access and maintain the applicable salt water disposal wells and any well servicing equipment located on their property. If that occurred, we would increase the levels of fluid injection at our remaining salt water disposal wells. However, our permits to inject fluid into the salt water disposal wells is subject to maximum pressure limitations and if multiple salt water disposal wells became unavailable, this might adversely impact our operations.
15
Table of Contents
Index to Financial Statements
We extend credit to our customers which presents a risk of non-payment.
A substantial portion of our accounts receivable are with customers involved in the oil and natural gas industry, whose revenues may be affected by fluctuations in oil and natural gas prices. Collection of these receivables could be influenced by economic factors affecting this industry. We do not have significant exposure to any individual customer other than our top customer, which accounted for approximately 8.5% of the revenues for the year ended December 31, 2008.
Due to the nature of our business, we may be subject to environmental liability.
Our business operations and ownership of real property are subject to numerous federal, state and local environmental and health and safety laws and regulations, including those relating to emissions to air, discharges to water, treatment, storage and disposal of regulated materials, and remediation of soil and groundwater contamination. The nature of our business, including operations at our current and former facilities by prior owners, lessors or operators, exposes us to risks of liability under these laws and regulations due to the production, storage, use, transportation and disposal of materials that can cause contamination or personal injury if released into the environment. Environmental laws and regulations may have a significant effect on the costs of transportation and storage of raw materials as well as the costs of the transportation, treatment, storage and disposal of wastes. We believe we are in material compliance with applicable environmental and worker health and safety requirements. However, we may incur substantial costs, including fines, damages, criminal or civil sanctions, remediation costs, or experience interruptions in our operations for violations or liabilities arising under these laws and regulations. We may have the benefit of insurance maintained by us, our customers or others. However, we may become liable for damages against which we cannot adequately insure or against which we may elect not to insure because of high costs or other reasons.
Our customers are subject to similar environmental laws and regulations, as well as limits on emissions to the air and discharges into surface and sub-surface waters. Although regulatory developments that may occur in subsequent years could have the effect of reducing industry activity, we cannot predict the nature of any new restrictions or regulations that may be imposed. We may be required to increase operating expenses or capital expenditures in order to comply with any new restrictions or regulations.
Increasing trucking regulations may increase our costs and negatively affect our results of operations.
In connection with the services we provide, we operate as a motor carrier and therefore are subject to regulation by the U.S. Department of Transportation, or U.S. DOT, and by various state agencies. These regulatory authorities exercise broad powers, governing activities such as the authorization to engage in motor carrier operations and regulatory safety. There are additional regulations specifically relating to the trucking industry, including testing and specification of equipment and product handling requirements. The trucking industry is subject to possible regulatory and legislative changes that may affect the economics of the industry by requiring changes in operating practices or by changing the demand for common or contract carrier services or the cost of providing truckload services. Some of these possible changes include increasingly stringent environmental regulations and changes in the regulations that govern the amount of time a driver may drive in any specific period, onboard black box recorder devices, or limits on vehicle weight and size.
Interstate motor carrier operations are subject to safety requirements prescribed by the U.S. DOT. To a large degree, intrastate motor carrier operations are subject to state safety regulations that mirror federal regulations. Such matters as weight and dimension of equipment are also subject to federal and state regulations.
From time to time, various legislative proposals are introduced, including proposals to increase federal, state, or local taxes, including taxes on motor fuels, which may increase our costs or adversely affect the recruitment of drivers. Management cannot predict whether, or in what form, any increase in such taxes applicable to us will be enacted. We may be required to increase operating expenses or capital expenditures in order to comply with any new restrictions or regulations.
We are subject to extensive additional governmental regulation.
In addition to environmental and trucking regulations, our operations are subject to a variety of other United States and Mexico federal, state and local laws, regulations and guidelines, including laws and regulations relating to health and safety, the conduct of operations, and the manufacture, management, transportation, storage and disposal of certain materials used in our operations. We believe that we are in compliance with such laws, regulations and guidelines. Although we continue to enhance our infrastructure, we have invested financial and managerial resources to comply with applicable laws, regulations and guidelines and
16
Table of Contents
Index to Financial Statements
will continue to do so in the future. Although regulatory expenditures have not, historically, been material to us, such laws, regulations and guidelines are subject to change. Accordingly, it is impossible for us to predict the cost or effect of such laws, regulations or guidelines on our future operations.
Our operations are inherently risky, and insurance may not always be available in amounts sufficient to fully protect us.
We have an insurance and risk management program in place to protect our assets, operations and employees. We also have programs in place to address compliance with current safety and regulatory standards. However, our operations are subject to risks inherent in the oilfield services industry, such as equipment defects, malfunctions, failures, accidents and natural disasters. In addition, hazards such as unusual or unexpected geological formations, pressures, blow-outs, fires or other conditions may be encountered in drilling and servicing wells, as well as the transportation of fluids and company assets between locations. These risks and hazards could expose us to substantial liability for personal injury, loss of life, business interruption, property damage or destruction, pollution and other environmental damages.
Although we have obtained insurance against certain of these risks, such insurance is subject to coverage limits and exclusions and may not be available for the risks and hazards to which we are exposed. In addition, no assurance can be given that such insurance will be adequate to cover our liabilities or will be generally available in the future or, if available, that premiums will be commercially justifiable. If we were to incur substantial liability and such damages were not covered by insurance or were in excess of policy limits, or if we were to incur such liability at a time when we are not able to obtain liability insurance, our business, results of operations and financial condition could be materially adversely affected.
The market for oil and natural gas may be adversely affected by global demands to curtail use of such fuels.
Fuel conservation measures, alternative fuel requirements, increasing consumer demand for alternatives to oil and natural gas and technological advances in fuel economy and energy generation devices could reduce the demand for oil and other liquid hydrocarbons. We cannot predict the effect of changing demand for oil and natural gas products, and any major changes may have a material adverse effect on our business, financial condition, results of operations and cash flows.
Our international operations could be adversely affected by war, civil disturbance, or political or economic turmoil, fluctuation in currency exchange rates and local import and export controls.
We recently began international operations in Mexico. While such operations are currently not significant to our total operations, we may continue to grow our business in Mexico. Foreign operations are subject to various risks, including the risk of war, civil disturbances and governmental activities that may limit or disrupt markets, restrict the movement of funds or result in the deprivation of contract rights or the taking of property without fair compensation. In certain countries, our operations may be subject to the additional risk of fluctuating currency values and exchange controls. In Mexico we are subject, and in any other international market in which we may operate we will be subject, to various laws and regulations that govern the operation and taxation of our business and the import and export of our equipment from country to country, the imposition, application and interpretation of which can prove to be uncertain.
We cannot predict how an exit by any of our principal equity investors could affect our operations or business.
As of March 20, 2009, John E. Crisp, Charles C. Forbes and Janet L. Forbes owned 15.22%, 15.66%, and 14.54%, respectively, of our capital stock. Our principal equity investors may transfer their interests in us or engage in other business combination transactions with a third party that could result in a change in ownership or a change of control of us. Any transfer of an equity interest in us or a change of control could affect our governance. We cannot be certain that our equity investors will not sell, transfer or otherwise modify their ownership interest in us, whether in transactions involving third parties or other investors, nor can we predict how a change of equity investors or change of control would affect our operations or business.
Our principal equity investors control important decisions affecting our governance and our operations, and their interests may differ from those of the other stockholders and noteholders.
Circumstances may arise in which the interests of our principal equity investors could be in conflict with those of the other stockholders and/or noteholders. In particular, our principal equity investors may have an interest in pursuing certain strategies or transactions that, in their judgment, enhance the value of their investment in us even though these strategies or transactions may involve risks to noteholders. Further conflicts of interest may arise between noteholders and our principal equity investors when we are faced with decisions that could have different implications for noteholders and our principal equity investors, including financial
17
Table of Contents
Index to Financial Statements
budgets, potential competition, the issuance or disposition of securities, the payment of distributions by us, regulatory and legal positions and other matters. Because our principal equity investors control us, these conflicts may be resolved in a manner adverse to, or that imposes more risks on, the noteholders.
In addition, conflicts of interest may arise between us and one or more of our principal equity investors when we are faced with decisions that could have different implications for us and our principal equity investors. Although our bye-laws provide certain procedural protections and require that any business combination (as defined therein) between us and an interested shareholder (as defined therein) be approved by the board of directors and sixty-six and two-thirds percent of our outstanding voting shares, this does not address all conflicts of interest that may arise. For example, our principal equity investors and their affiliates are not prohibited from competing with us. Because our principal equity investors control us, conflicts of interest arising because of competition between us and a principal equity investor could be resolved in a manner adverse to us. It is possible that there will be situations where our principal equity investors’ interests are in conflict with our interests, and our principal equity investors acting through the Board of Directors or through our executive officers could resolve these conflicts in a manner adverse to us.
We are a Bermuda company and it may be difficult to enforce judgments against us.
We are a Bermuda exempted company. As a result, the rights of holders of our common shares will be governed by Bermuda law and our memorandum of association and Bye-laws. The rights of shareholders under Bermuda law may differ from the rights of shareholders of companies incorporated in other jurisdictions. As a result, it may be difficult for investors to enforce in Canada or the U.S. judgments obtained in Canadian or U.S. courts against us based on the civil liability provisions of U.S. or Canadian securities laws. It is doubtful whether courts in Bermuda will enforce judgments obtained in other jurisdictions, including the United States and Canada, against us or our directors or officers under the securities laws of those jurisdictions or entertain actions in Bermuda against us or our directors or officers under the securities laws of other jurisdictions.
Our Bye-laws restrict shareholders from bringing legal action against our officers and directors.
Our Bye-laws contain a broad waiver by our shareholders of any claim or right of action, both individually and on behalf of us, against any of our officers or directors. The waiver applies to any action taken by an officer or director, or the failure of an officer or director to take any action, in the performance of his or her duties, except with respect to any matter involving any fraud or dishonesty on the part of the officer or director. This waiver limits the right of shareholders to assert claims against the officers and directors unless the act or failure to act involves fraud or dishonesty.
We have anti-takeover provisions in our Bye-laws and elsewhere that may discourage a change of control.
Our Bye-laws contain provisions that could make it more difficult for a third party to acquire us without the consent of the Board of Directors. These provisions provide for the following:
| • | restrictions on the time period in which directors may be nominated; |
| • | the Board of Directors to determine the powers, preferences and rights of the Preference Shares and to issue the Preference Shares without shareholder approval; |
| • | Class B non-voting shares that are immediately convertible into common shares. In the event John E. Crisp, Charles C. Forbes and Janet L. Forbes converted all of their Class B non-voting shares into common shares, those three individuals would own a majority of our voting securities; and |
| • | an anti-takeover provision that requires a majority of the Board of Directors to approve certain corporate transactions. |
We also have a shareholder rights plan which makes it very difficult for anyone to accumulate more than a certain percentage of our outstanding equity without approval of the Board of Directors. These provisions could make it more difficult for a third party to acquire us, even if the third party’s offer may be considered beneficial by many shareholders. As a result, shareholders may be limited in their ability to obtain a premium for their shares.
18
Table of Contents
Index to Financial Statements
Future legal proceedings could adversely affect us and our operations.
Given the nature of our business, we are involved in litigation from time to time in the ordinary course of business. Although, except as set forth under “Part II, Item 1–Legal Proceedings,” we are not presently a party to any material legal proceedings, legal proceedings could be filed against us in the future. No assurance can be given as to the final outcome of any legal proceedings or that the ultimate resolution of any legal proceedings will not have a material adverse effect on us.
We may not be able to fully integrate future acquisitions.
We may undertake future acquisitions of businesses and assets in the ordinary course of business. Achieving the benefits of acquisitions depends in part on having the acquired assets perform as expected, successfully consolidating functions, retaining key employees and customer relationships, and integrating operations and procedures in a timely and efficient manner. Such integration may require substantial management effort, time and resources and may divert management’s focus from other strategic opportunities and operational matters, and ultimately we may fail to realize anticipated benefits of acquisitions.
Item 1B. Unresolved Staff Comments
None.
19
Table of Contents
Index to Financial Statements
The following sets forth the locations from which the Company conducts its operations. The Company leases or rents all of the properties set forth below, except for the Alice rig yard and San Ygnacio truck yard. A description of the leases is set forth in “Management’s Discussion and Analysis of Financial Condition and Results of Operations.”
Location | Date in Service | Service Offering | ||
South Texas | ||||
| Alice – truck location | 9/1/2003 | Fluid Logistics | ||
| Alice – rig location | 9/1/2003 | Well Servicing | ||
| Freer | 9/1/2003 | Fluid Logistics | ||
| Laredo | 10/1/2003 | Fluid Logistics | ||
| San Ygnacio | 4/1/2004 | Fluid Logistics | ||
| Goliad | 8/1/2005 | Fluid Logistics | ||
| Bay City | 9/1/2005 | Fluid Logistics | ||
| Edna | 2/1/2006 | Well Servicing/Fluid Logistics | ||
| Three Rivers | 8/1/2006 | Fluid Logistics | ||
| Carrizo Springs | 12/1/2006 | Fluid Logistics | ||
| Edinburg | 11/30/2007 | Fluid Logistics | ||
| West Texas | ||||
| Ozona | 3/1/2006 | Well Servicing/Fluid Logistics | ||
| San Angelo | 7/1/2006 | Well Servicing/Fluid Logistics | ||
| Monahans | 8/31/2007 | Well Servicing/Fluid Logistics | ||
| Odessa | 9/30/2007 | Well Servicing/Fluid Logistics | ||
| Big Spring | 10/15/2007 | Well Servicing/Fluid Logistics | ||
| Denver City | 4/10/2008 | Well Servicing | ||
| Big Lake | 7/16/2008 | Well Servicing/Fluid Logistics | ||
| Andrews | 8/27/2008 | Well Servicing | ||
| East Texas | ||||
| Marshall | 12/1/2005 | Fluid Logistics | ||
| Carthage | 3/1/2007 | Well Servicing | ||
| Kilgore | 11/1/2007 | Well Servicing/Fluid Logistics | ||
| Liberty | 5/1/2008 | Well Servicing | ||
| Nacogdoches | 6/5/2008 | Fluid Logistics | ||
| North Texas | ||||
| Godley | 2/15/2008 | Well Servicing | ||
| Mississippi | ||||
| Baxterville | 3/20/2008 | Well Servicing | ||
| Mexico | ||||
| Poza Rica | 12/01/2008 | Well Servicing | ||
20
Table of Contents
Index to Financial Statements
There are no pending material legal proceedings, and the Forbes Group is not aware of any material threatened legal proceedings, to which the Forbes Group is a party or to which its property is subject, other than in the ordinary course of business.
Item 4. Submission of Matters to a Vote of Security Holders
None.
21
Table of Contents
Index to Financial Statements
| Item 5. | Market for Registrant’s Common Equity, Related Stockholder Matters and Issuer Purchases of Equity Securities |
Price Range of Common Shares
Our common shares began trading on the Toronto Stock Exchange (“TSX”) under the symbol “FRB.TO” immediately after the completion of our initial public offering in Canada on May 29, 2008. The following table sets forth, for the periods indicated, the high and low sales prices reported in Canadian dollars as reported on the TSX for our common shares for the year ended December 31, 2008 beginning with such date.
| High | Low | |||||
Fiscal Year 2008: | ||||||
Second Quarter (beginning May 29, 2008) | CDN $ | 7.99 | CDN $ | 6.70 | ||
Third Quarter | CDN $ | 7.90 | CDN $ | 3.65 | ||
Fourth Quarter | CDN $ | 3.73 | CDN $ | 1.30 | ||
As of March 27, 2009, the last reported sales price of our common shares on the TSX was CDN$0.41 per share. As of March 26, 2009, there were 46 stockholders of record of our common shares. All common shares held in street name are recorded in the Company’s stock register as being held by one stockholder.
We have reserved 5,220,000 shares for issuance under our incentive compensation plan.
Dividend Policy
Our current indenture and credit agreement limit the payment of dividends, other than dividends payable solely in our capital stock. To date, we have not paid cash dividends on our common shares, and currently intend to retain earnings for the development and growth of our business. Future decisions to pay cash dividends will be at the discretion of the Board of Directors and will depend upon our results of operations, financial condition and capital expenditure plans and restrictive covenants under our indenture and credit facility, along with other relevant factors.
Unregistered Sales of Equity Securities
In October 2008, we completed a private placement of an aggregate of 7,966,500 of our common shares at a price per share of CDN $4.00 for an aggregate purchase price in the amount of USD $30,000,000. Such common shares were sold in reliance on exemptions from registration provided by Section 4(2) of the Securities Act of 1933, as amended, and Regulation D promulgated thereunder and were issued on October 22, 2008.
22
Table of Contents
Index to Financial Statements
| Item 6. | Selected Financial Data |
The statement of operations data for the years ended December 31, 2008, 2007 and 2006, and the balance sheet data as of December 31, 2008 and 2007, have been derived from our audited consolidated/combined financial statements included elsewhere in this Annual Report on Form 10-K. The statement of operations data for the years ended December 31, 2005 and 2004, and the balance sheet data as of December 31, 2006 and 2005 have been derived from our audited combined financial statements not included in this Annual Report on Form 10-K. The balance sheet data as of December 31, 2004 has been derived from our unaudited combined financial statements not included in this Annual Report on Form 10-K. Our historical results are not necessarily indicative of results to be expected for any future period. The data presented below have been derived from financial statements that have been prepared in accordance with accounting principles generally accepted in the United States and should be read with our financial statements, including notes, and with “Management’s Discussion and Analysis of Financial Condition and Results of Operations” included elsewhere in this Annual Report on Form 10-K.
| Year Ended December 31, | ||||||||||||||||||||
| 2008 | 2007 | 2006 | 2005 | 2004 | ||||||||||||||||
| (dollars in thousands) | ||||||||||||||||||||
Statement of Operations Data: | ||||||||||||||||||||
Revenues: | ||||||||||||||||||||
Well servicing | $ | 189,980 | $ | 103,601 | $ | 58,574 | $ | 24,022 | $ | 9,014 | ||||||||||
Fluid logistics | 170,949 | 103,405 | 74,141 | 36,799 | 13,580 | |||||||||||||||
Total revenues | 360,929 | 207,006 | 132,715 | 60,821 | 22,594 | |||||||||||||||
Expenses: | ||||||||||||||||||||
Well servicing | 128,614 | 60,570 | 32,453 | 16,346 | 6,759 | |||||||||||||||
Fluid logistics | 117,940 | 69,887 | 49,620 | 23,684 | 9,678 | |||||||||||||||
General and administrative | 17,700 | 8,824 | 6,026 | 2,747 | 1,026 | |||||||||||||||
Depreciation and amortization | 33,724 | 15,342 | 7,410 | 3,771 | 1,582 | |||||||||||||||
Impairment of goodwill | 4,364 | — | — | — | — | |||||||||||||||
Litigation Settlement | — | — | — | — | 7,250 | |||||||||||||||
Total expenses | 302,342 | 154,623 | 95,509 | 46,548 | 26,295 | |||||||||||||||
Operating income (loss) | 58,587 | 52,383 | 37,206 | 14,273 | (3,701 | ) | ||||||||||||||
Other income (expense): | ||||||||||||||||||||
Interest expense | (25,798 | ) | (8,343 | ) | (5,074 | ) | (2,182 | ) | (580 | ) | ||||||||||
Other income (expense) | 38 | 237 | 141 | (28 | ) | 61 | ||||||||||||||
Income (loss) before income taxes | 32,827 | 44,277 | 32,273 | 12,063 | (4,220 | ) | ||||||||||||||
Income tax expense (1) | (62,574 | ) | (683 | ) | — | — | — | |||||||||||||
Net income (loss) | $ | (29,748 | ) | $ | 43,594 | $ | 32,273 | $ | 12,063 | $ | (4,220 | ) | ||||||||
Loss per share of Common Stock | ||||||||||||||||||||
Basic | $ | (0.65 | ) | |||||||||||||||||
Diluted | $ | (0.65 | ) | |||||||||||||||||
23
Table of Contents
Index to Financial Statements
| Year Ended December 31, | ||||||||||
| 2008 | 2007 | 2006 | 2005 | 2004 | ||||||
Operating Data: | ||||||||||
Well servicing rigs (end of periods) | 170 | 101 | 43 | 17 | 11 | |||||
Rig hours | 378,657 | 180,700 | 90,941 | 44,086 | 20,108 | |||||
Heavy trucks (end of period) (2) | 370 | 262 | 179 | 119 | 34 | |||||
Trucking hours | 1,115,593 | 711,171 | 514,082 | 251,511 | 91,969 | |||||
Salt water disposal wells (end of period) | 14 | 14 | 9 | 6 | 4 | |||||
Locations (end of period) | 27 | 18 | 12 | 7 | 4 | |||||
Frac tanks (end of period) | 1,370 | 951 | 568 | 241 | 105 | |||||
| (1) | On May 29, 2008, in connection with the Bermuda Reorganization, the Forbes Group became a taxable entity, which resulted in $52.8 million of income tax expense that was recorded as a one-time, deferred income tax charge to recognize the conversion to a taxable entity. Prior to that time, the entities comprising the Forbes Group were flow through entities for federal income tax purposes and the only tax obligations of the entity were the Texas margin tax which was applicable after June 29, 2007. |
| (2) | Includes vacuum trucks, high pressure pump trucks and other heavy trucks. |
| Year Ended December 31, | |||||||||||||||
| 2008 | 2007 | 2006 | 2005 | 2004 | |||||||||||
| (unaudited) | |||||||||||||||
| (dollars in thousands) | |||||||||||||||
Balance Sheet Data: | |||||||||||||||
Cash and cash equivalents | $ | 23,469 | $ | 5,209 | $ | 7,650 | $ | 3,264 | $ | 359 | |||||
Property and equipment, net | 330,951 | 204,132 | 92,131 | 46,786 | 22,909 | ||||||||||
Total assets | 482,801 | �� | 259,995 | 128,518 | 66,369 | 30,819 | |||||||||
Total long-term debt | 205,378 | 107,458 | 56,188 | 33,470 | 15,058 | ||||||||||
Total liabilities | 324,383 | 189,536 | 89,718 | 55,103 | 29,252 | ||||||||||
Stockholder’s equity/Members’ equity/Partners’ capital | 158,418 | 70,459 | 38,801 | 11,266 | 1,567 | ||||||||||
24
Table of Contents
Index to Financial Statements
| Item 7. | Management’s Discussion and Analysis of Financial Condition and Results of Operations |
The following discussion and analysis of our financial condition and results of operations should be read in conjunction with the accompanying consolidated/combined financial statements and related notes included elsewhere in this Annual Report on Form 10-K. Any forward-looking statements made by or on our behalf are made pursuant to the safe harbor provisions of the Private Securities Litigation Reform Act of 1995. Readers are cautioned that such forward-looking statements involve risks and uncertainties in that the actual results may differ materially from those projected in the forward-looking statements. Important factors that could cause actual results to differ include risks set forth in “Part I-Item 1A. Risk Factors” included herein.
Overview
Forbes Energy Services Ltd. (“FES Ltd”) and its domestic subsidiaries, Forbes Energy Services LLC (“FES LLC”), Forbes Energy Capital Inc. (“FES CAP”), C.C. Forbes, LLC (“CCF”), TX Energy Services, LLC (“TES”), Superior Tubing Testers, LLC (“STT”) and Forbes Energy International, LLC (“FEI LLC”), are headquartered in Alice, Texas and conduct business primarily in the state of Texas. On October 15, 2008, FES LLC and FEI LLC formed Forbes Energy Services México, S. de R.L. de C.V. (“FES Mexico”), a Mexican limited liability partnership (sociedad de responsabilidad limitada de capital variable), to conduct operations in Mexico.
As used in this Annual Report on Form 10-K, the “Company,” the “Forbes Group,” “we,” and “our” mean FES Ltd and its subsidiaries on and after May 29, 2008; and FES LLC and its subsidiaries from January 1, 2008 to May 28, 2008 (in each case referred to in the financial statements column headings as “Successor”); CCF, TES and STT from June 29, 2007 to December 31, 2007, and C.C. Forbes, L.P., Texas Energy Services, L.P. and Superior Tubing Testers, L.P. prior to June 29, 2007 (in each case prior to January 1, 2008, referred to in the financial statement column headings as “Predecessor”).
We are an independent oilfield services contractor that provides a wide range of well site services to oil and natural gas drilling and producing companies to help develop and enhance the production of oil and natural gas. These services include fluid hauling, fluid disposal, well maintenance, completion services, workovers and recompletions, plugging and abandonment, and tubing testing. Our operations are concentrated in the major onshore oil and natural gas producing regions of Texas, with one location in Baxterville, Mississippi and one location in Poza Rica, Mexico.
We currently conduct our operations through the following two business segments:
| • | Well Servicing. Our well servicing segment comprised 52.6% of consolidated revenues for the year ended December 31, 2008. At December 31, 2008, our well servicing segment utilized our modern fleet of 170 owned or leased well servicing rigs, which included 162 workover rigs and 8 swabbing rigs, and related assets and equipment with an average life of 2 years. These assets are used to provide (i) well maintenance, including remedial repairs and removal and replacement of downhole production equipment, (ii) well workovers, including significant downhole repairs, re-completions and re-perforations, (iii) completion and swabbing activities, and (iv) plugging and abandoning services. In addition, we have a fleet of 6 tubing testing units that are used to conduct pressure testing of oil and natural gas production tubing. |
| • | Fluid Logistics. Our fluid logistics segment comprised 47.4% of consolidated revenues for the year ended December 31, 2008. Our fluid logistics segment utilized our fleet of owned or leased fluid transport trucks and related assets, including specialized vacuum, high-pressure pump and tank trucks, frac tanks, water wells, proprietary salt water disposal wells and facilities, and related equipment. These assets are used to provide, transport, store, and dispose of a variety of drilling and produced fluids used in, and generated by, oil and natural gas production. These services are required in most workover and completion projects and are routinely used in daily operations of producing wells. |
We believe that our two business segments are complementary and create synergies in terms of selling opportunities. Our multiple lines of service allow us to capitalize on our existing customer base to grow within existing markets, generate more business from existing customers, and increase our operating profits. By offering our customers the ability to reduce the number of vendors they use, we believe we help improve our customers’ efficiency. This is demonstrated by the fact that 81.9% of our revenues for the year ended December 31, 2008 were from customers that utilized services of both of our business segments. Further, by having multiple service offerings that span the life cycle of the well, we believe we have a competitive advantage over smaller competitors offering more limited services.
25
Table of Contents
Index to Financial Statements
Factors Affecting Results of Operations
Oil and Natural Gas Prices
Demand for well servicing and fluid logistics services is generally a function of the willingness of oil and natural gas companies to make operating and capital expenditures to explore for, develop and produce oil and natural gas, which in turn is affected by current and anticipated levels of oil and natural gas prices. Exploration and production spending is generally categorized as either operating expenditures or capital expenditures. Activities by oil and natural gas companies designed to add oil and natural gas reserves are classified as capital expenditures, and those associated with maintaining or accelerating production, such as workover and fluid logistics services, are categorized as operating expenditures. Operating expenditures are typically more stable than capital expenditures and are less sensitive to oil and natural gas price volatility. In contrast, capital expenditures by oil and natural gas companies for drilling are more directly influenced by current and expected oil and natural gas prices and generally reflect the volatility of commodity prices.
Workover Rig Rates
Our well servicing segment revenues are dependent on the prevailing market rates for workover rigs. Market dayrates for workover rigs increased from 2003 through the first half of 2008, as high oil and natural gas prices and declining domestic production resulted in a substantial growth of drilling activity and demand for workover services that are used primarily to maintain or enhance production levels of existing producing wells. In the second half of 2008 and to date in 2009, we have experienced declines in demand and significant pricing pressure that are a result of the general economic decline and, more specifically, the precipitous decline in oil prices.
Fluid Logistics Rates
Our fluid logistics segment revenues are dependent on the prevailing market rates for fluid transport trucks and the related assets, including specialized vacuum, high-pressure pump and tank trucks, frac tanks and proprietary salt water disposal wells. Prior to the general economic decline, higher oil and natural gas prices resulted in growing demand for drilling and, since the decline, lower oil and natural gas prices have resulted in reduced demand for drilling and our services. Required disposal of fluids produced from wells and the increased number of wells in service through the first half of 2008 led to a higher demand for fluid logistics services. In the second half of 2008 and to date in 2009, fluid logistics rates have been under significant downward pressure.
Operating Expenses
Prior to the general economic decline, a strong oil and natural gas environment resulted in a higher demand for operating personnel and oilfield supplies and caused increases in the cost of those goods and services. In the second half of 2008 and to date in 2009, a weaker oil and natural gas environment has resulted in lower demand for operating personnel and oilfield supplies which has allowed us to decrease our costs, thereby offsetting a portion of the price decreases granted to our customers. Additionally, fuel costs, which comprise a substantial portion of our operating expenses, increased substantially over the last few years and in particular in the first half of 2008 before declining significantly in recent months. Future earnings and cash flows will be dependent on our ability to manage our overall cost structure and obtain price increases from our customers.
General and Administrative Expenses
Due to our substantial growth, we increased our professional staff in 2007 and 2008, which has resulted in increased general and administrative costs. Additionally, our expenses for information technology, accounting, rent, entertainment and third-party professional fees have also increased.
Capital Expenditures and Debt Service Obligations
As a general matter, our capital expenditures to maintain our assets have been relatively limited. We have incurred indebtedness to invest in new assets to grow our business. As a result, the indebtedness we incurred for our capital expenditures has significantly increased our debt service obligations. The majority of the net proceeds of the issuance (the “Debt Offering”) of our $205 million 11% senior secured notes (the “Senior Secured Notes”) was used to repay indebtedness incurred on capital expenditures. Most of our new assets have been acquired, and will continue to be acquired, through bank borrowings, short-term equipment vendor financings, cash flows from operations and other permitted financings. In the future, we expect our capital expenditures and our debt outstanding to increase as we continue to grow our business within the constraints of the covenants under our indenture and revolving credit facility. As of March 20, 2009, we had only $1.6 million in additional capacity available under our revolving credit agreement.
26
Table of Contents
Index to Financial Statements
Capital Expenditures and Operating Income Margins
The well servicing segment typically has higher operating income margins along with higher capital expenditures when compared with the fluid logistics segment, which has lower operating margins but also lower capital expenditure requirements.
Presentation
The following discussion and analysis is presented on a consolidated/combined basis to reflect the results of operations and financial condition of the Forbes Group. This financial information is presented on a combined basis as of and for periods ended on or prior to December 31, 2007, because the operating subsidiaries were under common management prior to the Delaware Reorganization (as defined below). The financial information as of and for the year ended December 31, 2008 is presented on a consolidated basis for FES LLC and its subsidiaries from and after January 1, 2008 to May 28, 2008, because of the completion of the reorganization in which FES LLC, a Delaware limited liability company, became the parent of the operating subsidiaries (the “Delaware Reorganization”) and on a consolidated basis for FES Ltd and its subsidiaries from and after May 29, 2008, because of the completion of the reorganization in which FES Ltd, a Bermuda corporation, became the direct parent of FES LLC and, as a result, the indirect parent of the operating subsidiaries (the “Bermuda Reorganization”).
We believe that we will experience increased general and administrative expenses over those historically recognized due to the adoption of a holding company structure, the increased costs of complying with Canadian reporting requirements and the requirements of the Securities Exchange Act of 1934 and the Sarbanes-Oxley Act and remediating certain material weaknesses described under “Part II. Item 9A. Controls and Procedures—Material Weaknesses” and “Part I. Item 1A. Risk Factors – We face several risks relating to material weaknesses in our internal controls.”
Finally, we note that the limited liability companies and their predecessor entities that comprised the Forbes Group prior to January 1, 2008, were not, and until May 29, 2008, FES LLC and its subsidiaries were not, subject to federal income tax. All of the income, losses, credit, and deductions of these entities were passed through to the equity owners for purposes of their individual income tax returns, which is why these are referred to as “flow through entities” for federal income tax purposes. Accordingly, no provision for income taxes is included in the following discussion and analysis of our historical operations through May 28, 2008. As of May 29, 2008, in conjunction with the Canadian initial public offering and simultaneous U.S. private placement of FES Ltd’s common shares and the related Bermuda Reorganization, the Forbes Group became subject to U.S. federal income tax.
27
Table of Contents
Index to Financial Statements
Results of Operations
Comparison of Year Ended December 31, 2008 and December 31, 2007
Revenues. For the year ended December 31, 2008, revenues increased by $153.9 million, or 74.4%, to $360.9 million when compared to the prior year. During 2008, we expanded into new locations and deployed new assets to meet the growing demand for our services.
Well Servicing—Revenues from the well servicing segment increased by $86.4 million for the year ended December 31, 2008, or 83.4%, to $190.0 million compared to the prior year. The increase was largely due to our successful deployment of new well servicing rigs. We utilized 170 well servicing rigs at December 31, 2008, compared to 101 well servicing rigs at December 31, 2007, a 68.3% increase. Well servicing rig hours were 378,657 and 180,700 for the years ended December 31, 2008 and 2007, respectively. This represents a 109.6% increase rig hours. In addition to expanding the size of its fleet, in 2008 we expanded our well servicing operations to five new locations throughout Texas, one in Baxterville, Mississippi, and one in Mexico.
Fluid Logistics—Revenues from the fluid logistics segment for the year ended December 31, 2008 increased by $67.5 million, or 65.3%, to $170.9 million compared to the prior year. While the pricing environment in the fluid logistics segment remained relatively stable, our business segment revenues increased substantially due to our successful deployment of new assets. Trucking hours for the year ended December 31, 2008 and 2007 were 1,115,593 and 711,171, respectively, an increase of 56.9%. Our principal fluid logistics assets at December 31, 2008 and 2007 were as follows:
| As of December 31, | |||||||
Asset | 2008 | 2007 | % Increase | ||||
Vacuum trucks | 294 | 205 | 43.4 | % | |||
High-pressure pump trucks | 19 | 14 | 35.7 | % | |||
Other heavy trucks | 57 | 43 | 32.6 | % | |||
Frac tanks (includes leased) | 1,370 | 951 | 44.1 | % | |||
Salt water disposal wells | 14 | 14 | — | ||||
Operating Expenses. Our consolidated operating expenses increased to $246.6 million for the year ended December 31, 2008, compared to $130.5 million for the year ended December 31, 2007, an increase of $116.1 million or 89.0%. Operating expenses as a percentage of revenues were 68.3% for the year ended December 31, 2008, compared to 63.0% for the year ended December 31, 2007.
Well Servicing—Operating expenses from the well servicing segment increased by $68.0 million, or 112.3%, to $128.6 million in 2008 as demand for the segment’s services continued to grow. This demand is reflected in our well servicing rig additions of 69 for 2008. Well servicing operating expenses as a percentage of well servicing revenues were 67.7% for the year ended December 31, 2008, compared to 58.5% for the year ended December 31, 2007. The increase in well servicing operating expense of $68.0 million was due in large part to an increase in labor costs of $34.5 million, or 99.5%, as the result of the addition of employees. Labor cost as a percentage of well servicing revenues was 36.3% for the year ended December 31, 2008, compared to 33.5% for the year ended December 31, 2007. The employee count at December 31, 2008, was 977 as compared with 625 employees at December 31, 2007. Fuel costs increased $3.8 million, or 92.9%, for the year ended December 31, 2008, when compared to the same period in the prior year due to the increased level of business and fuel price increases. We were able to pass a portion of this operating cost rate increase through to our customers. Fuel cost as a percentage of revenues was 4.2% and 4.0% for the years ended December 31, 2008 and 2007, respectively. Insurance was another significant expense that increased by $4.5 million, or 66.8%, from the year ended December 31, 2007 to the year ended December 31, 2008, due to additional employees and rising health care costs. Supplies & parts, repairs & maintenance, out of town expense, rent, bad debt expense, contract labor, uniforms, auto & truck expense, safety, property taxes, utilities and product & chemicals also increased $5.3 million, $4.2 million, $3.5 million, $2.5 million, $2.2 million, $2.0 million, $1.3 million, $1.0 million, $1.0 million, $1.0 million, $0.8 million, and $0.4 million respectively. All these expenses were consistent with the growth of our business.
Fluid Logistics—Operating expenses from the fluid logistics segment increased by $48.1 million, or 69.4%, to $117.9 million in 2008, primarily as a result of additions of new equipment and higher activity. Fluid logistics operating expenses as a percentage of fluid logistics revenues were 69.0% for the year ended December 31, 2008, compared to 67.6% for the year ended December 31,
28
Table of Contents
Index to Financial Statements
2007. The increase in fluid logistics operating expenses of $48.1 million was due in large part to an increase in labor costs of $12.3 million, or a 41.9% increase, as the result of the addition of employees and higher pay due to industry competition for labor. Labor cost as a percentage of revenues was 24.3% and 28.3% for the years ended December 31, 2008 and 2007, respectively. The employee count at December 31, 2008, was 868 as compared with 583 employees at December 31, 2007. Fuel costs increased $14.5 million, or 126.1%, for the year ended December 31, 2008, when compared to the same period in the prior year due to the increased level of business and fuel price increases. Fuel costs as a percentage of revenues was 15.2% and 11.1% for the twelve months ended December 31, 2008 and 2007, respectively. Product & Chemical expense, the third largest expense in fluids services, increased by $8.8 million or 656% from the year ended December 31, 2007, to the year ended December 31, 2008, primarily due to the rising chemical prices and increased level of business. Product and Chemicals prices increased 112.8% from January 2008 to December 2008. Repairs and maintenance and supplies and parts were other significant expenses that increased by $2.8 million or 60.4% and $1.5 million or 185%, respectively, due to direct result of added assets and higher activity levels. Contract services and salt and water disposal expenses also increased by $2.2 million and $2.7 million, respectively, from the year ended December 31, 2007, to the year ended December 31, 2008, due to the higher activity levels and growth of the business.
General and Administrative Expenses. General and administrative expenses from the combined operations for the year ended December 31, 2008 increased by approximately $8.2 million, or 86.2%, to $17.7 million when compared to the year ended December 31, 2007. Wages and professional fees increased approximately $6.1 million and $2.1 million, respectively, for the year ended December 31, 2008 compared to the year ended December 31, 2007. The increase in administrative cost is also related to the substantial growth which resulted in the need to increase professional staff. We expect these expenditures to continue to increase compared to prior periods due to our need to continue to invest in this area, including compliance with Commission reporting requirements, requirements related to the Sarbanes-Oxley Act and compliance with Canadian reporting requirements.
Depreciation and Amortization. Depreciation and amortization expenses increased by $19.1 million, or 128%, to $34.0 million in 2008 because of the new equipment acquired in 2007 and 2008 and increased basis in fixed assets in connection with the Delaware Reorganization effective January 1, 2008. Capital expenditures for the year ended December 31, 2008, were $142.0 million compared to $127.4 million for the year ended December 31, 2007.
Impairment of Goodwill.Goodwill and other intangible assets not subject to amortization are tested for impairment annually or more frequently if events or changes in circumstances indicate that the asset might be impaired. For the fourth quarter of 2008, we performed our annual impairment test for goodwill which resulted in an impairment of goodwill of $4.4 million. See “Goodwill” in the Critical Accounting Policies and Estimates section of Item 7 in this Form 10-K for more information. Prior to January 1, 2008, no goodwill was recorded in the financial statements.
Interest and Other Expenses. Interest and other expenses were $25.8 million in the year ended December 31, 2008, compared to $8.1 million in the year ended December 31, 2007. The increase is due to increases in our outstanding debt balances from $100.4 at December 31, 2007 to $212.2 at December 31, 2008. Substantially all of the interest expense incurred in both periods was due to the incurrence of debt to finance the purchase of additional equipment.
Income Tax Expense.On May 29, 2008, in connection with the Bermuda Reorganization, the Forbes Group became subject to federal income tax, which resulted in recognition of deferred income tax expense of approximately $54.1 million. Prior to that time, the entities comprising the Forbes Group were flow through entities for federal income tax purposes and the only income tax obligation of the Forbes Group was the Texas margin tax.
Comparison of Year Ended December 31, 2007 and December 31, 2006
Revenues. For the year ended December 31, 2007, revenues increased by $74.3 million, or 56.0%, to $207.0 million when compared to the prior year. During 2007, we expanded into new locations and deployed new assets to meet the growing demand for our services.
Well Servicing—Revenues from the well servicing segment increased by $45.0 million for the year ended December 31, 2007, or 76.9%, to $103.6 million compared to the prior year. The increase was largely due to our successful deployment of new well servicing rigs. We owned 101 well servicing rigs at December 31, 2007, compared to 43 well servicing rigs at December 31, 2006, a 134.9% increase. In addition to expanding the size of its fleet, in 2007 we expanded our well servicing operations to Carthage, Monahans, Odessa, Big Springs, Kilgore, and Edinburg, Texas.
29
Table of Contents
Index to Financial Statements
Fluid Logistics—Revenues from the fluid logistics segment for the year ended December 31, 2007, increased by $29.3 million, or 39.5%, to $103.4 million compared to the prior year. While the pricing environment in the fluid logistics segment remained relatively stable, our business segment revenues increased substantially due to our successful deployment of new assets and our expansion of operations into Carthage, Monahans, Odessa, Big Springs, Kilgore, and Edinburg, Texas. Our principal fluid logistics assets at December 31, 2007, and December 31, 2006, were as follows:
| As of December 31, | |||||||
Asset | 2007 | 2006 | % Increase | ||||
Vacuum trucks | 205 | 147 | 39.5 | % | |||
High-pressure pump trucks | 14 | 7 | 100.0 | % | |||
Other heavy trucks | 43 | 25 | 72.0 | % | |||
Frac tanks (includes leased) | 951 | 568 | 67.4 | % | |||
Salt water disposal wells | 14 | 9 | 55.6 | % | |||
Operating Expenses. Our operating expenses increased to $130.5 million for the year ended December 31, 2007, compared to $82.1 million for the year ended December 31, 2006, an increase of $48.4 million or 59.0%. Operating expenses as a percentage of revenues were 63.0% for the year ended December 31, 2007, compared to 61.8% for the year ended December 31, 2006.
Well Servicing—Operating expenses from the well servicing segment increased by $28.1 million, or 86.6%, to $60.6 million in 2007 as demand for the segment’s services continued to grow. This demand is reflected in our well servicing rig additions of 58 for 2007. Well servicing operating expenses as a percentage of well servicing revenues were 58.5% for the year ended December 31, 2007, compared to 55.4% for the year ended December 31, 2006. The increase in well servicing operating expense of $28.1 million was due in large part to an increase in labor costs of $18.3 million, or 112.4%, as the result of the addition of employees. Labor cost as a percentage of well servicing revenues was 33.4% for the year ended December 31, 2007, compared to 27.8% for the year ended December 31, 2006. The employee count at December 31, 2007, was 625 as compared with 316 employees at December 31, 2006. Fuel costs increased $2.0 million, or 94.9%, for the year ended December 31, 2007, when compared to the same period in the prior year due to the increased level of business and fuel price increases. Diesel fuel prices increased 56.5% from January 2007 to December 2007. We were able to pass a portion of this operating cost rate increase through to our customers. Fuel cost as a percentage of revenues was 3.9% and 3.6% for the years ended December 31, 2007 and 2006, respectively. Health insurance was another significant expense that increased by $2.3 million, or 147.2%, from the twelve months ended December 31, 2006, to the twelve months ended December 31, 2007, due to additional employees and rising health care costs. Other expenses were consistent with the growth of our business.
Fluid Logistics—Operating expenses from the fluid logistics segment increased by $20.3 million, or 40.8%, to $69.9 million in 2007, primarily as a result of the operation of the new equipment. Fluid logistics operating expenses as a percentage of fluid logistics revenues were 67.6% for the year ended December 31, 2007, compared to 66.9% for the year ended December 31, 2006. The increase in fluid logistics operating expenses of $20.3 million was due in large part to an increase in labor costs of $9.3 million, or a 46.6% increase, as the result of the addition of employees and higher pay due to industry competition for labor. Labor cost as a percentage of revenues was 28.3% and 26.9% for the years ended December 31, 2007 and 2006, respectively. The employee count at December 31, 2007, was 583 as compared with 431 employees at December 31, 2006. Fuel costs increased $4.2 million, or 57.1%, for the year ended December 31, 2007, when compared to the same period in the prior year due to the increased level of business and fuel price increases. Diesel fuel prices increased 56.5% from January 2007 to December 2007. We were able to pass a portion of this operating cost rate increase through to our customers. Fuel cost as a percentage of revenues was 11.1% and 9.9% for the years ended December 31, 2007 and 2006, respectively. Field expense increased $494,000, or 184.0%, from the year ended December 31, 2006, to the year ended December 31, 2007, due to increased business. Health insurance was another significant expense that increased by $631,000, or 65.8%, from the year ended December 31, 2006, to the year ended December 31, 2007, due to additional employees and rising health care costs. Other insurance expense increased $810,000, or 30.6%, as a result of the increase in the number of employees, the increase in the number of vehicles and equipment covered, and the increase in liability insurance costs. Other expenses were consistent with the growth of our business.
General and Administrative Expenses. General and administrative expenses from the combined operations increased by approximately $2.8 million, or 46.4%, to $8.8 million in 2007. Audit, legal, and third party accounting fees increased by approximately $1.5 million to $2.0 million from December 31, 2006 to December 31, 2007, due to additional temporary staffing
30
Table of Contents
Index to Financial Statements
related to preparing for audits and reviews, the Initial Equity Offering and the Debt Offering, and audit and review fees. We expect these expenses to continue to increase as we will be required to comply with future Canadian reporting requirements, Commission reporting requirements, and requirements related to the Sarbanes-Oxley Act.
Depreciation and Amortization. Depreciation and amortization expenses increased by $7.9 million, or 107.1%, to $15.3 million in 2007 because of the new equipment acquired in 2006 and 2007. Capital expenditures for the year ended December 31, 2007, were $127.2 million compared to $53.8 million for the year ended December 31, 2006.
Interest and Other Expenses. Interest and other expenses were $8.1 million in the year ended December 31, 2007, compared to $4.9 million in the year ended December 31, 2006. Substantially all of the interest expense incurred in both periods was due to the incurrence of debt to finance the purchase of additional equipment.
Liquidity and Capital Resources
Overview
Our Credit Facility (as defined below) and the indenture governing our Senior Secured Notes (as defined below) and the debt outstanding thereunder impose significant restrictions on us and increase our vulnerability to adverse economic and industry conditions that could limit our ability to obtain additional or replacement financing. While the principal indebtedness of the Credit Facility is not scheduled for repayment until April 2012 and the Senior Secured Notes not until February 2015, our inability to satisfy any obligations under these agreements would constitute an event of default. Under the Credit Facility, an event of default will be deemed to have occurred if there is a change in control over us or if a material adverse change occurs with regards to our consolidated financial position, our consolidated business, assets, operations, properties or prospects, our ability to timely pay the obligations under the Credit Facility or the enforceability of the material terms of any material loan document against us. The lender under the Credit Facility could, at some future date, make a determination that such a material adverse change has occurred, which is outside our control. The indenture governing the Senior Secured Notes does not have similar material adverse change or change in control events of default but does require an offer to redeem the Senior Secured Notes in the event of a change in control. It does contain a cross-default provision that would be triggered if the debt under the Credit Facility were accelerated. See a discussion of cross-default provisions in notes 9 and 10 to our consolidated/combined financial statements included herein. A default could result in all or a portion of our outstanding debt becoming immediately due and payable. If this would occur, we might not be able to obtain waivers or secure alternative financing to satisfy all of our obligations simultaneously. Given current market conditions, our ability to access the capital markets or to effect any asset sales might be restricted at a time when we would like or need to raise capital. In addition, the current economic conditions could also impact our customers and vendors and may cause then to fail to meet their obligations to us with little or no warning. These events could have a material adverse effect on our business, financial position, results of operations and cash flows and the ability to satisfy the obligations under our debt agreements. (Also see Notes 9 and 10 to our consolidated/combined financial statements included herein.)
The continued compliance with our debt covenants is dependent upon us obtaining a minimum level of earnings before interest, income taxes, depreciation, amortization and certain other add backs in accordance with our Indenture and Credit Facility, and maintaining a minimum level of net worth. Our forecasted EBITDA and net worth contain certain estimates and assumptions regarding rig and truck utilization, average hourly rates, and operating and general and administrative expenses, which could prove to be inaccurate. A material deviation from one or more of these estimates or assumptions could result in a violation of one or more of our contractual covenants, which could result in all or a portion of our outstanding debt becoming immediately due and payable.
Within certain constraints, we can conserve capital by reducing or delaying capital expenditures, deferring non-regulatory maintenance expenditures and further reducing operating and administrative costs. While postponing or eliminating capital expenditures would delay or reduce future cash flows, we believe these actions can provide us the flexibility to match our capital commitments to our available capital resources. Although we currently believe our liquidity and projected cash flows from operations will be sufficient to meet our cash requirements for the next year and the foreseeable future, the factors described above create uncertainty.
We have historically funded our operations, including capital expenditures, with bank borrowings, vendor financings, cash flow from operations, the issuance of our Senior Secured Notes and the proceeds from our Initial Equity Offering and our October 2008 U.S. private placement.
31
Table of Contents
Index to Financial Statements
As of December 31, 2008, we had $212.2 million in debt outstanding (including the Senior Secured Notes based on $205.0 million aggregate principal amount at an issue price of 97.635% of par). We believe that our cash and cash equivalents, cash flows from operations, available credit under the Credit Facility, and short-term credit from equipment vendors will be sufficient to finance our current and future operations, including our budgeted capital expenditures, for the next twelve months and for the foreseeable future.
As of December 31, 2008, we had $23.5 million in cash and cash equivalents, $205.4 million in long-term debt outstanding, $6.8 million in short-term debt outstanding, and $21.2 million of short-term (less than six months) equipment vendor financings for well servicing rigs and other equipment. In the year ended December 31, 2008, we incurred $142.0 million in capital expenditures, which included well servicing rigs, vacuum trucks, frac tanks, heavy trucks, pickup trucks, salt water disposal wells, and other related equipment. We financed these purchases with cash flow from operations, a portion of the proceeds of the Debt Offering, a portion of the proceeds from the Initial Equity Offering, proceeds from our October 2008 U.S. private placement and certain short-term vendor financings. In the fourth quarter of 2008 we entered into four operating leases for equipment that range in term from three to five years for total monthly payments of $303,000. In the first quarter or 2009 we entered into an additional operating lease for equipment with a five year term and a monthly payment of three thousand dollars.
At December 31, 2007, we had $5.2 million in cash and cash equivalents, $111.3 million in debt outstanding, and $57.2 million of vendor financings related to equipment purchases. In February 2008, we repaid substantially all of such debt and such vendor financings from the proceeds of the Debt Offering.
Cash Flows
Cash Flows from Operating Activities
Net cash provided by operating activities amounted to $65.2 million for the year ended December 31, 2008, compared to net cash provided by operating activities of $46.6 million for the year ended December 31, 2007, an increase of $18.6 million. This increase was primarily due to increased cash flow resulting from pre-tax earnings before deducting certain non-cash items such as depreciation, amortization, and our goodwill impairment. The largest item decreasing cash flows from operating activities was an increase in our accounts receivable of $28.9 million in 2008 as compared to an increase of $19.2 million in 2007. These increases were in line with our growth in revenues.
Net cash provided by operating activities increased to $46.6 million for the year ended December 31, 2007, as compared to $23.7 million for the year ended December 31, 2006. This increase was primarily a result of an increase in revenues from our well servicing and fluid logistics segments due to the increased service capacity resulting from our purchase of new property and equipment.
Cash Flows Used in Investing Activities
Net cash used in investing activities increased to $176.9 million for the year ended December 31, 2008, compared to $68.2 million for the year ended December 31, 2007. This increase was primarily the result of payments of vendor equipment financings from proceeds of the Debt Offering and payment for additional equipment purchases and certain vendor financings from our Initial Equity Offering and our October 2008 U.S. private placement.
Net cash used in investing activities increased to $68.2 million for the year ended December 31, 2007, as compared to $41.0 million for the year ended December 31, 2006. This increase was primarily a result of our purchase of new property and equipment, which amounted to $68.2 million for the year ended December 31, 2007, as compared to expenditures of $40.9 million for the year ended December 31, 2006.
Cash Flows from Financing Activities
Net cash provided by financing activities increased to $129.9 million for the year ended December 31, 2008, compared to $19.2 million for the year ended December 31, 2007, primarily due to the Debt Offering, the Initial Equity Offering, and the $30 million U.S. private placement of our common shares completed in October 2008. Additional borrowings amounted to $226.8 million and $58.8 million for the years ended December 31, 2008 and 2007, respectively. The 2008 borrowings were primarily related to our Debt Offering in February 2008. These borrowings were offset by debt repayments of $128.3 million and $27.4 million for the years ended December 31, 2008 and 2007, respectively.
32
Table of Contents
Index to Financial Statements
Net cash provided by financing activities decreased to $19.2 million for the year ended December 31, 2007, as compared to $21.7 million for the year ended December 31, 2006, primarily due to additional borrowings used to fund the purchase of additional equipment offset by debt repayments. Additional borrowings amounted to $60.6 million and $39.8 million for the years ended December 31, 2007 and 2006, respectively. These borrowings were offset by debt repayments of $27.8 million and $12.7 million for the years ended December 31, 2007 and 2006, respectively.
Senior Secured Notes
On February 12, 2008, we issued an aggregate of $205.0 million of 11.0% senior secured notes in the Debt Offering. The notes are our senior secured obligations. The notes are guaranteed on a senior secured basis by each of our existing and future domestic restricted subsidiaries. The notes and the guarantees are secured by second priority liens on substantially all of our assets, subject to certain exceptions and permitted liens. The notes are subject to redemption and requirements that we offer to purchase the notes upon a change of control, following certain asset sales, and if we have excess cash flow for any fiscal year beginning with fiscal 2008. The indenture governing the notes limits our and our restricted subsidiaries’ ability to, among other things, transfer or sell assets; pay dividends, redeem subordinated indebtedness, make investments or make other restricted payments; incur or guarantee additional indebtedness or issue disqualified capital stock; make capital expenditures that exceed certain amounts; create, incur or suffer to exist liens; incur dividend or other payment restrictions affecting certain subsidiaries; consummate a merger, consolidation or sale of all or substantially all of our assets; enter into transactions with affiliates; designate subsidiaries as unrestricted subsidiaries; engage in a business other than a business that is the same or similar to our current business and reasonably related businesses; and take or omit to take any actions that would adversely affect or impair in any material respect the liens in respect of the collateral securing the notes.
Revolving Credit Facility
On April 10, 2008, the Forbes Group entered into a Credit Facility. The Forbes Group can use borrowings under the Credit Facility for general corporate purposes. Any unpaid principal amount is due on the maturity date.
Borrowings under the Credit Facility accrue interest, at our option, at either (i) the greater of the Federal Funds Effective Rate in effect on such day plus 0.5% and the “prime rate” announced from time to time by Citibank, N.A., plus a margin of up to 1.25%, or (ii) the London Interbank Offered Rate, plus a margin of 1.75% to 2.25%. The applicable interest rate margin is based on our leverage ratio, as defined in the credit agreement governing the Credit Facility. Unpaid interest accrued on outstanding loans is payable quarterly.
The Credit Facility is secured by first priority security interests in substantially all of the Forbes Group’s assets, including those of all of the subsidiaries that rank senior to the security interest granted to the holders of the Senior Secured Notes. The credit agreement also contains customary representations, warranties and covenants for the type and nature of the Credit Facility, including certain limitations or restrictions on the Forbes Group’s and certain future subsidiaries’ ability to incur additional debt, guarantee others’ obligations, create, incur or permit to exist liens on assets, make investments or acquisitions, make certain dispositions of assets, make payments on certain subordinated indebtedness, pay dividends or other payments to equity holders, engage in mergers, consolidations or other fundamental changes, sell assets, change the nature of its business and engage in transactions with affiliates. The rights of the lender under the Credit Facility vis-à-vis the trustee and collateral agent under the indenture governing the Senior Secured Notes are governed by an intercreditor agreement among the Forbes Group, Citibank, N.A., the lender under the Credit Facility, and Wells Fargo Bank, National Association, the trustee and collateral agent under the indenture governing the Senior Secured Notes.
The Credit Agreement contains the following restrictive financial covenants, which provide that the Forbes Group shall not:
| • | Permit for the trailing twelve months as of the end of any fiscal quarter the ratio of Consolidated EBITDA to Consolidated Interest Expense, as both are defined in the Credit Agreement, to be less than 1.5 to 1.0. As of December 31, 2008 this ratio was 3.6 to 1.0. |
| • | Permit Consolidated Net Worth to be less than $63.4 million for the fiscal year ended December 31, 2008, and for each fiscal year thereafter Consolidated Net Worth to be less than $63.4 million plus 50% of Consolidated Net Income for such year, as both are defined in the Credit Agreement. As of December 31, 2008 the excess over the covenant was approximately $95 million. |
33
Table of Contents
Index to Financial Statements
| • | Permit the ratio of Senior Funded Debt to Consolidated Net Worth, as both are defined in the Credit Agreement, to be not greater than 2.50 to 1.00 for each fiscal quarter through September 30, 2008, and for fiscal quarters ending December 31, 2008 and thereafter, 2.00 to 1.0. As of December 31, 2008 this ratio was 1.3 to 1.0. |
| • | Permit the ratio of Consolidated Senior Funded Debt to Consolidated EBITDA for the trailing twelve months, as both are defined in the Credit Agreement, to be more than 5.5 to 1.0 as of the last day of any fiscal quarter. As of December 31, 2008 this ratio was 2.2 to 1.0. |
The Credit Agreement contains a provision that makes the occurrence of any Material Adverse Change an event of default. A “Material Adverse Change” is defined in the Credit Agreement to mean a material and adverse change from the state of affairs presented in the audited December 31, 2007 financial statements for the Forbes Group or as represented or warranted in any loan document to (a) the consolidated financial position of the Forbes Group, (b) the consolidated business, assets, operations, properties or prospects of the Forbes Group, (c) the Forbes Group’s ability to pay the obligations under the Credit Agreement or (d) the enforceability of the material terms of any material loan document against the Forbes Group. The occurrence of an event of default would allow the lender to accelerate the debt under the Credit Agreement. The Credit Agreement contains a cross-default provision that is triggered on the failure to comply with any other materially significant contract (including the indenture) if such failure is not remedied within any applicable grace period. The indenture contains a cross-default provision that is triggered on the default of any instrument evidencing or securing indebtedness (including the Credit Agreement), if that default is caused by failure to pay principal or interest prior to the expiration of any applicable grace period or if that default results in the acceleration of such indebtedness prior to its maturity, and such indebtedness, together with all other indebtedness where there has been such a default, aggregates $5.0 million or more.
As of December 31, 2008, we had no advances under the Credit Facility.
For additional information with respect to the Credit Facility and the Senior Secured Notes please refer to notes 9 and 10 of our consolidated/combined financial statements included herein.
Initial Public Offering and Simultaneous U.S. Private Placement
On May 29, 2008, FES Ltd completed the Initial Equity Offering. In the Initial Equity Offering, FES Ltd sold 24,644,500 common shares for CDN $7.00 per share and the common shares were listed on the Toronto Stock Exchange. Gross proceeds from the Initial Equity Offering were CDN $172,511,500, and net proceeds from the Initial Equity Offering after expenses were $162,465,730.
FES Ltd is a Bermuda company formed effective April 9, 2008 to act as the holding company for FES LLC and its subsidiaries. At the time of FES Ltd’s organization, 200 common shares were issued. On May 29, 2008, in conjunction with the Initial Equity Offering, the Forbes Group was reorganized, referred to herein as the Bermuda Reorganization, pursuant to which all of the members of FES LLC assigned approximately 63% of their membership interests in FES LLC to FES Ltd in exchange for 29,500,000 shares of FES Ltd’s Class B non-voting stock. Upon consummation of the Initial Equity Offering, FES Ltd contributed $120,000,000 cash as additional capital to FES LLC and FES LLC used the funds to redeem the remaining outstanding membership interests held by those members of FES LLC other than FES Ltd. The result was that FES LLC and its subsidiaries became wholly owned subsidiaries of FES Ltd.
October 2008 U.S. Private Placement of Common Shares
In October 2008, FES Ltd completed a U.S. private placement of 7,966,500 of its common shares at a price per share of CDN $4.00 for an aggregate purchase price in the amount of USD $30,000,000 based on the exchange rate between U.S. dollars and Canadian dollars then in effect of $1.00 to CDN$1.0622.
Contractual Obligations and Financing
The table below provides estimated timing of future payments for which we were obligated as of December 31, 2008.
Actual | Total | 1 Year or Less | 2-3 Years | 4-5 Years | More than 5 years | ||||||||||
| (in thousands) | |||||||||||||||
Maturities of long-term debt, including current portion | $ | 212,190 | $ | 6,815 | $ | 11,526 | $ | 3,087 | $ | 190,762 | |||||
Operating lease commitments | 20,644 | 5,156 | 9,503 | 5,985 | — | ||||||||||
Interest on long-term debt | 143,647 | 24,242 | 48,104 | 47,544 | 23,757 | ||||||||||
Total | 376,481 | 36,213 | 69,133 | 56,616 | 214,519 | ||||||||||
34
Table of Contents
Index to Financial Statements
Seasonality
Our operations are impacted by seasonal factors. Historically, our business has been negatively impacted during the winter months due to inclement weather, fewer daylight hours, and holidays. Our well servicing rigs are mobile, and we operate a significant number of oilfield vehicles. During periods of heavy snow, ice or rain, we may not be able to move our equipment between locations, thereby reducing our ability to generate rig or truck hours. In addition, the majority of our well servicing rigs work only during daylight hours. In the winter months when daylight time becomes shorter, this reduces the amount of time that the well servicing rigs can work and, therefore, has a negative impact on total hours worked. Finally, during the fourth quarter, we historically have experienced significant slowdowns during the Thanksgiving and Christmas holiday seasons.
Critical Accounting Policies and Estimates
The preparation of our consolidated/combined financial statements in accordance with GAAP requires management to make estimates and assumptions that affect the reported amounts of assets and liabilities and the disclosure of contingent assets and liabilities as of the dates of the financial statements and the reported amounts of revenue and expenses during the applicable reporting periods. On an ongoing basis, management reviews its estimates, particularly those related to depreciation and amortization methods, useful lives and impairment of long-lived assets, and asset retirement obligations, using currently available information. Changes in facts and circumstances may result in revised estimates, and actual results could differ from those estimates.
Estimated Depreciable Lives
A substantial portion of our total assets is comprised of equipment. Each asset included in equipment is recorded at cost and depreciated using the straight-line method, which deducts equal amounts of the cost of such assets from earnings every year over the asset’s estimated economic useful life. As a result of these estimates of economic useful lives, net equipment as of December 31, 2008 totaled $331.0 million which represented 67.2% of total assets. Depreciation expense for the year ended December 31, 2008 totaled $30.6 million which represented 12.5% of total operating expenses. Given the significance of equipment to our financial statements, the determination of an asset’s economic useful life is considered to be a critical accounting estimate. The estimated economic useful life is monitored by management to determine its continued appropriateness.
Impairments
Long-lived assets, which include property, equipment, and finite lived intangible assets subject to amortization, comprise a significant amount of our total assets. We review the carrying values of these assets for impairment periodically, and at least annually for goodwill, or whenever events or changes in circumstances indicate that the carrying amounts may not be recoverable. An impairment loss is recorded in the period in which it is determined that the carrying amount is not recoverable. This requires us to make judgments regarding long-term forecasts of future revenues and costs related to the assets subject to review. These forecasts include assumptions related to the rates we bill our customers, equipment utilization, equipment additions, debt borrowings and repayments, staffing levels, pay rates, and other expenses. In turn, these forecasts are uncertain in that they require assumptions about demand for our products and services, future market conditions and technological developments. Significant and unanticipated changes to these assumptions could require a provision for impairment in a future period. Given the nature of these evaluations and their application to specific assets and specific times, it is not possible to reasonably quantify the impact of changes in these assumptions. Based on our analysis as of December 31, 2008, we concluded that goodwill was impaired and recorded a $4.4 million impairment charge. We also assessed our long-lived assets for impairment and concluded that no such impairment was necessary.
Allowance for Doubtful Accounts
The determination of the collectability of amounts due from our customers requires us to use estimates and make judgments regarding future events and trends, including monitoring our customers’ payment history and current credit worthiness to determine that collectability is reasonably assured, as well as consideration of the overall business climate in which our customers operate. Inherently, these uncertainties require us to make frequent judgments and estimates regarding our customers’ ability to pay amounts due us in order to determine the appropriate amount of valuation allowances required for doubtful accounts. Provisions for doubtful accounts are recorded when it becomes evident that the customer will not make the required payments at either contractual due dates or in the future. At December 31, 2008 and 2007, allowance for doubtful accounts totaled $2.8 million, or 3.9%, and $50 thousand, or 0.2%, of accounts receivable, respectively. We believe that our allowance for doubtful accounts is adequate to cover potential bad debt losses under current conditions; however, uncertainties regarding changes in the financial condition of our customers, either adverse or positive, could impact the amount and timing of any additional provisions for doubtful accounts that may be required. A five percent
35
Table of Contents
Index to Financial Statements
change in the allowance for doubtful accounts would have had an impact on income from continuing operations before income taxes of approximately $0.1 million in 2008.
Revenue Recognition
Well Servicing — Well servicing consists primarily of maintenance services, workover services, completion services, plugging and abandonment services, and tubing testing. We price well servicing by the hour of service performed.
Fluid Logistics — Fluid logistics consists primarily of the sale, transportation, storage, and disposal of fluids used in drilling, production, and maintenance of oil and natural gas wells. We price fluid logistics by the job, by the hour, or by the quantities sold, disposed, or hauled.
We recognize revenue when services are performed, collection of the relevant receivables is probable, persuasive evidence of an arrangement exists, and the price is fixed or determinable.
Income Taxes
The Forbes Group was not subject to federal income tax until May 29, 2008. Prior to May 29, 2008 all income, losses, credits, and deductions of the Forbes Group were passed through to the equity owners’ individual tax returns. Accordingly, no provision for U.S. federal income taxes is included in the accompanying consolidated/combined financial statements through May 29, 2008. The Forbes Group is subject to the Texas margin tax. As of May 29, 2008, in conjunction with the Initial Equity Offering and the related Bermuda Reorganization, the Forbes Group became subject to U.S. federal income tax. For the year ended December 31, 2008 $61.6 million in federal income tax expense and $1.0 million in state tax expense was recorded. As of December 31, 2008 $62.1 million in deferred U.S. federal income tax is reflected in the FES Ltd’s balance sheet.
Current and deferred tax liabilities and assets are recorded in accordance with enacted tax laws and rates. Valuation allowances are established to reduce deferred tax assets when it is more likely than not that some portion or all of the deferred tax assets will not be realized. In determining the need for valuation allowances, we have considered and made judgments and estimates regarding estimated future taxable income and ongoing prudent and feasible tax planning strategies. These estimates and judgments include some degree of uncertainty and changes in these estimates and assumptions could require us to adjust the valuation allowances for our deferred tax assets.
Goodwill
Statement of Financial Accounting Standards No. 142,Goodwill and Other Intangible Assets(“SFAS No. 142”) eliminates the amortization of goodwill and other intangible assets with indefinite lives. Intangible assets with lives restricted by contractual, legal, or other means will continue to be amortized over their useful lives. Goodwill and other intangible assets not subject to amortization are tested for impairment annually or more frequently if events or changes in circumstances indicate that the asset might be impaired. SFAS No. 142 requires a two-step process for testing impairment. First, the fair value of each reporting unit is compared to its carrying value to determine whether an indication of impairment exists. If impairment is indicated, then the fair value of the reporting unit’s goodwill is determined by allocating the unit’s fair value to its assets and liabilities (including any unrecognized intangible assets) as if the reporting unit had been acquired in a business combination. The fair value for goodwill is measured as the difference between the fair value of the reporting unit’s assets (excluding goodwill) and its fair value.
In step one of the annual impairment test and due to the adverse equity market conditions affecting our common stock price and the declines in oil and natural gas prices in the fourth quarter of 2008 and continuing into 2009, we tested our fluid services business unit for goodwill impairment. The first step was to estimate the fair value of the fluid services segment using a weighting of the discounted cash flow method, the public company guideline method, and the guideline transaction method, weighted 45%, 45% and 10%, respectively. The discounted cash flow method and public company guideline method provided the strongest indication of value due to their ability to incorporate the current state of the oil field services industry as well as the recent changes in the credit and equity markets. The guideline transaction method involved considering private transactions that were relevant but were considered to a lesser degree. In order to validate the reasonableness of the estimated fair value obtained for this reporting unit, a reconciliation of fair value for all the major reporting units to our market capitalization was performed. For purposes of reconciliation to our market
36
Table of Contents
Index to Financial Statements
capitalization, a control premium was applied. The control premium used in the reconciliation was derived from a market transaction data study. In addition, for purposes of calculating fair value, the market value of our debt as of December 31, 2008 was used. The measurement date for the stock price for the reconciliation was the 30 day average closing price, centered on December 31, 2008. The results of the fair value analysis for step one showed the carrying value of the fluid services business above the fair value as of December 31, 2008.
Based on the results of step one, impairment of goodwill for the fluids unit was indicated. We performed step two by allocating the estimated fair value to the tangible and intangible assets, which indicated that the entire value of the goodwill in the fluids services unit of $4.4 million was impaired. This non-cash charge eliminates the goodwill recorded in connection with the January 1, 2008 Delaware Reorganization. The goodwill associated with the Delaware Reorganization had no tax basis, and accordingly, there was no tax benefit derived from recording the impairment charge. We have has no other goodwill recorded on our balance sheet.
Self-Insured Risk Accruals
We are self-insured up to retention limits with regard to workers’ compensation and medical coverage of our employees. We have deductibles for workers’ compensation of $250,000 bodily injury per accident and $250,000 per each claim for disease. The medical coverage has a $125,000 deductible per individual plus a $250,000 aggregate deductible. Deductibles for automobile liability and general liability are $100,000 per occurrence. Workers’ compensation, general liability and automobile liability have an aggregate stop loss in the amount of $6,425,250. We maintain accruals in our consolidated balance sheets related to self-insurance retentions by using third-party actuarial data and historical claims history.
Asset Retirement Obligation
We have has established an estimate for recognition and measurement of a liability for an asset retirement obligation and an associated asset retirement cost for our salt water disposal wells. A liability has been recorded for the fair value of the future removal of the assets as well as for the associated retirement costs. An outside company was engaged to estimate the cost of plugging the wells.
Environmental
We are subject to extensive federal, state, and local environmental laws and regulations. These laws, which are constantly changing, regulate the discharge or release of materials into the environment and may require us to remove or mitigate the adverse environmental effects of the disposal or release of petroleum, chemical or other hazardous substances at various sites. Environmental expenditures are expensed or capitalized depending on their future economic benefit. Expenditures that relate to an existing condition caused by past operations and that have no future economic benefits are expensed. Liabilities for expenditures of a non-capital nature are recorded when environmental assessment and/or remediation is probable and the costs can be reasonably estimated. We believe, on the basis of presently available information, that regulation of known environmental matters will not materially affect our liquidity, capital resources or consolidated/combined financial condition. However, there can be no assurances that future costs and liabilities will not be material.
Share Based Compensation
We use the Black-Scholes option pricing model which requires extensive use of financial estimates and accounting judgment, including the expected volatility of our common stock over the estimated term of the options granted, estimates on the expected time period that employees will retain their vested stock options prior to exercising them, and the number of shares that are expected to be forfeited before the options are vested. The use of alternative assumptions could produce significantly different estimates of the fair value of the stock-based compensation and as a result, provide significantly different amounts recognized in our statement of operations. Stock-based compensation was $1.4 million for 2008.
Contingent Liabilities
We establish a provision for a contingent liability when it is probable that a liability has been incurred and the amount is estimable. We base our estimates and judgments on historical experience and on various other assumptions and information that are believed to be reasonable under the circumstances. There are no pending legal proceedings, and we are not aware of any threatened legal proceedings, to which we are a party or to which our property is subject, other than immaterial proceedings in the ordinary course of business.
37
Table of Contents
Index to Financial Statements
Recent Accounting Pronouncements
In September 2006, the Financial Accounting Standards Board (“FASB”) issued SFAS No. 157, Fair Value Measurements. SFAS No. 157 defines fair value, establishes a framework for measuring fair value in GAAP, and enhances disclosures about fair value measurements. SFAS No. 157 applies when other accounting pronouncements require fair value measurements; it does not require new fair value measurement. SFAS No. 157 became effective for us on January 1, 2008, FASB Staff Position (“FSP”) 157-2 delays the effective date of SFAS 157 for nonfinancial assets and liabilities, except for items that are recognized or disclosed at fair value on a recurring basis (at least annually). Beginning January 1, 2008, we applied the provisions of SFAS 157 to our financial instruments and the impact was not material. We are currently assessing the impact this standard will have when applied to our nonfinancial assets and liabilities and its potential impact on the our consolidated financial statements (primarily asset retirement obligations and nonfinancial assets and liabilities measured at fair value in conjunction with impairment testing).
In February 2007, the FASB issued SFAS No. 159, The Fair Value Option for Financial Assets and Financial Liabilities—including an amendment of FASB Statement No. 115. This statement permits entities to choose to measure many financial instruments and certain other items at fair value that are not currently required to be measured at fair value and establishes presentation and disclosure requirements designed to facilitate comparisons between entities that choose different measurement attributes for similar types of assets and liabilities. SFAS No. 159 became effective for us as of January 1, 2008. The adoption of SFAS No. 159, did not have a material impact on our results of operations, cash flows, and financial position.
In December 2007, the FASB issued SFAS No. 141R, Business Combinations. SFAS No. 141R replaces SFAS No. 141 and addresses the recognition and accounting for identifiable assets acquired, liabilities assumed, and noncontrolling interests in business combinations. This Statement applies prospectively to business combinations for which the acquisition date is on or after the beginning of the first annual reporting period beginning on or after December 15, 2008 (January 1, 2009, for us). An entity may not apply it before that date. We are currently assessing the impact this standard will have on our results of operations, cash flows, and financial position.
In December 2007, the FASB issued SFAS No. 160, Noncontrolling Interests in Consolidated Financial Statements. SFAS No. 160 addresses the accounting and reporting framework for minority interests by a parent company. This Statement is effective for fiscal years, and interim periods within those fiscal years, beginning on or after December 15, 2008 ( January 1, 2009, for us). Early adoption is prohibited. We are currently assessing the impact this standard will have on our results of operations, cash flows, and financial position.
In May 2008, the FASB issued SFAS No. 162, The Hierarchy of Generally Accepted Accounting Principles. SFAS No. 162 identifies the sources of accounting principles and the framework for selecting the principles used in the preparation of financial statements of nongovernmental entities that are presented in conformity with generally accepted accounting principles (GAAP) in the United States. This statement shall be effective 60 days following the SEC’s approval of the Public Company Accounting Oversight Board (PCAOB) amendments to AU Section 411, The Meaning of Present Fairly in Conformity With Generally Accepted Accounting Principles. The impact to the financial statements was not material.
In April 2008, the FASB issued FSP No. 142-3, “Determining the Useful Life of Intangible Assets” (FSP 142-3). FSP 142-3 amends the factors to be considered in determining the useful life of intangible assets. Its intent is to improve the consistency between the useful life of an intangible asset and the period of expected cash flows used to measure such asset’s fair value. FSP 142-3 is effective for fiscal years beginning after December 15, 2008. We are currently assessing the potential impact, if any, of FSP 142-3 on our financial statements.
In January 2009, the FASB proposed FSP No. FAS 107-b and APB 28-a, which would amend SFAS No. 107, “Disclosures About Fair Value of Financial Instruments” and APB Opinion No. 28 “Interim Financial Reporting,” to require disclosure of the fair value of financial instruments in interim financial statements as well as annual financial statements. In addition, entities would be required to disclose the method and significant assumptions used to estimate the fair value of financial instruments. If ratified, this proposed guidance would become effective for interim and annual periods ending after March 15, 2009. We are currently evaluating the effect this proposed guidance may have on our financial position, results of operations and cash flows.
38
Table of Contents
Index to Financial Statements
Subsequent Events
We entered into the Third Supplemental Indenture, dated as of February 6, 2009 (the “Third Supplemental Indenture”), to the indenture governing the Senior Secured Notes (the “Indenture”), with Wells Fargo Bank, National Association, as trustee (the “Trustee”) and certain subsidiary guarantors named therein after receiving the requisite number of consents from the holders of the Senior Secured Notes. The Third Supplemental Indenture amends the definition of Net Income (as defined in the Indenture) to provide for the exclusion, in certain circumstances, of certain non-cash charges for impairment writedowns or writeoffs of noncurrent assets and extraordinary, unusual or nonrecurring non-cash charges. Additionally, the Third Supplemental Indenture amends the Indenture to (i) make the Limitation on Capital Expenditures covenant more restrictive on us, (ii) require us during the first quarter of 2009 and by the end of the second quarter of 2010, to spend an aggregate of $10 million in cash to repurchase Senior Secured Notes upon specified terms and conditions and (iii) restrict our ability to incur any additional Indebtedness (as defined in the Indenture and including Additional Notes, which essentially means additional Notes issued under the Indenture or so-called “tack-on” notes) under the Fixed Charge Coverage Ratio test contained in Section 4.14(a) of the Limitation on the Incurrence of Indebtedness and Issuance of Preferred Stock covenant (“ratio debt”) that is secured by any of our assets or property or those of our subsidiaries.
On March 30, 2008, the Forbes Group received a consent, waiver and acknowledgement from Citibank, N.A. for the following loan covenants as of December 31, 2008; (1) the requirement to furnish to Citibank for the fiscal year ended 2008 an opinion from an independent certified public accounting firm assessing the Company’s internal controls and stating that there exists no material weakness except those to which Citibank does not object or which have been disclosed in the Credit Agreement, (2) the requirement to furnish to Citibank financial statements 45 days after each fiscal quarter ended in 2008 and 90 days after the fiscal year ended 2008 as long as the Company provides such financial statements within the SEC deadlines, including any extensions available thereunder, for the relevant Form 10-Q or Form 10-K, (3) the requirement to furnish to Citibank consolidating financial statements for all periods ended in 2008, and (4) the presence of the material weaknesses set forth in the Company’s 8-K filed on March 23, 2009. Citibank, N.A. also authorized a sale/lease-back transaction as long as it complies with the terms of the Indenture.
Subsequent to December 31, 2008, we received advances of $12.0 million on our Credit Facility. We also have $6.4 million in outstanding letters of credit resulting in remaining availability under the Credit Facility of $1.6 million. Our cash balance at March 26, 2009 was $36.9 million.
| Item 7A. | Quantitative and Qualitative Disclosures About Market Risk |
In addition to the risks inherent in our operations, we are exposed to financial, market and economic risks. Changes in interest rates may result in changes in the fair market value of our financial instruments, interest income and interest expense. Our financial instruments that are exposed to interest rate risk are long-term borrowings. The following discussion provides information regarding our exposure to the risks of changing interest rates.
Our primary debt obligations are the outstanding Senior Secured Notes and borrowings under the Credit Facility, if any. Changes in interest rates do not affect interest expense incurred on our Senior Secured Notes as such notes bear interest at fixed rates. However, changes in interest rates would affect their fair values. In general, the fair market value of debt with a fixed interest rate will increase as interest rates fall. Conversely, the fair market value of debt will decrease as interest rates rise. A hypothetical change in interest rates of 10% relative to interest rates as of December 31, 2008 would have no impact on our interest expense for our notes.
The Credit Facility has a variable interest rate and, therefore, is subject to interest rate risk. A 100 basis point increase in interest rates on our variable rate debt would result in approximately $135,000 in additional annual interest expense.
We have not entered into any derivative financial instrument transactions to manage or reduce market risk or for speculative purposes.
| Item 8. | Consolidated/Combined Financial Statements and Supplementary Data |
39
Table of Contents
Index to Financial Statements
Forbes Energy Services Ltd and Subsidiaries (A/K/A The “Forbes Group”)
Consolidated/Combined Financial Statements
40
Table of Contents
Index to Financial Statements
| Item 8A. | Report of Independent Registered Public Accounting Firm |
To the Board of Directors and
Shareholders of Forbes Energy Services Ltd.:
In our opinion, the consolidated balance sheet and the related consolidated statements of operations, changes in shareholders’ equity and cash flows present fairly, in all material respects, the financial position of Forbes Energy Services Ltd. and its subsidiaries (the “ Successor Company”) at December 31, 2008, and the results of their operations and their cash flows for the year ended December 31, 2008 in conformity with accounting principles generally accepted in the United States of America. These financial statements are the responsibility of the Successor Company’s management. Our responsibility is to express an opinion on these financial statements based on our audit. We conducted our audit of these statements in accordance with the standards of the Public Company Accounting Oversight Board (United States). Those standards require that we plan and perform the audit to obtain reasonable assurance about whether the financial statements are free of material misstatement. An audit includes examining, on a test basis, evidence supporting the amounts and disclosures in the financial statements, assessing the accounting principles used and significant estimates made by management, and evaluating the overall financial statement presentation. We believe that our audit provides a reasonable basis for our opinion.
/s/ PricewaterhouseCoopers LLP
March 31, 2009
Houston, Texas
41
Table of Contents
Index to Financial Statements
To the Board of Directors and
Shareholders of Forbes Energy Services Ltd.:
In our opinion, the combined balance sheet and the related combined statements of operations, of changes in members’ equity and of cash flows present fairly, in all material respects, the financial position of Forbes Energy Services LLC. and its subsidiaries and affiliates (the “Predecessor Company”) at December 31, 2007 and the results of their operations and their cash flows for each of the two years in the period ended December 31, 2007 in conformity with accounting principles generally accepted in the United States of America. These financial statements are the responsibility of the Predecessor Company’s management. Our responsibility is to express an opinion on these financial statements based on our audits. We conducted our audit of these statements in accordance with the standards of the Public Company Accounting Oversight Board (United States). Those standards require that we plan and perform the audits to obtain reasonable assurance about whether the financial statements are free of material misstatement. An audit includes examining, on a test basis, evidence supporting the amounts and disclosures in the financial statements, assessing the accounting principles used and significant estimates made by management, and evaluating the overall financial statement presentation. We believe that our audits provide a reasonable basis for our opinion.
/s/ PricewaterhouseCoopers LLP
April 8, 2008
Houston, Texas
42
Table of Contents
Index to Financial Statements
Forbes Energy Services Ltd. and Subsidiaries (a/k/a the “Forbes Group”)
Consolidated/Combined Balance Sheets
| Successor- Consolidated December 31, 2008 | Predecessor- Combined December 31, 2007 | ||||||||
Assets | |||||||||
Current assets | |||||||||
Cash and cash equivalents | $ | 23,469,067 | $ | 5,209,345 | |||||
Accounts receivable–trade, net of allowance of $2.8 million and $50,000 for 2008 and 2007, respectively | 69,095,522 | 42,998,005 | |||||||
Accounts receivable – related parties | 97,672 | 151,676 | |||||||
Accounts receivable – other | 605,925 | 505,101 | |||||||
Prepaid expenses | 5,266,256 | 4,460,941 | |||||||
Other current assets | 1,108,846 | 5,552 | |||||||
Total current assets | 99,643,288 | 53,330,620 | |||||||
Property and equipment, net | 330,951,116 | 204,132,089 | |||||||
Intangible assets, net | 39,459,977 | — | |||||||
Deferred financing costs, net | 12,709,207 | — | |||||||
Other assets | 37,803 | 2,532,457 | |||||||
Total assets | $ | 482,801,391 | $ | 259,995,166 | |||||
Liabilities and Shareholders’/Members’ Equity | |||||||||
Current liabilities | |||||||||
Current maturities of long-term debt | $ | 6,811,802 | $ | 3,823,422 | |||||
Accounts payable – trade | 28,653,204 | 66,496,676 | |||||||
Accounts payable – related parties | 277,154 | 3,431,701 | |||||||
Accounts payable – income tax | 1,005,872 | — | |||||||
Accrued interest payable | 8,488,560 | 442,381 | |||||||
Accrued expenses | 11,699,652 | 7,384,137 | |||||||
Total current liabilities | 56,936,244 | 81,578,317 | |||||||
Long-term debt, net of current maturities | 205,378,040 | 100,409,507 | |||||||
Notes payable – related parties | — | 7,048,075 | |||||||
Deferred tax liability | 62,068,620 | 500,000 | |||||||
Total liabilities | 324,382,904 | 189,535,899 | |||||||
Commitments and contingencies (Note 13) | |||||||||
Members’ equity | — | 70,459,267 | |||||||
Shareholders’ equity | |||||||||
Preference shares, $.01 par value, 10,000,000 shares authorized | — | — | |||||||
Common shares, $.01 par value, 450,000,000 shares authorized, 32,611,200 shares issued and outstanding at December 31, 2008 | 326,112 | — | |||||||
Class B shares, $.01 par value, 40,000,000 shares authorized, 29,500,000 shares issued and outstanding at December 31, 2008 | 295,000 | — | |||||||
Additional paid-in capital | 166,676,054 | — | |||||||
Retained earnings/(accumulated deficit) | (8,878,679 | ) | — | ||||||
Total shareholders’ equity/members’ equity | 158,418,487 | 70,459,267 | |||||||
Total liabilities and shareholders’/members’ equity | $ | 482,801,391 | $ | 259,995,166 | |||||
The accompanying notes are an integral part of these consolidated/combined financial statements.
43
Table of Contents
Index to Financial Statements
Forbes Energy Services Ltd. and Subsidiaries (a/k/a the “Forbes Group”)
Consolidated/Combined Statements of Operations
| Years Ended December 31 | ||||||||||||||
| Successor- Consolidated 2008 | Predecessor-Combined | |||||||||||||
| 2007 | 2006 | |||||||||||||
Revenues | ||||||||||||||
Well servicing | $ | 189,980,242 | $ | 103,600,928 | $ | 58,574,563 | ||||||||
Fluid logistics | 170,949,057 | 103,405,487 | 74,140,794 | |||||||||||
Total revenues | 360,929,299 | 207,006,415 | 132,715,357 | |||||||||||
Expenses | ||||||||||||||
Well servicing | 128,614,600 | 60,570,743 | 32,452,953 | |||||||||||
Fluid logistics | 117,940,153 | 69,887,441 | 49,620,296 | |||||||||||
General and administrative | 17,700,341 | 8,823,299 | 6,026,184 | |||||||||||
Depreciation and amortization | 33,724,218 | 15,341,906 | 7,409,381 | |||||||||||
Goodwill impairment | 4,363,369 | — | — | |||||||||||
Total expenses | 302,342,681 | 154,623,389 | 95,508,814 | |||||||||||
Operating income | 58,586,618 | 52,383,026 | 37,206,543 | |||||||||||
Interest expense | (25,797,663 | ) | (8,342,652 | ) | (5,074,367 | ) | ||||||||
Other income, net | 37,947 | 236,583 | 140,901 | |||||||||||
Income before taxes | 32,826,902 | 44,276,957 | 32,273,077 | |||||||||||
Income tax expense | 62,574,492 | 683,291 | — | |||||||||||
Net income(loss) | $ | (29,747,590 | ) | $ | 43,593,666 | $ | 32,273,077 | |||||||
Loss per share of common stock (Note 16) | ||||||||||||||
Basic | $ | (0.65 | ) | — | — | |||||||||
Diluted | (0.65 | ) | — | — | ||||||||||
Weighted average number of shares outstanding | ||||||||||||||
Basic | 45,894,557 | — | — | |||||||||||
Diluted | 45,894,557 | — | — | |||||||||||
Unaudited proforma earnings per share (Note 16) | ||||||||||||||
Basic | $ | 0.37 | $ | 0.52 | $ | 0.39 | ||||||||
Diluted | 0.37 | 0.52 | 0.39 | |||||||||||
Unaudited proforma weighted average number of shares outstanding | ||||||||||||||
Basic | 55,994,843 | 54,144,700 | 54,144,700 | |||||||||||
Diluted | 55,994,843 | 54,144,700 | 54,144,700 | |||||||||||
The accompanying notes are an integral part of these consolidated/combined financial statements.
44
Table of Contents
Index to Financial Statements
Forbes Energy Services Ltd. and Subsidiaries (a/k/a the “Forbes Group”)
Consolidated/Combined Statements of Changes in Shareholders’/Members’ Equity
| Total Members’ Equity | ||||
Balance December 31, 2005 | $ | 11,265,843 | ||
Net income | 32,273,077 | |||
Distributions | (4,738,188 | ) | ||
Balance December 31, 2006 | 38,800,732 | |||
Net income | 43,593,666 | |||
Distributions | (11,935,131 | ) | ||
Balance December 31, 2007 | $ | 70,459,267 | ||
| Additional Paid-In Capital | Retained Earnings | Total Members’ Equity | Total Shareholders’ Equity | |||||||||||||||||
| Capital Stock | ||||||||||||||||||||
| Shares | Amount | |||||||||||||||||||
Balance December 31, 2007 | — | $ | — | $ | — | $ | — | $ | 70,459,267 | $ | — | |||||||||
January 1, 2008 Delaware reorganization – conversion of CCF | — | — | — | — | 35,603,182 | 35,603,182 | ||||||||||||||
Acquisition of TES and STT | — | — | — | — | 96,067,739 | 96,067,739 | ||||||||||||||
Distributions | — | — | — | — | (14,734,271 | ) | (14,734,271 | ) | ||||||||||||
Class B stock issued in connection with Bermuda Reorganization | 29,500,000 | 295,000 | 95,772,739 | 20,868,911 | (116,936,650 | ) | — | |||||||||||||
Common stock issued in Initial Equity Offering, net | 24,644,700 | 246,447 | 39,691,348 | — | — | 39,937,795 | ||||||||||||||
Additional common stock issued | 7,966,500 | 79,665 | 29,761,972 | — | — | 29,841,637 | ||||||||||||||
Stock-based compensation | — | — | 1,449,995 | — | — | 1,449,995 | ||||||||||||||
Net loss | — | — | — | (29,747,590 | ) | — | (29,747,590 | ) | ||||||||||||
Balance December 31, 2008 | 62,111,200 | $ | 621,112 | $ | 166,676,054 | $ | (8,878,679 | ) | $ | — | $ | 158,418,487 | ||||||||
The accompanying notes are an integral part of these consolidated/combined financial statements.
45
Table of Contents
Index to Financial Statements
Forbes Energy Services Ltd. and Subsidiaries (a/k/a the “Forbes Group”)
Consolidated/Combined Statements of Cash Flows
| Years Ended December 31, | ||||||||||||||
| Successor- Consolidated 2008 | Predecessor-Combined | |||||||||||||
| 2007 | 2006 | |||||||||||||
Cash flows from operating activities: | ||||||||||||||
Net Income (loss) | $ | (29,747,590 | ) | $ | 43,593,666 | $ | 32,273,077 | |||||||
Adjustments to reconcile net income/(loss) to net cash provided by operating activities | ||||||||||||||
Depreciation and amortization expense | 33,724,218 | 15,341,906 | 7,409,381 | |||||||||||
Amortization of Senior Secured Notes discount | 610,289 | — | — | |||||||||||
Stock-based compensation | 1,449,995 | — | — | |||||||||||
Impairment of goodwill | 4,363,369 | — | — | |||||||||||
Deferred income tax | 61,568,620 | 500,000 | — | |||||||||||
Loss on disposal of assets, net | 682,851 | 36,836 | 126,622 | |||||||||||
Bad debt expense | 2,739,473 | 55,455 | 848,334 | |||||||||||
Deferred loan cost amortization | 5,976,131 | 253,935 | 104,478 | |||||||||||
Changes in operating assets and liabilities, net of effects of acquisitions: | ||||||||||||||
Accounts receivable | (28,937,814 | ) | (19,227,480 | ) | (10,441,547 | ) | ||||||||
Accounts receivable – related party | 54,004 | (151,676 | ) | — | ||||||||||
Prepaid expenses | (1,015,810 | ) | (1,202,628 | ) | (1,524,796 | ) | ||||||||
Inventory | (892,800 | ) | (139,859 | ) | 27,041 | |||||||||
Accounts payable | 4,110,765 | 1,631,865 | (222,590 | ) | ||||||||||
Accounts payable – related party | (3,154,547 | ) | 2,620,226 | — | ||||||||||
Accrued expenses | 4,626,861 | 3,091,203 | (5,099,800 | ) | ||||||||||
Income taxes payable | 1,005,872 | — | — | |||||||||||
Accrued interest payable | 8,046,179 | 178,361 | 158,561 | |||||||||||
Net cash provided by operating activities | 65,210,066 | 46,581,810 | 23,658,761 | |||||||||||
Cash flows from investing activities: | ||||||||||||||
Proceeds from sale of property and equipment | 50,017 | 11,478 | 77,500 | |||||||||||
Payments for property and equipment | (176,940,028 | ) | (68,234,687 | ) | (40,883,585 | ) | ||||||||
Other | — | — | (150,000 | ) | ||||||||||
Net cash used in investing activities | (176,890,011 | ) | (68,223,209 | ) | (40,956,085 | ) | ||||||||
Cash flows from financing activities: | ||||||||||||||
Payments for debt issuance costs | (16,502,030 | ) | (1,653,208 | ) | (611,613 | ) | ||||||||
Proceeds from issuance of common stock | 189,779,432 | — | — | |||||||||||
Purchase outstanding interest in Forbes Energy Services LLC | (120,000,000 | ) | — | — | ||||||||||
Proceeds from related party debt issuance | — | 1,800,000 | 700,000 | |||||||||||
Repayments of related party debt | (7,048,075 | ) | (431,000 | ) | (200,000 | ) | ||||||||
Proceeds from borrowings on debt | 226,775,441 | 58,780,339 | 39,052,738 | |||||||||||
Repayments of debt | (128,330,830 | ) | (27,359,891 | ) | (12,519,654 | ) | ||||||||
Distributions to members | (14,734,271 | ) | (11,935,131 | ) | (4,738,188 | ) | ||||||||
Net cash provided by financing activities | 129,939,667 | 19,201,109 | 21,683,283 | |||||||||||
Net increase (decrease) in cash and cash equivalents | 18,259,722 | (2,440,290 | ) | 4,385,959 | ||||||||||
Cash and cash equivalents | ||||||||||||||
Beginning of year | 5,209,345 | 7,649,635 | 3,263,676 | |||||||||||
End of year | $ | 23,469,067 | $ | 5,209,345 | $ | 7,649,635 | ||||||||
The accompanying notes are an integral part of these consolidated/combined financial statements.
46
Table of Contents
Index to Financial Statements
Forbes Energy Services Ltd. and Subsidiaries (a/k/a the “Forbes Group”)
Notes to Consolidated/Combined Financial Statements
| 1. | Organization and Nature of Operations |
Nature of Business
Forbes Energy Services Ltd. (“FES Ltd”) and its subsidiaries, Forbes Energy Services LLC (“FES LLC”), Forbes Energy Capital Inc. (“FES CAP”), C.C. Forbes, LLC (“CCF”), TX Energy Services, LLC (“TES”), Superior Tubing Testers, LLC (“STT”) and Forbes Energy International, LLC (“FEI LLC”) are headquartered in Alice, Texas, and conduct business primarily in the state of Texas. On October 15, 2008, FES LLC and FEI LLC formed Forbes Energy Services México, S. de R.L. de C.V. (“FES Mexico”), a Mexican limited liability partnership (sociedad de responsabilidad limitada de capital variable), to conduct operations in Mexico. As used in these consolidated/combined financial statements, the “Company,” the “Forbes Group,” “we,” or “our” means FES Ltd and all subsidiaries after May 29, 2008; FES LLC and its subsidiaries from January 1, 2008 to May 29, 2008 (in each case from January 1, 2008 referred to in the financial statements column headings as “Successor”); CCF, TES and STT from June 29, 2007 to December 31, 2007, and C.C. Forbes, L.P., Texas Energy Services, L.P. and Superior Tubing Testers, L.P. prior to June 29, 2007 (in each case prior to January 1, 2008, referred to in the financial statements column headings as “Predecessor”).
The Forbes Group is an independent oilfield services contractor that provides a wide range of well site services to oil and natural gas drilling and producing companies to help develop and enhance the production of oil and natural gas. These services include fluid hauling, fluid disposal, well maintenance, completion services, workovers and recompletions, plugging and abandonment, and tubing testing. The Forbes Group’s operations are concentrated in the major onshore oil and natural gas producing regions of Texas, with one location in Baxterville, Mississippi and one location in Poza Rica, Mexico.
| 2. | Risk and Uncertainties |
As an independent oilfield services contractor that provides a broad range of drilling-related and production-related services to oil and natural gas companies, primarily onshore in Texas, our revenue, profitability, cash flows and future rate of growth are substantially dependent on our ability to (1) maintain adequate equipment utilization, (2) maintain adequate pricing for the services we provide, and (3) maintain a trained work force. Failure to do so could adversely affect our financial position, results of operations, and cash flows.
Because our revenues are generated primarily from customers who are subject to the same factors generally impacting the oil and natural gas industry, our operations are also susceptible to market volatility resulting from economic, cyclical, weather related or other factors related to such industry. Changes in the level of operating and capital spending in the industry, decreases in oil and natural gas prices, or industry perception about future oil and natural gas prices could materially decrease the demand for our services, adversely affecting our financial position, results of operations and cash flows.
Our Credit Facility (as defined below) and the indenture governing our Senior Secured Notes (as defined below) and the debt outstanding thereunder impose significant restrictions on us and increase our vulnerability to adverse economic and industry conditions that could limit our ability to obtain additional or replacement financing. While the principal indebtedness of the Credit Facility is not scheduled for repayment until April 2012 and the Senior Secured Notes not until February 2015, our inability to satisfy any obligations under these agreements would constitute an event of default. Under the Credit Facility, an event of default will be deemed to have occurred if there is a change in control of the Forbes Group or if a material adverse change occurs in regards to the consolidated financial position of the Forbes Group, the consolidated business, assets, operations, properties or prospects of the Forbes Group, the Forbes Groups’ ability to timely pay the obligations under the Credit Facility or the enforceability of the material terms of any material loan document against the Forbes Group. The lender under the Credit Facility could, at some future date, make a determination that such a material adverse change has occurred, which is outside the control of the Forbes Group. The indenture governing the Senior Secured Notes does not have similar material adverse change or change in control events of default but does require an offer to redeem the Senior Secured Notes in the event of a change in control. It contains a cross-default provision that would be triggered if the debt under the Credit Facility were accelerated. See a discussion of cross-default provisions in Note 9, below. A default could result in all or a portion of our outstanding debt becoming immediately due and payable. If this should occur, we might not be able to obtain waivers or secure alternative financing to satisfy all of our obligations simultaneously. Given current market conditions, our ability to access the capital markets or to effect any asset sales might be restricted at a time when we would like or need to raise capital. In addition, the current economic conditions could also impact our customers and vendors and may cause them to fail to meet their obligations to us with little or no warning. These events could have a material adverse effect on our business, financial position,
results of operations and cash flows and our ability to satisfy the obligations under our debt agreements. (Also see Notes 9 and 10)
47
Table of Contents
Index to Financial Statements
Although we currently believe our liquidity and projected cash flows from operations will be sufficient to meet our cash requirements for the next twelve months and the foreseeable future, the factors described above create uncertainty. The continued compliance with our debt covenants is dependent upon us obtaining a minimum level of EBITDA and maintaining a minimum level of net worth. Our forecasted EBITDA and net worth contain certain estimates and assumptions regarding rig and truck utilization, average hourly rates, and operating and general and administrative expenses, which could prove to be inaccurate. A material deviation from one or more of these estimates or assumptions could result in a violation of one or more of our contractual covenants, which could result in all or a portion of our outstanding debt becoming immediately due and payable. Within certain constraints, we can conserve capital by reducing or delaying capital expenditures, deferring non-regulatory maintenance expenditures and further reducing operating and administrative costs. Postponing or eliminating capital expenditures would delay or reduce future cash flows, and we believe these actions can provide us the flexibility to match our capital commitments to our available capital resources.
| 3. | Formation of Forbes Energy Services LLC and Forbes Energy Services Ltd. and the Initial Equity Offering |
FES LLC is a Delaware limited liability company formed effective January 1, 2008 to act as the holding company for the three wholly-owned operating companies, CCF, TES, and STT. In the reorganization (the “Delaware Reorganization”), ownership of each of such three operating subsidiaries comprising our business was transferred to FES LLC by their equity investors in exchange for equity interests in FES LLC. Although FES LLC was the legal acquirer in the Delaware Reorganization, CCF was considered the acquirer for accounting purposes. As a result of this determination, the net assets of CCF remain at their historical cost, while purchase accounting was applied to TES and STT. The purchase prices of TES and STT were based on estimates of the enterprise value of each company. Amounts allocated to identifiable tangible and intangible assets acquired and liabilities assumed were based on valuations. FES LLC allocated $14.5 million as a step-up in book value to property and equipment of TES, $4.4 million to goodwill, and $42.3 million to other intangible assets. Total value added to the assets and stockholders’ equity was $61.1 million as a result of the Delaware Reorganization.
The Pro Forma unaudited results summarized below reflect our consolidated Pro Forma results of operations for the years ended December 31, 2007 and 2006 as if TES and STT were acquired January 1, 2007 and 2006, respectively. These results include amortization of the intangibles other than goodwill that resulted from the reorganization. Depreciation on the stepped up basis in the assets of TES is also included. Federal income tax expense was calculated at an assumed rate of 35% for both years.
| Year Ended December 31 | ||||||
| 2007 | 2006 | |||||
Revenues | $ | 207,006,415 | $ | 132,715,357 | ||
Depreciation and amortization | 20,703,122 | 12,770,600 | ||||
Income before taxes | 38,915,741 | 26,911,858 | ||||
Net income | 25,295,231 | 17,492,708 | ||||
FES Ltd is a Bermuda corporation formed effective April 9, 2008 to act as the holding company for FES LLC and its subsidiaries. At the time of FES Ltd’s organization, 200 common shares were issued. On May 29, 2008, concurrent with the Initial Equity Offering, all of the members of FES LLC assigned 63% of their membership interests in FES LLC to FES Ltd in exchange for 29,500,000 shares of FES Ltd’s Class B non-voting stock. This transaction was accounted for as a transaction between entities under common control and deemed to be effective for accounting purposes as of January 1, 2008. Upon consummation of the Initial Equity Offering, FES Ltd contributed $120,000,000 cash as additional capital to FES LLC and FES LLC used the funds to redeem the remaining outstanding membership interests held by the members of FES LLC, other than FES Ltd. The result was that FES LLC and its subsidiaries became wholly owned subsidiaries of FES Ltd. (collectively, the “Bermuda Reorganization”).
On May 29, 2008, FES Ltd completed its Canadian initial public offering (the “Initial Equity Offering”) and simultaneous U.S. private placement of its common shares. In the Initial Equity Offering, FES Ltd sold 24,644,700 common shares for CDN $7.00 per share and the common shares are listed on the Toronto Stock Exchange under the symbol FRB.TO. Gross proceeds from the Initial Equity Offering were CDN $172,511,500 and net proceeds from the Initial Equity Offering after expenses were CDN $162,465,730.
48
Table of Contents
Index to Financial Statements
| 4. | Summary of Significant Accounting Policies |
Principles of Consolidation
The Forbes Group’s consolidated financial statements as of and for the year ended December 31, 2008 include the accounts of FES Ltd and all of its wholly owned, direct and indirect, and consolidated subsidiaries, from May 29, 2008 to December 31, 2008, and FES LLC and all of its wholly owned and consolidated subsidiaries from January 1, 2008 through May 28, 2008. All significant intercompany balances and transactions have been eliminated in the consolidation.
Principles of Combination
The Forbes Group’s combined financial statements as of and for the periods ended on or prior to December 31, 2007 include the accounts of CCF, TES, STT, and their predecessor partnerships, as they were under common management. All significant intercompany balances and transactions have been eliminated in the combination.
Use of Estimates
The preparation of consolidated/combined financial statements in conformity with GAAP requires management to make estimates and assumptions that affect the reported amounts of assets and liabilities and disclosure of contingent assets and liabilities at the date of the consolidated/combined financial statements and the reported amounts of revenues and expenses during the reporting period. Actual results could differ from those estimates.
Revenue Recognition
Well Servicing–Well servicing consists primarily of maintenance services, workover services, completion services, plugging and abandonment services and tubing testing. The Forbes Group prices well servicing by the hour of service performed.
Fluid Logistics–Fluid logistics consists primarily of the sale, transportation, storage, and disposal of fluids used in drilling, production, and maintenance of oil and natural gas wells. The Forbes Group prices fluid logistics services by the job, by the hour, or by the quantities sold, disposed, or hauled.
The Forbes Group recognizes revenue when services are performed, collection of the relevant receivables is probable, persuasive evidence of an arrangement exists, and the price is fixed or determinable. In accordance with EITF Issue No. 06-03 “How Sales Taxes Collected from Customers and Remitted to Government Authorities Should be Presented in the Income Statement (That is, Gross Versus Net Presentation),” revenues are presented net of any sales taxes collected by the Forbes Group from its customers that are remitted to governmental authorities.
Income Taxes
The Forbes Group was not subject to U.S. federal income tax until May 29, 2008. Prior to May 29, 2008 all income, losses, credits, and deductions of the Forbes Group were passed through to the equity owners’ individual tax returns. Accordingly, no provision for U.S. federal income taxes is included in the accompanying consolidated/combined financial statements through May 29, 2008. In conjunction with the Initial Equity Offering of FES Ltd’s common shares on May 29, 2008 and the related Bermuda Reorganization, the Forbes Group became subject to U.S. federal income tax. As part of this reorganization, $52.8 million in deferred U.S. federal income taxes were recorded as income tax expense in accordance with SFAS No. 109, “Accounting for Income Taxes,” which requires that the tax effect of recognizing deferred tax items upon a change in tax status be included in current year operations.
Cash and Cash Equivalents
The Forbes Group considers all highly liquid investments purchased with an original maturity of three months or less to be cash equivalents.
Accounts Receivable and Allowance for Doubtful Accounts
Accounts receivable is based on earned revenues. The Forbes Group provides an allowance for doubtful accounts, which is based upon a review of outstanding receivables, historical collection information, and existing economic conditions. Provisions for doubtful accounts are recorded when it becomes evident that the customer will not make the required payments at either contractual due dates or in the future. At December 31, 2008 and 2007, the allowance for doubtful accounts totaled $2.8 million and $50,000, respectively.
49
Table of Contents
Index to Financial Statements
Property and Equipment
Property and equipment are recorded at cost. Improvements or betterments that extend the useful life of the assets are capitalized. Expenditures for maintenance and repairs are charged to expense when incurred. The costs of assets retired or otherwise disposed of and the related accumulated depreciation are eliminated from the accounts in the period of disposal. Gains or losses resulting from property disposals are credited or charged to operations currently. Depreciation is recorded using the straight-line method over the estimated useful lives of the assets.
Goodwill
Goodwill results from business acquisitions and represents the excess of acquisition costs over the fair value of the net assets acquired. We account for goodwill and other intangible assets under the provisions of SFAS No. 142, “Goodwill and Other Intangible Assets” (“SFAS 142”). Goodwill and other intangible assets not subject to amortization are tested for impairment annually as of December 31, or more frequently if events or changes in circumstances indicate that the asset might be impaired. SFAS 142 requires a two-step process for testing impairment. First, the fair value of each reporting unit is compared to its carrying value to determine whether an indication of impairment exists. If impairment is indicated, then the fair value of the reporting unit’s goodwill is determined by allocating the unit’s fair value to its assets and liabilities (including any unrecognized intangible assets) as if the reporting unit had been acquired in a business combination. The amount of impairment for goodwill is measured as the excess of its carrying value over its fair value. As discussed in Note 5, $4.4 million of goodwill was recorded in connection with the Delaware Reorganization effective January 1, 2008. An impairment charge of $4.4 million was recorded in the fourth quarter of 2008 which reduced the goodwill in our balance sheet to zero as of December 31, 2008.
Impairments
In accordance with SFAS No. 144,Accounting for the Impairment or Disposal of Long-Lived Assets, or SFAS No. 144, long-lived assets, such as property, and equipment, and finite-lived intangibles subject to amortization, are reviewed for impairment at a minimum annually, or whenever, in management’s judgment events or changes in circumstances indicate that the carrying amount of such assets may not be recoverable. Recoverability of assets to be held and used is measured by a comparison of the carrying amount of such assets to estimated undiscounted future cash flows expected to be generated by the assets. Expected future cash flows and carrying values are aggregated at their lowest identifiable level. If the carrying amount of such assets exceeds their estimated future cash flows, an impairment charge is recognized in the amount by which the carrying amount of such assets exceeds the fair value of the assets. The Forbes Group evaluated its asset group (other than goodwill) in accordance with FAS 144 which resulted in no impairment for the year ended December 31, 2008.
Environmental
The Forbes Group is subject to extensive federal, state, and local environmental laws and regulations. These laws, which are constantly changing, regulate the discharge of materials into the environment and may require the Forbes Group to remove or mitigate the adverse environmental effects of the disposal or release of petroleum or chemical substances at various sites. Environmental expenditures are expensed or capitalized depending on their future economic benefit. Expenditures that relate to an existing condition caused by past operations and that have no future economic benefits are expensed. Liabilities for expenditures of a non-capital nature are recorded when environmental assessment and/or remediation is probable and the costs can be reasonably estimated.
Deferred Financing Costs
Deferred financing costs are amortized over the period of the loan agreement on an effective interest basis, as a component of interest expense. Additionally, the Forbes Group includes gains and losses on early extinguishment of debt as a component of interest expense. For the twelve months ended December 31, 2008, 2007, 2006 amortization of deferred financing costs was $6.0 million, $0.3 million, and $0.1 million, respectively. Losses on early extinguishment of debt totaled $0.7 million in 2008 and zero for 2007 and 2006.
Share-Based Compensation
The Company accounts for share based-compensation in accordance with SFAS No. 123R. The Company measures share-based compensation cost as of the grant date based on the estimated fair value of the award less an estimated rate for pre-vesting forfeitures, and recognizes compensation expense on a straight-line basis over the vesting period. Compensation expense is
50
Table of Contents
Index to Financial Statements
recognized with an off-setting credit to additional paid-in capital, which is then transferred to common stock when the award is distributed or the option is exercised. Consideration received on the exercise of stock options is also credited to common stock.
Contingent Liabilities
We establish a provision for a contingent liability when it is probable that a liability has been incurred and the amount is estimable. We base our estimates and judgments on historical experience and on various other assumptions and information that are believed to be reasonable under the circumstances. There are no pending legal proceedings, and the Forbes Group is not aware of any threatened legal proceedings, to which the Forbes Group is a party or to which its property is subject, other than immaterial proceedings in the ordinary course of business.
Recent Accounting Pronouncements
In September 2006, the Financial Accounting Standards Board (“FASB”) issued SFAS No. 157,Fair Value Measurements. SFAS No. 157 defines fair value, establishes a framework for measuring fair value in GAAP, and enhances disclosures about fair value measurements. SFAS No. 157 applies when other accounting pronouncements require fair value measurements; it does not require new fair value measurement. SFAS No. 157 is effective for fiscal years beginning after November 15, 2007, with early adoption encouraged. FASB Staff Position (“FSP”) 157-2 delayed the effective date of SFAS 157 for nonfinancial assets and liabilities, except for items that are recognized or disclosed at fair value on a recurring basis (at least annually). Beginning January 1, 2008, the Forbes Group has applied the provisions of SFAS 157 to its financial instruments and the impact is not material. The Forbes Group is currently assessing the impact this standard will have when applied to the Forbes Group’s nonfinancial assets and liabilities and its potential impact on the Forbes Group’s consolidated financial statements (primarily asset retirement obligations and nonfinancial assets and liabilities measured at fair value).
In February 2007, the FASB issued SFAS No. 159,The Fair Value Option for Financial Assets and Financial Liabilities—including an amendment of FASB Statement No. 115. This statement permits entities to choose to measure many financial instruments and certain other items at fair value that are not currently required to be measured at fair value and establishes presentation and disclosure requirements designed to facilitate comparisons between entities that choose different measurement attributes for similar types of assets and liabilities. SFAS No. 159 is effective as of the beginning of an entity’s first fiscal year that begins after November 15, 2007. The Forbes Group adopted SFAS No. 159 beginning January 1, 2008. The Forbes Group has determined that the impact of this standard on the Forbes Group’s results of operations, cash flows, and financial position was not material.
In December 2007, the FASB issued SFAS No. 141R,Business Combinations. SFAS No. 141R replaces SFAS No. 141 and addresses the recognition and accounting for identifiable assets acquired, liabilities assumed, and noncontrolling interests in business combinations. This Statement applies prospectively to business combinations for which the acquisition date is on or after the beginning of the first annual reporting period beginning on or after December 15, 2008 (that is, January 1, 2009, for the Forbes Group). An entity may not apply it before that date. The Forbes Group is currently assessing the impact this standard will have on the Forbes Group’s results of operations, cash flows, and financial position.
In December 2007, the FASB issued SFAS No. 160,Noncontrolling Interests in Consolidated Financial Statements. SFAS No. 160 addresses the accounting and reporting framework for minority interests by a parent company. This Statement is effective for fiscal years, and interim periods within those fiscal years, beginning on or after December 15, 2008 (that is, January 1, 2009, for the Forbes Group). Early adoption is prohibited. The Forbes Group is currently assessing the impact this standard will have on the Forbes Group’s results of operations, cash flows, and financial position.
In May 2008, the FASB issued SFAS No. 162,The Hierarchy of Generally Accepted Accounting Principles. SFAS No. 162 identifies the sources of accounting principles and the framework for selecting the principles used in the preparation of financial statements of nongovernmental entities that are presented in conformity with GAAP in the United States. This statement will be effective following the SEC’s approval of the Public Company Accounting Oversight Board (PCAOB) amendments to AU Section 411,The Meaning of Present Fairly in Conformity With Generally Accepted Accounting Principles. The impact to the Forbes Group’s financial statements was not material.
In April 2008, the FASB issued FASB Staff Position (FSP) No. 142-3, “Determining the Useful Life of Intangible Assets” (FSP 142-3). FSP 142-3 amends the factors to be considered in determining the useful life of intangible assets. Its intent is to improve the consistency between the useful life of an intangible asset and the period of expected cash flows used to measure such asset’s
51
Table of Contents
Index to Financial Statements
fair value. FSP 142-3 is effective for fiscal years beginning after December 15, 2008 (that is, January 1, 2009, for the Forbes Group). The Company is currently assessing the potential impact, if any, of FSP 142-3 on its financial statements.
In January 2009, the FASB issued FSP No. FAS 107-b and APB 28-a, which would amend SFAS No. 107, “Disclosures About Fair Value of Financial Instruments” and APB Opinion No. 28, “Interim Financial Reporting,” to require disclosure of the fair value of financial instruments in interim financial statements as well as annual financial statements. In addition, entities would be required to disclose the method and significant assumptions used to estimate the fair value of financial instruments. If ratified, this proposed guidance would become effective for interim and annual periods ending after March 15, 2009. We are currently evaluating the effect this proposed guidance may have on our financial position, results of operations and cash flows.
| 5. | Goodwill and Other Intangible Assets |
Statement of Financial Accounting Standards No. 142,Goodwill and Other Intangible Assets (“SFAS No. 142”) eliminates the amortization of goodwill and other intangible assets with indefinite lives. Intangible assets with lives restricted by contractual, legal, or other means will continue to be amortized over their useful lives. Goodwill and other intangible assets not subject to amortization are tested for impairment annually or more frequently if events or changes in circumstances indicate that the asset might be impaired. SFAS No. 142 requires a two-step process for testing impairment. First, the fair value of each reporting unit is compared to its carrying value to determine whether an indication of impairment exists. If impairment is indicated, then the fair value of the reporting unit’s goodwill is determined by allocating the unit’s fair value to its assets and liabilities (including any unrecognized intangible assets) as if the reporting unit had been acquired in a business combination. The fair value for goodwill is measured as the difference between the fair value of the reporting unit’s assets (excluding goodwill) and its fair value.
In step one of the annual impairment test and due to the adverse equity market conditions affecting our common stock price and the declines in oil and natural gas prices in the fourth quarter of 2008 and continuing into 2009, we tested our fluid services business unit for goodwill impairment. The first step was to estimate the fair value of the fluid services segment using a weighting of the discounted cash flow method, the public company guideline method, and the guideline transaction method, weighted 45%, 45% and 10%, respectively. The discounted cash flow method and public company guideline method provided the strongest indication of value due to their ability to incorporate the current state of the oil field services industry as well as the recent changes in the credit and equity markets. The guideline transaction method involved considering private transactions that were relevant but were considered to a lesser degree. In order to validate the reasonableness of the estimated fair value obtained for this reporting unit, a reconciliation of fair value for all the major reporting units to our market capitalization was performed. For purposes of reconciliation to the Company’s market capitalization, a control premium was applied. The control premium used in the reconciliation was derived from a market transaction data study. In addition, for purposes of calculating fair value, the market value of our debt as of December 31, 2008 was used. The measurement date for the stock price for the reconciliation was the 30-day average closing price, centered on December 31, 2008. The results of the fair value analysis for step one showed the carrying value of the fluid services business above the fair value as of December 31, 2008.
Based on the results of step one, impairment of goodwill for the fluid unit was indicated. The Company performed step two by allocating the estimated fair value to the tangible and intangible assets, which indicated that the entire value of the goodwill in the fluids services unit of $4.4 million was impaired. The goodwill associated with the Delaware Reorganization had no tax basis, and accordingly, there was no tax benefit derived from recording the impairment charge. The Company has no other goodwill recorded on our balance sheet.
Additionally in conjunction with the Delaware Reorganization effective January 1, 2008, the Forbes Group’s purchase price allocation assigned $42.3 million to other intangible assets with finite lives. Goodwill impairment test and in light of market conditions during the fourth quarter of 2008, we performed an assessment of our goodwill balance which indicated that our $4.4 million goodwill balance was impaired. Based on this, an impairment charge was recorded in the consolidated statement of operations resulting in goodwill of zero as of December 31, 2008. This impairment relates to our Fluid Logistics segment.
Our major classes of intangible assets subject to amortization under SFAS 142 consist of our customer relationships, trade name, safety training program and, dispatch software. Amortization expense for the twelve months ended December 31, 2008, 2007, and 2006 was $2.9 million, zero, and zero, respectively. Estimated aggregate amortization expense for each of the five succeeding fiscal years is $2.9 million per year.
The following sets forth the identified intangible assets by major asset class:
| As of December 31, 2008 | |||||||||||
| Useful Life (years) | Original Cost | Accumulated Amortization | Net Book Value | ||||||||
Customer relationships | 15 | $ | 31,895,919 | $ | 2,216,395 | $ | 29,769,524 | ||||
Trade name | 15 | 8,049,750 | 536,650 | 7,513,100 | |||||||
Safety training program | 15 | 1,181,924 | 78,795 | 1,103,129 | |||||||
Dispatch software | 10 | 1,135,282 | 113,528 | 1,021,754 | |||||||
Other | 10 | 58,300 | 5,830 | 52,470 | |||||||
| $ | 42,321,175 | $ | 2,951,198 | $ | 39,459,977 | ||||||
| 6. | Stock-Based Compensation |
General
The Forbes Group’s 2008 Incentive Compensation Plan is a long-term retention plan that is intended to attract, retain and provide incentives for talented employees, including officers, and non-employee directors, and to align stockholder and employee interests. The Company believes its 2008 Incentive Compensation Plan is critical to its operations and productivity.
2008 Incentive Compensation Plan
From time to time, the Company grants stock options to its employees, including executive officers, and directors from its 2008 Incentive Compensation Plan. Standard options vest over a three-year period, with approximately one third vesting on the first, second and third anniversaries of the date of grant. For most grantees, options expire at the earlier of either one year after the
52
Table of Contents
Index to Financial Statements
termination of grantee’s employment by reason of death, disability or retirement, ninety days after termination of the grantee’s employment other than upon grantee’s death, disability or retirement, or ten years after the date of grant.
At December 31, 2008, 2,450,000 shares were available for future grants under the 2008 Incentive Compensation Plan. All options granted under this plan for the year ended December 31, 2008 were granted on the date of the Initial Equity Offering and were priced at the fair market value on the date of grant, based on the issue price of the Company’s common stock in such offering. No grants were made during fiscal years 2007 or 2006.
Stock Option Activities
The following table presents a summary of the Company’s stock option activity for the year ended December 31, 2008 (shares in thousands):
| Shares | Weighted- Average Exercise Price | Weighted- Average Remaining Contractual Term | Aggregate Intrinsic Value | ||||||
Options outstanding at December 31, 2007: | — | CDN$ | — | ||||||
Stock options: | |||||||||
Granted | 2,770,000 | 7.00 | |||||||
Exercised | — | — | |||||||
Canceled | — | — | |||||||
Options outstanding at December 31, 2008: | 2,770,000 | $ | 7.00 | 9.41 years | — | ||||
Vested and expected to vest at December 31, 2008 | 2,770,000 | $ | 7.00 | 9.41 years | — | ||||
Exercisable at December 31, 2008 | — | CDN$ | — | — | — | ||||
The aggregate intrinsic value in the table above represents the total pre-tax intrinsic value (the difference between Forbes’s closing stock price on the last trading day of fiscal year 2008 and the exercise price, multiplied by the number of in-the-money options) that would have been received by the option holders had all option holders exercised their options on December 31, 2008. This amount changes based on the fair market value of Forbes’s stock. No options were exercised in fiscal year 2008.
The weighted-average fair value of the stock options granted under the 2008 Incentive Compensation Plan during the year ended December 31, 2008 as defined by SFAS 123R was $2.91.
Stock-Based Compensation Expense
During the year ended December 31, 2008, the Company recorded total stock based compensation expense of $1.4 million. As no stock options were granted prior to 2008, the Company had no stock based compensation for fiscal years 2007 and 2006. No stock-based compensation costs were capitalized as of December 31, 2008 and 2007. As of December 31, 2008, total unrecognized stock-based compensation costs amounted to $6.0 million, net of estimated forfeitures and is expected to be recorded over a weighted-average period of 2.4 years.
53
Table of Contents
Index to Financial Statements
At December 31, 2008, outstanding options had a weighted average remaining contractual term of 9.4 years. The amount of unrecognized stock-based compensation will be affected by any future stock option grants and any termination of employment by any employee that has received stock option grants that are unvested as of their termination date.
At December 31, 2008, the Company has assumed an annualized forfeiture rate of approximately 3% for options granted during the year. Under the true-up provisions of SFAS 123R, the Company will record additional expense if the actual forfeiture rate is lower than estimated, and will record a recovery of prior expense if the actual forfeiture is higher than estimated.
Assumptions for Estimating Fair Value of Stock Option Grants
Upon adoption of SFAS No. 123R, the Company selected the Black-Scholes option pricing model as the most appropriate model for determining the estimated fair value for stock-based awards. The use of the Black-Scholes model requires the use of extensive actual employee exercise behavior data and the use of a number of complex assumptions including expected volatility and expected term.
The following table summarizes the assumptions used to value options granted during the year ended December 31, 2008:
Expected term | 6 years | ||
Risk-free interest rate | 4.12% | ||
Volatility | 34.82% | ||
Dividend yield | 0.00% | ||
Grant date fair value per share | CDN$ | 2.91 |
The expected term of employee stock options represents the weighted-average period that the stock options are expected to remain outstanding. The risk-free interest rate is based on the U.S. Treasury constant maturity interest rate with a term consistent with the expected life of the options. Because the Forbes Group was a newly formed public company when the options were granted, the expected term approved and the expected volatility is based on the price of comparable company’s common stock in the same industry over a historical period which approximates the expected term of the options granted. The dividend yield assumption is based on the Company’s expectation of dividend payouts.
Total stock-based compensation recognized in operations in the Company’s Statements of Operations for the year ended December 31, 2008 was $1.4 million.
| 7. | Property and Equipment |
Property and equipment at December 31, 2008 and 2007, consisted of the following:
| Estimated Life in Years | Successor- Consolidated 2008 | Predecessor- Combined 2007 | ||||||||||
Well servicing equipment | 3-15 years | $ | 278,168,921 | $ | 158,973,304 | |||||||
Autos and trucks | 5-10 years | 78,043,817 | 60,386,415 | |||||||||
Disposal wells | 5-15 years | 15,028,481 | 8,268,355 | |||||||||
Building and improvements | 5-30 years | 4,598,976 | 2,813,116 | |||||||||
Furniture and fixtures | 3-10 years | 2,140,493 | 1,287,552 | |||||||||
Land | 91,242 | 91,242 | ||||||||||
Other | 3-15 years | 65,503 | 91,665 | |||||||||
| 378,137,433 | 231,911,649 | |||||||||||
Accumulated depreciation | (47,186,317 | ) | (27,779,560 | ) | ||||||||
| $ | 330,951,116 | $ | 204,132,089 | |||||||||
54
Table of Contents
Index to Financial Statements
| 8. | Accounts Payable and Accrued Liabilities |
Accrued expenses and accounts payable at December 31, 2008 and 2007, consisted of the following:
| Successor- Consolidated 2008 | Predecessor- Combined 2007 | |||||||
Accrued insurance | $ | 4,999,443 | $ | 3,288,593 | ||||
Accrued wages | 3,252,788 | 1,553,889 | ||||||
Other accrued expenses | 3,447,421 | 2,541,655 | ||||||
Total accrued expenses | $ | 11,699,652 | $ | 7,384,137 | ||||
Accounts payable – vendor financings | $ | 21,202,501 | $ | 60,316,391 | ||||
Accounts payable – other | 7,450,703 | 6,180,285 | ||||||
Total accounts payable | $ | 28,653,204 | $ | 66,496,676 | ||||
| 9. | Revolving Credit Facility |
Citibank Credit Agreement
On April 10, 2008, the Forbes Group entered into a credit agreement (the “Credit Agreement”) with Citibank, N.A., which provides for a four-year senior secured revolving credit facility for up to $20 million (the “Credit Facility”). The Forbes Group can use the proceeds for general corporate purposes. Any unpaid principal amount is due on the maturity date.
Borrowings under the Credit Facility accrue interest, at the Forbes Group’s option, at either (i) the greater of the Federal Funds Effective Rate in effect on such day plus 1/2 of 1% and the Citibank, N.A. “prime rate” plus a margin of up to 1.25%, or (ii) the London Interbank Offered Rate, plus a margin of 1.75% to 2.25%. The applicable interest rate margin is based on the Forbes Group’s leverage ratio, as defined in the credit agreement governing the Credit Facility. Unpaid interest accrued on outstanding loans is payable quarterly.
The Credit Facility is secured by first priority security interests in substantially all of the Forbes Group’s assets that rank senior to the security interests granted to the holders of the Senior Secured Notes. The credit agreement also contains customary representations, warranties and covenants for the type and nature of the Credit Facility, including certain limitations or restrictions on the Forbes Group’s and certain future subsidiaries’ ability to incur additional debt, guarantee others’ obligations, create, incur or permit to exist certain liens on assets, make investments or acquisitions, make certain dispositions of assets, make payments on certain subordinated indebtedness, pay dividends or certain other payments to equity holders, engage in mergers, consolidations or other fundamental changes, change the nature of its business and engage in transactions with affiliates. The rights of the lender under the Credit Facility vis-à-vis the trustee and collateral agent under the indenture governing the Senior Secured Notes are governed by an intercreditor agreement among the Forbes Group, Citibank, N.A., the lender under the Credit Facility, and Wells Fargo Bank, National Association, the trustee and collateral agent under the indenture governing the Senior Secured Notes (see Note 10).
The Credit Agreement contains the following restrictive financial covenants, which provide that the Forbes Group shall not:
| • | Permit for the trailing twelve months as of the end of any fiscal quarter the ratio of Consolidated EBITDA to Consolidated Interest Expense, as both capitalized terms are defined in the Credit Agreement, to be less than 1.5 to 1.0. As of December 31, 2008 this ratio was 3.6 to 1.0. |
| • | Permit Consolidated Net Worth to be less than $63.4 million for the fiscal year ended December 31, 2008, and for each fiscal year thereafter Consolidated Net Worth to be less than $63.4 million plus 50% of Consolidated Net Income for such year, as both capitalized terms are defined in the Credit Agreement. As of December 31, 2008 the excess over the covenant was approximately $95 million. |
55
Table of Contents
Index to Financial Statements
| • | Permit the ratio of Senior Funded Debt to Consolidated Net Worth, as both capitalized terms are defined in the Credit Agreement, to be not greater than 2.5 to 1.0 for each fiscal quarter through September 30, 2008, and for fiscal quarters ending December 31, 2008 and thereafter, 2.0 to 1.0. As of December 31, 2008 this ratio was 1.3 to 1.0. |
| • | Permit the ratio of Consolidated Senior Funded Debt to Consolidated EBITDA, as both capitalized terms are defined in the Credit Agreement, to be more than 5.5 to 1.0 as of the last day of any fiscal quarter. As of December 31, 2008 this ratio was 2.2 to 1.0. |
The Credit Agreement contains a provision that makes the occurrence of any Material Adverse Change an event of default. A “Material Adverse Change” is defined in the Credit Agreement to mean a material and adverse change from the state of affairs presented in the audited December 31, 2007 (the date of the most recent audit at the time the Credit Facility was finalized) financial statements for the Forbes Group or as represented or warranted in any loan document to (a) the consolidated financial position of the Forbes Group, (b) the consolidated business, assets, operations, properties or prospects of the Forbes Group, (c) the Forbes Group’s ability to pay the obligations under the Credit Agreement or (d) the enforceability of the material terms of any material loan document against the Forbes Group. The occurrence of an event of default would allow the lender to accelerate the debt under the Credit Agreement. The Credit Agreement contains a cross-default provision that is triggered on the failure to comply with any other materially significant contract (including the indenture) if such failure is not remedied within any applicable grace period. The indenture contains a cross-default provision that is triggered on the default of any instrument evidencing or securing indebtedness (including the Credit Agreement), if that default is caused by failure to pay principal or interest prior to the expiration of any applicable grace period or if that default results in the acceleration of such indebtedness prior to its maturity, and such indebtedness, together with all other indebtedness where there has been such a default, aggregates $5.0 million or more. The Forbes Group was in compliance with the Credit Agreement or has received a waiver for all covenants as of December 31, 2008.
Significant adverse changes in our expected utilization levels and prices we are able to charge our customers could have a material adverse affect on our financial condition and results of operations and our ability to maintain future compliance with these covenants.
As of December 31, 2008, the Forbes Group had no borrowings under the Credit Facility.
| 10. | Long-Term Debt |
Long-term debt at December 31, 2008 and 2007, consisted of the following:
| Successor- Consolidated 2008 | Predecessor- Combined 2007 | |||||||||
11% Senior Secured Notes | $ | 200,762,039 | $ | — | ||||||
FNB notes | — | 72,653,530 | ||||||||
Other equipment notes | 8,185,907 | 26,080,729 | ||||||||
Insurance notes | 3,241,896 | 3,823,422 | ||||||||
Other bank financing | — | 1,675,248 | ||||||||
| 212,189,842 | 104,232,929 | |||||||||
Less: Current maturities | (6,811,802 | ) | (3,823,422 | ) | ||||||
| $ | 205,378,040 | $ | 100,409,507 | |||||||
Consolidated debt maturities for each of the next five years amount to $6.8 million, $9.7 million, $1.8 million, $2.0 million and $1.1 million.
Senior Secured Notes
On February 12, 2008, FES LLC and FES CAP issued $205.0 million in principal amount of 11% senior secured notes (the “Senior Secured Notes”). The Forbes Group reflects $200.8 million of debt outstanding in its balance sheet which recognizes the original issue discount as the Senior Secured Notes were issued at 97.635% of par. After offering expenses, the Forbes Group realized net proceeds of approximately $188.7 million which was used to repay and fully extinguish all of the Forbes Group’s outstanding long-term debt and most current maturities, in addition to outstanding equipment vendor financings that were incurred prior to the issuance. The Senior Secured Notes mature on February 15, 2015, and require semi-annual interest
56
Table of Contents
Index to Financial Statements
payments at an annual rate of 11% on February 15 and August 15 of each year until maturity, with the first payment due on August 15, 2008. No principal payments are due until maturity. The Senior Secured Notes are senior obligations and rank equally in right of payment with other existing and future senior indebtedness and senior in right of payment to any subordinated indebtedness incurred by the Forbes Group in the future.
The Senior Secured Notes are guaranteed by FES Ltd, the parent company of FES LLC and Forbes Energy Capital Inc. FES Ltd has no independent assets or operations; and all of the parent company’s other direct and indirect subsidiaries are “100% owned” and, other than the subsidiary issuers and one minor subsidiary, guarantee the securities on a “full and unconditional” and “joint and several” basis. There are no significant restrictions on FES Ltd’s ability or the ability of any guarantor to obtain funds from its subsidiaries by such means as a dividend or loan except for certain restrictions contained in the Credit Facility restricting payment of dividends by the principal operating subsidiaries.
The Forbes Group may, at its option, redeem all or part of the Senior Secured Notes from time to time at specified redemption prices and subject to certain conditions required by the indenture governing the Senior Secured Notes. The Forbes Group is required to make an offer to purchase the notes and to repurchase any notes for which the offer is accepted at 101% of their principal amount, plus accrued and unpaid interest, if there is a change of control or if the Forbes Group has excess cash flow. The Forbes Group is required to make an offer to repurchase the notes and to repurchase any notes for which the offer is accepted at 100% of their principal amount, plus accrued and unpaid interest, following certain asset sales.
The Forbes Group is permitted under the terms of the indenture to incur additional indebtedness in the future, provided that certain financial conditions set forth in the Indenture are satisfied. The Forbes Group is subject to certain covenants contained in the indenture, including provisions that limit or restrict the Forbes Group’s and certain future subsidiaries’ abilities to incur additional debt, to create, incur or permit to exist certain liens on assets, to make certain dispositions of assets, to make payments on certain subordinated indebtedness, to pay dividends or certain other payments to equity holders, to engage in mergers, consolidations or other fundamental changes, to change the nature of its business, to engage in transactions with affiliates or to make capital expenditures in excess of certain amounts based on the year in which such expenditures are made.
Details of two of the significant restrictive covenants in the indenture are set forth below:
| • | Limitation on the incurrence of additional debt - In addition to certain defined Permitted Debt, the Forbes Group may only incur additional debt if it is unsecured and if the Fixed Charge Coverage Ratio (as defined) for the most recently completed four full fiscal quarters is at least 2.5 to 1.0 until December 31, 2009, and 3.0 to 1.0 thereafter. As of December 31, 2008 the Forbes Group could incur an additional $72 million in debt. |
| • | Limitations on capital expenditures - Subject to certain adjustments, permitted Adjusted Capital Expenditures (as defined) that may be made by the Forbes Group are limited to the following amounts for the periods indicated: |
Fiscal year ending December 31, 2009 | $35 million | |
Fiscal year ending December 31, 2010 | $85 million (assessed quarterly) | |
Fiscal year ending December 31, 2011 | $115 million | |
Fiscal year ending December 31, 2012 | $135 million | |
Fiscal year ending December 31, 2013 | $135 million | |
Fiscal year ending December 31, 2014 | $150 million | |
Period ending February 15, 2015 | $ 19 million |
Plus or minus for the periods ending 2011 through 2015 an amount by which Consolidated Cash Flow (as defined) exceeds or falls short of a specified target in each case for the immediately preceding year. The specified targets are:
Fiscal year ending December 31, 2011 | $160 million | |||||
Fiscal year ending December 31, 2012 | $ 200 million | |||||
Fiscal year ending December 31, 2013 | $ 240 million | |||||
Fiscal year ending December 31, 2014 | $ 280 million | |||||
Period ending February 15, 2015 | $320 million (prorated) |
57
Table of Contents
Index to Financial Statements
For the year ended December 31, 2008, after adjusting the Company’s capital expenditure limitation to recognize the Consolidated Cash Flow adjustment referenced above, to reflect the two equity offerings and to reduce for the net loss, capital expenditures were approximately $22 million less than the capital expenditure limit.
The Forbes Group was in compliance with the indenture or has received the requisite consents as of December 31, 2008 and entered into amendments embodied in the third supplemental indenture to the indenture.
For a discussion of relevant cross-default provisions see Note 9.
First National Bank Notes
Between August 2005 and October 2007, the Forbes Group entered into a series of promissory notes with First National Bank of Edinburg (“FNB”) with aggregate original principal amounts of approximately $92.8 million. The proceeds of these notes were used for working capital and for the purchase of certain vehicles and equipment. These notes accrued interest at a rate equal to the Prime Rate plus 1% and were payable monthly. These notes have been fully repaid with a portion of the proceeds from the sale of the Senior Secured Notes.
Other Notes
Between 2004 and 2007, the Forbes Group financed the purchase of certain vehicles and equipment through commercial loans, including loans from Paccar Financial Group, with aggregate original principal amounts of approximately $189.3 million. These loans accrued interest at rates ranging from 0% to 10.9%, were payable monthly and were collateralized by certain of the Forbes Group’s equipment. These notes have been fully repaid with a portion of the proceeds from the sale of the Senior Secured Notes.
New Paccar Notes
During 2008, the Forbes Group financed the purchase of certain vehicles and equipment through commercial loans with Paccar Financial Group, in an aggregate principal amount of approximately $8.2 million, which loans are currently outstanding. These loans are repayable in 60 monthly installments with the maturity dates ranging from May 2013 to October 2013. Interest accrues at rates ranging from 7.5% to 7.6% and is payable monthly. The loans are collateralized by equipment purchased with the proceeds of such loans.
Insurance Notes
During 2008, the Forbes Group entered into a promissory note with First Insurance Funding for the payment of insurance premiums in an aggregate principal amount outstanding as of December 31, 2008 of approximately $3.2 million. This note is payable in twelve monthly installments with a maturity date of September 15, 2009. Interest accrues at the rate of 3.7% and is payable monthly. The amount outstanding could be substantially offset by the cancellation of the related insurance coverage.
| 11. | Financial Instruments |
Effective January 1, 2008, the Company adopted the SFAS No. 157, which defines fair value, establishes a framework for measuring fair value when an entity is required to use a fair value measure for recognition or disclosure purposes and expands the disclosures about fair value measurements. The initial application of FAS 157 did not affect any of the Company’s recorded assets and liabilities. Effective January 1, 2009, FAS 157 is applicable to all nonfinancial assets and liabilities that are measured at fair value.
Our financial instruments that are not recorded at fair value include accounts receivable, accounts payable, accrued liabilities, and debt. We believe the carrying value of accounts receivable, accounts payable, and accrued liabilities approximates fair value due to the short maturity of these instruments. Our fair value assessment incorporates a variety of considerations, including the short-term duration of the instruments, our credit rating, and our historical incurrence of and expected future insignificance of bad debt expense, which includes an evaluation of counterparty credit risk. The estimated fair value of our 11% Senior Secured Notes is $113.8 million based on market trading prices at December 31, 2008. The fair value of Other Equipment Notes approximates carrying value at December 31, 2008.
58
Table of Contents
Index to Financial Statements
| 12. | Related Party Transactions |
In connection with the Bermuda Reorganization each of two executive officers/directors and one additional director were paid $36 million for his or her then remaining approximately 37% of the ownership interests in FES LLC originally held by such person from proceeds of FES Ltd’s Initial Equity Offering.
The Forbes Group enters into transactions with related parties in the normal course of conducting business. Accounts Receivable–related parties and Accounts Payable–related parties result from transactions with related parties which are at terms consistent with those available to third-party customers and from third-party vendors.
Certain members of the Forbes Group are also owners and managers of Alice Environmental Services, LP (“AES”). The Forbes Group has entered into the following transactions with AES and its subsidiaries:
| • | AES, through a wholly owned subsidiary, owns and operates an oil field supply store from which the Forbes Group purchases oil field supplies. This supply store was sold to an independent third party in May 2008. |
| • | AES owns aircraft that the Forbes Group contracts to use from time to time. |
| • | The Forbes Group has also entered into long-term operating leases with AES. |
The Forbes Group recognized revenues from AES of approximately $11,000, $228,000, and $393,000, related to rig, trucking, and equipment and facilities rental activities; expenses of approximately $5.5 million, $4.3 million, and $5.3 million and capital expenditures of $2.4 million, $5.3 million and $247,000 from these transactions for the years ended December 31, 2008, 2007 and 2006 , respectively. Accounts payable to AES as of December 31, 2008 and 2007 resulting from such transactions were $106,000 and $3.2 million, respectively. During December 2008 the Forbes Group leased 10 workover rigs from AES under long-term operating leases. Accounts receivable from AES as of December 31, 2008 and 2007 resulting from such transactions were $0 and $76,000, respectively.
Dorsal Services, Inc. is a trucking service provider that provides services to the Forbes Group. One of FES Ltd’s executive officers, who also serves as a director of FES Ltd, is a partial owner of Dorsal Services, Inc. The Forbes Group recognized revenues of approximately $58,000, $61,000 and $6,000 related to trucking services, equipment rental, and wash out activities; expenses of approximately $1.4 million, $402,000 and $240,000; and capital expenditures of approximately $29,000, $194,000 and $266,000 to transactions with Dorsal Services, Inc. for the years ended December 31, 2008, 2007, and 2006, respectively. The Forbes Group had accounts receivable from and accounts payable to Dorsal Services, Inc. of $97,000 and $55,000, and $89,000 and $154,000, as of December, 2008 and 2007, respectively, resulting from such transactions.
Tasco Tool Services, Inc. is a down-hole tool company that is partially owned and managed by a company that is owned by two officers of FES Ltd. Tasco rents and sells tools to the Forbes Group from time to time. The Forbes Group had revenues from Tasco of $0, $11,000, and $0 and recognized expenses of approximately $314,000, $47,000 and $0 and capital expenditures of $50,000, $93,000 and $34,000 related to transactions with Tasco for the years ended December 31, 2008, 2007, and 2006, respectively. The Forbes Group had no accounts receivable for either period. Accounts payable to Tasco as of December 31, 2008 and 2007 were $40,000 and $60,000, respectively, resulting from these transactions.
The C.W. Hahl Lease, an oil and natural gas lease, is owned by an officer of FES Ltd. The Forbes Group recognized no revenues or expenses for the years ended December 31, 2008, 2007, and 2006 and had accounts receivable of $1,000 as of December 31, 2008 and 2007.
FCJ Management (“FCJ”) is a corporation that leases land and facilities to the Forbes Group and is owned by two of the executive officers of FES Ltd, who also serve as directors of FES Ltd, and a manager of one of the subsidiaries of FES Ltd. The Forbes Group recognized expenses of $18,000, $0 and $0 for the twelve months ended December 31, 2008, 2007, and 2006, respectively. No revenues have been recognized from FCJ for any period. The Forbes Group had no accounts receivable from FCJ or accounts payable to FCJ as of December 31, 2008 and 2007.
C&F Partners is an entity that is owned by an officer of FES Ltd. The Forbes Group recognized no revenues, expenses of $130,000, and no capital expenditures as of December 31, 2008. There was no accounts receivable balance and accounts payable were $42,000 as of December 31, 2008. The Forbes Group recognized no revenues, expenses, or capital expenditures for the periods ended December 31, 2007 and 2006.
59
Table of Contents
Index to Financial Statements
Related party long term note balances were paid in full as of February 12, 2008.
The Forbes Group rents or leases fifteen separate properties from AES for separate parcels of land and buildings. The leases were entered into at various dates subsequent to December 31, 2006. Each lease has a five-year term with the Forbes Group having the option to extend from between one and five years. Aggregate amounts paid for the fifteen rentals and leases were $0.9 million and $0.5 million for the years ended December 31, 2008 and 2007, respectively.
The Forbes Group entered into a waste water disposal operating agreement dated January 1, 2007, with AES pursuant to which AES leases its rights in a certain well bore and receives payments in the form of a minimum fee of $5,000 per month plus $0.15 per barrel for any barrel injected over 50,000 barrels. Under this agreement, AES also receives a “skim oil” payment of 20% of the amount realized by the Forbes Group for all oil and hydrocarbons removed from liquids injected into the premises. The agreement term is for three years and is renewable for successive three year terms as long as AES has rights to the well.
The Forbes Group entered into a waste water disposal lease agreement dated April 1, 2007, with AES. Under the agreement, the Forbes Group is entitled to use the leased land for the disposal of waste water for a term of five years with three successive three year renewal periods. The Forbes Group pays a monthly rental of $2,500 per month plus $.05 per barrel for any barrel over 50,000 barrels of waste water injected per month. Additionally, the Forbes Group pays an amount equal to 10% of all oil or other hydrocarbons removed from liquids injected or any skim oil.
The Forbes Group has a relationship with a bank in which the President, Chief Executive Officer, and director is also a director of the Forbes Group. As of December 31, 2008 the Forbes Group had $10.6 million on deposit with this bank.
| 13. | Commitments and Contingencies |
Concentrations of Credit Risk
Financial instruments which subject the Forbes Group to credit risk consist primarily of cash balances maintained in excess of federal depository insurance limits and trade receivables. The Forbes Group restricts investment of temporary cash investments to financial institutions with high credit standings. The Forbes Group’s customer base consists primarily of multi-national and independent oil and natural gas producers. The Forbes Group performs ongoing credit evaluations of its customers but generally does not require collateral on its trade receivables. Any concentrations of credit risk are considered by management to be limited due to the large number of customers comprising its customer base.
Major Customers
The Forbes Group had two individual customers that represented 8.5% and 8.3% of total consolidated revenues for the year ended December 31, 2008. For the year ended December 31, 2007, the Forbes Group had two individual customers that represented 11.5% and 11.0% of total combined revenues. The Forbes Group had two individual customers that represented 13% and 10% of total combined revenues for the year ended December 31, 2006.
Employee Benefit Plan
In 2005, the Forbes Group implemented a 401(k) retirement plan for substantially all of its employees based on certain eligibility requirements. The Forbes Group may provide profit sharing contributions to the plan at the discretion of management. No such discretionary contributions have been made since inception of the plan.
Self-Insurance
We are self-insured up to retention limits with regard to workers’ compensation and medical coverage of our employees. We have deductibles for workers’ compensation of $250,000 bodily injury per accident and $250,000 per each claim for disease. The medical coverage has a $125,000 deductible per individual plus a $250,000 aggregate deductible. Deductibles for automobile liability and general liability are $100,000 per occurrence. Workers’ compensation, general liability and automobile liability have an aggregate stop loss in the amount of $6,425,250. The Forbes Group has an estimated value of all unprocessed claims at December 31, 2008 and 2007 of approximately $2.0 million and $1.4 million, respectively, which are included in accrued expenses in the accompanying consolidated/combined balance sheet.
60
Table of Contents
Index to Financial Statements
Litigation
In accordance with SFAS 5, we establish a provision for a contingent liability when it is probable that a liability has been incurred and the amount is estimable. There are no pending legal proceedings, and the Forbes Group is not aware of any threatened legal proceedings, to which the Forbes Group is a party or to which its property is subject, other than proceedings that are immaterial and are in the ordinary course of business.
Leases
Future minimum lease payments under non-cancellable operating leases as of December 31, 2008 are as follows:
| Related Party | Other | Total | |||||||
2009 | $ | 4,403,020 | $ | 753,332 | $ | 5,156,352 | |||
2010 | 4,313,020 | 710,469 | 5,023,489 | ||||||
2011 | 4,023,020 | 456,152 | 4,479,172 | ||||||
2012 | 3,497,020 | — | 3,497,020 | ||||||
2013 | 2,487,764 | — | 2,487,764 | ||||||
Thereafter | — | — | — | ||||||
Total | $ | 18,723,844 | $ | 1,919,953 | $ | 20,643,797 | |||
| 14. | Supplemental Cash Flow Information |
| Years Ended December 31, | ||||||||||||
| Successor- Consolidated 2008 | Predecessor- Combined | |||||||||||
| 2007 | 2006 | |||||||||||
Cash paid for | ||||||||||||
Interest | $ | 17,026,761 | $ | 8,164,287 | $ | 4,658,661 | ||||||
Income tax | 850,000 | — | — | |||||||||
Supplemental schedule of non-cash investing and financing activities | ||||||||||||
Seller-financed purchases of property and equipment | $ | 8,185,907 | $ | 5,236,173 | $ | 2,992,404 | ||||||
Changes in accounts payable related to capital expenditures | (41,954,237 | ) | 53,771,078 | 8,953,404 | ||||||||
Note exchanged for acquisition of business | — | — | 800,000 | |||||||||
Sale of property and equipment on credit | — | — | 450,000 | |||||||||
| 15. | Income Taxes |
In conjunction with the Initial Equity Offering of FES Ltd’s common shares on May 29, 2008 and the related Bermuda Reorganization, the Forbes Group became subject to U.S. federal income tax. As part of this reorganization, $52.8 million in deferred income taxes were recorded as income tax expense in accordance with SFAS No. 109, “Accounting for Income Taxes,” which requires that the tax effect of recognizing deferred tax items upon a change in tax status be included in current year operations.
In addition, the Forbes Group is subject to the revised Texas Franchise tax. The State of Texas enacted the revised Texas Franchise Tax effective January 1, 2007. The revised Texas Franchise tax is a tax equal to one percent of Texas-sourced revenue reduced by the greater of (a) cost of goods sold (as defined by Texas law), (b) compensation (as defined by Texas law) or (c) thirty percent of the Texas-sourced revenue. The Forbes Group accounts for the revised Texas Franchise tax as an income tax in accordance with SFAS No. 109, as the tax is derived from a taxable base that consists of income less deductible expenses. For the years ended December 31, 2008 and 2007 the Forbes Group incurred current franchise tax expense of $1.0 million and $183 thousand, respectively. As of December 31, 2008 and 2007, the Forbes Group reflected on its balance sheet a franchise tax liability of $1.0 million and $183 thousand, respectively.
As a result, income tax expense for the year ended December 31, 2008 includes no current federal income tax and Texas Franchise tax of $1.0 million.
The Forbes Group was not subject to U.S. federal income tax until May 29, 2008. Prior to May 29, 2008 all income, losses, credits, and deductions of the Forbes Group were passed through to the equity owners’ individual tax returns. Accordingly, no provision for U.S. federal income taxes is included in the accompanying consolidated/combined financial statements through May 29, 2008 which is reflected as an item in our effective tax rate reconciliation of $4.8 million.
61
Table of Contents
Index to Financial Statements
A reconciliation of federal statutory income taxes to our effective tax expense follows.
The domestic and foreign components of income before income taxes were as follows:
| |||||||||||||
| 2008 | 2007 | 2006 | |||||||||||
Domestic | $ | 34,023,599 | $ | 44,276,957 | $ | 32,273,077 | |||||||
Foreign | (1,196,697 | ) | — | — | |||||||||
| $ | 32,826,902 | $ | 44,276,957 | $ | 32,273,077 | ||||||||
The components of the provision for income taxes consisted of: | |||||||||||||
Current: | |||||||||||||
Federal | $ | — | $ | — | $ | — | |||||||
State | 1,005,872 | 183,291 | — | ||||||||||
Foreign | — | — | — | ||||||||||
Total current income tax provision | 1,005,872 | 183,291 | — | ||||||||||
Deferred: | |||||||||||||
Federal | 61,425,508 | — | — | ||||||||||
State | 143,112 | 500,000 | — | ||||||||||
Foreign | — | — | — | ||||||||||
Total deferred income tax provision | 61,568,620 | 500,000 | — | ||||||||||
Total income tax provision | $ | 62,574,492 | $ | 683,291 | $ | — | |||||||
Effective Tax Rate Reconciliation | 2008 | 2007 | 2006 | ||||||||||
Income taxes at statutory rate | $ | 11,489,416 | $ | — | $ | — | |||||||
Non-deductible expenses | 324,282 | — | — | ||||||||||
State income taxes, net of federal benefit | 775,850 | 683,291 | — | ||||||||||
Change in deferred tax valuation allowance | 335,075 | — | — | ||||||||||
Deferred taxes due to change in tax status | 52,835,075 | — | — | ||||||||||
Foreign rate difference | 83,768 | ||||||||||||
Goodwill Impairment | 1,527,179 | ||||||||||||
Tax pass through entity earnings | (4,796,153 | ) | — | — | |||||||||
| $ | 62,574,492 | $ | 683,291 | $ | — | ||||||||
At December 31, significant components of our deferred tax assets and liabilities were:
| |||||||||||||
| 2008 | 2007 | 2006 | |||||||||||
Deferred tax assets: | |||||||||||||
Net operating loss carryforwards | $ | 9,643,434 | $ | — | $ | — | |||||||
Other | 547,748 | — | — | ||||||||||
Total deferred tax assets | 10,191,182 | — | — | ||||||||||
Valuation allowance for deferred tax assets | (335,075 | ) | — | — | |||||||||
Deferred tax liabilities: | |||||||||||||
Tax over book depreciation | (58,127,316 | ) | (500,000 | ) | — | ||||||||
Intangible assets | (13,797,411 | ) | — | — | |||||||||
Total deferred tax liabilities | (71,924,727 | ) | (500,000 | ) | �� | ||||||||
Net deferred tax liabilities | $ | (62,068,620 | ) | $ | (500,000 | ) | $ | — | |||||
We had a U.S. net operating loss carryforward at December 31, 2008 of approximately $26.5 million which is subject to expiration in 2028. Realization of deferred tax assets associated with net operating loss carryforwards is dependent upon generating sufficient taxable income in the appropriate jurisdiction prior to their expiration. Management believes it is more likely than not that the U.S. deferred tax asset will be realized through future taxable income or reversal of temporary differences. Additionally, at December 31, 2008 we had a Mexico net operation loss carryforward of approximately $1.2 million. We have provided a full valuation allowance against the Mexico deferred tax asset, as we have concluded that due to the start up nature of the business and not having an operating history that it is more likely than not that our net deferred tax asset in Mexico will not be realized.
In July 2006, the Financial Accounting Standards Board (FASB) issued FASB Interpretation No. 48, “Accounting for Uncertainty in Income Taxes—an interpretation of FASB Statement No. 109” (FIN 48), which clarifies the accounting and disclosure for uncertainty in tax positions, as defined. FIN 48 seeks to reduce the diversity in practice associated with certain aspects of the recognition and measurement related to accounting for income taxes. The Company is subject to the provisions of FIN 48 after June 27, 2008 when it became subject to filing under the Securities Exchange Act of 1934. Prior to that date, the entity was a flow-through entity for tax purposes; therefore, the former owners are responsible for any tax adjustments related to prior years, although Management believes no uncertainties exist related to those prior years. The Forbes Group has analyzed filing positions in all of the federal and state jurisdictions where it is required to file income tax returns and is unaware of any uncertain tax positions. The Company files tax returns in the U.S., Texas, and Mexico. The Forbes Group became subject to federal income taxes on May 29, 2008 and has not yet been required to file a federal income tax return. Therefore, no reserves for uncertain income tax positions have been recorded pursuant to FIN 48. In addition, the Company was not required to record a cumulative effect adjustment related to the adoption of FIN 48.
The Company’s policy for recording interest and penalties associated with uncertain tax positions is to record such items as a component of tax expense.
62
Table of Contents
Index to Financial Statements
| 16. | Earning/(Loss) per Share |
The Forbes Group presents earnings per share information in accordance with the provisions of Statement of Financial Accounting Standards No. 128, “Earnings per Share” (“SFAS No. 128”). Under SFAS No. 128, basic earnings per common share are determined by dividing net earnings applicable to common stock by the weighted average number of common shares actually outstanding during the year. Because Class B shares are convertible into common shares at any time, they are considered common shares for purposes of calculating earning (loss) per share. Diluted earnings per common share is computed by dividing net income by the weighted. average number of common shares outstanding during the period plus the number of shares subject to potentially dilutive common stock equivalents. There are no dilutive common stock equivalents at December 31, 2008. Potential common stock equivalents that have been issued by the Forbes Group relate to outstanding stock options and are determined using the treasury stock method. The Forbes Group reported a net loss as of December 31, 2008, thus diluted earnings per share has been computed in the same manner as basic earnings per share.
Concurrent with the Equity Offering on May 29, 2008, we began conducting our business through, a newly formed Bermuda corporation and holding company. Historical net income per share was not presented for 2007 and prior since we were structured as a limited liability company, had limited member units and there were no ownership interests that were convertible into common stock or a common stock equivalent. The unaudited pro forma net income per share gives effect to the Bermuda Reorganization pursuant to which we changed from a flow through entity for federal income tax purposes to a “C” corporation, the issuance of our common stock in connection with our Initial Equity Offering on May 29, 2008, and an assumed effective tax rate of 37%, as though the Bermuda Reorganization and Initial Equity Offering had occurred on January 1, 2008, January 1, 2007, and January 1, 2006, respectively.
All outstanding options have been excluded from the diluted computations as they were antidilutive for all periods presented.
The following table sets forth the computation of basic and diluted earnings per share:
| Year Ended December 31, | ||||||||||||
| Successor | Predecessor | |||||||||||
| 2008 | 2007 | 2006 | ||||||||||
Basic: | ||||||||||||
Net loss | $ | (29,747,590 | ) | |||||||||
Weighted-average common shares | 45,894,557 | |||||||||||
Basic loss per share | $ | (0.65 | ) | |||||||||
Diluted: | ||||||||||||
Net loss | $ | (29,747,590 | ) | |||||||||
Weighted-average common shares | 45,894,557 | |||||||||||
Dilutive effect of stock options | — | |||||||||||
Weighted-average common shares - diluted | 45,894,557 | |||||||||||
Diluted loss per share | $ | (0.65 | ) | |||||||||
The following table sets forth the computation of unaudited pro forma basic and diluted earnings per share:
| ||||||||||||
| Pro Forma | ||||||||||||
Basic: | ||||||||||||
Net income | $ | 20,680,948 | $ | 28,335,883 | $ | 20,977,500 | ||||||
Weighted-average common shares | 55,994,843 | 54,144,700 | 54,144,700 | |||||||||
Basic earnings per share | $ | 0.37 | $ | 0.52 | $ | 0.39 | ||||||
Diluted: | ||||||||||||
Net income | $ | 20,680,948 | $ | 28,335,883 | $ | 20,977,500 | ||||||
Weighted-average common shares | 55,994,843 | 54,144,700 | 54,144,700 | |||||||||
Dilutive effect of stock options | — | — | — | |||||||||
Weighted-average common shares - diluted | 55,994,843 | 54,144,700 | 54,144,700 | |||||||||
Diluted earnings per share | $ | 0.37 | $ | 0.52 | $ | 0.39 | ||||||
| 17. | Business Segment Information |
The Forbes Group has determined that it has two reportable segments organized based on its products and services—well servicing and fluid logistics. The accounting policies of the segments are the same as those described in the summary of significant accounting policies in Note 4 hereof.
Well Servicing
The well servicing segment consists of operations in the U.S., which provide (i) well maintenance, including remedial repairs and removal and replacement of downhole production equipment, (ii) well workovers, including significant downhole repairs, re-completions and re-perforations, (iii) completion and swabbing activities, (iv) plugging and abandoning services and (v) pressure testing of oil and natural gas production tubing.
63
Table of Contents
Index to Financial Statements
Fluid Logistics
The fluid logistics segment consists of operations in the U.S., which provide, transport, store and dispose of a variety of drilling and produced fluids used in and generated by oil and natural gas production activities. These services are required in most workover and completion projects and are routinely used in daily producing well operations.
The following table sets forth certain financial information with respect to Forbes Group’s reportable segments (amounts in 000’s):
| Well Servicing | Fluid Logistics | Total | |||||||
Year Ended December 31, 2008 Successor – Consolidated | |||||||||
Operating revenues | $ | 189,980 | $ | 170,949 | $ | 360,929 | |||
Direct operating costs | 128,615 | 117,940 | 246,555 | ||||||
Segment profits | $ | 61,365 | $ | 53,009 | $ | 114,374 | |||
Depreciation and amortization | $ | 18,253 | $ | 15,471 | $ | 33,724 | |||
Capital expenditures | 106,016 | 36,017 | 142,033 | ||||||
Total assets | 294,352 | 188,449 | 482,801 | ||||||
Year Ended December 31, 2007 Predecessor – Combined | |||||||||
Operating revenues | $ | 103,601 | $ | 103,405 | $ | 207,006 | |||
Direct operating costs | 60,570 | 69,887 | 130,457 | ||||||
Segment profits | $ | 43,031 | $ | 33,518 | $ | 76,549 | |||
Depreciation and amortization | $ | 9,411 | $ | 5,931 | $ | 15,342 | |||
Capital expenditures | 91,860 | 35,548 | 127,408 | ||||||
Total assets | 181,512 | 86,103 | 267,615 | ||||||
Year Ended December 31, 2006 Predecessor – Combined | |||||||||
Operating revenues | $ | 58,575 | $ | 74,140 | $ | 132,715 | |||
Direct operating costs | 32,453 | 49,620 | 82,073 | ||||||
Segment profits | $ | 26,122 | $ | 24,520 | $ | 50,642 | |||
Depreciation and amortization | $ | 4,213 | $ | 3,196 | $ | 7,409 | |||
Capital expenditures | 36,529 | 16,889 | 53,418 | ||||||
Total assets | 87,937 | 51,217 | 139,154 | ||||||
Reconciliation of Forbes Group Operating Income As Reported: | Year Ended December 31, | |||||||||||
| 2008 | 2007 | 2006 | ||||||||||
Segment profits | $ | 114,374 | $ | 76,549 | $ | 50,642 | ||||||
General and administrative expense | 17,700 | 8,824 | 6,026 | |||||||||
Depreciation and amortization | 33,724 | 15,342 | 7,409 | |||||||||
Goodwill impairment | 4,364 | — | — | |||||||||
Operating income | 58,587 | 52,383 | 37,207 | |||||||||
Other income and expenses, net | (25,760 | ) | (8,106 | ) | (4,934 | ) | ||||||
Income before income taxes | $ | 32,827 | $ | 44,277 | $ | 32,273 | ||||||
Reconciliation of the Forbes Group Assets as Reported | Year Ended December 31, | |||||||||||
| 2008 | 2007 | 2006 | ||||||||||
Total reportable segments | $ | 469,286 | $ | 267,615 | $ | 139,154 | ||||||
Elimination of Internal transaction | (405,882 | ) | (7,620 | ) | (10,636 | ) | ||||||
Parent | 419,398 | — | — | |||||||||
Total assets | $ | 482,801 | $ | 259,995 | $ | 128,518 | ||||||
64
Table of Contents
Index to Financial Statements
| 18. | Supplemental Financial Information |
Quarterly Financial Data (Unaudited)
| Quarter Ended March 31, 2008 | Quarter Ended June 30, 2008 | Quarter Ended September 30, 2008 | Quarter Ended December 31, 2008 | |||||||||||
Revenues | $ | 70,522,859 | $ | 88,601,191 | $ | 105,145,388 | $ | 96,659,863 | ||||||
Operating income | 13,640,490 | 18,280,383 | 19,870,511 | 6,795,235 | ||||||||||
Net income (loss) | 7,522,898 | (43,212,011 | )(1) | 8,273,355 | (2,331,832 | )(2) | ||||||||
Earnings (loss) per share: (3) | ||||||||||||||
Basic | $ | (1.13 | ) | $ | 0.15 | $ | (.04 | ) | ||||||
Diluted | (1.13 | ) | 0.15 | $ | (.04 | ) | ||||||||
| Quarter Ended March 31, 2007 | Quarter Ended June 30, 2007 | Quarter Ended September 30, 2007 | Quarter Ended December 31, 2007 | |||||||||||
Revenues | $ | 42,051,629 | $ | 46,749,393 | $ | 55,838,888 | $ | 62,366,505 | ||||||
Operating income | 13,443,051 | 13,297,554 | 14,281,069 | 11,361,351 | ||||||||||
Net income (loss) | 11,659,820 | 11,528,854 | 12,279,735 | 8,125,257 | ||||||||||
| (1) | On May 29, 2008, in connection with the Bermuda Reorganization, the Forbes Group became a taxable entity, which resulted in $52.8 million of the 2008 income tax expensethat was recorded as a one-time, deferred income tax charge to recognize the conversion to a taxable entity. Prior to that time, the entities comprising the Forbes Group were flow through entities for federal income tax purposes and the only tax obligations of the entity were the Texas margin tax which was applicable after June 29, 2007. |
| (2) | As of December 31, 2008 the Forbes Group performed its annual impairment test on goodwill, and recorded an impairment charge of $4.4 million in the fourth quarter of 2008. |
| (3) | Concurrent with the Initial Equity Offering on May 29, 2008, we began conducting our business through a newly formed Bermuda corporation and holding company. Historically, net income per share was not presented for the quarter ended March 31, 2008 and prior since we were structured as a limited liability company with a limited number of members. |
Restatement
Subsequent to the issuance of our consolidated financial statements for the quarters ended March 31, June 30, and September 30, 2008, we determined that those financial statements included errors relating to goodwill, classification of accounts within stockholders’ equity, and income tax accounting. In connection with the Delaware Reorganization effective January 1, 2008, an error was made in the application of purchase accounting that resulted in an overstatement of goodwill and an overstatement of members/shareholders’ of $30.1 million and the classification of accounts within stockholders’ equity. In connection with the Bermuda Reorganization effective on May 29, 2008, an additional error was made in the calculation of income tax expense and deferred income taxes in the amount of $7.6 million. As a result, we are restating our unaudited condensed consolidated financial statements for the quarters ended March 31, June 30 and September 30, 2008 to correct these three accounting errors, as follows:
| March 31, 2008 Three months | June 30, 2008 Three months | September 30, 2008 Three months | ||||||||||
Goodwill, as previously reported | $ | 32,597,846 | $ | 32,597,846 | $ | 32,597,846 | ||||||
Restated adjustment | $ | (28,234,477 | ) | $ | (28,234,477 | ) | $ | (28,234,477 | ) | |||
Goodwill, as restated | $ | 4,363,369 | $ | 4,363,369 | $ | 4,363,369 | ||||||
Property and equipment, as previously reported | $ | 262,400,743 | $ | 301,468,972 | $ | 337,249,208 | ||||||
Restatement adjustment | $ | (1,788,779 | ) | $ | (1,706,762 | ) | $ | (1,624,745 | ) | |||
Property and equipment, as restated | $ | 260,611,964 | $ | 299,762,210 | $ | 335,624,463 | ||||||
65
Table of Contents
Index to Financial Statements
Total assets, as previously reported | $ | 416,719,875 | $ | 467,503,900 | $ | 518,594,889 | ||||||
Restatement adjustment | $ | (30,023,256 | ) | $ | (29,941,239 | ) | $ | (29,859,222 | ) | |||
Total assets, as restated | $ | 386,696,619 | $ | 437,562,661 | $ | 488,735,667 | ||||||
Deferred income tax liability, as previously reported | — | $ | 47,168,743 | $ | 47,828,963 | |||||||
Restatement adjustment | — | $ | 7,697,551 | $ | 11,746,797 | |||||||
Deferred income tax liability, as restated | — | $ | 54,866,294 | $ | 59,575,760 | |||||||
Additional paid-in capital, as previously reported | — | $ | 39,964,703 | $ | 40,617,901 | |||||||
Restatement adjustment | — | $ | 95,702,812 | $ | 95,702,812 | |||||||
Additional paid-in capital, as restated | — | $ | 135,667,515 | $ | 136,320,713 | |||||||
Members’ equity, as previously reported | $ | 165,915,147 | — | — | ||||||||
Restatement adjustment | $ | (30,023,256 | ) | — | — | |||||||
Members’ equity, as restated | $ | 135,891,891 | — | — | ||||||||
Retained earnings, as previously reported | — | $ | 118,400,050 | $ | 126,729,657 | |||||||
Restatement adjustment | — | $ | 133,220,253 | $ | (133,276,505 | ) | ||||||
Retained earnings (accumulated deficit), as restated | — | $ | (14,820,203 | ) | $ | (6,546,848 | ) | |||||
Total shareholders’ equity, as previously reported | — | $ | 158,906,200 | $ | 167,889,005 | |||||||
Restatement adjustment | — | $ | (37,517,441 | ) | $ | (37,573,693 | ) | |||||
Total shareholders’ equity, as restated | — | $ | 121,388,759 | $ | 130,315,312 | |||||||
Depreciation and amortization, as previously reported | $ | 7,122,040 | $ | 7,513,098 | $ | 9,157,283 | ||||||
Restatement adjustment | $ | (82,017 | ) | $ | (82,017 | ) | $ | (82,017 | ) | |||
Depreciation and amortization, as restated | $ | 7,040,023 | $ | 7,431,081 | $ | 9,075,266 | ||||||
Income tax expense, as previously reported | $ | 172,000 | $ | 47,409,217 | $ | 4,928,570 | ||||||
Restatement adjustment | $ | — | $ | 7,576,202 | $ | 138,269 | ||||||
Income tax expense, as restated | $ | 172,000 | $ | 54,985,419 | $ | 5,066,839 | ||||||
Net Income (loss), as previously reported | $ | 7,440,881 | $ | (35,717,826 | ) | $ | 8,329,607 | |||||
Restatement adjustment | $ | 82,017 | $ | (7,494,185 | ) | $ | (56252 | ) | ||||
Net income (loss), as restated | $ | 7,522,898 | $ | (43,212,011 | ) | $ | 8,273,355 | |||||
Earnings (loss) per share of common stock, basic and diluted, as previously reported | — | $ | (0.94 | ) | $ | 0.15 | ||||||
Restatement adjustment | — | $ | (.19 | ) | $ | — | ||||||
Earnings (loss) per share of common stock, basic and diluted, as restated | — | $ | (1.13 | ) | $ | 0.15 | ||||||
| 19. | Subsequent Events |
We entered into the Third Supplemental Indenture, dated as of February 6, 2009 (the “Third Supplemental Indenture”), to the indenture governing the Senior Secured Notes (the “Indenture”), with Wells Fargo Bank, National Association, as trustee (the “Trustee”) and certain subsidiary guarantors named therein after receiving the requisite number of consents from the holders of the Senior Secured Notes. The Third Supplemental Indenture amends the definition of Net Income (as defined in the Indenture) to provide for the exclusion, in certain circumstances, of certain non-cash charges for impairment writedowns or writeoffs of noncurrent assets and extraordinary, unusual or nonrecurring non-cash charges. Additionally, the Third Supplemental Indenture amends the Indenture to (i) make the Limitation on Capital Expenditures covenant more restrictive on us, (ii) require us during the first quarter of 2009 to spend an aggregate of $2.0 million to repurchase Senior Secured Notes and by the end of the second quarter of 2010, to spend an additional aggregate of $8 million in cash to repurchase Senior Secured Notes, in each case on specified terms and conditions and (iii) restrict our ability to incur any additional Indebtedness (as defined in the Indenture and including Additional Notes, which essentially means additional Notes issued under the Indenture or so-called “tack-on” notes) under the Fixed Charge Coverage Ratio test contained in Section 4.14(a) of the Limitation on the Incurrence of Indebtedness and Issuance of Preferred Stock covenant (“ratio debt”) that is secured by any of our assets or property or those of our subsidiaries.
On March 30, 2008, the Forbes Group received a consent, waiver and acknowledgement from Citibank, N.A. for the following loan covenants as of December 31, 2008; (1) the requirement to furnish to Citibank for the fiscal year ended 2008 an opinion from an independent certified public accounting firm assessing the Company’s internal controls and stating that there exists no material weakness except those to which Citibank does not object or which have been disclosed in the Credit Agreement, (2) the requirement to furnish to Citibank financial statements 45 days after each fiscal quarter ended in 2008 and 90 days after the fiscal year ended 2008 as long as the Company provides such financial statements within the SEC deadlines, including any extensions available thereunder, for the relevant Form 10-Q or form 10-K, (3) the requirement to furnish to Citibank consolidating financial statements for all periods ended in 2008, and (4) the presence of the material weaknesses set forth in the Company’s 8-K filed on March 23, 2009. Citibank, N.A. also authorized a sale/lease-back transaction as long as it complies with the terms of the Indenture.
66
Table of Contents
Index to Financial Statements
| Item 9. | Changes in Disagreements with Accountants on Accounting and Financial Disclosure |
This information was previously reported in our registration statement on Form S-4, as amended (Registration No. 333-150853), and, therefore, is not required to be reported here pursuant to Instruction 1 of Item 304 of Reg. S-K.
| Item 9A. | Controls and Procedures |
Evaluation of Disclosure Controls and Procedures
Our management, with the participation of our chief executive officer and chief financial officer, evaluated the effectiveness of our disclosure controls and procedures as of December 31, 2008. The term “disclosure controls and procedures,” as defined in Rules 13a-15(e) and 15d-15(e) under the Securities Exchange Act of 1934, as amended (“Exchange Act”), means controls and other procedures of a company that are designed to ensure that information required to be disclosed by a company in the reports that it files or submits under the Exchange Act is recorded, processed, summarized and reported, within the time periods specified in the Commission’s rules and forms. Disclosure controls and procedures include, without limitation, controls and procedures designed to ensure that information required to be disclosed by a company in the reports that it files or submits under the Exchange Act is accumulated and communicated to the company’s management, including its principal executive and principal financial officers, as appropriate to allow timely decisions regarding required disclosure. Management recognizes that any controls and procedures, no matter how well designed and operated, can provide only reasonable assurance of achieving their objectives and management necessarily applies its judgment in evaluating the cost-benefit relationship of possible controls and procedures. Based on the evaluation of our disclosure controls and procedures as of December 31, 2008, our chief executive officer and chief financial officer concluded that, as of such date, our disclosure controls and procedures were not effective. See “Material Weaknesses” below.
Changes in Internal Control over Financial Reporting, including Remediation of Certain Material Weaknesses
A material weakness is a control deficiency, or combination of control deficiencies, that results in more than a remote likelihood that a material misstatement of the annual or interim financial statements will not be prevented or detected. We had identified various material weaknesses as of December 31, 2007 primarily related to internal accounting controls. We believe that many of these were attributable to our transition from a private company to a public reporting company. In connection with the preparation of our consolidated financial statements as of and for the year ended December 31, 2008 included in this Form 10-K and our assessment of the effectiveness of our disclosure controls and procedures, we have concluded that we successfully remediated the following specific control deficiencies, which represented material weaknesses in our internal control over financial reporting as of September 30, 2008:
| • | Prior to our effective remediation, we did not maintain effective controls over the recording of period-end adjustments and accruals necessary to ensure the completeness, accuracy and valuation of the combined accounts. |
| • | Prior to our effective remediation, we did not maintain effective controls over revenue. Specifically, we did not maintain effective controls over the cut-off and completeness of unbilled fluid logistics revenue and associated accounts receivable. This control deficiency resulted in a prior restatement of the Forbes Group’s 2005 and 2006 combined financial statements. |
| • | Prior to our effective remediation, we did not maintain effective control over accounts payable. Specifically, we did not maintain effective controls over cut-off and completeness of accounts payable and associated expenses and capital expenditures. |
| • | Prior to our effective remediation, we did not maintain effective control over recording of invoices to the proper accounts in the general ledger, including the determination of capital and expense items. |
| • | Prior to our effective remediation, we did not maintain effective control over “OTE” (Accounting for Out of Town Expenses) income statement account as it did not reconcile OTE reimbursement activity with the detailed supporting documentation in a timely manner. |
67
Table of Contents
Index to Financial Statements
| • | Prior to our effective remediation, we did not maintain effective control over unissued checks as there were numerous check numbers omitted from the 2008 C.C. Forbes, LLC disbursements listing as a consequence of insufficient control in distributing checks in addition to lack of support for voided checks. |
| • | Prior to our effective remediation, we did not maintain effective control over accrual of the liability for health insurance and workers’ compensation expense, as it did not consider all relevant information to assist it in estimating the level of accrual required relating to the incurred but not reported component of the health insurance and workers’ compensation expense. |
On July 1, 2008, we substantially completed the basic conversion to a new accounting system, which is used to perform certain accounting and financial reporting functions. In connection with the system conversion, internal controls and procedures have been modified as necessary to reflect the new system environment; however, we believe certain financial reporting controls have not been remediated solely as a result of the conversion. Other than these changes and the remediation measures described in this section, no change in our internal control over financial reporting (as defined in Rules 13a-15(f) and 15d-15(f) under the Exchange Act) occurred during the fiscal year ended December 31, 2008 that has materially affected, or is reasonably likely to materially affect, our internal control over financial reporting.
This annual report does not include a report of management’s assessment regarding internal control over financial reporting or an attestation report of our independent registered public accounting firm due to a transition period established by rules of the Securities and Exchange Commission for newly public companies.
Material Weaknesses
In connection with the preparation of the Forbes Group’s consolidated financial statements for the year ended December 31, 2008, we identified control deficiencies that constitute material weaknesses in the design and operation of our internal control over financial reporting. The following material weaknesses were present at December 31, 2008.
| • | We did not maintain an appropriate accounting and financial reporting organizational structure to support the activities of the Forbes Group. Specifically, we did not maintain a sufficient complement of personnel with an appropriate level of accounting knowledge, experience and training to ensure the proper selection, application and implementation of GAAP. |
| • | We did not maintain effective controls over the preparation and review of the combined financial statements and disclosures. Specifically, effective controls were not designed and in place around the oversight and review of the consolidated financial statements and disclosures. |
| • | We did not design or maintain effective controls over purchase accounting. Specifically, we did not design and maintain effective controls over the accuracy and completeness of the purchase price allocation associated with the January 1, 2008 Delaware Reorganization. This material weakness resulted in the requirement to restate the Company’s unaudited condensed consolidated financial statements issued and filed for the quarters ended June 30, 2008 and September 30, 2008 (as well as the issued but unfiled financial statements for the quarter ended March 31, 2008). |
| • | We did not design and maintain effective controls over the review of the accuracy and completeness of the income tax provision. This material weakness resulted in the requirement to restate the Company’s unaudited condensed consolidated financial statements issued and filed for the quarters ended June 30, 2008 and September 30, 2008. |
These control deficiencies could result in a future material misstatement to substantially all the accounts and disclosures that would result in a material misstatement to the annual or interim combined financial statements that would not be prevented or detected. Accordingly, we have determined that each of the above control deficiencies represents a material weakness.
68
Table of Contents
Index to Financial Statements
Remediation
As mentioned above, we have identified certain material weaknesses that exist as of December 31, 2008 in our internal control over external financial reporting and complex, non-routine accounting issues.
We have implemented, or are in the process of implementing and continue to implement, remedial measures to address the above deficiencies on a going-forward basis. Specifically, in mid-2007 we hired a chief financial officer. In early 2008, we hired a controller and accounting staff, and in mid-2008, established our audit committee. In 2009, in response to the requirement to restate quarterly financial statements for the first, second, and third quarters of 2008 referred to in this Annual Report on Form 10-K, we engaged a professional services firm to assist our accounting staff with external financial reporting and complex, non-routine accounting issues.
We believe that certain material weaknesses that existed at December 31, 2007, as reflected in our Form 10-K for the year ended December 31, 2007 and subsequent filings, have been remediated. These material weaknesses primarily related to internal accounting controls and include controls over recording period end adjustments, controls over revenue, controls over accounts payable, controls over recording invoices to the proper accounts, controls over out-of-town expenses, controls over un-issued checks, and controls over accrual of liability for insurance expense. These material weaknesses were remediated through the measures taken above, through reorganization of the accounting department, and through engagement of a professional services firm which assessed our systems and controls, documented our systems and controls, then implemented the processes and controls necessary to address these material weaknesses. On a going-forward basis this firm will provide a periodic internal audit function.
Beginning with the year ending December 31, 2009, pursuant to Section 404 of the Sarbanes-Oxley Act, we will be required to deliver a report that assesses the effectiveness of our internal control over financial reporting, and our auditors will be required to audit and report on our assessment of and the effectiveness of our internal control over financial reporting. We have a substantial effort ahead of us to complete the documentation and testing of our internal control over financial reporting and remediate any additional material weaknesses identified during that activity. We may not be able to complete the required management assessment by our reporting deadline. An inability to complete this assessment would result in receiving something other than an unqualified report from our auditors with respect to our assessment of our internal control over financial reporting. In addition, if material weaknesses are not remediated, we would not be able to conclude that our internal control over financial reporting was effective, which would result in the inability of our external auditors to deliver an unqualified report on the effectiveness of our internal control over financial reporting.
| Item 9B. | Other Information |
None.
69
Table of Contents
Index to Financial Statements
| Item 10. | Directors, Executive Officers and Corporate Governance |
The information required under this item will be filed in a Form 10-K/A within 120 days after December 31, 2008 pursuant to General Instruction G(3) of Form 10-K.
| Item 11. | Executive Compensation |
The information required under this item will be filed in a Form 10-K/A within 120 days after December 31, 2008 pursuant to General Instruction G(3) of Form 10-K.
| Item 12. | Security Ownership of Certain Beneficial Owners and Management and Related Stockholder Matters |
The information required under this item will be filed in a Form 10-K/A within 120 days after December 31, 2008 pursuant to General Instruction G(3) of Form 10-K.
| Item 13. | Certain Relationships and Related Transaction, and Director Independence |
The information required under this item will be filed in a Form 10-K/A within 120 days after December 31, 2008 pursuant to General Instruction G(3) of Form 10-K.
| Item 14. | Principal Accounting Fees and Services |
The information required under this item will be filed in a Form 10-K/A within 120 days after December 31, 2008 pursuant to General Instruction G(3) of Form 10-K.
70
Table of Contents
Index to Financial Statements
| Item 15. | Exhibits, Financial Statement Schedules |
| (a) | The following items are filed as part of this report: |
| 1. | Financial Statements. The financial statements and information required by Item 8 appear on pages 39 through 66 of this report. The Index to Consolidated Financial Statements appears on page 40. |
| 2. | Financial Statement Schedules. All schedules are omitted because they are not applicable or the required information is shown in the financial statements or the notes thereto. |
| 3. | Exhibits. |
Number | Description of Exhibits | |||
| 2.1 | — | Agreement and Plan of Reorganization effective January 1, 2008 among Forbes Energy Services LLC and the respective members of C.C. Forbes, LLC, TX Energy Services, LLC and Superior Tubing Testers, LLC (incorporated by reference to Exhibit 2.1 to the Company’s Form S-4/A filed June 27, 2008, Registration No. 333-150853). | ||
| 2.2 | — | Agreement and Plan of Reorganization effective May 29, 2008 among Forbes Energy Services Ltd. and the members of Forbes Energy Services LLC (incorporated by reference to Exhibit 2.2 to the Company’s Form S-4/A filed June 27, 2008, Registration No. 333-150853). | ||
| 3.1 | — | Memorandum of Association of Forbes Energy Services Ltd. (incorporated by reference to Exhibit 3.11 to the Company’s Form S-4/A filed June 27, 2008, Registration No. 333-150853). | ||
| 3.2 | — | Amended and Restated Bye-laws of Forbes Energy Services Ltd. (incorporated by reference to Exhibit 3.12 to the Company’s Form S-4/A filed June 27, 2008, Registration No. 333-150853). | ||
| 4.1* | — | Indenture, dated February 12, 2008 among Forbes Energy Services LLC and Forbes Energy Capital Inc., as issuers, the guarantors party thereto and Wells Fargo Bank, National Association, as trustee. | ||
| 4.2 | — | Supplemental Indenture (First Supplemental Indenture), dated May 29, 2008 among Forbes Energy Services Ltd., Forbes Energy Services LLC, Forbes Energy Capital Inc., the other Guarantors (as defined in the Indenture referred to therein) and Wells Fargo Bank, National Association, as trustee (incorporated by reference to Exhibit 4.2 to the Company’s Quarterly Report on Form 10-Q for the quarter ended June 30, 2008). | ||
| 4.3* | — | Supplemental Indenture (Second Supplemental Indenture), dated effective October 6, 2008 among Forbes Energy Services Ltd., Forbes Energy Services LLC, Forbes Energy Capital Inc., Forbes Energy International, LLC, the other Guarantors (as defined in the Indenture referred to therein) and Wells Fargo Bank, National Association, as trustee. | ||
| 4.4 | — | Third Supplemental Indenture, dated February 6, 2009 among Forbes Energy Services Ltd., Forbes Energy Services LLC, Forbes Energy Capital Inc., Forbes Energy International, LLC and the other Guarantors (as defined in the Indenture referred to therein) and Wells Fargo Bank, National Association, as trustee (incorporated by reference to Exhibit 4.1 to the Company’s Current Report on Form 8-K dated February 6, 2009). | ||
| 4.5* | — | Notation of Guarantee from Forbes Energy Services Ltd. | ||
| 4.6* | — | Notation of Guarantee from Forbes Energy International, LLC. | ||
| 4.7* | — | Registration Rights Agreement, dated as of February 7, 2008, among Jefferies & Company, Inc., Forbes Energy Services Inc., Forbes Energy Capital Inc. and the guarantors party thereto. | ||
| 4.8 | — | Specimen 144A Global 11% Senior Secured Exchange Note due 2015 (incorporated by reference to Exhibit 4.5 to the Company’s Form S-4/A filed June 27, 2008, Registration No. 333-150853). | ||
71
Table of Contents
Index to Financial Statements
Number | Description of Exhibits | |||
| 4.9 | — | Rights Agreement effective May 19, 2008 between Forbes Energy Services Ltd. and CIBC Mellon Trust Company, as Rights Agent, which includes as Exhibit A the Certificate of Designations of Series A Junior Participating Preferred Shares, as Exhibit B the form of Right Certificate and as Exhibit C the form of Summary of Rights to Purchase Shares (incorporated by reference to Exhibit 4.8 to the Company’s Form S-4/A filed June 27, 2008, Registration No. 333-150853). | ||
| 10.1* | — | Credit Agreement dated April 10, 2008 among C.C. Forbes, LLC, TX Energy Services, LLC and Superior Tubing Testers, LLC, as borrowers, Forbes Energy Services LLC, as guarantor, and Citibank, N.A., as lender, governing the Credit Facility. | ||
| 10.2* | — | Intercreditor Agreement dated April 10, 2008 among C.C. Forbes, LLC, TX Energy Services, LLC, Superior Tubing Testers, LLC, as borrowers, Forbes Energy Services LLC and Forbes Energy Capital Inc., as issuers, Citibank, N.A. and Wells Fargo Bank, National Association. | ||
| 10.3 | — | Forbes Energy Services Ltd. Incentive Compensation Plan effective May 19, 2008 (incorporated by reference to Exhibit 10.1 to the Company’s Form S-4/A filed June 27, 2008, Registration No. 333-150853). | ||
| 10.4 | — | Employment Agreement effective May 1, 2008 by and between John E. Crisp and Forbes Energy Services LLC (incorporated by reference to Exhibit 10.2 to the Company’s Form S-4/A filed June 27, 2008, Registration No. 333-150853). | ||
| 10.5 | — | Employment Agreement effective May 1, 2008 by and between Charles C. Forbes and Forbes Energy Services LLC (incorporated by reference to Exhibit 10.3 to the Company’s Form S-4/A filed June 27, 2008, Registration No. 333-150853). | ||
| 10.6 | — | Employment Agreement effective May 1, 2008 by and between L. Melvin Cooper and Forbes Energy Services LLC (incorporated by reference to Exhibit 10.4 to the Company’s Form S-4/A filed June 27, 2008, Registration No. 333-150853). | ||
| 10.7 | — | Form of Indemnification Agreement for directors, officers and key employees (incorporated by reference to Exhibit 10.5 to the Company’s Form S-4/A filed June 27, 2008, Registration No. 333-150853). | ||
| 10.8 | — | Form of Executive Non-Qualified Stock Option Agreement (incorporated by reference to Exhibit 10.6 to the Company’s Form S-4/A filed June 27, 2008, Registration No. 333-150853). | ||
| 10.9 | — | Form of Director Non-Qualified Stock Option Agreement (incorporated by reference to Exhibit 10.7 to the Company’s Form S-4/A filed June 27, 2008, Registration No. 333-150853). | ||
| 10.10 | Commercial Equipment Lease Agreement, dated October 15, 2008 among Forbes Energy Services LLC and Alice Environmental Services, LP. (incorporated by reference to Exhibit 10.1 to the Company’s Quarterly Report on Form 10-Q for the quarter ended September 30, 2008). | |||
| 21.1* | Subsidiaries of the Company. | |||
| 31.1* | — | Certification of Chief Executive Officer pursuant to Rule 13a-14(a)/15d-14(a). | ||
| 31.2* | — | Certification of Chief Financial Officer pursuant to Rule 13a-14(a)/15d-14(a). | ||
| 32.1* | — | Certification of Chief Executive Officer Pursuant to Section 18 U.S.C. Section 1350, as Adopted Pursuant to Section 906 of the Sarbanes-Oxley Act of 2002. | ||
| 32.2* | — | Certification of Chief Financial Officer Pursuant to Section 18 U.S.C. Section 1350, as Adopted Pursuant to Section 906 of the Sarbanes-Oxley Act of 2002. | ||
| 99.1* | — | Press Release dated August 14, 2008. | ||
| * | Filed herewith. |
72
Table of Contents
Index to Financial Statements
SIGNATURES
Pursuant to the requirements of Section 13 or 15(d) of the Securities Exchange Act of 1934, as amended, the registrant has duly caused this report to be signed on its behalf by the undersigned, thereunto duly authorized, in the City of Alice, the State of Texas, on March 31, 2009.
| FORBES ENERGY SERVICES LTD. | ||
| By: | /s/ John E. Crisp | |
| John E. Crisp | ||
| President and Chief Executive Officer | ||
Pursuant to the requirements of the Securities Exchange Act of 1934, as amended, this report has been signed by the following persons on behalf of the registrant and in the capacities and on the dates indicated.
Signature | Title | Date | ||
/s/ John E. Crisp (John E. Crisp) | Chairman of the Board, President, Chief Executive Officer and Director (Principal Executive Officer) | March 31, 2009 | ||
/s/ L. Melvin Cooper (L. Melvin Cooper) | Senior Vice President, Chief Financial Officer and Secretary (Principal Financial and Accounting Officer) | March 31, 2009 | ||
/s/ Charles C. Forbes (Charles C. Forbes) | Executive Vice President, Chief Operating Officer and Director | March 31, 2009 | ||
/s/ Dale Bossert (Dale Bossert) | Director | March 31, 2009 | ||
/s/ Travis H. Burris (Travis H. Burris) | Director | March 31, 2009 | ||
/s/ Janet L. Forbes (Janet L. Forbes) | Director | March 31, 2009 | ||
/s/ William W. Sherrill (William W. Sherrill) | Director | March 31, 2009 | ||
Table of Contents
Index to Financial Statements
EXHIBIT INDEX
Number | Description of Exhibits | ||||
| 2.1 | — | Agreement and Plan of Reorganization effective January 1, 2008 among Forbes Energy Services LLC and the respective members of C.C. Forbes, LLC, TX Energy Services, LLC and Superior Tubing Testers, LLC (incorporated by reference to Exhibit 2.1 to the Company’s Form S-4/A filed June 27, 2008, Registration No. 333-150853). | |||
| 2.2 | — | Agreement and Plan of Reorganization effective May 29, 2008 among Forbes Energy Services Ltd. and the members of Forbes Energy Services LLC (incorporated by reference to Exhibit 2.2 to the Company’s Form S-4/A filed June 27, 2008, Registration No. 333-150853). | |||
| 3.1 | — | Memorandum of Association of Forbes Energy Services Ltd. (incorporated by reference to Exhibit 3.11 to the Company’s Form S-4/A filed June 27, 2008, Registration No. 333-150853). | |||
| 3.2 | — | Amended and Restated Bye-laws of Forbes Energy Services Ltd. (incorporated by reference to Exhibit 3.12 to the Company’s Form S-4/A filed June 27, 2008, Registration No. 333-150853). | |||
| 4.1 | * | — | Indenture, dated February 12, 2008 among Forbes Energy Services LLC and Forbes Energy Capital Inc., as issuers, the guarantors party thereto and Wells Fargo Bank, National Association, as trustee. | ||
| 4.2 | — | Supplemental Indenture (First Supplemental Indenture), dated May 29, 2008 among Forbes Energy Services Ltd., Forbes Energy Services LLC, Forbes Energy Capital Inc., the other Guarantors (as defined in the Indenture referred to therein) and Wells Fargo Bank, National Association, as trustee (incorporated by reference to Exhibit 4.2 to the Company’s Quarterly Report on Form 10-Q for the quarter ended June 30, 2008). | |||
| 4.3 | * | — | Supplemental Indenture (Second Supplemental Indenture), dated effective October 6, 2008 among Forbes Energy Services Ltd., Forbes Energy Services LLC, Forbes Energy Capital Inc., Forbes Energy International, LLC, the other Guarantors (as defined in the Indenture referred to therein) and Wells Fargo Bank, National Association, as trustee. | ||
| 4.4 | — | Third Supplemental Indenture, dated February 6, 2009 among Forbes Energy Services Ltd., Forbes Energy Services LLC, Forbes Energy Capital Inc., Forbes Energy International, LLC and the other Guarantors (as defined in the Indenture referred to therein) and Wells Fargo Bank, National Association, as trustee (incorporated by reference to Exhibit 4.1 to the Company’s Current Report on Form 8-K dated February 6, 2009). | |||
| 4.5 | * | — | Notation of Guarantee from Forbes Energy Services Ltd. | ||
| 4.6 | * | Notation of Guarantee from Forbes Energy International, LLC. | |||
| 4.7 | * | — | Registration Rights Agreement, dated as of February 7, 2008, among Jefferies & Company, Inc., Forbes Energy Services Inc., Forbes Energy Capital Inc. and the guarantors party thereto. | ||
| 4.8 | — | Specimen 144A Global 11% Senior Secured Exchange Note due 2015 (incorporated by reference to Exhibit 4.5 to the Company’s Form S-4/A filed June 27, 2008, Registration No. 333-150853). | |||
| 4.9 | — | Rights Agreement effective May 19, 2008 between Forbes Energy Services Ltd. and CIBC Mellon Trust Company, as Rights Agent, which includes as Exhibit A the Certificate of Designations of Series A Junior Participating Preferred Shares, as Exhibit B the form of Right Certificate and as Exhibit C the form of Summary of Rights to Purchase Shares (incorporated by reference to Exhibit 4.8 to the Company’s Form S-4/A filed June 27, 2008, Registration No. 333-150853). | |||
| 10.1 | * | — | Credit Agreement dated April 10, 2008 among C.C. Forbes, LLC, TX Energy Services, LLC and Superior Tubing Testers, LLC, as borrowers, Forbes Energy Services LLC, as guarantor, and Citibank, N.A., as lender, governing the Credit Facility. | ||
Table of Contents
Index to Financial Statements
Number | Description of Exhibits | |||
| 10.2* | — | Intercreditor Agreement dated April 10, 2008 among C.C. Forbes, LLC, TX Energy Services, LLC, Superior Tubing Testers, LLC, as borrowers, Forbes Energy Services LLC and Forbes Energy Capital Inc., as issuers, Citibank, N.A. and Wells Fargo Bank, National Association. | ||
| 10.3 | — | Forbes Energy Services Ltd. Incentive Compensation Plan effective May 19, 2008 (incorporated by reference to Exhibit 10.1 to the Company’s Form S-4/A filed June 27, 2008, Registration No. 333-150853). | ||
| 10.4 | — | Employment Agreement effective May 1, 2008 by and between John E. Crisp and Forbes Energy Services LLC (incorporated by reference to Exhibit 10.2 to the Company’s Form S-4/A filed June 27, 2008, Registration No. 333-150853). | ||
| 10.5 | — | Employment Agreement effective May 1, 2008 by and between Charles C. Forbes and Forbes Energy Services LLC (incorporated by reference to Exhibit 10.3 to the Company’s Form S-4/A filed June 27, 2008, Registration No. 333-150853). | ||
| 10.6 | — | Employment Agreement effective May 1, 2008 by and between L. Melvin Cooper and Forbes Energy Services LLC (incorporated by reference to Exhibit 10.4 to the Company’s Form S-4/A filed June 27, 2008, Registration No. 333-150853). | ||
| 10.7 | — | Form of Indemnification Agreement for directors, officers and key employees (incorporated by reference to Exhibit 10.5 to the Company’s Form S-4/A filed June 27, 2008, Registration No. 333-150853). | ||
| 10.8 | — | Form of Executive Non-Qualified Stock Option Agreement (incorporated by reference to Exhibit 10.6 to the Company’s Form S-4/A filed June 27, 2008, Registration No. 333-150853). | ||
| 10.9 | — | Form of Director Non-Qualified Stock Option Agreement (incorporated by reference to Exhibit 10.7 to the Company’s Form S-4/A filed June 27, 2008, Registration No. 333-150853). | ||
| 10.10 | — | Commercial Equipment Lease Agreement, dated October 15, 2008 among Forbes Energy Services LLC and Alice Environmental Services, LP. (incorporated by reference to Exhibit 10.1 to the Company’s Quarterly Report on Form 10-Q for the quarter ended September 30, 2008). | ||
| 21.1* | — | Subsidiaries of the Company. | ||
| 31.1* | — | Certification of Chief Executive Officer pursuant to Rule 13a-14(a)/15d-14(a). | ||
| 31.2* | — | Certification of Chief Financial Officer pursuant to Rule 13a-14(a)/15d-14(a). | ||
| 32.1* | — | Certification of Chief Executive Officer Pursuant to Section 18 U.S.C. Section 1350, as Adopted Pursuant to Section 906 of the Sarbanes-Oxley Act of 2002. | ||
| 32.2* | — | Certification of Chief Financial Officer Pursuant to Section 18 U.S.C. Section 1350, as Adopted Pursuant to Section 906 of the Sarbanes-Oxley Act of 2002. | ||
| * | Filed herewith. |