Filed Pursuant to Rule 424(b)(3)
Registration No.333-209131
Prospectus
1,723,993 shares of Common Stock of
XG SCIENCES, INC.
This is the initial public offering of common stock of XG Sciences, Inc., and no public market currently exists for the securities being offered. We originally registered for sale a total of 3,000,000 shares of common stock at a fixed price of $8.00 per share to the general public in a self-underwritten, best efforts offering. As of May 14, 2018, we have sold 1,276,007 shares at $8.00 per share for total proceeds of $10,208,056. Therefore, we are registering the remaining 1,723,993 shares in this Post-Effective Amendment No. 6 to the Company’s existing Registration Statement of which this prospectus is a part. We have and intend to continue to engage the services of non-exclusive sales agents to assist us with selling the shares. We intend to pay a commission fee of up to 8% to each sales agent. Only one sales agent shall receive a commission for each share sold. For additional information please see the “Plan of Distribution”.
We estimate our total offering expenses to be approximately $760,000, assuming we pay sales agents an 8% commission fee on fifty percent of the shares sold in this offering and dealer managers that introduce other broker dealers to serve as sales agents a 2% commission fee on twenty five percent of the shares sold in this offering. There is no minimum number of shares that must be sold by us for the offering to proceed, and we will retain the proceeds (net of any sales agent commissions) from the sale of any of the offered shares.
The offering shall terminate on the earlier of (i) when the offering period ends (3 years from the effective date of the Existing Registration Statement, or April 13, 2019), (ii) the date when the sale of all of the remaining 1,723,993 shares is completed, and (iii) when our Board of Directors decides that it is in the best interest of the Company to terminate the offering prior to the completion of the sale of all of the shares registered under the Registration Statement of which this prospectus is part.
There has been no public market for our securities and a public market may never develop, or, if any market does develop, it may not be sustained. Our common stock is not currently quoted on or traded on any exchange or on any over-the-counter market.
After this offering is completed, we intend to seek either (i) a listing of our common stock on a securities exchange registered with the Securities and Exchange Commission (SEC) under Section 6(a) of the Securities Exchange Act of 1934, as amended, such as the NASDAQ Capital Market or the New York Stock Exchange (NYSE), or (ii) the quotation of our common stock on the OTCQB or OTCQX marketplaces operated by OTC Markets Group, Inc. (any of the foregoing generally referred to as a “Qualified National Exchange” and the act of achieving such listing or quotation, generally referred to hereafter as a “Public Listing” in this prospectus). In order to achieve a Public Listing, we will have to meet certain initial listing qualifications of the Qualified National Exchange on which we are seeking the Public Listing. In addition, we will need to have market makers agree to make a market in our common stock and file a FINRA Form 15c211 with the SEC on our behalf before we can achieve a Public Listing, and we will also need to remain current in our quarterly and annual filings with the SEC.
There can be no assurance that our common stock will ever be quoted or traded on a Qualified National Exchange or that any market for our common stock will develop.
| 3 |
We are an “emerging growth company” as that term is used in the Jumpstart Our Business Startups Act of 2012 and, as such, may elect to comply with certain reduced public company reporting requirements for future filings. Please refer to discussions under “Prospectus Summary” on page 6 and “Risk Factors” on page 19 of how and when we may lose emerging growth company status and the various exemptions that are available to us.
Investing in our securities involves a high degree of risk. You should purchase these securities only if you can afford a complete loss of your investment. See the section entitled “Risk Factors” on page 19 of this prospectus and in the documents we filed with the Securities and Exchange Commission that are incorporated in this prospectus by reference for certain risks and uncertainties you should consider.
Neither the SEC nor any state securities commission has approved or disapproved of these securities or passed upon the adequacy or accuracy of this prospectus. Any representation to the contrary is a criminal offense.
The date of this prospectus is June 26, 2018.
| 4 |
TABLE OF CONTENTS
Until April 13, 2019, all dealers that effect transactions in these securities, whether or not participating in this offering, may be required to deliver a prospectus. This is in addition to each dealer’s obligation to deliver a prospectus when acting as underwriters and with respect to their unsold allotments or subscriptions.
You should rely only on the information contained in this prospectus. We have not authorized any person to provide you with different information. If anyone provides you with different or inconsistent information, you should not rely on it. This prospectus is not an offer to sell securities in any state where the offer or solicitation is not permitted. The information contained in this prospectus is complete and accurate as of the date on the front cover of this prospectus, but information may have changed since that date. We are responsible for updating this prospectus to ensure that all material information is included and will update this prospectus to the extent required by law.
| 5 |
This prospectus of XG Sciences, Inc., a Michigan corporation (together with its sole subsidiary, the “Company”, “XG Sciences”, “XGS” or “we”, “us”, or “our”) is a part of a registration statement on Form S-1 that we filed with the Securities and Exchange Commission (SEC). This summary highlights selected information contained elsewhere in this prospectus. This summary does not contain all the information that you should consider before investing in our common stock. You should carefully read the entire prospectus, including “Risk Factors”, “Management’s Discussion and Analysis of Financial Condition and Results of Operations” and the financial statements and related notes beginning on page F-1 before making an investment decision.
XG Sciences was formed in May 2006 for the purpose of commercializing certain technology to produce graphene nanoplatelets. First isolated and characterized in 2004, graphene is a single layer of carbon atoms configured in an atomic-scale honeycomb lattice. Among many noted properties, monolayer graphene is harder than diamonds, lighter than steel but significantly stronger, and conducts electricity better than copper. Graphene nanoplatelets are particles consisting of multiple layers of graphene. Graphene nanoplatelets have unique capabilities for energy storage, thermal conductivity, electrical conductivity, barrier properties, lubricity and the ability to impart physical property improvements when incorporated into plastics or other matrices.
We believe the unique properties of graphene and graphene nanoplatelets will enable numerous new product applications and the market for such products will quickly grow to be a significant market opportunity. Our business model is to design, manufacture and sell advanced materials we call xGnP® graphene nanoplatelets and value-added products incorporating xGnP® nanoplatelets. We currently have hundreds of customers trialing our products for numerous applications, including, but not limited to composites, packaging, lithium ion batteries, lead acid batteries, thermal transfer fluids, other thermal management applications, inks and coatings, printed electronics, construction materials, cement, and military uses. We believe our proprietary processes have enabled us to be a low-cost producer of high quality, graphene nanoplatelets and that we are well positioned to address a wide range of end-use applications.
Our Customers
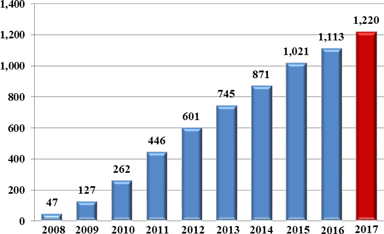
We sell products to customers around the world and have sold materials to over 1,000 customers in 47 countries since 2008. Our customers have included well-known automotive and OEM suppliers (Ford, Johnson Controls, Magna, Honda Engineering) globally recognized lithium ion battery manufacturers in the U.S., South Korea and China (Samsung SDI, LG Chemical, Lishen, A123) and diverse specialty material companies (3M, BASF, Henkel, Dow Chemical, DuPont) as well as leading research centers such as Lawrence Livermore National Laboratory and Oakridge National Laboratory. We have also licensed some of our base manufacturing technology to other companies and we consider technology licensing a component of our business model. Our licensees include POSCO, the fourth largest steel manufacturer in the world by volume of output, and Cabot Corporation (“Cabot”), a leading global specialty chemicals and performance materials company. These licensees further extend our technology through their customer networks. As can be seen in the below bar chart, the cumulative number of customers has steadily grown over the past ten years.
Cumulative Customers, By Year
| 6 |
We believe average order size is an indicator of commercial traction. The majority of our customers are still ordering in smaller quantities consistent with their development and engineering qualification work. As can be seen in the chart below, our quarterly average order size was relatively modest until 2017, when a number of customers reached commercial status with different product applications. These data represent orders shipped in the respective quarter and exclude no charge orders targeted mainly for R&D purposes. The data show that the average order size has increased steadily over the last two years, and we believe that it will continue to increase in 2018 as more customers commercialize products using our materials. As a result of this increasing order size, in 2017 our customer shipments increased by over 600% to almost 18 metric tons of products from the 2.5 metric tons shipped in 2016. In the first quarter of 2018, this growth trend continued and we shipped products containing over 10 metric tons of graphene nanoplatelets, on a dry powder basis, up from just over 9 metric tons in the fourth quarter of 2017. In the first quarter of 2018, we also saw aa sequential quarterly increase in average order size to $15,827 from $14,541 in the fourth quarter of 2017.
Average Order Size of Fulfilled Orders

Our Products
Bulk Materials. We target our xGnP® nanoplatelets for use in a wide range of large and growing end-use markets. Our proprietary manufacturing processes allow us to produce nanoplatelets with varying performance characteristics that can be tuned to specific end-use applications based on customer requirements. We currently offer four commercial “grades” of bulk materials, each of which is available in various particle sizes and thickness, which allows for surface areas ranging from 50 to 800 square meters per gram of material depending on the product. Other grades may be made available, depending on the needs for specific applications. In addition, we sell our xGnP® graphene nanoplatelets in the form of pre-dispersed mixtures with water, alcohol, or other organic solvents and resins. In addition to selling bulk graphene nanoplatelets, we also offer the following integrated, value-added products that contain our graphene nanoplatelets in various forms:
| 7 |
Composites.These consist of compositions of specially designed xGnP® graphene nanoplatelets formulated in pre-dispersed mixtures that can be easily incorporated in various polymers. Our integrated composites portfolio includes pre-compounded resins derived from a range of thermoplastics as well as mother batches of resins and xGnP® nanoplatelets and their combination with resins and fibers for use in various end-use applications that may include industrial, automotive and sporting goods and which have demonstrated efficacy in standard injection molding, compression molding, blow molding and 3-D processes, to name but a few. In addition, we offer various bulk materials with demonstrated efficacy in plastic composites to impart improved physical performance to such matrices, which may be supplied as dry powders or as aqueous or solvent-based dispersions or cakes. We have also targeted use of our graphene nanoplatelets as an additive in cement mixtures, which we believe results in improved barrier resistance, durability, toughness and corrosion protection. Our GNP®Concrete Additive promotes the formation of more uniform and smaller grain structure in cement. This fine-grain and uniform structure gives the concrete improvements in flexural and compressive strength. In addition, the embedded graphene nanoplatelets will reduce water absorption and stop cracks from forming as well as retard crack propagation, should any cracks form – the combination of which will improve lifetime and durability of cement.
Energy Storage Materials. These consist of specialty advanced materials that have been formulated for specific applications in the energy storage segment. Chief among these is our proprietary, specially formulated silicon-graphene composite material (also referred to as “SiG” or “XG SiG®”) for use in lithium-ion battery anodes. XG SiG® targets the never-ending need for higher battery capacity and longer life. In several customer trials, our SiG material has demonstrated the potential to increase battery energy storage capacity by 3-5x what is currently available with conventional lithium ion batteries today. Additionally, we offer various bulk materials for use as conductive additives for cathodes and anodes in lithium-ion batteries, as an additive to anode slurries for lead-carbon batteries, as a component in coatings for current collectors in lithium-ion batteries and we are investigating the use of our materials as part of other battery components.
Inks and Coatings. These consist of specially-formulated dispersions of xGnP®together with solvents, binders, and other additives to make electrically or thermally conductive products designed for printing or coating and which are showing promise in diverse customer applications such as advanced packaging, electrostatic dissipation and thermal management. We also offer a set of standardized ink formulations suitable for printing. These inks offer the capability to print electrical circuits or antennas and may be suitable for other electrical or thermal applications. All of these formulations can be customized for specific customer requirements.
Thermal Management Materials. These consist mainly of two types of products, our XG Leaf® sheet products and various thermal interface materials (“TIM”) in the form of custom greases or pastes. XG Leaf® is a family of sheet products ideally suited for use in thermal management in portable electronics, which may include cell phones, tablets and notebook PC’s. As these devices continue to adopt faster electronics, higher data management capabilities, brighter displays with ever increasing definition, they generate more and more heat. Managing that heat is a key requirement for the portable electronics market and our XG Leaf® product line is well suited to address the need. These sheets are made using special formulations of xGnP® graphene nanoplatelets as precursors, along with other materials for specific applications. There are several different types of XG Leaf®available in various thicknesses, depending on the end-use requirements for thermal conductivity, electrical conductivity, or resistive heating. Our custom XG TIM® greases and pastes are also designed to be used in various high temperature environments. Additionally, we offer various bulk materials for use as active components in liquids, coatings and plastic composites to impart improved thermal management performance to such matrices.
Our Focus Areas
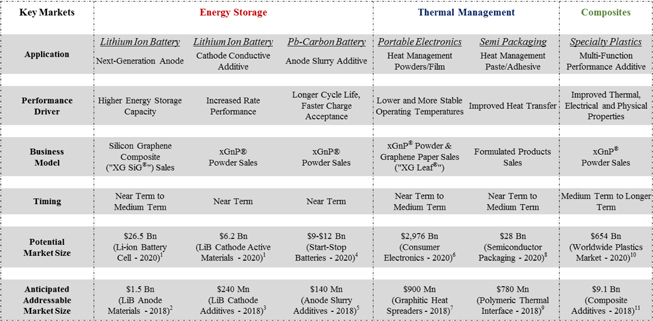
We believe we are a “platform play” in advanced materials, because our proprietary processes allow us to produce varying grades of graphene nanoplatelets that can be mapped to a variety of applications in many market segments. However, we are prioritizing our efforts in specific areas and with specific customers that we believe represent opportunities for either relatively near-term revenue or especially large and attractive markets. At this time, we are focused on three high priority areas: Energy Storage, Thermal Management and Composites. The following table shows examples of the types of applications we are pursuing, the expected timing of revenue and the addressable market size of selected market opportunities.
| 8 |
XGS Market/Application Focus Areas & 2018 Market Size
| (1) | Avicenne Energy, "The Worldwide Rechargeable Battery Market 2014 - 2025", 24th Edition - V3, July 2015. |
| (2) | Avicenne Energy, The Battery Show; Novi, MI; September, 2017. |
| (3) | Avicenne Energy, The Battery Show; Novi, MI; September, 2017. & Internal Estimates. |
| (4) | ArcActive via Nanalyze, April 3, 2015. |
| (5) | ArcActive via Nanalyze, April 3, 2015 & Internal Estimates. |
| (6) | Future Markets Insights, "Consumer Electronics Market: Global Industry Analysis and opportunity Assessment 2015 – 2020", May 8, 2015. |
| (7) | Prismark, "Market Assessment: Thin Carbon-Based Heat Spreaders", August 2014. |
| (8) | Reporterlink.com, "Semiconductor & IC Packaging Materials Market…", May 2014. |
| (9) | Prismark, 2015. |
| (10) | Grand View Research, "Global Plastics Market Analysis…", August 2014. |
| (11) | From (10) and internal estimates: 2018 = 305 million tons of plastic, if 10% of the market adopted xGnP to enhance their properties, and at only 1% by weight as an additive, then in 2018 305,000 tons or 305,000,000 kilos of xGnP would be required. At $30 a Kg - the value is $9.1 Bn per year. |
Commercialization Process
Because graphene is a new material, most of our customers are still developing applications that use our products. Commercialization is a process, the exact timing of which is often difficult to predict. It starts with our own internal R&D to validate performance for an identified market or customer-specific need. Our customers then validate the performance of our materials and determine whether our products can be incorporated into their manufacturing processes. This is initially done at pilot production scale levels. Our customers then have to introduce products that incorporate our materials to their own customers to validate performance. After their customers have validated performance, our customers will then move to commercial scale production. Every customer goes through the same process, but will do so at varying speeds, depending on the customer, the product application and the end-use market. Thus, we are not always able to predict when our customers will begin ordering commercial volumes of our materials or predict their expected volumes over time. However, as customers move through the process, we generally receive feedback and gain greater insights regarding their commercialization plans. The following are examples where our products are providing value to our customers at levels that are either in commercial production or we believe will warrant their use on a commercial basis.
| • | Callaway Golf Company incorporated our graphene nanoplatelets into the outer core of their Chrome Soft golf balls, resulting in a new class of golf ball that enables higher driving speeds, greater distance and increased control, which is allowing Callaway to command a premium price for their golf balls in the marketplace, and |
| 9 |
| • | Light emitting diode module and product company demonstrated approximately 50% improvement in thermal management capability when compared to existing commercial thermal management products, translating into a 15% improvement in thermal management at the device level, and |
| • | Automotive parts supplier demonstrating improvements in thermal stability for polymer composites incorporating our materials, allowing for approximately 20% higher operating temperatures and a 50% improvement in strength at the elevated temperature, and |
| • | Lead acid battery manufacturer demonstrating approximately 90% improvement in measured cycle life, appreciable improvement in capacity and charge acceptance and without any loss in water retention performance, and |
| • | Construction company demonstrating less than one weight percent of our product in construction material composites improves flexural strength by more than 30%, and |
| • | Plastics composite part manufacturer demonstrating 7-30% improvement in strength and 40% improvement in modulus when used in sheet molding compound, and |
| • | Engineering design firm for automotive manufacturers found approximately 20% reduction in operating temperature and in thermal uniformity when XG Leaf®replaces standard cooling fins in lithium ion battery packs, and |
| • | Plastic composite parts manufacturer demonstrating 25% increase in tensile strength and 15% improvement in flex modulus for a high-density polyethylene composite. |
The process of “designing-in” new materials is relatively complex and involves the use of relatively small amounts of the new material in laboratory and engineering development for an extended period of time. We believe following successful development, customers that incorporate our materials into their products will then order much larger quantities of material to support commercial production. Although, our customers are under no obligation to report to us on the usage of our materials, some have indicated that they have introduced or will soon introduce commercial products that use our materials. Thus, while many of our customers are currently purchasing our materials in kilogram (one or two pound) quantities, some are now ordering at multiple ton quantities and we believe many will require tens of tons or even hundreds of tons of material as they commercialize products that incorporate our materials. We also believe that those customers already in production will increase their order volume as demand increases and others will begin to move into commercial volume production as they gain more experience in working with our materials and engage new customers. For example, in the first half of 2017 we shipped 3.4 metric tons of product for various end-use customers and in the second half of 2017 we shipped just shy of 14 metric tons. In the fourth quarter of 2017, we received orders that exceeded our then capacity. In the first quarter of 2018 we shipped products comprising over 10 metric tons of graphene nanoplatelets. In addition, we used approximately 300 Kg of dry powder to produce and ship approximately 9 metric tons of additional product in the form of a slurry, cake or other integrated products. This demand profile is further evidence that we are transitioning into higher-volume production. Based on customer forecasts and management estimates, we expect to ship from 100 to 200 metric tons in 2018.
2018 Expected Revenue
We are tracking the commercial and development status of more than 75 different customer applications using our materials with some customers pursuing multiple applications. As of March 31, 2018, we had seventeen specific customer applications where our materials are incorporated into our customers’ products and such customers are actively selling these products to their own customers. In addition, we have another twelve customer applications where our customers have indicated that they expect to begin shipping product incorporating our materials in the next 3 – 6 months, and we have another eighteen customer applications where our customers have indicated an intent to commercialize in the next 6 – 9 months. We are also working with numerous additional customers that have not yet indicated an exact date for commercialization, but we believe have the potential to contribute to revenue in 2018. The following graphic demonstrates the trend over the past 8 quarters as an increasing number of customers indicate their intent to commercialize applications and move into actively selling. We anticipate that the average order size for these customers will increase throughout 2018 as their demand grows. As a result, we believe we will begin shipping significantly greater quantities of our products, and thus continue scaling revenue in 2018. Based on the status of current discussions with customers and their feedback on the performance of our materials in their products, we believe we will be able to recognize approximately $8 – $15 million of revenue in 2018, although this cannot be assured.12
| 10 |

| (a) | Customer applications where our materials are used in customer products and they are actively selling them to their customers. |
| (b) | Customer applications where our customers are indicating that they expect to begin shipping products incorporating our materials in the next 3-6 months. |
| (c) | Customer applications where our customers are indicating an intent to commercialize in the next 6-9 months. Additional 10’s of customers demonstrating efficacy and moving through qualification process. |
| (12) | For Pennsylvania investors, this statement should not be read as prospective market and financial information within the meaning of 64 Pa. Code§ 609.010(d)(1)-(9). These statements are based solely on management’s discussion with customers regarding future demand. |
Addressable Markets
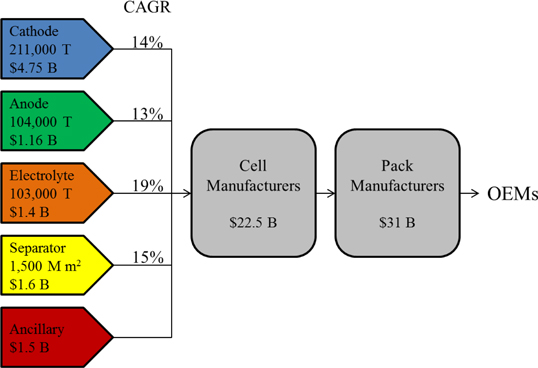
The markets that we serve are large and rapidly growing. For example, as shown in the figure below, Avicenne Energy (The Battery Show, Novi MI, September 2017) estimates that the market for materials used in lithium ion batteries is currently approximately $10.4 billion and with a double-digit compound annual growth rate. We believe our ability to address next generation battery materials represents a significant opportunity for us.
| 11 |
2016 Lithium Ion Battery Value Chain – Market Demand
According to Prismark Partners, LLC, a leading electronics industry consulting firm specializing in advanced materials, the market for finished graphitic heat spreaders as sold to the OEM and EMS companies with adhesive, PET, and/or copper backing for selected portable applications is expected to reach $900 million in 2018. The market has been in a significant expansion period driven by the demand for portable devices. In a press release dated October 17, 2017, Gartner, Inc., a leading research organization, estimated the 2018 global smartphone market at more than 1.6 billion units and worldwide combined shipments of devices (PC’s, tablets, ultraphones and mobile devices) are expected to reach 2.35 billion units in 2018. Every cell phone has some form of thermal management system, and we believe many of the new smart phones and other portable devices being developed can benefit from the thermal management properties of our XG Leaf® product line. In November 2017, International Data Corporation (IDC) in their Worldwide Quarterly Tablet Tracker, estimated the global shipment of tablets in the third quarter 2017 at 40 million units (Q1 2017 at 36.2 million units and Q2 2017 at 37.9 million units). Thus, we believe our XG Leaf® product line is well positioned to address a very large and rapidly growing market.
Our Intellectual Property
Some of our proprietary manufacturing processes were developed at Michigan State University (MSU) and licensed to us in 2006. We licensed three U.S. patents and patent applications from MSU. On August 8, 2016, we signed an agreement acquiring an exclusive license to Metna’s background IP for use of graphene nanoplatelets as additives to concrete mixtures. For purposes of the agreement, Metna’s background IP relates to the U.S. Patent 8,951,343. Also, on August 8, 2016, we entered into a second agreement for an exclusive license related to all Metna’s background technology and foreground technology, including any jointly-owned foreground technology where the end use is known to be any graphite additive dispersed in concrete mixtures. Over time, our scientists and engineers have made many further discoveries and inventions that are embodied in the form of (and as of March 31, 2018): eight additional U.S. patents, ten foreign patents, 16 additional U.S. patent applications, and numerous trade secrets. For many of the applications filed in the U.S., additional filings are made in other countries such as the European Union, Japan, South Korea, China, Taiwan or other applicable countries. As of March 31, 2018, we maintained 36 international patent applications. These filings and analyses are made on a case-by-case basis. Typically, patents that are defensive in nature are not filed abroad, while those that are protective of active XGS products or applications are filed in relevant countries abroad. Our general IP strategy is to keep as trade secrets those manufacturing processes that are difficult to enforce should they be disclosed and to seek patent coverage for other manufacturing processes, materials derived from those processes, unique combinations of materials and end uses of materials containing graphene nanoplatelets. We believe that the combination of our rights under the MSU license, the Metna license, our patents and patent applications, and our trade secrets create a strong intellectual property position.
| 12 |
Our Manufacturing Capacity
We have developed and scaled-up capacity for two proprietary manufacturing processes — one based on chemical intercalation and exfoliation of graphite and subsequent exfoliation and classification; and the second based on a high-shear mechanical exfoliation process which also employs graphite as the starting material. In March 2012, we took possession of a production facility under terms of a long-term lease and moved our headquarters to this new location. Initial production commenced in this facility in September 2012. Currently, this facility is capable of producing approximately 30 – 50 tons per year of chemically intercalated and exfoliated materials (depending on product mix) if operated on a continuous basis. We expect to streamline certain process steps in 2018 to roughly double the capacity output for our chemical exfoliation processes. We also operate a separate production facility in leased manufacturing space which is used for the production of certain graphene nanoplatelets derived from our high-shear mechanical exfoliation process and also other specialty materials. This facility is capable of producing approximately 30 – 60 tons per year of materials (depending on product mix) if operated on a continuous basis. In October 2017, we signed a lease for a new 64,000 square foot manufacturing facility which will be the site for expansion of our mechanical exfoliation capacity. It is our intent to consolidate equipment into the new facility and to add next-generation tooling to meet our estimated 2018 demand. Following consolidation, we will close the older facility. We expect to increase capacity in 2018 to four times that of our capacity at the end of 2017. We believe these manufacturing facilities will be sufficient to meet demands for the majority of our bulk materials for a number of years, with suitable additions of capital equipment as warranted. However, additional manufacturing capabilities for certain value-added products and certain bulk materials remain to be developed and will likely require the acquisition of additional facilities. In particular, the production processes for XG Leaf®, XG SiG®, XG TIM®, and our conductive inks will require additional capital and additional facilities to meet expected future customer demand.
Many of the Company’s products are new products that have not yet been fully developed and for which manufacturing operations have not yet been fully scaled. Although we believe as we continue to scale our production capability and revenue in 2018, we still have not yet demonstrated the capability to produce sufficient materials to generate the ongoing revenues necessary to sustain our operations in the long-term. For additional information please see “Risk Factors”.
Our Lead Investors and Strategic Partners
Since inception and through April, 2018, we have raised over $40 million of capital through the issuance of equity and equity-linked securities, $4 million through licensing fees and $6 million through the issuance of certain lease and senior debt obligations. Notable investors and licensees in the Company include:
| • | Aspen Advanced Opportunity Fund and affiliates – $20+ million in various equity investments (2010 – March 31, 2018) |
| • | POSCO Corporation – $5.2 million in equity investments/license agreement (June 2011 and March 2014) |
| • | Samsung Ventures – $3 million equity investment (January 2014) |
| • | The Dow Chemical Company – $5 million drawn on a $10 million senior debt financing (December 2016-2017) |
Our Competitive Strengths
We believe that we are a world leader in the emerging global market for graphene nanoplatelets. The following competitive strengths distinguish us in our industry:
| 13 |
Our know-how and ability to tailor our products for use in multiple composite applications. Many of our products and product-development activities target use of our xGnP® graphene nanoplatelets in various matrices to form composite products that are then used by our customers. We have extensive knowledge of how to tailor our products to deliver specific performance characteristics in various composite products including a wide range of polymers. We also have knowledge of how to tailor other components of a composite to adjust the performance of the composite for use in various applications.
The strength of our intellectual property. Because of our focus on manufacturing process development, we believe we have one of the world’s strongest internal knowledge bases in graphene nanoplatelet manufacturing, with most of our proprietary knowledge maintained as trade secrets to avoid the disclosures required by patenting. The 28 US patents and patent applications that we are currently managing (including those under license from MSU and Metna) and 46 international patents and patent applications add value by protecting specific equipment, or high-value end-user product applications. The fact that two global companies have evaluated and licensed our production technology provides independent evidence of our technology’s effectiveness.
The breadth of our product offering. To our knowledge, we have the broadest product offering in our industry. In addition to offering four standard grades of bulk graphene nanoplatelet materials in a range of diameters and surface areas and derived from two manufacturing processes, we offer four different grades of XG Leaf® in multiple thicknesses, two different grades of silicon-graphene composite materials, three standard ink formulations, and optional custom dispersions and formulations of our bulk materials. We also offer an XG TIM®thermal interface material and a newly introduced GNP® Cement Additive product.
The low-cost nature of our manufacturing processes. We believe our manufacturing processes are the lowest-cost approaches to the manufacture of graphene nanoplatelets (subject to economies of scale) based on our internal modelling of competitive processes as well as our analysis of alternative technologies.
Our corporate and strategic partners. Three global corporations (Samsung, POSCO, and Hanwha Chemical) have invested over $11 million in XGS, giving us a significant global reach as well as the ability to leverage the assets of our partners. In addition, The Dow Chemical Company has extended $10 million in senior debt financing, of which we have drawn down $5 million.
Our licensees will accelerate our entry into large markets. Cabot Corporation, the largest U.S.-based manufacturer of carbon particles, and POSCO, one of the world’s largest steel producers, have licensed parts of our production technology. We believe these licensees will help us distribute our products and value-added products made with our xGnP®nanoplatelets more rapidly than we could do on our own.
The number of development partners that are working with our materials. As of March 31, 2018, we had supplied materials to 284 universities or government laboratories in 41 different countries around the world. A recent search of the U.S. patent database revealed 574 citations of XG Sciences in patents filed by other organizations. These other organizations include Goodrich Corporation, PPG Industries, ExxonMobil Research & Engineering, Toray, Solvay, Honda, Eastman Kodak, Baker Hughes, GM, Rohm and Haas and Sekisui Chemical.
The number of commercial customers purchasing and working with our materials. As of March 31, 2018, we have supplied materials to approximately 1000 commercial companies around the world (in addition to universities and research laboratories) who are assessing their performance and potentially designing them into products. We have more than 75 active development relationships where we are working with end-use customers to design products for commercial use. We believe that these relationships will continue to expand.
As a result of these factors, we believe that XGS is a world leader in the emerging global market for graphene nanoplatelets. Other independent observers have agreed with this assessment. For example, Lux Research, in a July 2015 release listed XGS as a leading worldwide player in its review of the graphene industry. Further, Lux analysts wrote: “XG’s march of strategic relationship announcements — Hanwha Chemical in December 2010, POSCO in June 2011, and Cabot in November 2011 — arguably give it the strongest partnership portfolio in the space, and its recent expansion (see the May 7, 2012 LRMJ) makes it one of the low cost and capacity leaders.”
| 14 |
Our Financing History
Since our inception, we have incurred annual losses every year and have accumulated a deficit from operations of $(49,641,638) through March 31, 2018, $(47,767,544) through December 31, 2017 and $(41,188,851) through December 31, 2016. As of March 31, 2018, December 31, 2017, and December 31, 2016, our total stockholder’s equity was $1,002,375, $1,097,472 and $2,523,578, respectively.
From December 31, 2015 through April 7, 2016, we entered into private placement bridge financings with 15 investors, seven of whom are members or affiliates of members of our board of directors (“Board of Directors” or “Board”), totaling $1,124,750 (the “Bridge Financings”). The investors in the Bridge Financings received common stock warrant coverage of 30% for investments made prior to December 31, 2015 with an exercise price of $8.00 per share, and 20% coverage thereafter with an exercise price of $10.00 per share. In June of 2016, we repaid outstanding principal of $750,000 plus accrued interest of $27,032 to the Bridge Financing Investors. In December of 2016, we repaid the remaining $374,750 of outstanding principal plus accrued interest of $21,253. Members of the Board and their affiliates provided $800,000 of the principal for such Bridge Financings and re-invested all the principal plus additional funds of $1,013,032 to purchase 226,629 shares of the Company’s common stock during 2016.
In December 2016, we entered into a draw loan note and agreement (the “Dow Facility”) with The Dow Chemical Company (“Dow”) which provides us with up to $10 million of secured debt financing at an interest rate of 5% per year, drawable at our request under certain conditions. We received $2 million at closing and an additional $1 million on each of July 18, 2017, September 22, 2017 and December 4, 2017, respectively. After December 1, 2017, an additional $5 million becomes available if we have raised $10 million of equity capital after October 31, 2016. As of May 14, 2018, we have raised $7,007,024 in equity capital during the measurement period beginning November 1, 2016. Thus, we still need to raise $2,992,976 of additional equity capital prior to the remaining $5.0 million under the Dow Facility becoming available to us.
The Dow Facility is senior to most of our other debt and is secured by all of our assets (Dow is subordinate only to the capital leases with AAOF, see Note 13 to the December 31, 2017 financial statements). The loan matures on December 1, 2021 (subject to certain mandatory prepayments based on our equity financing activities). Interest is payable beginning January 1, 2017, although we have elected to capitalize interest through January 1, 2019. Dow received warrant coverage of one share of common stock for each $40 in loans received by us, equating to 20% warrant coverage, with an exercise price of $8.00 per share for the warrants issued at closing of the initial $2 million draw. After the initial closing, the strike price of future warrants issued are subject to adjustment if we sell shares of common stock at a lower price. As of December 31, 2017, we had issued 125,000 warrants to Dow, all with an exercise price of $8.00 per share, which are exercisable on or before the expiration date of December 1, 2023.
During each of the years ended December 31, 2017 and 2016, we issued 28,560 shares of Series A Preferred Stock to Aspen Advanced Opportunity Fund as payment under the terms of a Master Leasing Agreement for lease financing obligations.
We filed a Registration Statement on Form S-1 (File No. 333-209131) with the SEC on April 11, 2016 which was declared effective by the SEC on April 13, 2016 (the “Registration Statement”). The Registration Statement registered up to 3,000,000 shares of common stock at a fixed price of $8.00 per share to the general public in a self-underwritten offering (the “Offering” or our “IPO”). Post-Effective Amendment No. 1 to the Registration Statement was declared effective August 26, 2016, Post-Effective Amendment No. 2 was declared effective August 31, 2016, Post-Effective Amendment No. 3 was declared effective January 17, 2017, and Post-Effective Amendments No. 4 and No. 5 were dated April 12, 2017.Post-Effective Amendment No. 5 wasdeclared effective April 14, 2017. Although we are currently selling shares of our common stock in our IPO pursuant to an effective Registration Statement, we have not yet listed the company for trading on any exchanges.
As of May 14, 2018, the Company has sold 1,276,007 shares under the Registration Statement at a price of $8.00 per share for proceeds of $10,208,056.
As of May 14, 2018, March 31, 2018, and December 31, 2017, we had cash on hand of $1,660,600, $2,285,117, and $2,845,798, respectively. We believe our cash is sufficient to fund our operations for the next 12 months when taking into account various sources of funding and cash received from continued commercial sales transactions.
| 15 |
We intend that the primary means for raising funds will be through our Offering of common stock and the additional $5 million of proceeds from the Dow Facility available to us after we have raised $10 million of equity capital as measured in the period beginning after October 31, 2016. As of May 14, 2018, we have sold 1,276,007 shares of common stock pursuant to our IPO at a price of $8.00 per share for gross proceeds of $10,208,056. However, only $7,007,024 of this amount has been raised during the measurement period beginning November 1, 2016. Thus, we still need to raise $2,992,976 of additional equity capital prior to the remaining $5.0 million under the Dow Facility becoming available to us. Taking into account our cash position as of May 14, 2018 and an additional $3 million in proceeds from the Offering, which would allow us to draw up to $5 million from the Dow Facility, we believe that we can fund our operations including planned capital expenditures for the next 12 months. In addition, on March 28, 2018, two of our shareholders committed to provide the balance of the equity capital required to open up the remaining $5.0 million of availability under the Dow Facility during the twelve-month period ended March 31, 2019 to the extent the Company is unable to raise such funds from other third parties. As of May 14, 2018, one such shareholder had already funded $500,000 toward this commitment and the unfunded balance of the standby commitment, after taking into consideration other recent proceeds from this Offering, was $3.0 million.
As a result of the Bridge Financings and the IPO, the conversion price of our Series A Preferred Stock was adjusted to $6.40 per share.
Pursuant to the Certificate of Designation for the Series A, as amended, all then-outstanding shares of Series A will automatically convert into shares of common stock upon the listing of the Company’s common stock on a Qualified National Exchange (a securities exchange registered with the SEC under Section 6(a) of the Securities Exchange Act of 1934, as amended (“Exchange Act”), such as the NASDAQ Capital Market or the New York Stock Exchange, or (ii) the quotation of our common stock on the OTCQB or OTCQX marketplaces operated by OTC Markets Group, Inc. (“OTC Markets”), and the act of achieving such listing or quotation is referred to hereafter as a “Public Listing” in this prospectus). As a result, there will only be one class of equity securities outstanding — common stock — after we achieve a Public Listing. Prior to any such listing, the Series A may be voluntarily converted into shares of common stock at the then-current conversion rate (current rate for the Series A Preferred Stock is 1.875 for 1).
Public Listing
In order to achieve a Public Listing, we will have to meet certain initial listing qualifications of the Qualified National Exchange or the OTC Markets on which we are seeking the Public Listing. In addition, we will need to have market makers agree to make a market in our common stock and file a FINRA Form 15c211 with the SEC on our behalf before we can achieve a Public Listing, and we will also need to remain current in our quarterly and annual filings with the SEC. Although we intend to seek a Public Listing in the next 12 to 18 months, we cannot make any assurances that our common stock will ever be quoted or traded on the Qualified National Exchange or the OTC Markets or that any market for our common stock will develop. In connection with our plan to list on The Nasdaq Stock Market we have reserved the ticker symbol “XG”.
Employees
As of April 30, 2018, we had 47 full-time employees and 1 part-time employee. 8 of these employees were contract employees who may generally be hired as permanent employees after 3 – 6 months. Employees include the following four senior managers that report to the CEO: Chief Commercial Officer, Vice President of Operations, Vice President of Research & Development, and Controller. The Company employs a total of 7 full-time scientists and technicians in its R&D group, including the Vice President of Research & Development.
Corporate Information
XG Sciences, Inc. was incorporated on May 23, 2006 in the State of Michigan and is organized as a “C” corporation under the applicable laws of the United States and the State of Michigan. We do not currently have any affiliated companies or joint venture partners, and we have one wholly-owned subsidiary called XG Sciences IP, LLC. This subsidiary was created in 2014 for the purpose of holding our intellectual property. Our headquarters and principal executive offices are located at 3101 Grand Oak Drive, Lansing, Michigan, 48911 and our telephone number is (517) 703-1110.
Our website address ishttp://www.xgsciences.com, although the information contained in, or that can be accessed through, our website is not part of this prospectus. You may also contact Dr. Philip L. Rose, our Chief Executive Officer via email atp.rose@xgsciences.com.
| 16 |
| Common stock to be offered by the Company | 1,723,993 shares | |
| Common stock issued and outstanding before the offering(1) | 2,662,525 shares | |
| Offering price | $8.00 per share | |
| Duration of offering | This offering shall commence on the effective date of the Registration Statement of which this prospectus is a part and terminate on the earlier of (i) 3 years from the effective date of the Existing Registration Statement, or April 13, 2019, (ii) the date when the sale of all of the remaining 1,723,993 shares is completed, and (iii) when the Board of Directors decides that it is in the best interest of the Company to terminate the offering prior the completion of the sale of all of the shares registered under the Registration Statement of which this prospectus is a part. | |
| Common stock issued and outstanding after the offering after giving effect to the sale of 1,723,993 shares by the Company(1) | 4,386,518 shares | |
| Pro forma common stock issued and outstanding after the offering after giving effect to the sale of 1,723,993 shares by the Company assuming the conversion of all issued and issuable shares of Series A Preferred Stock(2) | 9,720,537 | |
| Ticker Symbol and Market for our common stock | This is our initial public offering and no public market currently exists for our shares and a public market may never develop, or, if any market does develop, it may not be sustained. | |
| After this offering is completed, we intend to seek either (i) a listing of our common stock on a securities exchange registered with the SEC under Section 6(a) of the Exchange Act, such as the NASDAQ Capital Market or NYSE, or (ii) the quotation of our common stock on the OTCQB or OTCQX marketplaces operated by OTC Markets Group, Inc. (each of the foregoing, a “Qualified National Exchange”). In order to achieve such a Public Listing, we will have to meet certain initial listing qualifications of such Qualified National Exchange on which we are seeking the Public Listing. In addition, we will need to have market makers agree to make a market in our common stock and file a FINRA Form 15c211 with the SEC on our behalf before we can achieve a Public Listing. No market maker has agreed to file such application. We will also need to remain current in our quarterly and annual filings with the SEC to achieve and maintain a Public Listing. There can be no assurance that our common stock will ever be quoted on Qualified National Exchange or that any market for our common stock will develop. | ||
| Offering use of proceeds | We intend to use the net proceeds from the sale of the remaining 1,723,993 shares by the Company for capital expenditures in 2018 and 2019, working capital, and other general corporate purposes. Pending such use, we reserve the right to temporarily invest the proceeds. See “Use of Proceeds” beginning on page 30. | |
| Subscriptions | All subscriptions, once accepted by us, are irrevocable. | |
| Risk Factors | The common stock offered hereby involves a high degree of risk and should not be purchased by investors who cannot afford the loss of their entire investment. See “Risk Factors” beginning on page 19. | |
| Dividend policy | We do not intend to pay dividends on our common stock. We plan to retain any earnings for use in the operation of our business and to fund future growth. |
| 17 |
| (1) | Includes the actual number of shares outstanding as of May 14, 2018 and, for the avoidance of doubt, does not include the conversion or exchange of any preferred shares or the exercise of any options or warrants. |
| (2) | This figure includes (a) 2,662,525 shares of common stock currently outstanding as of May 14, 2018, (b) the issuance of 3,510,174 shares of common stock upon conversion of all 1,872,096 shares of Series A Preferred Stock currently outstanding at the current Series A Conversion Rate (see “Description of Securities — Series A Convertible Preferred Stock”), and (c) the issuance of 1,823,845 shares upon the conversion of 972,720 shares of Series A Preferred Stock (at the Series A Conversion Rate) issued upon the exercise of 972,720 warrants to purchase Series A Preferred Stock (the “Series A warrants”). This figure does not include 393,017 currently exercisable warrants to purchase common stock with an average exercise price of $12.69 per share, and 687,125 currently exercisable stock options with an average exercise price of $8.00 per share. |
There is no assurance that we will raise the $13,791,944 in gross proceeds anticipated from the sale by the Company of 1,723,993 shares, and there is no guarantee that we will receive any proceeds from the offering. We may sell only a small portion or none of the offered shares.
Emerging Growth Company
In April 2012, the Jumpstart Our Business Startups Act of 2012, or the JOBS Act, was enacted. Section 107 of the JOBS Act provides that an “emerging growth company,” or EGC, can take advantage of the extended transition period for complying with new or revised accounting standards. Thus, an EGC can delay the adoption of certain accounting standards until those standards would otherwise apply to private companies. We have irrevocably elected not to avail ourselves of this extended transition period and, as a result, we will adopt new or revised accounting standards on the relevant dates on which adoption of such standards is required for other public companies.
We are in the process of evaluating the benefits of relying on other exemptions and reduced reporting requirements under the JOBS Act. Subject to certain conditions, as an EGC, we intend to rely on certain of these exemptions, including exemptions from the requirement to provide an auditor’s attestation report on our system of internal controls over financial reporting pursuant to Section 404(b) of the Sarbanes-Oxley Act and from any requirement that may be adopted by the Public Company Accounting Oversight Board regarding mandatory audit firm rotation or a supplement to the auditor’s report providing additional information about the audit and the financial statements, known as the auditor discussion and analysis. We will remain an EGC until the earlier of: the last day of the fiscal year in which we have total annual gross revenues of $1.0 billion or more; the last day of the fiscal year following the fifth anniversary of the date of the completion of this offering; the date on which we have issued more than $1.0 billion in nonconvertible debt during the previous three years; or the date on which we are deemed to be a large accelerated filer under the rules of the SEC.
| 18 |
THE SECURITIES BEING OFFERED INVOLVE A HIGH DEGREE OF RISK AND, THEREFORE, SHOULD BE CONSIDERED EXTREMELY SPECULATIVE. THEY SHOULD NOT BE PURCHASED BY PERSONS WHO CANNOT AFFORD THE POSSIBILITY OF THE LOSS OF THEIR ENTIRE INVESTMENT. PROSPECTIVE INVESTORS SHOULD READ THE ENTIRE PROSPECTUS, INCLUDING ALL EXHIBITS, AND CAREFULLY CONSIDER, AMONG OTHER FACTORS, THE FOLLOWING RISK FACTORS.
Risks Relating to Our Business and Industry
We have a limited operating history, an accumulated deficit and a stockholders’ deficit, making it difficult for you to evaluate our business and your investment.
XG Sciences, Inc. was incorporated on May 23, 2006, and is an advanced materials company. We sell bulk nanomaterials or products made with these materials to other companies for incorporation into their products. To date, there has been limited incorporation of our materials or products into customer products that are released for commercial sale. Because there is a limited demonstrated history of commercial success for our products, it is difficult to evaluate whether our products will ultimately be successful in the market. It is possible that larger and or extended commercial success may never happen and that we will never achieve the level of revenues necessary to sustain our business or continue to attract additional financing.
Many of our products represent new products that have not yet been fully developed and for which manufacturing operations have not yet been fully scaled. This means that investors are subject to all of the risks incident to the creation and development of multiple new products and their associated manufacturing processes.
As of December 31, 2017, and March 31, 2018, we have an accumulated deficit from operations of $(47,767,544) and $(49,641,638), respectively. As of December 31, 2017, and March 31, 2018, our total stockholder’s equity was $1,097,472 and $1,002,375, respectively. The deficit reflects net losses in each period since our inception incurred through development of nanomaterials without the presence of a large-scale market to generate substantial revenues to cover development costs and generate a profit. We have never paid a dividend. Also, since inception, we have not generated sufficient revenues to cover our fixed expenses or sustain our business in any financial reporting period. Nor have we demonstrated the capability to produce sufficient materials to generate the ongoing revenues necessary to sustain our operations in the long-term. There can be no assurance that we will ever produce a profit.
Because we are subject to these uncertainties, there may be risks that management has failed to anticipate and you may have a difficult time evaluating our business and your investment in our Company. Our ability to become profitable depends primarily on our ability to successfully commercialize our products in the future. Even if we successfully develop and market our products, we may not generate sufficient or sustainable revenue to achieve or sustain profitability, which could cause us to cease or curtail operations. In such case, you could lose all or a significant part of your investment.
We will need to raise substantial additional capital in the future to fund our operations and we may be unable to raise such funds when needed and on acceptable terms, which could have a materially adverse effect on our business.
Developing, manufacturing and selling nanomaterials in commercially-viable quantities requires substantial funding. As of March 31, 2018, we had cash on hand of $2,285,117. We believe our cash is sufficient to fund our operations for the next twelve months when taking into account various sources of funding and cash received from continued commercial sales transactions. We intend that the primary means for raising funds will be through our Offering and the additional $5 million of proceeds from the Dow Facility available to us after we have raised $10 million of equity capital as measured in the period beginning on November 1, 2016, however we can make no assurances that we will gain access to the additional $5 million under the Dow Facility. In addition, there can be no assurance that we will be able to raise additional equity capital in subsequent equity offerings or that the terms and conditions of any future financings will be workable or acceptable to us and our stockholders. Our continuation as a going concern is dependent upon continued financial support from our shareholders, our ability to obtain necessary equity and/or debt financing to continue operations, and the attainment of profitable operations. In the event that we are not able to raise substantial additional funds in the future on terms that are acceptable or adjust our business model accordingly, we may be forced to curtail or cease operations and you could lose all or a significant part of your investment.
| 19 |
We have limited experience in the higher volume manufacturing that will be required to support profitable operations, and the risks associated with scaling to larger production quantities may be substantial.
We have limited experience manufacturing our products. We have established small-scale commercial or pilot-scale production facilities for our bulk powders, thermal interface materials (“XG TIM®” or TIM), XG Leaf® and XG SiG® materials. In order to develop the capacity to produce much higher volumes, it will be necessary to produce multiples of existing processes or engineer new production processes in some cases.
We are in the process of outfitting a new 64,000 square foot manufacturing facility in Mason, MI, but there can be no assurance that this new facility will be opened on time or as planned. There is no guarantee that we will be able to economically scale-up our production processes to the levels required. If we are unable to scale-up our production processes and facilities to support sustainable sales levels, the Company may be forced to curtail or cease operations and you could lose all or a significant part of your investment.
Projection of fixed monthly expenses and operating losses for the near future means that investors may not earn a return on their investment or may lose their investment.
Because of the nature of our business, we project considerable fixed expenses that will lead to projected monthly deficits for the near future. Fixed manufacturing expenses to maintain production facilities, compensation expenses for scientists and other critical personnel, and ongoing rent and utilities amount to several hundred thousand dollars per month, and we believe that such expenses are required as a precursor to significant customer sales. However, there can be no assurance that monthly sales will ever reach a sufficient level to cover the cost of ongoing monthly expenses and if they do, are maintained for a sustainable period of time. If sufficient regular monthly sales are not generated to cover these fixed expenses, we will continue to experience monthly cash flow deficits which, if not eliminated, will require continuing new investment in the Company. If monthly cash flow deficits continue beyond levels that investors find tolerable, we may not be able to raise additional funds and may be forced to curtail or cease operations and you could lose all or a significant part of your investment.
We have a long and complex sales cycle and have not demonstrated the ability to operate successfully in this environment.
It has been our experience since our inception that the average sales cycle for our products can range from one to seven years from the time a customer begins testing our products until the time that they could be successfully used in a commercial product. The product introduction timing will vary based on the target market, with automotive uses typically being toward the long end and consumer electronics toward the shorter end. We have a limited track record of success in completing customer development projects, which makes it difficult for investors to fully evaluate the likelihood of our future success. The sales and development cycle for our products is subject to customer budgetary constraints, internal acceptance procedures, competitive product assessments, scientific and development resource allocations, and other factors beyond our control. If we are not able to successfully accommodate these factors to enable customer development success, we will be unable to achieve sufficient sales to reach profitability. In this case, we may not be able to raise additional funds and may be forced to curtail or cease operations and you could lose all or a significant part of your investment.
We could be adversely affected by our exposure to customer concentration risk.
We are subject to customer concentration risk as a result of our reliance on a relatively small number of customers for a significant portion of our revenues. In 2017 we had one customer (a commercial customer) whose purchases accounted for 53% of product revenue and in 2016 we had one customer (one of our licensees) whose purchases accounted for 24% of total product revenues. Due to the nature of our business and the relatively large size of many of the applications our customers are developing, we anticipate that we will be dependent on a relatively small number of customers for the majority of our revenues for the next several years. It is possible that only one or two customers could place orders sufficient to utilize most or all of our existing manufacturing capacity. In this case, there would be a risk of significant loss of future revenues if one or more of these customers were to stop ordering our materials, which could in turn have a material adverse effect on our business and on your investment.
Our revenues often fluctuate significantly based on one-off orders from customers or from the recognition of grant revenues which vary from period-to-period, which may materially impact our financial results from period to period.
Because of the potential for large revenue swings from one-time, large orders or grants it may be difficult to accurately forecast the needs for inventory, working capital, and other financial resources from period-to-period. Such orders would require a significant short-term increase in our production capacity and would require the financial resources to add staff and support the associated working capital. If such large, one-time orders were not handled smoothly, customer confidence in us as a viable supplier could be reduced and we might not succeed in capturing the additional larger orders that may be reflected in our business plan.
We operate in an advanced technology arena where hypothesized properties and benefits of our products may not be achieved in practice, or in which technological change may alter the attractiveness of our products.
Because there is no sustained history of successful use of our products in commercial applications, there is no assurance that broad successful commercial applications may be broadly technically feasible. Many of the scientific and engineering data related to our products has been generated in our own laboratories or in laboratory environments at our customers or third-parties, like universities and national laboratories. It is well known that laboratory data is not always representative of commercial applications.
| 20 |
Likewise, we operate in a market that is subject to rapid technological change. Part of our business strategy is to monitor such change and take steps to remain technologically current, but there is no assurance that such strategy will be successful. If we are not able to adapt to new advances in materials sciences, or if unforeseen technologies or materials emerge that are not compatible with our products and services or that could replace our products and services, our revenues and business prospects would likely be adversely affected. Such an occurrence may have severe consequences, including the potential for our investors to lose all or a significant part of their investment.
Competitors that are larger and better funded may cause us to be unsuccessful in selling our products.
The Company operates in a market in which there are competitors. Global research is being conducted by substantially larger companies who have greater financial, personnel, technical, and marketing resources. There can be no assurance that our strategy of offering better materials based on our proprietary graphene nanoplatelets will be able to compete with other companies, many of whom will have significantly greater resources, on a continuing basis. In the event that we cannot compete successfully, we may be forced to cease or curtail operations and investors may lose all or a significant part of their investment.
We are dependent on key employees.
Our operations and development are dependent upon the experience and knowledge of Philip L. Rose, our Chief Executive Officer. If he was to resign or be terminated, our business would be adversely affected in the short term, and his departure could disrupt the business enough to endanger your investment. We also depend on Dr. Liya Wang, Vice President of Research & Development, Bamidele Ali, Chief Commercial Officer, Scott Murray, Vice President of Operations, and Dr. Hiroyuki Fukushima, Technical Director. If the services of any of these individuals should become unavailable, our business operations might be adversely affected. We do not hold any “Key Person” insurance, and if several of these individuals became unavailable at the same time, our ability to continue normal business operations might be adversely affected, to the extent that revenue or profits could be diminished and you could lose all or a significant part of your investment.
Our success depends in part on our ability to protect our intellectual property rights, and our inability to enforce these rights could have a material adverse effect on our competitive position.
We rely on the patent, trademark, copyright and trade-secret laws of the United States and the countries where we do business to protect our intellectual property rights. We may be unable to prevent third parties from using our intellectual property without our authorization. The unauthorized use of our intellectual property could reduce any competitive advantage we have developed, reduce our market share or otherwise harm our business. In the event of unauthorized use of our intellectual property, litigation to protect or enforce our rights could be costly, and we may not prevail.
Many of our technologies are not covered by any patent or patent application, and our issued and pending U.S. and non-U.S. patents may not provide us with any competitive advantage and could be challenged by third parties. Our inability to secure issuance of our pending patent applications may limit our ability to protect the intellectual property rights these pending patent applications were intended to cover. Our competitors may attempt to design around our patents to avoid liability for infringement and, if successful, our competitors could adversely affect our market share. Furthermore, the expiration of our patents may lead to increased competition.
Our pending trademark applications may not be approved by the responsible governmental authorities and, even if these trademark applications are granted, third parties may seek to oppose or otherwise challenge these trademark applications. A failure to obtain trademark registrations in the United States and in other countries could limit our ability to protect our products and their associated trademarks and impede our marketing efforts in those jurisdictions.
In addition, effective patent, trademark, copyright and trade secret protection may be unavailable or limited in some foreign countries. In some countries, we do not apply for patent, trademark or copyright protection. We also rely on unpatented proprietary manufacturing expertise, continuing technological innovation and other trade secrets to develop and maintain our competitive position. Although we generally enter into confidentiality agreements with our employees and third parties to protect our intellectual property, these confidentiality agreements are limited in duration and could be breached and may not provide meaningful protection of our trade secrets or proprietary manufacturing expertise. Adequate remedies may not be available if there is an unauthorized use or disclosure of our trade secrets and manufacturing expertise. In addition, others may obtain knowledge about our trade secrets through independent development or by legal means. The failure to protect our processes, apparatuses, technology, trade secrets and proprietary manufacturing expertise, methods and compounds could have a material adverse effect on our business by jeopardizing critical intellectual property.
| 21 |
Where a product formulation or process is kept as a trade secret, third parties may independently develop or invent and patent products or processes identical to our trade-secret products or processes. This could have an adverse impact on our ability to make and sell products or use such processes and could potentially result in costly litigation in which we might not prevail.
We could face intellectual property infringement claims that could result in significant legal costs and damages and impede our ability to produce key products, which could have a material adverse effect on our business, financial condition and results of operations.
If we are unable to implement and maintain effective internal control over financial reporting, our stock could be less attractive to potential investors.
We are required to establish and maintain appropriate internal controls over financial reporting, subject to exemptions that we avail ourselves to under the JOBS Act discussed below. Failure to establish such controls, or any failure of such controls once established, could adversely impact our public disclosures regarding our business, financial condition or results of operations. Any failure of our controls could also prevent us from maintaining accurate accounting records and discovering accounting errors and financial frauds. Rules adopted by the SEC pursuant to Section 404 of the Sarbanes-Oxley Act of 2002 require annual assessment of our internal control over financial reporting, and the standards that must be met for management to assess the internal control over financial reporting as effective are new and complex, and require significant documentation, testing and possible remediation to meet the detailed standards. In the year ended December 31, 2017, we identified material weaknesses in our internal controls over financial reporting related to a limited number of accounting personnel which does not provide for an adequate segregation of duties and the lack of a chief financial officer. We plan to create positions to segregate duties consistent with control objectives in our accounting department after we hire a chief financial officer.
In addition, management’s assessment of internal controls over financial reporting may identify material weaknesses and conditions that need to be addressed in our internal controls over financial reporting or other matters that may raise concerns for investors in the future. Any actual or perceived weaknesses and conditions that need to be addressed in our internal control over financial reporting, disclosure of management’s assessment of our internal controls over financial reporting, or at such time as we are no longer subject to exemptions under the JOBS Act, disclosure of our independent registered public accounting firm’s report on management’s assessment of our internal controls over financial reporting may have an adverse impact on the price of our common stock or on our ability to sell our common stock.
Future adverse regulations could affect the viability of the business.
Our bulk products have been approved for sale in the United States by the U.S. Environmental Protection Agency after a detailed review of our products and production processes for our H, M, R and C grade materials. In most cases, as far as we are aware, there are no current regulations elsewhere in the world that prevent or prohibit the sale of our products. Nevertheless, the sale of nano-materials is a subject of regulatory discussion and review in many countries around the world. In some cases, there is a discussion of potential testing requirements for toxicity or other health effects of nano-materials before they can be sold in certain jurisdictions. If such regulations are enacted in the future, our business could be adversely affected because of the requirement for expensive and time-consuming tests or other regulatory compliance. If nano-materials are found to be toxic, such finding could have a material impact on our business and on the production and sale of our products. There can be no assurance that future regulations might not severely limit or even prevent the sale of our products in major markets, in which case our financial prospects might be severely limited, causing investors to lose all or a significant part of their investment.
Compliance with changing regulation of corporate governance and public disclosure will result in additional expenses and will divert time and attention away from revenue generating activities.
Changing laws, regulations and standards relating to corporate governance and public disclosure, including the Sarbanes-Oxley Act of 2002 and related SEC regulations, have significantly increased the costs and risks associated with accessing the public markets and public reporting. Our management team will need to invest significant management time and financial resources to comply with both existing and evolving standards for public companies, which will lead to increased general and administrative expenses and a diversion of management time and attention from revenue generating activities to compliance activities, which could have an adverse effect on our business.
Given our limited resources, we may not effectively manage our growth.
There is no guarantee that we have the resources, financial or operational, required to manage our growth. This is particularly true as we expand facilities and manufacture our products on a greater commercial scale. Furthermore, rapid growth in our operations may place a significant strain on our management, administrative, operational and financial infrastructure. The inability to adequately manage our growth could have a material and adverse effect on our business, financial condition or results of operations, and could result in a lower quoted price of our common stock or impair our ability to sell common stock in the future.
| 22 |
Downturns in general economic conditions could adversely affect our profitability.
Downturns in general economic conditions can cause fluctuations in demand for our products, product prices, volumes and gross margins. Future economic conditions may not be favorable to our industry. A decline in the demand for our products or a shift to lower-margin products due to deteriorating economic conditions could adversely affect sales of our products and our profitability and could also result in impairments of certain of our assets.
Furthermore, any uncertainty in economic conditions may result in a slowdown to the global economy that could affect our business by reducing the prices that our customers may be able or willing to pay for our products or by reducing the demand for our products.
An increase in the cost of raw materials or electricity might affect our profits.
Any increase in the prices of our raw materials or energy might affect the overall cost of our products. If we are not able to raise our prices to pass on increased costs to our customers, we would be unable to maintain our existing profit margins. Our major cost components include items such as graphite, sulfuric acid, and electricity, which items are normally readily available industrial commodities. During our history as a business, we have not seen any material impact (as defined by GAAP) on our cost structure from fluctuations in raw material or energy costs, but this could change in the future.
Our results of operations could deteriorate if our manufacturing operations were substantially disrupted for an extended period.
Our manufacturing operations are subject to disruption due to extreme weather conditions, floods and similar events, major industrial accidents, strikes and lockouts, adoption of new laws or regulations, changes in interpretations of existing laws or regulations or changes in governmental enforcement policies, civil disruption, riots, terrorist attacks, war, and other events. We cannot assure you that no such events will occur. If such an event occurs, it could have a material adverse effect on us.
Some health effects of nanotechnology are unknown.
There is scientific debate on the health effects of nano-materials such as graphene nanoplatelets, but some scientists believe that certain nano-materials may be hazardous to human health, including the respiratory system if inhaled. Although there is no conclusive evidence of any danger associated with the handling of the Company’s products, there is a theoretical risk of danger to health if an individual is exposed to and/or inhales/ingests some of the Company’s products. The specific health effects of nanoplatelets are unknown and can depend on how they are incorporated and/or bonded to other materials. We carefully evaluate potential health effects of our products and the effects of handling materials on our employees and those who manufacture for us, but as any specific health risks are unknown, we cannot be certain our products currently are free of danger to our employees and customers. If nanoplatelets are found to be hazardous to human health, this may adversely affect market acceptance of our products, subject us to additional regulation and have an adverse effect on our business.
Defects in our products or poor performance of our customers’ products could result in lost sales and subject us to substantial liability.
We have limited experience with large scale commercialization by our customers of products incorporating our nanoplatelets, and the chance of variability in the performance of our products as shipped may impact the performance of our customers’ products. If our customers’ products incorporating nanoplatelets perform poorly, whether due to design, engineering, production or other reasons, our customers may scale back or cancel orders. In certain cases, if our nanoplatelets are found to be the component that leads to failure or a failure to meet the performance specifications of a customer, we could be required to pay monetary damages. Real or perceived defects in our products could result in claims by our customers for losses they sustain. If our customers make such claims, we may be required, or may choose, for customer relations or other reasons, to expend additional resources to help correct any real or perceived defects. Liability provisions in our terms and conditions of sale may not be enforceable under some circumstances or may not fully or effectively protect us from claims and related liabilities and costs. In addition, regardless of the party at fault, errors of these kinds divert the attention of our engineering personnel from our product development efforts, damage our reputation and the reputation of our products, cause significant customer relations problems and can result in product liability claims. In addition, even claims that ultimately are unsuccessful could result in expenditures of funds in connection with litigation and divert management’s time and other resources. We also may incur costs and expenses relating to a recall of one or more of our products, and the occurrence of such claims could result in the delay or loss of market acceptance of our products and could adversely affect our business, operating results and financial condition.
| 23 |
If product liability lawsuits are brought against us, we may incur substantial liabilities.
We have limited experience with the large-scale manufacturing and distribution of our products. The commercialization of our products and the sale of our products in significant quantities involves exposure to product liability claims. We do not have product liability insurance. If we choose to obtain product liability insurance but cannot obtain sufficient insurance coverage at an acceptable cost or otherwise protect against potential product liability claims, the commercialization of products that we develop may be prevented or inhibited. We cannot predict all of the adverse health events that our products or products may cause. As a result, our current and future coverages may not be adequate to protect us from all of the liabilities that we may incur. If losses from product liability claims exceed any insurance coverage, we may incur substantial liabilities that exceed our financial resources. In addition, we may not be able to maintain our product liability insurance at an acceptable cost, if at all, and this insurance may not provide adequate coverage against potential claims or losses. If we are required to pay a product liability claim, we may not have sufficient financial resources and our business and results of operations may be harmed. Whether or not we are ultimately successful in product liability litigation, such litigation could also consume substantial amounts of our financial and managerial resources, and might result in adverse publicity, all of which could have a material adverse effect on our business.
Cybersecurity incidents could disrupt business operations, result in the loss of critical and confidential information, and adversely impact our reputation and results of operations.
Global cybersecurity threats and incidents can range from uncoordinated individual attempts to gain unauthorized access to information technology systems to sophisticated and targeted measures known as advanced persistent threats, directed at the Company, its plants and operations, its products, its customers and/or its third-party service providers. We rely on third party service providers to protect information technology systems, a breach of which could expose our confidential intellectual property, including trade secrets. The failure to protect such intellectual property could create a diminution in the value of our investment in research, development and engineering, and increased cybersecurity protection and remediation costs, which in turn could adversely affect our competitiveness and results of operations. We cannot be sure that our information technology infrastructure is safe from cybersecurity threats. Cybersecurity incidents, depending on their nature and scope, could potentially result in the misappropriation, destruction, corruption or unavailability of critical data and confidential or proprietary information (our own or that of third parties) and the disruption of business operations. The potential consequences of a material cybersecurity incident include reputational damage, claims from and litigation with third parties, fines levied by governmental authorities, and competitive disadvantages in our business.
Risks Relating to Our Common Stock
There is a risk of dilution of your percentage ownership of common stock in the Company.
In addition to the shares which we may sell pursuant to our Registration Statement, we have the right to raise additional capital or incur borrowings from third parties to finance our business. We may also implement public or private mergers, business combinations, business acquisitions and similar transactions pursuant to which we would issue substantial additional capital stock to outside parties, causing substantial dilution in the ownership of the Company by our existing stockholders. Our Board of Directors has the authority, without the consent of any of the stockholders, to cause the Company to issue more shares of common stock and/or preferred stock at such price and on such terms and conditions as are determined by the Board in its sole discretion.
The sale of the shares being offered by us in our Registration Statement, as well as the shares of common stock issuable upon the exercise of options and warrants, the shares issuable upon conversion of Series A Preferred Stock (including the shares of Series A Preferred Stock issuable upon the exercise of certain warrants) and the issuance of additional shares of capital stock by us will dilute your ownership percentage in the Company and could impair our ability to raise capital in the future through the sale of equity securities.
Certain stockholders who are also officers and directors of the Company may have significant control over our management, which may not be in your best interests.
As of May 14, 2018, the directors, or the entities they represent, and executive officers of the Company owned approximately 50% of the voting stock of the Company.
Additionally, our existing stockholders are party to a certain shareholder agreement, dated March 18, 2013, amended on February 24, 2016 effective as of April 13, 2016, and further amended on May 31, 2018 (such shareholder agreement, as amended, the “Shareholder Agreement”). Although shareholders purchasing shares under our Registration Statement will not be subject to the Shareholder Agreement, certain provisions of such Shareholder Agreement may impact the governance of the Company. Pursuant to the Shareholder Agreement, (a) so long as Aspen Advanced Opportunity Fund, LP, or “AAOF” or its affiliates own 10% of more of the aggregate outstanding Shareholder Stock (as defined in the Shareholder Agreement), (i) the size of the Board of Directors shall be set at seven individuals (provided, however, that the number of directors on the Board of Directors may be increased or decreased with the prior written consent of AAOF and shareholders (including AAOF) who in the aggregate then own Shareholder Stock representing a majority of the then issued and outstanding voting stock of the Company), (ii) one person nominated by AAOF shall be elected to the Board of Directors, (iii) two members of the Board of Directors, other than those nominated by AAOF, POSCO or Hanwha Chemical, shall qualify as independent Directors; (b) so long as POSCO owns 10% of more of the aggregate outstanding Shareholder Stock, one person nominated by POSCO shall be elected to the Board of Directors (POSCO does not currently own 10% or more of the aggregate outstanding Shareholder Stock and therefore does not maintain a seat on our Board of Directors); and (c) so long as Hanwha Chemical owns 10% of more of the aggregate outstanding Shareholder Stock, one person nominated by Hanwha Chemical shall be elected to the Board of Directors (Hanwha does not currently own 10% or more of the aggregate outstanding Shareholder Stock and therefore does not maintain a seat on our Board of Directors).
| 24 |
The Shareholder Agreement will continue in effect, unless the Shareholder Agreement is earlier terminated in accordance with its terms, until the date on which the Company’s common stock is listed on the NASDAQ Stock Market of the New York Stock Exchange. As a result, in the event that we are unable to achieve a Public Listing on the NASDAQ Stock Market or the New York Stock Exchange, the Shareholder Agreement will continue to remain in effect and certain of our larger shareholders will be entitled to continue to exercise their rights under such Shareholder Agreement, but purchasers of shares of common stock under the registration statement filed in connection with our current offering will not be required to adopt the Shareholder Agreement.
As a result, such entities have a significant influence on the affairs and management of the Company, as well as on all matters requiring stockholder approval, including electing and removing members of our Board of Directors, causing us to engage in transactions with affiliated entities, causing or restricting the sale or merger of the Company, and certain other matters. Such concentration of ownership and control could have the effect of delaying, deferring or preventing a change in control of the Company even when such a change of control would be in the best interests of our stockholders.
We may, in the future, issue additional shares of common stock, which would reduce investors’ percent of ownership and may dilute our share value.
Our Articles of Incorporation, as amended, authorize the issuance of up to 25,000,000 shares of common stock and up to 8,000,000 shares of preferred stock. As of May 14, 2018, the Company had 2,662,525 shares of common stock and 1,872,096 shares of Series A Preferred Stock issued and outstanding.
Upon a Public Listing on a Qualified National Exchange, all Series A Preferred Stock then currently outstanding will automatically convert into shares of common stock at the then-current Series A Conversion Rate (current ratio is 1.875 for 1), which would result in the issuance of 3,510,174 shares of common stock assuming the conversion of all 1,872,096 shares of Series A Preferred Stock. Series A Preferred Stockholders may also voluntarily convert at the then-current rate at any time prior to any such Public Listing on a Qualified National Exchange.
As of May 14, 2018, the Company had also granted options to purchase up to 687,125 shares of common stock and had issued warrants to purchase up to (i) 393,017 shares of common stock, (including the warrants for 125,000 shares issued under the Dow Facility) and (ii) 972,720 shares of Series A Preferred Stock which, if exercised, would be convertible into 1,823,845 shares of common stock at the then-current Series A Conversion Rate (currently of 1.875 shares for each share of Series A Preferred Stock). Therefore, we have committed to issue up to an additional 6,564,886 shares of common stock, which includes the issuance of (a) 3,510,174 shares upon conversion of all 1,872,096 shares Series A Preferred Stock currently outstanding at the Series A Conversion Rate, (b) 1,823,845 shares upon the conversion of 972,720 shares of Series A Preferred Stock (at the current Series A Conversion Rate) which are issuable upon exercise of 972,720 Series A warrants, (c) 687,125 shares upon the exercise of common stock options and (d) the issuance of 393,017 shares upon the exercise of common stock warrants. If we issued all 6,414,161 shares, we would have, including the 2,662,525 shares currently outstanding, 9,076,686 shares issued and outstanding, with 15,923,314 authorized shares available for future issuance, and if we assume the sale of all 1,723,993 shares being offered pursuant to our Registration Statement, we would have 14,199,321 authorized shares available for future issuance. The future issuance of common stock may result in substantial dilution in the percentage of our common stock held by our then existing stockholders. We may value any common stock issued in the future on an arbitrary basis. The issuance of common stock for future services or acquisitions or other corporate actions may have the effect of diluting the value of the shares held by our investors, might have an adverse effect on any trading market for our common stock and could impair our ability to raise capital in the future through the sale of equity securities.
The Dow Facility obligates us to issue a warrant to purchase a share of our common stock for each $40 in debt drawn. If we are able to and choose to draw further funding from the Dow Facility, we will become obligated to issue warrants to purchase up to 125,000 more of our shares depending on the amount drawn. If we issue these warrants, further dilution could occur.
We are considered a smaller reporting company and are exempt from certain disclosure requirements, which could make our stock less attractive to potential investors.
Rule 12b-2 of the Exchange Act defines a “smaller reporting company” as an issuer that is not an investment company, an asset-backed issuer, or a majority-owned subsidiary of a parent that is not a smaller reporting company and that:
| 25 |
| ● | Had a public float of less than $75 million as of the last business day of its most recently completed second fiscal quarter, computed by multiplying the aggregate worldwide number of shares of its voting and non-voting common equity held by non-affiliates by the price at which the common equity was last sold, or the average of the bid and asked prices of common equity, in the principal market for the common equity; or | |
| ● | In the case of an initial registration statement under the Securities Act or Exchange Act for shares of its common equity, had a public float of less than $75 million as of a date within 30 days of the date of the filing of the registration statement, computed by multiplying the aggregate worldwide number of such shares held by non-affiliates before the registration plus, in the case of a Securities Act registration statement, the number of such shares included in the registration statement by the estimated public offering price of the shares; or | |
| ● | In the case of an issuer whose public float as calculated under paragraph (1) or (2) of this definition was zero, had annual revenues of less than $50 million during the most recently completed fiscal year for which audited financial statements are available. |
As a “smaller reporting company” (in addition to and without regard to our status as an “emerging growth company”) (i) we are not required and may not include a “Discussion and Analysis” section in our proxy statements; (ii) we provide only 3 years of business development information; (iii) we provide fewer years of selected financial data in certain tables; and (iv) we have other “scaled” disclosure requirements that are less comprehensive than issuers that are not “smaller reporting companies” which may make our stock less attractive to potential investors, which could make it more difficult for you to sell your shares.
We are subject to the periodic reporting requirements of the Exchange Act, which will require us to incur audit fees, legal fees and valuation fees in connection with the preparation of such reports. These additional costs will negatively affect our ability to earn a profit.
We are required to file periodic reports with the Securities and Exchange Commission pursuant to the Exchange Act and the rules and regulations thereunder by virtue of our effective Registration Statement and our status as a smaller reporting company. In order to comply with such requirements, our independent registered auditors have to review our financial statements on a quarterly basis and audit our financial statements on an annual basis. Moreover, our legal counsel will have to review and assist in the preparation of such reports. Factors such as the number and type of transactions that we engage in and the complexity of our reports cannot accurately be determined at this time and may have a major negative effect on the cost and amount of time to be spent by our auditors and attorneys. However, the incurrence of such costs will be an expense to our operations and thus have a negative effect on our ability to meet our overhead requirements and earn a profit.
However, for as long as we remain an “emerging growth company” we intend to take advantage of certain exemptions from various reporting requirements until we are no longer an “emerging growth company.”
For so long as we remain a smaller reporting company, we benefit from many of the same exemptions and exclusions as an emerging growth company. In the event that we cease to be an emerging growth company as a result of a lapse of the five-year period, but continue to be a smaller reporting company, we would continue to be subject to the exemptions available to emerging growth companies until such time as we were no longer a smaller reporting company.
After, and if ever, we are no longer an “emerging growth company,” we expect to incur significant additional expenses and devote substantial management effort toward ensuring compliance with those requirements applicable to companies that are not “emerging growth companies,” including Section 404 of the Sarbanes-Oxley Act.
For so long as we are an emerging growth company, we may rely on certain exemptions provided in the JOBS Act, which could make our common stock less attractive to investors due to the nature of the reduced disclosure.
We are an “emerging growth company,” as defined in the JOBS Act, and may remain an emerging growth company for up to five years. For so long as we remain an emerging growth company, we are permitted and plan to rely on exemptions from certain disclosure requirements that are applicable to other public companies that are not emerging growth companies. These exemptions include not being required to comply with the auditor attestation requirements of Section 404 of the Sarbanes-Oxley Act of 2002, or SOX Section 404, not being required to comply with any requirement that may be adopted by the Public Company Accounting Oversight Board regarding mandatory audit firm rotation or a supplement to the auditor’s report providing additional information about the audit and the financial statements, reduced disclosure obligations regarding executive compensation and exemptions from the requirements of holding a nonbinding advisory vote on executive compensation and stockholder approval of any golden parachute payments not previously approved. In this prospectus, we have provided only two years of audited financial statements and have not included all of the executive compensation related information that would be required if we were not an emerging growth company. We cannot predict whether investors will find our common stock less attractive if we rely on these exemptions. If some investors find our common stock less attractive as a result, there may be a less active trading market for our common stock and our stock price may be more volatile. In addition, the JOBS Act provides that an emerging growth company can take advantage of an extended transition period for complying with new or revised accounting standards. This allows an emerging growth company to delay the adoption of certain accounting standards until those standards would otherwise apply to private companies. We have irrevocably elected not to avail ourselves of this exemption from new or revised accounting standards and, therefore, we will be subject to the same new or revised accounting standards as other public companies that are not emerging growth companies.
| 26 |
If securities or industry analysts do not publish research or reports or publish unfavorable research about our business, the price and trading volume of our common stock could decline.
Upon a Public Listing, the trading market for our common stock will depend in part on the research and reports that securities or industry analysts publish about us or our business. We do not currently have and may never obtain research coverage by securities and industry analysts. If no securities or industry analysts commence coverage of us, the trading price for our common stock and other securities would be negatively affected. In the event that we obtain securities or industry analyst coverage, if one or more of the analysts who covers us downgrades our securities, the price of our securities would likely decline. If one or more of these analysts ceases to cover us or fails to publish regular reports on us, interest in the purchase of our securities could decrease, which could cause the price of our common stock and other securities and their trading volume to decline.
If our common stock becomes a “penny stock,” you may have greater difficulty selling your shares.
Penny stocks are generally equity securities with a price of less than $5.00, other than securities registered on certain national securities exchanges or quoted on the NASDAQ system, provided that current price and volume information with respect to transactions in such securities is provided by the exchange or quotation system. After a Public Listing, our common stock may become a “penny stock” within the meaning of the rules, the rules apply to us and to our securities if we are not listed on a national securities exchange. These rules may further affect the ability of owners of shares to sell our securities in any market that might develop for them. As long as the trading price of our common stock is less than $5.00 per share, even if our common stock is quoted on either the OTCQX or OTCQB market place operated by the OTC Markets, our common stock will be subject to Rule 15g-9 under the Exchange Act (the “Penny Stock Rules”). The Penny Stock Rules require a broker-dealer, prior to a transaction in a penny stock, to deliver a standardized risk disclosure document prepared by the SEC, that:
| ● | contains a description of the nature and level of risk in the market for penny stocks in both public offerings and secondary trading; | |
| ● | contains a description of the broker’s or dealer’s duties to the customer and of the rights and remedies available to the customer with respect to a violation to such duties or other requirements of securities laws; | |
| ● | contains a brief, clear, narrative description of a dealer market, including bid and ask prices for penny stocks and the significance of the spread between the bid and ask price; | |
| ● | contains a toll-free telephone number for inquiries on disciplinary actions; | |
| ● | defines significant terms in the disclosure document or in the conduct of trading in penny stocks; and | |
| ● | contains such other information and is in such form, including language, type, size and format, as the SEC shall require by rule or regulation. |
The broker-dealer also must provide, prior to effecting any transaction in a penny stock, the customer with: (a) bid and offer quotations for the penny stock; (b) the compensation of the broker-dealer and its salesperson in the transaction; (c) the number of shares to which such bid and ask prices apply, or other comparable information relating to the depth and liquidity of the market for such stock; and (d) a monthly account statements showing the market value of each penny stock held in the customer’s account. In addition, the penny stock rules require that prior to a transaction in a penny stock not otherwise exempt from those rules; the broker-dealer must make a special written determination that the penny stock is a suitable investment for the purchaser and receive the purchaser’s written acknowledgment of the receipt of a risk disclosure statement, a written agreement to transactions involving penny stocks, and a signed and dated copy of a written suitably statement. These disclosure requirements may have the effect of reducing the trading activity in the secondary market for our stock it becomes designated as a Penny Stock.
| 27 |
Because we do not intend to pay any cash dividends on our common stock, our stockholders will not be able to receive a return on their shares unless they sell them.
We intend to retain any future earnings to finance the development and expansion of our business. We do not anticipate paying any cash dividends on our common stock in the foreseeable future. Unless we pay dividends, our stockholders will not be able to receive a return on their shares unless they sell them. There is no assurance that stockholders will be able to sell shares when desired.
Risks Related to our Offering
Because the offering price for the primary shares has been arbitrarily set by us, you may not realize a return on your investment upon the resale of your shares.
The offering price of each share and other terms and conditions relative to the shares being sold in our Offering have been arbitrarily determined by us and do not bear any relationship to assets, earnings, book value or any other objective financial criteria. Additionally, as the Company was formed on May 23, 2006, and has only a limited operating history with no earnings, the price of the offered shares under our Registration Statement is not based on its past earnings, and no investment banker, appraiser, or other independent third party, has been consulted concerning the offering price for the shares or the fairness of the offering price used for the shares, as such our stockholders may not be able to receive a return on their investment when they sell shares of common stock purchased under our Registration Statement.
Our officers and directors have limited prior experience offering and selling securities to the public, and as a result, we may not be able to raise sufficient funds to sustain our business.
Certain of our officers and directors are selling shares in our Offering, where allowed to do so under applicable state blue sky laws, on our behalf. We are conducting a “best efforts” offering under our Registration Statement which does not require a minimum amount to be raised, and there is no guarantee sufficient funds will be raised to sustain our business.
Our officers and directors have limited experience conducting a publicly registered securities Offering and we may not be able to successfully raise any funds. If we are not able to raise sufficient funds, we may not be able to fund our operations as planned, and we may be forced to curtail or cease operations and investors could lose all or a significant part of their investment. Our inability to successfully conduct the Offering could be the basis of investors losing all or a significant part of their investment in us.
Due to the lack of trading market for our securities, you may have difficulty selling any shares you purchase in our Offering.
We are not registered on any market or public stock exchange. There is presently no demand for our common stock and no public market exists for the shares being offered in our Registration Statement. In the future, we intend to seek a listing or a quotation on a Qualified National Exchange or the OTC Markets, we cannot make any assurance that our common stock will ever be quoted or traded on Qualified National Exchange or the OTC Markets or that any public market for our stock will develop. In order to achieve a Public Listing, we will have to meet certain initial listing qualifications of the Qualified National Exchange or the OTC Markets on which we are seeking the Public Listing. In addition, we will need to have market makers agree to make a market in our common stock and file a FINRA Form 15c211 with the SEC on our behalf before we can achieve a Public Listing. As of the date of this prospectus, there have been no discussions or understandings between the Company and anyone acting on our behalf, with any market maker regarding participation in a future trading market for our securities. If we are successful in achieving a Public Listing for our common stock, we will also need to remain current in our quarterly and annual filings with the SEC to achieve and maintain such Public Listing. Market makers are not permitted to begin quotation of a security whose issuer does not meet these filing requirements. Furthermore, if we are not able to pay the expenses associated with our ongoing reporting obligations we will not be able to achieve or maintain a Public Listing. If no public market is ever developed for our common stock, it will be difficult for investors to sell any shares they purchase under our Registration Statement. In such a case, investors may find that they are unable to achieve any benefit from their investment or liquidate their shares without considerable delay, if at all. In addition, if we fail to have our common stock quoted on a public trading market, any common stock purchased by investors will not have a quantifiable value and it may be difficult, if not impossible, to ever resell their shares, resulting in an inability to realize any value from their investment.
| 28 |
This prospectus contains forward-looking statements which relate to future events or our future financial performance. In some cases, you can identify forward-looking statements by terminology such as “may,” “should,” “expects,” “plans,” “anticipates,” “believes,” “estimates,” “predicts,” “potential” or “continue” or the negative of these terms or other comparable terminology. These statements are only predictions and involve known and unknown risks, uncertainties and other factors, including the risks in the section entitled “Risk Factors” that may cause our or our industry’s actual results, levels of activity, performance or achievements to be materially different from any future results, levels of activity, performance or achievements expressed or implied by these forward-looking statements. In addition, you are directed to factors discussed in the Business section and in the Management’s Discussion of Financial Condition and Results of Operations section and those discussed elsewhere in this prospectus.
Although these forward-looking statements, and any assumptions upon which they are based, are made in good faith and reflect our current judgment regarding the direction of our business, actual results will almost always vary, sometimes materially, from any estimates, predictions, projections, assumptions or other future performance suggested herein. Except as required by applicable law, including by the securities laws of the United States, we do not intend to update any of the forward-looking statements to conform these statements to actual results.
MARKET AND INDUSTRY DATA AND FORECASTS
This prospectus includes estimates of market share and industry data and forecasts that we obtained from industry publications and surveys and/or internal company sources. Industry publications and surveys and forecasts generally state that the information contained therein has been obtained from sources believed to be reliable, but there can be no assurance as to the accuracy or completeness of included information. We have not independently verified any of the data from third-party sources, nor have we ascertained the underlying economic assumptions relied upon therein. Similarly, while we believe our internal estimates with respect to our industry are reliable, our estimates have not been verified by any independent sources. Although we are not aware of any misstatements regarding any industry data presented in this prospectus, our estimates, in particular as they relate to market share and our general expectations, involve risks and uncertainties and are subject to change based on various factors, including those discussed under the section entitled “Risk Factors” beginning on page 19. Unless otherwise noted, all market share data is based on net sales in the applicable market.
| 29 |
This offering is being made on a best efforts basis and no minimum number of shares must be sold in order for the offering to proceed. The offering price per share is $8.00. The following table sets forth the uses of proceeds assuming the sale of 25%, 50%, 75% and 100%, respectively, of the securities offered for sale by the Company. There is no assurance that we will raise the full $13,791,944 in gross proceeds and there is no guarantee that we will receive any proceeds from the offering. We intend to use the estimated net proceeds from the sale of the shares of common stock being offered by the Company hereunder as follows:
| If 25% of Shares are Sold | % of Net Proceeds | If 50% of Shares are Sold | % of Net Proceeds | If 75% of Shares are Sold | % of Net Proceeds | If 100% of Shares are Sold | % of Net Proceeds | |||||||||||||||||||||||||
| GROSS PROCEEDS | $ | 3,447,986 | $ | 6,895,972 | $ | 10,343,958 | $ | 13,791,944 | ||||||||||||||||||||||||
| Offering Expenses | 139,363 | 139,363 | 139,363 | 139,363 | ||||||||||||||||||||||||||||
| Selling Agent and Dealer Manager Fees (1) | 155,159 | 310,319 | 465,478 | 620,637 | ||||||||||||||||||||||||||||
| NET PROCEEDS | 3,153,464 | 6,446,290 | 9,739,117 | 13,031,944 | ||||||||||||||||||||||||||||
| PLANNED USE OF PROCEEDS: | ||||||||||||||||||||||||||||||||
| Capital Expenditures: | ||||||||||||||||||||||||||||||||
| Misc. office remodeling, furniture and equipment | - | 0.0 | % | 40,000 | 0.5 | % | 40,000 | 0.4 | % | 80,000 | 0.6 | % | ||||||||||||||||||||
| Purchased software | - | 0.0 | % | - | 0.0 | % | 80,000 | 0.8 | % | 150,000 | 1.1 | % | ||||||||||||||||||||
| Furniture and fixtures | - | 0.0 | % | - | 0.0 | % | 40,000 | 0.4 | % | 40,000 | 0.3 | % | ||||||||||||||||||||
| Laboratory equipment for Research and Development | 70,000 | 2.0 | % | 150,000 | 2.3 | % | 200,000 | 2.0 | % | 290,000 | 2.2 | % | ||||||||||||||||||||
| Machinery, equipment, leasehold Improvements for manufacturing facilities | 600,000 | 19.0 | % | 2,130,000 | 33.0 | % | 3,120,000 | 32.0 | % | 4,830,000 | 37.0 | % | ||||||||||||||||||||
| Total proceeds for capital expenditures | 670,000 | 21.2 | % | 2,320,000 | 36.0 | % | 3,480,000 | 35.7 | % | 5,390,000 | 41.4 | % | ||||||||||||||||||||
| Intellectual property expenses | - | 200,000 | 3.0 | % | 380,000 | 3.8 | % | 720,000 | 5.5 | % | ||||||||||||||||||||||
| Leasing of additional facilities | - | 0.0 | % | - | 0.0 | % | 380,000 | 3.8 | % | 370,000 | 2.8 | % | ||||||||||||||||||||
| Marketing and sales development expenses | 380,000 | 12.0 | % | 710,000 | 11.0 | % | 1,470,000 | 15.0 | % | 1,460,000 | 11.2 | % | ||||||||||||||||||||
| R&D and product development expenses | 290,000 | 9.0 | % | 590,000 | 9.0 | % | 690,000 | 7.0 | % | 720,000 | 5.5 | % | ||||||||||||||||||||
| Salaries and other General & Administrative Expenses: | ||||||||||||||||||||||||||||||||
| Salaries, wages, and related costs | 1,420,000 | 45.0 | % | 2,070,000 | 32.0 | % | 2,730,000 | 28.0 | % | 3,650,000 | 28.0 | % | ||||||||||||||||||||
| Professional fees and outsourced services | 290,000 | 9.0 | % | 390,000 | 6.0 | % | 390,000 | 4.0 | % | 590,000 | 4.5 | % | ||||||||||||||||||||
| Total proceeds for salaries & other G&A | 1,710,000 | 54.2 | % | 2,460,000 | 38.2 | % | 3,120,000 | 32.0 | % | 4,240,000 | 32.5 | % | ||||||||||||||||||||
| Cash Reserves | 103,464 | 3.3 | % | 166,290 | 2.6 | % | 219,117 | 2.2 | % | 131,944 | 1.0 | % | ||||||||||||||||||||
| TOTAL USES OF PROCEEDS | $ | 3,153,464 | 100.0 | % | $ | 6,446,290 | 100.0 | % | $ | 9,739,117 | 100.0 | % | $ | 13,031,944 | 100.0 | % | ||||||||||||||||
| (1) | Assumes we pay sales agents an 8% commission on fifty percent of the shares sold in this offering and dealer managers that introduce other broker dealers to serve as sales agents a 2% commission on twenty five percent (25%) of the shares sold in this offering. |
| 30 |
The above estimates assume that, if we sell 100% of the shares in this offering and raise net proceeds of approximately $13 million, we will be able to invest in sufficient capacity expansions and expand our sales and marketing capabilities to the extent necessary to rapidly increase revenues, which we believe will allow us to begin generating positive cash flow from operations by the end of 2018. On the other hand, if we sell only 25% of the shares and raise net proceeds of approximately $3.2 million, we will use the majority of net proceeds from the offering to fund ongoing salaries and other operating expenses and only make minimal investments in capacity expansions and our sales and marketing capabilities. In between these two scenarios, we would plan to balance the use of proceeds between growth and expansion activities and salaries and other operating expenses. We plan to temporarily invest the proceeds of this offering into interest bearing accounts pending the use of such proceeds. In addition to the net proceeds raised from this offering listed in the above scenarios, we will have an additional $5 million available to us from the Dow Facility if we are able to raise an additional $3 million of equity capital (See “Prospectus Summary – Our Financing History”). In that event, we would be able to draw against that additional $5 million under the Dow Facility until December 31, 2019.
| 31 |
The following table sets forth our cash and cash equivalents and our capitalization as of March 31, 2018:
| Cash | $ | 2,285,117 | ||
| Capital lease obligations | $ | 106,624 | ||
| Long-term debt | 4,869,714 | |||
| Total debt obligations, current and non-current | 4,976,338 | |||
| Series A convertible preferred stock, 3,000,000 shares authorized, 1,857,816 shares issued and outstanding, liquidation value of $22,293,792 | 22,002,717 | |||
| Common stock, no par value, 25,000,000 shares authorized and 2,353,350 shares outstanding | 20,741,574 | |||
| Additional paid-in-capital | 7,899,722 | |||
| Accumulated deficit | (49,641,638 | ) | ||
| Total stockholders’ equity | 1,002,375 | |||
| Total capitalization | $ | 5,978,713 |
The table above assumes the following:
| • | the exclusion of all shares issuable upon the conversion of currently outstanding shares of Series A Preferred Stock; |
| • | the exclusion of 687,125 shares of common stock issuable upon exercise of outstanding options, at a weighted average purchase price of $8.00 per share; |
| • | the exclusion of the additional 512,875 shares of common stock reserved for issuance pursuant to our Stock Option Plan; |
| • | the exclusion of 393,017 shares of common stock issuable upon exercise of outstanding common stock warrants at a weighted average purchase price of $12.69 per share; and |
| • | the exclusion of 1,823,845 shares of common stock issuable upon exercise of 972,720 shares of Series A Preferred Stock issuable upon the exercise of 972,720 Series A warrants (assuming full conversion into common stock) at an exercise price of $12.00 per share of Series A Preferred Stock (or $6.40 per share of common stock on an as-converted basis). |
| 32 |
MARKET FOR COMMON EQUITY AND RELATED SHAREHOLDER MATTERS
Market for Common Equity
This is our initial public offering of 1,723,993 shares of our common stock at $8.00 per share, and no public market currently exists for our shares and a public market may never develop, or, if any market does develop, it may not be sustained.
After this offering is completed, we intend to seek either (i) a listing of our common stock on a securities exchange registered with the SEC under Section 6(a) of the Exchange Act, such as the NASDAQ Capital Market or the NYSE, or (ii) the quotation of our common stock on the OTCQB or OTCQX marketplaces operated by OTC Markets Group, Inc. (each of the foregoing, a “Qualified National Exchange”). In order to achieve such a Public Listing, we will have to meet certain initial listing qualifications of the Qualified National Exchange on which we are seeking the Public Listing. In addition, we will need to have market makers agree to make a market in our common stock and file a FINRA Form 15c211 with the SEC on our behalf before we can achieve a Public Listing, and we will also need to remain current in our quarterly and annual filings with the SEC. As of the date of this prospectus, there have been no discussions or understandings between the Company and anyone acting on our behalf, with any market maker regarding participation in a future trading market for our securities. There can be no assurance that our common stock will ever be quoted or traded on Qualified National Exchange or that any market for our common stock will develop.
Holders of Equity
As of May 14, 2018, we had 322 record holders of our common stock, and a total of 2,662,525 shares of common stock issued and outstanding. We had 13 record holders of Series A Preferred Stock and a total of 1,872,096 shares of Series A Preferred Stock issued and outstanding. In total, we had 327 shareholders of record of all classes of our capital stock as of May 14, 2018.
Each share of Series A Preferred Stock is voluntarily convertible, at the option of the holder thereof, at any time after the date of issuance and prior to any Public Listing of common stock on a Qualified National Exchange, into that number of fully paid, non-assessable shares of common stock determined by dividing the Original Issue Price by the Conversion Price then in effect, as such terms are defined in the Series A Designations. The current Series A Conversion Rate is 1.875 shares of common stock for each share of Series A Preferred Stock. The Conversion Price of the Series A Preferred Stock is subject to adjustments pursuant to the occurrence of stock splits and certain other specified events, and therefore the respective conversion rates are subject to change.
Furthermore, under the terms of the Series A Designations (as amended), all outstanding shares of Series A Preferred Stock will automatically convert into shares of common stock upon a Public Listing on a Qualified National Exchange at the then-current Series A Conversion Rate. At the current Series A Conversion Rate, if all outstanding shares of Series A Preferred Stock were voluntarily converted or automatically converted, we would issue 3,510,174 shares of common stock.
As of May 14, 2018, the Company had also granted options to purchase up to 687,125 shares of common stock and had issued warrants to purchase up to (i) 393,017 shares of common stock, (including the warrants for 125,000 shares issued under the Dow Facility) and (ii) 972,720 shares of Series A Preferred Stock which, if exercised, would be convertible into 1,823,845 shares of common stock at the then-current Series A Conversion Rate (currently of 1.875 shares of common stock for each share of Series A Preferred Stock). Therefore, we have committed to issue up to an additional 6,414,161 shares of common stock, which includes the issuance of (a) 3,510,174 shares upon conversion of all 1,872,096 shares Series A Preferred Stock currently outstanding at the Series A Conversion Rate, (b) 1,823,845 shares upon the conversion of 972,720 shares of Series A Preferred Stock (at the current Series A Conversion Rate) which are issuable upon exercise of 972,720 Series A warrants, (c) 687,125 shares upon the exercise of options and (d) the issuance of 393,017 shares upon the exercise of warrants. If we issued all 6,414,161 shares, we would have, in addition to the 2,662,525 shares currently outstanding, 9,076,686 shares issued and outstanding, with 15,923,314 authorized shares available for future issuance, and if we assume the sale of all 1,723,993 shares being offered hereunder, we would have 14,199,321 authorized shares available for future issuance. The future issuance of common stock may result in substantial dilution in the percentage of our common stock held by our then existing stockholders. We may value any common stock issued in the future on an arbitrary basis. The issuance of common stock for future services or acquisitions or other corporate actions may have the effect of diluting the value of the shares held by our investors, might have an adverse effect on any trading market for our common stock and could impair our ability to raise capital in the future through the sale of equity securities.
Securities Authorized for Issuance under Equity Compensation Plans
As of May 14, 2017, December 31, 2017, and December 31, 2016, the Company had outstanding stock options to purchase up to 687,125, 677,125, and 369,750 shares of common stock, respectively.
| 33 |
In 2007, the Company implemented a Stock Option Plan (the “2007 Plan”) and initially reserved 75,000 shares of common stock to cover stock options that might be issued under the 2007 Plan. However, in March 2016, shareholders holding a majority of the outstanding capital stock voted to increase the number shares reserved for issuance under the Stock Option Plan to 1,200,000.
As of December 31, 2016, stock options to purchase a total of 369,750 shares at prices ranging from $8.00 to $12.00 per share had been granted to Company employees and Directors, with expiration dates ranging from December 2017 to October 2023, with a weighted average purchase price of $11.89 per share.
The previously established 2007 Plan was scheduled to expire on October 30, 2017. On May 4, 2017, the Board approved the 2017 Equity Incentive Plan (the “2017 Plan”) to replace the 2007 Plan, which became effective upon the approval of the stockholders holding a majority of the voting power in the Company on July 18, 2017. The 2017 Plan replaces the 2007 Plan and authorizes us to issue awards (stock options and restricted stock) with respect of a maximum of 1,200,000 shares of our common stock, which equals the number of shares authorized under the 2007 Plan, as amended.
On July 24, 2017, certain stock options from the 2007 Plan were cancelled and replacement stock options were awarded. The replacement stock option awards have an exercise price of $8.00 per share, a seven-year term, are vested 50% on date of grant with the remaining vesting over a 4-year period from the date issued and are subject to certain other terms. Each option holder received options equal to 150% of the number of cancelled stock options. The cancellation and reissuance of the stock options were treated as a modification under ASC 718, Compensation-Stock Compensation. Incremental compensation cost of approximately $1,015,758 was measured as the excess of the fair value of the modified award over the fair value of the original award immediately before the terms were modified. Compensation cost of approximately $501,071 was recorded on the date of cancellation for awards that were vested on the date of the modification. For unvested awards, compensation cost of approximately $514,687 will be recorded over the remaining requisite service period.
We also granted stock options and restricted stock to each of our Board members as part of their compensation package. Each of the 4 independent Board members received 2,500 stock options and 2,500 shares of restricted stock for their Board services. The options were granted at a price of $8.00 per share and had an aggregate grant date fair value of $26,120. The options vest ratably over a four-year period beginning on the one-year anniversary. The restricted stock issued to the Board members has an aggregate fair value of $80,000 and vest ratably in arrears on the last day of each fiscal quarter following the grant date. As of March 31, 2018, 7,500 shares of restricted stock had vested resulting in compensation expense of $60,000.
On November 1, 2017, we granted 32,500 stock options to employees with an exercise price of $8.00 and a seven-year term. The aggregate fair value of the awards on the date of grant was $88,946 and they vest equally over four years beginning on the first anniversary of the date of grant.
As of May 14, 2018, stock options to purchase a total of 687,125 shares at a price of $8.00 per share had been granted to Company employees and Directors, with expiration dates ranging from July 2024 to November 2024.
| 34 |
Equity Compensation Plans as of March 31, 2018
| Equity Compensation Plan Information | ||||||||||||
| Plan category | Number of securities to be issued upon exercise of outstanding options, warrants and rights (a) | Weighted- average exercise price of outstanding options, warrants and rights (b) | Number of securities remaining available for future issuance under equity compensation plans (excluding securities reflected in column (a)) (c) | |||||||||
| Equity compensation plans approved by security holders(1) | 687,125 | $ | 8.00 | 512,875 | ||||||||
| Equity compensation plans not approved by security holders | — | — | — | |||||||||
| Total | 687,125 | $ | 8.00 | 512,875 | ||||||||
| (1) | Reflects our 2017 Equity Incentive Plan for the benefit of our directors, officers, employees and consultants as of March 31, 2017. As of March 31, 2018, we had reserved 1,200,000 shares of common stock for such persons pursuant to that plan and had granted stock options to purchase 687,125 shares at a weighted average price of $8.00 per share with 512,875 shares remaining available for future issuance. |
Securities that May be Sold under Rule 144
As of May 14, 2018, of the 2,662,525 shares of common stock issued and outstanding, 527,779 shares of common stock were held by affiliates and 2,134,746 shares of common stock were held by non-affiliates. Of the 6,172,699 shares of common stock that would be issued and outstanding on a fully diluted basis assuming (i) the conversion of all 1,872,096 shares of Series A Preferred Stock into 3,510,174 shares of common stock and (ii) no warrants or stock options are converted or exercised, 3,682,856 shares of common stock would be held by affiliates of the Company and 2,489,843 shares of common stock would be held by non-affiliates. All of foregoing shares held by affiliates are deemed “restricted securities” within the meaning of Rule 144 as promulgated under the Securities Act.
With the exception of certain shares sold pursuant to this offering, no underwriters were utilized and, no commissions or fees were paid with respect to any issuances of the Company’s securities, and we relied on Regulation S, Section 4(2), 4(a)(2) and/or Rule 506 of Regulation D of the Securities Act for all such issuances since none of the transactions involved any public offering.
It is anticipated that all of the “restricted securities” will be eligible for resale under Rule 144, provided there is a public market for resale. In general, under Rule 144, subject to the satisfaction of certain other conditions, a person, who is not an affiliate (and who has not been an affiliate for a period of at least three months immediately preceding the sale) and who has beneficially owned restricted shares of our common stock for at least six months is permitted to sell such shares without restriction, provided that there is sufficient public information about us as contemplated by Rule 144. An affiliate who has beneficially owned restricted shares of our common stock for a period of at least one year may sell a number of shares equal to one percent of our issued and outstanding common stock approximately every three months.
| 35 |
Since inception, we have not paid any dividends on our common stock. We currently do not anticipate paying any cash dividends in the foreseeable future on our common stock, because we intend to retain our earnings, if any, to finance the growth of our business. Our Board of Directors will have the discretion to declare and pay dividends in the future. Payment of dividends in the future will depend upon our earnings, capital requirements, and other factors, which our Board of Directors may deem relevant.
| 36 |
DETERMINATION OF OFFERING PRICE
The offering price in this offering and other terms and conditions relative to the Company’s shares have been arbitrarily determined by us and do not bear any relationship to assets, earnings, book value or any other objective financial criteria. In determining the number of shares to be offered and the offering price, we took into consideration our cash on hand and the amount of money we would need to implement our business plan. Accordingly, the offering price should not be considered an indication of the actual value of the securities.
| 37 |
If you invest in our shares of common stock, you will incur immediate, substantial dilution based on the difference between the public offering price per share you will pay in the offering and the net tangible book value per share of common stock immediately after the primary offering.
Our net tangible book value as of March 31, 2018 was approximately $427,796, or $.17 per share, based on 2,555,275 shares of common stock outstanding on March 31, 2018. Based on the offering price of $8.00 per share, investors will incur further dilution from the sale by us of shares of our common stock offered in the offering. Assuming all of the shares are sold in this offering, after deducting the estimated offering expenses of $760,000 from the gross proceeds of $14,649,944 for the 1,831,243 shares that remained to be sold in this offering as of March 31, 2018, our as adjusted net tangible book value as of March 31, 2018 on a pro forma basis for the offering would have been $14,317,740 or $3.26 per share, based on 4,386,518 shares of common stock outstanding after the offering. This represents an immediate increase in net tangible book value of $3.09 per share to our existing stockholders and an immediate dilution of $4.74 per share to the new investors purchasing shares of our common stock in the offering.
The following table illustrates this per share dilution:
| Assumed public offering price per share | $ | 8.00 | ||
| Net tangible book value per share as of March 31, 2018 | .17 | |||
| Increase per share attributable to new public investors | 3.09 | |||
| Net tangible book value per share after this offering | 3.26 | |||
| Dilution per share to new public investors | $ | 4.74 | ||
| % Dilution | 59.2 | % |
On a fully diluted basis, our tangible book value as of March 31, 2018 was approximately $427,796, or $.05 per share, based on 7,875,912 fully diluted, as converted, outstanding shares of common stock on March 31, 2018 assuming a) conversion of all Series A Preferred Stock into 3,496,792 shares of common stock, and b) exercise and conversion of all Series A Warrants into 1,823,845 shares of common stock, but excluding all out-of-the money stock options and other common stock warrants. Based on offering price of $8.00 per share, investors will incur further dilution from the sale by us of shares of our common stock offered in the offering. Assuming all of the shares are sold in this offering, after deducting the estimated offering expenses of $760,000 from the gross proceeds of $14,649,944 for the 1,831,243 shares that remained to be sold in this offering as of March 31, 2018, our as adjusted net tangible book value as of March 31, 2018 on a pro forma basis for the offering would have been $14,317,740, or $1.47 per fully diluted share, based on 9,707,155 fully diluted, as converted, shares outstanding after the offering. This represents an immediate increase in net tangible book value of $1.42 per share to our existing stockholders and an immediate dilution of $6.53 per share to the new investors purchasing shares of our common stock in the offering.
The following table illustrates this per share dilution on a fully diluted basis:
| Assumed public offering price per share | $ | 8.00 | ||
| Net tangible book value per fully diluted share as of March 31, 2018 | .05 | |||
| Increase per share attributable to new public investors | 1.42 | |||
| Net tangible book value per share after this offering | 1.47 | |||
| Dilution per share to new public investors | $ | 6.53 | ||
| % Dilution | 81.6 | % |
| 38 |
MANAGEMENT’S DISCUSSION AND ANALYSIS OF FINANCIAL CONDITION
AND RESULTS OF OPERATIONS
This section of the prospectus includes a number of forward-looking statements that reflect our current views with respect to future events and financial performance. Forward-looking statements are often identified by words like “believe”, “expect”, “estimate”, “anticipate”, “intend”, “project” and similar expressions, or words which, by their nature, refer to future events. You should not place undue certainty on these forward-looking statements. These forward-looking statements are subject to certain risks and uncertainties that could cause actual results to differ materially from our predictions.
Overview of our Business
XG Sciences was formed in May 2006 for the purpose of commercializing certain technology to produce graphene nanoplatelets. First isolated and characterized in 2004, graphene is a single layer of carbon atoms configured in an atomic-scale honeycomb lattice. Among many noted properties, monolayer graphene is harder than diamonds, lighter than steel but significantly stronger, and conducts electricity better than copper. Graphene nanoplatelets are particles consisting of multiple layers of graphene. Graphene nanoplatelets have unique capabilities for energy storage, thermal conductivity, electrical conductivity, barrier properties, lubricity and the ability to impart physical property improvements when incorporated into plastics or other matrices.
We believe the unique properties of graphene and graphene nanoplatelets will enable numerous new product applications and the market for such products will quickly grow to be a significant market opportunity. Our business model is to design, manufacture and sell advanced materials we call xGnP®nanoplatelets and value-added products incorporating xGnP® graphene nanoplatelets. We currently have hundreds of customers trialing our products for numerous applications, including, but not limited to composites, packaging, lithium ion batteries, lead acid batteries, thermal transfer fluids, other thermal management applications, inks and coatings, printed electronics, construction materials, cement, and military uses. We believe our proprietary processes have enabled us to be a low-cost producer of high quality, graphene nanoplatelets and that we are well positioned to address a wide range of end-use applications.
We sell products to customers around the world and have sold materials to over 1,000 customers in 47 countries since 2008. Our customers have included well-known automotive and OEM suppliers (Ford, Johnson Controls, Magna, Honda Engineering) globally recognized lithium ion battery manufacturers in the U.S., South Korea and China (Samsung SDI, LG Chemical, Lishen, A123) and diverse specialty material companies (3M, BASF, Henkel, Dow Chemical, DuPont) as well as leading research centers such as Lawrence Livermore National Laboratory and Oakridge National Laboratory. We have also licensed some of our base manufacturing technology to other companies and we consider technology licensing a component of our business model. Our licensees include POSCO, the fourth largest steel manufacturer in the world by volume of output, and Cabot Corporation (“Cabot”), a leading global specialty chemicals and performance materials company. These licensees further extend our technology through their customer networks.
Commercialization Process
Because graphene is a new material, most of our customers are still developing applications that use our products. Commercialization is a process, the exact timing of which is often difficult to predict. It starts with our own internal R&D to validate performance for an identified market or customer-specific need. Our customers then validate the performance of our materials and determine whether our products can be incorporated into their manufacturing processes. This is initially done at pilot production scale levels. Our customers then have to introduce products that incorporate our materials to their own customers to validate performance. After their customers have validated performance, our customers will then move to commercial scale production. Every customer goes through the same process, but will do so at varying speeds, depending on the customer, the product application and the end-use market. Thus, we are not always able to predict when our customers will begin ordering commercial volumes of our materials or predict their expected volumes over time. However, as customers move through the process, we generally receive feedback and gain greater insights regarding their commercialization plans.
The process of “designing-in” new materials is relatively complex and involves the use of relatively small amounts of the new material in laboratory and engineering development for an extended period of time. Following successful development, customers that incorporate our materials into their products will then order much larger quantities of material to support commercial production. Although our customers are under no obligation to report to us on the usage of our materials, some have indicated that they have introduced, or will soon introduce, commercial products that use our materials. Thus, while many of our customers are currently purchasing our materials in kilogram (one or two pound) quantities, some are now ordering at multiple ton quantities and we believe many will require tens of tons or even hundreds of tons of material as they commercialize products that incorporate our materials. We also believe that those customers already in production will increase their order volume as demand increases and others will begin to move into commercial volume production as they gain more experience in working with our materials and engage new customers. For example, in the first half of 2017 we shipped 3.4 metric tons of product for various end-use customers and in the second half of 2017 we shipped just shy of 14 metric tons. In the fourth quarter of 2017, we received orders that exceeded our then capacity. In the first quarter of 2018 we shipped products comprising over 10 metric tons of graphene nanoplatelets. In addition, we used approximately 300 Kg of dry powder to produce and ship approximately 9 metric tons of additional product in the form of a slurry, cake or other integrated products. This demand profile is further evidence that we are transitioning into higher-volume production. Based on customer forecasts and management estimates, we expect to ship from 100 to 200 metric tons in 2018.
| 39 |
We are tracking the commercial and development status of more than 75 different customer applications using our materials with some customers pursuing multiple applications. As of March 31, 2018, we had seventeen specific customer applications where our materials are incorporated into our customer’s products and such customers are actively selling these products to their customers. In addition, we have another twelve customer applications where our customers have indicated that they expect to begin shipping product incorporating our materials in the next 3 – 6 months, and we have another eighteen customer applications where our customers have indicated an intent to commercialize in the next 6 – 9 months. We are also working with numerous additional customers that have not yet indicated an exact date for commercialization, but we believe have the potential to contribute to revenue in 2018. As a result, we believe we will begin shipping significantly greater quantities of our products, and thus continue scaling revenue in 2018. Based on the status of current discussions with customers and their feedback on the performance of our materials in their products, we believe we will be able to recognize approximately $8 – 15 million of revenue in 2018, although this cannot be assured.12
Operating Segment
We have one reportable operating segment that manufactures xGnP® graphene nanoplatelets and value-added products produced therefrom, conducts research on graphene nanoplatelets and related products, and licenses our technology as appropriate. As of March 31, 2018, we shipped products on a worldwide basis, but all of our assets were located within the United States.
Our Critical Accounting Policies
US generally accepted accounting principles (“GAAP”) requires management to make estimates, judgments and assumptions that affect the reported amounts of assets, liabilities, revenues and expenses, together with amounts disclosed in the related notes to the consolidated financial statements. Actual results and outcomes may differ from management’s estimates, judgments and assumptions. Significant estimates, judgments and assumptions used in our consolidated financial statements include, but are not limited to, those related to revenues, accounts receivable and related allowances, contingencies, useful lives and recovery of long-term assets, income taxes, and the fair values of stock-based compensation and derivative financial instrument liabilities. These estimates, judgments, and assumptions are reviewed periodically and the effects of material revisions in estimates are reflected in the consolidated financial statements prospectively from the date of the change in estimate.
Revenue Recognition
We recognize revenues when (a) the price is fixed or determinable, (b) persuasive evidence of a sales arrangement exists, (c) the service is performed or delivery has occurred and (d) collectability of the resulting receivable is reasonably assured.
We recognize product revenues when products are shipped to customers. At that time, product ownership and risk have transferred to the customer and we have no further obligations. We record product sales at net selling prices that are reflective of discounts and allowances. Shipping and handling costs are recorded as a component of direct costs, as are shipping and handling costs billed to customers.
Revenue related to licensing agreements is recorded upon substantial performance of the terms of the licensing contract. In the case of licensing arrangements that involve up-front payments, revenue is recorded when management determines that the appropriate terms of the contract have been fulfilled. For example, this may occur when technology has been transferred via written documents or, if training is involved, whenever all contracted training has occurred. In the case of licenses where product delivery is also embedded in the deliverable, a portion of revenue would be recognized when products are delivered.
In the case of licensing arrangements that involve ongoing royalties based on sales of products produced with our technology, royalty income is recorded when received or, in the case of minimum royalties due, in the period when due.
Grant contract revenue is recognized over the life of the contracts as the services are performed.
Amounts received in excess of revenues earned are recorded as deferred revenue.
| 40 |
Stock-Based Compensation
We recognize compensation expense in our statement of operations for all share-based option and stock awards, based on estimated grant-date fair values.
We estimate the grant-date fair value of stock-based compensation awards using the Black-Scholes option valuation model. This model is affected by the estimated value of our common stock on the date of the grant as well as assumptions regarding a number of highly complex and subjective variables. These variables include the expected term of the option, the exercise price, expected risk-free rates of return, the expected volatility of our common stock, and expected dividend yield, each of which is more fully described below. The assumptions for the estimated value of our common stock, expected term and expected volatility are the assumptions that most significantly affect the grant date fair value.
Expected Term: Because we have limited experience related to the exercise of employee stock options, we use the simplified method permitted by SEC Staff Accounting Bulletin Topic 14 to estimate the expected term of the options. The expected term of an option is estimated to be equal to the mid-point between the vesting and expiration dates of the option
Risk-free Interest Rate: We base the risk-free interest rate used on the implied yield at the grant date of U.S. Treasury zero-coupon issues with a term approximately equal to the expected term of the stock-based award being valued.
Expected Stock Price Volatility: Because we are not currently registered for trading on any market or public exchanges and we have very limited stock sales history (in this Offering we are selling stock directly to investors without the assistance of an investment bank), we use a blended average weekly volatility of certain publicly traded peer companies. We believe that the use of this blended average peer volatility is reflective of market conditions and a reasonable indicator of our expected future volatility.
Dividend Yield: Because we have never paid a dividend and do not expect to begin doing so in the foreseeable future, we have assumed a 0% dividend yield in valuing our stock-based awards.
The grant-date fair value of the award is recognized as expense over the requisite service period using the straight-line method.
Fair Value Measurements
FASB ASC 820: “Fair Value Measurements and Disclosures” defines fair value as the exchange price that would be received for an asset or paid to transfer a liability (an exit price) in the principal or most advantageous market for the asset or liability in an orderly transaction between market participants on the measurement date. ASC 820 also establishes a fair value hierarchy which requires an entity to maximize the use of observable inputs and minimize the use of unobservable inputs when measuring fair value. The standard describes three levels of inputs that may be used to measure fair value:
Level 1: Quoted prices in active markets for identical assets or liabilities.
Level 2: Inputs other than quoted prices included within Level 1 which are either directly or indirectly observable.
Level 3: Inputs to the valuation methodology are unobservable and significant to the fair value measurement.
A financial instrument’s level within the fair value hierarchy is based on the lowest level of any input that is significant to the fair value measurement. Our derivative liabilities are classified as Level 3 within the fair value hierarchy because they were valued using other unobservable inputs. The valuation technique used to measure fair value of the derivative liabilities is based on a lattice model with significant assumptions and inputs determined by the Company. A lattice model was used to estimate the fair value of the derivative liabilities because management believes it reflects all of the assumptions that market participants would likely consider including early exercise of the warrants. The fair value of the derivative liabilities will be significantly influenced by the fair value of our common stock, stock price volatility and the risk-free interest components of the lattice technique.
Derivative Financial Instruments
We do not use derivative instruments to hedge exposures to cash flow, market or foreign currency risk. The terms of convertible preferred stock and convertible notes that we have issued in the past were reviewed to determine whether or not they contain embedded derivative instruments that are required by ASC 815: “Derivatives and Hedging” to be accounted for separately from the host contract and recorded at fair value. In addition, freestanding warrants are also reviewed to determine if they achieve equity classification. Certain warrants that we have issued did not meet the conditions for equity classification and are classified as derivative instrument liabilities measured at fair value. The fair values of these derivative liabilities are revalued at each reporting date, with the change in fair value recognized in earnings. See Note 9 of the consolidated financial statements for additional information.
| 41 |
Liquidity
We have historically incurred recurring losses from operations and we may continue to generate negative cash flows as we implement our business plan. Our consolidated financial statements are prepared using GAAP as applicable to a going concern, which contemplates the realization of assets and liquidation of liabilities in the normal course of business.
As of May 14, 2018, we had cash on hand of $1,660,600. We believe our cash from increasing commercial sales activity and various financing sources will fund our operations for at least the next 12 months. We intend that the primary means for raising funds will be through our IPO and the additional $5 million of proceeds from the Dow Facility that becomes available to us after we have raised another $3 million of equity capital as noted above; however, we can make no assurances that we will raise such equity capital and be able to access the additional $5 million under the Dow Facility. Taking into account our current cash position as noted above and an additional $3 million in proceeds from our IPO, which would allow us to draw up to $5 million from the Dow Facility, we believe that we can fund our operations including planned capital expenditures for at least the next 12 months. In addition, on March 27, 2018, two of our shareholders committed to provide the balance of the equity capital required to open up the remaining $5.0 million of availability under the Dow Facility during the twelve-month period ended March 31, 2019 to the extent the Company is unable to raise such funds from other third parties. As of May 14, 2018, one such shareholder had already funded $500,000 toward this commitment and the unfunded balance of the standby commitment, after taking into consideration other recent proceeds from this Offering, was $3.0 million.
There has been no public market for our securities and a public market may never develop, or, if any market does develop, it may not be sustained. Our common stock is not currently quoted on or traded on any exchange or on any over-the-counter market. In the event we are unable to fund our operations from existing cash on hand, operating cash flows, additional borrowings or raising equity capital, we may be forced to reduce our expenses, slow down our growth rate, or discontinue operations. Our condensed consolidated financial statements do not include any adjustments relating to the recoverability and classification of recorded asset amounts or the amounts and classification of liabilities that might be necessary should we be unable to continue as a going concern.
Recent Accounting Pronouncements
In May 2014, the FASB issued ASU No. 2014-09 (ASC 606), Revenue from Contracts with Customers, which requires an entity to recognize the amount of revenue to which it expects to be entitled for the transfer of promised goods or services to customers. ASU No. 2014-09 will replace most existing revenue recognition guidance in U.S. GAAP when it becomes effective. The new standard is effective for us on January 1, 2018. Early adoption is not permitted. The standard permits the use of either the retrospective or cumulative effect transition method. We performed an analysis and concluded that the amendment will not have a material impact on our financial condition or results of operations.
ASC 606 became effective for us beginning with the first quarter of 2018, and we adopted the new accounting standard using the modified retrospective transition approach. The modified retrospective transition approach recognizes any changes from the beginning of the year of initial application through retained earnings with no restatement of comparative periods. We record revenue under ASC 606 at a single point in time, when control is transferred to the customer, which is consistent with past practice. We will continue to apply our current business processes, policies, systems and controls to support recognition and disclosure under the new standard. Based on the results of the evaluation, nothing has come to our attention that would indicate that adoption of the new standard will have a material impact on our consolidated financial statements. Application of the transition requirements of the new standard will not have a material impact on opening retained earnings.
In April 2015, the FASB issued ASU No. 2015-03,Simplifying the Presentation of Debt Issuance Costs, or ASU 2015-03. ASU 2015-03 requires debt issuance costs to be presented in the balance sheet as a direct deduction from the carrying value of the associated debt liability, consistent with the presentation of a debt discount. The standard also aligns the GAAP presentation with International Financial Reporting Standards and will remedy the long-standing conflict with the guidance in FASB Concepts Statement No. 6, Elements of Financial Statements, which indicates that debt issuance costs do not meet the definition of an asset, because they provide no future economic benefit. ASU No. 2015-03 is effective for financial statements issued for fiscal years beginning after December 15, 2015, and interim periods within those fiscal years. Early adoption is permitted for financial statements that have not been previously issued. The new guidance will be applied on a retrospective basis. The adoption of this guidance during the year ended December 31, 2016 did not have a material impact on our consolidated statements of financial position, results of operations, or cash flows.
On February 24, 2016, the FASB issued ASU No. 2016-02, Leases, requiring lessees to recognize a right-of-use asset and a lease liability on the balance sheet for all leases with the exception of short-term leases. For lessees, leases will continue to be classified as either operating or finance leases in the income statement. Lessor accounting is similar to the current model but updated to align with certain changes to the lessee model. Lessors will continue to classify leases as operating, direct financing or sales-type leases. The effective date of the new standard for public companies is for fiscal years beginning after December 15, 2018 and interim periods within those fiscal years. Early adoption is permitted. The new standard must be adopted using a modified retrospective transition and requires application of the new guidance at the beginning of the earliest comparative period presented. We are currently evaluating the effect that the updated standard will have on our consolidated financial statements and related disclosures.
| 42 |
On March 30, 2016, the FASB issued ASU No. 2016-09, Improvements to Employee Share-Based Payment Accounting, which simplifies various aspects related to the accounting and presentation of share-based payments. The amendments require entities to record all tax effects related to share-based payments at settlement or expiration through the income statement and the windfall tax benefit to be recorded when it arises, subject to normal valuation allowance considerations. All tax-related cash flows resulting from share-based payments are required to be reported as operating activities in the statement of cash flows. The updates relating to the income tax effects of the share-based payments including the cash flow presentation must be adopted either prospectively or retrospectively. Further, the amendments allow the entities to make an accounting policy election to either estimate forfeitures or recognize forfeitures as they occur. If an election is made, the change to recognize forfeitures as they occur must be adopted using a modified retrospective approach with a cumulative effect adjustment recorded to opening retained earnings. The effective date of the new standard for public companies is for fiscal years beginning after December 15, 2016 and interim periods within those fiscal years. Early adoption is permitted. The adoption of this standard during December 31, 2017 did not have a material effect on our consolidated statements of financial position, results of operations, or cash flows.
In July 2015, the FASB issued ASU No. 2015-11, (“ASU 2015-11”), Inventory (Topic 330): Simplifying the Measurement of Inventory. ASU 2015-11 requires an entity to measure in scope inventory at the lower of cost and net realizable value. The amendment does not apply to inventory that is measured using last-in, first-out or the retail inventory method. For public entities, ASU 2015-11 is effective for fiscal years beginning after December 15, 2016, and interim periods within those fiscal years, and is to be applied prospectively. The adoption of this standard during the year ended December 31, 2017 did not have a material effect on our consolidated statements of financial position, results of operations, or cash flows.
In August 2016, the FASB issued ASU 2016-15, Statement of Cash Flows (Topic 230). This update provides clarification regarding how certain cash receipts and cash payments are presented and classified in the statement of cash flows. This update addresses eight specific cash flow issues with the objective of reducing the existing diversity in practice. This update is effective for annual and interim periods beginning after December 15, 2017, which will require us to adopt these provisions in the first quarter of fiscal 2018 using a retrospective approach. Early adoption is permitted. We do not expect the adoption of this guidance to have a material impact on our consolidated financial statements.
In July 2017, the FASB issued Accounting Standards Update No. 2017-11,Earnings Per Share (Topic 260), Distinguishing Liabilities From Equity (Topic 480), Derivatives and Hedging (Topic 815) (“ASU 2017-11”). This update changes the classification analysis of certain equity-linked financial instruments with down-round features. When determining whether certain financial instruments should be classified as liabilities or equity instrument, securities with anti-dilution features no longer preclude equity classification when assessing whether the instrument is indexed to an entity’s own stock. As a result, freestanding equity-linked financial instruments (or embedded conversion features) would no longer be accounted for as derivative liabilities at fair value because of the existence of an anti-dilution feature. For freestanding equity classified financial instruments, ASU 2017-11 requires entities that present earnings per share in accordance with ASC Topic 260 to recognize the effect of the anti-dilution feature when it is triggered. That effect is treated as a dividend and as a reduction of income available to common shareholders in basic EPS. The guidance in this Update is effective for fiscal years, and interim period within those fiscal years, beginning after December 15, 2018, with earlier adoption permitted. When adopted in an interim period, any adjustments are reflected as of the beginning of the fiscal year that includes that interim period. We elected to early adopt ASU 2017-11 during September 30, 2017 by applying the standard retrospectively to outstanding financial instruments with a down round feature by means of a cumulative-effect adjustment to the Company’s beginning accumulated deficit as of January 1, 2017 (see Note 9 to the Financial Statements). There were 972,720, warrants indexed to Series A Convertible Preferred Stock which were originally recorded as derivative liabilities because of their anti-dilution features. We chose to early adopt ASU 2017-11 because it permitted these warrants to be recorded as equity rather than derivative liabilities.
With the exception of the standards discussed above, we believe there have been no new accounting pronouncements effective or not yet effective that have significance, or potential significance, to our Consolidated Financial Statements.
JOBS Act
In April 2012, the Jumpstart Our Business Startups Act of 2012, or the JOBS Act, was enacted. Section 107 of the JOBS Act provides that an “emerging growth company,” or EGC, can take advantage of the extended transition period for complying with new or revised accounting standards. Thus, an EGC can delay the adoption of certain accounting standards until those standards would otherwise apply to private companies. We have irrevocably elected not to avail ourselves of this extended transition period and, as a result, we will adopt new or revised accounting standards on the relevant dates on which adoption of such standards is required for other public companies.
| 43 |
We are in the process of evaluating the benefits of relying on other exemptions and reduced reporting requirements under the JOBS Act. Subject to certain conditions, as an EGC, we intend to rely on certain of these exemptions, including exemptions from the requirement to provide an auditor’s attestation report on our system of internal controls over financial reporting pursuant to Section 404(b) of the Sarbanes-Oxley Act and from any requirement that may be adopted by the Public Company Accounting Oversight Board regarding mandatory audit firm rotation or a supplement to the auditor’s report providing additional information about the audit and the financial statements, known as the auditor discussion and analysis. We will remain an EGC until the earlier of: the last day of the fiscal year in which we have total annual gross revenues of $1.0 billion or more; the last day of the fiscal year following the fifth anniversary of the date of the completion of our Offering; the date on which we have issued more than $1.0 billion in nonconvertible debt during the previous three years; or the date on which we are deemed to be a large accelerated filer under the rules of the SEC.
Internal Control Over Financial Reporting
The Company’s management is responsible for establishing and maintaining adequate internal control over financial reporting as defined in Rule 13a-15(f) of the Securities Exchange Act of 1934. The Company’s internal control over financial reporting is a process designed to provide reasonable assurance regarding the reliability of financial reporting and the preparation of financial statements for external purposes in accordance with United States generally accepted accounting principles. Internal control over financial reporting includes policies and procedures that (i) pertain to the maintenance of records that, in reasonable detail, accurately and fairly reflect the transactions and dispositions of the assets of the Company; (ii) provide reasonable assurance that transactions are recorded as necessary to permit preparation of financial statements in accordance with United States generally accepted accounting principles, and that receipts and expenditures of the Company are being made only in accordance with authorizations of management and directors of the Company; and (iii) provide reasonable assurance regarding prevention or timely detection of unauthorized acquisitions, use or disposition of the Company’s assets that could have a material effect on the financial statements.
Management assessed the effectiveness of the Company’s internal control over financial reporting as of December 31, 2017. In making this assessment, management used the criteria set forth by the Committee of Sponsoring Organizations of the Treadway Commission (“COSO”) in Internal Control-Integrated Framework published in 2013. Based on this assessment, and on those criteria, management concluded that the Company’s internal control over financial reporting was not effective as of December 31, 2017 for the following reasons:
The Company’s accounting department consists of a limited number of personnel which does not provide for an adequate segregation of duties and we do not have a chief financial officer. Assuming we are able to secure additional working capital and as our business grows, we will create positions to segregate duties consistent with control objectives in our accounting department and will hire a CFO.
Results of Operations for the Three Months Ended March 31, 2018 Compared with the Three Months Ended March 31, 2017
| For the Three Months Ended March 31, | ||||||||||||
| 2018 | 2017 (Restated) | Change | ||||||||||
| Total Revenues | $ | 886,337 | $ | 282,189 | $ | 604,148 | ||||||
| Cost of Goods Sold | 1,214,774 | 487,920 | 726,854 | |||||||||
| Gross Loss | (328,437 | ) | (205,731 | ) | (122,706 | ) | ||||||
| Research & Development Expense | 277,063 | 263,564 | 13,499 | |||||||||
| Sales, General & Administrative Expense | 1,186,679 | 996,587 | 190,092 | |||||||||
| Total Operating Expense | 1,463,742 | 1,260,151 | 203,591 | |||||||||
| Operating Loss | (1,792,179 | ) | (1,465,882 | ) | (326,298 | ) | ||||||
| Other Expense | (81,916 | ) | (29,941 | ) | (51,975 | ) | ||||||
| Net Loss | $ | (1,874,095 | ) | $ | (1,495,823 | ) | $ | (378,272 | ) | |||
Revenue
Revenues for the three months ended March 31, 2018 and 2017, by category, are shown below.
| For the Three Months Ended March 31, | ||||||||||||
| 2018 | 2017 | Change | ||||||||||
| Product Sales | $ | 886,337 | $ | 157,700 | $ | 728,637 | ||||||
| Grants | - | 99,489 | (99,489 | ) | ||||||||
| Licensing Revenues | - | 25,000 | (25,000 | ) | ||||||||
| Total | $ | 886,337 | $ | 282,189 | $ | 604,148 | ||||||
| 44 |
Product sales consist of two broad categories: (1) material sold to customers for research or development purposes; and (2) production orders for customers. Typically, the order sizes for the first category are relatively small, however we expect orders in the second category to be much larger in the future. For the three months ended March 31, 2018, product sales increased by $728,637, or 462% from the comparable period in the prior year. The main reason for the increase in product sales was customers moving through development programs towards commercialization, requiring larger quantities of our materials for advanced testing, pilot production and commercial-scale production activities. We believe that those customers already in production will increase their order volume as demand increases and other customers will begin to move into commercial volume production as they gain more experience in working with our materials and engage their own customers. As a result of this movement, we shipped over 10 metric tons of bulk powders in the three months ended March 31, 2018.
We ship our products from our Lansing, MI manufacturing facilities to customers around the world. During the three months ended March 31, 2018, we shipped materials to customers in 12 countries, as compared to 20 countries during the same three-month period in 2017. For the three months ended, March 31, 2018, there were no shipments to any one country that accounted for more than 10% of product sales. For the three months ended March 31, 2017, shipments to two countries, South Korea and the United Kingdom accounted for more than 10% of product sales.
Order Summary
The table below shows a comparison of domestic and international orders fulfilled (note that this does not include orders for free samples). The table also includes the average order size for product sales. These numbers indicate that our customer base remains active with research and development projects that use our materials, but that the order size is increasing as more customers order for production purposes or approach commercial status with products using our materials. The average order size for the product revenue during the three months ended March 31, 2018 increased by 613% as compared to the same period in 2017. Although the average size of these orders is still relatively small, we have begun shipping in metric ton quantities to multiple customers.
| For the Three Months Ended March 31, | Change | |||||||||||||||
| 2018 | 2017 | % | ||||||||||||||
| Number of orders – domestic | 38 | 30 | 8 | 26.7 | ||||||||||||
| Number of orders – international | 18 | 41 | (23 | ) | (56.1 | ) | ||||||||||
| Number of orders – total | 56 | 71 | (15 | ) | (21.1 | ) | ||||||||||
| Average order size for product sales recorded in Statement of Operations | $ | 15,827 | $ | 2,221 | 13,606 | 612.6 | ||||||||||
Grant Revenue
There was no grant revenue for the three months ended March 31, 2018. Grant revenue for the three months ended March 31, 2017 consisted of proceeds from sources as shown in the table below:
| For the Three Months Ended March 31, | ||||||||
| 2018 | 2017 | |||||||
| US Department of Energy Grant | $ | — | $ | 93,747 | ||||
| Daimler / University of Michigan | — | 5,742 | ||||||
| Total | $ | — | $ | 99,489 | ||||
Licensing Revenue
For the three months ended March 31, 2018 we had no licensing revenue. Licensing revenue for the three months ended March 31, 2017 was $25,000. The licensing revenue in 2017 was from POSCO, a shareholder of the Company. The original license agreement dated June 8, 2011 was modified on November 3, 2017. Under the terms of the revised agreement no current licensing revenue is due from POSCO.
Cost of Goods Sold
We use a standard cost system to estimate the direct costs of products sold. Direct costs include estimates of raw material costs, packaging, freight charges net of those billed to customers, and an allocation for direct labor and manufacturing overhead. Because of the nature of our production processes, there is a substantial fixed manufacturing expense requirement that represents the ongoing cost of maintaining production facilities that are not directly related to products sold, so we use a “full capacity” allocation of overhead based on an estimate of what product costs would be if the manufacturing facilities were operating on a full-time basis and producing products at the designed capacity.
| 45 |
The following table shows the relationship of direct costs to product sales for the three months ended March 31, 2018 and 2017:
Direct Margin and Gross Profit Summary
| For the Three Months Ended March 31, | ||||||||||||
| 2018 | 2017 | Change | ||||||||||
| Product Sales | $ | 886,337 | $ | 157,700 | $ | 728,637 | ||||||
| Direct Costs | 468,191 | 116,770 | 351,421 | |||||||||
| Direct Cost Margin | 418,146 | 40,930 | 377,216 | |||||||||
| % of Sales | 47.2 | % | 26.0 | % | 21.2 | % | ||||||
| Unallocated Manufacturing Expense | 746,583 | 371,150 | 375,433 | |||||||||
| Gross Loss on Product Sales | $ | (328,437 | ) | $ | (330,220 | ) | $ | 1,783 | ||||
| % of Sales | (37.1 | )% | (209.4 | )% | 172.3 | % | ||||||
We believe that the fluctuations in gross loss on product sales and direct cost from period to period are not indicative of future margins because of the relatively small size of our sales in comparison to our future expectations. Direct costs vary depending on the size of an order, the specific products being ordered, and other factors like shipping destination (which on small orders can represent a significant percentage of the cost).
Costs associated with grant revenue tend to be a mixture of facilities use, management time, labor from scientists, technicians and manufacturing personnel, and some supplies. Because of the difficulty of developing and maintaining an administrative system to gather direct costs for grants, together with the relatively small size of grant revenue, we do not track direct costs for grant revenue as a separate cost category. Therefore, we do not calculate direct cost margins associated with grant revenue but, rather, we view this revenue as being supported by indirect corporate expenses.
Costs associated with licensing revenue tend to be a mixture of IP costs as well as management and administrative expenses that are indirect in nature. As such, we do not assign direct costs to licensing revenue. Where revenue from a license agreement can be assigned to specific product revenue, we classify this revenue as product sales and, using our standard cost system, assign direct costs to those sales.
The remaining “non-direct” costs of operating our manufacturing facilities are recorded as unallocated manufacturing expenses. These expenses include personnel costs, rent, utilities, indirect supplies, depreciation, and related indirect expenses. Unallocated manufacturing expenses are expensed as incurred. We allocate these costs to direct product costs based on the proportion of these expenses that would be representative direct product costs if we were operating our factory at full capacity.
For the three months ended March 31, 2018, unallocated manufacturing expenses increased by 101% to $746,583 as compared to $371,150 in 2017. The increase of $375,433 is largely due to higher levels of manufacturing overhead expense as we prepare for and fulfill higher volume commercial orders.
Sales, General and Administrative Expenses
During the first three months ended March 31, 2018 we incurred selling, general and administrative expenses (SGA) of $1,186,679. This is an increase of approximately $190,092 or 19.1% from the same period in 2017, primarily due to increases in personnel costs as a result of our growth in sales. As we continue to grow and gain traction in the marketplace our SGA expenses will increase but we expect them to become more fixed in nature as we achieve economies of scale.
Research and Development Expenses
Research and development expenses for the three months ended March 31, 2018 were $277,064 as compared to $263,564 for the same period in 2017, an increase of $13,500 or 5%.
| 46 |
Other Income (Expense)
The following table shows a comparison of other income and expense by major expense component for the three months ended March 31, 2018 and 2017:
| For the Three Months Ended March 31, | ||||||||||||
| 2018 | 2017 (Restated) | $ | ||||||||||
| Interest expense, net | $ | (85,169 | ) | $ | (59,088 | ) | (26,081 | ) | ||||
| Gain from change in fair value of derivative liability – warrants | - | 29,171 | (29,171 | ) | ||||||||
| Government incentives, net | 3,253 | (24 | ) | 3,277 | ||||||||
| Total | $ | (81,916 | ) | $ | (29,941 | ) | (51,975 | ) | ||||
Interest expense, net of interest income in the three months ended March 31, 2018, increased by $26,081 compared to the same period in 2017. The increase is due to an increase in the amount of indebtedness outstanding under the Dow Facility, the balance of which increased to $5 million as of March 31, 2018, from $2 million as of March 31, 2017.
Gain/(loss) from changes in the fair value of derivative liability warrants from the previous valuation period are characterized as other income (expense) on our Statement of Operations as a result of the GAAP requirement to use variable accounting for such instruments. These values fluctuate from period to period as a result of updating inputs used in the trinomial lattice model used to value such warrants, including risk free rate, volatility, remaining term of each warrant, and the underlying stock price assumption used in such calculations. On September 30, 2017, we reclassified 224,897 warrants related to Series B Preferred stock from derivative liabilities to equity and we are no longer required to record the change in fair values for these instruments.
Government incentives include accruals for incentive awards from state and local government entities, these incentives often relate to new hires or job creation activities.
Cash Flow Summary
The following condensed cash flow statement compares cash flow from operating, investing, and financing activities for the three months ended March 31, 2018 and 2017:
| For the Three Months Ended March 31, | ||||||||||||
| 2018 | 2017 | $ | ||||||||||
| Cash, beginning of period | $ | 2,845,798 | $ | 1,785,343 | 1,060,455 | |||||||
| Net Cash provided (used) by: | ||||||||||||
| Operating activities | (1,270,591 | ) | (1,007,741 | ) | (262,850 | ) | ||||||
| Investing Activities | (889,931 | ) | (241,433 | ) | (648,498 | ) | ||||||
| Financing Activities | 1,599,841 | 612,512 | 987,329 | |||||||||
| Net decrease in cash | (560,681 | ) | (636,662 | ) | 75,981 | |||||||
| Cash, end of period | $ | 2,285,117 | $ | 1,148,681 | 1,136,436 | |||||||
Investing activities for the three months ended March 31, 2018 included net capital expenditures for the purchase of property and equipment of $874,357 and $15,574 for intellectual property as compared with $203,664 for property and equipment and $37,769 for intellectual property during the same period in 2017. These levels of capital expenditures are higher as we have begun to update and install equipment necessary to increase production capacity to meet anticipated customer orders for those customers who are moving into commercialization of products containing our materials.
Financing activities provided a net increase in cash of $1,599,841 and $612,512 for the three months ended March 31, 2018 and 2017, respectively. For the three months ended March 31, 2018 gross proceeds from the issuance of common stock was $1,615,400 and stock issuance expenses were $9,838 as compared to proceeds from the issuance of common stock for the three months ended March 31, 2017 of $771,800 and stock issuance expenses of $154,413.
Liquidity and Capital Expenditures
We have historically incurred losses from operations and we may continue to generate negative cash flows as we implement our business plan. Our condensed consolidated financial statements are prepared using US GAAP as applicable to a going concern, which contemplates the realization of assets and liquidation of liabilities in the normal course of business.
In December 2016, we entered into the Dow Facility to provide up to $10 million of secured debt financing at an interest rate of 5% per year, drawable at our request under certain conditions. As of May 14, 2018, we had drawn $5.0 million under the Dow Facility. The remaining $5 million will become available to us once we have raised $10 million of equity capital after October 31, 2016. As of May 14, 2018, we have sold 1,276,007 shares of common stock pursuant to our IPO at a price of $8.00 per share for gross proceeds of $10,208,056. However, only $7,007,024 of this amount has been raised during the measurement period beginning November 1, 2016. Thus, we still need to raise $2,992,976 of equity capital prior to the remaining $5.0 million under the Dow Facility becoming available to us.
| 47 |
As of May 14, 2018, we had cash on hand of $1,660,600. We believe our cash from increasing commercial sales activity and various financing sources will fund our operations for at least the next 12 months. We intend that the primary means for raising funds will be through our IPO and the additional $5 million of proceeds from the Dow Facility that becomes available to us after we have raised another $3 million of equity capital as noted above; however, we can make no assurances that we will raise such equity capital and be able to access the additional $5 million under the Dow Facility. Taking into account our current cash position as noted above and an additional $3 million in proceeds from our IPO, which would allow us to draw up to $5 million from the Dow Facility, we believe that we can fund our operations including planned capital expenditures for at least the next 12 months. In addition, on March 28, 2018, two of our shareholders committed to provide the balance of the equity capital required to open up the remaining $5.0 million of availability under the Dow Facility during for the twelve-month period ended March 31, 2019 to the extent the Company is unable to raise such funds from other third parties. As of May 14, 2018, one such shareholder had already funded $500,000 toward this commitment and the unfunded balance of the standby commitment, after taking into consideration other recent proceeds from this Offering, was $3.0 million.
In the event we are unable to fund our operations from existing cash on hand, operating cash flows, additional borrowings or raising equity capital, we may be forced to reduce our expenses, slow down our growth rate, or discontinue operations. Our condensed consolidated financial statements do not include any adjustments relating to the recoverability and classification of recorded asset amounts or the amounts and classification of liabilities that might be necessary should we be unable to continue as a going concern.
Results of Operations for the Year Ended December 31, 2017 Compared with the Year Ended December 31, 2016
The following table summarizes the results of our operations for the years ended December 31, 2017 and 2016.
| Year Ended December 31 | Change 2017 – 2016 | |||||||||||||||
| 2017 | 2016 (restated) | $ | % | |||||||||||||
| Total Revenues | $ | 1,805,133 | $ | 736,490 | 1,068,643 | 145.1 | ||||||||||
| Cost of Goods Sold | 2,652,776 | 1,586,662 | 1,066,114 | 67.2 | ||||||||||||
| Gross Loss | (847,643 | ) | (850,172 | ) | 2,529 | (.3 | ) | |||||||||
| Research & Development Expense | 923,419 | 1,124,165 | (200,746 | ) | (17.9 | ) | ||||||||||
| Sales, General & Administrative Expense | 4,434,322 | 3,548,605 | 885,717 | 25.0 | ||||||||||||
| Total Operating Expense | 5,357,741 | 4,672,770 | 684,971 | 14.7 | ||||||||||||
| Operating Loss | (6,205,384 | ) | (5,522,942 | ) | (682,442 | ) | 12.4 | |||||||||
| Other Expense | (373,309 | ) | (226,805 | ) | (146,504 | ) | 64.6 | |||||||||
| Net Loss | $ | (6,578,693 | ) | $ | (5,749,747 | ) | (828,946 | ) | 14.4 | |||||||
Revenues
Revenues for the years ended December 31, 2017 and 2016, by category, are shown below.
| Year Ended December 31 | Change 2017 – 2016 | |||||||||||||||
| 2017 | 2016 | $ | % | |||||||||||||
| Product Sales | $ | 1,605,178 | $ | 356,730 | 1,248,448 | 350.0 | ||||||||||
| Grants | 124,955 | 279,760 | (154,805 | ) | (55.3 | ) | ||||||||||
| Licensing Revenues | 75,000 | 100,000 | (25,000 | ) | (25.0 | ) | ||||||||||
| Total | $ | 1,805,133 | $ | 736,490 | 1,068,643 | 145.1 | ||||||||||
Product sales consist of two broad categories: (1) material sold to customers for research or development purposes; and (2) production orders for customers. Typically, the order sizes for the first category are relatively small, however we expect orders in the second category to be much larger in the future. For the year ended December 31, 2017, product sales increased by $1,248,448 or 350% from the comparable period in the prior year. The main reason for the increase in product sales was customers moving through development programs towards commercialization, requiring larger quantities of our materials for advanced testing, pilot production and commercial-scale production activities. We believe that those customers already in production will increase their order volume as demand increases and other customers will begin to move into commercial volume production as they gain more experience in working with our materials and engage their own customers.
| 48 |
Order Summary
The table below shows a comparison of domestic and international orders fulfilled (note that this does not include orders for free samples). The table also includes the average order size for product sales. These numbers indicate that our customer base remains active with research and development projects that use our materials, but that the order size is increasing as more customers approach commercial status with products using our materials. The average order size for the product revenue during the year ended December 31, 2017 increased by 337% as compared to the same period in 2016. Although the average size of these orders is still relatively small, we have begun shipping in metric ton quantities to multiple customers.
| Year Ended December 31 | Change 2017 – 2016 | |||||||||||||||
| 2017 | 2016 | $ | % | |||||||||||||
| Number of orders – domestic | 114 | 109 | 5 | 5 | ||||||||||||
| Number of orders – international | 146 | 137 | 9 | 7 | ||||||||||||
| Number of orders – total | 260 | 246 | 14 | 6 | ||||||||||||
| Average order size – $ | $ | 6,174 | $ | 1,453 | $ | 4,721 | 325 | % | ||||||||
Grant Revenue
Grant revenues of $124,955 in 2017 consisted of proceeds from sources as shown in the table below. The largest of these sources in both 2017 and 2016 came from the Department of Energy or DOE. In June 2016, a $150,000, nine-month DOE Phase I Small Business Innovation Research (SBIR) grant was awarded to develop and demonstrate a composite anode material that delivers improved capacity retention during full lithium-ion battery charge to further the nation’s energy strategy to reduce reliance on fossil fuels and improve the environment. As of the grant expiration date of March 14, 2017, $149,979 had been billed against it. The grant is considered billed in full and completed. The table below shows the components of grant revenue.
| Year Ended December 31 | ||||||||
| 2017 | 2016 | |||||||
| US Department of Energy | $ | 93,747 | $ | 214,597 | ||||
| Grand Valley State | — | 25,000 | ||||||
| Daimler / University of Michigan | 31,208 | 40,163 | ||||||
| Total | $ | 124,955 | $ | 279,760 | ||||
Licensing Revenue
The Company and POSCO, a shareholder of the Company, entered into a license agreement dated June 8, 2011, pursuant to which POSCO agreed to pay a minimum annual royalty of $100,000 per year if certain circumstances existed, among other things. The Company believed that this minimum annual royalty became due annually beginning on February 28, 2015, and up until June 30, 2017, recorded this royalty revenue at a rate of $25,000 per quarter. POSCO disputed its obligation to pay this minimum annual royalty and did not pay the royalty in any prior year. We filed a demand for arbitration in the International Court of Arbitration on March 9, 2016, in an effort to resolve the dispute. Pursuant to a confidential settlement, on November 3, 2017, the Company and POSCO agreed to settle the dispute and to dismiss the arbitration. Amounts owed to us were paid by POSCO in November 2017. There were no amounts due and recorded on our balance sheet at December 31, 2017.
Cost of Goods Sold
We use a standard cost system to estimate the direct costs of products sold. Direct costs include estimates of raw material costs, packaging, freight charges net of those billed to customers, and an allocation for direct labor and manufacturing overhead. Because of the nature of our production processes, there is a substantial fixed manufacturing expense requirement that represents the ongoing cost of maintaining production facilities that are not directly related to products sold, so we use a “full capacity” allocation of overhead based on an estimate of what product costs would be if the manufacturing facilities were operating on a full-time basis and producing products at the designed capacity.
Gross Profit Summary
The following table shows the relationship of direct costs to product sales for the years ended December 31, 2017 and 2016:
Gross Profit Summary
| Year Ended December 31 | Change 2017 – 2016 | |||||||||||||||
| 2017 | 2016 | $ | % | |||||||||||||
| Product Sales | $ | 1,605,178 | $ | 356,730 | 1,248,448 | 350.0 | ||||||||||
| Direct Costs | 911,115 | 172,394 | 738,721 | 428.5 | ||||||||||||
| Direct Cost Margin | 694,063 | 184,336 | 509,727 | 276.5 | ||||||||||||
| % of Sales | 43.2 | % | 51.7 | % | ||||||||||||
| Unallocated Manufacturing Expense | 1,741,661 | 1,414,268 | 327,393 | 23.1 | ||||||||||||
| Gross Loss on Product Sales | $ | (1,047,598 | ) | $ | (1,229,932 | ) | 182,334 | (14.8 | ) | |||||||
| 49 |
We believe that the fluctuations in gross loss on product sales and direct cost from period to period are not indicative of future margins because of the relatively small size of our sales in comparison to our future expectations. Direct costs vary depending on the size of an order, the specific products being ordered, and other factors like shipping destination (which on small orders can represent a significant percentage of the cost).
Costs associated with grant revenue tend to be a mixture of facilities use, management time, labor from scientists, technicians and manufacturing personnel, and some supplies. Because of the difficulty of developing and maintaining an administrative system to gather direct costs for grants, together with the relatively small size of grant revenue, we do not track direct costs for grant revenue as a separate cost category. Therefore, we do not calculate direct cost margins associated with grant revenue but, rather, we view this revenue as being supported by indirect corporate expenses.
Costs associated with licensing revenue tend to be a mixture of IP costs as well as management and administrative expenses that are indirect in nature. As such, we do not assign direct costs to licensing revenue. Where revenue from a license agreement can be assigned to specific product revenue, we classify this revenue as product sales and, using our standard cost system, assign direct costs to those sales.
The remaining “non-direct” costs of operating our manufacturing facilities are recorded as unallocated manufacturing expenses. These expenses include personnel costs, rent, utilities, indirect supplies, depreciation, and related indirect expenses. Unallocated manufacturing expenses are expensed as incurred. We allocate these costs to direct product costs based on the proportion of these expenses that would be representative direct product costs if we were operating our factory at full capacity.
For the year ended December 31, 2017, unallocated manufacturing expenses increased by 23% to $1,741,661 as compared to $1,414,268 in 2016. The increase of $327,393 is largely due to higher levels of manufacturing overhead expense as we prepare for and fulfill higher volume commercial orders.
Research and Development Expenses
Research and development expenses for the year ended December 31, 2017 decreased by 18% to $923,419 as compared to $1,124,165 for the year ended December 31, 2016. The decrease of $200,746 is largely due to the higher expenses incurred in 2016 to work on and complete the DOE Phase I SBIR grant discussed above.
Sales, General and Administrative Expenses
During 2017 we incurred selling, general and administrative expenses (SG&A) of $4,434,322. This is an increase of $885,717 or 25% from 2016 which was primarily the result of a one-time, non-cash charge of $501,071 recorded in July 2017 to account for the cancellation and replacement of certain stock options. See Note 12 in the financial statements for further discussion of the modifications. In addition, during the third quarter of 2016 we incurred a $182,146 reduction in SG&A expenses associated with reclassifying certain expenses related to the DOE Phase I SBIR grant into our research and development expenses. This resulted in a reduction of SG&A expenses in 2016 that did not occur in 2017. As we continue to grow and gain traction in the marketplace we expect that our SG&A expenses will fluctuate but should stabilize and become more fixed in nature as we achieve economies of scale.
Other Income (Expense)
The following table shows a comparison of other income and expense by major expense component for the years ended December 31, 2017 and 2016:
| Year Ended December 31 | Change 2017 – 2016 | |||||||||||||||
| 2017 | 2016 (restated) | $ | % | |||||||||||||
| Interest expense, net | $ | (254,091 | ) | $ | (298,208 | ) | 44,117 | (14.8 | ) | |||||||
| Gain (loss) from change in fair value of derivative liability - warrants | (46,612 | ) | 61,911 | (108,523 | ) | (175.3 | ) | |||||||||
| Government incentives, net | (72,606 | ) | 79,635 | (152,241 | ) | (191.2 | ) | |||||||||
| Loss on disposal of equipment and intangible assets | — | (70,143 | ) | 70,143 | (100.0 | ) | ||||||||||
| Total | $ | (373,309 | ) | $ | (226,805 | ) | (146,504 | ) | 64.6 | |||||||
| 50 |
Interest expense, net of interest income in the year ended December 31, 2017, decreased by $44,117 compared to 2016. The net decrease in expense reflects the principal reductions (pay downs) of our capital lease commitments.
Gain/(loss) from changes in the fair value of derivative liability warrants from the previous valuation period are characterized as other (expense)/other income on our Statement of Operations as a result of the GAAP requirement to use variable accounting for such instruments. These values fluctuate from period to period as a result of updating inputs used in the trinomial lattice model used to value such warrants, including risk free rate, volatility, remaining term of each warrant, and the underlying stock price assumption used in such calculations. In 2017 we implemented ASU 2017-11 and reclassified 224,897 warrants related to Series B Preferred stock from derivative liabilities to equity and we are no longer required to record the change in fair values for these instruments. See Note 2 and Note 9 for further information.
Government incentives include accruals for incentive awards from state and local government entities relating to new hires during the period indicated, net of any true up of previous accruals to reflect actual payments. In 2016, we accrued $74,000 for expected incentive awards from the Michigan Economic Growth Authority (MEGA), based on our experience in receiving such incentive awards over the previous four years for our hiring practices. Upon review by MEGA in May 2017, our 2016 incentive was declined, because of our failure to meet a baseline assumed hiring threshold, which we missed by two full-time equivalent employees by December 31, 2016. Since 2016 was the final year for this incentive award program, we wrote off this previously accrued award in 2017, and thus we recorded a loss of $74,024 in the year ended December 31, 2017. This loss was offset by a small state incentive, $1,418, received in 2017.
Cash Flow Summary
The following condensed cash flow statement compares cash flow from operating, investing, and financing activities for the year ended 2017 and 2016. Net cash used by operating activities increased 17% during 2017 as compared to 2016 because of higher levels of manufacturing overhead expense as we prepared for and fulfilled higher volume commercial orders.
| Year Ended December 31 | Change 2016 – 2017 | |||||||||||||||
| 2017 | 2016 | $ | % | |||||||||||||
| Cash, beginning of period | $ | 1,785,343 | $ | 1,060,224 | 725,119 | 68.4 | ||||||||||
| Net Cash provided (used) by: | ||||||||||||||||
| Operating activities | (4,623,996 | ) | (3,964,206 | ) | (659,790 | ) | 16.6 | |||||||||
| Investing Activities | (743,196 | ) | (216,777 | ) | (526,419 | ) | 242.8 | |||||||||
| Financing Activities | 6,427,647 | 4,906,102 | 1,521,545 | 31.0 | ||||||||||||
| Net increase (decrease) in cash | 1,060,455 | 725,119 | 335,336 | 46.2 | ||||||||||||
| Cash, end of period | $ | 2,845,798 | $ | 1,785,343 | 1,060,455 | 59.4 | ||||||||||
Net cash used in operating activities for the year ended December 31, 2017 and 2016 was $4,623,996 and $3,964,206, respectively.
Investing activities for the year ended December 31, 2017 included net capital expenditures for the purchase of property and equipment of $602,237 and $140,957 for intellectual property as compared with $93,002 for property and equipment and $123,775 for intellectual property during the same period in 2016. These levels of capital expenditures are higher as we have begun to update and install equipment necessary to increase production capacity to meet anticipated customer orders for those customers who are moving into commercialization of products containing our materials.
Financing activities provided a net increase in cash of $6,427,647 and $4,906,102 for the year ended December 31, 2017 and 2016, respectively. For the year ended December 31, 2017 gross proceeds from the issuance of common stock was $3,665,400 and stock issuance expenses were $237,227 as compared to proceeds from the issuance of common stock for the year ended December 31, 2016 of $4,069,255 and stock issuance expenses of $638,174. Financing activities for the year ended December 31, 2017 also included $3,000,000 of loan proceeds from the Dow Facility (see Note 7 of our financial statements in this prospectus) versus $2,000,000 during the year ending December 31, 2016.
| 51 |
Liquidity and Capital Expenditures
We have historically incurred losses from operations and we may continue to generate negative cash flows as we implement our business plan. Our condensed consolidated financial statements are prepared using US GAAP as applicable to a going concern, which contemplates the realization of assets and liquidation of liabilities in the normal course of business.
In December 2016, we entered into the Dow Facility to provide up to $10 million of secured debt financing at an interest rate of 5% per year, drawable at our request under certain conditions. As of May 14, 2018, we had drawn $5.0 million under the Dow Facility. The remaining $5 million will become available to us once we have raised $10 million of equity capital after October 31, 2016. As of May 14, 2018, we have sold 1,276,007 shares of common stock pursuant to our IPO at a price of $8.00 per share for gross proceeds of $10,208,056. However, only $7,007,024 of this amount has been raised during the measurement period beginning November 1, 2016. Thus, we still need to raise $2,992,976 of equity capital prior to the remaining $5.0 million under the Dow Facility becoming available to us.
As of December 31, 2017, we had cash on hand of $2,845,798 and as of March 31, 2018, we had cash on hand of $2,285,182. We believe our cash from increasing commercial sales activity and various financing sources will fund our operations for at least the next 12 months. We intend that the primary means for raising funds will be through our IPO and the additional $5 million of proceeds from the Dow Facility that becomes available to us after we have raised another $3 million of equity capital as noted above; however, we can make no assurances that we will raise such equity capital and be able to access the additional $5 million under the Dow Facility. Taking into account our current cash position as noted above and an additional $3 million in proceeds from our IPO, which would allow us to draw up to $5 million from the Dow Facility, we believe that we can fund our operations including planned capital expenditures for at least the next 12 months. In addition, on March 28, 2018, two of our shareholders committed to provide the balance of the equity capital required to open up the remaining $5.0 million of availability under the Dow Facility during twelve-month period ended March 31, 2019 to the extent the Company is unable to raise such funds from other third parties. As of May 14, 2018, one such shareholder had already funded $500,000 toward this commitment and the unfunded balance of the standby commitment, after taking into consideration other recent proceeds from this Offering, was $3.0 million.
In the event we are unable to fund our operations from existing cash on hand, operating cash flows, additional borrowings or raising equity capital, we may be forced to reduce our expenses, slow down our growth rate, or discontinue operations. Our condensed consolidated financial statements do not include any adjustments relating to the recoverability and classification of recorded asset amounts or the amounts and classification of liabilities that might be necessary should we be unable to continue as a going concern.
| 52 |
Overview
XG Sciences was formed in May 2006 for the purpose of commercializing certain technology to produce graphene nanoplatelets. First isolated and characterized in 2004, graphene is a single layer of carbon atoms configured in an atomic-scale honeycomb lattice. Among many noted properties, monolayer graphene is harder than diamonds, lighter than steel but significantly stronger, and conducts electricity better than copper. Graphene nanoplatelets are particles consisting of multiple layers of graphene. Graphene nanoplatelets have unique capabilities for energy storage, thermal conductivity, electrical conductivity, barrier properties, lubricity and the ability to impart physical property improvements when incorporated into plastics or other matrices.
We believe the unique properties of graphene and graphene nanoplatelets will enable numerous new product applications and the market for such products will quickly grow to be a significant market opportunity. Our business model is to design, manufacture and sell advanced materials we call xGnP®graphene nanoplatelets and value-added products incorporating xGnP® nanoplatelets. We currently have hundreds of customers trialing our products for numerous applications, including, but not limited to composites, packaging, lithium ion batteries, lead acid batteries, thermal transfer fluids, other thermal management applications, inks and coatings, printed electronics, construction materials, cement, and military uses. We believe our proprietary processes have enabled us to be a low-cost producer of high-quality, graphene nanoplatelets and that we are well positioned to address a wide range of end-use applications.
Forms of Graphene
Graphene has been hailed as a “miracle material” because of its many potential uses in products ranging from hand-held electronics to automobiles to spacecrafts. Its material properties include very high strength, very high thermal conductivity, good electrical conductivity, strong barrier properties, and very high stiffness. These properties make graphene potentially useful in thousands of specific products.
The term “graphene” is used in the popular press to cover a variety of specific forms of the material, but we generally think about two broad classes of graphene materials:
| 1. | One-atom thick films of carbon commonly referred to as monolayer graphene, manufactured from gases by assembling molecules to form relatively large, transparent sheets of material. We do not manufacture these films and do not participate in the markets for these films and believe that in general, the markets for these films do not compete with those for graphene nanoplatelets. |
| 2. | Ultra-thin particles of carbon that usually consist of a few layers of graphene sheets. Because they are thin and can be manufactured in a range of diameters, these graphene particles are useful for a wide variety of applications. Our typical particles are about 5 nanometers thick — or about 50,000 times thinner than a human hair and range in diameter from less than 1 micron to 100 microns. The manufacture of these graphene particles is our main area of expertise, and their use in practical applications is the focus of our marketing and development efforts. |
Overall Market Size
The potential market size for graphene-related products is difficult to accurately predict. This is primarily related to the fact that graphene is a relatively new material for which no historical use data exists on a commercial scale. However, because graphene is a new form of carbon and with unique performance attributes, one may consider other carbon forms such as carbon nanotubes or carbon fibers or activated carbon as a basis for estimating the potential market size for graphene in as much as graphene’s enhanced performance may take market share from one or more of the more established forms of carbon. We also estimate target market sizes by using a bottom-up approach where we look at existing applications for graphene and estimate sales by year as a function of graphene’s unique performance attributes and value proposition for specific customers. In some instances, we are able to get fairly granular data on market estimates. In other areas, we must infer a potential market size from related materials.
The figure given below provides estimates for the 2018 total available market in a range of target applications. Since our advanced materials are sometimes used as a replacement material to supplant the current materials used in these applications and are sometimes used as an additive material to augment the incumbent materials, it is difficult to determine the exact market potential and by segment. However, this information does provide an indication of the relevant markets and their respective sizes. Naturally, we do not expect to address all of these markets, but we do see opportunities to capture significant market share (1% to 20%) in selected targeted markets. The following discussion applies to the individual segments of the chart:
| • | “High strength composites” is the size of the carbon fiber market used in advanced composites for automobiles and industrial applications. xGnP® offers improvements in physical properties in a range of matrices and is a candidate to augment and/or substitute carbon fibers in high strength composites. |
| 53 |
| • | “Lithium Ion Battery Anode Active Materials” is a forecast for total carbon materials sold into the application, for which our SiG materials are a potential direct replacement with significant performance advantages and our xGnP® graphene nanoplatelets may be used as additives to either the anode or cathode to improve their performance. |
| • | “Thermal Paper” is the forecast annual sales of “carbon-based” sheet products used to control thermal spreading or provide heat management in portable electronic devices. |
| • | “Automotive” includes miscellaneous automotive applications such as electromagnetic interference shielding of engine or control components, circuits printed with conductive inks, and thermal shielding. |
| • | “Sensors” includes carbon-based sheets or printed substrates into which our materials may be incorporated to improve results. |
| • | “Packaging” includes conductive inks or coatings printed on packages as part of circuits or sensors. |
| • | “RFID” means Radio Frequency Identification Devices that are printed or installed on packaged items to facilitate tracking. Our materials can be used in conductive inks and components used to print circuits, batteries, or antennas. |
| • | “Supercapacitors” means high-capacity capacitors that are typically fabricated with electrodes made from high-surface area carbon materials. |
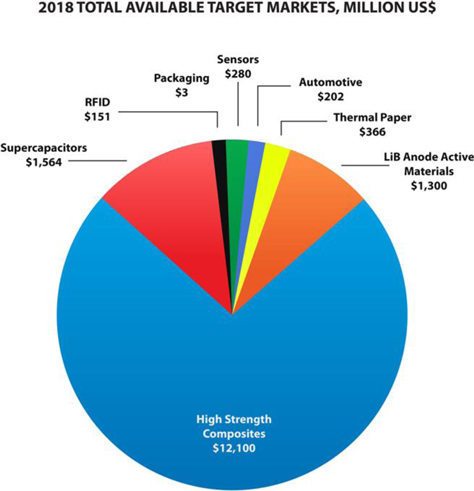
Note: Market sizes estimated by XG Sciences, based on customer input as well as reference market sizes for equivalent or identical materials from outside market research sources including:
(a) ID Tech “Graphene Markets, Technologies and Opportunities 2013 – 2018.”
| 54 |
(b) ID Tech “Conductive Ink Markets 2014 – 2024, Silver & Copper Inks & Pastes — and Beyond.”
(c) Avicenne Energy “The Rechargeable Battery Market, 2014 – 2025” July 2015.
(d) Prismark Partners “Thin Carbon-Based Heat Spreaders” August 2014.
ID Tech, in a published study (Graphene Markets, Technologies and Opportunities 2013 – 2018), estimates 2018 global graphene sales slightly in excess of $100 million and in a range of applications. Their projections are based largely on replacement of existing carbon-based materials and with very minimal market penetration. They do not consider such products as XG SiG®, and XG Leaf® that are products incorporating our ability to tailor the form and function of xGnP®into value-added product platforms. We believe we will generate sales from the design and manufacture of both our xGnP®nanoplatelets and value-added products derived therefrom. As such, we are not able to rely on market projections such as those provided by ID Tech and others but rather, use a combination of total available market data, customer input and internal estimates. Many of our customers are evaluating graphene for numerous different applications, including, but not limited to, lithium ion batteries, thermal shielding and heat transfer, inks and coatings, printed electronics, construction materials, tires, beverage packaging, golf balls, field hockey sticks, adhesives, composites, and military uses.
The market for materials used in lithium ion batteries is large and growing rapidly as shown in the figure below (Avicenne Energy, The Battery Show, Novi, Michigan, September 2017). We believe our ability to address next generation battery materials represents a significant opportunity for us.
2016 Lithium Ion Battery Value Chain – Market Demand

We also believe the market for thermal management materials is large and rapidly growing. In a press release dated, October 17, 2017, Gartner, Inc., a leading research organization, estimated the 2018 global smartphone market at more than 1.6 billion units and worldwide combined shipments of devices (PC’s, tablets, ultraphones and mobile devices) are expected to reach 2.35 billion units in 2018. Every cell phone has some form of thermal management system, and we believe many of the new smart phones and other mobile devices being developed can benefit from the performance advantages we are able to achieve with XG Leaf®. In November 2017, International Data Corporation (IDC) in their Worldwide Quarterly Tablet Tracker estimated the global shipment of tablets in the third quarter at 40 million units (Q1 at 36.2 million units and Q2 at 37.9 million units). Thus, we believe our XG Leaf® product line is well positioned to address a very large and rapidly growing market.
Graphene Manufacturing Processes
The primary manufacturing processes in use today are plotted below as a function of their ability to tailor both thickness (correlates with surface area) and particle size.
| 55 |
Graphene Processes
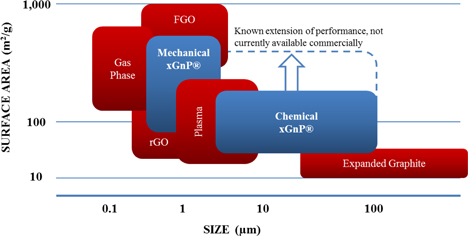
XG Sciences uses two proprietary processes to create our xGnP® nanoplatelets: i) chemical intercalation of natural graphite followed by thermal exfoliation, and ii) high-shear mechanical exfoliation. We believe our proprietary processes have enabled us to be a low-cost producer of high quality, graphene nanoplatelets and that we are well positioned to address a wide range of end-use applications. We chose not to pursue a graphene oxide process because it is inherently more costly, may create toxic byproducts that are difficult to handle at scale, produces nanoplatelets with more surface functional groups and higher levels of dislocation (e.g., holes) in the basel planes, both of which tend to degrade electrical and thermal performance. Gas phase processes produce very small particle sizes which make them slightly better for applications where optical purity is a requirement. However, gas phase processes are both costly and difficult to scale, thus we chose not to pursue this technology as well. Expanded graphite is created by swelling natural graphite in a solvent like NMP and then sonicating (the act of applying sound energy to agitate particles) to separate the layers. The process tends to make rather thick material which limits the amount of platelet overlap that can be achieved and therefore degrades desired properties. In addition, many applications will not tolerate residual solvent that is difficult and costly to remove.
XG Sciences Proprietary Manufacturing Processes
XG Sciences offers an advanced material platform in the form of varying grades of graphene nanoplatelets produced from two processes, each of which can be customized in many ways. Our proprietary manufacturing processes control the attributes of the graphene nanoparticles as summarized below. These attributes contribute to a range of properties that can be mapped to various functions and applications. Because we have multiple production processes and because we have invested in application know-how and development of value-added product formulations, we are able to cost effectively address a range of market needs in multiple market segments, providing breadth to our base capabilities and product portfolio.
| 56 |

Products
We target our xGnP® nanoplatelets for use in a range of large and growing end-use markets. Our proprietary manufacturing processes allow us to produce nanoplatelets with varying performance characteristics that can be tuned to specific end-use applications based on customer requirements. We manage our business with five major product lines at this time:
| 1. | Bulk Materials. We sell bulk materials under the trademarked brand name of xGnP®graphene nanoplatelets. These materials are produced in various grades, which are analogous to average particle thickness, and average particle diameters. There are three commercial grades (Grades H, M & R), each of which is offered in three standard particle sizes and a fourth, C Grade, which is offered in three standard surface areas. These bulk materials, which normally ship in the form of a dry powder, are especially applicable for use as additives in polymeric or metallic composites, or in coatings or other formulations where particular electrical, thermal or barrier applications are desired by our customers. We also offer our material in the form of dispersions of nanoplatelets in liquids such as water, alcohol, or organic solvents, or mixed into resins or polymers such as epoxies or urethanes. We use two different commercial processes to produce these bulk materials: |
| • | Grade H/M/R materials are produced through chemical intercalation of natural graphite followed by thermal exfoliation using a proprietary process developed by us. The “grade” designates the thickness and surface characteristics of the material, and each grade is available in various average particle diameters. Surface area, calculated by the Brunauer, Emmet, and Teller (BET) Method, is used as a convenient proxy for thickness, so each grade of products produced through chemical intercalation is designated by its average surface area, which ranges from 50 to 150 m2/g of material. We are able to extend the surface area higher but are not yet producing these materials commercially. As the market need emerges for few layer graphene, we will consider making these materials available commercially. We recently introduced a new Grade of xGnP® powders, R-Grade, with improved electrical conductivity targeting use in LiB as a cathode conductive additive and for use in various electrically and thermally conductive ink and composite applications. |
| • | Grade C materials, and some related composite materials, are produced through a high-shear mechanical exfoliation using a proprietary process and equipment that we invented, designed, and constructed. The Grade C materials are smaller particles than those grades produced through chemical exfoliation, and Grade C materials are designated by their BET surface area, which ranges from 300 to 800 m2/g. We are able to produce other surface areas but are not yet making those available commercially. |
| 57 |
| 2. | Composites. These consist of compositions of specially designed xGnP® graphene nanoplatelets formulated in pre-dispersed mixtures that can be easily incorporated into various polymers. Our integrated composites portfolio includes pre-compounded resins derived from a range of thermoplastics as well as mother batches of resins and xGnP® nanoplatelets and their combination with resins and fibers for use in various end-use applications that may include industrial, automotive and sporting goods and which have demonstrated efficacy in standard injection molding, compression molding, blow molding and 3-D processes, to name but a few. In addition, we offer various bulk materials with demonstrated efficacy in plastic composites to impart improved physical performance to such matrices, which may be supplied as dry powders or as aqueous or solvent-based dispersions or cakes. We have also targeted use of our graphene nanoplatelets as an additive in cement mixtures, which we believe results in improved barrier resistance, durability, toughness and corrosion protection. Our GNP® Concrete Additive promotes the formation of more uniform and smaller grain structure in the cement. This fine-grain and uniform structure gives concrete improvements in flexural and compressive strength. In addition, the embedded graphene nanoplatelets will reduce water absorption and stop cracks from forming as well as retard crack propagation, should any cracks form – the combination of which will improve lifetime and durability of cement. |
| 3. | Energy Storage Materials. These value-added products consist of specialty advanced materials that have been formulated for specific applications in the energy storage segment. Chief among these is our proprietary, specially formulated silicon-graphene composite material (also referred to as “SiG” or “XG SiG®”) for use in lithium-ion battery anodes. XG SiG®targets the never-ending need for higher battery capacity and longer life. In several customer trials, our SiG material has demonstrated the potential to increase battery energy storage capacity by 3-5x what is currently available with conventional lithium ion batteries today. Additionally, we offer various bulk materials for use as conductive additives for cathodes and anodes in lithium-ion batteries, as an additive to anode slurries for lead-carbon batteries, as a component in coatings for current collectors in lithium-ion batteries and we are investigating the use of our materials as part of other battery components. |
| 4. | Inks and Coatings. These value-added products consist of specially-formulated dispersions of xGnP® together with solvents, binders, and other additives to make electrically or thermally conductive products designed for printing or coating and which are showing promise in diverse customer applications such as advanced packaging, electrostatic dissipation and thermal management. We also offer a set of standardized ink formulations suitable for printing. These inks offer the capability to print electrical circuits or antennas, and might be suitable for other electrical or thermal applications. All of these formulations can be customized for specific customer requirements. |
| 5. | Thermal Management Materials. These consist mainly of two types of products, our XG Leaf® sheet products and various custom thermal interface materials (XG TIM® or TIM) in the form of greases or pastes. XG Leaf® is a family of sheet products ideally suited for use in thermal management in portable electronics, which may include cell phones, tablets and notebook PC’s. As these devices continue to adopt faster electronics, higher data management capabilities, brighter displays with ever increasing definition, they generate more and more heat. Managing that heat is a key requirement for the portable electronics market and our XG Leaf® product line is well suited to address the need. These sheets are made using special formulations of xGnP® graphene nanoplatelets as precursors, along with other materials for specific applications. There are several different types of XG Leaf® available in various thicknesses, depending on the end-use requirements for thermal conductivity, electrical conductivity, or resistive heating. Our custom XG TIM®greases and pastes are also designed to be used in various high temperature environments. Additionally, we offer various bulk materials for use as active components in liquids, coatings and plastic composites to impart improved thermal management performance to such matrices. |
Our general business plan is to use our scientific and manufacturing expertise to develop specific products based on our xGnP®graphene nanoplatelets for end-use applications in industrial, electronics, aerospace, automotive, military, and similar OEM markets. Our initial focus is on developing high-value products that use our bulk materials as a significant component. We work closely with customers to design our products to meet their needs. Because these needs may be unique to a given customer and/or a given application, we may formulate and ultimately commercialize customer-specific formulations. These formulations, to the extent possible, will be made available to other customers. It is more likely that a new customer will require a combination of our technologies to derive a customer-specific performance outcome. In addition to selling bulk graphene nanoplatelets, we also offer integrated, value-added products that contain our graphene nanoplatelets in various forms. We expect to continue and develop and make available for sale integrated products and variations thereof.
Successful execution requires a close development relationship with customers and an ability to formulate products for use in multiple markets and for multiple customers.
| 58 |
Priority Markets Served
We believe we are a “platform play” in advanced materials, because our proprietary processes allow us to produce varying grades of graphene nanoplatelets that can be mapped to a variety of applications in many market segments. However, we are prioritizing our efforts in specific areas and with specific customers that we believe represent opportunities for either relatively near-term revenue or especially large and attractive markets. At this time, we are focused on three high priority areas:
| • | Composites: Incorporation of our xGnP®graphene nanoplatelets into various polymers have been shown to impart improvements in strength, electrical conductivity, thermal conductivity and/or barrier performance. The company pursues several end-use applications that may benefit from one or more properties and believes that composites represent a potentially large opportunity for commercial sales. |
| • | Energy Storage: Within energy storage we focus on lead acid batteries and lithium ion batteries. Within lithium ion batteries, we develop silicone-graphene composite materials for lithium-ion battery anodes. This is a material that has shown superior early results in laboratory and early prototype battery testing. Although there is still a scientific development, with testing and prototyping that remains to be done, we perceive a significant market opportunity for this new anode material. We also develop a cathode conductive additive to improve rate capability, especially for higher power applications. XG Sciences’ graphene nanoplatelets demonstrate higher discharge capacity at high rates, which translates into more battery power needed during heavy power requirements: start-up, acceleration, and/or elevation ascent. In lead acid batteries, we develop anode conductive additives demonstrating improved performance for lifetime and charge acceptance. |
| • | Thermal Management: Thermal management products may take on many forms. Their underlying intent is to improve the efficiency of heat transfer or movement of heat where excessive heat may cause a reduction in product lifetime and/or performance. XG Leaf® materials for thermal applications in electronics is an example of the latter. XG Leaf®is a paper-like product comprised of xGnP®graphene nanoplatelets. Early testing with customers has produced promising results in applications requiring high thermal conductivity in thin (20–50 microns) and thick (50–120 microns) sheets, depending upon the end-use application. Typical applications include the use of these materials in smart phones, tablets, and portable computers. Other customers have found efficacy for very thick sheets (up to 300 microns) when incorporated into solid-state heating and cooling designs. While there are many other applications for XG Leaf®, including electrostatic dissipation (“ESD”), electromagnetic interference (“EMI”) shielding and resistive heating, our initial focus is on thermal management. TIM, or thermal interface materials, in the form of greases or pastes is another product in this category. XG Sciences’ TIM’s have been shown to improve the thermal dissipation of heat generated by light emitting diodes when incorporated in various lighting devices. Other products may include inks or coating formulations specifically designed for use in such applications as portable electronics, heaters and other industrial equipment benefiting from the use of coatings to improvement heat dissipation and as a component of adhesives for use in electronic and automotive applications. |
Customers
We sell products around the world and have sold materials to over 1,000 customers in 47 countries since 2008. Some of these customers are research organizations and some are commercial organizations. Our customers have included well-known automotive and OEM suppliers (Ford, Johnson Controls, Magna, Honda Engineering) globally recognized lithium ion battery manufacturers in the US, South Korea and China (Samsung SDI, LG Chemical, Lishen, A123) and diverse specialty material companies (3M, BASF, Henkel, Dow Chemical, DuPont) as well as leading research centers such as Lawrence Livermore National Laboratory and Oakridge National Laboratory. We have also licensed some of our base manufacturing technology to other companies and we consider technology licensing a component of our business model. Our licensees include POSCO, the fourth largest steel manufacturer in the world by volume of output, and Cabot Corporation (“Cabot”), a leading global specialty chemicals and performance materials company. These licensees further extend our technology through their customer networks. As can be seen in the below bar chart, the cumulative number of customers has steadily grown over the past ten years.
| 59 |
Cumulative Customers, By Year
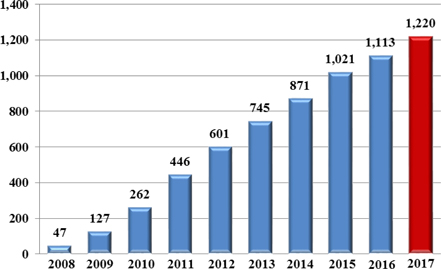
Commercialization Process
Because graphene is a new material, most of our customers are still developing applications that use our products. Commercialization is a process, the exact timing of which is often difficult to predict. It starts with our own internal R&D to validate performance for an identified market or customer-specific need. Our customers then validate the performance of our materials and determine whether our products can be incorporated into their manufacturing processes. This is initially done at pilot production scale levels. Our customers then have to introduce products that incorporate our materials to their own customers to validate performance. After their customers have validated performance, our customers will then move to commercial scale production. Every customer goes through the same process, but will do so at varying speeds, depending on the customer, the product application and the end-use market. Thus, we are not always able to predict when our customers will begin ordering commercial volumes of our materials or their expected volumes over time. However, as customers move through the process, we generally receive feedback and gain greater insights regarding their commercialization plans. The following are examples of where our products are providing value to our customers at levels that we believe will warrant their use on a commercial basis
| • | Callaway Golf Company incorporated our graphene nanoplatelets into the outer core of their Chrome Soft golf balls, resulting in a new class of golf ball that enables higher driving speeds, greater distance and increased control, which is allowing Callaway to command a premium price for their golf balls in the marketplace, and |
| • | Light emitting diode module and product company demonstrating approximately 50% improvement in thermal management capability when compared to existing commercial thermal management products, translating into a 15% improvement in thermal management at the device level, and |
| • | Automotive parts supplier demonstrating improvements in thermal stability for polymer composites incorporating our materials, allowing for approximately 20% higher operating temperatures and a 50% improvement in strength at the elevated temperature, and |
| • | Lead acid battery manufacturer demonstrating approximately 90% improvement in measured cycle life, appreciable improvement in capacity and charge acceptance and without any loss in water retention performance, and |
| • | Construction company demonstrating less than one weight percent of our product in construction material composites improves flexural strength by more than 30%, and |
| • | Plastics composite part manufacturer demonstrating 7-30% improvement in strength and 40% improvement in modulus when used in sheet molding compound, and |
| • | Engineering design firm for automotive manufacturers found approximately 20% reduction in operating temperature and in thermal uniformity when XG Leaf® replaces standard cooling fins in lithium ion battery packs’, and |
| • | Plastic composite parts manufacturer demonstrating 25% increase in tensile strength and 15% improvement in flex modulus for a high-density polyethylene composite. |
| 60 |
The process of “designing-in” new materials is relatively complex and involves the use of relatively small amounts of the new material in laboratory and engineering development for an extended period of time. Following successful development, customers that incorporate our materials into their products will then order much larger quantities of material to support commercial production. Although, our customers are under no obligation to report to us on the usage of our materials, some have indicated that they have introduced or will soon introduce commercial products that use our materials. Thus, while many of our customers are currently purchasing our materials in kilogram (one or two pound) quantities, some are now ordering at multiple ton quantities and we believe many will require tons or even hundreds of tons of material as they commercialize products that incorporate our materials. We also believe that those customers already in production will increase their order volume as demand increases and others will begin to move into commercial volume production as they gain more experience in working with our materials and engage new customers. For example, in the first half of 2017 we shipped 3.4 metric tons of product for various end-use customers and in the second half of 2017 we shipped just shy of 14 metric tons. In the fourth quarter of 2017, we received orders that exceeded our then capacity. In the first quarter of 2018 we shipped products comprising over 10 metric tons of graphene nanoplatelets. In addition, we used approximately 300 Kg of dry powder to produce and ship approximately 9 metric tons of additional product in the form of a slurry, cake or other integrated products. This demand profile is further evidence that we are transitioning into higher-volume production.
We believe average order size is an indicator of commercial traction. The majority of our customers are still ordering in smaller quantities consistent with their development and engineering qualification work. As can be seen in the chart below, our quarterly average order size was relatively modest until 2017, when a number of customers reached commercial status with different product applications. These data represent orders shipped in the respective quarter and exclude no charge orders targeted mainly for R&D purposes. The data show that the average order size has increased steadily over the last two years, and we believe that it will continue to increase in 2018 as more customers commercialize products using our materials. As a result of this increasing order size, in 2017 our customer shipments increased by over 600% to almost 18 metric tons of products from the 2.5 metric tons shipped in 2016. In the first quarter of 2018, we saw an incremental increase in the average order size to $15,827 from $14,541 in the fourth quarter of 2017. Also, in the first quarter of 2018, we shipped products containing over 10 metric tons of graphene nanoplatelets, on a dry powder basis, up from just over 9 metric tons in the fourth quarter of 2017, on a similar basis.
Average Order Size of Fulfilled Orders
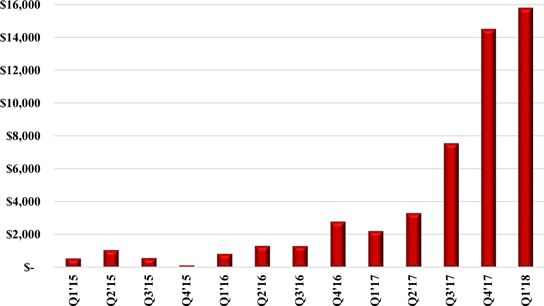
2018 Revenue
We are tracking the commercial and development status of more than 75 different customer applications using our materials with some customers pursuing multiple applications. As of March 31, 2018, we had seventeen specific customer applications where our materials are incorporated into our customer’s products and they are actively selling them to their customers. In addition, we have another twelve customer applications where our customers have indicated that they expect to begin shipping product incorporating our materials in the next 3 – 6 months, and we have another eighteen customer applications where our customers have indicated an intent to commercialize in the next 6 – 9 months. We also have tens of customers with whom we are working that have not yet indicated an exact date for commercialization, but we believe have the potential to contribute to revenue in 2018. The following graphic demonstrates the trend over the past 8 quarters as increasingly more customers indicate their intent to commercialize and move into actively selling products. We anticipate that the average order size for these customers will increase throughout 2018 as their demand grows. As a result, we believe we will begin shipping significantly greater quantities of our products, and thus continue scaling revenue in 2018. Based on the status of current discussions with customers and their feedback on the performance of our materials in their products, we believe we will be able to recognize approximately $8 – $15 million of revenue in 2018.12
| 61 |
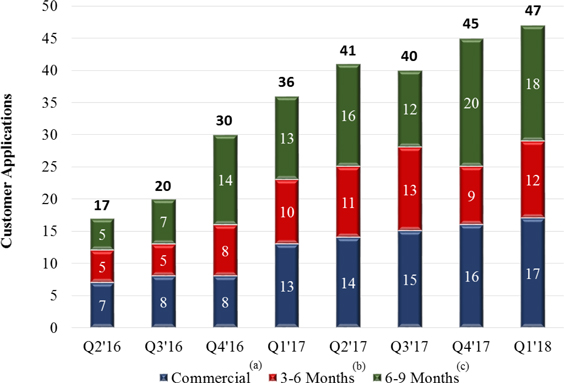
| (a) | Customer applications where our materials are used in customer products and they are actively selling them to their customers. |
| (b) | Customer applications where our customers are indicating that they expect to begin shipping products incorporating our materials in the next 3-6 months. |
| (c) | Customer applications where our customers are indicating an intent to commercialize in the next 6-9 months. Additional 10’s of customers demonstrating efficacy and moving through qualification process. |
Markets
Plastic Composites
The demand for higher performing materials continues to grow commensurate with the need for greater product efficiency, increased processing efficiency, mass customization and sustainability. Increased performance is highly correlated with the replacement of monolithic materials by more complex composite materials. In general, additives are combined with thermoplastics, thermosets, elastomers, and various metals to change or improve their properties for specific product applications. More specifically, xGnP® Composite Materials enhance mechanical and physical properties when added to polymer matrices and metal compositions.
According to the American Chemistry Council, total global polymer production reached 345 million metric ton in 2017 and with a compound annual growth rate of 4-5% (see figure below). The advanced composite application market which includes almost every bulk, engineering, and advanced material generated $85B in revenue in 2016 (Composites Manufacturing, 2016). $30B of the composites applications market is in materials. $6B of those composite materials are polymeric in nature. XG Sciences targets applications where our products are added to polymers costing more than two dollars per kilogram and also applications requiring varying material performance such as improved tensile strength and flame retardancy. Targeting applications at more than the $2/Kg price point will keep the potential cost increase of adding xGnP®to the base material below 30%, an acceptable range while adding significant performance improvements unmatched by any single additive.
| 62 |
2017 Global Polymer Production: 345 million metric tons (Source: American Chemistry Council)
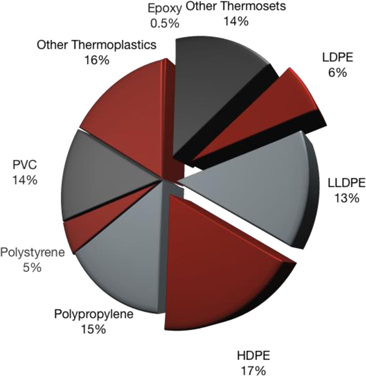
The 3D printing market has seen a compounded annual growth rate for the past 28 years of 25.9% (Wohler’s Associates 2017). The overall industry grew by 17.4% to $6B in 2016. The materials sold for 3D printing use grew by 17.5% to ~$1B of the industry total. These materials primarily include epoxy-based resins, powders and filaments. All of these matrices are well suited for xGnP® as an additive solution.
2017 3D Printing Materials Market: $1 Billion (Source: Wohler’s Associates)
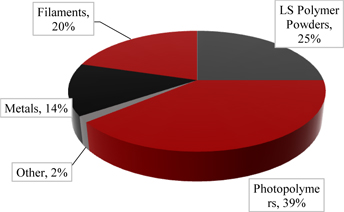
Addition of xGnP® graphene nanoplatelets to various polymer matrices such as polypropylene (PP) and polyethylene terephthalate (PET) has be shown to increase the mechanical properties from 10-40%. In addition, we have demonstrated 2-3X improvement in functional behaviors in other thermoset and elastomer materials. We target applications using neat resin systems incorporating glass and carbon fiber fillers systems where addition of our materials will realize various property improvements. For example, in applications where customer may be required to use multiple fillers to generate improved mechanical performance, processability, and flame resistance, they may now use only xGnP®graphene nanoplatelets to realize many of the same performance benefits. We are able to make bulk polymer materials perform like engineering plastic materials which command higher price points than their commoditized neighbors. In the area of composites materials, using a very low weight loading of graphene, we believe we are able to capture 15,000 – 25,000 metric ton of material production volume sold in the form of integrated products (pellets, powder mixtures, and dispersions).
| 63 |
Energy Storage
One of the more exciting market opportunities is the market for rechargeable batteries. In general, lithium-ion battery (“LIB”) technology is the dominant technology for rechargeable batteries throughout the world. As shown in the figure below, Avicenne Energy (The Battery Show, Novi MI, September 2017) estimates that the market for materials used in lithium ion batteries is currently approximately $10.4 billion and with a double-digit compound annual growth rate. We
2016 Lithium Ion Battery Value Chain – Market Demand

The LIB market is often divided into two major segments, each of which has different technical, cost, and efficiency requirements:
| • | The industrial market consists of electric and hybrid vehicles, grid storage, and similar heavy-duty applications. These applications require long life, extreme safety, high-power capacity, durability, and the ability to operate in extreme ranges of environmental conditions. |
| • | The market for consumer electronics uses LIB technology to power the devices we carry in our pockets, purses and briefcases. These devices need small batteries, with high power density, that charge rapidly and do not cost much. This market is dynamic and has an insatiable appetite for smaller, cheaper, faster-charging, higher capacity batteries. |
These market segments have different development timelines and the marketing strategies and the route-to-market that we pursue differs in these two segments.
For industrial applications, we work closely work with large US based battery manufacturers and automobile manufacturers. For consumer applications, we focus on the large consumer battery manufacturers, which are almost all in Asia. These companies perform their own research, development, and battery engineering. Names like Samsung, Panasonic, and LG Chemical are familiar to most Western consumers, but other companies like ATL, Envision, Wanxiang, BYD, Lishen, BAK, and many other Chinese companies are rapidly growing and represent potentially large sales opportunities for XGS. Our general strategy is to engage customers on sampling and joint development to design our technology into our customer’s products. We have a network of distributors, who have close connections to the customers in their countries and also provide assistance in customer collaboration.
Our main internal development focus has been on the use of our proprietary manufacturing processes and proprietary materials to produce a composite material composed primarily of silicon and graphene. We also develop xGnP® materials and functionalized xGnP® for use as conductive aids in both the cathode and anode formulations.
Inks and Coatings
Our xGnP® graphene nanoplatelets can be made into coatings or inks for thermal, electrical, anti-corrosion or lubricant applications. Various types of processing and application methods can be used, depending on customer systems and requirements. We have developed several products and also work with customers to provide formulations of inks or coatings to achieve targeted electrical and thermal properties.
| 64 |
xGnP®is potentially suited for formulating into ink-based products for deposition by flexo, gravure and screen printing processes. These inks show intermediate performance when compared to silver-based inks, the standard product used today for electrically-conductive ink requirements. Silver-based inks have high conductivity but are relatively expensive due to their use of silver. Carbon-based inks are lower cost but have poor conductive performance and are well suited for few applications. xGnP®inks, although still a few orders of magnitude lower in conductivity than silver-based inks, are potentially less expensive to produce and have cost/performance benefits allowing them to be used in many applications. Marketsandmarkets.com reports the market size of conductive inks was $3.17 Billion in 2015 and is projected to reach $3.91 Billion by 2021, registering a CAGR of 3.5% between 2016 and 2021. In the short term, our xGnP®-based inks are designed for applications where silver-based inks exceed the cost and performance targets required for specific applications.
Other Markets
We may also choose to participate in a number of other broad market segments which we believe are large and growing and where the performance of our products may find a good fit with existing and emerging market needs. These market segments require “advanced composites” or “nano-composites” materials. Because we may compete with and replace existing materials or may create new opportunities, it is difficult to accurately quantify specific market segments. However, we believe that the broad range of existing materials and existing applications might account for hundreds of millions of dollars in annual sales. Other product applications that have been identified for graphene and that we may pursue include, but are not limited to:
| • | XG Sciences’ elastomeric (rubber) composites used in car tires have realized improvements in rolling resistance, impact strength, puncture resistance, and overall deflection. XG PU (Polyurethane) composites have demonstrated >15°C higher heat deflection, 30% better impact strength and 20% better compression strength, 17% improvement in sound and vibration isolation as well as light weighting improvements for under-the-hood automobile parts including fuel rails covers, pump covers and front engine covers. |
| • | The production of concrete structures, including precast structures, where better compression strength, crack resistance and barrier properties are important for product sustainability. |
| • | The production of roof materials for commercial and residential construction where UV (Ultraviolet light) degradation severely impacts long term product life. |
| • | The production of thermoplastic based packaging products that are trending towards light-weighting, increased mechanical strength, and reduced native material use (sustainability). |
Multiple Applications and Products within Markets
It is also worth noting that many of our markets contain multiple applications for our products. For example, automotive markets may offer potential applications for multiple uses of our anti-corrosion coatings technologies within one automobile, along with vinylester-based SMC (sheet molding compound) parts, and battery anode materials in another. To further illustrate the automotive adjacencies, the following diagram shows possible uses for our materials within areas of an automobile.
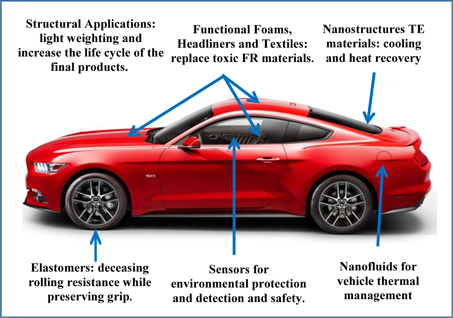
| 65 |
Distribution Channels
Our business model includes the production of bulk materials and value-added products based on our proprietary production processes and the sale of these materials directly to customers around the world. We generate sales through our own sales and scientific personnel and also maintain a network of independent representatives who may assist in sales to smaller customers throughout North America. Additionally, we maintain a network of distributors and sales agents for handling customers in overseas locations. Currently, we have signed Sales Agency Agreements with companies in South Korea, Japan, Taiwan, China, and Italy and will add other distributors on a worldwide basis as needed.
We pursue a national and international customer base. We plan to develop a broader sales and marketing organization and also plan to extend production of our products to overseas locations as appropriate in the next several years. We plan to recruit and train a sales organization located at headquarters as well as locations around the world. We also plan to partner with other companies in the United States and other countries in order to further leverage our time-to-market advantage.
Manufacturing Capacity and Concentration of Business
We have developed and scaled-up capacity for two proprietary manufacturing processes — one based on chemical intercalation and exfoliation of graphite and subsequent exfoliation and classification; and the second based on a high-shear mechanical exfoliation process which also employs graphite as the starting material. In March 2012, we took possession of a production facility under terms of a long-term lease and moved our headquarters to this new location. Initial production commenced in this facility in September 2012. Currently, this facility is capable of producing approximately 30 – 50 tons per year of chemically intercalated and exfoliated materials (depending on product mix) if operated on a continuous basis. We expect to streamline certain process steps in 2018 to roughly double the capacity output for our chemical exfoliation processes. We also operate a separate production facility in leased manufacturing space which is used for the production of certain graphene nanoplatelets derived from our high-shear mechanical exfoliation process and also other specialty materials. This facility is capable of producing approximately 30 – 60 tons per year of materials (depending on product mix) if operated on a continuous basis. In October 2017, we signed a lease for a new 64,000 square foot manufacturing facility which will be the site for expansion of our mechanical exfoliation capacity. It is our intent to consolidate equipment into the new facility and to add next-generation tooling to meet our estimated 2018 demand. Following consolidation, we will close the older facility. We expect to increase capacity in 2018 to four times that of our capacity at the end of 2017. We believe these manufacturing facilities will be sufficient to meet demands for the majority of our bulk materials for a number of years, with suitable additions of capital equipment as warranted. However, additional manufacturing capabilities for certain value-added products and certain bulk materials remain to be developed and will likely require the acquisition of additional facilities. In particular, the production processes for XG Leaf®, XG SiG®, XG TIM®, and our conductive inks will require additional capital and additional facilities to meet expected future customer demand.
Because of the nature of the applications that our customers are developing, we anticipate that we may see a few customers that account for the majority of our revenues. For example, in 2017, 2016, 2015, 2014 and 2013 the number one customer had revenue representing 53%, 24%, 9%, 69% and 77%, respectively, of total revenues. In 2017, 2016, 2015 and 2014 the customer with the second highest sales in each year represented 12%, 7%, 12% and 4% of total revenues. It is very conceivable that, as we go forward, we may have only a few customers that order enough materials to effectively utilize all of our manufacturing capacity. This would, of course, raise certain risks if those customers were to leave us in the future. Likewise, it is possible that we may find opportunities to serve these large customers with dedicated cooperative manufacturing facilities located near end-use points, or otherwise find ways to accommodate concentration risks.
Sources and Availability of Raw Materials
The raw materials we use for our products consist primarily of graphite and standard industrial chemicals that are readily available. Although we purchase raw materials used in the manufacturing of our products from a small number of sources in order to maintain the stability of the quality of the raw materials, we have the ability to purchase from numerous sources. We believe that all necessary raw materials for our products are readily available and will continue to be so in the foreseeable future. We have never had, nor do we anticipate experiencing, any shortages of such materials.
Strategic Investors
In addition to our sales of products, we also emphasize the importance of strategic investors, for several reasons. We see an opportunity to partner with larger companies as a way to accelerate our customer reach — particularly in parts of the world where we have not yet established a physical presence. In addition, many of our prospective customers are global companies with multiple manufacturing facilities in various parts of the world. These companies often seek local suppliers. In addition, these companies often seek multiple suppliers to avoid the risk of single-sourced supply. Thus, an important part of our business strategy has been to seek to develop relationships with other companies that we see as complementary partners that can help us develop our business for mutual benefit. These strategic partners typically have much greater resources than we do and represent manufacturing or technology partners or both.
| 66 |
During the past several years, XGS has formed relationships with a number of larger companies that it considers to be “strategic partners” where both companies can mutually benefit from combining their resources in specific ways. We foresee a likelihood of continuing partnerships with large companies as we focus on local production in non-U.S. locations. The following is a short list of transactions with strategic partners or licensees:
| • | Hanwha Chemical. In December 2010, we sold 150,000 shares of common stock at $20.00 per share to Hanwha Chemical Company (Hanwha Chemical), a global company with headquarters in South Korea. At the same time, we signed a Mutual Collaboration Agreement that gave Hanwha Chemical a non-exclusive right to distribute XGS products in East and Southeast Asia. |
| • | POSCO. In June 2011, the Company sold 200,000 shares of common stock at $20.00 per share for $4 million to POSCO, a global corporation with headquarters in Pohang, South Korea. At the same time, the Company granted to POSCO a non-exclusive, royalty-bearing license to certain XGS production technology for use in Southeast Asia region defined therein, as well as a non-exclusive license to sell XGS products on a worldwide basis. In March, 2014, POSCO purchased an additional 100,000 shares of Series A Preferred Stock at $12 per share for $1.2 million as part of a preemptive rights share offering. The license to POSCO terminates on December 31, 2024 unless terminated earlier by mutual consent. |
| • | Cabot Corporation. In November 2011 (as amended in January 2014), the Company granted a non-exclusive, royalty-bearing, worldwide license to certain of its production technology to Cabot Corporation (Cabot), a global corporation with headquarters in Boston, Massachusetts for $4 million. Cabot is a customer of XGS and is also a development partner and licensee. We are not currently receiving royalty payments from Cabot. |
| • | Samsung. On January 15, 2014 the Company sold $3,000,000 of notes to Samsung Ventures. In conjunction with the sale of these notes, the Company also entered into a Joint Development Agreement with Samsung SDI on April 8, 2014, under which we will jointly develop anode materials for future versions of lithium-ion batteries to be manufactured by Samsung SDI. The Joint Development Agreement continued through June 2015. It is no longer active. Samsung Ventures purchased secured convertible notes on terms identical those of Aspen Advanced Opportunity Fund, LP. Such notes were converted into Series A Preferred Stock on December 31, 2015. The Series A Preferred Stock is convertible into common stock at the lower of: (a) $12.00 per share, or (b) 80% of the price at which XGS sells any equity or equity-linked securities in the future. The current conversion price is $6.40 per share. Samsung Ventures also received 40% warrant coverage on their investment with such warrants vesting according to the amount of cash payments made to XGS in connection with the joint development agreement and other commercial arrangements; the warrants have a four-year term. |
| • | The Dow Chemical Company. On December 21, 2016, the Company announced it has closed an agreement with The Dow Chemical Company (NYSE: DOW) for up to a $10 million senior credit facility, which may be drawn down in tranches by XGS at its discretion through December, 2019. For the first 2 years, interest on funds drawn under this facility may be accrued and added to principal at the Company’s request. The credit facility is secured by the assets of the Company, and XGS has agreed to issue warrants for 20% of amounts drawn under the facility. Such warrants will have a strike price equal to the last price per share at which the Company issued equity capital prior to any advances under the credit facility, which is currently $8.00 per share in the Company’s ongoing self-underwritten Initial Public Offering. |
Intellectual Property
We believe that our intellectual property (IP) is an important asset. Our strategy is to keep our production processes as legally defined and protected trade secrets rather than to patent them. We believe that by patenting our processes, we would simply be teaching others how to produce materials like ours. In addition, it would be difficult or impossible to detect infringement. Therefore, our basic intercalation and exfoliation processes are not patented. We have, however, patented some of the equipment used in these processes.
Our intellectual property consists of four main types of assets:
| 1. | Employee knowledge and skills |
| 2. | Corporate “trade-secrets” and processing know-how |
| 3. | Exclusive license from Michigan State University on certain inventions |
| 4. | Patents and trademarks owned by the Company |
| 67 |
In January 2014 in connection with the Samsung Ventures investment, we transferred all of our intellectual property into a newly created, wholly owned subsidiary of the Company called XG Sciences IP, LLC, a Michigan limited liability company.
Employee Knowledge and Skills
Our founding stockholders include three research scientists and one experienced entrepreneur. Our Chief Scientist, Dr. Lawrence Drzal, is a University Distinguished Professor at Michigan State University and has a worldwide reputation in the field of materials science. Dr. Drzal has been engaged in research in our product areas for over eleven years. Dr. Hiroyuki Fukushima, another founding stockholder, has been engaged in research in this area for over ten years and is a co-inventor of one of our proprietary manufacturing processes.
Beginning in mid-2011, we started adding research scientists to our staff. As these scientists gather experience working with our materials, the cumulative research experience becomes increasingly valuable. We believe the cumulative knowledge of our employees is an important aspect of our intellectual property. In mid-2012, we hired Dr. Liya Wang as Vice President of Research & Development. Having served in a number of senior scientific positions for global battery makers, Dr. Wang significantly strengthened our experience base in the energy storage sector.
In January 2014, we hired Dr. Philip L. Rose as CEO. Prior to joining XGS, Dr. Rose was President of SAFC Hitech, a $100 million division of Sigma-Aldrich Corporation that makes precursors and performance materials for the LED, energy and display, and semiconductor markets. Before moving to Sigma Aldrich, Dr. Rose spent almost 20 years with Rohm and Haas in various leadership positions in the semiconductor and flat panel display industries.
Corporate Trade-Secrets and Processing Know-How
The production of xGnP® brand graphene nanoplatelets involves significant processing know-how that we maintain as secret internal knowledge, commonly referred to as “trade-secrets”. These trade secrets have been internally documented and safeguarded through the use of limited documentation, stringent employee confidentiality agreements, and strict disclosure policies. We have chosen not to pursue patent protection for some of our processing know-how because of the public disclosure involved. Nevertheless, we believe that this processing know-how has a significant value and we believe that a prospective competitor would be forced to spend millions of dollars to duplicate the processing know-how necessary to produce products of a similar quality to our products. In part, this reasoning has been validated by two large global companies: POSCO and Cabot. Each of these companies independently researched worldwide technologies for production of graphene and each of them chose to license XG Sciences’ production processes. These two companies have paid millions of dollars for access to our trade secrets and the experience and knowledge of our personnel. In addition, we signed in April, 2014 an agreement with Samsung SDI, the world’s largest producer of lithium ion batteries for handheld devices, outlining a joint development program aimed at engineering our Silicon Graphene material into a next generation lithium ion battery platform.
Michigan State University License
We have acquired an exclusive license for a number of inventions from Michigan State University. These rights are embodied in a Technology Licensing Agreement between XGS and Michigan State University dated July 27, 2007 and amended on May 24, 2010 and May 27, 2011, which owns the rights to all intellectual property resulting from research performed at the University. This Agreement gives us the exclusive worldwide rights to the subject intellectual property in its field. In exchange for the rights to the technology covered by this Agreement, we paid MSU an initial fee and agreed to pay ongoing royalties on the basis of material sold by us in future years. Under a previous version of the Licensing Agreement, we also awarded a small amount of common stock to MSU.
The intellectual property covered by the Agreement is in various stages of development and legal protection. Because there is an active research program underway in this area, we also anticipate that future inventions will be made that will also fall under the terms of our license agreement with MSU. In some limited cases, depending on the source of research funds, other parties may have limited rights to use the inventions covered by these agreements. This is typical in the case of research funded by U.S. government agencies and is sometimes the case when research has been funded or partially funded by private corporations.
As of March 31, 2018, the following technologies were included in the MSU License Agreements with XGS and were being actively prosecuted at the U.S. Patent Office:
| · | U.S. Patent Application No. 12/587,645. “Electrically Conductive, Optically Transparent Films of Exfoliated Graphite NanoParticles & Methods of Making the Same” |
| · | U.S. Patent 9,776,874. “PI Coupling Agents for Dispersion of Graphene NanoPlatelets in Polymers” |
| 68 |
| · | U.S. Patent 8,834,959. “Method for the Preparation of Doped Single Graphene Sheets” |
In general, the current license arrangement with MSU provides us with an exclusive option to relevant MSU inventions, as documented by MSU invention disclosures. We, in turn, have an obligation to patent these disclosures in a timely manner. Disclosures that we do not pursue or that are not allowed as patentable by the USPTO are eventually considered as abandoned and drop out of the licensed technology package. It is contemplated that periodic amendments to the MSU — XGS License Agreement will update the list of existing technologies covered by the license.
In general, the MSU licensed technology relates to end-use applications for graphene nanoplatelets. Of particular interest are the discoveries and claims related to the use of graphene nanoplatelets in electrodes for lithium-ion batteries and supercapacitors.
Metna License
On August 8, 2016, we signed an agreement acquiring an exclusive license to Metna’s background IP for use of graphene nanoplatelets as additives to concrete mixtures. For purposes of the agreement, Metna’s background IP relates to the U.S. Patent 8,951,343 B2. Also, on August 8, 2016, we entered into a second agreement for an exclusive license related to all Metna’s background technology and foreground technology, including any jointly-owned foreground technology where the end use is known to be any graphite additive dispersed in concrete mixtures.
| · | U.S. Patent 8,951,343 B2. “Ultra High Performance Concrete Reinforced with Low-Cost Graphite Nanomaterials and Microfibers, and Method for Production Thereof” |
Our Patents and Patent Filings
In addition to the patent and patent applications related to MSU technology discussed above, we also file for patents on some of our own inventions. As of March 31, 2018, the following patents and patent applications were being managed by us and our patent attorneys:
| · | U.S. Patent 8,715,720. “A Cloud Mixer and Method of Minimizing Agglomeration of Particles” (method) |
| · | U.S. Patent 9,061,259. “A Cloud Mixer and Method of Minimizing Agglomeration of Particles” (product) |
| · | U.S. Patent 9,206,051. “Mechanical Exfoliation Apparatus” |
| · | U.S. Patent 9,266,078, “A Cloud Mixer and Method of Minimizing Agglomeration of Particles” (apparatus) |
| · | U.S. Patent 9,472,354. “Electrodes for Capacitors from Mixed Carbon Compositions” |
| · | U.S. Patent 9,682,380. “Mechanical Exfoliation Apparatus – Divisional” |
| · | U.S. Patent 9,758,378. “Single Mode Microwave Device for Producing Exfoliated Graphite.” |
| · | U.S. Patent 9,763,287. “Single Mode Microwave Device for Producing Exfoliated Graphite” |
| · | U.S. Patent Application No. 15/155,158. “Process of Dry Milling Particulate Materials” |
| · | U.S. Patent Application No. 15/589,151. “Single Mode Microwave Device for Producing Exfoliated Graphite.” |
| · | U.S. Patent Application No. 14/201,986. “Graphene Carbon Compositions” |
| · | U.S. Patent Application No. 15/332,338. “Flexible Resin-Free Composites Containing Graphite & Fillers” |
| · | U.S. Patent Application No. 14/079,057. “Silicon-Graphene Nanocomposites for Electrochemical Applications” |
| · | U.S. Patent Application No. 62/060,319. “LiF-Embedded SiG Powder for Lithium-Ion Battery” |
| · | U.S. Patent Application No. 15/517,417. “LiF-Embedded SiG Powder for Lithium-Ion Battery” |
| · | U.S. Patent Application No. 15/285,967. “Thermal Interface Materials using Graphene Coated Fillers” |
| · | U.S. Patent Application No. 15/082,363. “Heat Exchanger Elements and Devices” |
| · | U.S. Patent Application No. 14/931,236. “Mechanical Exfoliation Apparatus - Divisional” |
| · | U.S. Patent Application No. 15/013,028. “Mechanical Exfoliation Apparatus – Divisional” |
| · | U.S. Patent Application No. 15/047,995. “Mechanical Exfoliation Apparatus – Divisional” |
| · | U.S. Patent Application No. 15/050,496. “Mechanical Exfoliation Apparatus – Divisional” |
| 69 |
| · | U.S. Patent Application No. 15/018,885. “Mechanical Exfoliation Apparatus – Divisional” |
| · | U.S. Patent Application No. 15/050,517. “Mechanical Exfoliation Apparatus – Divisional” |
| · | U.S. Patent Application No. 62/303,612. “Graphene Based Coating on Lead Grid for Lead Acid Batteries” |
Global Patent Filings
For each patent application filed in the US, we make a determination on the nature and value of the patent. For many of the applications filed in the US, additional filings are made in other countries such as the European Union, Japan, South Korea, China, Taiwan or other applicable countries. As of March 31, 2018, the Company maintains 46 international patent applications. These filings and analyses are made on a case-by-case basis. Typically, patents that are defensive in nature are not filed abroad, while those that are protective of active XGS products or application areas are filed in relevant countries abroad. Only granted and allowed patents are listed below:
| · | China Patent No. ZL 2012 8 0065778.X. “Single Mode Microwave Device for Producing Exfoliated Graphite” |
| · | China Patent No. ZL 2012 8 0052188.3. “Cloud Mixer and Method of Minimizing Agglomeration of Particulates” |
| · | China Patent No. ZL 2013 8 0017776.8. “Mechanical Exfoliation Apparatus” |
| · | Taiwan Patent No. I552955 “Graphene Nanoparticles as Conductive Filler for Resistor Materials and a Method of Preparation” |
| · | Taiwan Patent No. I589524 “Process of Dry Milling of Particulate Materials” |
| · | European Patent No. EP 2 785 449 B1 “Single Mode Microwave Device for Producing Exfoliated Graphite” |
| · | German Patent No. DE 60 2012 030 903.2 “Single Mode Microwave Device for Producing Exfoliated Graphite” |
| · | Italy Patent No. 50 2017 000052802, “Single Mode Microwave Device for Producing Exfoliated Graphite” |
| · | UK Patent No. EP 2 785 449 B1 “Single Mode Microwave Device for Producing Exfoliated Graphite” |
| · | Japan Patent No. 6,124,027 “Single Mode Microwave Device for Producing Exfoliated Graphite” |
Trademarks
We have obtained a registered trademark on the following:
| · | “xGnP®,” which is the brand name by which we designate our graphene nanoplatelets. |
| · | The corporate logo “XG Sciences” (design logo plus words) |
| · | The tag line “The Material Difference” which is used in conjunction with the corporate logo. |
| · | The product designation “XG Leaf®”, which is the brand name for our family of sheet products. |
| · | The product designation “XG SiGTM”, which is the brand name for our battery anode materials. |
| · | The product designation “XG TIM®”, which is the brand name for our thermal interface materials. |
| · | The product designation “GNP®”, which is the brand name for our concrete additive materials. |
Protection of IP
We protect our IP through various agreements. Employee agreements, non-disclosure agreements, and confidentiality agreements all include provisions to prevent our confidential information from disclosure outside very tightly controlled circumstances. A sign-in sheet non-disclosure agreement is maintained at the entrance to each facility. Access to the lab and production facility is controlled on a need to know basis for non-XGS personnel.
Research and Development
During 2017 and 2016 we spent $923,419 and $1,124,165 research and development activities, respectively. Of these amounts, $124,955 and $279,760 were funded by government agencies in the form of grants, recorded as revenues during 2017 and 2016, respectively. With the exception of these government grants, none of our research and development activities have been funded directly by customers.
| 70 |
Competition
We manufacture xGnP® graphene nanoplatelets and various value-added products made therefrom. In one sense, this is a new type of material that requires application development before it can be incorporated into customer products. In another sense, our material is similar to other carbon products in its chemistry and molecular composition. Therefore, there are many instances when our materials might be used interchangeably or in combination with other types of carbon materials like carbon nanotubes, carbon fibers, or carbon black. Because these other forms of carbon materials are much older, with markets that are significantly more developed, there are many companies that are much larger and more well-established than we are and that might compete in the same markets we address.
In addition, there are many different materials that may sometimes be used as full or partial substitutes for our materials. A large number of companies offer a wide variety of materials that may compete with us. Almost all of these competitors that manufacture alternative materials are significantly larger and better financed than we are. In addition to alternative materials, there are a number of emerging companies in the United States that have announced plans to offer graphene platelet materials purported to be similar to ours. In addition, several new companies in Europe and Asia have announced the availability of materials purported to be similar to ours. Many of these companies currently offer materials only in limited quantities, but we anticipate that it will face competition from a variety of companies in most of the markets in which we compete.
Graphene has excited great interest in the scientific community and there are hundreds of university groups and private corporations that are interested in this material. In addition to us, many other small companies are beginning to appear that have announced products based on graphene or graphene nanoplatelets in some form, and we believe this trend will continue. We believe that we are a first mover in this market and believe that our production processes are the lowest cost, but we expect competition from various sources in the future. Given the huge projected market sizes, we expect that several companies will share these markets, perhaps focused on specific niches.
Our strategy is to compete with other start-ups on the basis of our business model, our manufacturing techniques, our management team, our scientific credibility, and our strategic partners. Recognizing that the worldwide market for products and materials similar to ours is developing very rapidly and will be quite large, we intend to compete vigorously on a worldwide basis by:
| • | Implementing strategic partnerships with customers and other partners in many different geographic localities as well as specialized markets. |
| • | Focusing our resources on remaining a low-cost supplier of high-quality materials with sufficient production capacity to meet the needs of large, global customers. |
| • | Developing “value-added” products like XG Leaf®, XG SiG®battery anode materials, XG TIM®, inks and coatings, GNP® cement additives and similar specialized products for specific markets. |
| • | Investing in intellectual property, especially in areas covering novel formulations of our products and use of our products in end-use applications. |
Legal Proceedings
None.
Governmental Regulation and Environmental Compliance
We believe we are in material compliance with all applicable governmental regulations, and that the cost and effect of compliance with environmental laws is not material. Most new chemical substances or materials sold in the U.S or in many other countries require regulation by government authorities. In the U.S., we have specifically reviewed our grades H, M and C materials and the associated production processes with the U.S. Environmental Protection Agency and have received written confirmation from that agency as to the appropriate classification of our materials and of our ability to offer these materials on a commercial basis within the U.S. In most other countries, there are no specific regulations that require additional regulation but some countries do have registration requirements with which we comply to the best our ability.
| 71 |
Our Production Facilities
In March of 2012, we took possession of a larger production facility at 3101 Grand Oak Drive, Lansing, Michigan, 48911 under terms of a long-term lease and moved our headquarters to this new location. We and Dart Container of Michigan LLC, a Michigan limited liability company (“Dart”) entered into a lease pursuant to which Dart, as landlord, agreed to lease such property for ten years at an annual base rent for each of the ten years in twelve equal monthly instalments each year. Such annual base rent for years one through ten were $189,996, $193,800, $197,676, $201,636, $205,668, $209,772, $213,972, $218,256, $222,612, and $227,064, respectively. In addition to base rent, we agreed to pay additional rent consisting of certain taxes, insurance costs, assessments and common area maintenance charges. Furthermore, we agreed to provide Dart with a letter of credit in the amount of $189,996, the terms of which are more specifically detailed in the lease. Additionally, under the terms of the lease, the parties agreed that Dart would pay costs up to $640,000 in connection with specified improvements (described in an exhibit to the lease) to the leased premises and that any costs over such amount would be borne by us.
Effective as of August 15, 2011, we and Dart amended certain provisions whereby the parties agreed that taxes payable shall be paid directly to the “appropriate taxing authority” instead of to Dart; that we shall provide copies of the tax or assessment being paid along with a copy of the applicable check; and that we shall pay our respective share of Taxes (as such term is defined in the lease) either for the entire year or its pro rata share of any partial year in which we occupied the leased premises. Furthermore, the parties amended the obligation of the landlord to deliver estimates of certain costs payable by us. The revision removed the requirement imposed on Dart to provide a Tax Estimate (as such term is defined in the lease) to us. The lease was also amended to provide for a default in the event the “appropriate taxing authority fails to receive any payment of Taxes within ten days after written notice from either landlord or the taxing authority that such payment is past due.”
The lease was further amended by us and Dart effective as of November 16, 2012 to include additional space as part of the leased premises from January 1, 2013 through December 31, 2017, and as such, we agreed to an increase to base rent by $6,667, $6,871, $7,074, $7,288 and $7,503 per month for the periods ranging from January 1, 2013 through December 31, 2013, January 1, 2014 through December 31, 2014, January 1, 2015 through December 31, 2015, January 1, 2016 through December 31, 2016, and January 1, 2017 through December 31, 2017, respectively. The parties further agreed that common cost estimates for such additional space was $2,147 per month for the calendar year 2013, said cost to be adjusted for each subsequent year. Additionally, we now have the ability to terminate the lease of the above-mentioned additional space by providing six months’ notice. A second and third amendment addresses utility payments in connection with additional rental space. The lease was further amended by us and Dart effective February 1st, 2018 to extend the lease through December 31, 2022. Our base rent for the extension is $7,503 per month from January 1, 2018 through December 31, 2020, $8,409 per month from January 1, 2021 through December 31, 2021, and $8,720 per month from January 1, 2022 through December 31, 2022.
We also operate a separate production facility in leased manufacturing space, which is used for the production of certain specialty materials. On January 3, 2008, we entered into a lease agreement with Quality Dairy Company, as landlord, pursuant to which the landlord agreed to lease to us such 6,600 square feet of a building commonly referred to as “Building C” and an area approximately 16’ X 80’ of the parking lot adjacent to the aforementioned area located at 2100 S. Washington Ave., Lansing, MI 48910. We were also granted the non-exclusive right to use common facilities. The term of the lease was for six months, commencing on January 15, 2008 and ending on July 31, 2008. We agreed to pay base rent in monthly instalments in the amount of $12,798 for the term of the lease, and $1,969 per month thereafter. In addition to base rent, we agreed to pay certain utilities, janitorial services, and personal property taxes as they become due. Subsequently, we have extended this lease and now maintain our presence in this facility on a month-to-month basis.
In October of 2017, we took possession of a 64,500 square foot facility to be used for production operations at 4215 Legion Drive, Mason, Michigan, 48854 under terms of a 5-year lease with DJV Properties, LLC. Base rent of $20,156.25 per month commenced on January 1, 2018 and will go through December 31, 2022 when the lease expires. We are responsible for payment of all improvements, utilities, taxes, insurance, and maintenance on the building. We expect to have the facility in production during quarter two of 2018 and as such will gradually phase out our production at our Washington Avenue facility and close it before the end of the year.
We believe our manufacturing facilities will be sufficient to meet demands for the majority of our bulk materials for a number of years, with suitable additions of capital equipment as warranted. However, additional manufacturing capabilities for certain value-added products and certain bulk materials remain to be developed and may require the acquisition of additional facilities. In particular, the production processes for XG Leaf® and our silicon-graphene electrode materials have not yet been scaled and will require additional capital to meet expected customer demand.
Our Employees
As of April 30, 2018, we had 47 full-time employees and 1 part-time employee. 8 of these employees were contract employees who may generally be hired as permanent employees after 3 – 6 months. Employees include the following four senior managers that report to the CEO: Chief Commercial Officer, Vice President of Operations, Vice President of Research & Development, and Controller. The Company employs a total of 7 full-time scientists and technicians in its R&D group, including the Vice President of Research & Development.
| 72 |
Corporate Information
XG Sciences, Inc. was incorporated on May 23, 2006 in the State of Michigan and is organized as a “C” corporation under the applicable laws of the United States and State of Michigan. We do not currently have any affiliated companies or joint venture partners, and we have one wholly-owned subsidiary called XG Sciences IP, LLC. This subsidiary was created in 2014 for the purpose of holding our intellectual property. Our headquarters and principal executive offices are located at 3101 Grand Oak Drive, Lansing, Michigan, 48911 and our telephone number is (517) 703-1110.
Our website address ishttp://www.xgsciences.com, although the information contained in, or that can be accessed through, our website is not part of this prospectus. You may also contact Dr. Philip L. Rose, our Chief Executive Officer via email at p.rose@xgsciences.com.
The following table sets forth the name and age of the Company’s executive officers, Directors and significant employees as of May 14, 2018. There are no family relationships among any of our executive officers or directors.
| Name | Age | Position(s) | ||
| Philip L. Rose | 56 | Chief Executive Officer, President, Secretary, Treasurer & Director | ||
| Arnold A. Allemang | 75 | Chairman of the Board, Chairman of the Executive Committee, and member of the Audit and Compensation Committees | ||
| Steven C. Jones | 55 | Director, AAOF representative to the Board, Chairman of the Audit, Nominating, and Corporate Governance Committees, member of the Executive and Compensation Committees | ||
| Molly P. Zhang | 56 | Director, member of the Audit Committee, Nominating, and Corporate Governance Committees | ||
| Dave Pendell | 71 | Director | ||
| Bamidele Ali | 41 | Chief Commercial Officer | ||
| Scott Murray | 63 | Vice President, Operations | ||
| Liya Wang | 60 | Vice President of Research & Development |
Biographies of Officers and Directors
Philip L. Rose, Ph.D.
Dr. Rose joined the Company in January 2014 and currently serves as our Chief Executive Officer, President, Secretary, Treasurer and has served as a Director of XG Sciences since March 2014. Dr. Rose has extensive international business management experience in the electronic and specialty materials markets. Prior to joining XG Sciences, he spent 4 years as President of SAFC Hitech, a $100 million division of Sigma-Aldrich that makes precursors and performance materials for the LED, energy and display, and semiconductor markets. He also served concurrently for a period of time as CEO of Soulbrain-Sigma Aldrich based in South Korea and as an independent Director for Pixtronix, a company based in the Boston area. Before joining Sigma Aldrich, Dr. Rose spent almost 20 years with Rohm and Haas in various leadership positions in the semiconductor and flat panel display industries that include general management, mergers and acquisitions, business development and marketing. Dr. Rose has 7 years of experience living in Japan and South Korea and has travelled extensively in Asia over the past 15 years. Dr. Rose earned his Ph.D. in Physical Chemistry from Duke University and holds a B.S. in Chemistry from the University of Southern California and a certificate in Business Management from The Wharton School at the University of Pennsylvania. In light of the aforementioned experience qualifications, attributes and skills, we believe Dr. Rose is qualified to serve as a director.
Arnold A. Allemang
Mr. Allemang has served as a Director of XG Sciences since March 2010 and Chairman of the Board since January 2016. Mr. Allemang was employed by Dow, headquartered in Midland, Michigan for 43 years. Mr. Allemang joined Dow in 1965 in Freeport, Texas. After five years in the Solvents Development Lab, he transferred to Stade, Germany. In 1972, he returned to the United States for various technical and managerial assignments. Mr. Allemang was named unit manager for Freeport’s Chlorinated Ethanes in 1981, and two years later assumed the same role for Light Hydrocarbons and Acetylene. He transferred to Terneuzen, The Netherlands, in 1984 to become production manager for Light Hydrocarbons I, and in 1986 became responsible for process control and engineering functions. In 1988, he returned to Freeport to manage the site’s hydrocarbons production and moved to Midland in 1989 as Director of Technology Centers. Mr. Allemang was named Manufacturing General Manager for Dow Benelux in 1992, and in early 1993 was named regional vice president, Manufacturing and Administration, Dow Benelux. He was named vice president, Manufacturing Operations Dow Europe in late 1993. In August 1995, Mr. Allemang was named vice president, Operations, which included global manufacturing and engineering activities. He then became executive vice president of Dow in 2000 and was named senior advisor in 2004. In March 2008, he retired as a Dow employee Mr. Allemang was elected to the Dow Board of Directors in July 1996 and served until May 2015. Mr. Allemang received a bachelor’s degree in chemistry from Sam Houston State University in Huntsville, Texas. In light of the aforementioned experience qualifications, attributes and skills, we believe Mr. Allemang is qualified to serve as a director.
| 73 |
Steven C. Jones
Mr. Jones has served as a Director of XG Sciences since March 2013. Mr. Jones is the Chairman of Aspen Capital Group, LLC, a private equity firm headquartered in Naples, FL, which manages private equity funds. Mr. Jones also serves as the President of Aspen Capital Advisors, LLC, which is Aspen Capital Group’s investment management subsidiary. Aspen believes its highest value is to be a “hands on” partner with the management teams of portfolio investments to help them achieve their growth objectives by bringing capital, strategic partners, customers, additional management and other business advice. Mr. Jones has substantial expertise in developing and financing emerging growth companies. In addition to his involvement with XG Sciences, Mr. Jones serves on the Boards of NeoGenomics, Inc. (NASDAQ: NEO) (“NEO”), a leading cancer genetic testing company, and ERP Maestro, Inc, a privately-held software as a service (SaaS) company focused on governance and risk compliance solutions for enterprise customers. Mr. Jones has also served as an Executive Vice President and consultant of NEO since November 2009 and previously served as Chief Financial Officer from October 2003 until November 2009. He was appointed to serve as a Director of XG Sciences by the Aspen Advanced Opportunity Fund, LP in connection with its investment in XGS. Prior to his career in structured private equity, among other positions, Mr. Jones was a Vice President in the Telecommunications, Media and Technology Investment Banking Group of Merrill Lynch & Co in New York and was the chief executive officer or chief financial officer of various public and private companies. Mr. Jones has a BS degree in Computer Engineering from the University of Michigan and an MBA from the Wharton School of the University of Pennsylvania. In light of the aforementioned experience qualifications, attributes and skills, we believe Mr. Jones is qualified to serve as a director.
Molly P. Zhang
Molly P. Zhang (aka Peifang Zhang) has served as a Director of XG Sciences since May 2017. From 2011 until retiring in October 2016, Dr. Zhang served as a Vice President of Orica Ltd., USA in a number of departments, including General Management, Global Manufacturing and Asset Management. Prior to joining Orica, Dr. Zhang spent 22 years with Dow, most recently as Managing Director of the SCG-Dow Group and Country General Manager of Dow Thailand. Prior to her roles with Dow in Thailand, Dr. Zhang served as Global Business Vice President of Dow Technology Licensing and Catalyst, and as Manufacturing Leader of Dow Asia Pacific. She also served as Manufacturing Director, Global Technology Director and as a board member of the SCG-Dow Group. Dr. Zhang currently serves as a member of the Supervisory Board for GEA Group, a publicly traded, global engineering, process technology solutions and specialty equipment company based in Dusseldorf, Germany, serving the food, chemical, and energy industries. She also serves on the board of directors of Cooper-Standard Holdings, Inc., a publicly traded, global, tier 1 automotive components supplier based in Detroit, MI. Dr. Zhang has a Ph.D. in Chemical Engineering from the Technical University of Clausthal, Germany and a Diploma in Chemistry (MS degree), Technical University of Clausthal, Germany. Dr. Zhang is fluent in English, Chinese and German. In light of the aforementioned experience qualifications, attributes and skills, we believe Ms. Zhang is qualified to serve as a director.
Dave Pendell
David Pendell has served as a Director of XG Sciences since February 2016. From June 2009, Mr. Pendell has served as General Partner and Officer of Advanced Stage Capital LLC, which he owns and operates. Since January 2011 Mr. Pendell has served as General Partner and Officer of ASC Lease Income LLC. From May of 2013 until February 2016, Mr. Pendell served as a Board Observer of the Company until he was appointed to the Board in February 2016. In addition, since June 2013, Mr. Pendell has served on the board of directors of ERP Maestro. Mr. Pendell is a principal of the Aspen Advanced Opportunity Fund and has worked with Veterans Capital Fund. Prior to forming Advanced Stage Capital, Mr. Pendell was responsible for the successful launch and subsequent profitable sale of five start-up entities in which he was the lead entrepreneur and numerous other investments where he served as a lead investor/mentor/coach. Predominantly, Mr. Pendell led the growth of Pendell Printing, Inc. from a small print firm of less than $1MM in sales in 1971 to over $85MM in 1998 when the sale of the business was completed. Past management roles include Chairman of the Board/President of Pendell Printing Inc.; co-founder of Envision Inc., a graphic solutions enterprise; President and CEO of Baustert Engineering, Inc., a software business; co-founder of Ecoland, a timber/real estate development company; founder of The Earth Generation, an environmental education publisher; and co- Founder of Fuel Oil News, a publication for the home heating industry. Mr. Pendell also actively participates in the Michigan Angel Fund and Tamiami Angel Fund I and II. He received his BS in Psychology from Central Michigan University in 1969. In light of the aforementioned experience qualifications, attributes and skills, we believe Mr. Pendell is qualified to serve as a director.
| 74 |
Bamidele Ali
Bamidele Ali joined the Company in March 2017 as the Chief Commercial Officer. Prior to joining XG Sciences Mr. Ali served as Vice President of Business Development for Architected Materials, a hybrid-materials and manufacturing company. In that role, he was responsible for sales, global marketing and branding, joint developments, and product pricing strategies. Before joining Architected Materials, he spent 9 years as the president of Ali Technologies Inc. a nanotechnology focused product development and consulting firm. Mr. Ali also served as Director, Continuous Improvement & Program Management and Director, Additive Manufacturing Business Development, Mergers & Acquisition for DSM, an $8 billion life sciences and materials company. In these roles, he developed the company’s global additive manufacturing strategy as well as established a program management office and continuous improvement organization. Mr. Ali also spent several years leading strategic initiatives and developing medical equipment for General Electric Healthcare. He has extensive experience evaluating and integrating foreign companies and technology portfolios. He is also the founder of “ManufactureThis.Build”, an online algorithmic company specializing in financial modeling of production technologies and their applications. Mr. Ali is a Six Sigma Black Belt. He earned his B.S. in Electrical Engineering from the University of Kentucky and holds a certificate in chemistry from Virginia Tech University.
Scott Murray
Scott Murray has extensive experience as an operations executive and is skilled in business management, product and process development, and strategic leadership of growth of businesses. These experiences ranged from small, privately owned companies to Fortune 500 Companies. Mr. Murray has been the Vice President of Operations of the Company since October 2007. Prior to his tenure with the Company, Mr. Murray was with Motor Wheel Corporation for 17 years having held positions in engineering, marketing, and plant management. He served in the positions of Chief Engineer and Director of Manufacturing prior to the leaving to form a new company. Mr. Murray founded and was CEO of Uretech International Inc. from 1995 through 2004. He directed all process, product, marketing, and commercial activities for that company. As a manufacturer of specialty chemicals and urethane products, Uretech International supplied products to many markets including the automotive, medical, and office furniture industries as well as a variety of industrial applications. Most recently, as Director of Development for McKechnie Automotive, Mr. Murray was responsible for the technical and market introduction of a new product line and the startup of a manufacturing operation for that product line in Kentucky. Mr. Murray is a graduate of Michigan Tech University, where he earned a degree in Metallurgical Engineering. As a member of the Society of Automotive Engineers and the American Iron and Steel Institute served on numerous task forces and technical committees for professional organizations in the automotive industry. He is a past Committee Chairman for the American Society of Non-Destructive Testing. Mr. Murray is a registered Professional Engineer and holds a Six Sigma Black Belt certification.
Liya Wang, Ph.D.
Dr. Liya Wang leads the research and development activities of the Company for a variety of applications. Previously, Dr. Wang was Principal Scientific Director at CIC Energigune in Spain from 2010 to 2012. There he helped build a world-class new energy research center and led the development of advanced batteries and capacitors. Prior to arriving at CIC Energigune, Dr. Wang was Director of Emerging Technologies from 2006 to 2010 at A123 Systems, a global Li-ion battery manufacturer based in US. He led the development of new generations of Li-ion battery cathodes and the transition of technologies into production. From 2003 to 2006, Dr. Wang worked as R&D Director at Pacific Industrial Development Corp and coordinated the development of nano materials for catalysis and luminescence applications. From 1999 to 2003, he was Manager of Materials Development and Vice President at T/J technologies where he built and led a multi-million dollar battery research program. From 1994 to 1999, he worked at IMRA America as a Researcher on electrochemical capacitors and high-power lithium ion batteries. Dr. Wang received a Bachelor’s and a Master’s degree in Metallurgy from Beijing University of Science and Technology in China, and a Master’s and a PhD degree in Materials Science from University of Michigan in US. He is a Guest Professor at University of Electronic Science and Technology in China and an Adjunct Associate Professor at University of Michigan in USA.
Shareholder Agreement
In conjunction with a financing with AAOF, we and our stockholders listed therein entered into a Shareholder Agreement on March 18, 2013 that contains a number of specific provisions pertaining to the Board of Directors as well as individual Directors. On February 26, 2016, we amended the Shareholder Agreement, a copy of which is referenced as Exhibit 10.8 to the registration statement of which this prospectus is a part. On May 30, 2018, we further amended the Shareholder Agreement, a copy of which is referenced as Exhibit 10.13 to the registration statement of which this prospectus is a part.
Among other things, the Shareholder Agreement provides for certain voting and nomination rights to be calculated on the basis of “Full Conversion” stock ownership (under which calculation, all convertible notes, preferred shares, or other convertible equity securities are deemed converted into common stock) as follows:
| • | So long as AAOF or its affiliates own 10% or more of the aggregate outstanding Shareholder Stock (as defined in the Shareholder Agreement): |
| - | the size of the Board of Directors shall be set at seven individuals. |
| 75 |
| - | one person nominated by AAOF shall be elected to the Board of Directors. |
| - | two members of the Board of Directors, other than those nominated by AAOF, POSCO or Hanwha Chemical, shall qualify as independent Directors. |
| • | So long as POSCO owns 10% of more of the aggregate outstanding Shareholder Stock, one person nominated by POSCO shall be elected to the Board of Directors. POSCO does not currently own at least 10% of the aggregate outstanding Shareholder Stock and therefore, there is no POSCO representative on the Board of Directors. |
| • | So long as Hanwha Chemical owns 10% of more of the aggregate outstanding Shareholder Stock, one person nominated by Hanwha Chemical shall be elected to the Board of Directors. Hanwha does not currently own at least 10% of the aggregate outstanding Shareholder Stock and therefore, there is no Hanwha representative on the Board of Directors. |
As of December 31, 2017, the ownership percentage of AAOF, as calculated for purposes of Director voting, required the stockholders bound by the Shareholder Agreement to vote for a Director nominated by AAOF. Mr. Jones is the AAOF representative to the Board pursuant to the terms of the Shareholder Agreement.
The Shareholder Agreement grants preemptive rights to shareholders who are parties to the Shareholder Agreement. Pursuant to the terms therein, such shareholders have the right to purchase their pro rata share of all shareholder stock that the Company may, from time to time, propose to sell, issue, or exchange after the date of the Shareholder Agreement, other than certain excluded stock which includes stock granted to employees, stock issued pursuant to an effective Registration Statement, or stock issued as merger consideration. Each shareholder’s pro rata shares shall be equal to the ratio of (i) the aggregate number of shares of the Company’s common stock on a fully diluted basis, owned by the such shareholder at the time of the delivery of a preemptive right notice to (ii) the aggregate number of shares of Company’s common stock on a fully diluted basis owned by all of the Company’s shareholders at the time of the delivery of a preemptive rights notice.
The Shareholder Agreement may be amended or terminated by agreement (either generally or in a particular instance and either retroactively or prospectively), only with the written consent of (i) a majority of the Company’s board of directors, and (ii) persons holding, in the aggregate, shares of Shareholder Stock representing at least sixty percent (60%) of the voting power of all shares of Shareholder Stock then held by Shareholders and their permitted assignees.
On February 26, 2016, the Shareholders Agreement was amended to provide that holders of Excluded Stock are not subject to the terms of the Shareholders Agreement. Excluded Stock means shares of common stock that are subject to a registration statement that has been filed with the SEC and has been declared effective, and, for the avoidance of any doubt, includes the 3,000,000 shares being offered hereunder. Thus, purchasers of shares of common stock under the Registration Statement of which this prospectus is a part, will not be required to adopt the Shareholders Agreement. The Amendment to Shareholders Agreement further clarifies that preemptive rights shall not apply to Excluded Stock. This Amendment to Shareholders Agreement took effect when the registration statement of which this prospectus is a part was declared effective by the SEC on April 13, 2016.
On May 30, 2018, the Shareholders Agreement was further amended to provide that. unless the Shareholder Agreement is earlier terminated in accordance with its terms, it continues in effect until the date on which the Company’s common stock is listed on the NASDAQ Stock Market of the New York Stock Exchange. As a result, in the event that the Company is unable to consummate a Public Listing on the NASDAQ Stock Market or the New York Stock Exchange, the Shareholder Agreement will continue to remain in effect and the larger shareholders described above will be entitled to continue to exercise their rights under such Shareholders Agreement.
Code of Ethics
We have a Code of Ethics applicable to our principal executive, financial and accounting officers, a copy of which is referenced as Exhibit 14 to the registration statement of which this prospectus is a part.
Fiduciary Duty
Our directors perform their duties as members of the board and its committees in good faith and with fair dealing as fiduciaries of the Company and each of its shareholders in accordance with Michigan law and the Bylaws of the Company. The Board is committed to acting in the interests of all of its shareholders in the best interests of the Company, including all investors who purchase securities in the Company covered in this offering. The Company has duties of fair disclosure in this offering, but the Board should not be considered as a fiduciary to any non-shareholders.
| 76 |
Board Committees
Audit Committee
Our Board has established an Audit Committee, which is composed of Steven C. Jones, Arnold A. Allemang, and Molly P. Zhang. Pursuant to our Audit Committee charter, the Audit Committee was established for the primary purpose of assisting the Board in its oversight of the Company’s tax, legal regulatory and ethical compliance. The Audit Committee assists the Board in certain areas, including, but not limited to:
| · | Oversight and monitoring of the Company’s financial statements, accounting and financial reporting processes, financial statement audits, and other financial information provided by the Company to its shareholders and others; | |
| · | Overseeing the Company’s compliance with legal, regulatory, and public disclosure requirements; | |
| · | Oversight of the Company’s registered public accounting firm’s (“independent auditor”) qualifications and independence; | |
| · | Overseeing the performance of the Company’s independent auditor and the internal audit function; | |
| · | Overseeing the Company’s systems of disclosure controls and procedures, internal controls over financial reporting, and compliance with ethical standards adopted by the Company; | |
| · | Oversight of treasury and finance matters; | |
| · | Oversight and monitoring of enterprise risk management, privacy, and data security; | |
| · | Oversight of the auditing, accounting, and financial reporting process generally; | |
| · | Preparation of a report of the Committee to be included in the Company’s annual proxy statement in accordance with any applicable rules of the SEC; and | |
| · | Review and approval of related-party transactions (as defined by any applicable rules of the SEC and any applicable listing standards of the NASDAQ). |
The members of the Committee are appointed by the Board at its annual meeting from among the Company’s directors. Members are appointed to serve until their successors are duly elected and qualified by the Board, or until their resignation or removal. The Board determines the number of members on the Committee from time to time, but in any event the Committee is to be composed of at least three Board members or any greater minimum number as required by applicable law, the Company’s Bylaws, or the Company’s contractual obligations. The Board may appoint a chairperson and secretary for the Committee. If the Board does not appoint a chairperson or a secretary, the members of the Committee may elect a chairperson or secretary, respectively, by majority vote. Steven Jones currently serves as Chairman of the Audit Committee.
Each member of the Committee is and must be “independent” in accordance with the Company’s contractual obligations and any applicable SEC and NASDAQ rules. The Board determines the standards that are currently applicable to determining whether a member is “independent” and whether each member or nominee member of the Committee satisfies those standards.
The members of the Committee must also satisfy other applicable qualification rules of NASDAQ and the SEC. Generally, each member of the Committee must have a strong level of accounting or financial acumen and must be able to read and understand fundamental financial statements. A member of the Committee may not have participated in the preparation of financial statements of the Company or any current subsidiary of it at any time during the past three years. To the extent required by applicable rules of the SEC, at least one member of the Committee must be a “financial expert” as defined by the applicable rules of the SEC. In general, to be considered a “financial expert,” an audit committee member must have the following attributes:
| · | An understanding of generally accepted accounting principles and financial statements. |
| · | The ability to assess the general application of generally accepted accounting principles in connection with the accounting for estimates, accruals, and reserves. |
| · | Experience preparing, auditing, analyzing, or evaluating financial statements that present a breadth and level of complexity of accounting issues that are generally comparable to the breadth and complexity of issues that can reasonably be expected to be raised by the Company’s financial statements, or experience actively supervising one or more persons engaged in such activities. |
| 77 |
| · | An understanding of internal controls and procedures for financial reporting. |
| · | An understanding of audit committee functions. |
Steven Jones and Arnold Allemang qualify as “audit committee financial experts” as the term is defined under the SEC rules.
Nominating and Corporate Governance Committee
Our Board has established and adopted a charter for a Nominating and Corporate Governance Committee (“NGC”). The Committee is composed of Arnold A. Allemang, Steven C. Jones and Molly P. Zhang. As provided in its charter, the Nomination and Corporate Governance Committee was established for the primary purposes of considering and reporting to the Board on matters relating to the identification, selection, and qualification of Board members and candidates nominated to the Board as well as assisting the Board with respect to corporate governance matters. The NGC is responsible for providing support to the Board in certain areas, including:
| · | Assisting the Board by identifying individuals qualified to become Board members. |
| · | Recommending to the Board the director nominees for the next annual meeting of shareholders. |
| · | Leading the Board in an annual review of the Board’s performance. |
| · | Recommending to the Board director nominees for each committee. |
| · | Developing, maintaining, and overseeing the Company’s corporate governance guidelines. |
| · | Making recommendations to the Board with respect to corporate governance matters. |
The members of the NGC are appointed by the Board at its annual meeting from among the Company directors and are appointed to serve until their successors are duly elected and qualified by the Board, or until their resignation or removal. The Board determines the number of members on the NGC from time to time, but in any event the NGC must be composed of at least three Board members or any greater minimum number as required by applicable law, the Company’s Bylaws, or the Company’s contractual obligations. The Board may appoint a chairperson and secretary for the NGC. If the Board does not appoint a chairperson or a secretary, the members of the NGC may elect a chairperson or secretary, respectively, by majority vote. Steven Jones currently serves as the Chairperson of the NGC.
Each member of the NGC is and must be “independent” in accordance with the Company’s contractual obligations and any applicable SEC and NASDAQ rules. The Board determines the standards that are currently applicable to determining whether a member is “independent” and whether each member or nominee member of the NGC satisfies those standards.
Compensation Committee
Our Board has established a Compensation Committee, which is composed of Arnold A. Allemang and Steven C. Jones. The Compensation Committee was established for the primary purpose of assisting the Board with the review and determination of executive compensation and the oversight, review, and approval of significant employee benefits programs, policies, and plans. The Board has adopted a Compensation Committee charter.
The members of the Compensation Committee are appointed by the Board at its annual meeting from among the Company’s directors and are appointed to serve until their successors are duly elected and qualified by the Board, or until their resignation or removal. The Board will determine the number of members on the Compensation Committee from time to time, but in any event the Compensation Committee must be composed of at least three Board members or any greater minimum number as required by applicable law, the Company’s Bylaws, or the Company’s contractual obligations. The Board may appoint a chairperson and secretary for the Compensation Committee. If the Board does not appoint a chairperson or a secretary, the members of the Compensation Committee may elect a chairperson or secretary, respectively, by majority vote. Arnold Allemang currently serves as the Chairperson of the Compensation Committee.
Each member of the Compensation Committee must be “independent” in accordance with the Company’s contractual obligations and any applicable SEC and NASDAQ rules. Each member of the Compensation Committee must also qualify as an “outside director” for purposes of 162(m) of the Internal Revenue Code of 1986, as amended. The Board shall determine the standards that are currently applicable to determining whether a member is “independent” and whether each member or nominee member of the Compensation Committee satisfies those standards.
| 78 |
Executive Committee
Our Board has established an Executive Committee, which is composed of Arnold A. Allemang and Steven C. Jones. Pursuant to our Executive Committee charter, the Executive Committee was established for the primary purpose of exercising the powers and duties of the Board between Board Meetings and while the Board is not in session and to implement policy decisions of the Board.
During the intervals between meetings of the Board, the Executive Committee may exercise all of the powers and authority of the Board of Directors for the purpose of acting upon matters that should not be postponed until the next scheduled meeting of the Board. The members of the Executive Committee are to exercise their business judgment to act in what they reasonably believe to be in the best interests of the Corporation and its shareholders. The Executive Committee will have all powers and authority of the Board enumerated in the Bylaws of the Corporation, except to:
| 1. | Take action specifically reserved for another committee of the Board; |
| 2. | Amend the Corporation’s Articles of Incorporation or Bylaws; |
| 3. | Adopt an agreement of merger, conversion, or share exchange; |
| 4. | Recommend to shareholders the sale, lease, or exchange of all or substantially all of the Corporation’s property and assets; |
| 5. | Recommend to shareholders a dissolution of the Corporation or a revocation of a dissolution; |
| 6. | Fill vacancies in the Board; |
| 7. | Declare a distribution or dividend or to authorize the issuance of shares; or |
| 8 | Take action with respect to any other matter that the Board may not delegate to the Committee under the Michigan Business Corporation Act, the Corporation’s Articles of Incorporation, the Corporation’s Bylaws, or the Corporation’s contractual commitments. |
Notwithstanding the foregoing, the Board may, by resolution or an amendment to this Charter, restrict the powers and authority of the Executive Committee, in its sole discretion. In addition, the Executive Committee shall comply with all directions of the Board and shall discharge all duties and responsibilities expressly delegated by the Board to the Executive Committee.
The Executive Committee may delegate any of its responsibilities, along with the authority to take action in relation to such responsibilities, to one or more subcommittees as the Committee may determine to be appropriate. The Board may appoint a chairperson and secretary for the Compensation Committee. If the Board does not appoint a chairperson or a secretary, the members of the Compensation Committee may elect a chairperson or secretary, respectively, by majority vote. Arnold Allemang currently serves as the Chairperson of the Compensation Committee.
Conflicts of Interest
Certain potential conflicts of interest are inherent in the relationships between our officers and directors and us.
From time to time, one or more of our affiliates may form or hold an ownership interest in and/or manage other businesses both related and unrelated to the type of business that we own and operate. These persons expect to continue to form or hold ownership interests in and/or manage additional businesses which may compete with our business with respect to operations, including financing and marketing, management time and services and potential customers. These activities may give rise to conflicts between or among the interests of us and other businesses with which our affiliates are associated. Our affiliates are in no way prohibited from undertaking such activities, and neither we nor our stockholders will have any right to require participation in such other activities.
Further, because we have transacted business and intend to continue to do so with some of our officers, directors and affiliates, as well as with firms in which some of our officers, directors or affiliates have a material interest, including, without limitation, Samsung Ventures, XGS II and AAOF, potential conflicts may arise between the respective interests of us and these related persons or entities. We believe that any such transactions will be consummated on terms at least as favorable to us as those available from unrelated third-parties.
| 79 |
With respect to transactions involving real or apparent conflicts of interest, we have adopted policies and procedures which require that: (i) the fact of the relationship or interest giving rise to the potential conflict be disclosed or known to the directors who authorize or approve the transaction prior to such authorization or approval; and (ii) the transaction be fair and reasonable to us at the time it is authorized or approved by our directors.
Risk Oversight
The Board of Directors is actively involved in the oversight of risks, including strategic, operational and other risks, which could affect our business. The Board of Directors does not have a standing risk management committee but administers this oversight function directly through the Board of Directors as a whole, which oversee risks relevant to their respective functions. The Board of Directors considers strategic risks and opportunities and administers its respective risk oversight function by evaluating management’s monitoring, assessment and management of risks, including steps taken to limit our exposure to known risks, through regular interaction with our senior management and in board and committee deliberations that are closed to members of management. The interaction with management occurs not only at formal board and committee meetings but also through periodic and other written and oral communications.
Meetings of the Board and Committees
The Board met 6 times in 2017. The Board of Directors also acted at times by unanimous written consent, as authorized by our Bylaws and the Michigan Business Corporation Act. The Audit Committee met 5 times in 2017. The Compensation Committee met 5 times in 2017. The Executive Committee met 1 time in 2017. The Nominating and Governance Committee met 2 times in 2017.
Director Independence
Our Board of Directors has determined that we currently have four independent directors on our Board of Directors: Arnold A. Allemang, Molly P. Zhang, Steven C. Jones, and Dave Pendell. Philip L. Rose is not considered independent. Because our common stock is not currently listed on a national securities exchange, we have used the definition of “independence” of the NASDAQ Stock Market to make this determination.
NASDAQ Listing Rule 5605(a)(2) provides that an “independent director” is a person other than an officer or employee of the Company or any other individual having a relationship that, in the opinion of the Company’s Board, would interfere with the exercise of independent judgment in carrying out the responsibilities of a director. The NASDAQ listing rules provide that a director cannot be considered independent if:
| • | the director is, or at any time during the past three years was, an employee of the Company; |
| • | the director or a family member of the director accepted any compensation from the Company in excess of $120,000 during any period of 12 consecutive months within the three years preceding the independence determination (subject to certain exclusions, including, among other things, compensation for board or board committee service); |
| • | a family member of the director is, or at any time during the past three years was, an executive officer of the Company; |
| • | the director or a family member of the director is a partner in, controlling stockholder of, or an executive officer of an entity to which the Company made, or from which the Company received, payments in the current or any of the past three fiscal years that exceed 5% of the recipient’s consolidated gross revenue for that year or $200,000, whichever is greater (subject to certain exclusions); |
| • | the director or a family member of the director is employed as an executive officer of an entity where, at any time during the past three years, any of the executive officers of the Company served on the compensation committee of such other entity; or |
| • | the director or a family member of the director is a current partner of the Company’s outside auditor, or at any time during the past three years was a partner or employee of the Company’s outside auditor, and who worked on the Company’s audit. |
The following is a summary of certain of the experience, qualifications, attributes and skills that led the Company’s Board of Directors to conclude that such person should serve as a director or officer This information supplements the biographical information provided above.
Philip L. Rose, Ph.D., Chief Executive Officer, President, Treasurer & Director. Dr. Rose has extensive international business management experience, having previously served as the chief executive officer, president and director of several companies based both in the United States and abroad, and significant experience in the electronic and specialty materials markets. Based on his practical leadership and industry experience, Dr. Rose provides valuable experience and knowledge.
| 80 |
Arnold A. Allemang, Chairman of the Board. Mr. Allemang’s previous board service for several corporations and substantial managerial and operational history at The Dow Chemical Company will prove valuable to the Board as it seeks to implement and maintain growth strategies that will enable the Company to succeed.
Steven C. Jones, Director. Mr. Jones’ background in investment banking and in investing, as well as his prior experience serving as a member of several boards and a senior executive in several companies, enables him to provide the Board with valuable insight and expertise.
Dave Pendell, Director. Mr. Pendell’s experience in successfully building businesses in a range of end-use markets will prove very useful to the Board.
Molly P. Zhang, Director. Ms. Zhang’s experience supporting and advising companies with respect to their growth and business development will enable her to assist the Board and management as they endeavor to expand the Company.
Summary Compensation
The following table sets forth all compensation earned and accrued, in all capacities, during the fiscal years ended December 31, 2017 and 2016 by our named executive officers:
| Name and Position | Year | Salary | Bonus | Option Expense(1) | Other | Total | ||||||||||||||||
| Philip L. Rose,Chief Executive Officer, Secretary, Treasurer | 2017 | $ | 275,000 | $ | 17,000 | 470,771 | 12,881 | $ | 775,652 | |||||||||||||
| 2016 | $ | 281,346 | $ | 11,000 | 332,447 | — | $ | 624,792 | ||||||||||||||
| Bamidele Ali,Chief Commercial Officer | 2017 | $ | 153,808 | — | 22,939 | — | $ | 176,747 | ||||||||||||||
| 2016 | $ | — | — | — | — | $ | — | |||||||||||||||
| Scott Murray,Vice President of Operations | 2017 | $ | 148,077 | $ | 15,000 | 85,242 | 1,309 | $ | 249,628 | |||||||||||||
| 2016 | $ | 140,000 | $ | 6,000 | 11,084 | — | $ | 157,084 | ||||||||||||||
| Liya Wang,Vice President of Research & Development | 2017 | $ | 200,000 | $ | — | 64,919 | — | $ | 264,919 | |||||||||||||
| 2016 | $ | 200,000 | $ | 6,000 | 25,324 | — | $ | 231,324 | ||||||||||||||
| (1) | Option expense is calculated using the fair value of options that vested during the period. See Note 12 to our December 31, 2017 financial statements included in this prospectus. |
Outstanding Equity Awards
The Board of Directors of the Company occasionally awards stock options and restricted common stock under the Company’s 2017 Plan. Additionally, stock warrants have been issued to certain officers and directors of the Company in conjunction with financing agreements. The following table sets forth information regarding outstanding stock option and stock warrant awards as of December 31, 2017:
| Name and Position(s) | Number of Securities Underlying Unexercised Options and Warrants that are currently Exercisable | Number of Securities Underlying Unexercised Options and Warrants that are currently Unexercisable | Exercise Price | Expiration Date | ||||||||||
| Philip L. Rose,Chief Executive Officer, Secretary, Treasurer | 171,658 | 158,342 | $ | 8.00 | 7/24/2024 | |||||||||
| Bamidele Ali,Chief Commercial Officer | - | 80,000 | $ | 8.00 | 7/24/2024 | |||||||||
| Scott Murray,Vice President of Operations | 40,000 | - | $ | 8.00 | 7/24/2024 | |||||||||
| Liya Wang,Vice President of Research & Development | 37,500 | - | $ | 8.00 | 7/24/2024 | |||||||||
| 81 |
Director Compensation
Each of our non-employee Directors who was not appointed as a representative of a corporate investor in XGS is entitled to receive compensation in accordance with director compensation plans as amended by the full Board of Directors from time to time. The following table sets forth information concerning the compensation of eligible Directors for the years ended December 31, 2017 and 2016:
| Name | Period | Cash Compensation | Restricted Stock(1) | Option Expense(1) | Total | |||||||||||||
| Arnold Allemang | 2017 | $ | 25,000 | $ | 10,000 | 26,478 | $ | 61,478 | ||||||||||
| 2016 | $ | — | $ | — | 11,105 | $ | 11,105 | |||||||||||
| Steven Jones | 2017 | $ | 25,000 | $ | 10,000 | 25,872 | $ | 60,872 | ||||||||||
| 2016 | $ | — | $ | — | 11,105 | $ | 11,105 | |||||||||||
| David Pendell | 2017 | $ | 17,500 | $ | 10,000 | 4,494 | $ | 31,994 | ||||||||||
| 2016 | $ | — | $ | — | — | $ | — | |||||||||||
| Molly P. Zhang | 2017 | $ | 6,000 | $ | 10,000 | 639 | $ | 16,639 | ||||||||||
| 2016 | $ | — | $ | — | — | $ | — | |||||||||||
| (1) | We granted stock options and restricted stock to each of our Board members as part of their compensation package. Each of the 4 independent Board members received 2,500 stock options and 2,500 shares of restricted stock for their Board services. The options were granted at a price of $8.00 per share and had an aggregate grant date fair value of $26,120. The options vest ratably over a four-year period beginning on the one-year anniversary. The restricted stock issued to the Board members has an aggregate fair value of $80,000 and vest ratably in arrears on the last day of each fiscal quarter following the grant date. As of December 31, 2017, 5,000 shares of restricted stock had vested resulting in compensation expense of $40,000. Option expense is calculated using the fair value of options that vested during the period. See Note 12 to the December 31, 2017 financial statements included in this prospectus. |
2017 Stock Option Plan
The previously established 2007 Plan, which was scheduled to expire on October 30, 2017 and under which we granted key employees and directors options to purchase shares of our common stock at not less than fair market value as of the grant date. On May 4, 2017, the Board approved the 2017 Plan to replace the 2007 Plan, which became effective upon the approval of the stockholders holding a majority of the voting power in the Company on July 18, 2017. The 2017 Plan replaces the 2007 Plan and authorizes us to issue awards (stock options and restricted stock) with respect of a maximum of 1,200,000 shares of our common stock, which equals the number of shares authorized under the 2007 Plan.
The fair value of the options granted was estimated on the date of grant using the Black Scholes option-pricing model. As of December 31, 2017, and 2016, respectively, 677,125 and 369,750 options were outstanding. Vesting of the option shares with the employees range from immediately to 25% per year. Rights to exercise the options vest immediately upon a change in control of XGS or termination of the employee’s continuous service due to death or disability. The options expire at various dates through 2024.
Employment Agreements and Potential Payments Upon Termination
The Company is party to two employment agreements. The following descriptions summarize the commitments in these arrangements.
On December 16, 2013, the Company entered into an employment agreement with Philip L. Rose to serve as the Company’s Chief Executive Officer commencing on January 6, 2014 and continuing indefinitely, subject to termination by the Company for cause or without cause, or resignation by Dr. Rose with or without cause. If the Company terminates Dr. Rose without cause, or if Dr. Rose resigns with cause, the Company has agreed to pay Dr. Rose’s base salary for a period of six months, any permitted COBRA health insurance premiums for Dr. Rose and his family, and any pro-rata bonus amounts that are deemed to have been earned during Dr. Rose’s employment period prior to termination. In the event that the Company terminates Dr. Rose with cause, or if Dr. Rose resigns without cause, the Company has no further obligations beyond the severance date. The Agreement provides that Dr. Rose will be paid an initial base salary of $275,000 annually, with an annual Target Bonus opportunity of 30% of base salary, which may be earned up to a level of 150% of the Target Bonus under certain conditions. Additionally, Dr. Rose was awarded an option to purchase a total of 330,000 shares of common stock at $8.00 per share and with a life of seven years from the award date. These stock options have vested or will vest as follows: 171,658 on July 24, 2017, 39,586 on July 24, 2018, July 24, 2019, July 24, 2020 and 39,584 on July 24, 2021.
| 82 |
On March 22, 2017, the Company entered into an employment agreement with Bamidele Ali to serve as the Company’s Chief Commercial Officer. The employment agreement: (i) establishes an annual base salary of $215,000, (ii) grants the employee eligibility to participate in the Company’s Management Incentive Plan with a target annual bonus of 30% of the employee’s annual base salary, and (iii) provides for other fringe benefits, including a stock option grant to purchase 80,000 shares of the Company’s common stock at a strike price of $8.00 per share and with a life of seven years from the award date. These stock options vest ratably over a four-year period beginning on the one-year anniversary; 20,000 on July 24, 2018 and 20,000 each of the three years thereafter until 2021. The employment agreement creates an “at will” employment relationship. However, if the Company terminates the employee’s employment without cause (as defined in the employment agreement), then the Company must pay as severance 100% of the COBRA premiums for the employee’s family health insurance benefits and a pro-rata portion of any annual bonus that would be due for the year in which termination occurs.
CERTAIN RELATIONSHIPS AND RELATED PARTY TRANSACTIONS
Related Party Transactions
On March 9, 2016, we issued a promissory note and warrants to purchase 2,000 shares of common stock to Mr. Arnold Allemang, our Chairman of the Board. The note matured on December 31, 2016 and the warrants have a five-year term and a strike price of $10.00 per share. Mr. Allemang purchased the note and warrants for $100,000. The note was paid off in full as of June 30, 2016. Mr. Allemang reinvested the proceeds from the repayment of this note plus additional other funds into our Offering.
On March 25, 2016, we issued a promissory note and warrants to purchase 2,000 shares of common stock to Mr. Steven Jones, a member of our Board of Directors. The note matured on December 31, 2016 and the warrants have a five-year term and a strike price of $10.00. Mr. Jones purchased the note and warrants for $100,000. The note was paid off in full as of June 30, 2016. Mr. Jones reinvested the proceeds from the repayment of this note plus additional other funds into our Offering.
On March 25, 2016, we issued a promissory note and warrants to purchase 1,000 shares of common stock to Mr. David Pendell, a member of our Board of Directors. The note matured on December 31, 2016 and the warrants have a five-year term and a strike price of $10.00. Mr. Pendell purchased the note and warrants for $50,000. The note was paid off in full as of December 31, 2016. Mr. Pendell re-invested $48,000 of these loan repayment proceeds into our Offering.
During the period from June - December 2016, Messrs. Allemang, Jones and Pendell and certain of their affiliates invested the following amounts into our Offering and purchased the number of shares indicated.
| Purchase Dates | Amount Invested | Shares Purchased | ||||||||
| Arnold Allemang and affiliates | June 23 – 28 and Sept. 30 | $ | 965,000 | 120,625 | ||||||
| Steven C. Jones and affiliates | June 24 – 27 | $ | 748,000 | 93,500 | ||||||
| David G. Pendell and affiliates | June 27 and Dec. 5 | $ | 100,032 | 12,504 | ||||||
| Total | $ | 1,813,032 | 226,629 | |||||||
During 2017, Messrs. Allemang, Jones and Pendell and certain of their affiliates invested the following amounts into our Offering and purchased the number of shares indicated below.
| Purchase Dates | Amount Invested | Shares Purchased | ||||||||
| Arnold Allemang and affiliates | Sept. 6 and Dec. 28, 2017 | $ | 560,000 | 70,000 | ||||||
| Steven C. Jones and affiliates | April 3 and Sept. 29, 2017 | $ | 252,400 | 31,550 | ||||||
| David G. Pendell and affiliates | February 9, 2017 | $ | 16,000 | 2,000 | ||||||
| Total | $ | 828,400 | 103,350 | |||||||
On April 19, 2018 Mr. Allemang purchased 62,500 shares in our Offering for $500,000 through the Arnold A. Allemang Revocable Trust.
In conjunction with a financing with AAOF, we and our stockholders listed therein entered into a Shareholder Agreement on March 18, 2013, which was amended on February 26, 2016 and May 30, 2018, that contains a number of specific provisions pertaining to the Board of Directors as well as the nomination of individuals to serve as Directors.
| 83 |
Among other things, the Shareholder Agreement provides for certain voting and nomination rights to be calculated on the basis of “Full Conversion” stock ownership (under which calculation, all convertible notes, preferred shares, or other convertible equity securities are deemed converted into common stock) as follows:
| • | So long as AAOF or its affiliates own 10% of more of the aggregate outstanding Shareholder Stock (as defined in the Shareholder Agreement): |
| - | the size of the Board of Directors shall be set at seven individuals. |
| - | one person nominated by AAOF shall be elected to the Board of Directors. |
| - | two members of the Board of Directors, other than those nominated by AAOF, POSCO or Hanwha Chemical, shall qualify as independent Directors. |
| • | So long as POSCO owns 10% of more of the aggregate outstanding Shareholder Stock, one person nominated by POSCO shall be elected to the Board of Directors. POSCO does not currently own at least 10% of the aggregate outstanding Shareholder Stock and therefore, there is no POSCO representative on the Board of Directors. |
| • | So long as Hanwha Chemical owns 10% of more of the aggregate outstanding Shareholder Stock, one person nominated by Hanwha Chemical shall be elected to the Board of Directors. Hanwha does not currently own at least 10% of the aggregate outstanding Shareholder Stock and therefore, there is no Hanwha representative on the Board of Directors. |
As of December 31, 2016, the ownership percentage of AAOF, as calculated for purposes of Director voting, required the stockholders bound by the Shareholder Agreement to vote for a Director nominated by AAOF. Mr. Jones is the AAOF representative to the Board pursuant to the terms of the Shareholder Agreement.
The Shareholder Agreement grants preemptive rights to shareholders and holders of convertible notes who are parties to the Shareholder Agreement. Pursuant to the terms therein, such shareholders and noteholders have the right to purchase their pro rata share of all shareholder stock that the Company may, from time to time, propose to sell, issue, or exchange after the date of the Shareholder Agreement, other than certain excluded stock which includes stock granted to employees or as merger consideration. Each shareholder’s pro rata shares shall be equal to the ratio of (i) the aggregate number of shares of the Company’s common stock on a fully diluted basis, owned by the such shareholder at the time of the delivery of a preemptive right notice to (ii) the aggregate number of shares of Company’s common stock on a fully diluted basis owned by all of the Company’s shareholders at the time of the delivery of a preemptive rights notice.
The Shareholder Agreement may be amended or terminated by agreement (either generally or in a particular instance and either retroactively or prospectively), only with the written consent of (i) a majority of the Board, and (ii) persons holding, in the aggregate, shares of Shareholder Stock representing at least sixty percent (60%) of the voting power of all shares of Shareholder Stock then held by the parties thereto and their permitted assignees.
On February 26, 2016, the Shareholders Agreement was amended to provide that holders of Excluded Stock are not subject to the terms of the Shareholders Agreement. Excluded Stock means shares of common stock that are subject to a registration statement that has been filed with the SEC and has been declared effective, and, for the avoidance of any doubt, includes the 3,000,000 shares being offered hereunder. Thus, purchasers of shares of common stock under the Registration Statement of which this prospectus is a part, will not be required to adopt the Shareholders Agreement. The Amendment to Shareholders Agreement further clarifies that preemptive rights shall not apply to Excluded Stock. This Amendment to Shareholders Agreement took effect when the registration statement of which this prospectus is a part was first declared effective by the SEC on April 13, 2016.
On May 30, 2018, the Shareholders Agreement was further amended to provide that. unless the Shareholder Agreement is earlier terminated in accordance with its terms, it continues in effect until the date on which the Company’s common stock is listed on the NASDAQ Stock Market of the New York Stock Exchange. As a result, in the event that the Company is unable to consummate a Public Listing on the NASDAQ Stock Market or the New York Stock Exchange, the Shareholder Agreement will continue to remain in effect and the larger shareholders described above will be entitled to continue to exercise their rights under such Shareholders Agreement.
| 84 |
SECURITY OWNERSHIP OF CERTAIN BENEFICIAL OWNERS AND MANAGEMENT AND
RELATED STOCKHOLDER MATTERS
As of May 14, 2018 (the “Ownership Date”), the following table sets forth certain information with respect to the beneficial ownership of our common stock, Series A Preferred Stock and Series B Preferred Stock by (i) by each of our directors and executive officers, (ii) by all of our director and executive officers as a group, and (iii) by each person or entity known by us to beneficially own more than 5% of any class of our outstanding shares. We have determined the number and percentage of shares beneficially owned by such person in accordance with Rule 13d-3 under the Exchange Act.
| Name and Address of Beneficial Owner(1)(2) | Shares of Common Stock Beneficially Owned(3) | Percentage of Shares of Common Stock Beneficially Owned(4) | Shares of Common Stock Underlying Shares of Series A Preferred Stock Beneficially Owned(5) | Percentage of Shares of Common Stock Underlying Shares of Series A Preferred Stock Beneficially Owned(6) | Total Percentage of Outstanding Shares of Fully Converted Voting Common Stock Beneficially Owned(7) | |||||||||||||||
| Directors, Executive Officers, and Significant Employees | ||||||||||||||||||||
| Philip L. Rose(8) | 180,564 | 6.4 | % | — | — | 2.8 | % | |||||||||||||
| Arnold A. Allemang(9) | 323,031 | 12.0 | % | — | — | 5.2 | % | |||||||||||||
| Steven C. Jones(10) | 194,456 | 7.2 | % | — | — | 3.1 | % | |||||||||||||
| David G. Pendell(11) | 37,704 | 1.4 | % | 5,919 | * | * | ||||||||||||||
| Molly P. Zhang(12) | 2,500 | * | — | — | * | |||||||||||||||
| Bamidele Ali(13) | — | — | — | — | — | |||||||||||||||
| Scott Murray(14) | 40,100 | 1.5 | % | — | — | * | ||||||||||||||
| Liya Wang(15) | 37,500 | 1.4 | % | — | — | * | ||||||||||||||
| Directors & Executive Officers as a Group (8 persons) | 815,855 | 27.2 | % | 5,919 | * | 12.5 | % | |||||||||||||
| Certain Other Beneficial Owners – Over 5% Ownership | ||||||||||||||||||||
| Aspen Advanced Opportunity Fund, LP(16) | 3,604,651 | 57.5 | % | 3,604,651 | 71.1 | % | 46.6 | % | ||||||||||||
| POSCO(17) | 481,250 | 16.3 | % | 281,250 | 7.8 | % | 7.7 | % | ||||||||||||
| ASC-XGS, LLC(18) | 311,293 | 10.5 | % | 311,293 | 8.9 | % | 5.0 | % | ||||||||||||
| XGS II, LLC(19) | 360,946 | 11.9 | % | 360,946 | 9.8 | % | 5.7 | % | ||||||||||||
| SVIC No. 15 New Technology Business Investment LLP (Samsung)(20) | 590,079 | 18.1 | % | 590,079 | 16.8 | % | 9.6 | % | ||||||||||||
| Michael R. Knox(21) | 268,090 | 9.5 | % | 135,423 | 3.9 | % | 4.3 | % | ||||||||||||
| * | Less than 1% |
| (1) | Beneficial ownership is determined in accordance with the rules of the SEC and generally includes voting or investment power with respect to securities. In accordance with SEC rules, shares of stock issuable upon the exercise of options, warrants and other convertible securities which are currently exercisable and convertible or which become exercisable or convertible within sixty (60) days following the date of the information in this table are deemed to be beneficially owned by, and outstanding with respect to, the holder of such option, warrant or other convertible security. Subject to community property laws where applicable, and unless otherwise specified, to our knowledge, each person listed is believed to have sole voting and investment power with respect to all shares owned by such person. |
| (2) | Unless otherwise specified, the address of the beneficial owner shall be the business address of the Company, c/o XG Sciences, Inc., 3101 Grand Oak Drive, Lansing, MI 48911. |
| (3) | Number of shares of common stock includes, as of the Ownership Date: (i) shares of common stock registered in the name of the respective stockholder; (ii) shares of common stock which are issuable upon the conversion of Series A Preferred Stock registered in the name of the respective stockholder that are immediately convertible at the current Series A Conversion Rate; (iii) shares of common stock underlying common stock options and/or common stock warrants of the respective stockholder and which are exercisable within sixty (60) days of the Ownership Date; and (iv) shares of common stock which are issuable upon the exercise of warrants to purchase Series A Preferred Stock currently exercisable within sixty (60) days of the Ownership Date that are registered in the name of the respective stockholder and the conversion of such Series A Preferred Stock into common stock at the current Series A Conversion Rate. |
| (4) | Applicable percentage of ownership of common stock for each respective stockholder is based on 2,662,525 shares of common stock issued and outstanding as of the Ownership Date, together with: (i) shares of common stock which are issuable upon the conversion of Series A Preferred Stock registered in the name of the respective stockholder that are immediately convertible at the current Series A Conversion Rate; (ii) shares of common stock underlying stock options and/or common stock warrants registered in the name of the respective stockholder and which are exercisable within sixty (60) days of the Ownership Date; and (iii) shares of common stock underlying warrants to purchase Series A Preferred Stock registered in the name of the respective stockholder which are exercisable and convertible into common stock, at the current Series A Conversion Rate, within sixty (60) days of the Ownership Date. |
| 85 |
| (5) | Number of shares of Series A Preferred Stock includes, as of the Ownership Date: (i) shares of common stock which are issuable upon the conversion of Series A Preferred Stock registered in the name of the respective stockholder that are immediately convertible at the current Series A Conversion Rate; and (ii) shares of common stock which are issuable upon the exercise of warrants to purchase Series A Preferred Stock currently exercisable within sixty (60) days of the Ownership Date that are registered in the name of the respective stockholder and the conversion of such Series A Preferred Stock into common stock at the current Series A Conversion Rate. |
| (6) | Applicable percentage of ownership of Series A Preferred Stock, as of the Ownership Date, is based on 3,510,174 shares of common stock which are issuable upon conversion of all 1,872,096 shares of Series A Preferred Stock that are immediately convertible, together with shares of common stock underlying warrants to purchase Series A Preferred Stock registered in the name of the respective stockholder which are exercisable and convertible into common stock, at the current Series A Conversion Rate, within sixty (60) days of the Ownership Date. |
| (7) | Applicable percentage of ownership of fully converted voting common stock, as of the Ownership Date, is based on: (i) 2,662,525 shares of common stock issued and outstanding, (ii) 3,510,174 shares of common stock which are issuable upon the conversion of 1,872,096 shares of Series A Preferred Stock that are immediately convertible, (iii) shares of common stock underlying options and/or common stock warrants of the respective stockholder which are exercisable within sixty (60) days of the Ownership Date, and (iv) shares of common stock which are issuable upon the exercise of warrants to purchase Series A Preferred Stock currently exercisable within sixty (60) days of the Ownership Date that are registered in the name of the respective stockholder and the conversion of such Series A Preferred Stock into common stock at the current Series A Conversion Rate. |
| (8) | Philip Rose figures include: (i) 6,250 shares of common stock; (ii) 171,658 shares of common stock underlying currently exercisable options; and (iii) 2,656 shares of common stock underlying currently exercisable warrants. |
| (9) | Arnold Allemang figures include: (i) 286,875 shares of common stock; (ii) 24,656 shares of common stock underlying currently exercisable warrants; and (iv) 11,500 shares of common stock underlying currently exercisable options. The shares of common stock and warrants are held in the name of the Arnold Avery Allemang Revocable Trust. |
| (10) | Steven Jones figures include: (i) 2,500 shares of common stock; (ii) 11,000 shares of common stock underlying currently exercisable options; (iii) 77,500 shares of common stock and 9,969 shares of common stock underlying currently exercisable warrants, held in the name Jones Network, LP, of which Mr. Jones is the General Partner; (iv) 6,250 shares of common stock and 2,656 shares of common stock underlying currently exercisable warrants, held in the name Jones Extended Family Trust, of which Mr. Jones is trustee; (v) 13,000 shares of common stock and 3,750 shares of common stock underlying currently exercisable warrants, held in the name of MadSavAsh Investments, LLC, of which Mr. Jones is managing member; (vi) 34,250 shares of common stock and 8,281 shares of common stock underlying currently exercisable warrants, held in the name Steven & Carisa Jones 401K Plan and Trust, of which Mr. Jones is trustee; (vii) 300 shares of common stock held jointly with his 3 children: 100 shares held in the name of Savannah W. Jones & Steven C. Jones JTWROS, 100 shares held in the name of Ashleigh C. Jones and Steven C. Jones JTWROS, and Madison A. Jones & Steven C. Jones JTWROS; and (viii) 25,000 shares of common stock held in the name of Steven & Carisa Jones JTWROS. Mr. Jones is an affiliate of Aspen Advanced Opportunity Fund, LP (“AAOF”), which owns 1,089,148 shares of Series A Preferred Stock which are currently convertible into 2,042,152 shares of common stock and currently exercisable warrants to purchase 833,333 shares of Series A Preferred Stock which are currently convertible into 1,562,499 shares of common Stock. Mr. Jones disclaims beneficial ownership of the shares and warrants owned by AAOF. |
| (11) | David Pendell figures include: (i) 2,500 shares of common stock; (ii) 3,000 shares of common stock underlying currently exercisable options; (iii) 2,875 shares of common stock underlying currently exercisable warrants; (iv) 5,919 shares of common stock issuable upon the conversion of 3,157 shares of Series A Preferred Stock held jointly with his wife Vicky Pendell; (v) 6,250 shares of common stock and 2,656 shares of common stock underlying currently exercisable warrants, held in the name David Pendell Revocable Trust; (vi) 12,504 shares of common stock held in the name of the Shirley G. Pendell Irrevocable Trust, of which Mr. Pendell is a trustee; and (vii) 2,000 shares of common stock held in the name of Pendell Irrevocable Trust U/A dated 12/9/98, of which Mrs. Vicky Pendell is a trustee. Mr. Pendell is an affiliate of AAOF, which owns 1,074,868 shares of Series A Preferred Stock which are currently convertible into 2,015,377 shares of common stock and currently exercisable warrants to purchase 833,333 shares of Series A Preferred Stock which are currently convertible into 1,562,499 shares of common Stock. Mr. Pendell is also an affiliate of XGS II, LLC, which owns 109,172 shares of Series A Preferred Stock which are currently convertible into 204,697 shares of common stock and currently exercisable warrants to purchase 83,333 shares of Series A Preferred Stock which are currently convertible into 156,249 shares of common Stock. Mr. Pendell is also an affiliate of ASC XGS, LLC, which owns 166,023 shares of Series A Preferred Stock which are currently convertible into 311,293 shares of common stock. Mr. Pendell disclaims beneficial ownership of any shares and warrants owned by AAOF, XGS II or ASC XGS. |
| (12) | Molly P. Zhang figures include: (i) 2,500 shares of common stock. |
| (13) | Bamidele Ali does not currently own any common or other stock. |
| 86 |
| (14) | Scott Murray figures include (i) 100 shares of common stock; and (ii) 40,000 shares of common stock underlying currently exercisable options. |
| (15) | Liya Wang figures include 30,500 shares of common stock underlying currently exercisable options. |
| (16) | Aspen Advanced Opportunity Fund, LP figures include: (i) 2,015,377 shares of common stock underlying 1,074,868 shares of immediately convertible Series A Preferred Stock, and (ii) 1,562,499 shares of common stock issuable upon the exercise and conversion of currently exercisable warrants to purchase 833,333 shares of Series A Preferred Stock. |
| (17) | POSCO figures include: (i) 200,000 shares of common stock, (ii) 187,500 shares of common stock underlying 100,000 shares of immediately convertible Series A Preferred Stock, and (iii) 93,750 shares of common stock issuable upon the exercise and conversion of currently exercisable warrants to purchase 50,000 shares of Series A Preferred Stock. |
| (18) | ASC XGS, LLC figures include 311,293 shares of common stock underlying 166,023 shares of immediately convertible Series A Preferred Stock. |
| (19) | XGS II, LLC figures include: (i) 204,697 shares of common stock underlying 109,172 shares of immediately convertible Series A Preferred Stock, and (ii) 156,249 shares of common stock issuable upon the exercise and conversion of currently exercisable warrants to purchase 83,333 shares of Series A Preferred Stock. |
| (20) | SVIC No. 15 New Technology Business Investment LLP, an investment vehicle owned by Samsung Group, figures include 590,881 shares of common stock underlying 314,709 shares of immediately convertible Series A Preferred Stock. |
| (21) | Michal Knox figures include: (i) 121,667 shares of common stock; (ii) 11,000 shares of common stock underlying currently exercisable warrants; and (iii) 135,423 shares of common stock underlying 72,226 shares of immediately convertible shares of Series A Preferred Stock. Mr. Knox retired from the Company and resigned as a Director on February 24, 2016. |
Change in Control Arrangements
We are not aware of any arrangements that could result in a change of control.
In the discussion that follows, we have summarized selected provisions of our Articles of Incorporation, as amended relating to our capital stock. This summary is not complete. This discussion is subject to the relevant provisions of the Michigan Business Corporation Act and is qualified in its entirety by reference to our Articles of Incorporation, as amended and our Bylaws. You should read the provisions of our Articles of Incorporation, as amended and our Bylaws as currently in effect for provisions that may be important to you.
Common Stock
As of May 14, 2018, we had 25,000,000 shares of common stock, no stated par value per share, authorized for issuance and 2,662,525 shares of common stock issued and outstanding.
In accordance with the terms of our Bylaws, each outstanding share of capital stock is entitled to one vote on each matter submitted to a vote, unless otherwise provided in our Articles of Incorporation, as amended. A vote may be cast either orally or in writing. When an action, other than the election of Directors, is to be taken by vote of the stockholders, it shall be authorized by a majority of the votes cast by the holders of shares of capital stock entitled to vote thereon, unless a plurality is required by the Articles of Incorporation, as amended or by the laws of the State of Michigan. Except as otherwise provided by our Articles of Incorporation, as amended, the Directors shall be elected by a plurality of the votes cast at an election of Directors. Holders of common stock do not have cumulative voting rights in the election of Director.
According to our Articles of Incorporation, as amended, and Bylaws, any action required or permitted to be taken at an annual or special meeting of stockholders may be taken without a meeting, without prior notice, and without a vote, if consents in writing, setting forth the action so taken, are signed by the holders of outstanding shares having not less than the minimum number of votes that would be necessary to authorize or take the action at a meeting at which all shares entitled to vote on the action were present and voted.
Each stockholder is entitled to receive dividends, as the Board of Directors may, from time to time, declare in a manner and upon the terms and conditions provided by the laws of the State of Michigan and our Articles of Incorporation, as amended.
Holders of the common stock have no preemptive or other preferential rights to purchase additional shares of any class of the Company’s capital stock in subsequent stock offerings.
| 87 |
Preferred Stock
As of May 14, 2018, the Company had 8,000,000 shares of preferred stock authorized for issuance, no stated par value per share. As of May 14, 2018, 3,000,000 preferred shares have been designated as Series A Preferred Stock, of which 1,872,096 shares of Series A Preferred Stock were issued and are outstanding; and 1,500,000 shares have been designated as Series B Preferred Stock, of which none were issued and outstanding. The remaining 3,500,000 authorized shares are shares of blank check preferred stock which may be issued in one or more series, each of such series to have such designations, powers, preferences, and relative participating, optional, or other rights, and such qualifications, limitations, or restrictions, as may be stated in a resolution or resolutions providing for the issue of such series adopted by the Board of Directors.
Series A Convertible Preferred Stock
As of May 14, 2018, 3,000,000 preferred shares have been designated as Series A Preferred Stock, of which 1,872,096 shares of Series A Preferred Stock were issued and are outstanding.
Pursuant to the Series A Designations, the Company’s Series A Preferred Stock have the following powers, preferences, rights, qualifications, limitations and restrictions:
Upon any liquidation, dissolution or winding up of the Company, either voluntary or involuntary, the holders of the Series A Preferred Stock shall be entitled to receive, prior and in preference to any distribution of any of the assets of the Company to the holders of common stock by reason of their ownership of such stock, an amount per share for each share of Series A Preferred Stock held by them equal to (i) the Liquidation Preference, as such term is defined in the Series A Designations, specified for such share of Series A Preferred Stock less (ii) all dividends (if any) paid on such share of Series A Preferred Stock.
With respect to any matter presented to the stockholders of the Company for their action or consideration at any meeting of stockholders of the Company, or by written consent of stockholders in lieu of a meeting, each holder of Series A Preferred Stock shall be entitled to cast the number of votes equal to the number of whole shares of common stock into which the shares of Series A Preferred Stock held by such holder are convertible as of the record date for determining stockholders entitled to vote on such matter.
Each share of Series A Preferred Stock shall be convertible, at the option of the holder thereof, at any time after the date of issuance of such share, into that number of fully paid, non-assessable shares of common stock determined by dividing the Series A Original Issue Price (which is $12.00 per share), subject to certain adjustments from time to time for recapitalizations, by the Conversion Price (which is currently $6.40 per share), subject to adjustment from time to time for recapitalizations or as otherwise set forth in the Series A Designations. The conversion price of the Series A Preferred Stock is also subject to adjustments pursuant to the occurrence of stock splits and certain other specified events. The number of shares of common stock into which each share of Series A Preferred Stock may be converted is the “Series A Conversion Rate”. The current Series A Conversion Rate is 1.875 shares of common stock for each share of Series A Preferred Stock.
Furthermore, each share of Series A Preferred Stock is subject to mandatory conversion at the then-effective Series A Conversion Rate (currently 1.875 for 1) upon the Public Listing by the Company of its common stock on a Qualified National Exchange. Notwithstanding the foregoing, the Series A Preferred Stock shall not be subject to such mandatory conversion until all outstanding Convertible Securities (any evidences of indebtedness, shares or other securities convertible into or exchangeable for common stock or preferred stock) are also converted into common stock.
Upon any liquidation, dissolution or winding up of the Company, either voluntary or involuntary, the holders of the Series A Preferred Stock shall be entitled to receive, prior and in preference to any distribution of any of the assets of the Company to the holders of the common stock by reason of their ownership of such stock, an amount per share for each share of Series A Preferred Stock held by them equal to (i) the Liquidation Preference, as such term is defined in the Series A Designations, specified for such share of Series A Preferred Stock less (ii) all dividends (if any) paid on such share of Series A Preferred Stock.
With respect to any matter presented to the stockholders of the Company for their action or consideration at any meeting of stockholders of the Company, or by written consent of stockholders in lieu of a meeting, each holder of Series A Preferred Stock shall be entitled to cast the number of votes equal to the number of whole shares of common stock into which the shares of Series A Preferred Stock held by such holder are convertible as of the record date for determining stockholders entitled to vote on such matter.
Series B Units
In April 2015, we commenced a private placement offering of up to $18,000,000 in Series B Units consisting of up to 1,125,000 shares of Series B Preferred Stock and warrants to purchase common stock at an offering price of $16.00 per Series B Unit (also referred to herein as the Series B warrants). As of December 31, 2015, we had sold Series B Units consisting of 266,887 shares of Series B Preferred Stock and Warrants to purchase 222,262 shares of common stock, for aggregate gross proceeds of $4,270,192. In addition, the private placement triggered a preemptive rights offering to existing shareholders and holders of convertible notes. The preemptive rights offering resulted in the issuance additional Series B Units consisting of 3,100 shares of Series B Preferred Stock and Warrants to purchase 2,635 shares of common stock which resulted in additional proceeds of $49,600. The Series B Unit offering was terminated on February 25, 2016. As a result of this offering and pursuant to the Series B Exchange Rights, holders of Series B Preferred Stock received the right to exchange each share of Series B Preferred Stock they owned into two shares of common stock. As of December 31, 2016, all holders of Series B Preferred Stock had exercised their Series B Exchange Rights, and as a result the Company issued 539,974 shares of restricted common stock in exchange for the 269,987 shares of Series B Preferred Stock that had been previously outstanding. All of the previously issued Series B Preferred Stock was cancelled. However, all of the Warrants issued in connection with the Series B Units remain outstanding at May 14, 2018.
| 88 |
Series B Convertible Preferred Stock
As of May 14, 2018, 1,500,000 shares have been designated as Series B Preferred Stock, of which none were issued and outstanding.
Pursuant to the Series B Designations, as amended, and in addition to the rights set forth above in the subsection entitled “Series B Units”, the Company’s Series B Preferred Stock has the following powers, preferences, rights, qualifications, limitations and restrictions:
Series B Preferred Stock shall rank (a) senior to all other equity or equity equivalent securities of the Company other than those securities which are explicitly senior orpari passu in rights and liquidation preference to the Series B Preferred Stock (“Junior Securities”) and (b)pari passu with the Company’s Series A Preferred Stock and (c) junior to all other series of the Company’s preferred stock that are explicitly senior in rights and liquidation preference which, as of the date hereof, is none.
In the event of any liquidation, dissolution or winding up of the Company, either voluntary or involuntary, holders of the Series B Preferred Stock shall be entitled to receive, prior and in preference to any distribution of any of the assets of the Company to the holders of Junior Securities, an amount per share for each share of Series B Preferred held by them equal to $16.00.
With respect to any matter presented to the stockholders of the Company for their action or consideration at any meeting of stockholders of the Company, or by written consent of stockholders in lieu of a meeting, each holder of Series B Preferred Stock shall be entitled to cast the number of votes equal to the number of whole shares of common stock into which the shares of Series B Preferred Stock held by such holder are convertible as of the record date for determining stockholders entitled to vote on such matter.
Each share of Series B Preferred Stock shall be convertible, at the option of the holder thereof, at any time after the date of issuance of such share, into that number of fully paid, non-assessable shares of common stock determined by dividing the Series B Original Issue Price (which is currently $16.00, subject to adjustments), by the Conversion Price (which is currently $16.00, subject to adjustments), as such terms are further defined in the Series B Designations. The conversion price of the Series B Preferred Stock is subject to adjustments pursuant to the occurrence of stock splits and certain other specified events. The number of shares of common stock into which each share of Series B Preferred Stock may be converted is the “Series B Conversion Rate”. The current Series B Conversion Rate is 1 share of common stock for each share of Series B Preferred Stock.
Furthermore, each share of Series B Preferred Stock is subject to mandatory conversion at the then-effective Series B Conversion Rate (currently 1 for 1) upon the Public Listing by the Company of its common stock on a Qualified National Exchange. Notwithstanding the foregoing, the Series B Preferred Stock shall not be subject to such mandatory conversion until all outstanding Convertible Securities (any evidences of indebtedness, shares or other securities convertible into or exchangeable for common stock or preferred stock) are also converted into common stock.
Warrants
In conjunction with previous loans to the Company in 2009 and 2012 by Michael Knox, warrants to purchase 5,000 and 6,000 shares of common stock, respectively, were issued to Mr. Knox. In conjunction with the sale of Series B Units in April and June of 2015, an additional 224,897 warrants to purchase shares of common stock were issued (as a component of the Series B Units). In connection with the December Notes and December Warrants issuance, warrants to purchase 20,625 shares of common stock were issued to certain existing stockholders of the Company. In connection with the issuance of certain promissory notes in March 2016, warrants to purchase 10,600 shares of common stock were issued to certain existing stockholders of the Company. In connection with the Dow Facility, in December 2016, July, September, and December of 2017, warrants to purchase 125,000 shares of common stock were issued to The Dow Chemical Company. These common stock warrants have exercise prices ranging $8.00 to $16.00 per share, with a weighted average purchase price of $12.69 per share. These warrants expire on various dates ranging from July 2019 to October 2027. In 2014, warrants to purchase 1,072,720 shares of Series A Preferred Stock were issued in conjunction with the sale of Series A Preferred Stock, of which 972,720 are currently into 1,823,845 shares of common stock. All of these Series A warrants are vested. These Series A warrants have an exercise price of $12.00 per share and expire on January 15, 2024.
| 89 |
As of May 14, 2018, outstanding warrants were as follows:
| Holder | Issue Date | Warrant Shares | Expiration Date | Exercise Price | Total Vested on 5/14/18 | Total Not Vested on 5/14/18 | ||||||||||||||
| Warrants to Purchase Common Stock | ||||||||||||||||||||
| Michael R. Knox | 10/8/2012 | 5,000 | 10/8/2017 | $ | 12.00 | 5,000 | — | |||||||||||||
| Michael R. Knox | 7/1/2009 | 6,000 | 7/1/2019 | $ | 8.00 | 6,000 | — | |||||||||||||
| Jones Network, LP | 4/21/2015 | 7,969 | 4/21/2022 | $ | 16.00 | 7,969 | — | |||||||||||||
| George Cardoza | 4/22/2015 | 2,125 | 4/22/2022 | $ | 16.00 | 2,125 | — | |||||||||||||
| William Robison | 4/22/2015 | 26,563 | 4/22/2022 | $ | 16.00 | 26,563 | — | |||||||||||||
| Steven Purcell | 4/23/2015 | 5,313 | 4/23/2022 | $ | 16.00 | 5,313 | — | |||||||||||||
| James D. Chambers | 4/24/2015 | 5,100 | 4/24/2022 | $ | 16.00 | 5,100 | — | |||||||||||||
| Golden Hills Investments, LLLP | 4/24/2015 | 13,281 | 4/24/2022 | $ | 16.00 | 13,281 | — | |||||||||||||
| Muriel F. Licht Trust | 4/24/2015 | 2,656 | 4/24/2022 | $ | 16.00 | 2,656 | — | |||||||||||||
| Hewit Hawn | 4/24/2015 | 266 | 4/24/2022 | $ | 16.00 | 266 | — | |||||||||||||
| First Trust Company of Onaga FBO Kenneth RJ Rettig | 4/27/2015 | 956 | 4/27/2022 | $ | 16.00 | 956 | — | |||||||||||||
| Jones Extended Family Trust | 4/27/2015 | 2,656 | 4/27/2022 | $ | 16.00 | 2,656 | — | |||||||||||||
| David G. Pendell Revocable Trust | 4/28/2015 | 2,656 | 4/28/2022 | $ | 16.00 | 2,656 | — | |||||||||||||
| Edelgard Traut | 4/28/2015 | 850 | 4/28/2022 | $ | 16.00 | 850 | — | |||||||||||||
| First Trust Company of Onaga FBO George A. Shaw | 4/28/2015 | 2,656 | 4/28/2022 | $ | 16.00 | 2,656 | — | |||||||||||||
| John M. O’Neill | 4/28/2015 | 850 | 4/28/2022 | $ | 16.00 | 850 | — | |||||||||||||
| L.D. Sipes, Jr. | 4/28/2015 | 8,500 | 4/28/2022 | $ | 16.00 | 8,500 | — | |||||||||||||
| Lexy and Steven Shroyer Family Trust 2004 | 4/28/2015 | 7,969 | 4/28/2022 | $ | 16.00 | 7,969 | — | |||||||||||||
| Robert Moyer | 4/28/2015 | 3,985 | 4/28/2022 | $ | 16.00 | 3,985 | — | |||||||||||||
| Samuel H. Jones Jr. | 4/28/2015 | 5,313 | 4/28/2022 | $ | 16.00 | 5,313 | — | |||||||||||||
| Elaine D. Cavanna | 4/29/2015 | 1,381 | 4/29/2022 | $ | 16.00 | 1,381 | — | |||||||||||||
| Shannondoah, LLC | 4/29/2015 | 1,275 | 4/29/2022 | $ | 16.00 | 1,275 | — | |||||||||||||
| Traut Family Trust UTD 7/3/13 | 4/29/2015 | 850 | 4/29/2022 | $ | 16.00 | 850 | — | |||||||||||||
| Ravi Shanker | 4/29/2015 | 850 | 4/29/2022 | $ | 16.00 | 850 | — | |||||||||||||
| David Fuhrhop and Marcia L. Fuhrhop | 4/29/2015 | 495 | 4/29/2022 | $ | 16.00 | 495 | — | |||||||||||||
| Thomas Bombeck IV | 4/29/2015 | 2,550 | 4/29/2022 | $ | 16.00 | 2,550 | — | |||||||||||||
| Arnold Avery Allemang Revocable Trust | 4/29/2015 | 13,281 | 4/29/2022 | $ | 16.00 | 13,281 | — | |||||||||||||
| Steven & Carisa Jones 401K Plan & Trust | 4/29/2015 | 2,656 | 4/29/2022 | $ | 16.00 | 2,656 | — | |||||||||||||
| George J. and/or Beverly A. Biltz | 4/29/2015 | 3,188 | 4/29/2022 | $ | 16.00 | 3,188 | — | |||||||||||||
| Philip Rose | 4/29/2015 | 2,656 | 4/29/2022 | $ | 16.00 | 2,656 | — | |||||||||||||
| Laurie L. Bock Administrative Trust | 4/29/2015 | 797 | 4/29/2022 | $ | 16.00 | 797 | — | |||||||||||||
| Kay B. Coin | 4/29/2015 | 1,329 | 4/29/2022 | $ | 16.00 | 1,329 | — | |||||||||||||
| LMRAY, LLC | 4/29/2015 | 399 | 4/29/2022 | $ | 16.00 | 399 | — | |||||||||||||
| Spinnaker Brown, LLC | 4/29/2015 | 1,435 | 4/29/2022 | $ | 16.00 | 1,435 | — | |||||||||||||
| Who Dat Nation Trust | 4/29/2015 | 1,496 | 4/29/2022 | $ | 16.00 | 1,496 | — | |||||||||||||
| Arthur Baumann | 4/29/2015 | 691 | 4/29/2022 | $ | 16.00 | 691 | — | |||||||||||||
| 90 |
| Holder | Issue Date | Warrant Shares | Expiration Date | Exercise Price | Total Vested on 5/14/18 | Total Not Vested on 5/14/18 | ||||||||||||||
| N. Rich Holdings, LLC | 4/29/2015 | 1,700 | 4/29/2022 | $ | 16.00 | 1,700 | — | |||||||||||||
| M. Rich Holdings, LLC | 4/29/2015 | 5,100 | 4/29/2022 | $ | 16.00 | 5,100 | — | |||||||||||||
| David P. Stern Trust UA 12-19-2001 | 4/29/2015 | 425 | 4/29/2022 | $ | 16.00 | 425 | — | |||||||||||||
| Arnold S. and Bette G. Hoffman | 4/29/2015 | 2,656 | 4/29/2022 | $ | 16.00 | 2,656 | — | |||||||||||||
| Tomas R. Manson Family Trust | 4/29/2015 | 1,275 | 4/29/2022 | $ | 16.00 | 1,275 | — | |||||||||||||
| Thomas and Carmelita B. Karacic | 4/29/2015 | 2,656 | 4/29/2022 | $ | 16.00 | 2,656 | — | |||||||||||||
| Erik J. Falconer | 4/29/2015 | 2,550 | 4/29/2022 | $ | 16.00 | 2,550 | — | |||||||||||||
| Brian G. Martindale Trust | 4/29/2015 | 2,720 | 4/29/2022 | $ | 16.00 | 2,720 | — | |||||||||||||
| OK Enterprises | 4/30/2015 | 797 | 4/30/2022 | $ | 16.00 | 797 | — | |||||||||||||
| Mary V. Murfey Family Trust #2 | 4/30/2015 | 3,400 | 4/30/2022 | $ | 16.00 | 3,400 | — | |||||||||||||
| Galt Asset Management | 4/30/2015 | 2,656 | 4/30/2022 | $ | 16.00 | 2,656 | — | |||||||||||||
| Paul Anthony Radomski | 4/30/2015 | 8,500 | 4/30/2022 | $ | 16.00 | 8,500 | — | |||||||||||||
| Stevens Financial Group, LLC | 4/30/2015 | 26,563 | 4/30/2022 | $ | 16.00 | 26,563 | — | |||||||||||||
| First Trust Company of Onaga FBO James M Rajewski | 4/30/2015 | 1,993 | 4/30/2022 | $ | 16.00 | 1,993 | — | |||||||||||||
| David Ari Johnson and Gabrielle Johnson Revocable Trust 1-13-14 | 4/30/2015 | 1,329 | 4/30/2022 | $ | 16.00 | 1,329 | — | |||||||||||||
| Timothy Long Living Trust | 4/30/2015 | 531 | 4/30/2022 | $ | 16.00 | 531 | — | |||||||||||||
| Thomas W. Rouse | 4/30/2015 | 1,036 | 4/30/2022 | $ | 16.00 | 1,036 | — | |||||||||||||
| Morgan Duke | 4/30/2015 | 2,656 | 4/30/2022 | $ | 16.00 | 2,656 | — | |||||||||||||
| Howard Moskow | 4/30/2015 | 1,329 | 4/30/2022 | $ | 16.00 | 1,329 | — | |||||||||||||
| Hoffman Investment Company | 4/30/2015 | 2,656 | 4/30/2022 | $ | 16.00 | 2,656 | — | |||||||||||||
| Russell S. Deane Trust 1/4/2008 | 4/30/2015 | 1,063 | 4/30/2022 | $ | 16.00 | 1,063 | — | |||||||||||||
| Scott Lizenby | 4/30/2015 | 340 | 4/30/2022 | $ | 16.00 | 340 | — | |||||||||||||
| Michael D. Bierlein Intervivos Trust | 4/30/2015 | 2,790 | 4/30/2022 | $ | 16.00 | 2,790 | — | |||||||||||||
| Lillian Elizabeth Deane Trust dated July 2, 1993 | 4/30/2015 | 531 | 4/30/2022 | $ | 16.00 | 531 | — | |||||||||||||
| Jennifer Dana Dean | 4/30/2015 | 850 | 4/30/2022 | $ | 16.00 | 850 | — | |||||||||||||
| First Trust Company of Onaga FBO Robert L Hartsock | 4/30/2015 | 1,275 | 4/30/2022 | $ | 16.00 | 1,275 | — | |||||||||||||
| Robert and Carlita Gasparini | 4/30/2015 | 1,329 | 4/30/2022 | $ | 16.00 | 1,329 | — | |||||||||||||
| Colin Cronin | 5/26/2015 | 2,125 | 5/26/2022 | $ | 16.00 | 2,125 | — | |||||||||||||
| Lawrence T. Drzal | 5/26/2015 | 510 | 5/26/2022 | $ | 16.00 | 510 | — | |||||||||||||
| Rodney Boulanger | 6/26/2015 | 1,563 | 6/26/2022 | $ | 16.00 | 1,563 | — | |||||||||||||
| James R. DeVore and Joan Mobley-DeVore | 6/30/2015 | 5,000 | 6/30/2022 | $ | 16.00 | 5,000 | — | |||||||||||||
| Arnold Avery Allemang Revocable Trust | 12/31/2015 | 9,375 | 12/31/2020 | $ | 8.00 | 9,375 | — | |||||||||||||
| Steven & Carisa Jones 401K Plan & Trust | 12/31/2015 | 1,875 | 12/31/2020 | $ | 8.00 | 1,875 | — | |||||||||||||
| Steven & Carisa Jones 401K Plan & Trust | 6/15/2017 | 3,750 | 12/31/2020 | $ | 8.00 | 3,750 | — | |||||||||||||
| MadSavAsh Investments, LLC | 12/31/2015 | 3,750 | 12/31/2020 | $ | 8.00 | 3,750 | — | |||||||||||||
| 91 |
| Holder | Issue Date | Warrant Shares | Expiration Date | Exercise Price | Total Vested on 5/14/18 | Total Not Vested on 5/14/18 | ||||||||||||||
| David G. Pendell | 12/31/2015 | 1,875 | 12/31/2020 | $ | 8.00 | 1,875 | — | |||||||||||||
| David G. Pendell | 3/31/2016 | 1,000 | 3/31/2021 | $ | 10.00 | 1,000 | — | |||||||||||||
| Jones Network, LP | 3/31/2016 | 2,000 | 3/31/2021 | $ | 10.00 | 2,000 | — | |||||||||||||
| Arnold Avery Allemang Revocable Trust | 3/31/2016 | 2,000 | 3/31/2021 | $ | 10.00 | 2,000 | — | |||||||||||||
| L.D. Sipes, Jr. | 3/31/2016 | 1,000 | 3/31/2021 | $ | 10.00 | 1,000 | — | |||||||||||||
| Mainstar Trust FBO George A Shaw | 3/31/2016 | 800 | 3/31/2021 | $ | 10.00 | 800 | — | |||||||||||||
| David H & Marcia L Furhop | 3/31/2016 | 200 | 3/31/2021 | $ | 10.00 | 200 | — | |||||||||||||
| Shannondoah, LLC | 3/31/2016 | 1,200 | 3/31/2021 | $ | 10.00 | 1,200 | — | |||||||||||||
| Arthur/Margarita Baumann | 3/31/2016 | 400 | 3/31/2021 | $ | 10.00 | 400 | — | |||||||||||||
| Brian G. Martindale Trust | 3/31/2016 | 2,000 | 3/31/2021 | $ | 10.00 | 2,000 | — | |||||||||||||
| LMRAY, LLC | 4/30/2016 | 195 | 4/30/2021 | $ | 10.00 | 195 | — | |||||||||||||
| Spinnaker Brown, LLC | 4/30/2016 | 700 | 4/30/2021 | $ | 10.00 | 700 | — | |||||||||||||
| The Dow Chemical Company | 12/14/2016 | 50,000 | 12/1/2023 | $ | 8.00 | 50,000 | — | |||||||||||||
| The Dow Chemical Company | 7/18/2017 | 25,000 | 12/1/2023 | $ | 8.00 | 25,000 | — | |||||||||||||
| The Dow Chemical Company | 9/22/2017 | 25,000 | 12/1/2023 | $ | 8.00 | 25,000 | — | |||||||||||||
| The Dow Chemical Company | 12/4/2017 | 25,000 | 12/1/2023 | $ | 8.00 | 25,000 | — | |||||||||||||
| Total Common Stock Warrants | 393,017 | 393,017 | — | |||||||||||||||||
| Warrants to Purchase Series A Preferred Stock | ||||||||||||||||||||
| Hiroyuki Fukushima | 3/31/2014 | 250 | 1/15/2024 | $ | 12.00 | 250 | — | |||||||||||||
| Inwhan Do | 3/31/2014 | 250 | 1/15/2024 | $ | 12.00 | 250 | — | |||||||||||||
| Peter S. Bosanic & Lisa Kendzioski Bosanic | 1/15/2014 | 625 | 1/15/2024 | $ | 12.00 | 625 | — | |||||||||||||
| John W. Dourjalian | 1/15/2014 | 1,041 | 1/15/2024 | $ | 12.00 | 1,041 | — | |||||||||||||
| Colin D. Cronin | 1/15/2014 | 1,767 | 1/15/2024 | $ | 12.00 | 1,767 | — | |||||||||||||
| Paul Nordstrom | 1/15/2014 | 2,121 | 1/15/2024 | $ | 12.00 | 2,121 | — | |||||||||||||
| POSCO | 3/31/2014 | 50,000 | 1/15/2024 | $ | 12.00 | 50,000 | — | |||||||||||||
| XGS II, LLC | 1/15/2014 | 83,333 | 1/15/2024 | $ | 12.00 | 83,333 | — | |||||||||||||
| Aspen Advanced Opportunity Fund, LP | 1/15/2014 | 833,333 | 1/15/2024 | $ | 12.00 | 833,333 | — | |||||||||||||
| Total Series A Warrants | 972,720 | 972,720 | — | |||||||||||||||||
| Grand Total Warrants | 1,365,737 | 1,365,737 | — | |||||||||||||||||
Stock Options
Our 2007 Stock Option Plan (the “2007 Plan”), which was scheduled to expire on October 30, 2017 and under which we granted key employees and directors options to purchase shares of our common stock at not less than fair market value as of the grant date. On May 4, 2017, the Board approved the 2017 Equity Incentive Plan (the “2017 Plan”) to replace the 2007 Plan, which became effective upon the approval of the stockholders holding a majority of the voting power in the Company on July 18, 2017. The 2017 Plan replaces the 2007 Plan and authorizes us to issue awards (stock options and restricted stock) with respect of a maximum of 1,200,000 shares of our common stock, which equals the number of shares authorized under the 2007 Plan.
As of May 14, 2018, stock options to purchase a total of 687,125 shares at $8.00 per share had been granted to Company employees and Directors, with expiration dates ranging from July 2024 to March 2025.
| 92 |
The following table shows the number of stock options issued and outstanding as of May 14, 2018:
| Total | Total Non- | |||||||||||||||||||
| Exercisable | Exercisable | |||||||||||||||||||
| Total | Within | With | ||||||||||||||||||
| Options | Exercise | 60 Days of | 60 Days of | |||||||||||||||||
| Holder | Issue Date | Issued | Exp. Date | Price | 5/14/2018 | 5/14/2018 | ||||||||||||||
| Philip Rose | 7/24/2017 | 330,000 | 7/24/2024 | $ | 8.00 | 171,658 | 158,342 | |||||||||||||
| Liya Wang | 7/24/2017 | 37,500 | 7/24/2024 | $ | 8.00 | 37,500 | - | |||||||||||||
| R Privette (DOT 3/16/18) | 7/24/2017 | 27,500 | 6/16/2018 | $ | 8.00 | 25,000 | 2,500 | |||||||||||||
| Scott Murray | 7/24/2017 | 40,000 | 7/24/2024 | $ | 8.00 | 40,000 | - | |||||||||||||
| Corinne Lyon | 7/24/2017 | 15,000 | 7/24/2024 | $ | 8.00 | 15,000 | - | |||||||||||||
| Arnold Allemang | 8/10/2017 | 21,750 | 8/10/2024 | $ | 8.00 | 11,500 | 10,250 | |||||||||||||
| Arnold Allemang | 8/10/2017 | 2,500 | 8/10/2024 | $ | 8.00 | - | 2,500 | |||||||||||||
| Steven Jones | 8/10/2017 | 19,875 | 8/10/2024 | $ | 8.00 | 11,000 | 8,875 | |||||||||||||
| Steven Jones | 8/10/2017 | 2,500 | 8/10/2024 | $ | 8.00 | - | 2,500 | |||||||||||||
| Albert Kim | 7/24/2017 | 30,000 | 7/24/2024 | $ | 8.00 | 15,000 | 15,000 | |||||||||||||
| Percy Chinoy | 7/24/2017 | 15,000 | 7/24/2024 | $ | 8.00 | 7,500 | 7,500 | |||||||||||||
| David G. Pendell | 8/10/2017 | 18,000 | 8/10/2024 | $ | 8.00 | 3,000 | 15,000 | |||||||||||||
| David G. Pendell | 8/10/2017 | 2,500 | 8/10/2024 | $ | 8.00 | - | 2,500 | |||||||||||||
| Bamidele Ali | 7/24/2017 | 80,000 | 7/24/2024 | $ | 8.00 | - | 80,000 | |||||||||||||
| Molly Zhang | 8/10/2017 | 2,500 | 8/10/2024 | $ | 8.00 | - | 2,500 | |||||||||||||
| Hiroyuki Fukishima | 11/1/2017 | 10,000 | 11/1/2024 | $ | 8.00 | - | 10,000 | |||||||||||||
| Chris Hessler | 11/1/2017 | 7,500 | 11/1/2024 | $ | 8.00 | - | 7,500 | |||||||||||||
| Bob Budlong | 11/1/2017 | 5,000 | 11/1/2024 | $ | 8.00 | - | 5,000 | |||||||||||||
| Nate Guyuski | 11/1/2017 | 5,000 | 11/1/2024 | $ | 8.00 | - | 5,000 | |||||||||||||
| Trent Hinze | 11/1/2017 | 5,000 | 11/1/2024 | $ | 8.00 | - | 5,000 | |||||||||||||
| Denise Radkowski | 3/19/2018 | 10,000 | 3/19/2025 | $ | 8.00 | 10,000 | ||||||||||||||
| Total Options | 687,125 | 337,158 | 349,967 | |||||||||||||||||
The Company intends to continue to use stock options as one method of attracting and retaining key employees and expects that additional shares will be reserved to cover stock options that might be issued under the plan.
Non-Convertible Promissory Notes
On December 31, 2015, the Company issued non-secured, non-convertible promissory notes (the December Notes) in an aggregate amount of $550,000 to existing stockholders of the Company who are also accredited investors and members of the board of Directors, along with warrants to purchase 20,625 shares of common stock. The December Notes were paid off in full as of June 30, 2016.
During the period from March 9 to April 7, 2016, the Company issued non-secured, non-convertible promissory notes in an aggregate amount of $574,750 to existing stockholders of the Company who are also accredited investors, along with warrants to purchase 11,495 shares of common stock. The notes were paid off in full as of December 31, 2016.
During June 2016, the Company repaid i) outstanding principal of $550,000 plus accrued interest of $22,000 to the December 2015 Bridge Financing investors and ii) outstanding principal of $200,000 plus accrued interest of $5,032 to two of the March 2016 Bridge Financing investors. These investors, who are also members of the board of directors of the Company, used the proceeds from repayment of their notes, plus additional funds, to purchase 199,879 additional shares of the Company’s common stock in this offering for approximately $1.6 million.
The Dow Facility
On December 7, 2016, the Company entered into the Dow Facility, which subsequently closed after approval by holders of at least 60% of the Company’s Series A Convertible Preferred Stock and holders of at least 60% of the Company’s Series B Convertible Preferred Stock.
Under the Dow Facility, Dow will provide up to $10 million of secured debt financing to the Company, drawable upon the Company’s request as follows: (a) $2 million drawn at closing (the “Initial Draw”); (b) up to an additional $3 million drawable on or before December 1, 2017; and (c) up to an additional $5 million drawable after December 1, 2017, but on or before December 1, 2019, if the Company has raised at least $10 million of certain equity capital after October 31, 2016.
| 93 |
The Dow Facility is senior to most of the Company’s other debt and is secured by the Company’s assets and the assets of the Company’s subsidiary, XG Sciences IP, LLC pursuant to a certain Security Agreement, Intellectual Property Security Agreement and Pledge Agreement, by and between the Company and Dow. The Dow Facility bears interest at a 5% annual rate payable quarterly in arrears, provided that higher interest rates may apply in certain circumstances and that the Company may elect to capitalize interest through January 1, 2019. The Dow Facility’s stated maturity date is December 1, 2021, subject to certain prepayment requirements based on the Company’s financing activities, to acceleration upon an event of default, and to certain other events.
In connection with each draw against the Dow Facility, the Company will also issue a warrant to Dow to purchase shares of the Company’s common stock. For each $40 drawn against the Loan, the related warrant entitles the Lender to purchase one share of the Company’s common stock. Therefore, Dow received warrants to purchase 50,000 shares of the Company’s common stock in connection with the Initial Draw, and in connection with subsequent draws may thereafter receive warrants to purchase up to an additional 200,000 shares of the Company’s common stock. The warrant issued in connection with the Initial Draw has an exercise price of $8.00 per share. Subsequent warrants will have an exercise price equal to the lowest price per share paid to the Company in the arm’s-length transaction for the Company’s common stock that precedes the issuance of the warrant, excluding transactions involving warrants and options and excluding common stock that is issued upon the exercise of warrants or options. Warrants will be exercisable by Dow by delivery, on or before the expiration date, of the warrant, certain related agreements, and the purchase price. Warrants will also be subject to cashless exercise. All such warrants would have an expiration date of December 1, 2023.
The Dow Facility entitles Dow to appoint an observer to the Company’s board of directors. Dow will maintain its observation right until the later of December 1, 2019 or when the amount of principal and interest outstanding under the Dow Facility is less than $5 million.
Preemptive Rights
As part of our overall financing agreements with AAOF, we agreed to allow conversion of previously held shares of common stock into Series A Preferred Stock for AAOF affiliates or other stockholders who exercised preemptive rights to purchase Series A Preferred Stock on or before October 31, 2013. The preemptive rights allowed the stockholders to purchase one share of Series A Preferred Stock at a price of $12.00 per share for every two shares of Series A Preferred Stock or common stock owned by the stockholder. Stockholders exercised these preemptive rights to purchase 11,107 shares of Series A Preferred Stock for $133,284. In addition, a total of 174,734 shares of common stock were cancelled on conversion into a like number of shares of Series A Preferred Stock.
On January 15, 2014, as part of our financing agreements with Samsung Ventures, AAOF and XGS II, we agreed to allow all stockholders to purchase one share of Series A Preferred Stock at a price of $12.00 per share for every two shares of Series A Preferred Stock or common stock owned by the stockholder. In addition, for every two preemptive shares purchased, the Company issued the stockholder a warrant to purchase one additional share of Series A Preferred Stock with the same terms as the warrants issued to AAOF and XGS II. The Company also agreed to issue warrants with the same terms to those stockholders who exercised preemptive rights in October 2013. These preemptive rights expired on March 31, 2014.
During the quarter ended March 31, 2014, 101,000 shares of Series A Preferred Stock were sold to existing stockholders at a price of $12.00 per share under the January 15, 2014 preemptive rights offering. In addition, Stock Warrants indexed to 56,054 shares of Series A Preferred Stock were issued in conjunction with these stock purchases, including 5,554 warrants related to the preemptive rights exercised in October 2013.
During the year ended December 31, 2015, 3,100 shares of Series B Preferred Stock and warrants to purchase 2,635 shares of common stock were sold to existing stockholders at a price of $16.00 per share under a preemptive rights offering associated with the April 18, 2015 offering of Series B Units. See also “Description of Securities — Series B Units”.
Our Shareholder Agreement grants preemptive rights to shareholders and holders of convertible notes who are parties to the Shareholder Agreement. Pursuant to the terms therein, such shareholders and note holders have the right to purchase their pro rata share of all shareholder stock that the Company may, from time to time, propose to sell, issue, or exchange after the date of the Shareholder Agreement, other than certain excluded stock which includes stock granted to employees or as merger consideration. Each shareholder’s pro rata shares shall be equal to the ratio of (i) the aggregate number of shares of the Company’s common stock on a fully diluted basis, owned by the such shareholder at the time of the delivery of a preemptive right notice to (ii) the aggregate number of shares of Company’s common stock on a fully diluted basis owned by all of the Company’s shareholders at the time of the delivery of a preemptive rights notice. The Shareholder Agreement’s preemptive rights provision supersedes the preemptive rights granted by the stock redemption agreement.
Our Shareholder Agreement was amended on February 26, 2016, which was effective as of April 13, 2016, to provide that holders of Excluded Stock are not subject to the terms of the Shareholders Agreement. Excluded Stock means shares of common stock that are subject to a registration statement that has been filed with the SEC and has been declared effective. The Amendment to Shareholders Agreement also clarified that preemptive rights shall not apply to Excluded Stock.
| 94 |
Michigan Anti-Takeover Law and Charter Provisions
Provisions of our Articles of Incorporation, as amended may delay or discourage transactions involving an actual or potential change in our control or change in our management. Therefore, these provisions could adversely affect the price of our common stock. Our Articles of Incorporation, as amended, permit our Board of Directors to issue up to 5,000,000 shares of blank check preferred stock in one or more series, each of such series to have such designations, powers, preferences, and relative participating, optional, or other rights, and such qualifications, limitations, or restrictions, as may be stated in a resolution or resolutions providing for the issue of such series adopted by the Board of Directors.
Registration Rights
On December 31, 2015, the Company issued promissory notes and warrants to several existing investors in a private placement (the December Notes and December Warrants). Pursuant to the terms of the subscription agreement therein, the Company agreed to use its best efforts to register its shares of common stock on Form S-1, subject to certain extensions of the registration timeframe which the Company may make in its discretion. Pursuant to the terms of the Series B Unit offering, investors therein were granted registration rights with respect to the common stock underlying the shares of Series B Preferred Stock. The Company agreed to use its best efforts to file a registration statement on Form S-1 with the SEC to register shares of common stock within six months of the last closing of the offering of Series B Units, subject to certain extensions of the registration timeframe which the Company may make in its discretion. On December 20, 2013, the Company, AAOF, XGS II, LLC and Samsung Ventures executed the Second Amended and Restated Registration Rights Agreement whereby AAOF, XGS II, LLC and Samsung Ventures were granted demand and piggy-back registration rights with respect to any shares of common stock held by such investors or issuable upon conversion, exercise or exchange of any securities owned by the investors.
On May 24, 2010, the Company entered into an amended and restated license agreement with MSU whereby the Company, in further consideration of the license, issued 9,543 shares of common stock to MSU and granted to MSU tag-along and piggyback registration rights. The Company agreed to pay all expenses of such registrations.
Transfer Agent and Registrar
Our transfer agent is VStock Transfer, LLC, located at 18 Lafayette Place, Woodmere, NY 11598, telephone number (212) 828-8436 and facsimile number (646) 536-3179.
Use of Non-Exclusive Sales Agents
We intend to engage the services of non-exclusive sales agents to assist us in selling the shares. If we do engage sales agents, each sales agent will not purchase or sell any securities offered by this prospectus, nor will it be required to arrange the purchase or sale of any specific number or dollar amount of securities but must agree to use its best efforts to arrange for the sale of all of the securities offered hereby. Any non-exclusive sales agents do not have any fiduciary duties to the Company and their duties to investors are governed by the laws of each state where such sales agents are registered.
A sales agent may retain other brokers or dealers to act as sub-agents on its behalf in connection with the offering. Therefore, we will enter into a subscription agreement directly with investors in connection with this offering and we may not sell the entire amount of securities offered pursuant to this prospectus. We intend to pay each non-exclusive sales agent a cash fee equal to up to eight percent (8%) of the gross proceeds of this offering attributable to the efforts of such sales agent.
| 95 |
The following table shows the per share sales agent’s fees that we intend to pay to any sales agent in connection with the sale of the shares offered pursuant to this offering, assuming the purchase of all of the shares offered hereby were arranged through sales agents:
| Maximum Selling Commissions as a % of Proceeds from Sale of Common Stock (8%) | ||||
| Sale of all 1,723,993 shares of common stock at $8.00 per share (gross proceeds of $13,791,944) | $ | 1,103,356 | ||
In addition to the commissions payable to sales agents, we may also pay dealer manager commissions to one or more registered broker dealers equal to up to two percent (2%) of the gross proceeds raised by other registered broker dealers serving as sales agents that were introduced to us by a dealer manager, or up to $137,919, assuming that we engage dealer managers that introduce sales agents for 50% of the gross proceeds in this offering.
Our obligation to issue and sell securities to the purchasers is subject to the conditions set forth in the subscription agreement, which may be waived by us at our discretion. A purchaser’s obligation to purchase securities is subject to the conditions set forth in the subscription agreement as well, which may also be waived. We estimate that the total expenses of the offering, including registration, filing and listing fees, printing fees and legal and accounting expenses, including the sales agent fees (assuming that fifty percent (50%) of the shares are sold by sales agents), and the dealer manager fees (assuming that twenty five percent (25%) of the shares are sold by sales agents introduced by dealer managers) will be approximately $760,000, all of which are payable by us.
The foregoing does not purport to be a complete statement of the terms and conditions of the subscription agreement. If sales of shares offered under this prospectus are made to broker-dealers as principals, we would be required to file a post-effective amendment to the registration statement of which this prospectus is a part. In the post-effective amendment, we would be required to disclose the names of any participating broker-dealers and the compensation arrangements relating to such sales.
Direct Sales Efforts by Company without Sales Agents
If we determine not to engage a sales agent, Philip Rose, Steve Jones, Arnold Allemang and Dave Pendell will conduct the offering on our behalf. Such officers and directors will offer the shares solely by means of this prospectus and the investor presentation materials which are attached as Exhibit 99.1 to the registration statement of which this prospectus is a part, to friends, family members, business acquaintances and other contacts, and by direct mail to investors who have indicated an interest in us. In connection with the offering, Philip Rose, Steve Jones, Arnold Allemang and Dave Pendell will not register as a broker-dealer pursuant to Section 15 of the Exchange Act, but rather will rely upon the exemption provided by Rule 3a4-1 under the Exchange Act. Generally speaking, Rule 3a4-1 provides an exemption from the broker-dealer registration requirements of the Exchange Act for persons associated with an issuer that participate in an offering of the issuer’s securities. In order to comply with Rule 3a4-1, such officers and directors:
| • | may not be subject to a statutory disqualification, as that term is defined in Section 3(a)(39) of the Exchange Act, at the time of his participation in this offering; |
| • | may not be compensated in connection with his participation in this offering by the payment of commissions or other remuneration based either directly or indirectly on transactions in our securities; |
| • | may not be, nor have been within the past 12 months, a broker or dealer, and may not, nor have been within the past 12 months, an associated person of a broker or dealer; |
| • | must primarily perform substantial duties for us or on our behalf otherwise than in connection with transactions in securities; and |
| • | may not participate in selling an offering of securities for us more than once every 12 months other than in reliance on Rule 3a4-1(a)(4)(i) or (iii). |
All expenses of the registration statement including, but not limited to, legal, accounting, printing and mailing fees are and will be borne by us.
| 96 |
Penny Stock Regulations
You should note that once our shares are publicly traded, they may become a penny stock. The SEC has adopted Rule 15g-9 which generally defines “penny stock” to be any equity security that has a market price (as defined) less than $5.00 per share or an exercise price of less than $5.00 per share, subject to certain exceptions. Our securities will at such time likely be covered by the Penny Stock Rules, which impose additional sales practice requirements on broker-dealers who sell to persons other than established customers and “accredited investors”. The term “accredited investor” refers generally to institutions with assets in excess of $5,000,000 or individuals with a net worth in excess of $1,000,000 or annual income exceeding $200,000 or $300,000 jointly with their spouse. The Penny Stock Rules require a broker-dealer, prior to a transaction in a penny stock not otherwise exempt from the rules, to deliver a standardized risk disclosure document in a form prepared by the SEC which provides information about penny stocks and the nature and level of risks in the penny stock market. The broker-dealer also must provide the customer with current bid and offer quotations for the penny stock, the compensation of the broker-dealer and its salesperson in the transaction and monthly account statements showing the market value of each penny stock held in the customer’s account. The bid and offer quotations, and the broker-dealer and salesperson compensation information, must be given to the customer orally or in writing prior to effecting the transaction and must be given to the customer in writing before or with the customer’s confirmation. In addition, the Penny Stock Rules require that prior to a transaction in a penny stock not otherwise exempt from these rules, the broker-dealer must make a special written determination that the penny stock is a suitable investment for the purchaser and receive the purchaser’s written agreement to the transaction. These disclosure requirements may have the effect of reducing the level of trading activity in the secondary market for the stock that is subject to these Penny Stock Rules. Consequently, these Penny Stock Rules may affect the ability of broker-dealers to trade our securities if our common stock is publicly traded or quoted. We believe that the Penny Stock Rules discourage investor interest in and limit the marketability of our common stock.
Procedures for Subscribing
If you decide to subscribe for any shares in this offering, you must (1) execute and deliver a subscription agreement; and (2) deliver a check or certified funds to us for acceptance or rejection in accordance with the terms of the subscription agreement.
All checks for subscriptions must be made payable to “XG Sciences, Inc.” The Company will deliver stock certificates attributable to shares of common stock purchased directly to the purchasers.
Right to Reject Subscriptions
We have the right to accept or reject subscriptions in whole or in part, for any reason or for no reason. All monies from rejected subscriptions will be returned promptly by us to the subscriber, without interest or deductions.
Under advisement from certain state securities regulators, we have agreed to limit the scope of this offering in certain states to investors meeting specified suitability standards.
The following table sets forth the suitability for citizens of each state where such standards are applicable.
| Kentucky | Kentucky investors must meet the following criteria: |
| 1. | A net income of at least $200,000 in each of the two most recent years or joint income with a spouse exceeding $300,000 for those years and a reasonable expectation of the same income level in the current year; or |
| 2. | An individual net worth, or joint net worth with that person’s spouse, in excess of $1,000,000, excluding the value of the person’s primary resident. |
| Missouri | Missouri investors must meet the following criteria: |
| 1. | A minimum annual gross income of $70,000 and a minimum net worth of $70,0000, exclusive of automobile home and home furnishings; or |
| 2. | A minimum net worth of $250,000 exclusive of automobile, home and home furnishings. |
| 3. | No more than 10% of any one Missouri investor’s liquid net worth shall be invested in the Company’s securities. |
| 97 |
| Pennsylvania | Pennsylvania investors must meet the following criteria: |
| 1. | A minimum annual gross income of $70,000 and a minimum net worth of $70,0000, exclusive of automobile home and home furnishings; or |
| 2. | A minimum net worth of $250,000 exclusive of automobile, home and home furnishings. |
| Vermont | Vermont investors may invest pursuant to the following restrictions: |
| 1. | Accredited investors in Vermont, as defined in 17 C.F.R. Section 230.501, may invest freely in this offering; and |
| 2. | Non-accredited Vermont investors may not purchase an amount in this offering that exceeds 10% of the investor’s “liquid net worth”, defined as an investor’s total assets (not including home, home furnishings or automobiles) minus total liabilities. |
| California | California investors must meet the following criteria: |
| 1. | Only “Accredited Investors” in California (as that term is defined in Rule 501 of Regulation D of the Securities Act of 1933, as amended) may invest in this offering. |
| New Jersey | New Jersey investors must meet the following criteria: |
| 1. | Only “Accredited Investors” in New Jersey (as that term is defined in Rule 501 of Regulation D of the Securities Act of 1933, as amended) may invest in this offering. |
The validity of the securities being offered by this prospectus has been passed upon for us by Foster Swift Collins & Smith PC, with an address at 313 South Washington Square, Lansing, MI 48933-2114.
The 2017 and 2016 financial statements included in this prospectus have been so included in reliance on the report of Frazier & Deeter, LLC, an independent registered public accounting firm, given on the authority of said firm as experts in auditing and accounting.
No expert or counsel named in this prospectus as having prepared or certified any part of this prospectus or having given an opinion upon the validity of the securities being registered or upon other legal matters in connection with the registration or offering of the common stock was employed on a contingency basis, or had, or is to receive, in connection with the offering, a substantial interest, direct or indirect, in the registrant or any of its parents or subsidiaries. Nor was any such person connected with the registrant or any of its parents or subsidiaries as a promoter, managing or principal underwriter, voting trustee, director, officer, or employee.
INCORPORATION OF CERTAIN DOCUMENTS BY REFERENCE
All documents subsequently filed by the Registrant with the SEC pursuant to Sections 13(a), 13(c), 14 and 15(d) of the Exchange Act (other than those made pursuant to Item 2.02 or Item 7.01 of Form 8-K or other information “furnished” to the SEC) prior to the filing of a post-effective amendment which indicates that all securities offered have been sold or which deregisters all securities then remaining unsold, shall be deemed to be incorporated by reference in the Registration Statement of which this prospectus is a part and to be part hereof from the date of filing of such documents. These documents include periodic reports, such as Proxy Statements, Annual Reports on Form 10-K, Quarterly Reports on Form 10-Q and Current Reports on Form 8-K (other than the portions of those documents not deemed to be filed, which is deemed not to be incorporated by reference in the Registration Statement of which this prospectus is a part). Any statement contained in a document incorporated or deemed to be incorporated herein by reference shall be deemed to be modified or superseded for purposes of the Registration Statement of which this prospectus is a part to the extent that a statement contained herein or in any other subsequently filed document which also is or is deemed to be incorporated by reference herein modifies or supersedes such statement.
WHERE YOU CAN FIND ADDITIONAL INFORMATION
We filed with the Securities and Exchange Commission a registration statement under the Securities Act for the shares of common stock in this offering. This prospectus does not contain all of the information in the registration statement and the exhibits that were filed with the registration statement. For further information with respect to us and our common stock, we refer you to the registration statement and the exhibits that were filed with the registration statement. Statements contained in this prospectus about the contents of any contract or any other document that is filed as an exhibit to the registration statement are not necessarily complete but do contain the material provisions for each such contract and other document, and we refer you to the full text of the contract or other document filed as an exhibit to the registration statement. A copy of the registration statement and the exhibits that were filed with the registration statement may be inspected without charge at the Public Reference Room maintained by the Securities and Exchange Commission at 100 F Street, N.E. Washington, DC 20549, and copies of all or any part of the registration statement may be obtained from the Securities and Exchange Commission upon payment of the prescribed fee. Information regarding the operation of the Public Reference Room may be obtained by calling the Securities and Exchange Commission at 1-800-SEC-0330. The Securities and Exchange Commission maintains a website that contains reports, proxy and information statements, and other information regarding registrants that file electronically with the SEC. The address of the website iswww.sec.gov.
| 98 |
We are obligated to file periodic reports, and we will file periodic reports under the Exchange Act, including annual, quarterly and special reports, and other information with the SEC. These periodic reports and other information will be available for inspection and copying at the regional offices, public reference facilities and website of the Securities and Exchange Commission referred to above.
We will also make available free of charge on or through our internet website our annual reports on Form 10-K, quarterly reports on Form 10-Q, current reports on Form 8-K, and amendments to those reports filed or furnished pursuant to Section 13(a) or 15(d) of the Exchange Act as soon as reasonably practicable after we electronically file such material with, or furnish it to, the Securities and Exchange Commission.
DISCLOSURE OF COMMISSION POSITION ON INDEMNIFICATION
FOR SECURITIES ACT LIABILITY
Our Articles of Incorporation, as amended, state that a Director of the Company shall not be personally liable to the Company or its stockholders for money damages for any action taken or any failure to take any action as a Director, except liability for any of the following:
| (a) | The amount of a financial benefit received by a Director to which the Director is not entitled; |
| (b) | The intentional infliction of harm on the Company or its stockholders; |
| (c) | A violation of Section 551 of the Michigan Business Corporation Act, as amended (the “Act”); or |
| (d) | An intentional criminal act. |
In the event the Act is amended, after approval by the stockholders of the appurtenant article in the Company’s Articles of Incorporation, as amended to authorize corporate action further eliminating or limiting the personal liability of Directors, then the liability of a Director of the Company shall be eliminated or limited to the fullest extent permitted by the Act, as so amended. Any repeal, modification or adoption of any provision in our Articles of Incorporation, as amended inconsistent with this Article in shall not adversely affect any right or protection of a Director of the Company existing at the time of such repeal, modification or adoption.
Our Bylaws states that each person who is or was or had agreed to become a Director or officer of the Company, or each such person who is or was serving or who had agreed to serve at the request of the Board of Directors as an employee or agent of the Company, or as a Director, officer, employee or agent of another corporation (whether for profit or not), partnership, joint venture, trust or other enterprise (including the heirs, executors, administrators or estate of such person), shall be indemnified by the Company to the full extent permitted by the Act or any other applicable laws as presently or hereafter in effect.
The right to indemnification conferred in the Bylaws shall not be exclusive of any right any person may have or acquire under any statute, provision of the Articles of Incorporation, as amended, Bylaws, agreement, vote of stockholders or disinterested Directors, or otherwise.
The Company shall have the power to purchase and maintain insurance on behalf of any person who is or was a Director, officer, employee or agent of the Company or is or was serving at the request of the Company as a Director, officer, partner, trustee, employees or agent of another foreign or domestic corporation, partnership, joint venture, trust or other enterprise, whether for profit or not, against any liability asserted against him or her and incurred by him or her in any such capacity or arising out of his or her status as such, whether or not the Company would have the power to indemnify him or her against such liability under the appurtenant provision of the Company’s Bylaws.
Under Michigan law, however, such provisions do not eliminate the personal liability of a director unless the director (i) acted in good faith; (ii) acted in a manner he or she reasonably believed to be in or not opposed to the best interests of the corporation or its shareholders; and (iii) with respect to a criminal action or proceeding, if the director had no reasonable cause to believe his or her conduct was unlawful. Furthermore, under Section 551of the Act, directors who vote for, or concur in, any of the following corporate actions are jointly and severally liable to the corporation for the benefit of its creditors or shareholders, to the extent any legally recoverable injury suffered by its creditors or shareholders as a result of the action but not to exceed the difference between the amount paid or distributed and the amount that lawfully could have been paid or distributed: (i) a declaration of a share dividend or distribution to shareholders contrary to the Act or contrary to any restriction in the articles of incorporation; (ii) distribution to shareholders during or after dissolution of the corporation without paying or providing for debts obligations and liabilities of the corporation as required by Section 855a of the Act; and (iii) making a loan to a director, officer, or employee of the corporation or of a subsidiary of the corporation contrary to the Act.
| 99 |
We have been advised that in the opinion of the Securities and Exchange Commission indemnification for liabilities arising under the Securities Act is against public policy as expressed in the Securities Act, and is, therefore, unenforceable. In the event that a claim for indemnification against such liabilities is asserted by one of our directors, officers, or controlling persons in connection with the securities being registered, we will, unless in the opinion of our legal counsel the matter has been settled by controlling precedent, submit the question of whether such indemnification is against public policy to a court of appropriate jurisdiction. We will then be governed by the court’s decision.
DISCLOSURE OF COMMISSION POSITION ON INDEMNIFICATION
FOR SECURITIES ACT LIABILITY
Our Articles of Incorporation, as amended, state that a Director of the Company shall not be personally liable to the Company or its stockholders for money damages for any action taken or any failure to take any action as a Director, except liability for any of the following:
(a) The amount of a financial benefit received by a Director to which the Director is not entitled;
(b) The intentional infliction of harm on the Company or its stockholders;
(c) A violation of Section 551 of the Michigan Business Corporation Act, as amended (the “Act”); or
(d) An intentional criminal act.
In the event the Act is amended, after approval by the stockholders of the appurtenant article in the Company’s Articles of Incorporation, as amended to authorize corporate action further eliminating or limiting the personal liability of Directors, then the liability of a Director of the Company shall be eliminated or limited to the fullest extent permitted by the Act, as so amended. Any repeal, modification or adoption of any provision in our Articles of Incorporation, as amended inconsistent with this Article in shall not adversely affect any right or protection of a Director of the Company existing at the time of such repeal, modification or adoption.
Our Bylaws states that each person who is or was or had agreed to become a Director or officer of the Company, or each such person who is or was serving or who had agreed to serve at the request of the Board of Directors as an employee or agent of the Company, or as a Director, officer, employee or agent of another corporation (whether for profit or not), partnership, joint venture, trust or other enterprise (including the heirs, executors, administrators or estate of such person), shall be indemnified by the Company to the full extent permitted by the Act or any other applicable laws as presently or hereafter in effect.
The right to indemnification conferred in the Bylaws shall not be exclusive of any right any person may have or acquire under any statute, provision of the Articles of Incorporation, as amended, Bylaws, agreement, vote of stockholders or disinterested Directors, or otherwise.
The Company shall have the power to purchase and maintain insurance on behalf of any person who is or was a Director, officer, employee or agent of the Company or is or was serving at the request of the Company as a Director, officer, partner, trustee, employees or agent of another foreign or domestic corporation, partnership, joint venture, trust or other enterprise, whether for profit or not, against any liability asserted against him or her and incurred by him or her in any such capacity or arising out of his or her status as such, whether or not the Company would have the power to indemnify him or her against such liability under the appurtenant provision of the Company’s Bylaws.
Under Michigan law, however, such provisions do not eliminate the personal liability of a director unless the director (i) acted in good faith; (ii) acted in a manner he or she reasonably believed to be in or not opposed to the best interests of the corporation or its shareholders; and (iii) with respect to a criminal action or proceeding, if the director had no reasonable cause to believe his or her conduct was unlawful. Furthermore, under Section 551of the Act, directors who vote for, or concur in, any of the following corporate actions are jointly and severally liable to the corporation for the benefit of its creditors or shareholders, to the extent any legally recoverable injury suffered by its creditors or shareholders as a result of the action but not to exceed the difference between the amount paid or distributed and the amount that lawfully could have been paid or distributed: (i) a declaration of a share dividend or distribution to shareholders contrary to the Act or contrary to any restriction in the articles of incorporation; (ii) distribution to shareholders during or after dissolution of the corporation without paying or providing for debts obligations and liabilities of the corporation as required by Section 855a of the Act; and (iii) making a loan to a director, officer, or employee of the corporation or of a subsidiary of the corporation contrary to the Act.
| 100 |
We have been advised that in the opinion of the Securities and Exchange Commission indemnification for liabilities arising under the Securities Act is against public policy as expressed in the Securities Act, and is, therefore, unenforceable. In the event that a claim for indemnification against such liabilities is asserted by one of our directors, officers, or controlling persons in connection with the securities being registered, we will, unless in the opinion of our legal counsel the matter has been settled by controlling precedent, submit the question of whether such indemnification is against public policy to a court of appropriate jurisdiction. We will then be governed by the court’s decision.
| 101 |
Consolidated Financial Statements
INDEX TO FINANCIAL STATEMENTS
TABLE OF CONTENTS
| Consolidated Financial Statements as of and for the years ended December 31, 2017 and 2016 | |
| Report of Independent Registered Public Accounting Firm | F-2 |
| Consolidated Balance Sheets | F-3 |
| Consolidated Statements of Operations | F-4 |
| Consolidated Statement of Changes in Stockholders’ Equity (Deficit) | F-5 |
| Consolidated Statements of Cash Flows | F-6 |
| Notes to Consolidated Financial Statements | F-7 – F-26 |
| Consolidated Financial Statements as of and for the periods ended March 31, 2018 and 2017 | |
| Condensed Consolidated Balance Sheets | F-27 |
| Condensed Consolidated Statements of Operations | F-28 |
| Condensed Consolidated Statement of Changes in Stockholders’ Deficit | F-29 |
| Condensed Consolidated Statements of Cash Flows | F-30 |
| Notes to Condensed Consolidated Financial Statements | F-31 – F-38 |
| F-1 |
REPORT OF INDEPENDENT REGISTERED PUBLIC ACCOUNTING FIRM
To the Shareholders and Board of Directors of
XG Sciences, Inc.
Opinion on the Consolidated Financial Statements
We have audited the accompanying consolidated balance sheets of XG Sciences, Inc. (the "Company") as of December 31, 2017 and 2016, and the related consolidated statements of operations, changes in stockholders' equity (deficit) and cash flows for the years then ended, and the related notes (collectively referred to as the consolidated financial statements). In our opinion, the consolidated financial statements present fairly, in all material respects, the financial position of the Company as of December 31, 2017 and 2016, and the results of their operations and cash flows for the years then ended in conformity with accounting principles generally accepted in the United States of America.
Basis for Opinion
These consolidated financial statements are the responsibility of the Company's management. Our responsibility is to express an opinion on the Company's consolidated financial statements based on our audits. We are a public accounting firm registered with the Public Company Accounting Oversight Board (United States) ("PCAOB") and are required to be independent with respect to the Company in accordance with the U.S. federal securities laws and the applicable rules and regulations of the Securities and Exchange Commission and the PCAOB.
We conducted our audits in accordance with the standards of the PCAOB. Those standards require that we plan and perform the audit to obtain reasonable assurance about whether the consolidated financial statements are free of material misstatement, whether due to error or fraud. The Company is not required to have, nor were we engaged to perform, an audit of its internal control over financial reporting. As part of our audits we are required to obtain an understanding of internal control over financial reporting but not for the purpose of expressing an opinion on the effectiveness of the Company's internal control over financial reporting. Accordingly, we express no such opinion.
Our audits included performing procedures to assess the risks of material misstatement of the consolidated financial statements, whether due to error or fraud, and performing procedures that respond to those risks. Such procedures included examining, on a test basis, evidence regarding the amounts and disclosures in the consolidated financial statements. Our audits also included evaluating the accounting principles used and significant estimates made by management, as well as evaluating the overall presentation of the consolidated financial statements. We believe that our audits provide a reasonable basis for our opinion.
Emphasis of a Matter
As discussed in Note 2 to the financial statements, the Company has changed its method of accounting for warrants in 2017 due to the adoption of Accounting Standards Update No. 2017-11, Earnings Per Share, Distinguishing Liabilities From Equity, Derivatives and Hedging.
We have served as the Company's auditor since 2012.
| /s/ Frazier & Deeter, LLC | |
| Frazier & Deeter, LLC | |
| Tampa, FL | |
| April 2, 2018 |
| F-2 |
CONSOLIDATED BALANCE SHEETS AS OF DECEMBER 31, 2017 AND 2016
| 2017 | 2016 | |||||||
| (Restated) | ||||||||
| ASSETS | ||||||||
| CURRENT ASSETS | ||||||||
| Cash | $ | 2,845,798 | $ | 1,785,343 | ||||
| Accounts receivable, less allowance for doubtful accounts of $40,000 in 2017 and $10,000 in 2016, respectively | 468,623 | 99,078 | ||||||
| Inventories | 171,864 | 205,973 | ||||||
| Incentive refunds receivable | - | 165,635 | ||||||
| Other current assets | 15,781 | 174,495 | ||||||
| Total current assets | 3,502,066 | 2,430,524 | ||||||
| PROPERTY, PLANT AND EQUIPMENT, NET | 2,601,571 | 2,886,421 | ||||||
| RESTRICTED CASH FOR LETTER OF CREDIT | 195,792 | 195,499 | ||||||
| LEASE DEPOSIT | 20,156 | - | ||||||
| INTANGIBLE ASSETS, NET | 571,938 | 478,019 | ||||||
| TOTAL ASSETS | $ | 6,891,523 | $ | 5,990,463 | ||||
| LIABILITIES AND STOCKHOLDERS’ EQUITY | ||||||||
| CURRENT LIABILITIES | ||||||||
| Accounts payable and other current liabilities | $ | 858,077 | $ | 964,757 | ||||
| Deferred revenue | 7,298 | 6,428 | ||||||
| Current portion of capital lease obligations | 118,553 | 268,667 | ||||||
| Total current liabilities | 983,928 | 1,239,852 | ||||||
| LONG-TERM LIABILITIES | ||||||||
| Long-term portion of capital lease obligations | 15,527 | 115,106 | ||||||
| Long term debt | 4,794,596 | 1,862,120 | ||||||
| Derivative liability – warrants | - | 249,807 | ||||||
| Total long-term liabilities | 4,810,123 | 2,227,033 | ||||||
| TOTAL LIABILITIES | 5,794,051 | 3,466,885 | ||||||
| STOCKHOLDERS’ EQUITY | ||||||||
| Series A convertible preferred stock, 3,000,000 shares authorized, 1,857,816 and 1,829,256 shares issued and outstanding, liquidation value of $22,293,792 and $21,951,072 at December 31, 2017 and December 31, 2016, respectively | 21,917,046 | 21,574,360 | ||||||
| Series B Preferred Stock, 1,500,000 shares authorized, 0 shares issued and outstanding, liquidation value of $0 at December 31, 2017 and December 31, 2016, respectively | - | - | ||||||
| Common stock, no par value, 25,000,000 shares authorized, 2,353,350 and 1,885,175 shares issued and outstanding at December 31, 2017 and December 31, 2016, respectively | 19,116,012 | 15,647,839 | ||||||
| Additional paid-in capital | 7,831,958 | 6,490,230 | ||||||
| Accumulated deficit | (47,767,544 | ) | (41,188,851 | ) | ||||
| Total stockholders’ equity | 1,097,472 | 2,523,578 | ||||||
| TOTAL LIABILITIES AND STOCKHOLDERS’ EQUITY | $ | 6,891,523 | $ | 5,990,463 | ||||
See notes to consolidated financial statements
| F-3 |
CONSOLIDATED STATEMENTS OF OPERATIONS
FOR THE YEARS ENDED DECEMBER 31, 2017 AND 2016
| 2017 | 2016 | |||||||
| (Restated) | ||||||||
| REVENUE | ||||||||
| Product sales | $ | 1,605,178 | $ | 356,730 | ||||
| Grants | 124,955 | 279,760 | ||||||
| Licensing revenue | 75,000 | 100,000 | ||||||
| Total revenues | 1, 805,133 | 736,490 | ||||||
| COST OF GOODS SOLD | ||||||||
| Direct costs | 911,115 | 172,394 | ||||||
| Unallocated manufacturing expenses | 1,741,661 | 1,414,268 | ||||||
| Total cost of goods sold | 2,652,776 | 1,586,662 | ||||||
| GROSS LOSS | (847,643 | ) | (850,172 | ) | ||||
| OPERATING EXPENSES | ||||||||
| Research and development | 923,419 | 1,124,165 | ||||||
| Sales, general and administrative | 4,434,322 | 3,548,605 | ||||||
| Total operating expenses | 5,357,741 | 4,672,770 | ||||||
| OPERATING LOSS | (6,205,384 | ) | (5,522,942 | ) | ||||
| OTHER INCOME (EXPENSE) | ||||||||
| Interest expense, net | (254,091 | ) | (298,208 | ) | ||||
| Gain (loss) from change in fair value of derivative liability – warrants | (46,612 | ) | 61,911 | |||||
| Government incentives, net | (72,606 | ) | 79,635 | |||||
| Loss on disposal of equipment and intangible assets | - | (70,143 | ) | |||||
| Total other income (expense) | (373,309 | ) | (226,805 | ) | ||||
| NET LOSS | $ | (6,578,693 | ) | $ | (5,749,747 | ) | ||
| WEIGHTED AVERAGE NUMBER OF SHARES OUTSTANDING – Basic and diluted | 2,077,870 | 1,112,647 | ||||||
| NET LOSS PER SHARE – Basic and diluted | $ | (3.17 | ) | $ | (5.17 | ) | ||
See notes to consolidated financial statements
| F-4 |
CONSOLIDATED STATEMENT OF CHANGES IN STOCKHOLDERS’ EQUITY (DEFICIT)
FOR THE YEARS ENDED DECEMBER 31, 2017 AND 2016
| Preferred stock (A) | Preferred stock (B) | Common stock | Additional paid-in | Accumulated | ||||||||||||||||||||||||||||||||
| Shares | Amount | Shares | Amount | Shares | Amount | capital | deficit | Total | ||||||||||||||||||||||||||||
| Balances, December 31, 2015 | 1,800,696 | $ | 21,291,912 | 269,987 | $ | 3,651,533 | 836,544 | $ | 8,565,225 | $ | 5,791,074 | $ | (43,371,368 | ) | $ | (4,071,624 | ) | |||||||||||||||||||
| Stock issued for cash | — | — | — | — | 508,657 | 4,069,255 | — | — | 4,069,255 | |||||||||||||||||||||||||||
| Stock issuance fees and expenses | — | — | — | — | — | (638,174 | ) | — | — | (638,174 | ) | |||||||||||||||||||||||||
| Series B stock exchanged for common stock | — | — | (269,987 | ) | (3,651,533 | ) | 539,974 | 3,651,533 | — | — | — | |||||||||||||||||||||||||
| Reclassification of Derivative Liability to Equity | — | — | — | — | — | — | 51,418 | — | 51,418 | |||||||||||||||||||||||||||
| Warrants issued with Bridge Financings | — | — | — | — | — | — | 24,060 | — | 24,060 | |||||||||||||||||||||||||||
| Warrants issued with Dow Financing | — | — | — | — | — | — | 143,146 | — | 143,146 | |||||||||||||||||||||||||||
| Preferred stock issued to pay capital lease obligations | 28,560 | 342,685 | — | — | — | — | — | — | 342,685 | |||||||||||||||||||||||||||
| Stock-based compensation | — | — | — | — | — | — | 480,532 | — | 480,532 | |||||||||||||||||||||||||||
| Net loss | — | — | — | — | — | — | — | (5,528,162 | ) | (5,528,162 | ) | |||||||||||||||||||||||||
| Balances, December 31, 2016 | 1,829,256 | 21,634,597 | — | — | 1,885,175 | $ | 15,647,839 | 6,490,230 | (48,899,530 | ) | (5,126,864 | ) | ||||||||||||||||||||||||
| Reclassification of Derivative Liability balance at December 31, 2016 to Equity, see note 2 | — | (60,237 | ) | — | — | — | — | — | 7,710,679 | 7,650,442 | ||||||||||||||||||||||||||
| Balances, December 31, 2016, (Restated) – see note 2 | 1,829,256 | 21,574,360 | — | — | 1,885,175 | 15,647,839 | 6,490,230 | (41,188,851 | ) | 2,523,578 | ||||||||||||||||||||||||||
| Stock issued for cash | — | — | — | — | 458,175 | 3,665,400 | — | — | 3,665,400 | |||||||||||||||||||||||||||
| Stock issuance fees and expenses | — | — | — | — | — | (237,227 | ) | — | — | (237,227 | ) | |||||||||||||||||||||||||
| Reclassification of Derivative Liability to Equity – see note 2 | — | — | — | — | — | — | 296,419 | — | 296,419 | |||||||||||||||||||||||||||
| Warrants issued with Dow Financing | — | — | — | — | — | — | 229,225 | — | 229,225 | |||||||||||||||||||||||||||
| Preferred stock issued to pay capital lease obligations | 28,560 | 342,686 | — | — | — | — | — | — | 342,686 | |||||||||||||||||||||||||||
| Stock-based compensation | — | — | — | — | 10,000 | 40,000 | 816,084 | — | 856,084 | |||||||||||||||||||||||||||
| Net loss | — | — | — | — | — | — | — | (6,578,693 | ) | (6,578,693 | ) | |||||||||||||||||||||||||
| Balances, December 31, 2017 | 1,857,816 | $ | 21,917,046 | — | $ | — | 2,353,350 | $ | 19,116,012 | $ | 7,831,958 | $ | (47,767,544 | ) | $ | 1,097,472 | ||||||||||||||||||||
See notes to consolidated financial statements
| F-5 |
CONSOLIDATED STATEMENTS OF CASH FLOWS
FOR THE YEARS ENDED DECEMBER 31, 2017 AND 2016
| 2017 | 2016 | |||||||
| (Restated) | ||||||||
| CASH FLOWS FROM OPERATING ACTIVITIES | ||||||||
| Net loss | $ | (6,578,693 | ) | $ | (5,749,747 | ) | ||
| Adjustments to reconcile net loss to net cash used in operating activities: | ||||||||
| Depreciation | 887,089 | 908,896 | ||||||
| Amortization of intangible assets | 47,038 | 38,336 | ||||||
| Loss on disposal of equipment and intangible assets | — | 70,143 | ||||||
| Provision for bad debts | 30,000 | — | ||||||
| Stock-based compensation expense | 856,084 | 480,532 | ||||||
| Non-cash interest expense | 255,221 | 250,471 | ||||||
| Loss (gain) from change in fair value of derivative liability – warrants | 46,612 | (61,911 | ) | |||||
| (Increase) Decrease in: | ||||||||
| Accounts receivable | (399,545 | ) | (44,665 | ) | ||||
| Inventories | 34,109 | 23,061 | ||||||
| Incentive refund receivable | 165,635 | (79,635 | ) | |||||
| Other current assets | 158,714 | (66,402 | ) | |||||
| Other assets | (20,450 | ) | (293 | ) | ||||
| Increase (Decrease) in: | ||||||||
| Accounts payable and other liabilities | (180,853 | ) | 303,112 | |||||
| Accrued compensation | 74,173 | (42,532 | ) | |||||
| Deferred revenue | 870 | 6,428 | ||||||
| NET CASH USED IN OPERATING ACTIVITIES | (4,623,996 | ) | (3,964,206 | ) | ||||
| CASH FLOWS FROM INVESTING ACTIVITIES | ||||||||
| Purchases of property and equipment | (602,239 | ) | (93,002 | ) | ||||
| Purchases of intangible assets | (140,957 | ) | (123,775 | ) | ||||
| NET CASH USED IN INVESTING ACTIVITIES | (743,196 | ) | (216,777 | ) | ||||
| CASH FLOWS FROM FINANCING ACTIVITIES | ||||||||
| Advances (repayments) on short-term notes, net | — | (550,000 | ) | |||||
| Advances (repayments) of capital lease obligations | (526 | ) | 25,021 | |||||
| Proceeds from long-term loan | 3,000,000 | 2,000,000 | ||||||
| Proceeds from issuance of common stock | 3,665,400 | 4,069,255 | ||||||
| Common stock issuance fees and expenses | (237,227 | ) | (638,174 | ) | ||||
| NET CASH PROVIDED BY FINANCING ACTIVITIES | 6,427,647 | 4,906,102 | ||||||
| NET INCREASE IN CASH | 1,060,455 | 725,119 | ||||||
| CASH AT BEGINNING OF PERIOD | 1,785,343 | 1,060,224 | ||||||
| CASH AT END OF PERIOD | $ | 2,845,798 | $ | 1,785,343 | ||||
| SUPPLEMENTAL DISCLOSURE OF CASH FLOW INFORMATION: | ||||||||
| Cash paid for interest | $ | — | $ | 48,360 | ||||
| Value of preferred stock issued for AAOF capital lease obligations | $ | 342,686 | $ | 342,686 | ||||
| Property and equipment additions under capital leases | $ | 18,975 | $ | 38,998 | ||||
| Reclassification of derivative liability warrants to equity | $ | 296,419 | $ | 7,650,442 | ||||
| Warrants issued with bridge financings | $ | — | $ | 24,060 | ||||
| Warrants issued with Dow financing | $ | 229,225 | $ | 143,146 | ||||
| Conversion of Series B stock to common stock | $ | — | $ | 3,651,533 | ||||
See notes to consolidated financial statements
| F-6 |
XG SCIENCES, INC.
NOTES TO CONSOLIDATED FINANCIAL STATEMENTS
DECEMBER 31, 2017 AND 2016
NOTE 1 — NATURE OF BUSINESS AND BASIS OF PRESENTATION
XG Sciences, Inc., a Michigan company located in Lansing, Michigan and its subsidiary, XG Sciences IP, LLC (collectively referred to as “we”, “us”, “our”, or the “Company”) manufactures graphene nanoplatelets, using two proprietary manufacturing processes to split natural flakes of crystalline graphite into very small and thin particles, which we sell as xGnP® graphene nanoplatelets. We sell our nanoparticles in the form of bulk powders or dispersions to other companies for use as additives to make composite and other materials with specially engineered characteristics. We also manufacture and sell integrated, value-added products containing these graphene nanoplatelets such as greases, composites, thin sheets, inks and coating formulations that we sell to other companies. Additionally, we license our technology to other companies in exchange for royalties and other fees.
Basis of Presentation
The accompanying consolidated financial statements have been prepared in accordance with accounting principles generally accepted in the United States of America (“US GAAP”). All normal adjustments considered necessary for a fair presentation have been included.
The consolidated financial statements include the accounts of XG Sciences, Inc. and our wholly-owned subsidiary, XGS IP, LLC. We operate as one reportable segment. All intercompany accounts, transactions and profits have been eliminated in consolidation.
Liquidity
We have historically incurred losses from operations and we may continue to generate negative cash flows as we implement our business plan. Our consolidated financial statements are prepared using US GAAP as applicable to a going concern, which contemplates the realization of assets and liquidation of liabilities in the normal course of business.
In December 2016, we entered into a draw loan note and agreement (the “Dow Facility”) with The Dow Chemical Company (“Dow”) to provide up to $10 million of secured debt financing at an interest rate of 5% per year, drawable at our request under certain conditions. We received $2 million at closing, $1 million on each of July 18, 2017, September 22, 2017, and December 4, 2017. We currently have an additional $5 million that becomes available under the Dow Facility once we have raised $10 million of equity capital after October 31, 2016.
As of December 31, 2017, we had cash on hand of $2,845,798 and at March 30, 2018 cash on hand of $2,285,182. We believe our cash is sufficient to fund our operations through March 2019 when taking into account various sources of funding and cash received from continued commercial sales transactions. We intend that the primary means for raising funds will be through our Offering of common stock and the additional $5 million of proceeds from the Dow Facility available to us after we have raised $10 million of equity capital as measured in the period beginning on November 1, 2016, however we can make no assurances that we will raise $10 million of equity capital and access the additional $5 million under the Dow Facility. At March 30, 2018 we have raised $6,149,024 towards this $10,000,000 requirement. Taking into account the cash position at March 30, noted above, an additional $3.85 million in proceeds from the Offering, which would allow us to draw up to $5 million from the Dow Facility, we believe that we can fund our operations including planned capital expenditures through March 31, 2019. In addition, two of our shareholders have committed to provide up to $4.5 million in funding for the twelve-month period ended March 31, 2019 to the extent the Company has been unable to raise such funds from other third parties.
There can be no assurance that we will be able to raise additional equity capital in the Offering or in subsequent equity offerings or that the terms and conditions of any future financings will be workable or acceptable to us and our stockholders. In the event we are unable to fund our operations from existing cash on hand, operating cash flows, additional borrowings or raising equity capital, we may be forced to reduce our expenses, slow down our growth rate, or discontinue operations. Our consolidated financial statements do not include any adjustments relating to the recoverability and classification of recorded asset amounts or the amounts and classification of liabilities that might be necessary should we be unable to continue as a going concern.
NOTE 2 — SUMMARY OF SIGNIFICANT ACCOUNTING POLICIES
Use of Estimates
US GAAP requires management to make estimates, judgments and assumptions that affect the reported amounts of assets, liabilities, revenues and expenses, together with amounts disclosed in the related notes to the consolidated financial statements. Actual results and outcomes may differ from management’s estimates, judgments and assumptions. Significant estimates, judgments and assumptions used in these consolidated financial statements include, but are not limited to, those related to revenues, accounts receivable and related allowances, contingencies, useful lives and recovery of long-term assets, income taxes, and the fair values of stock-based compensation, warrants, and derivative financial instrument liabilities. These estimates, judgments, and assumptions are reviewed periodically and the effects of material revisions in estimates are reflected in the financial statements prospectively from the date of the change in estimate.
| F-7 |
Revenue Recognition
We recognize revenues when (a) the price is fixed or determinable, (b) persuasive evidence of a sales arrangement exists, (c) the service is performed, or delivery has occurred and (d) collectability of the resulting receivable is reasonably assured.
We recognize product revenues when products are shipped to customers. At that time, product ownership and risk have transferred to the customer and we have no further obligations. We record product sales at net selling prices that are reflective of discounts and allowances. Shipping and handling costs are recorded as a component of direct costs, as are shipping and handling costs billed to customers.
Revenue related to licensing agreements is recorded upon substantial performance of the terms of the licensing contract. In the case of licensing arrangements that involve up-front payments, revenue is recorded when management determines that the appropriate terms of the contract have been fulfilled. For example, this may occur when technology has been transferred via written documents or, if training is involved, whenever all contracted training has occurred. In the case of licenses where product delivery is also embedded in the deliverable, a portion of revenue would be recognized when products are delivered.
In the case of licensing arrangements that involve ongoing royalties based on sales of products produced with our technology, royalty income is recorded when received or, in the case of minimum royalties due, in the period when due.
Grant contract revenue is recognized over the life of the contracts as the services are performed.
Amounts received in excess of revenues earned are recorded as deferred revenue.
Cost of Products Sold
We use a standard cost system to estimate the direct costs of products sold. Direct costs include estimates of raw material costs, packaging, freight charges net of those billed to customers, and an allocation for direct labor and manufacturing overhead. Because of the nature of our production processes, there is a substantial fixed manufacturing expense requirement that represents the ongoing cost of maintaining production facilities that are not directly related to products sold, so we use a “full capacity” allocation of overhead based on an estimate of what product costs would be if the manufacturing facilities were operating on a full-time basis and producing products at the designed capacity.
The remaining costs of operating the Company’s manufacturing facilities are recorded as Unallocated Manufacturing Expenses. Manufacturing expense includes the costs of operating our manufacturing facilities including personnel costs, rent, utilities, indirect supplies, depreciation, and related indirect expenses. Manufacturing expenses are expensed as incurred.
Research and Development
Research and development expenses include the compensation costs of research personnel, laboratory rent and utilities, depreciation of laboratory equipment, travel and laboratory supplies and are expensed as incurred.
General and Administrative Expense
General and administrative expenses include the compensation costs of personnel, rent, utilities, supplies, travel, depreciation of office equipment, and related expenses not included in other expense categories. General and administrative expenses also include non-cash compensation expenses related to the Company’s deferred compensation, management incentive bonus, and employee stock option programs.
Sales and Marketing Expense
Sales and marketing costs include compensation, travel, and business development expenses including free samples provided to customers. These costs are expensed as incurred. Product marketing allowances are recorded at the estimated out of pocket cost necessary to produce the product in the period the allowance is granted. Advertising costs are expensed at the time they are incurred and were not material for the years ended December 31, 2017 and 2016.
| F-8 |
Income Taxes
It is our policy to provide for uncertain tax positions and the related interest and penalties based upon management’s assessment of whether a tax benefit is more likely than not to be sustained upon examination by tax authorities. To the extent that the probable tax outcome of these uncertain tax position changes, such changes in estimate will impact the income tax provision in the period in which such determination is made. At December 31, 2017, we believe we have appropriately accounted for any unrecognized tax benefits. We are not aware of any uncertain tax positions. To the extent we prevail in matters for which a liability for an unrecognized tax benefit is established or we are required to pay amounts in excess of the liability, our effective tax rate in a given financial statement period may be affected.
We account for income taxes using an asset and liability approach. The difference between the financial statement and tax basis of assets and liabilities is determined annually. Deferred income tax assets and liabilities are computed for those differences that have future tax consequences using the currently enacted tax laws and rates that apply to the periods in which they are expected to affect taxable income. Income tax expense is the current tax payable or refundable for the period plus or minus the net change in the deferred tax assets and liabilities. The deferred tax effects of state and local income taxes are considered immaterial and have not been recorded. Valuation allowances are established, if necessary, to reduce deferred tax assets to the amount that is estimated to be realized. Because of the uncertainty related to future realization of deferred tax assets (see Note 14), we have established a valuation allowance equal to one hundred percent of the deferred tax assets.
The Tax Cuts and Jobs Act (the Tax Act) was signed into law on December 22, 2017. The Tax Act changed many aspects of U.S. corporate income taxation and included reduction of the corporate income tax rate from 35% to 21%. The Company will continue to assess its provision for income taxes as future guidance is issued but does not currently anticipate significant revisions will be necessary. Any such revisions will be treated in accordance with the measurement period guidance outlined in Staff Accounting Bulletin No. 118.
Net Income (Loss) Per Common Share
We compute net income or (loss) per share in accordance with Financial Accounting Standards Board (“FASB”) Accountings Standards Codification (“ASC”) Topic 260: Earnings Per Share. Under the provisions of ASC 260, basic net income (loss) per share is computed by dividing the net income (loss) available to common stockholders by the weighted average number of common shares outstanding during the period. Diluted net loss per share is computed using the weighted average number of shares outstanding during the applicable period, plus the effect of potentially dilutive securities. Potentially dilutive securities consist of shares potentially issuable pursuant to stock options and warrants as well as shares that would result from full conversion of all outstanding convertible securities. These potentially dilutive securities were 3,081,487 and 2,699,112 as of December 31, 2017 and 2016 and are excluded from diluted net loss per share calculations because they are anti-dilutive. As a result, for the years ended December 31, 2017 and 2016, basic and diluted net loss per share was the same.
Accounts Receivable and Allowance for Doubtful Accounts
Accounts receivable are stated at the amount management expects to collect from outstanding balances. Management provides for probable uncollectible amounts through a provision for bad debt expense and an adjustment to a valuation allowance based on their assessment of the current status of individual accounts. Balances that are still outstanding after management has used reasonable collection efforts are written off through a charge to the allowance account and a credit to accounts receivable.
Statements of Cash Flows
For the purposes of the statements of cash flows, we consider all highly liquid investments purchased with an original maturity of three months or less to be cash equivalents.
Fair Value of Financial Instruments and Concentrations of Credit Risk
Financial instruments, which potentially subject the Company to concentrations of credit risk, consist principally of cash and accounts receivable. The Company places its cash with FDIC insured financial institutions. Although such balances may exceed the federally insured limits at certain times, in the opinion of management they are subject to minimal risk.
The Company has established policies for extending credit to customers based upon factors including the customers’ credit worthiness, historical trends and other information. Nonetheless the collectability of accounts receivable is affected by regional economic conditions and other factors.
| F-9 |
Inventory
Inventory consists of raw materials, work-in-process and finished goods, all of which are stated at the lower of cost or market. Cost is determined on a first in, first out basis.
Property and Equipment
Property and equipment are recorded at cost, net of accumulated depreciation and amortization. Property and equipment generally includes purchases of items with a cost greater than $3,000 and a useful life greater than one year. Depreciation and amortization are computed on the straight-line basis over the estimated useful lives of the assets. Leasehold improvements are amortized over the shorter of the related lease terms or their estimated useful lives.
We periodically review the estimated useful lives of property and equipment. Changes to the estimated useful lives are recorded prospectively from the date of the change. Upon retirement or sale, the cost of the assets disposed of and the related accumulated depreciation are removed from the accounts and any resulting gain or loss is included in the statement of operations. Repairs and maintenance costs are expensed as incurred.
Recoverability and Impairment of Long-Lived Assets
Land, buildings and equipment and certain other assets, including definite-lived intangible assets, are reviewed for impairment whenever events or changes in circumstances indicate that the carrying amount of an asset may not be recoverable. The judgments we make related to the expected useful lives of long-lived assets, definitions of lease terms and our ability to realize undiscounted cash flows in excess of the carrying amounts of these assets are affected by factors such as the ongoing maintenance and improvements of the assets, changes in economic conditions, changes in usage or operating performance, and other factors, such as our ability to sell our assets held for sale. As we assess the ongoing expected cash flows and carrying amounts of our long-lived assets, significant adverse changes in these factors could cause us to realize an impairment loss. Based on a review of operating results, we believe the carrying values of our long-lived assets are recoverable at December 31, 2017 and 2016.
Intangible Assets
We have entered into a license agreement with Michigan State University under which we have licensed certain intellectual property in the form of patents and patent applications and invention disclosures. We are responsible for managing the patent process and ongoing filings for this licensed intellectual property and for bearing the cost thereof. We capitalize all costs related to the acquisition and ongoing administration of this license agreement and we amortize these costs over 15 years or the remaining life of the license agreement, whichever is shorter.
In addition to the costs of managing in-licensed intellectual property, we also file for patent protection for inventions and other intellectual property generated by our employees. All patents are evaluated for filing in international markets on a case-by-case basis and are filed in the United States and in selected international markets as considered appropriate. All external legal and filing costs related to patent applications, patent filings, ongoing registrations, overseas filings, and legal opinions related thereto are capitalized as intangible assets at cost and amortized over a period of 15 years from the date incurred, or the remaining useful life of the associated patent, whichever is shorter.
The cost of royalties or minimum payments specified under the license agreement for in-licensed technology is expensed as incurred.
We have also out-licensed certain of our intellectual property to licensees under terms and conditions of license agreements that specify the intellectual property licensed, the territory, and the type of license. In exchange for these licenses, we have recorded revenues associated with the initial granting of the license and expect to receive royalties based on sales of products produced under these licenses. License revenues are recorded to reflect our performance of requirements under these license agreements. In addition, we record royalty revenues from licensees at the time they are earned.
Incentive Refund
As of December 31, 2017, and 2016, we had $0 and $165,635 of incentive refunds due from the Michigan Economic Growth Authority under a five-year agreement signed on January 19, 2011. These incentive payments are awarded annually based on a pre-determined formula relating to the number of jobs created, average compensation, and total payroll and benefits for jobs created by XG Sciences in Michigan. These refunds are paid in cash during the year following the refund period. There is no requirement to have taxable income to receive these incentive payments. The five-year agreement expired December 31, 2016.
| F-10 |
Stock-Based Compensation
We recognize compensation expense in our statement of operations for all share-based option and stock awards, based on estimated grant-date fair values.
We estimate the grant-date fair value of stock-based compensation awards using the Black-Scholes option valuation model. This model is affected by the estimated value of our common stock on the date of the grant as well as assumptions regarding a number of highly complex and subjective variables. These variables include the expected term of the option, the exercise price, expected risk-free rates of return, the expected volatility of our common stock, and expected dividend yield, each of which is more fully described below. The assumptions for the estimated value of our common stock, expected term and expected volatility are the assumptions that most significantly affect the grant date fair value.
Expected Term: Because we have limited experience related to the exercise of employee stock options, we use the simplified method permitted by SEC Staff Accounting Bulletin Topic 14 to estimate the expected term of the options. The expected term of an option is estimated to be equal to the mid-point between the vesting and expiration dates of the option.
Risk-free Interest Rate: We base the risk-free interest rate used on the implied yield at the grant date of U.S. Treasury zero-coupon issues with a term approximately equal to the expected term of the stock-based award being valued.
Expected Stock Price Volatility: Because we are a company with very limited stock sales history (we have an Offering whereby we are selling stock directly to investors without the assistance of an investment bank nor are we registered on any market or public exchange), we use a blended average weekly volatility of certain publicly traded peer companies. We believe that the use of this blended average peer volatility is reflective of market conditions and a reasonable indicator of our expected future volatility.
Dividend Yield: Because we have never paid a dividend and do not expect to begin doing so in the foreseeable future, we have assumed a 0% dividend yield in valuing our stock-based awards.
The grant-date fair value of the award is recognized as expense over the requisite service period using the straight-line method.
Fair Value Measurements
FASB ASC 820: “Fair Value Measurements and Disclosures” defines fair value as the exchange price that would be received for an asset or paid to transfer a liability (an exit price) in the principal or most advantageous market for the asset or liability in an orderly transaction between market participants on the measurement date. ASC 820 also establishes a fair value hierarchy which requires an entity to maximize the use of observable inputs and minimize the use of unobservable inputs when measuring fair value. The standard describes three levels of inputs that may be used to measure fair value:
Level 1: Quoted prices in active markets for identical assets or liabilities.
Level 2: Inputs other than quoted prices included within Level 1 which are either directly or indirectly observable.
Level 3: Inputs to the valuation methodology are unobservable and significant to the fair value measurement.
A financial instrument’s level within the fair value hierarchy is based on the lowest level of any input that is significant to the fair value measurement. Our derivative liabilities are classified as Level 3 within the fair value hierarchy because they were valued using other unobservable inputs. The valuation technique used to measure fair value of the derivative liabilities is based on a lattice model with significant assumptions and inputs determined by the Company. A lattice model was used to estimate the fair value of the derivative liabilities because management believes it reflects all of the assumptions that market participants would likely consider including early exercise of the warrants. The fair value of the derivative liabilities will be significantly influenced by the fair value of our common stock, stock price volatility and the risk-free interest components of the lattice technique.
Derivative Financial Instruments
We do not use derivative instruments to hedge exposures to cash flow, market or foreign currency risk. The terms of convertible preferred stock and convertible notes that we issue are reviewed to determine whether or not they contain embedded derivative instruments that are required by ASC 815: “Derivatives and Hedging” to be accounted for separately from the host contract and recorded at fair value. In addition, freestanding warrants are also reviewed to determine if they achieve equity classification. Certain stock warrants that we have issued did not meet the conditions for equity classification and are classified as derivative instrument liabilities measured at fair value. The fair values of these derivative liabilities are revalued at each reporting date, with the change in fair value recognized in earnings. See Note 9 for additional information.
| F-11 |
In July 2017, the FASB issued Accounting Standards Update No. 2017-11, Earnings Per Share (Topic 260), Distinguishing Liabilities From Equity (Topic 480), Derivatives and Hedging (Topic 815) (“ASU 2017-11”). This update changes the classification analysis of certain equity-linked financial instruments with down-round features. When determining whether certain financial instruments should be classified as liabilities or equity instrument, securities with anti-dilution features no longer preclude equity classification when assessing whether the instrument is indexed to an entity’s own stock. As a result, freestanding equity-linked financial instruments (or embedded conversion features) would no longer be accounted for as derivative liabilities at fair value because of the existence of an anti-dilution feature. For freestanding equity classified financial instruments, ASU 2017-11 requires entities that present earnings per share in accordance with ASC Topic 260 to recognize the effect of the anti-dilution feature when it is triggered. That effect is treated as a dividend and as a reduction of income available to common shareholders in basic EPS. The guidance in this Update is effective for fiscal years, and interim period within those fiscal years, beginning after December 15, 2018, with earlier adoption permitted. When adopted in an interim period, any adjustments are reflected as of the beginning of the fiscal year that includes that interim period. We elected to early adopt ASU 2017-11 at September 30, 2017 by applying the standard retrospectively to outstanding financial instruments with a down round feature by means of a cumulative-effect adjustment to the Company’s beginning accumulated deficit as of January 1, 2017 (see Note 9). There were 972,720, warrants indexed to Series A Preferred Stock which were originally recorded as derivative liabilities because of their anti-dilution features. We chose to early adopt ASU 2017-11 because it permitted these warrants to be recorded as equity rather than derivative liabilities. If ASU 2017-11 had been effective in 2016, it would have resulted in a decrease in the derivative liability and a corresponding decrease in the accumulated deficit of $7,650,443 as of December 31, 2016. The impact to the financial statements for the year ended December 31, 2016 is as follows:
| Year ended December 31, 2016 | ||||||||
| As previously | As | |||||||
| reported | Adjusted | |||||||
| Operating loss | $ | (5,522,942 | ) | $ | (5,522,942 | ) | ||
| Other income (expense): | ||||||||
| Incentive refund and interest income | 80,259 | 79,635 | ||||||
| Interest expense, net | (298,832 | ) | (298,208 | ) | ||||
| Gain from change in fair value of derivative warrants | 283,496 | 61,911 | ||||||
| Loss on disposal of equipment and intangible assets | (70,143 | ) | (70,143 | ) | ||||
| Total other income (expense) | (5,220 | ) | (226,805 | ) | ||||
| Net loss | $ | (5,528,162 | ) | $ | (5,749,747 | ) | ||
| The impact to the balance sheet as of December 31, 2016 is as follows: | ||||||||
| As previously | As | |||||||
| reported | Adjusted | |||||||
| Derivative liability-warrants | $ | 7,900,249 | $ | 249,807 | ||||
| Total long-term liabilities | $ | 9,877,475 | $ | 2,227,033 | ||||
| Total liabilities | $ | 11,117,327 | $ | 3,466,885 | ||||
| Series A convertible preferred stock | $ | 21,634,597 | $ | 21,574,360 | ||||
| Accumulated deficit | $ | (48,899,530 | ) | $ | (41,188,851 | ) | ||
| Total liabilities and stockholder’s deficit | $ | 5,990,463 | $ | 5,990,463 | ||||
Fair Value Measurements
The liabilities measured at fair value on a recurring basis using significant unobservable inputs during the year ended December 31, 2017 is as follows:
| 2017 | 2016 | |||||||
| Balance at January 1 | $ | 249,807 | $ | 8,235,163 | ||||
| (Gain) Loss recognized in earnings | 46,612 | (283,496 | ) | |||||
| Reclass to equity-Waiver of Exchange Rights | - | (51,418 | ) | |||||
| Reclass to equity-Adoption of ASU 2017-11 | - | (7,650,442 | ) | |||||
| Reclass to equity-Series B Amendment | (296,419 | ) | - | |||||
| Balance at December 1 | $ | - | $ | 249,807 | ||||
| F-12 |
As mentioned in further detail in Notes 8 and 9, the warrants issued in connection with the Series B Units were classified as liabilities until September 30, 2017 when they were reclassified to equity after it was determined they no longer required liability classification.
Recent Accounting Pronouncements
In May 2014, the FASB issued ASU No. 2014-09 (ASC 606), Revenue from Contracts with Customers, which requires an entity to recognize the amount of revenue to which it expects to be entitled for the transfer of promised goods or services to customers. ASU No. 2014-09 will replace most existing revenue recognition guidance in U.S. GAAP when it becomes effective. The new standard is effective for us on January 1, 2018. Early adoption is not permitted. The standard permits the use of either the retrospective or cumulative effect transition method. We performed an analysis and concluded that the amendment will not have a material impact on our financial condition or results of operations.
ASC 606 will become effective for us beginning with the first quarter of 2018, and we plan to adopt the new accounting standard using the modified retrospective transition approach. The modified retrospective transition approach will recognize any changes from the beginning of the year of initial application through retained earnings with no restatement of comparative periods. We will record revenue under ASC 606 at a single point in time, when control is transferred to the customer, which is consistent with past practice. We will continue to apply our current business processes, policies, systems and controls to support recognition and disclosure under the new standard. Based on the results of the evaluation, nothing has come to our attention that would indicate that adoption of the new standard will have a material impact on our consolidated financial statements. Application of the transition requirements of the new standard will not have a material impact on opening retained earnings.
In April 2015, the FASB issued ASU No. 2015-03,Simplifying the Presentation of Debt Issuance Costs, or ASU 2015-03. ASU 2015-03 requires debt issuance costs to be presented in the balance sheet as a direct deduction from the carrying value of the associated debt liability, consistent with the presentation of a debt discount. The standard also aligns the GAAP presentation with International Financial Reporting Standards and will remedy the long-standing conflict with the guidance in FASB Concepts Statement No. 6, Elements of Financial Statements, which indicates that debt issuance costs do not meet the definition of an asset, because they provide no future economic benefit. ASU No. 2015-03 is effective for financial statements issued for fiscal years beginning after December 15, 2015, and interim periods within those fiscal years. Early adoption is permitted for financial statements that have not been previously issued. The new guidance will be applied on a retrospective basis. The adoption of this guidance during the year ended December 31, 2016 did not have a material impact on our consolidated statements of financial position, results of operations, or cash flows.
On February 24, 2016, the FASB issued ASU No. 2016-02, Leases, requiring lessees to recognize a right-of-use asset and a lease liability on the balance sheet for all leases with the exception of short-term leases. For lessees, leases will continue to be classified as either operating or finance leases in the income statement. Lessor accounting is similar to the current model but updated to align with certain changes to the lessee model. Lessors will continue to classify leases as operating, direct financing or sales-type leases. The effective date of the new standard for public companies is for fiscal years beginning after December 15, 2018 and interim periods within those fiscal years. Early adoption is permitted. The new standard must be adopted using a modified retrospective transition and requires application of the new guidance at the beginning of the earliest comparative period presented. We are currently evaluating the effect that the updated standard will have on our consolidated financial statements and related disclosures.
On March 30, 2016, the FASB issued ASU No. 2016-09, Improvements to Employee Share-Based Payment Accounting, which simplifies various aspects related to the accounting and presentation of share-based payments. The amendments require entities to record all tax effects related to share-based payments at settlement or expiration through the income statement and the windfall tax benefit to be recorded when it arises, subject to normal valuation allowance considerations. All tax-related cash flows resulting from share-based payments are required to be reported as operating activities in the statement of cash flows. The updates relating to the income tax effects of the share-based payments including the cash flow presentation must be adopted either prospectively or retrospectively. Further, the amendments allow the entities to make an accounting policy election to either estimate forfeitures or recognize forfeitures as they occur. If an election is made, the change to recognize forfeitures as they occur must be adopted using a modified retrospective approach with a cumulative effect adjustment recorded to opening retained earnings. The effective date of the new standard for public companies is for fiscal years beginning after December 15, 2016 and interim periods within those fiscal years. Early adoption is permitted. The adoption of this standard during December 31, 2017 did not have a material effect on our consolidated statements of financial position, results of operations, or cash flows.
In July 2015, the FASB issued ASU No. 2015-11, (“ASU 2015-11”), Inventory (Topic 330): Simplifying the Measurement of Inventory. ASU 2015-11 requires an entity to measure in scope inventory at the lower of cost and net realizable value. The amendment does not apply to inventory that is measured using last-in, first-out or the retail inventory method. For public entities, ASU 2015-11 is effective for fiscal years beginning after December 15, 2016, and interim periods within those fiscal years, and is to be applied prospectively. The adoption of this standard during the year ended December 31, 2017 did not have a material effect on our consolidated statements of financial position, results of operations, or cash flows.
| F-13 |
In August 2016, the FASB issued ASU 2016-15, Statement of Cash Flows (Topic 230). This update provides clarification regarding how certain cash receipts and cash payments are presented and classified in the statement of cash flows. This update addresses eight specific cash flow issues with the objective of reducing the existing diversity in practice. This update is effective for annual and interim periods beginning after December 15, 2017, which will require us to adopt these provisions in the first quarter of fiscal 2018 using a retrospective approach. Early adoption is permitted. We do not expect the adoption of this guidance to have a material impact on our consolidated financial statements.
In July 2017, the FASB issued Accounting Standards Update No. 2017-11,Earnings Per Share (Topic 260), Distinguishing Liabilities From Equity (Topic 480), Derivatives and Hedging (Topic 815) (“ASU 2017-11”). This update changes the classification analysis of certain equity-linked financial instruments with down-round features. When determining whether certain financial instruments should be classified as liabilities or equity instrument, securities with anti-dilution features no longer preclude equity classification when assessing whether the instrument is indexed to an entity’s own stock. As a result, freestanding equity-linked financial instruments (or embedded conversion features) would no longer be accounted for as derivative liabilities at fair value because of the existence of an anti-dilution feature. For freestanding equity classified financial instruments, ASU 2017-11 requires entities that present earnings per share in accordance with ASC Topic 260 to recognize the effect of the anti-dilution feature when it is triggered. That effect is treated as a dividend and as a reduction of income available to common shareholders in basic EPS. The guidance in this Update is effective for fiscal years, and interim period within those fiscal years, beginning after December 15, 2018, with earlier adoption permitted. When adopted in an interim period, any adjustments are reflected as of the beginning of the fiscal year that includes that interim period. We elected to early adopt ASU 2017-11 during September 30, 2017 by applying the standard retrospectively to outstanding financial instruments with a down round feature by means of a cumulative-effect adjustment to the Company’s beginning accumulated deficit as of January 1, 2017 (see Note 9 to the Financial Statements). There were 972,720, warrants indexed to Series A Convertible Preferred Stock which were originally recorded as derivative liabilities because of their anti-dilution features. We chose to early adopt ASU 2017-11 because it permitted these warrants to be recorded as equity rather than derivative liabilities.
With the exception of the standards discussed above, we believe there have been no new accounting pronouncements effective or not yet effective that have significance, or potential significance, to our Consolidated Financial Statements.
JOBS Act
In April 2012, the Jumpstart Our Business Startups Act of 2012, or the JOBS Act, was enacted. Section 107 of the JOBS Act provides that an “emerging growth company,” or EGC, can take advantage of the extended transition period for complying with new or revised accounting standards. Thus, an EGC can delay the adoption of certain accounting standards until those standards would otherwise apply to private companies. We have irrevocably elected not to avail ourselves of this extended transition period and, as a result, we will adopt new or revised accounting standards on the relevant dates on which adoption of such standards is required for other public companies.
We are in the process of evaluating the benefits of relying on other exemptions and reduced reporting requirements under the JOBS Act. Subject to certain conditions, as an EGC, we intend to rely on certain of these exemptions, including exemptions from the requirement to provide an auditor’s attestation report on our system of internal controls over financial reporting pursuant to Section 404(b) of the Sarbanes-Oxley Act and from any requirement that may be adopted by the Public Company Accounting Oversight Board regarding mandatory audit firm rotation or a supplement to the auditor’s report providing additional information about the audit and the financial statements, known as the auditor discussion and analysis. We will remain an EGC until the earlier of: the last day of the fiscal year in which we have total annual gross revenues of $1.0 billion or more; the last day of the fiscal year following the fifth anniversary of the date of the completion of our Offering; the date on which we have issued more than $1.0 billion in nonconvertible debt during the previous three years; or the date on which we are deemed to be a large accelerated filer under the rules of the SEC.
NOTE 3 — INVENTORY
Inventory is carried at the lower of cost or market. Cost is determined using the first-in, first-out method for raw material and finished goods inventory. Market is based on current replacement cost for raw materials and net realizable value for finished goods. Raw materials include all components used in the production of our finished goods, which are our four major product lines, bulk materials, energy storage materials, thermal management materials and inks and coatings.
The following amounts were included in inventory at the end of the period:
| Year Ended December 31 | ||||||||
| 2017 | 2016 | |||||||
| Raw materials | $ | 39,841 | $ | 45,964 | ||||
| Finished goods | 132,023 | 160,009 | ||||||
| Total | $ | 171,864 | $ | 205,973 | ||||
| F-14 |
NOTE 4 — PROPERTY, PLANT AND EQUIPMENT
Property, plant and equipment as of December 31 consist of the following:
| Depreciable life (years) | 2017 | 2016 | ||||||||
| Plant and equipment not yet placed in service | $ | 183,964 | $ | 49,200 | ||||||
| Leasehold improvements | 5-10 | 399,060 | 399,060 | |||||||
| Lab equipment | 3-7 | 884,548 | 871,512 | |||||||
| Production and other equipment | 3-7 | 6,264,376 | 5,809,937 | |||||||
| Software | 3 | 39,144 | 39,144 | |||||||
| 7,771,092 | 7,168,853 | |||||||||
| Less accumulated depreciation and amortization | (5,169,521 | ) | (4,282,432 | ) | ||||||
| Net property, plant and equipment | $ | 2,601,571 | $ | 2,886,421 | ||||||
Depreciation and amortization expense on property and equipment, including leased assets, for the years ended December 31, 2017 and 2016, was $887,089 and $908,896, respectively. These amounts are included as part of our statement of operations in Cost of Goods Sold, Research and Development, and General and Administrative Expenses. For the year ended December 31, 2017, $770,290 was recorded in Cost of Goods Sold, $99,487 in Research and Development, and $17,312 in General and Administrative Expenses. For the year ended December 31, 2016, $756,029 was recorded in Cost of Goods Sold, $119,481 in Research and Development, $33,385 in General and Administrative Expenses.
Property and equipment under capital leases included above consists of the following at December 31:
| 2017 | 2016 | |||||||
| Lab equipment | $ | — | $ | 73,202 | ||||
| Production and other equipment | 448,293 | 991,887 | ||||||
| 448,293 | 1,065,089 | |||||||
| Less accumulated depreciation | (175,173 | ) | (386,314 | ) | ||||
| Net property, plant and equipment under capital leases | $ | 273,120 | $ | 678,775 | ||||
NOTE 5 — INTANGIBLE ASSETS
Intangible assets and related accumulated amortization as of December 31, 2017 and 2016 are as follows:
| Carrying Amount | Less Accumulated Amortization | Net Carrying Amount | ||||||||||
| Licenses | $ | 137,533 | $ | (75,140 | ) | $ | 62,393 | |||||
| Patents | 481,733 | (69,526 | ) | 412,207 | ||||||||
| Trademarks, other intangibles | 5,698 | (2,279 | ) | 3,419 | ||||||||
| Balance, December 31, 2016 | $ | 624,964 | $ | (146,945 | ) | $ | 478,019 | |||||
| Licenses | $ | 137,533 | $ | (88,100 | ) | $ | 49,433 | |||||
| Patents | 608,757 | (103,217 | ) | 505,540 | ||||||||
| Trademarks, other intangibles | 19,631 | (2,666 | ) | 16,965 | ||||||||
| Balance, December 31, 2017 | $ | 765,921 | $ | (193,983 | ) | $ | 571,938 | |||||
Amortization expense of $47,038 and $38,337 was recorded for the years ended December 31, 2017 and 2016, respectively. Amortization expense for the next five years is estimated to be approximately $55,000 annually.
| F-15 |
NOTE 6 — OTHER CURRENT LIABILITIES
As of December 31, 2017 and 2016, our accounts payable and other current liabilities consisted of the following:
| 2017 | 2016 | |||||||
| Accounts payable | $ | 561,368 | $ | 731,518 | ||||
| Accrued compensation | 218,307 | 144,134 | ||||||
| Accrued expenses | 3,089 | 11,100 | ||||||
| 401(k) employer contribution expense | 75,313 | 78,005 | ||||||
| Accounts payable and other liabilities | $ | 858,077 | $ | 964,757 | ||||
NOTE 7 —WARRANTS AND FINANCING AGREEMENTS
Dow Facility
In December 2016, we entered into the Dow Facility which provides us with up to $10 million of secured debt financing at an interest rate of 5% per year, drawable at our request under certain conditions. We received $2 million at closing and an additional $1 million on July 18, 2017, September 22, 2017 and December 4, 2017, respectively. After December 1, 2017, an additional $5 million becomes available once we have raised $10 million of equity capital after October 31, 2016, however we can make no assurances that we will raise $10 million of equity capital and access the additional $5 million under the Dow Facility. At March 30, 2018 we have raised $6,149,024 and have $3,850,976 to raise towards the $10 million requirement.
The Dow Facility is senior to most of our other debt and is secured by all of our assets (Dow is subordinate only to the capital leases with AAOF, see Note 13). The loan matures on December 1, 2021 (subject to certain mandatory prepayments based on our equity financing activities). Interest is payable beginning January 1, 2017 although we may elect to capitalize interest through January 1, 2019. Dow received warrant coverage of one share of common stock for each $40 in loans received by us, equating to 20% warrant coverage, with an exercise price of $8.00 per share for the warrants issued at closing of the initial $2 million draw. After the initial closing, the strike price of future warrants issued is subject to adjustment if we sell shares of common stock at a lower price. As of December 31, 2017, we had issued 125,000 warrants to Dow, which are exercisable on or before the expiration date of December 1, 2023.
The aforementioned warrants meet the criteria for classification within stockholders’ equity. Proceeds were allocated between the debt and the warrants at their relative fair value. The total debt discount on the Dow Facility was approximately $372,000. The debt discount is being amortized to interest expense using the effective interest method over the term of the loans using an average effective interest rate of 6.3%. During the year ended December 31, 2017, amortization expense of $161,702 was recognized resulting in a carrying value of $4,794,596 for the Dow Facility as of December 31, 2017.
The Dow Facility entitles Dow to appoint an observer to our Board. Dow will maintain this observation right until the later of December 1, 2019 or when the amount of principal and interest outstanding under the Dow Facility is less than $5 million.
2014 Samsung Financing and Warrants
On January 15, 2014, we sold $3,000,000 of Secured Convertible Notes to SVIC No. 15 New Technology Business Investment L.L.P, a subsidiary of the Samsung Group (“Samsung”). The Notes were converted into Series A Convertible Preferred Stock on December 31, 2015. In connection with the sale of the Notes, the Company issued to Samsung a total of 100,000 warrants with a term of 4 years that were exercisable into shares of Series A Convertible Preferred Stock at a price of $12.00. These warrants vested in four annual installments according to the amount of future cash payments made by Samsung for licensing, royalties and product purchases. As of December 31, 2017, no payments had been made by Samsung and none of the warrants associated with the Samsung note had vested. The warrants expired on January 15, 2018.
Bridge Financings
From December 31, 2015 through April 7, 2016, we entered into private placement bridge financings, executed using 15 separate short-term promissory notes totaling $1,124,750 (the “Bridge Financings”). Seven of these notes were executed by three Board members and their affiliates. The Bridge Financings had maturity dates ranging from June 30, 2016 through December 31, 2016 and the interest rate was 8%.
The investors in the Bridge Financings received common stock warrant coverage of 30% for investments made prior to December 31, 2015 with an exercise price of $8.00 per share, and 20% coverage thereafter with an exercise price of $10.00 per share.
| F-16 |
The Company issued warrants to purchase 32,120 shares of common stock with a five-year term and an exercise price of $8.00 per share.
The Bridge Financing warrants issued in December 2015 inadvertently provided the holder with the right to exchange their warrants on a price per share basis into a new security on the same relative price per share terms as any new securities sold to third parties resulting in gross proceeds of at least $18,000,000. As a result of these exchange rights, the warrants did not achieve equity classification at inception and were recorded as derivative liabilities, at fair value. During the second quarter of 2016, such warrant holders agreed to waive their exchange rights at which time the warrants were reclassified to equity. This resulted in the current fair value of such warrants of $51,418, being reclassified from derivative liabilities to equity. During June 2016, we repaid outstanding principal of $750,000 plus accrued interest of $27,032 to the Bridge Financing investors. These investors, who are also members of the Board, used the proceeds from repayment of their notes, plus additional funds, to purchase 199,879 additional shares of the Company’s common stock for approximately $1.6 million. During December 2016, we repaid the remaining $374,750 of outstanding principal plus accrued interest of $21,253. Members of the Board and their affiliates provided $800,000 of the principal for such Bridge Financings, and upon repayment they re-invested all of the principal plus an additional $1,013,032 to purchase 226,629 shares of the Company’s common stock.
NOTE 8 — PRIVATE PLACEMENT
In April 2015, we commenced a private placement offering of up to $18,000,000 in Series B Units consisting of up to 1,125,000 shares of Series B Preferred Stock and warrants to purchase common stock at an offering price of $16.00 per Series B Unit (“Series B Units”). As of December 31, 2016, we had sold 266,887 shares of Series B Convertible Preferred Stock and Warrants to purchase 222,262 shares of common stock, for aggregate gross proceeds of $4,270,192.
The private Series B Unit offering was terminated on February 25, 2016. As a result of our Offering and pursuant to certain exchange rights granted to participants in the Series B Unit offering, holders of Series B Preferred Stock received the right to exchange each share of Series B Preferred Stock they owned into two shares of common stock. As of December 31, 2016, all holders of Series B Preferred Stock had exercised their Series B exchange rights, and as a result we issued 539,974 shares of restricted common stock in exchange for the 269,987 shares of Series B Preferred Stock that had been previously outstanding. All of the previously issued Series B Preferred Stock was cancelled. Although the stock was cancelled, all of the warrants to purchase 222,262 shares of common stock and preemptive rights warrants to purchase 2,635 shares of common stock issued in connection with the Series B Units remain outstanding at December 31, 2017. Such warrants have an exercise price of $16.00 per share and expire between April 21 and June 30, 2022. These warrants were classified as derivative liabilities until September 30, 2017; at which time they were reclassified to equity (additional paid in capital). The reclassification was made on September 30, 2017 after determining that the exchange rights as defined in the Michigan “Certificate of Amendment – Corporation”, filed on August 19, 2016 no longer required liability classification.
NOTE 9 - DERIVATIVE LIABILITY WARRANTS
On the date of their issuances, the Series A Convertible Preferred Stock warrants issued in conjunction with convertible notes issued in 2013 (subsequently converted into Series A Convertible Preferred Stock on December 31, 2015), equipment financing leases procured in 2013 and 2014, and certain other pre-emptive rights and the common stock warrants issued in connection with the 2015 Series B Unit offering were derivative liabilities which require re-measurement at fair value each reporting period.
As mentioned in Note 2, in September 2017, we chose to adopt ASU 2017-11 which changed the classification analysis of certain warrants with anti-dilution features. Since we adopted ASU 2017-11 in an interim period, the adjustments were reflected as of the beginning of the fiscal year as a cumulative-effect adjustment to the Company’s beginning accumulated deficit as of January 1, 2016. As a result of adopting ASU 2017-11, the Company no longer recognizes a liability related to 972,720 warrants, which were only classified as liabilities a result of having anti-dilution features.
As mentioned in Note 8, 224,897 warrants related to the Series B offering were reclassified from derivative liabilities on the balance sheet to equity at September 30, 2017 because the requirement to classify them as liabilities was removed when we amended the Series B Certificate of Designation in August of 2016.
The initial value of the stock warrants issued as consideration for the equipment financing leases in 2013 and 2014 was recorded as a reduction of the capital lease obligation and is being amortized as part of the effective interest cost on the capital lease obligation (see Note 13).
In 2014 when we entered into financing agreements with Samsung, AAOF and XGS II, and we provided our shareholders with preemptive rights to purchase shares of Series A Convertible Preferred Stock for every two shares of Series A Convertible Preferred Stock or common stock owned by the shareholder. In addition, for every two shares of Series A Convertible Preferred Stock purchased by a shareholder, we issued such shareholder a warrant to purchase one additional share of Series A Convertible Preferred Stock with the same terms as the warrants issued to AAOF and XGS II.
| F-17 |
Also, as part of our private placement of Series B Units in April 2015, shareholders and holders of our convertible notes were provided the right to purchase their pro rata share of any class of stock that the Company sells or issues. The sale of Series B Preferred Stock in the April 2015 offering triggered the preemptive rights resulting in the issuance of shares of Series B Preferred Stock and warrants. As of December 31, 2017, the total number of warrants issued due to the preemptive rights offerings was 58,689.
The following table summarizes the fair value of the derivative liabilities as of December 31, 2016:
| 2016 | ||||
| Warrants issued with Secured Convertible Notes | $ | 6,554,160 | ||
| Warrants issued with equipment financing leases | 655,418 | |||
| Warrants issued with preemptive rights | 443,790 | |||
| Warrants issued with April 2015 private placement of Series B Units | 246,881 | |||
| Adoption of accounting standard ASU 2017-11 (see note 2) | (7,650,442 | ) | ||
| Total derivative liabilities | $ | 249,807 | ||
The Company estimated the fair value of their warrant derivative liabilities as of December 31, 2016, using a lattice model and the following assumptions:
| 2016 | ||
| Fair value of underlying stock | $7.63 - $12.64 | |
| Expected term (in years) | 5.33 – 7.04 | |
| Equivalent risk-free interest rate | 1.27% – 1.46% | |
| Equivalent stock price volatility | 37.44%- 37.92% | |
| Expected dividend yield | — |
Because the Company is not publicly traded on a national exchange or to our knowledge, quoted on any over-the-counter market, the expected volatility of the Company’s common stock was developed using historical volatility for a peer group for a period equal to the expected term of the warrants. While the warrants were classified as liabilities, the fair value of the warrants was significantly influenced by the fair value of our common stock, stock price volatility, and the risk-free interest components of the lattice technique.
Changes in the fair value of Derivative Liabilities, carried at fair value, are reported as “Change in fair value of derivative liability — warrants” in the Statement of Operations. Comparative prior periods were prepared using the newly adopted ASU 2017-11 as follows:
| Year ended December 31, | ||||||||
| 2017 | 2016 | |||||||
| Warrants issued with preemptive rights | $ | (545 | ) | $ | 59,947 | |||
| Warrants issued with April 2015 private placement of Series B Units | (46,067 | ) | 706 | |||||
| Warrants issued with Bridge Financings | — | 1,258 | ||||||
| Total Derivative Gain (Loss) | $ | (46,612 | ) | $ | 61,911 | |||
As a result of the Company’s early adoption of ASU 2017-11 at September 30, 2017, which effected warrants to purchase 972,720 shares of Series A Convertible Preferred Stock and warrants to purchase 224,897 shares of common stock that were issuance in connection with the Series B Unit Offering, we reclassified $7,650,442 of derivative liabilities to shareholders equity as we are no longer required to record the change in fair values for these instruments.
NOTE 10 – STOCK WARRANTS ACCOUNTED FOR AS EQUITY INSTRUMENTS
The following table summarizes the warrants (including the warrants previously accounted for as derivatives) outstanding at December 31, 2017, which are accounted for as equity instruments, all of which are exercisable:
| Date Issued | Expiration Date | Indexed Stock | Exercise Price | Number of Warrants | ||||||||
| 07/01/2009 | 07/01/2019 | Common | $ | 8.00 | 6,000 | |||||||
| 10/08/2012 | 10/08/2027 | Common | $ | 12.00 | 5,000 | |||||||
| 01/15/2014 - 12/31/2014 | 01/15/2024 | Series A Convertible Preferred | $ | 6.40 | 972,720 | |||||||
| 04/30/2015- 05/26/2015 | 04/30/2022 | Common | $ | 16.00 | 218,334 | |||||||
| 06/30/2015 | 06/30/2022 | Common | $ | 16.00 | 6,563 | |||||||
| 12/31/2015 | 12/31/2020 | Common | $ | 8.00 | 20,625 | |||||||
| 03/31/2016 | 03/31/2021 | Common | $ | 10.00 | 10,600 | |||||||
| 04/30/2016 | 04/30/2021 | Common | $ | 10.00 | 895 | |||||||
| 12/14/2016 | 12/01/2023 | Common | $ | 8.00 | 50,000 | |||||||
| 07/18/2017 | 12/01/2023 | Common | $ | 8.00 | 25,000 | |||||||
| 09/22/2017 | 12/01/2023 | Common | $ | 8.00 | 25,000 | |||||||
| 12/04/2017 | 12/01/2023 | Common | $ | 8.00 | 25,000 | |||||||
| 1,365,737 | ||||||||||||
| F-18 |
The warrants indexed to Series A Convertible Preferred Stock are currently exercisable and are exchangeable into 1.875 shares of common stock.
NOTE 11 — STOCKHOLDERS’ EQUITY (DEFICIT)
Common Stock
The Company is authorized to issue 25,000,000 shares of common stock, no par value per share. During the years ended December 31, 2017 and 2016, the Company issued 468,175 and 508,657 shares of common stock, respectively. There were 2,353,350 and 1,885,175 shares of common stock issued and outstanding at December 31, 2017 and 2016, respectively.
Each outstanding shares of common stock is entitled to one vote on each matter submitted to a vote, unless provided in our Articles of Incorporation, as amended. Each common stockholder is entitled to receive dividends, if declared. Holders of the common stock have no other preemptive or preferential rights to purchase additional shares of any class of the Company’s capital stock in subsequent stock offerings.
Series A Convertible Preferred Stock
As of December 31, 2017, the Company is authorized to issue up to 3,000,000 shares of Series A Convertible Preferred Stock, or Series A Preferred. Each share of the Series A Preferred, which has a liquidation preference of $12.00 per share, is convertible at any time, at the option of the holder, into one share of Common Stock at the lower of: (a) $12.00 per share, or (b) 80% of the price at which the Company sells any equity or equity-linked securities in the future. The Series A Preferred also contains typical anti-dilution provisions that provide for adjustment of the conversion price to reflect stock splits, stock dividends, or similar events. The Series A Preferred is subject to mandatory conversion into Common Stock upon the listing of the Company’s Common Stock on a Qualified National Exchange. However, the Series A Preferred is not subject to the mandatory conversion until all outstanding Convertible Securities are also converted into common stock. The Series A Preferred ranks senior to all other equity or equity equivalent securities of the Company other than those securities which are explicitly senior or pari passu in rights and liquidation preference to the Series A Preferred and pari passu with the Company’s Series B Preferred.
The Company issued 1,456,126 shares of Series A Preferred in connection with the conversion of certain convertible notes on December 31, 2015.
When the Company issued warrants for $8.00 per share, which is also the price at which the Company is selling common stock in its Offering, in conjunction with the December 2015 Bridge Financing, the conversion price of the Series A Preferred was reduced from $12.00 to $6.40 (80% of $8.00), which makes each share of Series A Preferred Stock convertible into 1.875 shares of common stock. The repricing of the Series A Preferred resulted in a beneficial conversion feature of approximately $2.21 million which was recorded as a deemed dividend.
Series B Convertible Preferred Stock
As of December 31, 2017, 1,500,000 shares have been designated as Series B Convertible Preferred Stock, or Series B Preferred, of which none were issued and outstanding. Each share of the Series B Preferred, which has a liquidation preference of $16.00 per share, is convertible at any time, at the option of the holder, into one share of common stock at $16.00 per share. The Series B Preferred also contains typical anti-dilution provisions that provide for adjustment of the conversion price to reflect stock splits, stock dividends, or similar events. Each share of Series B Preferred is subject to mandatory conversion into common stock at the then-effective Series B conversion rate upon the public listing by the Company of its common stock on a Qualified National Exchange. However, the Series B Preferred is not subject to the mandatory conversion until all outstanding Convertible Securities are also converted into common stock. The Series B Preferred ranks senior to all other equity or equity equivalent securities of the Company other than those securities which are explicitly senior or pari passu in rights and liquidation preference to the Series B Preferred and pari passu with the Company’s Series A Preferred.
| F-19 |
Investors in the Series B Unit offering in April 2014 had the right to exchange their Series B Preferred on a price per share basis into new securities on the relative price per share terms as new securities sold to a third party on the earlier of i) December 31, 2017 and ii) the date the Company consummates the sale of new securities resulting in gross proceeds of at least $18 million. As discussed in further detail in Note 8, as of December 31, 2017, all holders of Series B Preferred exercised their exchange rights and had exchanged all their Series B Preferred for shares of common stock.
The Series A Preferred and Series B Preferred are not redeemable for cash and the Company concluded that they are more akin to equity-type instruments than debt-type instruments. Accordingly, the embedded conversion option in each agreement is clearly and closely related to an equity-type host and the conversion option does not require classification and measurement as a derivative financial instrument. Therefore, the securities meet the conditions for stockholders’ equity classification.
NOTE 12 — EQUITY INCENTIVE PLAN
We previously established the 2007 Stock Option Plan (the “2007 Plan”), which was scheduled to expire on October 30, 2017 and under which we granted key employees and directors options to purchase shares of our common stock at not less than fair market value as of the grant date. On May 4, 2017, the Board approved the 2017 Equity Incentive Plan (the “2017 Plan”) to replace the 2007 Plan, which became effective upon the approval of the stockholders holding a majority of the voting power in the Company on July 18, 2017. The 2017 Plan replaces the 2007 Plan and authorizes us to issue awards (stock options and restricted stock) with respect of a maximum of 1,200,000 shares of our common stock, which equals the number of shares authorized under the 2007 Plan.
On July 24, 2017, certain stock options from the 2007 Plan were cancelled and replacement stock options were awarded. The replacement stock option awards have an exercise price of $8.00 per share, a seven-year term, are vested 50% on date of grant with the remaining vesting over a 4-year period from the date issued and are subject to certain other terms. Each option holder received options equal to 150% of the number of cancelled stock options. The cancellation and reissuance of the stock options were treated as a modification under ASC 718, Compensation-Stock Compensation. Incremental compensation cost of approximately $1,015,758 was measured as the excess of the fair value of the modified award over the fair value of the original award immediately before the terms were modified. Compensation cost of approximately $501,071 was recorded on the date of cancellation for awards that were vested on the date of the modification. For unvested awards, compensation cost of approximately $514,687 will be recorded over the remaining requisite service period.
On August 10, 2017, the Company granted stock options and restricted stock to each of its Board members as part of their compensation package. Each of the 4 independent Board members received 2,500 stock options and 2,500 shares of restricted stock for their Board services. The options were granted at a price of $8.00 per share and had an aggregate grant date fair value of $26,120. The options vest ratably over a four-year period beginning on the one-year anniversary. The restricted stock issued to the Board members has an aggregate fair value of $80,000 and vest ratably in arrears over four quarters on the last day of each fiscal quarter following the grant date. As of December 31, 2017, 5,000 of the 10,000 shares of restricted stock issued had vested, resulting in compensation expense of $40,000 in 2017.
The Company granted 32,500 employee stock options on November 1, 2017. The options were granted at a price of $8.00 per share and had an aggregate grant date fair value of $88,946. The options vest ratably over a four-year period beginning on the one-year anniversary.
The following table shows the stock option activity during the years ended December 31, 2017 and 2016:
| 2017 | 2016 | |||||||||||||||
| Number Of Options | Weighted Average Exercise Price | Number Of Options | Weighted Average Exercise Price | |||||||||||||
| Options outstanding at beginning of year | 369,750 | $ | 11.86 | 419,750 | $ | 12.00 | ||||||||||
| Changes during the year: | ||||||||||||||||
| Cancelled | (357,750 | ) | 12.00 | — | ||||||||||||
| Replacement options granted- at market price | 536,625 | 8.00 | — | |||||||||||||
| New options granted- at market price | 140,500 | 8.00 | — | |||||||||||||
| Expired | (12,000 | ) | 12.00 | (50,000 | ) | 13.20 | ||||||||||
| Options outstanding at end of year | 677,125 | 8.00 | 369,750 | 11.89 | ||||||||||||
| Options exercisable at end of year | 322,158 | 8.00 | 268,565 | 11.86 | ||||||||||||
| Weighted average fair value exercise price of options granted during the year | $ | 8.00 | $ | 0.00 | ||||||||||||
| Weighted average remaining contractual term (in months) | 80 | 32 | ||||||||||||||
| F-20 |
Costs incurred in respect of stock-based compensation for employees and directors, for the years ended December 31, 2017 and 2016 were $856,084 and $480,532, respectively. Unrecognized compensation cost as of December 31, 2017 and 2016 was $935,363 and $381,009, respectively.
As of December 31, 2017, none of the currently exercisable stock options had intrinsic value. The intrinsic value of each option share is the difference between the fair market value of our common stock and the exercise price of such option share to the extent it is “in-the-money”. Aggregate intrinsic value represents the value that would have been received by the holders of in-the-money options had they exercised their options on the last trading day of the year and sold the underlying shares at the closing stock price on such day. The intrinsic value calculation is based on the assumed market value of our common stock on December 31, 2017 of $8.00 per share, which is the price per share at which we have been selling shares of common stock to third parties in our Offering. There were no in-the-money options outstanding and exercisable as of December 31, 2017, since the exercise prices of the stock options outstanding and expected to vest were all equal to the fair value of our common stock.
The following table presents changes in the number of non-exercisable options during 2017:
| 2017 | ||||
| Total- non-exercisable options outstanding- December 31, 2016 | 101,185 | |||
| Options granted | 354,967 | |||
| Options vested | (28,002 | ) | ||
| Options cancelled/forfeited | (73,183 | ) | ||
| Outstanding non-exercisable options outstanding as of December 31, 2017 | 354,967 | |||
| Weighted average grant date fair value | $ | 8.00 | ||
| Weighted average remaining vested period (in months) | 80 | |||
The total fair value of options granted during the year ended December 31, 2017 was $1,673,476 with $1,302,627 of this amount being related to options that were issued to replace options which were cancelled on July 24, 2017. There were no options granted during 2016.
The fair value of the options granted in 2017 was estimated on the grant date using the Black-Scholes option-pricing model with the following assumptions:
| 2017 | ||
| Fair value of underlying stock | $8.00 | |
| Expected option life | 3.50 years – 4.75 years | |
| Expected stock price volatility | 34.81% – 36.85% | |
| Risk free interest rate | 1.49%- 2.01% | |
| Expected dividend yield | 0.00% |
Information with respect to restricted stock awards outstanding as of December 31, 2017 was as follows:
| 2017 | ||||
| Outstanding non-vested restricted stock at beginning of year: | — | |||
| Granted | 10,000 | |||
| Vested | 5,000 | |||
| Cancelled/forfeited | — | |||
| Outstanding non-vested restricted stock as of December 31, 2017 | 5,000 | |||
| Weighted average grant date fair value | $ | 8.00 | ||
| Weighted average remaining vested period (in months) | 6 | |||
| F-21 |
NOTE 13 — CAPITAL LEASES
As of December 31, 2017, and 2016, we have capital lease obligations to AAOF (see Note 9) and other lessors as follows:
| December 31, 2017 | December 31, 2016 | |||||||
| Capital lease obligations | $ | 149,120 | $ | 449,368 | ||||
| Unamortized warrant discount | (15,040 | ) | (65,595 | ) | ||||
| Net obligations | 134,080 | 383,773 | ||||||
| Short-term portion of obligations | (118,553 | ) | (268,667 | ) | ||||
| Long-term portion of obligations | $ | 15,527 | $ | 115,106 | ||||
In connection with the lease agreements with AAOF, we issued to them preferred stock warrants with an initial fair value of $156,043 and $147,496 in 2015 and 2014, respectively (see Note 9). The initial fair value has been accounted for as a discount on the capital lease obligation and is being amortized as part of the interest expense on the leases. Initially the warrants were accounted for as derivative instrument liabilities at fair value. With the early adoption of ASU 2017-11 (see Note 2) these were reclassified to equity.
Our AAOF capital lease obligations are four-year leases starting on January 1, 2014 and January 1, 2015. The effective interest rates on the leases are 50% and 32% for the leases executed in 2015 and 2014, respectively. The present value of the lease payments are more than 90% of the fair value of the equipment and therefore the leases were capitalized.
Our other capital leases expire at various dates in 2018 and 2022, have average effective interest rates of 1.54% and contain bargain purchase options that allow us to purchase the leased property for a minimal amount upon the expiration of the lease term.
Future minimum lease payments under capital lease obligations are as follows:
| For the year ending December 31: | ||||
| 2018 | $ | 144,413 | ||
| 2019 | 4,266 | |||
| 2020 | 4,266 | |||
| 2021 | 4,266 | |||
| 2022 | 4,266 | |||
| Total future minimum lease payments | 161,477 | |||
| Less amount representing interest | (27,397 | ) | ||
| Present value of future minimum lease payments | 134,080 | |||
| Less current maturities | (118,553 | ) | ||
| Obligations under capital leases – long term | $ | 15,527 | ||
Property and equipment acquired under capital lease agreements is pledged as collateral to secure the performance of the future minimum lease payments above.
NOTE 14 — INCOME TAXES
Deferred tax assets (liabilities) consist of the following at December 31:
| 2017 | 2016 | |||||||
| Deferred tax assets: | ||||||||
| Net operating loss carry forwards | $ | 9,230,000 | $ | 12,985,000 | ||||
| Miscellaneous temporary differences | 5,000 | 75,000 | ||||||
| Research and development credits | 600,000 | 560,000 | ||||||
| Deferred tax liabilities: | ||||||||
| Property and equipment | (120,000 | ) | (230,000 | ) | ||||
| Net deferred tax asset | $ | 9,715,000 | $ | 13,390,000 | ||||
| Valuation allowance | $ | (9,715,000 | ) | $ | (13,390,000 | ) | ||
| Net deferred tax asset | $ | — | $ | — | ||||
| F-22 |
Net operating loss carry forwards of $44,000,000 and $38,000,000 exist at December 31, 2017 and 2016, respectively.
The primary difference between the net operating loss carry forwards and the accumulated deficit arises from certain stock option, warrants and other debt and equity transactions that are considered permanent differences. These losses were incurred in the years 2006 through 2017 and will expire between 2026 and 2037 and their utilization may be limited if we experience significant ownership changes. The Company has not conducted a full IRC Section 382 analysis to determine if a reduction in net operating loss carry forwards is required due to ownership changes. The analysis has not been undertaken due to the financial burden it would cause and changes, if any, resulting in a reduction to the deferred tax asset and related valuation would have no impact on the net deferred tax asset or expense recognized. The research and development credits will expire between 2028 and 2037. Rates of 27% and 40% have been used to calculate the deferred tax assets and liabilities based on the expected effective tax rates, net of applicable credits, upon reversal of the differences above. A valuation allowance has been established against the entire deferred tax asset at December 31, 2017 and 2016.
The Tax Cuts and Jobs Act of 2017 was signed into law on December 22, 2017. The law includes significant changes to the U.S. corporate income tax system, including a federal corporate rate reduction from 35% to 21%, limitations on the deductibility of interest expense and executive compensation, and the transition of U.S. international taxation from a worldwide tax system to a territorial tax system. The rate reduction resulted in a $5,635,000 decrease in both the deferred tax asset and valuation allowance with no net impact on the financial statement amounts.
We implemented ASU No. 2015-17,Income Taxes (Topic 740): Balance Sheet Classification of Deferred Taxesfor 2017 which results in all deferred tax components being disclosed as noncurrent. Other temporary differences previously disclosed as current are classified as noncurrent after implementation. Implementation had no impact on the balance sheet as a valuation allowance is established against 100% of the deferred tax assets.
The Company will continue to assess its provision for income taxes as future guidance is issued but does not currently anticipate significant revisions will be necessary. Any such revisions will be treated in accordance with the measurement period guidance outlined in Staff Accounting Bulletin No. 118.
Below is a reconciliation of the statutory federal income tax rate to our effective tax rate for the fiscal years ended December 31, 2017 and 2016:
| 2017 | 2016 | |||||||
| Federal tax provision | 32.0 | % | 32.0 | % | ||||
| State tax provision | 6.0 | % | 6.0 | % | ||||
| Non-deductible compensation expense | 13.3 | % | 3.6 | % | ||||
| Valuation allowance | (51.3 | )% | (41.6 | )% | ||||
| 0.0 | % | 0.0 | % | |||||
We file income tax returns in the U.S. federal jurisdiction and in Michigan. Tax regulations within each jurisdiction are subject to the interpretation of the related tax laws and regulations and require significant judgment to apply. Beginning in 2017 we will be filing under the corporate income tax (CIT) versus the Michigan Business Tax (MBT) structure. Net operating losses incurred in 2016 and prior will not carry forward to the CIT tax structure, accordingly all losses prior to 2017 are considered a permanent timing difference for state deferred tax calculations.
For federal and state purposes, we have open tax years for all years in which we have filed tax returns. We are not currently subject to any ongoing income tax examinations.
NOTE 15 —Customer, Supplier, country and Product Concentrations
Grants and Licensing Revenue Concentration
Two grantors accounted for 75% and 25% respectively of total grant revenue in 2017. In 2016, two grantors accounted for 77% and 14% of the revenue. The company’s licensing revenue in both 2017 and 2016 came from one licensor.
| F-23 |
Product Concentration
For 2017, we had concentrations of product revenue from two products that were greater than 10% of total product revenues. Revenue from two of the Company’s graphene nanoplatelets materials, Grade C 300 m²/g – HP, was 14% and Grade C 500 m²/g, was 55%. For 2016, we had concentrations of revenue from only one product that was greater than 10% of total revenues, Grade C 300 m²/g – HP was 24%. We attempt to minimize the risk associated with product concentrations by continuing to develop new products to add to our portfolio.
Customer Concentration
For 2017 we had three customers whose purchases accounted for 10%, 12% and 53% of total product revenues. In 2016 we had one customer that represented 24% of total product revenues. At December 31, 2017 and 2016, there was one customer who had an accounts receivable balance greater than 10% in both years of our outstanding receivable balance.
Country Concentration
We sell our products on a worldwide basis. International revenues in 2017 and 2016, as a percentage of total product revenue, were 30% and 56%, respectively. All of these sales are denominated in U.S. dollars.
For 2017, one country other than the United States (China) accounted for approximately 13% of total product revenue. Similarly, in 2016, one country other than the United States (South Korea) accounted for approximately 21% of total product revenue.
Suppliers
We buy raw materials used in manufacturing from several sources. These materials are available from a large number of sources. A change in suppliers has no material effect on the Company’s operations. We did not have any purchases to one supplier that were more than 10% of total purchases in either 2017 or 2016.
NOTE 16 — RELATED PARTY TRANSACTIONS AND COMMITMENTS
We have a licensing agreement for exclusive use of patents and pending patents with Michigan State University (MSU), a stockholder via the MSU Foundation. During 2017 and 2016, we incurred $50,000 each year for royalties for these licenses. We have also entered into product licensing agreements with certain other stockholders. No royalty expenses have been recognized related to these agreements during 2017 and 2016.
The Company and POSCO, a shareholder of the Company, entered into a license agreement dated June 8, 2011, pursuant to which POSCO agreed to pay a minimum annual royalty of $100,000 per year if certain circumstances existed, among other things. The Company believed that this minimum annual royalty became due annually beginning on February 28, 2015, and up until June 30, 2017, recorded this royalty revenue at a rate of $25,000 per quarter. POSCO disputed its obligation to pay this minimum annual royalty and did not pay the royalty in any prior year. We filed a demand for arbitration in the International Court of Arbitration on March 9, 2016, in an effort to resolve the dispute. On November 3, 2017, the Company and POSCO agreed to modify the terms of the initial agreement and dismiss the arbitration. Amounts owed to us were paid by POSCO in November 2017. There were no amounts due and recorded on our balance sheet at December 31, 2017.
During the years ended December 31, 2017 and 2016, we issued 28,560 and 28,560 shares, respectively, of Series A Preferred to AAOF as payment under the terms of a Master Leasing Agreement.
On December 31, 2015, we issued notes (“December Notes”) and warrants (“December Warrants”) to Steven Jones, Arnold Allemang, and Dave Pendell, each of whom is currently a member of the Board of Directors. The December Notes matured on June 30, 2016 and the December Warrants have a five-year term and a strike price of $8.00. Each of Messrs. Jones, Allemang and Pendell purchased December Notes for $250,000, $250,000 and $50,000 respectively, which included December Warrants for 9,375, 9,375, and 1,875 shares of common stock, respectively. These notes were paid off in full as of June 30, 2016. Messrs. Allemang, Jones, and Pendell and certain of their affiliates reinvested the proceeds from the repayment of the December Notes plus additional other funds into our Offering.
On March 9, 2016, we issued a promissory note and warrants to purchase 2,000 shares of common stock to Mr. Arnold Allemang, our Chairman of the Board. The note matured on December 31, 2016 and the warrants have a five-year term and a strike price of $10.00. Mr. Allemang purchased the note and warrants for $100,000. The note was paid off in full as of June 30, 2016. Mr. Allemang reinvested the proceeds from the repayment of this note plus additional other funds into our Offering.
| F-24 |
On March 25, 2016, we issued a promissory note and warrants to purchase 2,000 shares of common stock to Mr. Steven Jones, a member of our Board of Directors. The note matured on December 31, 2016 and the warrants have a five-year term and a strike price of $10.00. Mr. Jones purchased the note and warrants for $100,000. The note was paid off in full as of June 30, 2016. Mr. Jones reinvested the proceeds from the repayment of this note plus additional other funds into our Offering.
On March 25, 2016, we issued a promissory note and warrants to purchase 1,000 shares of common stock to Mr. David Pendell, a member of our Board of Directors. The note matured on December 31, 2016 and the warrants have a five-year term and a strike price of $10.00. Mr. Pendell purchased the note and warrants for $50,000. The note was paid off in full as of December 31, 2016. Mr. Pendell re-invested $48,000 of these loan repayment proceeds into our Offering.
During 2016, Messrs. Allemang, Jones and Pendell and certain of their affiliates invested the following amounts into our Offering and purchased the number of shares indicated below.
| Purchase Dates (2016) | Amount Invested | Shares Purchased | ||||||||
| Arnold Allemang and affiliates | June 23 – 28 and Sept. 30, 2016 | $ | 965,000 | 120,625 | ||||||
| Steven C. Jones and affiliates | June 24 – 27, 2016 | $ | 748,000 | 93,500 | ||||||
| David G. Pendell and affiliates | June 27 and Dec. 5, 2016 | $ | 100,032 | 12,504 | ||||||
| Total | $ | 1,813,032 | 226,629 | |||||||
During 2017, Messrs. Allemang, Jones and Pendell and certain of their affiliates invested the following amounts into our Offering and purchased the number of shares indicated below.
| Purchase Dates (2017) | Amount Invested | Shares Purchased | ||||||||
| Arnold Allemang and affiliates | Sept. 6 and Dec. 28, 2017 | $ | 560,000 | 70,000 | ||||||
| Steven C. Jones and affiliates | April 3 and Sept. 29, 2017 | $ | 252,400 | 31,550 | ||||||
| David G. Pendell and affiliates | February 9, 2017 | $ | 16,000 | 2,000 | ||||||
| Total | $ | 828,400 | 103,550 | |||||||
In conjunction with a financing with AAOF, we and our stockholders listed therein entered into a Shareholder Agreement on March 18, 2013 that contains a number of specific provisions pertaining to the Board of Directors as well as individual Directors. On February 26, 2016, we amended the Shareholder Agreement.
Among other things, the Shareholder Agreement provides for certain voting and nomination rights to be calculated on the basis of “Full Conversion” stock ownership (under which calculation, all convertible notes, preferred shares, or other convertible equity securities are deemed converted into common stock) as follows:
| • | So long as AAOF or its affiliates own 10% of more of the aggregate outstanding Shareholder Stock (as defined in the Shareholder Agreement): |
| - | the size of the Board of Directors shall be set at seven individuals. |
| - | one person nominated by AAOF shall be elected to the Board of Directors. |
| - | two members of the Board of Directors, other than those nominated by AAOF, POSCO or Hanwha Chemical, shall qualify as independent Directors. |
| • | So long as POSCO owns 10% of more of the aggregate outstanding Shareholder Stock, one person nominated by POSCO shall be elected to the Board of Directors. POSCO does not currently own at least 10% of the aggregate outstanding Shareholder Stock and therefore, there is no POSCO representative on the Board of Directors. |
| • | So long as Hanwha Chemical owns 10% of more of the aggregate outstanding Shareholder Stock, one person nominated by Hanwha Chemical shall be elected to the Board of Directors. Hanwha does not currently own at least 10% of the aggregate outstanding Shareholder Stock and therefore, there is no Hanwha representative on the Board of Directors. |
As of December 31, 2016, the ownership percentage of AAOF, as calculated for purposes of director voting, required the shareholders bound by the Shareholder Agreement to vote for a director nominated by AAOF. Mr. Jones is the AAOF representative to the Board pursuant to the terms of the Shareholder Agreement.
| F-25 |
The Shareholder Agreement grants preemptive rights to shareholders and holders of convertible notes who are parties to the Shareholder Agreement. Pursuant to the terms therein, such shareholders and noteholders have the right to purchase their pro rata share of all shareholder stock that the Company may, from time to time, propose to sell, issue, or exchange after the date of the Shareholder Agreement, other than certain excluded stock which includes stock granted to employees or as merger consideration. Each shareholder’s pro rata shares shall be equal to the ratio of (i) the aggregate number of shares of the Company’s common stock on a fully diluted basis, owned by the such shareholder at the time of the delivery of a preemptive rights notice to (ii) the aggregate number of shares of Company’s common stock on a fully diluted basis owned by all of the Company’s shareholders at the time of the delivery of a preemptive rights notice.
The Shareholder Agreement may be amended or terminated by agreement (either generally or in a particular instance and either retroactively or prospectively), only with the written consent of (i) a majority of the Board, and (ii) persons holding, in the aggregate, shares of Shareholder Stock representing at least sixty percent (60%) of the voting power of all shares of Shareholder Stock then held by Shareholders and their permitted assignees.
The February 26, 2016 amendment provides that holders of Excluded Stock are not subject to the terms of the Shareholders Agreement. Excluded Stock means shares of common stock that are subject to a registration statement that has been filed with the SEC and has been declared effective, and, for the avoidance of any doubt, includes the 3,000,000 shares being offered under the Registration Statement. This amendment took effect upon the effectiveness of our Registration Statement.
The Amendment to the Shareholder Agreement further clarifies that preemptive rights shall not apply to Excluded Stock (including, without limitation, the 3,000,000 shares being offered under the Registration Statement) and amends the termination date of the Shareholders Agreement. Specifically, the Shareholder Agreement has been amended to provide that it continues in effect until (i) the date of the closing of a public offering of common stock pursuant to a registration statement filed with the SEC that is declared effective in which the Company receives gross proceeds of at least $10,000,000, on which date it shall terminate in its entirety, unless the Shareholder Agreement is earlier terminated in accordance with its terms, or (ii) the date on which the Company’s common stock is listed on the NASDAQ Stock Market of the New York Stock Exchange. As a result, in the event that the Company is unable to raise at least $10,000,000 in our Offering, the Shareholder Agreement will continue to remain in effect and the larger shareholders described above will be entitled to continue to exercise their rights under such Shareholders Agreement, but purchasers of shares of common stock under this registration statement, if it is made effective, will not be required to adopt the Shareholders Agreement.
NOTE 17 — OPERATING LEASES
We lease our primary manufacturing facility, laboratory and administrative office under two separate operating leases expiring in March 2022 and December 2022. A second manufacturing facility is leased on a month to month basis. We have a third manufacturing facility under an operating lease executed in October of 2017 and expiring December 31, 2022. We plan to move our manufacturing from the facility with the month to month lease to the new facility in quarter 2 of 2018. Total rent expense, including common area maintenance costs, was $388,851 and $383,029 during the years ended December 31, 2017 and 2016, respectively. Operating lease commitments for the next 5 years are as follows:
| For the year ending December 31: | ||||
| 2018 | $ | 689,038 | ||
| 2019 | $ | 587,136 | ||
| 2020 | $ | 591,474 | ||
| 2021 | $ | 606,774 | ||
| 2022 | $ | 431,691 |
NOTE 18 — RETIREMENT PLAN
We maintain a defined-contribution 401(k) retirement plan covering substantially all employees (as defined by our plan document). Employees may make voluntary contributions to the plan, subject to limitations based on IRS regulations and compensation. The plan allows for an employer match contribution. The employer match expense was $75,496 and $78,005 for the years ended December 31, 2017 and 2016, respectively.
NOTE 19 — LETTER OF CREDIT
We are required by one of our lease agreements to maintain a letter of credit of approximately $190,000 through February 2022. To support this letter of credit, we are required to maintain an equivalent cash deposit. As of December 31, 2017, there were no amounts outstanding on the letter of credit. The cash deposit is restricted and classified as a non-current asset. As of December 31, 2017, and 2016, the cash deposit for the letter of credit was $195,792 and $195,499, respectively.
NOTE 20 — SUBSEQUENT EVENTS
During the period from January 1 through April 2, 2018, we received common stock proceeds of $1,615,400 for the sale of 201,925 shares.
| F-26 |
CONDENSED CONSOLIDATED BALANCE SHEETS
| March 31, 2018 | December 31, 2017 | |||||||
| (unaudited) | ||||||||
| ASSETS | ||||||||
| CURRENT ASSETS | ||||||||
| Cash | $ | 2,285,117 | $ | 2,845,798 | ||||
| Accounts receivable, less allowance for doubtful accounts of $40,000 at March 31, 2018 and December 31, 2017 | 668,040 | 468,623 | ||||||
| Inventories | 209,711 | 171,864 | ||||||
| Other current assets | 91,588 | 15,781 | ||||||
| Total current assets | 3,254,456 | 3,502,066 | ||||||
| PROPERTY, PLANT AND EQUIPMENT, NET | 3,266,797 | 2,601,571 | ||||||
| RESTRICTED CASH FOR LETTER OF CREDIT | 195,865 | 195,792 | ||||||
| LEASE DEPOSIT | 20,156 | 20,156 | ||||||
| INTANGIBLE ASSETS, NET | 574,579 | 571,938 | ||||||
| TOTAL ASSETS | $ | 7,311,853 | $ | 6,891,523 | ||||
| LIABILITIES AND STOCKHOLDERS’ EQUITY | ||||||||
| CURRENT LIABILITIES | ||||||||
| Accounts payable and other current liabilities | $ | 1,332,951 | $ | 858,077 | ||||
| Deferred revenue | 189 | 7,298 | ||||||
| Current portion of capital lease obligations | 91,985 | 118,553 | ||||||
| Total current liabilities | 1,425,125 | 983,928 | ||||||
| LONG-TERM LIABILITIES | ||||||||
| Long-term portion of capital lease obligations | 14,639 | 15,527 | ||||||
| Long term debt | 4,869,714 | 4,794,596 | ||||||
| Total long-term liabilities | 4,884,353 | 4,810,123 | ||||||
| TOTAL LIABILITIES | 6,309,478 | 5,794,051 | ||||||
| STOCKHOLDERS’ EQUITY | ||||||||
| Series A convertible preferred stock, 3,000,000 shares authorized, 1,864,956 and 1,857,816 shares issued and outstanding, liquidation value of $22,379,472 and $22,293,792 at March 31, 2018 and December 31, 2017, respectively | 22,002,717 | 21,917,046 | ||||||
| Common stock, no par value, 25,000,000 shares authorized, 2,555,275 and 2,353,350 shares issued and outstanding at March 31, 2018 and December 31, 2017, respectively | 20,741,574 | 19,116,012 | ||||||
| Additional paid-in capital | 7,899,722 | 7,831,958 | ||||||
| Accumulated deficit | (49,641,638 | ) | (47,767,544 | ) | ||||
| Total stockholders’ equity | 1,002,375 | 1,097,472 | ||||||
| TOTAL LIABILITIES AND STOCKHOLDERS’ EQUITY | $ | 7,311,853 | $ | 6,891,523 | ||||
See notes to unaudited condensed consolidated financial statements
| F-27 |
CONDENSED CONSOLIDATED STATEMENTS OF OPERATIONS
(unaudited)
| For the Three Months Ended March 31, | ||||||||
| 2018 | 2017 | |||||||
| (Restated) | ||||||||
| REVENUE | ||||||||
| Product sales | $ | 886,337 | $ | 157,700 | ||||
| Grants | - | 99,489 | ||||||
| Licensing revenue | - | 25,000 | ||||||
| Total revenues | 886,337 | 282,189 | ||||||
| COST OF GOODS SOLD | ||||||||
| Direct costs | 468,191 | 116,770 | ||||||
| Unallocated manufacturing expenses | 746,583 | 371,150 | ||||||
| Total cost of goods sold | 1,214,774 | 487,920 | ||||||
| GROSS LOSS | (328,437 | ) | (205,731 | ) | ||||
| OPERATING EXPENSES | ||||||||
| Research and development | 277,063 | 263,564 | ||||||
| Sales, general and administrative | 1,186,679 | 996,587 | ||||||
| Total operating expenses | 1,463,742 | 1,260,151 | ||||||
| OPERATING LOSS | (1,792,179 | ) | (1,465,882 | ) | ||||
| OTHER INCOME (EXPENSE) | ||||||||
| Interest expense, net | (85,169 | ) | (59,088 | ) | ||||
| Gain from change in fair value of derivative liability – warrants | - | 29,171 | ||||||
| Government incentives, net | 3,253 | (24 | ) | |||||
| Total other expense | (81,916 | ) | (29,941 | ) | ||||
| NET LOSS | $ | (1,874,095 | ) | $ | (1,495,823 | ) | ||
| WEIGHTED AVERAGE NUMBER OF SHARES OUTSTANDING – Basic and diluted | 2,454,314 | 1,920,090 | ||||||
| NET LOSS PER SHARE – Basic and diluted | $ | (0.76 | ) | $ | (0.78 | ) | ||
See notes to unaudited condensed consolidated financial statements
| F-28 |
CONDENSED CONSOLIDATED STATEMENT OF CHANGES IN STOCKHOLDERS’ EQUITY (DEFICIT)
(unaudited)
| Preferred stock (A) | Common stock | Additional paid-in | Accumulated | |||||||||||||||||||||||||
| Shares | Amount | Shares | Amount | capital | deficit | Total | ||||||||||||||||||||||
| Balances, December 31, 2017 | 1,857,816 | $ | 21,917,046 | 2,353,350 | $ | 19,116,012 | $ | 7,831,958 | $ | (47,767,544 | ) | $ | 1,097,472 | |||||||||||||||
| Stock issued for cash | — | — | 201,925 | 1,615,400 | — | — | 1,615,400 | |||||||||||||||||||||
| Stock issuance fees and expenses | — | — | — | (9,838 | ) | — | — | (9,838 | ) | |||||||||||||||||||
| Preferred stock issued to pay capital lease obligations | 7,140 | 85,671 | — | — | — | — | 85,671 | |||||||||||||||||||||
| Stock-based compensation | — | — | — | 20,000 | 67,764 | — | 87,764 | |||||||||||||||||||||
| Net loss | — | — | — | — | — | (1,874,095 | ) | (1,874,095 | ) | |||||||||||||||||||
| Balances, March 31, 2018 | 1,864,956 | $ | 22,002,717 | 2,555,275 | $ | 20,741,574 | $ | 7,899,722 | $ | (49,641,638 | ) | $ | 1,002,375 | |||||||||||||||
See notes to unaudited condensed consolidated financial statements
| F-29 |
CONDENSED CONSOLIDATED STATEMENTS OF CASH FLOWS
(unaudited)
| For the Three Months Ended March 31, | ||||||||
| 2018 | 2017 | |||||||
| (Restated) | ||||||||
| CASH FLOWS FROM OPERATING ACTIVITIES | ||||||||
| Net loss | $ | (1,874,095 | ) | $ | (1,495,823 | ) | ||
| Adjustments to reconcile net loss to net cash used in operating activities: | ||||||||
| Depreciation and amortization | 209,131 | 214,770 | ||||||
| Amortization of intangible assets | 12,934 | 10,590 | ||||||
| Stock-based compensation expense | 87,764 | 88,370 | ||||||
| Non-cash interest expense | 85,973 | 59,480 | ||||||
| Non-cash equipment rent expense | 53,082 | - | ||||||
| Gain from change in fair value of derivative liability – warrants | - | (29,171 | ) | |||||
| Changes in current assets and liabilities: | ||||||||
| Accounts receivable | (199,417 | ) | 14,680 | |||||
| Inventory | (37,847 | ) | 8,229 | |||||
| Other current and non-current assets | (75,881 | ) | 103,558 | |||||
| Accounts payable and other liabilities | 467,765 | 17,576 | ||||||
| NET CASH USED IN OPERATING ACTIVITIES | (1,270,591 | ) | (1,007,741 | ) | ||||
| CASH FLOWS FROM INVESTING ACTIVITIES | ||||||||
| Purchases of property and equipment | (874,357 | ) | (203,664 | ) | ||||
| Purchases of intangible assets | (15,574 | ) | (37,769 | ) | ||||
| NET CASH USED IN INVESTING ACTIVITIES | (889,931 | ) | (241,433 | ) | ||||
| CASH FLOWS FROM FINANCING ACTIVITIES | ||||||||
| Repayments of capital lease obligations | (5,721 | ) | (4,875 | ) | ||||
| Proceeds from issuance of common stock | 1,615,400 | 771,800 | ||||||
| Common stock issuance fees and expenses | (9,838 | ) | (154,413 | ) | ||||
| NET CASH PROVIDED BY FINANCING ACTIVITIES | 1,599,841 | 612,512 | ||||||
| NET DECREASE IN CASH AND CASH EQUIVALENTS | (560,681 | ) | (636,662 | ) | ||||
| CASH AND CASH EQUIVALENTS AT BEGINNING OF PERIOD | 2,845,798 | 1,785,343 | ||||||
| CASH AND CASH EQUIVALENTS AT END OF PERIOD | $ | 2,285,117 | $ | 1,148,681 | ||||
| SUPPLEMENTAL DISCLOSURE OF CASH FLOW INFORMATION: | ||||||||
| Cash paid for interest | $ | 220 | $ | - | ||||
| SUPPLEMENTAL DISCLOSURE OF NON-CASH INVESTING AND FINANCING: | ||||||||
| Value of preferred stock issued for AAOF capital lease obligations | $ | 85,671 | $ | 85,672 | ||||
| Reclassification of derivative liability warrants to equity – ASU 2017-11 (see note 2) | $ | - | $ | 125,481 | ||||
See notes to unaudited condensed consolidated financial statements
| F-30 |
XG SCIENCES, INC.
NOTES TO CONSOLIDATED FINANCIAL STATEMENTS
MARCH 31, 2018 AND 2017
NOTE 1 – NATURE OF BUSINESS AND BASIS OF PRESENTATION
XG Sciences, Inc., a Michigan company located in Lansing, Michigan and its subsidiary, XG Sciences IP, LLC (collectively referred to as “we”, “us”, “our”, or the “Company”) manufactures graphene nanoplatelets made from graphite, using two proprietary manufacturing processes to split natural flakes of crystalline graphite into very small and thin particles, which we sell as xGnP®graphene nanoplatelets. We sell our nanoparticles in the form of bulk powders or dispersions to other companies for use as additives to make composite and other materials with specially engineered characteristics. We also manufacture and sell integrated, value-added products containing these graphene nanoplatelets such as greases, composites, thin sheets, inks and coating formulations that we sell to other companies. Additionally, we license our technology to other companies in exchange for royalties and other fees.
Basis of Presentation
The accompanying interim condensed consolidated financial statements are unaudited and have been prepared in accordance with accounting principles generally accepted in the United States of America (“GAAP”) for interim financial information and the instructions to Form 10-Q and do not include all of the information and footnotes required by GAAP for complete financial statements. All intercompany transactions have been eliminated in consolidation.
Certain information and footnote disclosures normally included in our annual audited consolidated financial statements and accompanying notes have been condensed or omitted in these interim condensed consolidated financial statements. Accordingly, the unaudited condensed consolidated financial statements included herein should be read in conjunction with the audited consolidated financial statements for the year ended December 31, 2017, as filed with the Securities and Exchange Commission (“SEC”) on Form 10-K on April 2, 2018.
The results of operations presented in these interim condensed consolidated financial statements are not necessarily indicative of the results of operations that may be expected for any future periods. In the opinion of management, these unaudited condensed consolidated financial statements include all adjustments and accruals, consisting only of normal recurring adjustments that are necessary for a fair statement of the results of all interim periods reported herein.
NOTE 2 – SUMMARY OF SIGNIFICANT ACCOUNTING POLICIES
Liquidity
We have historically incurred losses from operations and we may continue to generate negative cash flows as we implement our business plan. Our condensed consolidated financial statements are prepared using US GAAP as applicable to a going concern, which contemplates the realization of assets and liquidation of liabilities in the normal course of business.
We filed a Registration Statement on Form S-1 (File No. 333-209131) with the SEC on April 11, 2016 which was declared effective by the SEC on April 13, 2016 (as amended, the “Registration Statement”). The Registration Statement registered up to 3,000,000 shares of common stock at a fixed price of $8.00 per share to the general public in a self-underwritten offering (the “Offering” or our “IPO”). Post-Effective Amendment No. 1 to the Registration Statement was declared effective August 26, 2016, Post-Effective Amendment No. 2 was declared effective August 31, 2016, Post-Effective Amendment No. 3 was declared effective January 17, 2017, and Post-Effective Amendments No. 4 and No. 5 were dated April 12, 2017.Post-Effective Amendment No. 5 wasdeclared effective April 14, 2017. Although we are currently selling shares of our common stock in our Offering pursuant to our Registration Statement, we have not yet listed the company for trading on any exchanges.
In December 2016, we entered into a draw loan note and agreement (the “Dow Facility”) with The Dow Chemical Company (“Dow”) to provide up to $10 million of secured debt financing at an interest rate of 5% per year, drawable at our request under certain conditions. As of May 14, 2018, we had drawn $5.0 million under the Dow Facility. The remaining $5 million will become available to us once we have raised $10 million of equity capital after October 31, 2016. As of May 14, 2018, we have sold 1,276,007 shares of common stock pursuant to our IPO at a price of $8.00 per share for gross proceeds of $10,208,056. However, only $7,007,024 of this amount has been raised during the measurement period beginning November 1, 2016. Thus, we still need to raise $2,992,976 of additional equity capital prior to the remaining $5.0 million under the Dow Facility becoming available to us.
As of May 14, 2018, we had cash on hand of $1,660,600. We believe our cash from increasing commercial sales activity and various financing sources will fund our operations for at least the next 12 months. We intend that the primary means for raising funds will be through our Offering and the additional $5 million of proceeds from the Dow Facility that becomes available to us after we have raised another $3 million of equity capital as noted above; however, we can make no assurances that we will raise such equity capital and be able to access the additional $5 million under the Dow Facility. Taking into account our current cash position as noted above, an additional $3 million in proceeds from our IPO, which would allow us to draw up to $5 million from the Dow Facility, we believe that we can fund our operations including planned capital expenditures for at least the next 12 months. In addition, two of our shareholders have committed to provide up to $4.5 million in funding for the twelve-month period ended March 31, 2019 to the extent the Company is unable to raise such funds from other third parties.
| F-31 |
In the event we are unable to fund our operations from existing cash on hand, operating cash flows, additional borrowings or raising equity capital, we may be forced to reduce our expenses, slow down our growth rate, or discontinue operations. Our condensed consolidated financial statements do not include any adjustments relating to the recoverability and classification of recorded asset amounts or the amounts and classification of liabilities that might be necessary should we be unable to continue as a going concern.
Use of Estimates
The preparation of our condensed consolidated financial statements in conformity with GAAP requires us to make estimates, judgments and assumptions that affect the reported amounts of assets, liabilities, revenue and expenses, together with amounts disclosed in the related notes to the financial statements. Actual results and outcomes may differ from our estimates, judgments and assumptions. Significant estimates, judgments and assumptions used in these condensed consolidated financial statements include, but are not limited to, those related to revenue, accounts receivable and related allowances, contingencies, useful lives and recovery of long-term assets, including intangible assets, income taxes, and the fair value of stock-based compensation. These estimates, judgments, and assumptions are reviewed periodically and the effects of material revisions in estimates are reflected in the financial statements prospectively from the date of the change in estimate.
Inventory
Inventory consists of raw materials, work-in-process and finished goods, all of which are stated at the lower of cost or market. Cost is determined on a first in, first out basis.
| The following amounts were included in inventory at the end of the period: | ||||||||
| March 31, | December 31, | |||||||
| 2018 | 2017 | |||||||
| Raw materials | $ | 79,581 | $ | 39,841 | ||||
| Finished goods | 130,130 | 132,023 | ||||||
| Total | $ | 209,711 | $ | 171,864 | ||||
Derivative Financial Instruments
We do not use derivative instruments to hedge exposures to cash flow, market or foreign currency risk. The terms of convertible preferred stock and convertible notes that we issue are reviewed to determine whether or not they contain embedded derivative instruments that are required by ASC 815: “Derivatives and Hedging” to be accounted for separately from the host contract and recorded at fair value. In addition, freestanding warrants are also reviewed to determine if they achieve equity classification. Certain stock warrants that we issued did not meet the conditions for equity classification at inception and were classified as derivative instrument liabilities measured at fair value.
In July 2017, the FASB issued Accounting Standards Update No. 2017-11, Earnings Per Share (Topic 260), Distinguishing Liabilities From Equity (Topic 480), Derivatives and Hedging (Topic 815) (“ASU 2017-11”). This update changes the classification analysis of certain equity-linked financial instruments with down-round features. We elected to early adopt ASU 2017-11 at September 30, 2017 by applying the standard retrospectively to outstanding financial instruments with a down round feature by means of a cumulative-effect adjustment to the Company’s beginning accumulated deficit as of January 1, 2017. There were 972,720, warrants indexed to Series A Preferred Stock which were originally recorded as derivative liabilities because of their anti-dilution features. We chose to early adopt ASU 2017-11 because it permitted these warrants to be recorded as equity rather than derivative liabilities. The impact to the financial statements for the three months ended March 31, 2017 is as follows:
| For three months ended March 31, 2017 | ||||||||
| As previously | As | |||||||
| reported | Adjusted | |||||||
| Operating loss | $ | (1,465,882 | ) | $ | (1,465,882 | ) | ||
| Other income (expense): | ||||||||
| Incentive refund and interest income | 368 | 368 | ||||||
| Interest expense, net | (59,480 | ) | (59,480 | ) | ||||
| Gain from change in fair value of derivative warrants | 154,652 | 29,171 | ||||||
| Total other income (expense) | 95,540 | (29,941 | ) | |||||
| Net loss | $ | (1,370,342 | ) | $ | (1,495,823 | ) | ||
| F-32 |
Fair Value Measurements
The Company utilizes a valuation hierarchy that prioritizes fair value measurements based on the types of inputs used for the various valuation techniques related to its financial assets and financial liabilities in accordance to Accounting Standards Codification (“ASC”) Topic 820 Fair Value Measurements and Disclosures.
For financial instruments such as cash, accounts payable and other current liabilities, the Company considers the recorded value of such financial instruments approximate to the current fair value because of their short-term nature.
Recent Accounting Pronouncements
ASU No. 2014-09 (ASC 606), Revenue from Contracts with Customers became effective for us beginning with the first quarter of 2018, and we adopted the new accounting standard using the modified retrospective transition approach. The modified retrospective transition approach recognized any changes from the beginning of the year of initial application through retained earnings with no restatement of comparative periods. We will record revenue under ASC 606 at a single point in time, when control is transferred to the customer, which is consistent with past practice. We will continue to apply our current business processes, policies, systems and controls to support recognition and disclosure under the new standard. Based on the results of the evaluation, we have determined that the adoption of the new standard presents no material impact on our consolidated financial statements. Application of the transition requirements of the new standard did not have a material impact on opening retained earnings.
NOTE 3 — WARRANTS AND FINANCING AGREEMENTS
Dow Facility
In December 2016, we entered into the Dow Facility which provides us with up to $10 million of secured debt financing at an interest rate of 5% per year, drawable at our request under certain conditions. We received $2 million at closing and an additional $1 million on July 18, 2017, September 22, 2017 and December 4, 2017, respectively. An additional $5 million becomes available once we have raised $10 million of equity capital after October 31, 2016; however, we can make no assurances that we will raise such equity capital and be able to access the additional $5 million under the Dow Facility. As of May 14, 2018, we have sold 1,276,007 shares of common stock pursuant to our IPO at a price of $8.00 per share for gross proceeds of $10,208,056. However, only $7,007,024 of this amount has been raised during the measurement period beginning November 1, 2016. Thus, we still need to raise $2,992,976 of equity capital prior to the remaining $5.0 million under the Dow Facility becoming available to us.
The Dow Facility is senior to most of our other debt and is secured by all of our assets (Dow is subordinate only to the capital leases with Aspen Advanced Opportunity Fund, LP (“AAOF”). The loan matures on December 1, 2021 (subject to certain mandatory prepayments based on our equity financing activities). Interest is payable beginning January 1, 2017 although we may elect to capitalize interest through January 1, 2019. Dow received warrant coverage of one share of common stock for each $40 in loans received by us, equating to 20% warrant coverage, with an exercise price of $8.00 per share for the warrants issued at closing of the initial $2 million draw. After the initial closing, the strike price of future warrants issued is subject to adjustment if we sell shares of common stock at a lower price. As of March 31, 2018, we had issued 125,000 warrants to Dow, which are exercisable on or before the expiration date of December 1, 2023.
The aforementioned warrants meet the criteria for classification within stockholders’ equity. Proceeds were allocated between the debt and the warrants at their relative fair value. During the fiscal year ended December 31, 2017, we recognized amortization expense of $161,702, and the resulting carrying value of the Dow Facility on our balance sheet as of December 31, 2017 was $4,794,596. During the three months ended March 31, 2018, we recognized amortization expense of $75,118, and the resulting carrying value of the Dow Facility on our balance sheet as of March 31, 2018 was $4,869,714.
| F-33 |
NOTE 4 – STOCK WARRANTS ACCOUNTED FOR AS EQUITY INSTRUMENTS
The following table summarizes the warrants (including the warrants previously accounted for as derivatives) outstanding at March 31, 2018, which are accounted for as equity instruments, all of which are exercisable:
| Date Issued | Expiration Date | Indexed Stock | Exercise Price | Number of Warrants | ||||||||
| 07/01/2009 | 07/01/2019 | Common | $ | 8.00 | 6,000 | |||||||
| 10/08/2012 | 10/08/2027 | Common | $ | 12.00 | 5,000 | |||||||
| 01/15/2014 – 12/31/2014 | 01/15/2024 | Series A Convertible Preferred | $ | 6.40 | 972,720 | |||||||
| 04/30/2015- 05/26/2015 | 04/30/2022 | Common | $ | 16.00 | 218,334 | |||||||
| 06/30/2015 | 06/30/2022 | Common | $ | 16.00 | 6,563 | |||||||
| 12/31/2015 | 12/31/2020 | Common | $ | 8.00 | 20,625 | |||||||
| 03/31/2016 | 03/31/2021 | Common | $ | 10.00 | 10,600 | |||||||
| 04/30/2016 | 04/30/2021 | Common | $ | 10.00 | 895 | |||||||
| 12/14/2016 | 12/01/2023 | Common | $ | 8.00 | 50,000 | |||||||
| 07/18/2017 | 12/01/2023 | Common | $ | 8.00 | 25,000 | |||||||
| 09/22/2017 | 12/01/2023 | Common | $ | 8.00 | 25,000 | |||||||
| 12/04/2017 | 12/01/2023 | Common | $ | 8.00 | 25,000 | |||||||
| 1,365,737 | ||||||||||||
The warrants indexed to Series A Convertible Preferred Stock are currently exercisable and are exchangeable into 1.875 shares of common stock.
NOTE 5 — STOCKHOLDERS’ EQUITY (DEFICIT)
Common Stock
The Company is authorized to issue 25,000,000 shares of common stock, no par value per share of which 2,555,275 and 2,353,350 shares were issued and outstanding as of March 31, 2018 and December 31, 2017, respectively.
During the three months ended March 31, 2018, the Company issued 201,925 shares of common stock pursuant to the Offering. As of May 14, 2018, the Company has sold 1,276,007 shares of common stock in its IPO at a price of $8.00 per share for gross proceeds of $10,208,056.
Series A Convertible Preferred Stock
The Company is authorized to issue up to 3,000,000 shares of Series A Convertible Preferred Stock (the “Series A Preferred”). Each share of the Series A Preferred, which has a liquidation preference of $12.00 per share, is convertible at any time, at the option of the holder, into one share of Common Stock at the lower of: (a) $12.00 per share, or (b) 80% of the price at which the Company sells any equity or equity-linked securities in the future. The Series A Preferred also contains typical anti-dilution provisions that provide for adjustment of the conversion price to reflect stock splits, stock dividends, or similar events. The Series A Preferred is subject to mandatory conversion into Common Stock upon the listing of the Company’s common stock on a Qualified National Exchange. However, the Series A Preferred is not subject to the mandatory conversion until all outstanding convertible securities are also converted into common stock. The Series A Preferred ranks senior to all other equity or equity equivalent securities of the Company other than those securities which are explicitly senior or pari passu in rights and liquidation preference to the Series A Preferred and pari passu with the Company’s Series B Preferred Stock.
The Company issued 1,456,126 shares of Series A Preferred in connection with the conversion of certain convertible notes on December 31, 2015.
In December 2015, the conversion price of the Series A Preferred was reduced from $12.00 to $6.40 (80% of $8.00), and thus, each share of Series A Preferred Stock is convertible into 1.875 shares of common stock.
As of March 31, 2018, and December 31, 2017, the Company had 1,864,956 and 1,857,816 shares of Series A Preferred Stock issued and outstanding, respectively.
During the three months ended March 31, 2018, the Company issued 7,140 shares of Series A Preferred to AAOF as payment under the terms of their Master Leasing Agreement.
| F-34 |
Series B Convertible Preferred Stock
As of March 31, 2018, and December 31, 2017, 1,500,000 shares have been designated as Series B Convertible Preferred Stock (“Series B Preferred”), of which no shares were issued and outstanding. Each share of the Series B Preferred, which has a liquidation preference of $16.00 per share, is convertible at any time, at the option of the holder, into one share of common stock at $16.00 per share. The Series B Preferred also contains typical anti-dilution provisions that provide for adjustment of the conversion price to reflect stock splits, stock dividends, or similar events. Each share of Series B Preferred is subject to mandatory conversion into common stock at the then-effective Series B conversion rate upon the public listing by the Company of its common stock on a Qualified National Exchange. However, the Series B Preferred is not subject to the mandatory conversion until all outstanding convertible securities are also converted into common stock. The Series B Preferred ranks senior to all other equity or equity equivalent securities of the Company other than those securities which are explicitly senior or pari passu in rights and liquidation preference to the Series B Preferred and pari passu with the Company’s Series A Preferred.
NOTE 6 – EQUITY INCENTIVE PLAN
We previously established the 2007 Stock Option Plan (the “2007 Plan”), which was scheduled to expire on October 30, 2017 and under which we granted key employees and directors options to purchase shares of our common stock at not less than fair market value as of the grant date. On May 4, 2017, the Board approved the 2017 Equity Incentive Plan (the “2017 Plan”) to replace the 2007 Plan, which became effective upon the approval of the stockholders holding a majority of the voting power in the Company on July 18, 2017. The 2017 Plan replaced the 2007 Plan and authorizes us to grant awards (stock options and restricted stock) up to a maximum of 1,200,000 shares of our common stock.
On July 24, 2017, certain stock options from the 2007 Plan were cancelled and replacement stock options were awarded. The replacement stock option awards have an exercise price of $8.00 per share and a seven-year term. Fifty percent of such awards vested on the date of grant with the remaining vesting over a 4-year period, subject to certain other terms. Each option holder received options equal to 150% of the number of cancelled stock options.
On August 10, 2017, the Company granted stock options and restricted stock to each of its Board members as part of its Board compensation package. Each of the 4 independent Board members received 2,500 stock options and 2,500 shares of restricted stock for Board services. The options were granted at a price of $8.00 per share and had an aggregate grant date fair value of $26,120. The options vest ratably over a four-year period beginning on the one-year anniversary. The restricted stock issued to the Board members has an aggregate fair value of $80,000 and vest ratably in arrears over four quarters on the last day of each fiscal quarter following the grant date. As of March 31, 2018, 7,500 shares of restricted stock had vested, resulting in total compensation expense of $60,000.
A summary of the stock option activity for the three months ended March 31, 2018 is as follows:
| Weighted | ||||||||
| Number | Average | |||||||
| Of | Exercise | |||||||
| Options | Price | |||||||
| Options outstanding at December 31, 2017 | 677,125 | $ | 8.00 | |||||
| Changes during the period: | ||||||||
| Expired | - | - | ||||||
| New Options Granted – at market price | 10,000 | 8.00 | ||||||
| Exercised | — | — | ||||||
| Options outstanding at March 31, 2018 | 687,125 | $ | 8.00 | |||||
| Options exercisable at March 31, 2018 | 337,158 | $ | 8.00 | |||||
All options granted thus far under the 2017 Plan have an exercise price of $8.00 per share and vesting of the options ranges from immediate to 20% per year, with most options vesting on a straight-line basis over a four-year period from the date of grant. The options expire in seven years from the date of grant.
During the three months ended March 31, 2018, the Company granted 10,000 employee stock options with an aggregate grant date fair value of $28,755. The fair value of the options granted was estimated on the date of grant using the Black Scholes option-pricing model using the following assumptions: Stock price: $8.00, Exercise Price: $8.00, Expected Term: 4.75, Volatility: 37.34%, Risk free rate: 2.65%, Dividend rate: 0%. As of March 31, 2018, 687,125 stock options and 10,000 shares of restricted stock awards were outstanding under our 2017 Plan.
| F-35 |
Stock-based compensation expense was $87,764 and $88,370 for the three months ended March 31, 2018 and 2017, respectively. As of March 31, 2018, there was approximately $895,00 in unrecognized compensation cost related to the options granted under the 2017 plan.
NOTE 7 – CAPITAL LEASES
As of March 31, 2018, and December 31, 2017, we have capital lease obligations as follows:
| March 31, 2018 | December 31, 2017 | |||||||
| Capital lease obligations | $ | 114,970 | $ | 149,120 | ||||
| Unamortized warrant discount | (8,346 | ) | (15,040 | ) | ||||
| Net obligations | 106,624 | 134,080 | ||||||
| Short-term portion of obligations | (91,985 | ) | (118,553 | ) | ||||
| Long-term portion of obligations | $ | 14,639 | $ | 15,527 | ||||
NOTE 8 —Customer, Supplier, country, and Product Concentrations
Grants and Licensing Revenue Concentration
There was no licensing or grant revenue to report during the first quarter of 2018. Two grantors accounted for 94% and 6% respectively of total grant revenue reported during the first quarter of 2017. The company’s licensing revenue in the first quarter of 2017 came from one licensor.
Product Concentration
During the first quarter of 2018 and 2017, we had concentrations of product revenue from only one product that was greater than 10% of total product revenues. Revenue from one of the Company’s graphene nanoplatelets materials, Grade C 500 m2/g, was 83% as of March 31, 2018 and 29% as of March 31, 2017. We attempt to minimize the risk associated with product concentrations by continuing to develop new products to add to our portfolio.
Customer Concentration
During the first quarter of 2018, we had one customer whose purchases accounted for 83% of total product revenues. During the first quarter of 2017 we had two customers that represented 29% and 22 % of total product revenues. At March 31, 2018 and 2017, there were two customers who each had an accounts receivable balance greater than 10% of our total outstanding receivable balance.
Country Concentration
We sell our products on a worldwide basis. Revenue derived from customers outside of the U.S. during the first quarter of 2018 was 3% as compared with 40% during the first quarter of 2017. All of these sales are denominated in U.S. dollars.
As of March 31, 2018, there were no foreign countries with greater than 10% of product revenue. During the quarter ended March 31, 2017, two countries, the United Kingdom and South Korea accounted for approximately 24% and 16%, respectively, of total product revenue.
Suppliers
We buy raw materials used in manufacturing from several sources. These materials are available from a large number of sources. A change in suppliers has no material effect on the Company’s operations. We did not have purchases from any suppliers that were greater than 10% of total purchases during the quarters ended March 31, 2018 and 2017.
NOTE 9 - RELATED PARTY TRANSACTIONS
We have a licensing agreement for exclusive use of patents and pending patents with Michigan State University (“MSU”), a shareholder of the Company via the MSU Foundation. We incurred $12,500 of licensing expense in each of the three month periods ended March 31, 2018 and 2017.
We have also entered into product licensing agreements with certain other shareholders. No royalty revenue or expenses have been recognized related to these agreements during the three months ended March 31, 2018. For the three months ended March 31, 2017, $25,000 of royalty revenue was recorded from POSCO, a shareholder.
| F-36 |
During each of the three months ended March 31, 2018 and 2017 we issued 7,140 shares of Series A Preferred Stock to AAOF as payment for lease financing obligations under the terms of the Master Lease Agreement, dated March 18, 2013.
NOTE 10 – SUBSEQUENT EVENTS
During the period from April 1 through May 14, 2018, we received common stock proceeds of $858,000 for the sale of 107,250 shares of common stock in our IPO.
| F-37 |
YOU SHOULD RELY ONLY ON THE INFORMATION CONTAINED IN THIS DOCUMENT OR THAT WE HAVE REFERRED YOU TO. WE HAVE NOT AUTHORIZED ANYONE TO PROVIDE YOU WITH INFORMATION THAT IS DIFFERENT. THIS PROSPECTUS IS NOT AN OFFER TO SELL COMMON STOCK AND IS NOT SOLICITING AN OFFER TO BUY COMMON STOCK IN ANY STATE WHERE THE OFFER OR SALE IS NOT PERMITTED.
1,723,993 SHARES OF COMMON STOCK
Until April 13, 2019, all dealers that effect transactions in these securities, whether or not participating in this offering, may be required to deliver a prospectus. This is in addition to a dealer’s obligation to deliver a prospectus when acting as underwriter and with respect to their unsold allotments or subscriptions.
The Date of this Prospectus is June 26, 2018.
| F-38 |