UNITED STATES
SECURITIES AND EXCHANGE COMMISSION
WASHINGTON, D.C. 20549
FORM N-CSR
CERTIFIED SHAREHOLDER REPORT OF REGISTERED
MANAGEMENT INVESTMENT COMPANIES
Investment Company Act file number 811-22208
Valued Advisers Trust
(Exact name of registrant as specified in charter)
Ultimus Fund Solutions, LLC, 225 Pictoria Drive, Suite 450, Cincinnati, OH 45246 |
| (Address of principal executive offices) | | (Zip code) |
Capitol Services, Inc.
108 Lakeland Ave., Dover, Delaware 19901
(Name and address of agent for service)
With Copies to:
Terry Davis
DLA Piper LLP
One Atlantic Center
1201 West Peachtree Street, Suite 2900
Atlanta, GA 30309
| Registrant’s telephone number, including area code: | 513-587-3400 | |
| Date of fiscal year end: | 5/31/25 | |
| | | |
| Date of reporting period: | 11/30/2024 | |
Item 1. Reports to Stockholders.
(a)
Institutional Class (BFSIX)
Semi-Annual Shareholder Report - November 30, 2024
This semi-annual shareholder report contains important information about BFS Equity Fund for the period of June 1, 2024 to November 30, 2024. You can find additional information about the Fund at https://funddocs.filepoint.com/bfs/. You can also request this information by contacting us at (855) 575-2430.
What were the Fund’s costs for the last six months?
(based on a hypothetical $10,000 investment)
| Class Name | Costs of a $10,000 investment | Costs paid as a percentage of a $10,000 investment |
|---|
| Institutional | $53 | 0.99% |
|---|
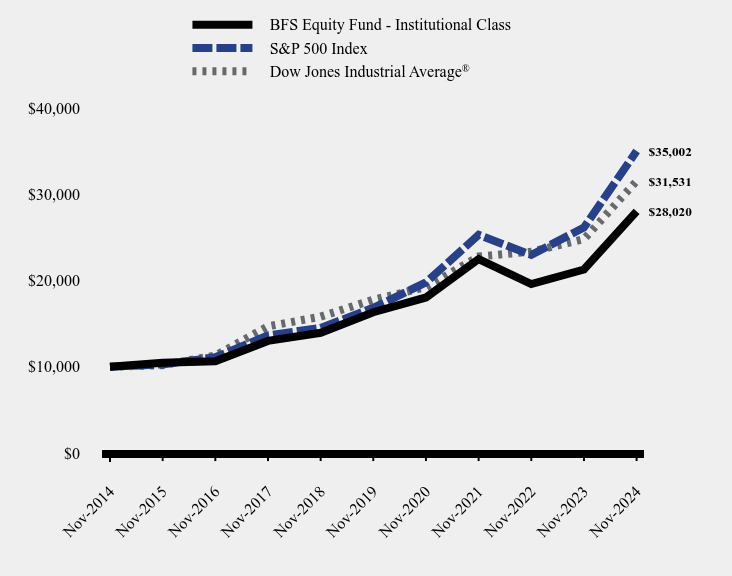
How has the Fund performed over the last ten years?
Total Return Based on $10,000 Investment
| BFS Equity Fund - Institutional Class | S&P 500 Index | Dow Jones Industrial Average® |
|---|
| Nov-2014 | $10,000 | $10,000 | $10,000 |
|---|
| Nov-2015 | $10,475 | $10,275 | $10,187 |
|---|
| Nov-2016 | $10,631 | $11,103 | $11,299 |
|---|
| Nov-2017 | $12,997 | $13,642 | $14,690 |
|---|
| Nov-2018 | $13,940 | $14,498 | $15,810 |
|---|
| Nov-2019 | $16,328 | $16,834 | $17,783 |
|---|
| Nov-2020 | $18,033 | $19,773 | $19,221 |
|---|
| Nov-2021 | $22,486 | $25,294 | $22,780 |
|---|
| Nov-2022 | $19,589 | $22,964 | $23,345 |
|---|
| Nov-2023 | $21,271 | $26,142 | $24,791 |
|---|
| Nov-2024 | $28,020 | $35,002 | $31,531 |
|---|
Average Annual Total Returns
| 1 Year | 5 Years | 10 Years |
|---|
| BFS Equity Fund - Institutional Class | 31.73% | 11.41% | 10.85% |
|---|
| S&P 500 Index | 33.89% | 15.77% | 13.35% |
|---|
Dow Jones Industrial Average® | 27.19% | 12.14% | 12.17% |
|---|
The Fund's past performance is not a good predictor of how the Fund will perform in the future. The graph and table do not reflect the deduction of taxes that a shareholder would pay on fund distributions or redemption of fund shares.
- Net Assets$62,628,549
- Number of Portfolio Holdings42
- Advisory Fee (net of waivers)$167,236
- Portfolio Turnover6%
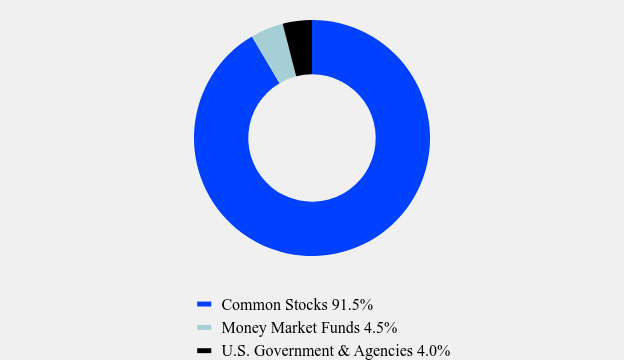
Asset Weighting (% of total investments)
| Value | Value |
|---|
| Common Stocks | 91.5% |
| Money Market Funds | 4.5% |
| U.S. Government & Agencies | 4.0% |
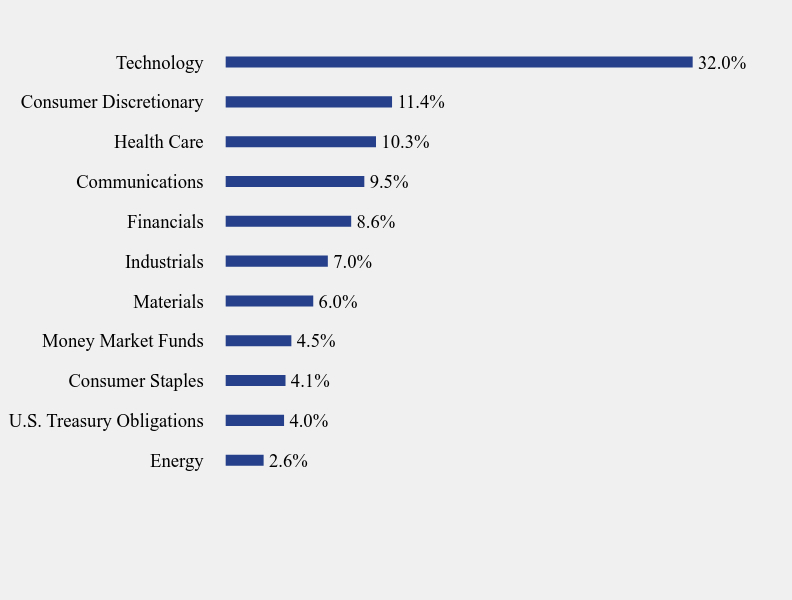
What did the Fund invest in?
Sector Weighting (% of net assets)
| Value | Value |
|---|
| Energy | 2.6% |
| U.S. Treasury Obligations | 4.0% |
| Consumer Staples | 4.1% |
| Money Market Funds | 4.5% |
| Materials | 6.0% |
| Industrials | 7.0% |
| Financials | 8.6% |
| Communications | 9.5% |
| Health Care | 10.3% |
| Consumer Discretionary | 11.4% |
| Technology | 32.0% |
Top 10 Holdings (% of net assets)
| Holding Name | % of Net Assets |
| Microsoft Corp. | 6.1% |
| NVIDIA Corp. | 5.5% |
| Alphabet, Inc., Class A | 5.4% |
| Apple, Inc. | 4.7% |
| Fidelity Investments Money Market Government Portfolio, Institutional Class | 4.5% |
| Meta Platforms, Inc., Class A | 4.1% |
| JPMorgan Chase & Co. | 4.0% |
| Amazon.com, Inc. | 4.0% |
| Fiserv, Inc. | 3.5% |
| Costco Wholesale Corp. | 3.1% |
No material changes occurred during the period ended November 30, 2024.
BFS Equity Fund - Institutional (BFSIX)
Semi-Annual Shareholder Report - November 30, 2024
Where can I find additional information about the Fund?
Additional information is available on the Fund's website (https://funddocs.filepoint.com/bfs/), including its:
Prospectus
Financial information
Holdings
Proxy voting information
Institutional Class (LSOFX)
Semi-Annual Shareholder Report - November 30, 2024
This semi-annual shareholder report contains important information about LS Opportunity Fund for the period of June 1, 2024 to November 30, 2024. You can find additional information about the Fund at https://funddocs.filepoint.com/lsofx. You can also request this information by contacting us at (877) 336-6763.
What were the Fund’s costs for the last six months?
(based on a hypothetical $10,000 investment)
| Class Name | Costs of a $10,000 investment | Costs paid as a percentage of a $10,000 investment |
|---|
| Institutional | $131 | 2.53% |
|---|
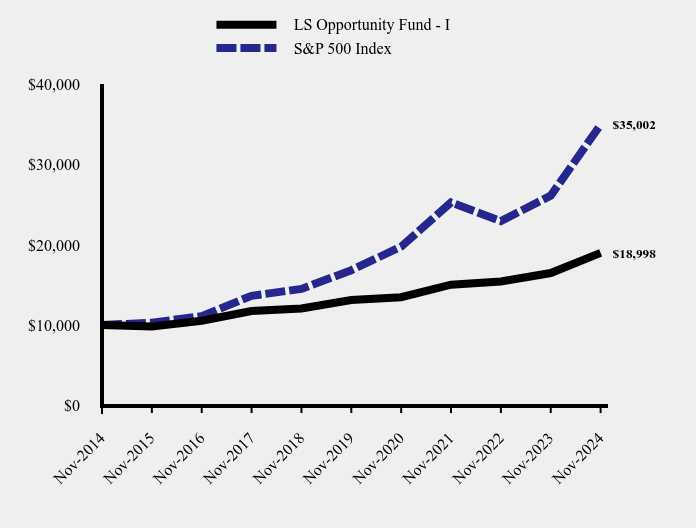
How has the Fund performed over the last ten years?
Total Return Based on $10,000 Investment
| LS Opportunity Fund - I | S&P 500 Index |
|---|
| Nov-2014 | $10,000 | $10,000 |
|---|
| Nov-2015 | $9,800 | $10,275 |
|---|
| Nov-2016 | $10,520 | $11,103 |
|---|
| Nov-2017 | $11,733 | $13,642 |
|---|
| Nov-2018 | $12,066 | $14,498 |
|---|
| Nov-2019 | $13,104 | $16,834 |
|---|
| Nov-2020 | $13,466 | $19,773 |
|---|
| Nov-2021 | $15,021 | $25,294 |
|---|
| Nov-2022 | $15,416 | $22,964 |
|---|
| Nov-2023 | $16,478 | $26,142 |
|---|
| Nov-2024 | $18,998 | $35,002 |
|---|
Average Annual Total Returns
| 1 Year | 5 years | 10 Years |
|---|
| LS Opportunity Fund - I | 15.29% | 7.71% | 6.63% |
|---|
| S&P 500 Index | 33.89% | 15.77% | 13.35% |
|---|
The Fund's past performance is not a good predictor of how the Fund will perform in the future. The graph and table do not reflect the deduction of taxes that a shareholder would pay on fund distributions or redemption of fund shares.
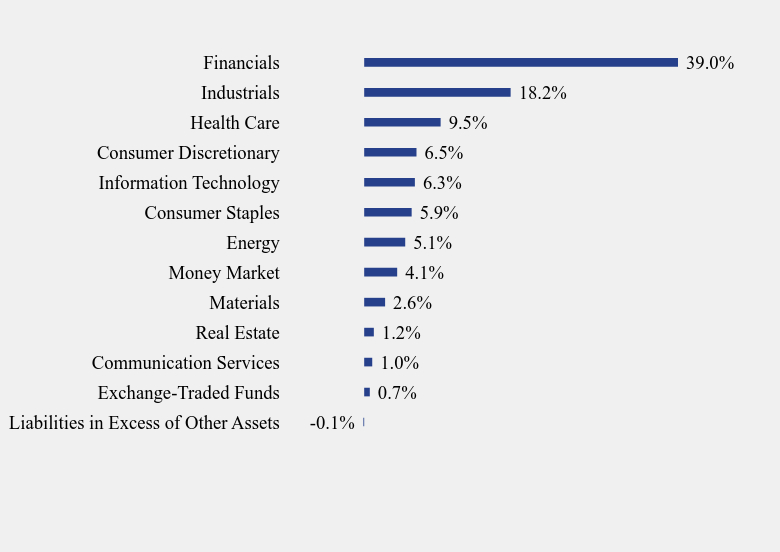
What did the Fund invest in?
- Net Assets$208,894,125
- Number of Portfolio Holdings96
- Advisory Fee (net of waivers)$1,724,504
- Portfolio Turnover26%
Long Sector Weighting (% of net assets)
| Value | Value |
|---|
| Liabilities in Excess of Other Assets | -0.1% |
| Exchange-Traded Funds | 0.7% |
| Communication Services | 1.0% |
| Real Estate | 1.2% |
| Materials | 2.6% |
| Money Market | 4.1% |
| Energy | 5.1% |
| Consumer Staples | 5.9% |
| Information Technology | 6.3% |
| Consumer Discretionary | 6.5% |
| Health Care | 9.5% |
| Industrials | 18.2% |
| Financials | 39.0% |
Top 10 Holdings (% of net assets)
| Holding Name | % of Net Assets |
| Invesco Treasury Portfolio, Institutional Class | 4.1% |
| Progressive Corp. (The) | 4.1% |
| Eaton Corp. PLC | 3.7% |
| Brown & Brown, Inc. | 3.5% |
| Fairfax Financial Holdings Ltd. | 3.4% |
| Abbott Laboratories | 3.1% |
| Leidos Holdings, Inc. | 2.6% |
| PNC Financial Services Group, Inc. (The) | 2.6% |
| Arthur J. Gallagher & Co. | 2.4% |
| Citigroup, Inc. | 2.4% |
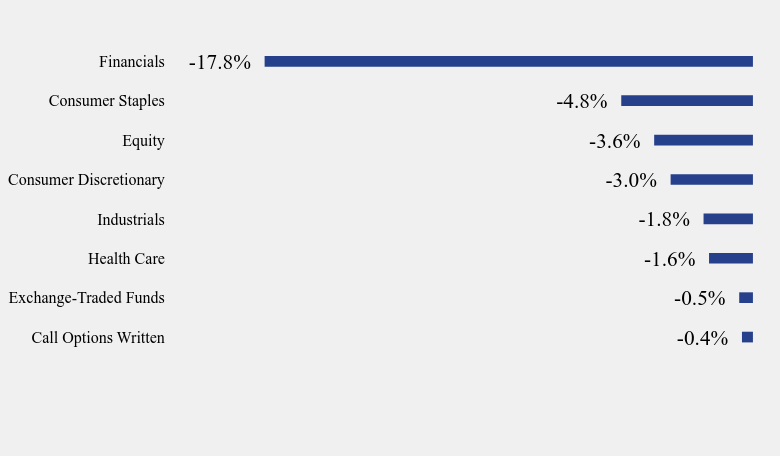
Short Sector Weighting (% of net assets)
| Value | Value |
|---|
| Call Options Written | -0.4% |
| Exchange-Traded Funds | -0.5% |
| Health Care | -1.6% |
| Industrials | -1.8% |
| Consumer Discretionary | -3.0% |
| Equity | -3.6% |
| Consumer Staples | -4.8% |
| Financials | -17.8% |
No material changes occurred during the period ended November 30, 2024.
Where can I find additional information about the Fund?
Additional information is available on the Fund's website (https://funddocs.filepoint.com/lsofx), including its:
Prospectus
Financial information
Holdings
Proxy voting information
Semi-Annual Shareholder Report - November 30, 2024
(b) Not applicable
Item 2. Code of Ethics.
Not Applicable – disclosed with annual report.
Item 3. Audit Committee Financial Expert.
Not Applicable – disclosed with annual report.
Item 4. Principal Accountant Fees and Services.
Not Applicable – disclosed with annual report.
Item 5. Audit Committee of Listed Registrants.
Not Applicable – disclosed with annual report.
Item 6. Investments.
The Registrant’s schedule of investments in unaffiliated issuers is included in the Financial Statements under Item 7 of this form.
Item 7. Financial Statements and Financial Highlights for Open-End Management Investment Companies.
(a)
BFS Equity Fund
FINANCIAL STATEMENTS
November 30, 2024 - (Unaudited)

185 Asylum Street ● City Place II ● Hartford, CT 06103 ● (855) 575-2430
BFS Equity Fund
Schedule of Investments
November 30, 2024 (Unaudited)
| | | Shares | | | Fair Value | |
| COMMON STOCKS — 91.56% | | | | | | | | |
| Aerospace & Defense — 1.56% | | | | | | | | |
| Northrop Grumman Corp. | | | 2,000 | | | $ | 979,300 | |
| | | | | | | | | |
| Banking — 5.50% | | | | | | | | |
| Bank of America Corp. | | | 20,000 | | | | 950,200 | |
| JPMorgan Chase & Co. | | | 10,000 | | | | 2,497,200 | |
| | | | | | | | 3,447,400 | |
| Beverages — 1.04% | | | | | | | | |
| PepsiCo, Inc. | | | 4,000 | | | | 653,800 | |
| | | | | | | | | |
| Biotech & Pharmaceuticals — 0.84% | | | | | | | | |
| Zoetis, Inc., Class A | | | 3,000 | | | | 525,750 | |
| | | | | | | | | |
| Building Products — 1.24% | | | | | | | | |
| Carrier Global Corp. | | | 10,000 | | | | 773,700 | |
| | | | | | | | | |
| Chemicals — 5.37% | | | | | | | | |
| Air Products & Chemicals, Inc. | | | 5,000 | | | | 1,671,650 | |
| Ecolab, Inc. | | | 2,000 | | | | 497,540 | |
| Sherwin-Williams Co. (The) | | | 3,000 | | | | 1,192,200 | |
| | | | | | | | 3,361,390 | |
| E-Commerce Discretionary — 3.99% | | | | | | | | |
| Amazon.com, Inc.(a) | | | 12,000 | | | | 2,494,680 | |
| | | | | | | | | |
| Health Care Facilities & Services — 3.08% | | | | | | | | |
| IQVIA Holdings, Inc.(a) | | | 2,000 | | | | 401,680 | |
| UnitedHealth Group, Inc. | | | 2,500 | | | | 1,525,500 | |
| | | | | | | | 1,927,180 | |
| Home Construction — 2.02% | | | | | | | | |
| D.R. Horton, Inc. | | | 7,500 | | | | 1,265,850 | |
| | | | | | | | | |
| Insurance — 1.86% | | | | | | | | |
| Marsh & McLennan Cos., Inc. | | | 5,000 | | | | 1,166,150 | |
| | | | | | | | | |
| Internet Media & Services — 9.52% | | | | | | | | |
| Alphabet, Inc., Class A | | | 20,000 | | | | 3,379,000 | |
| Meta Platforms, Inc., Class A | | | 4,500 | | | | 2,584,440 | |
| | | | | | | | 5,963,440 | |
| Machinery — 4.19% | | | | | | | | |
| Caterpillar, Inc. | | | 1,000 | | | | 406,110 | |
| Deere & Co. | | | 2,500 | | | | 1,164,750 | |
| Parker-Hannifin Corp. | | | 1,500 | | | | 1,054,350 | |
| | | | | | | | 2,625,210 | |
| Medical Equipment & Devices — 5.33% | | | | | | | | |
| Danaher Corp. | | | 6,000 | | | | 1,438,140 | |
| Stryker Corp. | | | 2,500 | | | | 980,375 | |
| Thermo Fisher Scientific, Inc. | | | 1,750 | | | | 926,853 | |
| | | | | | | | 3,345,368 | |
| Metals & Mining — 0.67% | | | | | | | | |
| Agnico Eagle Mines Ltd. | | | 5,000 | | | | 422,100 | |
See accompanying notes which are an integral part of these financial statements.
BFS Equity Fund
Schedule of Investments (continued)
November 30, 2024 (Unaudited)
| | | Shares | | | Fair Value | |
| COMMON STOCKS — 91.56% - continued | | | | | | | | |
| Oil & Gas Producers — 2.59% | | | | | | | | |
| ConocoPhillips | | | 15,000 | | | $ | 1,625,100 | |
| | | | | | | | | |
| Pharmaceuticals — 1.05% | | | | | | | | |
| Pfizer, Inc. | | | 25,000 | | | | 655,250 | |
| | | | | | | | | |
| Retail - Consumer Staples — 3.11% | | | | | | | | |
| Costco Wholesale Corp. | | | 2,000 | | | | 1,943,760 | |
| | | | | | | | | |
| Retail - Discretionary — 2.61% | | | | | | | | |
| Lowe’s Companies, Inc. | | | 6,000 | | | | 1,634,580 | |
| | | | | | | | | |
| Semiconductors — 7.46% | | | | | | | | |
| Broadcom, Inc. | | | 7,500 | | | | 1,215,600 | |
| NVIDIA Corp. | | | 25,000 | | | | 3,456,250 | |
| | | | | | | | 4,671,850 | |
| Software — 12.27% | | | | | | | | |
| Adobe, Inc.(a) | | | 2,000 | | | | 1,031,860 | |
| Microsoft Corp. | | | 9,000 | | | | 3,811,139 | |
| Oracle Corp. | | | 10,000 | | | | 1,848,400 | |
| Salesforce, Inc. | | | 3,000 | | | | 989,970 | |
| | | | | | | | 7,681,369 | |
| Specialty Finance — 1.22% | | | | | | | | |
| American Express Co. | | | 2,500 | | | | 761,700 | |
| | | | | | | | | |
| Specialty Retail — 2.75% | | | | | | | | |
| Home Depot, Inc. (The) | | | 4,000 | | | | 1,716,520 | |
| | | | | | | | | |
| Technology Hardware — 4.74% | | | | | | | | |
| Apple, Inc. | | | 12,500 | | | | 2,966,625 | |
| | | | | | | | | |
| Technology Services — 7.55% | | | | | | | | |
| Automatic Data Processing, Inc. | | | 3,000 | | | | 920,790 | |
| Fiserv, Inc.(a) | | | 10,000 | | | | 2,209,600 | |
| MasterCard, Inc., Class A | | | 3,000 | | | | 1,598,820 | |
| | | | | | | | 4,729,210 | |
| | | | | | | | | |
| Total Common Stocks (Cost $24,115,880) | | | | | | | 57,337,282 | |
| | | Principal
Amount | | | | |
| U.S. GOVERNMENT & AGENCIES — 3.97% | | | | | | | | |
| United States Treasury Bill, 5.00%, 12/5/2024 | | $ | 1,500,000 | | | | 1,499,445 | |
| United States Treasury Bill, 4.44%, 3/4/2025 | | | 1,000,000 | | | | 988,798 | |
| Total U.S. Government & Agencies (Cost $2,487,877) | | | | | | | 2,488,243 | |
See accompanying notes which are an integral part of these financial statements.
BFS Equity Fund
Schedule of Investments (continued)
November 30, 2024 (Unaudited)
| | | Shares | | | Fair Value | |
| MONEY MARKET FUNDS — 4.47% | | | | | | | | |
| Fidelity Investments Money Market Government Portfolio, Institutional Class, 4.55%(b) | | | 2,800,313 | | | $ | 2,800,313 | |
| Total Money Market Funds (Cost $2,800,313) | | | | | | | 2,800,313 | |
| | | | | | | | | |
| Total Investments — 100.00% (Cost $29,404,070) | | | | | | | 62,625,838 | |
| Other Assets in Excess of Liabilities — 0.00% | | | | | | | 2,711 | |
| NET ASSETS — 100.00% | | | | | | $ | 62,628,549 | |
| (a) | Non-income producing security. |
| (b) | Rate disclosed is the seven day effective yield as of November 30, 2024. |
See accompanying notes which are an integral part of these financial statements.
BFS Equity Fund
Statement of Assets and Liabilities
November 30, 2024 - (Unaudited)
| Assets | | | | |
| Investments in securities at fair value (cost $29,404,070) (Note 3) | | $ | 62,625,838 | |
| Dividends and interest receivable | | | 43,069 | |
| Prepaid expenses | | | 18,801 | |
| Total Assets | | | 62,687,708 | |
| Liabilities | | | | |
| Payable to Adviser (Note 4) | | | 29,847 | |
| Payable to Administrator (Note 4) | | | 8,450 | |
| Other accrued expenses | | | 20,862 | |
| Total Liabilities | | | 59,159 | |
| Net Assets | | $ | 62,628,549 | |
| Net Assets consist of: | | | | |
| Paid-in capital | | $ | 28,040,692 | |
| Accumulated earnings | | | 34,587,857 | |
| Net Assets | | $ | 62,628,549 | |
| Shares outstanding (unlimited number of shares authorized, no par value) | | | 2,410,274 | |
| Net asset value, offering and redemption price per share (Note 2) | | $ | 25.98 | |
See accompanying notes which are an integral part of these financial statements.
BFS Equity Fund
Statement of Operations
November 30, 2024 - (Unaudited)
| Investment Income | | | | |
| Dividend income (net of foreign taxes withheld of $600) | | $ | 299,253 | |
| Interest income | | | 55,848 | |
| Total investment income | | | 355,101 | |
| Expenses | | | | |
| Investment Adviser fees (Note 4) | | | 219,915 | |
| Administration fees (Note 4) | | | 24,075 | |
| Registration expenses | | | 13,974 | |
| Fund accounting fees (Note 4) | | | 12,911 | |
| Legal fees | | | 11,280 | |
| Transfer agent fees (Note 4) | | | 9,296 | |
| Audit and tax preparation fees | | | 9,274 | |
| Compliance services fees (Note 4) | | | 7,939 | |
| Trustee fees | | | 7,593 | |
| Printing and postage expenses | | | 5,373 | |
| Custodian fees | | | 2,264 | |
| Insurance expenses | | | 1,996 | |
| Miscellaneous | | | 18,080 | |
| Total expenses | | | 343,970 | |
| Fees contractually waived by Adviser (Note 4) | | | (52,679 | ) |
| Net operating expenses | | | 291,291 | |
| Net investment income | | | 63,810 | |
| Net Realized and Change in Unrealized Gain (Loss) on Investments | | | | |
| Net realized gain on: | | | | |
| Investment securities transactions | | | 1,125,666 | |
| Net change in unrealized appreciation on investments | | | 6,668,791 | |
| Net realized and change in unrealized gain on investments | | | 7,794,457 | |
| Net increase in net assets resulting from operations | | $ | 7,858,267 | |
See accompanying notes which are an integral part of these financial statements.
BFS Equity Fund
Statements of Changes in Net Assets
November 30, 2024
| | | For the
Six Months Ended
November 30,
2024 | | | For the
Year Ended
May 31,
2024 | |
| | | (Unaudited) | | | | |
| Increase (Decrease) in Net Assets due to: | | | | | | | | |
| Operations | | | | | | | | |
| Net investment income | | $ | 63,810 | | | $ | 265,504 | |
| Net realized gain on investment securities transactions | | | 1,125,666 | | | | 236,646 | |
| Net change in unrealized appreciation on investments | | | 6,668,791 | | | | 10,963,647 | |
| Net increase in net assets resulting from operations | | | 7,858,267 | | | | 11,465,797 | |
| Distributions to Shareholders from Earnings (Note 2) | | | — | | | | (244,163 | ) |
| Capital Transactions | | | | | | | | |
| Proceeds from shares sold | | | 1,172,252 | | | | 1,653,417 | |
| Reinvestment of distributions | | | — | | | | 228,207 | |
| Amount paid for shares redeemed | | | (1,406,810 | ) | | | (3,680,763 | ) |
| Net decrease in net assets resulting from capital transactions | | | (234,558 | ) | | | (1,799,139 | ) |
| Total Increase in Net Assets | | | 7,623,709 | | | | 9,422,495 | |
| Net Assets | | | | | | | | |
| Beginning of period | | | 55,004,840 | | | | 45,582,345 | |
| End of period | | $ | 62,628,549 | | | $ | 55,004,840 | |
| Share Transactions | | | | | | | | |
| Shares sold | | | 48,107 | | | | 80,926 | |
| Shares issued in reinvestment of distributions | | | — | | | | 11,292 | |
| Shares redeemed | | | (58,706 | ) | | | (183,902 | ) |
| Net decrease in shares outstanding | | | (10,599 | ) | | | (91,684 | ) |
See accompanying notes which are an integral part of these financial statements.
BFS Equity Fund - Institutional Class
Financial Highlights
(For a share outstanding during each period)
| | | For the
Six Months Ended November 30,
2024 | | | For the Years Ended May 31, | |
| | | (Unaudited) | | | 2024 | | | 2023 | | | 2022 | | | 2021 | | | 2020 | |
| Selected Per Share Data: | | | | | | | | | | | | | | | | | | | | | | | | |
| Net asset value, beginning of period | | $ | 22.72 | | | $ | 18.14 | | | $ | 18.52 | | | $ | 21.36 | | | $ | 16.10 | | | $ | 15.40 | |
| | | | | | | | | | | | | | | | | | | | | | | | | |
| Income from investment operations: | | | | | | | | | | | | | | | | | | | | | | | | |
| Net investment income (loss) | | | 0.03 | | | | 0.11 | | | | 0.10 | | | | (0.03 | ) | | | (0.02 | ) | | | 0.03 | |
| Net realized and unrealized gain/(loss) on investments | | | 3.23 | | | | 4.57 | | | | (0.28 | ) | | | (0.71 | ) | | | 5.57 | | | | 0.97 | |
| Total from investment operations | | | 3.26 | | | | 4.68 | | | | (0.18 | ) | | | (0.74 | ) | | | 5.55 | | | | 1.00 | |
| | | | | | | | | | | | | | | | | | | | | | | | | |
| Less distributions to shareholders from: | | | | | | | | | | | | | | | | | | | | | | | | |
| Net investment income | | | — | | | | (0.10 | ) | | | — | | | | — | | | | — | | | | (0.03 | ) |
| Net realized gains | | | — | | | | — | | | | (0.20 | ) | | | (2.10 | ) | | | (0.29 | ) | | | (0.27 | ) |
| Total distributions | | | — | | | | (0.10 | ) | | | (0.20 | ) | | | (2.10 | ) | | | (0.29 | ) | | | (0.30 | ) |
| | | | | | | | | | | | | | | | | | | | | | | | | |
| Net asset value, end of period | | $ | 25.98 | | | $ | 22.72 | | | $ | 18.14 | | | $ | 18.52 | | | $ | 21.36 | | | $ | 16.10 | |
| | | | | | | | | | | | | | | | | | | | | | | | | |
| Total Return(a) | | | 14.35 | %(b) | | | 25.87 | % | | | (0.94 | )% | | | (4.71 | )% | | | 34.68 | % | | | 6.32 | % |
| | | | | | | | | | | | | | | | | | | | | | | | | |
| Ratios and Supplemental Data: | | | | | | | | | | | | | | | | | | | | | | | | |
| Net assets, end of period (000 omitted) | | $ | 62,629 | | | $ | 55,005 | | | $ | 45,582 | | | $ | 46,766 | | | $ | 48,781 | | | $ | 38,864 | |
| Ratio of net expenses to average net assets | | | 0.99 | %(c) | | | 1.10 | % | | | 1.25 | % | | | 1.25 | % | | | 1.25 | % | | | 1.25 | % |
| Ratio of expenses to average net assets before waiver and reimbursement | | | 1.17 | %(c) | | | 1.32 | % | | | 1.46 | % | | | 1.41 | % | | | 1.46 | % | | | 1.52 | % |
| Ratio of net investment income (loss) to average net assets | | | 0.22 | %(c) | | | 0.53 | % | | | 0.57 | % | | | (0.13 | )% | | | (0.12 | )% | | | 0.21 | % |
| Portfolio turnover rate | | | 6.18 | %(b) | | | 22.31 | % | | | 35.81 | % | | | 61.08 | % | | | 68.77 | % | | | 49.27 | % |
| (a) | Total return represents the rate that the investor would have earned or lost on an investment in the Fund, assuming reinvestment of distributions. |
| (b) | Not annualized. |
| (c) | Annualized. |
See accompanying notes which are an integral part of these financial statements.
BFS Equity Fund
Notes to the Financial Statements
November 30, 2024 - (Unaudited)
NOTE 1. ORGANIZATION
The BFS Equity Fund (the “Fund”) is registered under the Investment Company Act of 1940, as amended (“1940 Act”), as an open-end diversified series of Valued Advisers Trust (the “Trust”) and commenced operations on November 8, 2013. The Trust is a management investment company established under the laws of Delaware by an Agreement and Declaration of Trust dated June 13, 2008 (the “Trust Agreement”). The Trust Agreement permits the Board of Trustees (the “Board” or the “Trustees”) to issue an unlimited number of shares of beneficial interest of separate series without par value. The Fund is one of a series of funds authorized by the Board. The Fund’s investment adviser is Bradley, Foster & Sargent, Inc. (the “Adviser”). The investment objective of the Fund is long-term appreciation through growth of principal and income.
The Fund currently offers one class of shares (Institutional), and may offer additional classes of shares in the future.
NOTE 2. SIGNIFICANT ACCOUNTING POLICIES
The Fund is an investment company and follows accounting and reporting guidance under Financial Accounting Standards Board Accounting Standards Codification (“ASC”) Topic 946, “Financial Services-Investment Companies”. The following is a summary of significant accounting policies followed by the Fund in the preparation of its financial statements. These policies are in conformity with generally accepted accounting principles in the United States of America (“GAAP”).
Estimates – The preparation of financial statements in conformity with GAAP requires management to make estimates and assumptions that affect the reported amounts of assets and liabilities and disclosure of contingent assets and liabilities at the date of the financial statements and the reported amounts of increases and decreases in net assets from operations during the reporting period. Actual results could differ from those estimates.
Federal Income Taxes – The Fund makes no provision for federal income or excise tax. The Fund has qualified and intends to qualify each year as a regulated investment company (“RIC”) under subchapter M of the Internal Revenue Code of 1986, as amended, by complying with the requirements applicable to RICs and by distributing substantially all of its taxable income. The Fund also intends to distribute sufficient net investment income and net realized capital gains, if any, so that it will not be subject to excise tax on undistributed income and gains. If the required amount of net investment income or gains is not distributed, the Fund could incur a tax expense.
As of and during the six months ended November 30, 2024, the Fund did not have any liabilities for any unrecognized tax benefits. The Fund recognizes interest and penalties,
BFS Equity Fund
Notes to the Financial Statements (continued)
November 30, 2024 - (Unaudited)
if any, related to unrecognized tax benefits as income tax expense on the Statement of Operations when incurred. During the six months ended November 30, 2024, the Fund did not incur any interest or penalties. Management of the Fund has reviewed tax positions taken in tax years that remain subject to examination by all major tax jurisdictions, including federal (i.e., the last three tax year ends and the interim tax period since then, as applicable). Management believes that there is no tax liability resulting from unrecognized tax benefits related to uncertain tax positions taken.
Expenses – Expenses incurred by the Trust that do not relate to a specific fund of the Trust are allocated to the individual funds of the Trust based on each fund’s relative net assets or another appropriate basis (as determined by the Board).
Security Transactions and Related Income – The Fund follows industry practice and records security transactions on the trade date for financial reporting purposes. For financial statement and income tax purposes, the specific identification method is used for determining capital gains or losses. Dividend income is recorded on the ex-dividend date and interest income is recorded on an accrual basis. Discounts and premiums on securities purchased are accreted or amortized using the effective interest method. Dividend income from real estate investment trusts (REITs) and distributions from limited partnerships are recognized on the ex-date. The calendar year end classification of distributions received from REITs during the fiscal year are reported subsequent to year end; accordingly, the Fund estimates the character of REIT distributions based on the most recent information available. Income or loss from Limited Partnerships is reclassified among the components of net assets upon receipt of Schedules K-1 (Form 1065). Non-cash income, if any, is recorded at the fair market value of the securities received. Withholding taxes on foreign dividends, if any, have been provided for in accordance with the Fund’s understanding of the applicable country’s tax rules and rates.
Foreign Currency Translation – The accounting records of the Fund are maintained in U.S. dollars. Foreign currency amounts are translated into U.S. dollars at the current rate of exchange each business day to determine the value of investments, and other assets and liabilities. Purchases and sales of foreign securities, and income and expenses, are translated at the prevailing rate of exchange on the respective date of these transactions. The Fund does not isolate that portion of the results of operations resulting from changes in foreign exchange rates on investments from fluctuation arising from changes in market prices of securities held. These fluctuations are included with the unrealized gain or loss from investments. Reported net realized foreign exchange gains or losses arise from sales of foreign currencies, currency gains or losses realized between the trade and settlement dates on securities transactions, and the difference between the amounts of dividends, interest, and foreign withholding taxes recorded on the Fund’s books and the U.S. dollar
BFS Equity Fund
Notes to the Financial Statements (continued)
November 30, 2024 - (Unaudited)
equivalent of the amounts actually received or paid. Net unrealized foreign exchange gains and losses arise from changes in the fair values of assets and liabilities, other than investments in securities at period end, resulting from changes in exchange rates.
Dividends and Distributions – The Fund intends to distribute its net investment income and net realized long-term and short-term capital gains, if any, at least annually. Dividends and distributions to shareholders, which are determined in accordance with income tax regulations, are recorded on the ex-dividend date. The treatment for financial reporting purposes of distributions made to shareholders during the period from net investment income or net realized capital gains may differ from their ultimate treatment for federal income tax purposes. These differences are caused primarily by differences in the timing of the recognition of certain components of income, expense or realized capital gain for federal income tax purposes. Where such differences are permanent in nature, they are reclassified among the components of net assets based on their ultimate characterization for federal income tax purposes. Any such reclassifications will have no effect on net assets, results of operations or net asset value (“NAV”) per share of the Fund.
Share Valuation – The NAV is calculated each day the New York Stock Exchange (the “NYSE”) is open by dividing the total value of the Fund’s assets, less liabilities, by the number of shares outstanding for the Fund.
NOTE 3. SECURITIES VALUATION AND FAIR VALUE MEASUREMENTS
The Fund values its portfolio securities at fair value as of the close of regular trading on the NYSE (normally 4:00 p.m. Eastern Time) on each business day the NYSE is open for business. Fair value is defined as the price that the Fund would receive upon selling an investment in a timely transaction to an independent buyer in the principal or most advantageous market of the investment. GAAP establishes a three-tier hierarchy to maximize the use of observable market data and minimize the use of unobservable inputs and to establish classification of fair value measurements for disclosure purposes.
Inputs refer broadly to the assumptions that market participants would use in pricing the asset or liability, including assumptions about risk (the risk inherent in a particular valuation technique used to measure fair value including a pricing model and/or the risk inherent in the inputs to the valuation technique). Inputs may be observable or unobservable. Observable inputs are inputs that reflect the assumptions market participants would use in pricing the asset or liability developed based on market data obtained and available from sources independent of the reporting entity. Unobservable inputs are inputs that reflect the reporting entity’s own assumptions about the assumptions market participants would use in pricing the asset or liability developed based on the best information available in the circumstances.
BFS Equity Fund
Notes to the Financial Statements (continued)
November 30, 2024 - (Unaudited)
Various inputs are used in determining the value of the Fund’s investments. These inputs are summarized in the three broad levels listed below.
| ● | Level 1 – unadjusted quoted prices in active markets for identical investments and/or registered investment companies where the value per share is determined and published and is the basis for current transactions for identical assets or liabilities at the valuation date |
| ● | Level 2 – other significant observable inputs (including, but not limited to, quoted prices for an identical security in an inactive market, quoted prices for similar securities, interest rates, prepayment speeds, credit risk, etc.) |
| ● | Level 3 – significant unobservable inputs (including the Fund’s own assumptions in determining fair value of investments based on the best information available) |
The inputs used to measure fair value may fall into different levels of the fair value hierarchy. In such cases, for disclosure purposes, the level in the fair value hierarchy which is reported is determined based on the lowest level input that is significant to the fair value measurement in its entirety.
Debt securities are valued by the Adviser as “Valuation Designee” under the oversight of the Board, by using the mean between the closing bid and ask prices provided by a pricing service. If the closing bid and ask prices are not readily available, the pricing service may provide a price determined by a matrix pricing method. Matrix pricing is a mathematical technique used to value fixed income securities without relying exclusively on quoted prices. Matrix pricing takes into consideration recent transactions, yield, liquidity, risk, credit quality, coupon, maturity, type of issue and any other factors or market data the pricing service deems relevant for the actual security being priced and for other securities with similar characteristics. These securities will generally be categorized as Level 2 securities. If the Adviser decides that a price provided by the pricing service does not accurately reflect the fair value of the securities or when prices are not readily available from a pricing service, securities are valued at fair value as determined by the Adviser, in conformity with guidelines adopted by and subject to review of the Board. These securities will generally be categorized as Level 3 securities.
Equity securities that are traded on any stock exchange are generally valued at the last quoted sale price on the security’s primary exchange. Lacking a last sale price, an exchange-traded security is generally valued at its last bid price. Securities traded in the Nasdaq over-the-counter market are generally valued at the Nasdaq Official Closing Price. When using the market quotations and when the market is considered active, the security is classified as a Level 1 security. In the event that market quotations are not readily
BFS Equity Fund
Notes to the Financial Statements (continued)
November 30, 2024 - (Unaudited)
available or are considered unreliable due to market or other events, securities are valued in good faith by the Adviser as “Valuation Designee” under the oversight of the Board. The Adviser has adopted written policies and procedures for valuing securities and other assets in circumstances where market quotes are not readily available. In the event that market quotes are not readily available, and the security or asset cannot be valued pursuant to one of the valuation methods, the value of the security or asset will be determined in good faith by the Adviser pursuant to its policies and procedures. On a quarterly basis, the Adviser’s fair valuation determinations will be reviewed by the Board. Under these policies, the securities will be classified as Level 2 or 3 within the fair value hierarchy, depending on the inputs used.
In accordance with the Trust’s valuation policies and fair value determinations pursuant to Rule 2a-5 under the 1940 Act, the Valuation Designee is required to consider all appropriate factors relevant to the value of securities for which it has determined other pricing sources are not available or reliable as described above. No single method exists for determining fair value because fair value depends upon the circumstances of each individual case. As a general principle, the current fair value of a security being valued by the Valuation Designee would be the amount that the Fund might reasonably expect to receive upon the current sale. Methods that are in accordance with this principle may, for example, be based on (i) a multiple of earnings; (ii) a discount from market prices of a similar freely traded security (including a derivative security or a basket of securities traded on other markets, exchanges or among dealers); or (iii) yield to maturity with respect to debt issues, or a combination of these and other methods. Fair-value pricing is permitted if, in the Valuation Designee’s opinion, the validity of market quotations appears to be questionable based on factors such as evidence of a thin market in the security based on a small number of quotations, a significant event occurs after the close of a market but before the Fund’s NAV calculation that may affect a security’s value, or the Valuation Designee is aware of any other data that calls into question the reliability of market quotations. The Valuation Designee may obtain assistance from others in fulfilling its duties. For example, it may seek assistance from pricing services, fund administrators, sub-advisers, accountants, or counsel; it may also consult the Trust’s Fair Value Committee. The Valuation Designee, however, remains responsible for the final fair value determination and may not designate or assign that responsibility to any third party.
Investments in mutual funds, including money market mutual funds, are generally priced at the ending NAV as reported by the underlying fund companies. These securities are categorized as Level 1 securities.
The following is a summary of the inputs used to value the Fund’s investments as of November 30, 2024:
BFS Equity Fund
Notes to the Financial Statements (continued)
November 30, 2024 - (Unaudited)
| | | Valuation Inputs | |
| Assets | | Level 1 | | | Level 2 | | | Level 3 | | | Total | |
| Common Stocks (a) | | $ | 57,337,282 | | | $ | — | | | $ | — | | | $ | 57,337,282 | |
| U.S. Government & Agencies | | | — | | | | 2,488,243 | | | | — | | | | 2,488,243 | |
| Money Market Funds | | | 2,800,313 | | | | — | | | | — | | | | 2,800,313 | |
| Total | | $ | 60,137,595 | | | $ | 2,488,243 | | | $ | — | | | $ | 62,625,838 | |
| (a) | Refer to Schedule of Investments for industry classifications. |
The Fund did not hold any investments during or at the end of the reporting period for which significant unobservable inputs (Level 3) were used in determining fair value; therefore, no reconciliation of Level 3 securities is included for this reporting period.
NOTE 4. FEES AND OTHER TRANSACTIONS WITH AFFILIATES AND OTHER SERVICE PROVIDERS
Under the terms of the investment advisory agreement on behalf of the Fund, the Adviser manages the Fund’s investments subject to oversight of the Board. As compensation for its services, the Fund pays the Adviser a fee, computed and accrued daily and paid monthly, at an annual rate of 0.75% of the average daily net assets of the Fund.
The Adviser has contractually agreed to waive or limit its management fee and/or reimburse certain operating expenses until September 30, 2025, but only to the extent necessary so that the Fund’s net expenses, excluding brokerage fees and commissions, borrowing costs (such as interest and dividend expenses on securities sold short), taxes, extraordinary expenses, fees and expenses paid under a distribution plan adopted pursuant to Rule 12b-1 fees, if any, and indirect expenses (such as “acquired funds fees and expenses”, and expenses that the Fund has incurred but did not actually pay because of an expense offset arrangement) do not exceed 0.99% of the average daily net assets of the Fund.
Each waiver or reimbursement of an expense by the Adviser is subject to repayment by the Fund within the three years following the date of such waiver or reimbursement, provided that the Fund is able to make the repayment without exceeding the expense limitation in place at the time of the waiver or reimbursement and the expense limitation in place at the time of the repayment. This contractual arrangement may only be terminated by mutual consent of the Adviser and the Board, and it will automatically terminate upon the termination of the investment advisory agreement between the Trust and the Adviser. For the six months ended November 30, 2024, the Adviser waived fees of $52,679.
BFS Equity Fund
Notes to the Financial Statements (continued)
November 30, 2024 - (Unaudited)
The amounts subject to repayment by the Fund, pursuant to the aforementioned conditions, are as follows:
| Recoverable Through | | | | |
| May 31, 2025 | | $ | 44,864 | |
| May 31, 2026 | | | 92,786 | |
| May 31, 2027 | | | 110,715 | |
| November 30, 2027 | | | 52,679 | |
The Trust retains Ultimus Fund Solutions, LLC (“Ultimus” or “Administrator”) to provide the Fund with administration, fund accounting and transfer agent services, including all regulatory reporting.
Northern Lights Compliance Services, LLC (“NLCS”), an affiliate of Ultimus, provides a Chief Compliance Officer and an Anti-Money Laundering Officer to the Trust, as well as related compliance services, pursuant to a consulting agreement between NLCS and the Trust. Under the terms of such agreement, NLCS receives fees from the Fund.
The officers of the Trust are members of management and/or employees of the Administrator or of NLCS, and are not paid by the Trust for services to the Fund. Ultimus Fund Distributors, LLC (the “Distributor”) acts as the distributor of the Fund’s shares. The Distributor is a wholly-owned subsidiary of Ultimus. There were no payments made to the Distributor by the Fund for the six months ended November 30, 2024.
The Fund previously adopted a Distribution Plan (the “Plan”) pursuant to Rule 12b-1 under the 1940 Act. The Plan provides that the Fund will pay the Distributor and/or any registered securities dealer, financial institution or any other person (the “Recipient”) a shareholder servicing fee of 0.25% of the average daily net assets of the Fund in connection with the promotion and distribution of the Fund’s shares or the provision of shareholder support services to shareholders, including, but not necessarily limited to, advertising, compensation to underwriters, dealers and selling personnel, the printing and mailing of prospectuses to other than current Fund shareholders, the printing and mailing of sales literature and servicing shareholder accounts (“12b-1 fees”). The Fund or Distributor may pay all or a portion of these fees to any Recipient who renders assistance in distributing or promoting the sale of shares, or who provides certain shareholder services, pursuant to a written agreement. When the Investor class of shares converted to the Institutional class of shares on November 3, 2023, the Distribution Plan was terminated.
BFS Equity Fund
Notes to the Financial Statements (continued)
November 30, 2024 - (Unaudited)
NOTE 5. PURCHASES AND SALES OF SECURITIES
For the six months ended November 30, 2024, purchases and sales of investment securities, other than short-term investments, were $3,441,280 and $6,123,563, respectively.
There were no purchases or sales of long-term U.S. government obligations during the six months ended November 30, 2024.
NOTE 6. FEDERAL TAX INFORMATION
At November 30, 2024, the net unrealized appreciation (depreciation) and tax cost of investments for tax purposes were as follows:
| Gross unrealized appreciation | | $ | 33,221,768 | |
| Gross unrealized depreciation | | | — | |
| Net unrealized appreciation on investments | | $ | 33,221,768 | |
| Tax cost of investments | | $ | 29,404,070 | |
At November 30, 2024, the difference between book basis and tax basis unrealized appreciation (depreciation) is attributable to the tax deferral of losses on wash sales.
The tax character of distributions paid for the fiscal year ended May 31, 2024, the Fund’s most recent fiscal year end, was as follows:
| Distributions paid from: | | | | |
| Ordinary income(a) | | $ | 244,163 | |
| Total distributions paid | | $ | 244,163 | |
| (a) | Short-term capital gain distributions are treated as ordinary income for tax purposes. |
At May 31, 2024, the components of accumulated earnings (deficit) on a tax basis were as follows:
| Undistributed ordinary income | | $ | 239,667 | |
| Undistributed long-term capital gains | | | 25,291 | |
| Unrealized appreciation (depreciation) | | | 26,464,632 | |
| Total accumulated earnings | | $ | 26,729,590 | |
NOTE 7. SECTOR RISK
If the Fund has significant investments in the securities of issuers within a particular sector, any development affecting that sector will have a greater impact on the value of the net assets of the Fund than would be the case if the Fund did not have significant investments in that sector. In addition, this may increase the risk of loss in the Fund and increase the
BFS Equity Fund
Notes to the Financial Statements (continued)
November 30, 2024 - (Unaudited)
volatility of the Fund’s NAV per share. For instance, economic or market factors, regulatory changes or other developments may negatively impact all companies in a particular sector, and therefore the value of the Fund’s portfolio will be adversely affected. As of November 30, 2024, the Fund had 32.0% of the value of its net assets invested in stocks within the Technology sector.
NOTE 8. IDEMNIFICATIONS
The Trust indemnifies its officers and Trustees for certain liabilities that may arise from their performance of their duties to the Trust or the Fund. Additionally, in the normal course of business, the Trust enters into contracts that contain a variety of representations and warranties which provide general indemnifications. The Trust’s maximum exposure under these arrangements is unknown, as this would involve future claims that may be made against the Trust that have not yet occurred.
NOTE 9. SUBSEQUENT EVENTS
Management of the Fund has evaluated the need for disclosures and/or adjustments resulting from subsequent events through the date at which these financial statements were issued. Based upon this evaluation, management has determined there were no items requiring adjustment of the financial statements or additional disclosure.
Proxy Voting Results (Unaudited)
At a Special Shareholder Meeting at which a quorum was present, held on June 27, 2024, Fund shareholders of record as of the close of business on May 13, 2024 voted to approve the following proposal:
Proposal 1: To elect the following individuals to serve on the Board of Trustees of the Trust:
Martin A. Burns
Susan J. Templeton
| | | Shares Voted in
Favor* | | Shares Voted
Against or Abstain* | | Shares Needed to
Approve* |
| Martin A. Burns | | 82,650,826 | | 53,513 | | Plurality |
| | | (99.94%) | | (0.06%) | | (greater than 50%) |
| Susan J. Templeton | | 82,570,073 | | 134,262 | | Plurality |
| | | (99.84%) | | (0.16%) | | (greater than 50%) |
| * | as a percentage of the total voting securities of the Fund voted at the meeting at which a quorum was present. |
Additional Information (Unaudited)
Changes in and Disagreements with Accountants
There were no changes in or disagreements with accountants during the period covered by this report.
Proxy Disclosures
Not applicable
Remuneration Paid to Directors, Officers and Others
Refer to the financial statements included herein.
Statement Regarding Basis for Approval of Investment Advisory Agreement
Not applicable.
Proxy Voting
A description of the policies and procedures that the Fund uses to determine how to vote proxies relating to portfolio securities and information regarding how the Fund voted those proxies during the most recent twelve month period ended June 30, are available (1) without charge upon request by calling the Fund at (855) 575-2430 and (2) in Fund documents filed with the SEC on the SEC’s website at www.sec.gov.
| TRUSTEES | INDEPENDENT REGISTERED |
Andrea N. Mullins, Chairperson
Ira P. Cohen
Martin A. Burns
Susan J. Templeton | PUBLIC ACCOUNTING FIRM Cohen & Company, Ltd.
1350 Euclid Avenue, Suite 800
Cleveland, OH 44115 |
| | |
| OFFICERS | LEGAL COUNSEL |
Matthew J. Miller, Principal Executive Officer and President
Zachary P. Richmond, Principal Financial Officer and Treasurer
Michael Wittke, Chief Compliance Officer
Carol J. Highsmith, Vice President and Secretary | DLA Piper LLP (US)
One Atlantic Center
1201 West Peachtree Street, Suite 2900
Atlanta, Georgia 30309 |
| | |
| INVESTMENT ADVISER | CUSTODIAN |
Bradley, Foster & Sargent, Inc.
185 Asylum Street, City Place II
Hartford, CT 06103 | Huntington National Bank
41 South High Street
Columbus, OH 43215 |
| | |
| DISTRIBUTOR | ADMINISTRATOR, TRANSFER |
Ultimus Fund Distributors, LLC
225 Pictoria Drive, Suite 450
Cincinnati, OH 45246 | AGENT AND FUND ACCOUNTANT Ultimus Fund Solutions, LLC
225 Pictoria Drive, Suite 450 Cincinnati, OH 45246 |
This report is intended only for the information of shareholders or those who have received the Fund’s prospectus which contains information about the Fund’s management fee and expenses. Please read the prospectus carefully before investing.
Distributed by Ultimus Fund Distributors, LLC, Member FINRA/SIPC

LS Opportunity Fund
Schedule of Investments
November 30, 2024 - (Unaudited)
| | | Shares | | | Fair Value | |
| COMMON STOCKS - LONG - DOMESTIC — 79.84% | | | | | | | | |
| Communication Services — 1.01% | | | | | | | | |
| Alphabet, Inc., Class A(a) | | | 12,436 | | | $ | 2,101,062 | |
| | | | | | | | | |
| Consumer Discretionary — 5.51% | | | | | | | | |
| Darden Restaurants, Inc.(a) | | | 13,321 | | | | 2,348,093 | |
| Expedia Group, Inc.(a) (b) | | | 17,528 | | | | 3,236,019 | |
| Home Depot, Inc. (The)(a) | | | 8,252 | | | | 3,541,181 | |
| Texas Roadhouse, Inc.(a) | | | 11,637 | | | | 2,388,727 | |
| | | | | | | 11,514,020 | |
| Consumer Staples — 4.58% | | | | | | | | |
| Church & Dwight Co., Inc.(a) | | | 28,226 | | | | 3,108,529 | |
| Colgate-Palmolive Co.(a) | | | 35,597 | | | | 3,439,738 | |
| Mondelez International, Inc., Class A(a) | | | 46,549 | | | | 3,023,358 | |
| | | | | | | 9,571,625 | |
| Energy — 3.52% | | | | | | | | |
| Exxon Mobil Corp.(a) | | | 30,592 | | | | 3,608,632 | |
| Hess Corp.(a) | | | 13,729 | | | | 2,020,634 | |
| Murphy Oil Corp.(a) | | | 52,954 | | | | 1,719,417 | |
| | | | | | | 7,348,683 | |
| Financials — 33.44% | | | | | | | | |
| Ameris Bancorp(a) | | | 34,029 | | | | 2,391,558 | |
| Arthur J. Gallagher & Co.(a) | | | 16,296 | | | | 5,088,263 | |
| Brown & Brown, Inc.(a) | | | 64,348 | | | | 7,277,759 | |
| Cboe Global Markets, Inc.(a) | | | 12,322 | | | | 2,659,704 | |
| Citigroup, Inc.(a) | | | 70,585 | | | | 5,002,359 | |
| F.N.B. Corp.(a) | | | 128,748 | | | | 2,208,028 | |
| Fidelity National Information Services, Inc.(a) | | | 34,589 | | | | 2,950,442 | |
| Globe Life, Inc.(a) | | | 44,705 | | | | 4,972,984 | |
| Goldman Sachs Group, Inc. (The)(a) | | | 3,499 | | | | 2,129,386 | |
| KeyCorp(a) | | | 150,521 | | | | 2,932,149 | |
| PJT Partners, Inc., Class A(a) | | | 20,575 | | | | 3,443,432 | |
| PNC Financial Services Group, Inc. (The)(a) | | | 24,880 | | | | 5,342,234 | |
| Primerica, Inc.(a) | | | 13,463 | | | | 4,075,923 | |
| Progressive Corp. (The)(a) | | | 32,141 | | | | 8,642,072 | |
| Prosperity Bancshares, Inc.(a) | | | 45,891 | | | | 3,842,454 | |
| SouthState Corp.(a) | | | 37,228 | | | | 4,120,767 | |
| Voya Financial, Inc.(a) | | | 33,391 | | | | 2,771,453 | |
| | | | | | | 69,850,967 | |
| Health Care — 9.54% | | | | | | | | |
| Abbott Laboratories(a) | | | 54,429 | | | | 6,464,532 | |
| Cigna Corp. (The)(a) | | | 10,770 | | | | 3,638,106 | |
| Hologic, Inc.(a) (b) | | | 25,461 | | | | 2,024,150 | |
| Johnson & Johnson(a) | | | 21,974 | | | | 3,406,190 | |
| Merck & Co., Inc.(a) | | | 43,304 | | | | 4,401,418 | |
| | | | | | | 19,934,396 | |
| Industrials — 12.95% | | | | | | | | |
| AMETEK, Inc.(a) | | | 12,018 | | | | 2,336,059 | |
| Carrier Global Corp.(a) | | | 62,880 | | | | 4,865,026 | |
See accompanying notes which are an integral part of these financial statements.
LS Opportunity Fund
Schedule of Investments (continued)
November 30, 2024 - (Unaudited)
| | | Shares | | | Fair Value | |
| COMMON STOCKS - LONG - DOMESTIC — 79.84% - continued | | | | | | | | |
| Industrials — 12.95% - continued | | | | | | | | |
| Curtiss-Wright Corp.(a) | | | 8,495 | | | $ | 3,173,987 | |
| Fortune Brands Innovations, Inc.(a) | | | 28,070 | | | | 2,197,881 | |
| General Dynamics Corp.(a) | | | 6,659 | | | | 1,891,223 | |
| Leidos Holdings, Inc.(a) | | | 32,767 | | | | 5,419,662 | |
| Otis Worldwide Corp.(a) | | | 19,616 | | | | 2,020,055 | |
| Paychex, Inc.(a) | | | 13,235 | | | | 1,935,883 | |
| RTX Corp.(a) | | | 26,294 | | | | 3,203,398 | |
| | | | | | | | 27,043,174 | |
| Information Technology — 6.31% | | | | | | | | |
| Littelfuse, Inc.(a) | | | 12,139 | | | | 2,994,327 | |
| Microsoft Corp.(a) | | | 7,367 | | | | 3,119,630 | |
| Teradyne, Inc.(a) | | | 12,968 | | | | 1,426,480 | |
| Trimble, Inc.(a) (b) | | | 56,835 | | | | 4,147,250 | |
| Zebra Technologies Corp., Class A(a) (b) | | | 3,689 | | | | 1,501,423 | |
| | | | | | | | 13,189,110 | |
| Materials — 1.74% | | | | | | | | |
| PPG Industries, Inc.(a) | | | 29,265 | | | | 3,639,688 | |
| | | | | | | | | |
| Real Estate — 1.24% | | | | | | | | |
| Howard Hughes Holdings, Inc. (The)(a) (b) | | | 29,915 | | | | 2,594,827 | |
| | | | | | | | | |
| Total Common Stocks - Long - Domestic (Cost $117,047,081) | | | | | | | 166,787,552 | |
| | | | | | | | | |
| COMMON STOCKS - LONG - INTERNATIONAL — 15.41% | | | | | | | | |
| Consumer Discretionary — 1.01% | | | | | | | | |
| Aptiv PLC(a) (b) | | | 37,771 | | | | 2,097,423 | |
| | | | | | | | | |
| Consumer Staples — 1.30% | | | | | | | | |
| Nestle S.A. | | | 31,208 | | | | 2,709,119 | |
| | | | | | | | | |
| Energy — 1.57% | | | | | | | | |
| Schlumberger Ltd.(a) | | | 74,635 | | | | 3,279,462 | |
| | | | | | | | | |
| Financials — 5.52% | | | | | | | | |
| Everest Re Group, Ltd.(a) | | | 11,161 | | | | 4,325,557 | |
| Fairfax Financial Holdings Ltd. | | | 5,096 | | | | 7,201,820 | |
| | | | | | | | 11,527,377 | |
| Industrials — 5.21% | | | | | | | | |
| Eaton Corp. PLC(a) | | | 20,157 | | | | 7,567,341 | |
| Pentair PLC(a) | | | 30,523 | | | | 3,326,702 | |
| | | | | | | | 10,894,043 | |
| Materials — 0.80% | | | | | | | | |
| Agnico Eagle Mines Ltd.(a) | | | 19,814 | | | | 1,672,698 | |
| | | | | | | | | |
| Total Common Stocks - Long - International (Cost $21,205,489) | | | | | | | 32,180,122 | |
See accompanying notes which are an integral part of these financial statements.
LS Opportunity Fund
Schedule of Investments (continued)
November 30, 2024 - (Unaudited)
| | Shares | | | Fair Value | |
| EXCHANGE-TRADED FUNDS — 0.73% | | | | | | |
| Abrdn Physical Platinum Shares ETF(a) (b) | | | 17,502 | | | $ | 1,523,724 | |
| Total Exchange-Traded Funds (Cost $1,678,391) | | | | | | | 1,523,724 | |
| | | Number of | | | Notional | | | Exercise | | | Expiration | | | | |
| Description | | Contracts | | | Amount | | | Price | | | Date | | | | |
| PUT OPTIONS PURCHASED — 0.02% | | | | | | | | | | | | | | | | | | |
| Post Holdings, Inc. | | 149 | | | $ | 1,795,152 | | | $ | 105.00 | | | 3/21/2025 | | | $ | 13,783 | |
| Post Holdings, Inc. | | 114 | | | | 1,373,472 | | | | 110.00 | | | 3/21/2025 | | | | 16,245 | |
| Prudential Financial, Inc. | | 140 | | | | 1,811,740 | | | | 105.00 | | | 1/17/2025 | | | | 2,800 | |
| Wells Fargo Co. | | 292 | | | | 2,224,164 | | | | 52.50 | | | 6/20/2025 | | | | 15,330 | |
| Total Put Options Purchased (Cost $310,164) | | | | | | | | | | | | | | | | | 48,158 | |
| MONEY MARKET FUNDS — 4.15% | | Shares | | | | |
| Invesco Treasury Portfolio, Institutional Class, 4.53%(c) | | 8,661,914 | | | | 8,661,914 | |
| Total Money Market Funds (Cost $8,661,914) | | | | | | 8,661,914 | |
| | | | | | | | |
| Total Investments — 100.15% (Cost $148,903,039) | | | | | | 209,201,470 | |
| Liabilities in Excess of Other Assets — (0.15)% | | | | | | (307,345 | ) |
| NET ASSETS — 100.00% | | | | | $ | 208,894,125 | |
| (a) | All or a portion of the security is held as collateral for securities sold short and written options. The fair value of this collateral on November 30, 2024 was $108,317,963. |
| (b) | Non-income producing security. |
| (c) | Rate disclosed is the seven day effective yield as of November 30, 2024. |
ETF - Exchange-Traded Fund
See accompanying notes which are an integral part of these financial statements.
LS Opportunity Fund
Schedule of Securities Sold Short
November 30, 2024 - (Unaudited)
| | | Shares | | | Fair Value | |
| COMMON STOCKS - SHORT - DOMESTIC - (23.36)% | | | | | | | | |
| Consumer Discretionary - (2.99)% | | | | | | | | |
| Brinker International, Inc.(a) | | | (19,381 | ) | | $ | (2,563,525 | ) |
| Hilton Grand Vacations, Inc.(a) | | | (43,880 | ) | | | (1,860,073 | ) |
| McDonald’s Corp. | | | (6,137 | ) | | | (1,816,613 | ) |
| | | | | | | | (6,240,211 | ) |
| Consumer Staples - (4.83)% | | | | | | | | |
| Campbell Soup Co. | | | (31,185 | ) | | | (1,440,747 | ) |
| Dollar Tree, Inc.(a) | | | (14,866 | ) | | | (1,059,500 | ) |
| Edgewell Personal Care Co. | | | (28,675 | ) | | | (1,048,931 | ) |
| Post Holdings, Inc.(a) | | | (31,641 | ) | | | (3,812,108 | ) |
| Sysco Corp. | | | (35,406 | ) | | | (2,730,157 | ) |
| | | | | | | | (10,091,443 | ) |
| Financials - (12.16)% | | | | | | | | |
| American International Group, Inc. | | | (27,610 | ) | | | (2,122,657 | ) |
| Capitol Federal Financial, Inc. | | | (224,868 | ) | | | (1,502,118 | ) |
| Enterprise Financial Services Corp. | | | (34,684 | ) | | | (2,101,504 | ) |
| Lincoln National Corp. | | | (103,500 | ) | | | (3,678,390 | ) |
| Markel Corp.(a) | | | (1,892 | ) | | | (3,373,285 | ) |
| Marsh & McLennan Cos., Inc. | | | (13,500 | ) | | | (3,148,605 | ) |
| Old Republic International Corp. | | | (128,886 | ) | | | (5,022,688 | ) |
| Park National Corp. | | | (5,876 | ) | | | (1,118,555 | ) |
| Washington Trust Bancorp, Inc. | | | (25,823 | ) | | | (959,066 | ) |
| WSFS Financial Corp. | | | (39,232 | ) | | | (2,354,705 | ) |
| | | | | | | | (25,381,573 | ) |
| Health Care - (1.57)% | | | | | | | | |
| Henry Schein, Inc.(a) | | | (13,322 | ) | | | (1,026,460 | ) |
| UnitedHealth Group, Inc. | | | (3,700 | ) | | | (2,257,740 | ) |
| | | | | | | | (3,284,200 | ) |
| Industrials - (1.81)% | | | | | | | | |
| Johnson Controls International PLC | | | (12,460 | ) | | | (1,044,896 | ) |
| Lockheed Martin Corp., Class B | | | (1,979 | ) | | | (1,047,702 | ) |
| TE Connectivity PLC | | | (11,200 | ) | | | (1,692,544 | ) |
| | | | | | | | (3,785,142 | ) |
| | | | | | | | | |
| TOTAL COMMON STOCKS - SHORT - DOMESTIC (Proceeds Received $43,997,998) | | | | | | | (48,782,569 | ) |
| | | | | | | | | |
| COMMON STOCKS - SHORT - INTERNATIONAL - (5.60)% | | | | | | | | |
| Financials - (5.60)% | | | | | | | | |
| Commonwealth Bank of Australia | | | (52,546 | ) | | | (5,434,162 | ) |
| Invesco Ltd. | | | (144,763 | ) | | | (2,618,763 | ) |
| Muenchener Rueckversicherungs-Gesellshaft AG | | | (3,716 | ) | | | (1,940,438 | ) |
| RenaissanceRe Holdings Ltd. | | | (6,016 | ) | | | (1,721,478 | ) |
| | | | | | | | (11,714,841 | ) |
| | | | | | | | | |
| TOTAL COMMON STOCKS - SHORT - INTERNATIONAL (Proceeds Received $10,203,608) | | | | | | | (11,714,841 | ) |
See accompanying notes which are an integral part of these financial statements.
LS Opportunity Fund
Schedule of Securities Sold Short (continued)
November 30, 2024 - (Unaudited)
| | Shares | | | Fair Value | |
| EXCHANGE-TRADED FUNDS - (4.14)% | | | | | | |
| Energy Select Sector SPDR® Fund | | | (11,025 | ) | | | (1,053,218 | ) |
| Vanguard Industrials ETF(a) | | | (16,030 | ) | | | (4,483,591 | ) |
| Vanguard Information Technology ETF | | | (5,009 | ) | | | (3,116,850 | ) |
| | | | | | | | | |
| TOTAL EXCHANGE-TRADED FUNDS (Proceeds Received $8,302,653) | | | | | | | (8,653,659 | ) |
| | | | | | | | | |
| TOTAL SECURITIES SOLD SHORT - (33.10)% (Proceeds Received $62,504,259) | | | | | | $ | (69,151,069 | ) |
| (a) | Non-dividend expense producing security. |
ETF - Exchange-Traded Fund
SPDR - Standard & Poor’s Depositary Receipt
The sectors shown on the schedule of investments and schedule of securities sold short are based on the Global Industry Classification Standard, or GICS® (“GICS”). The GICS was developed by and/ or is the exclusive property of MSCI, Inc. and Standard & Poor’s Financial Services LLC (“S&P”). GICS is a service mark of MSCI, Inc. and S&P and has been licensed for use by Ultimus Fund Solutions, LLC.
See accompanying notes which are an integral part of these financial statements.
LS Opportunity Fund
Schedule of Written Options
November 30, 2024 - (Unaudited)
| Description | | Number of
Contracts | | Notional
Amount | | | Exercise
Price | | | Expiration
Date | | | Fair
Value | |
| CALL OPTIONS WRITTEN - (0.39)% | | | | | | | | | | | | | | | | | |
| Goldman Sachs Group, Inc. | | (32) | | $ | (1,947,424 | ) | | $ | 490.00 | | | 1/17/2025 | | | $ | (383,520 | ) |
| Texas Roadhouse, Inc. | | (70) | | | (1,436,890 | ) | | | 155.00 | | | 12/20/2024 | | | | (352,800 | ) |
| Texas Roadhouse, Inc. | | (44) | | | (903,188 | ) | | | 200.00 | | | 4/17/2025 | | | | (74,140 | ) |
| | | | | | | | | | | | | | | | | |
| Total Call Options Written (Premiums Received $267,154) | | | | | | | | | | | | | | | $ | (810,460 | ) |
See accompanying notes which are an integral part of these financial statements.
LS Opportunity Fund
Statement of Assets and Liabilities
November 30, 2024 - (Unaudited)
| Assets | | | |
| Investments in securities, at fair value (cost $148,903,039) (Note 3) | | $ | 209,201,470 | |
| Deposits at broker for securities sold short (Note 2) | | | 69,730,567 | |
| Receivable for fund shares sold | | | 4,565 | |
| Dividends receivable | | | 254,781 | |
| Tax reclaims receivable | | | 25,065 | |
| Prepaid expenses | | | 22,692 | |
| Total Assets | | | 279,239,140 | |
| Liabilities | | | | |
| Investments in securities sold short, at fair value (proceeds received $62,504,259) (Note 2) | | | 69,151,069 | |
| Options written, at fair value (premium received $267,154) | | | 810,460 | |
| Payable for fund shares redeemed | | | 3,743 | |
| Dividend expense payable on short positions | | | 46,123 | |
| Payable to Adviser (Note 4) | | | 292,500 | |
| Payable to Administrator (Note 4) | | | 22,147 | |
| Other accrued expenses | | | 18,973 | |
| Total Liabilities | | | 70,345,015 | |
| Net Assets | | $ | 208,894,125 | |
| Net Assets consist of: | | | | |
| Paid-in capital | | $ | 156,865,305 | |
| Accumulated earnings | | | 52,028,820 | |
| Net Assets | | $ | 208,894,125 | |
| Shares outstanding (unlimited number of shares authorized, no par value) | | | 10,905,653 | |
| Net asset value, offering and redemption price per share (Note 2) | | $ | 19.15 | |
See accompanying notes which are an integral part of these financial statements.
LS Opportunity Fund
Statement of Operations
For the six months ended November 30, 2024 - (Unaudited)
| Investment Income | | | | |
| Dividend income (net of foreign taxes withheld of $7,343) | | $ | 1,666,738 | |
| Interest income | | | 1,546,127 | |
| Total investment income | | | 3,212,865 | |
| Expenses | | | | |
| Investment Adviser fees (Note 4) | | | 1,741,698 | |
| Dividend expense on securities sold short (Note 2) | | | 582,445 | |
| Administration fees (Note 4) | | | 79,681 | |
| Fund accounting fees (Note 4) | | | 26,283 | |
| Registration expenses | | | 17,938 | |
| Compliance services fees (Note 4) | | | 13,732 | |
| Custodian fees | | | 12,389 | |
| Legal fees | | | 11,486 | |
| Printing and postage expenses | | | 11,133 | |
| Transfer agent fees (Note 4) | | | 9,900 | |
| Audit and tax preparation expenses | | | 9,894 | |
| Trustee expenses | | | 7,593 | |
| Short sale and interest expense | | | 1,428 | |
| Miscellaneous | | | 22,493 | |
| Total expenses | | | 2,548,093 | |
| Fees waived by Adviser (Note 4) | | | (17,194 | ) |
| Net operating expenses | | | 2,530,899 | |
| Net investment income | | | 681,966 | |
| Net Realized and Change in Unrealized Gain (Loss) on Investments | | | | |
| Net realized gain (loss) on: | | | | |
| Investment securities | | | 6,132,873 | |
| Securities sold short | | | (8,028,065 | ) |
| Written options | | | (155,113 | ) |
| Purchased options | | | (289,922 | ) |
| Foreign currency | | | (9,307 | ) |
| Change in unrealized appreciation (depreciation) on: | | | | |
| Investment securities | | | 18,811,060 | |
| Securities sold short | | | (3,583,200 | ) |
| Written options | | | (370,278 | ) |
| Purchased options | | | (6,787 | ) |
| Foreign currency translations | | | 562 | |
| Net realized and change in unrealized gain on investments | | | 12,501,823 | |
| Net increase in net assets resulting from operations | | $ | 13,183,789 | |
See accompanying notes which are an integral part of these financial statements.
LS Opportunity Fund
Statements of Changes in Net Assets
| | | For the
Six Months Ended
November 30,
2024 | | | For the
Year Ended
May 31,
2024 | |
| | | (Unaudited) | | | | |
| Increase (Decrease) in Net Assets due to: | | | | | | | | |
| Operations | | | | | | | | |
| Net investment income | | $ | 681,966 | | | $ | 1,169,710 | |
| Net realized gain (loss) on investment transactions | | | (2,349,534 | ) | | | 291,436 | |
| Change in unrealized appreciation on investments | | | 14,851,357 | | | | 24,313,642 | |
| Net increase in net assets resulting from operations | | | 13,183,789 | | | | 25,774,788 | |
| | | | | | | | | |
| Capital Transactions | | | | | | | | |
| Proceeds from shares sold | | | 16,930,544 | | | | 42,767,896 | |
| Amount paid for shares redeemed | | | (12,162,685 | ) | | | (21,729,896 | ) |
| Net increase in net assets resulting from capital transactions | | | 4,767,859 | | | | 21,038,000 | |
| Total Increase in Net Assets | | | 17,951,648 | | | | 46,812,788 | |
| | | | | | | | | |
| Net Assets | | | | | | | | |
| Beginning of period | | | 190,942,477 | | | | 144,129,689 | |
| End of period | | $ | 208,894,125 | | | $ | 190,942,477 | |
| | | | | | | | | |
| Share Transactions | | | | | | | | |
| Shares sold | | | 915,051 | | | | 2,466,498 | |
| Shares redeemed | | | (656,699 | ) | | | (1,286,882 | ) |
| Net increase in shares outstanding | | | 258,352 | | | | 1,179,616 | |
See accompanying notes which are an integral part of these financial statements.
LS Opportunity Fund
Financial Highlights
(For a share outstanding during each period)
| | | For the
Six Months Ended November 30,
2024 | | | For the Years Ended May 31, | |
| | (Unaudited) | | | 2024 | | | 2023 | | | 2022 | | | 2021 | | | 2020 | |
| Selected Per Share Data: | | | | | | | | | | | | | | | | | | |
| Net asset value, beginning of period | | $ | 17.93 | | | $ | 15.22 | | | $ | 16.16 | | | $ | 17.01 | | | $ | 13.99 | | | $ | 14.07 | |
| | | | | | | | | | | | | | | | | | | | | | | | | |
| Investment operations: | | | | | | | | | | | | | | | | | | | | | | | | |
| Net investment income (loss) | | | 0.06 | | | | 0.11 | | | | 0.01 | | | | (0.15 | ) | | | (0.13 | ) | | | (0.07 | ) |
| Net realized and unrealized gain (loss) on investments | | | 1.16 | | | | 2.60 | | | | (0.14 | ) | | | 0.02 | | | | 3.35 | | | | 0.17 | (a) |
| Total from investment operations | | | 1.22 | | | | 2.71 | | | | (0.13 | ) | | | (0.13 | ) | | | 3.22 | | | | 0.10 | |
| | | | | | | | | | | | | | | | | | | | | | | | | |
| Less distributions to shareholders from: | | | | | | | | | | | | | | | | | | | | | | | | |
| Net realized gains | | | — | | | | — | | | | (0.81 | ) | | | (0.72 | ) | | | (0.20 | ) | | | (0.18 | ) |
| | | | | | | | | | | | | | | | | | | | | | | | | |
| Net asset value, end of period | | $ | 19.15 | | | $ | 17.93 | | | $ | 15.22 | | | $ | 16.16 | | | $ | 17.01 | | | $ | 13.99 | |
| | | | | | | | | | | | | | | | | | | | | | | | | |
| Total Return(b) | | | 6.80 | %(c) | | | 17.81 | % | | | (0.84 | )% | | | (0.77 | )% | | | 23.17 | % | | | 0.62 | % |
| | | | | | | | | | | | | | | | | | | | | | | | | |
| Ratios and Supplemental Data: | | | | | | | | | | | | | | | | | | | | | | | | |
| Net assets, end of period (000 omitted) | | $ | 208,894 | | | $ | 190,942 | | | $ | 144,130 | | | $ | 139,445 | | | $ | 132,424 | | | $ | 82,695 | |
| Ratio of net expenses to average net assets(d) | | | 2.53 | %(e) | | | 2.68 | % | | | 2.98 | % | | | 2.87 | % | | | 2.71 | % | | | 2.84 | % |
| Ratio of expenses to average net assets before waiver and reimbursement(d) | | | 2.55 | %(e) | | | 2.73 | % | | | 3.03 | % | | | 2.90 | % | | | 2.78 | % | | | 2.97 | % |
| Ratio of net investment income (loss) to average net assets | | | 0.68 | %(e) | | | 0.72 | % | | | 0.04 | % | | | (1.00 | )% | | | (1.04 | )% | | | (0.52 | )% |
| Portfolio turnover rate | | | 26.19 | %(c) | | | 46.61 | % | | | 74.68 | % | | | 55.37 | % | | | 69.69 | % | | | 69.47 | % |
| (a) | The amount shown for a share outstanding throughout the year does not accord with the change in aggregate gains and losses in the portfolio of securities during the year due to the timing of sales and purchases of fund shares in relation to fluctuating market values during the year. |
| (b) | Total return represents the rate that the investor would have earned or lost on an investment in the Fund, assuming reinvestment of distributions. |
| (c) | Not annualized. |
| (d) | Includes dividend and interest expense of 0.58% for the six months ended November 30, 2024 and 0.73%, 1.03%, 0.92%, 0.76% and 0.89% for the fiscal years ended May 31, 2024, 2023, 2022, 2021 and 2020, respectively. |
| (e) | Annualized. |
See accompanying notes which are an integral part of these financial statements.
LS Opportunity Fund
Notes to the Financial Statements
November 30, 2024 - (Unaudited)
NOTE 1. ORGANIZATION
The LS Opportunity Fund (the “Fund”) is registered under the Investment Company Act of 1940, as amended (“1940 Act”), as an open-end, diversified series of Valued Advisers Trust (the “Trust”). The Trust is a management investment company established under the laws of Delaware by an Agreement and Declaration of Trust dated June 13, 2008 (the “Trust Agreement”). The Trust Agreement permits the Board of Trustees (the “Board” or the “Trustees”) to issue an unlimited number of shares of beneficial interest of separate series without par value. The Fund is one of a series of funds authorized by the Board. The Fund’s investment adviser is Long Short Advisors, LLC (the “Adviser”). The Adviser has retained Prospector Partners, LLC (the “Sub-Adviser”) to serve as the sub-adviser to provide portfolio management and related services to the Fund. The Sub-Adviser receives a fee from the Adviser (not the Fund) for these services. The investment objective of the Fund is to generate long-term capital appreciation by investing in both long and short positions within a portfolio consisting of primarily publicly-traded common stock, with less net exposure than that of the stock market in general.
NOTE 2. SIGNIFICANT ACCOUNTING POLICIES
The Fund is an investment company and follows accounting and reporting guidance under Financial Accounting Standards Board Accounting Standards Codification (“ASC”) Topic 946, “Financial Services-Investment Companies”. The following is a summary of significant accounting policies followed by the Fund in the preparation of its financial statements. These policies are in conformity with generally accepted accounting principles in the United States of America (“GAAP”).
Estimates – The preparation of financial statements in conformity with GAAP requires management to make estimates and assumptions that affect the reported amounts of assets and liabilities and disclosure of contingent assets and liabilities at the date of the financial statements and the reported amounts of increases and decreases in net assets from operations during the reporting period. Actual results could differ from those estimates.
Federal Income Taxes – The Fund makes no provision for federal income or excise tax. The Fund has qualified and intends to qualify each year as a regulated investment company (“RIC”) under subchapter M of the Internal Revenue Code of 1986, as amended, by complying with the requirements applicable to RICs and by distributing substantially all of its taxable income. The Fund also intends to distribute sufficient net investment income and net realized capital gains, if any, so that it will not be subject to excise tax on undistributed income and gains. If the required amount of net investment income or gains is not distributed, the Fund could incur a tax expense.
LS Opportunity Fund
Notes to the Financial Statements (continued)
November 30, 2024 - (Unaudited)
As of and during the six months ended November 30, 2024, the Fund did not have any liabilities for any unrecognized tax benefits. The Fund recognizes interest and penalties, if any, related to unrecognized tax benefits as income tax expense on the Statement of Operations when incurred. During the six months ended November 30, 2024, the Fund did not incur any interest or penalties. Management of the Fund has reviewed tax positions taken in tax years that remain subject to examination by all major tax jurisdictions, including federal (i.e., the last three tax year ends and the interim tax period since then, as applicable). Management believes that there is no tax liability resulting from unrecognized tax benefits related to uncertain tax positions taken.
Expenses – Expenses incurred by the Trust that do not relate to a specific fund of the Trust are allocated to the individual funds of the Trust based on each fund’s relative net assets or another appropriate basis (as determined by the Board).
Security Transactions and Related Income – The Fund follows industry practice and records security transactions on the trade date for financial reporting purposes. For financial statement and income tax purposes, the specific identification method is used for determining capital gains or losses. Dividend income and dividend expense are recorded on the ex-dividend date and interest income is recorded on an accrual basis. Dividend income from real estate investment trusts (REITs) and distributions from limited partnerships are recognized on the ex-date. The calendar year end classification of distributions received from REITs during the fiscal year are reported subsequent to year end; accordingly, the Fund estimates the character of REIT distributions based on the most recent information available. Income or loss from Limited Partnerships is reclassified among the components of net assets upon receipt of Schedules K-1 (Form 1065). Non-cash income, if any, is recorded at the fair market value of the securities received. Withholding taxes on foreign dividends, if any, have been provided for in accordance with the Fund’s understanding of the applicable country’s tax rules and rates.
Foreign Currency Translation – Foreign currency amounts are translated into U.S. dollars as follows: (i) assets and liabilities at the rate of exchange at the end of the respective period; and (ii) purchases and sales of securities and income and expenses at the rate of exchange prevailing on the dates of such transactions. The portion of the results of operations arising from changes in the exchange rates and the portion due to fluctuations arising from changes in the market prices of securities are not isolated. Such fluctuations are included with the net realized and unrealized gain or loss on investments.
The Fund may enter into transactions to purchase or sell foreign currencies to protect the U.S. dollar value of its underlying portfolio securities against the effect of possible adverse movements in foreign exchange rates. Principal risks associated with such transactions include the movement in value of the foreign currency relative to the U.S. dollar and the
LS Opportunity Fund
Notes to the Financial Statements (continued)
November 30, 2024 - (Unaudited)
ability of the counterparty to meet its obligations. Reported net realized foreign exchange gains or losses arise from sales of foreign currencies, currency gains or losses realized between the trade and settlement dates on securities transactions, and the difference between the amounts of dividends, interest, and foreign withholding taxes recorded on the company’s books and the U.S. dollar equivalent of the amounts actually received or paid. These instruments involve market risk, credit risk, or both in excess of the amount that would be recognized in the Statement of Assets and Liabilities. Risks arise from the possible inability of counterparties to meet the terms of their contracts and from movement in currency and securities values and interest rates.
The Fund may be subject to foreign taxes related to foreign income received, capital gain on the sale of securities and certain foreign currency transactions (a portion of which may be reclaimable). All foreign taxes are recorded in accordance with the applicable regulations and rates that exist in the foreign jurisdictions in which the Fund invests.
Dividends and Distributions – The Fund intends to distribute its net investment income and net realized long-term and short-term capital gains, if any, at least annually. Dividends and distributions to shareholders, which are determined in accordance with income tax regulations, are recorded on the ex-dividend date. The treatment for financial reporting purposes of distributions made to shareholders during the period from net investment income or net realized capital gains may differ from their ultimate treatment for federal income tax purposes. These differences are caused primarily by differences in the timing of the recognition of certain components of income, expense or realized capital gain for federal income tax purposes. Where such differences are permanent in nature, they are reclassified among the components of net assets based on their ultimate characterization for federal income tax purposes. Any such reclassifications will have no effect on net assets, results of operations or net asset value (“NAV”) per share of the Fund.
Share Valuation – The NAV is calculated each day the New York Stock Exchange (the “NYSE”) is open by dividing the total value of the Fund’s assets, less liabilities, by the number of shares outstanding for the Fund.
Short Sales – The Fund may make short sales as part of its overall portfolio management strategies or to offset a potential decline in value of a security. The Fund may engage in short sales with respect to various types of securities, including exchange-traded funds (ETFs). A short sale involves the sale of a security that is borrowed from a broker or other institution to complete the sale. The Fund may engage in short sales with respect to securities it owns, as well as securities that it does not own. Short sales expose the Fund to the risk that it will be required to acquire, convert or exchange securities to replace the borrowed securities (also known as “covering” the short position) at a time when the securities sold short have appreciated in value, thus resulting in a loss to the Fund. The
LS Opportunity Fund
Notes to the Financial Statements (continued)
November 30, 2024 - (Unaudited)
amount of loss may exceed the proceeds received in a short sale. The Fund’s investment performance may also suffer if the Fund is required to close out a short position earlier than it had intended. The Fund must segregate assets determined to be liquid in accordance with procedures established by the Board, or otherwise cover its position in a permissible manner. The Fund will be required to pledge liquid assets to the broker in order to secure its performance on short sales. As a result, the assets pledged may not be available to meet the Fund’s needs for immediate cash or other liquidity. In addition, the Fund may be subject to expenses related to short sales that are not typically associated with investing in securities directly, such as costs of borrowing and margin account maintenance costs associated with the Fund’s open short positions. These types of short sales expenses are sometimes referred to as the “negative cost of carry,” and will reduce the Fund’s potential return on a short sale. The amount of restricted cash or cash equivalents held at the broker as collateral for securities sold short was $69,730,567 as of November 30, 2024.
Dividend expenses on securities sold short and borrowing costs are not covered under the Adviser’s expense limitation agreement with the Fund and, therefore, these expenses will be borne by the shareholders of the Fund.
Purchasing Call Options – The Fund may purchase call options. As the holder of a call option, the Fund has the right to purchase the underlying security at the exercise price at any time during the option period. The Fund may enter into closing sale transactions with respect to such options, exercise them or permit them to expire. The Fund may also purchase call options on relevant stock indexes. Call options may also be purchased by the Fund for the purpose of acquiring the underlying securities for its portfolio. Utilized in this fashion, the purchase of call options enables the Fund to acquire the securities at the exercise price of the call option plus the premium paid. At times the net cost of acquiring securities in this manner may be less than the cost of acquiring the securities directly. This technique may also be useful to the Fund in purchasing a large block of securities that would be more difficult to acquire by direct market purchases. So long as it holds such a call option rather than the underlying security itself, the Fund is partially protected from any unexpected decline in the market price of the underlying security and in such event could allow the call option to expire, incurring a loss only to the extent of the premium paid for the option.
Purchasing Put Options – The Fund may purchase put options. As the holder of a put option, the Fund has the right to sell the underlying security at the exercise price at any time during the option period. The Fund may enter into closing sale transactions with respect to such options, exercise them or permit them to expire. The Fund may purchase a put option on an owned underlying security (a “protective put”) as a defensive technique to protect against an anticipated decline in the value of the security. Such hedge protection
LS Opportunity Fund
Notes to the Financial Statements (continued)
November 30, 2024 - (Unaudited)
is provided only during the life of the put option when the Fund, as the holder of the put option, is able to sell the underlying security at the put exercise price regardless of any decline in the underlying security’s market price. The Fund may also purchase put options at a time when it does not own the underlying security. By purchasing put options on a security it does not own, the Fund seeks to benefit from a decline in the market price of the underlying security. If the put option is not sold when it has remaining value, and if the market price of the underlying security remains equal to or greater than the exercise price during the life of the put option, the Fund will lose its entire premium paid for the put option. In order for the purchase of a put option to be profitable, the market price of the underlying security must decline sufficiently below the exercise price to cover the premium and transaction costs.
Writing Options – The Fund may write covered call options on equity securities that the Fund is eligible to purchase to extend a holding period to obtain long-term capital gain treatment, to earn premium income, to assure a definite price for a security it has considered selling, or to close out options previously purchased. The Fund may write covered call options if, immediately thereafter, not more than 30% of its net assets would be committed to such transactions. A call option gives the holder (buyer) the right to purchase a security at a specified price (the exercise price) at any time until a certain date (the expiration date). A call option is “covered” if the Fund owns the underlying security subject to the call option at all times during the option period. When the Fund writes a covered call option, it maintains a segregated account with its custodian, cash, or liquid portfolio securities in an amount not less than the exercise price at all times while the option is outstanding.
The Fund may write covered put options on equity securities and futures contracts that the Fund is eligible to purchase to earn premium income or to assure a definite price for a security if it is considering acquiring the security at a lower price than the current market price or to close out options previously purchased. The Fund may not write a put option if, immediately thereafter, more than 25% of its net assets would be committed to such transactions. A put option gives the holder of the option the right to sell, and the writer has the obligation to buy, the underlying security at the exercise price at any time during the option period. The operation of put options in other respects is substantially identical to that of call options. When the Fund writes a covered put option, it maintains in a segregated account with its custodian cash or liquid portfolio securities in an amount not less than the exercise price at all times while the put option is outstanding.
Foreign Currency Exchange Contracts – The Fund may engage in foreign currency exchange transactions. The value of the Fund’s portfolio securities that are invested in non-U.S. dollar denominated instruments as measured in U.S. dollars may be affected favorably or unfavorably by changes in foreign currency exchange rates, and the Fund
LS Opportunity Fund
Notes to the Financial Statements (continued)
November 30, 2024 - (Unaudited)
may incur costs in connection with conversions between various currencies. The Fund will conduct its foreign currency exchange transactions either on a spot (i.e., cash) basis at the spot rate prevailing in the foreign currency exchange market or through forward foreign currency exchange contracts, to purchase or sell foreign currencies. A forward foreign currency exchange contract involves an obligation to purchase or sell a specific currency at a future date, which may be any fixed number of days from the date of the contract agreed upon by the parties, at a price set at the time of the contract. These contracts are traded directly between currency traders (usually large commercial banks) and their customers. The Fund will not, however, hold foreign currency except in connection with the purchase and sale of foreign portfolio securities. The Fund did not transact in forward foreign currency exchange contracts during the six months ended November 30, 2024.
Derivative Transactions – The following tables identify the location and fair value of derivative instruments on the Statement of Assets and Liabilities as of November 30, 2024 and the effect of derivative instruments on the Statement of Operations for the six months ended November 30, 2024.
As of November 30, 2024:
| Derivatives | | Location of Derivatives on
Statement of Assets
and Liabilities | | Fair Value | |
| Equity Price Risk: | | | | | | |
| Options Purchased | | Investments in securities at fair value | | $ | 48,158 | |
| Options Written | | Options written, at fair value | | | (810,460 | ) |
LS Opportunity Fund
Notes to the Financial Statements (continued)
November 30, 2024 - (Unaudited)
For the six months ended November 30, 2024:
| Derivatives | | Location of Gain (Loss) on
Derivatives on Statement of
Operations | | Realized Gain
(Loss) on
Derivatives | | | Change in Unrealized
Appreciation
(Depreciation) on
Derivatives | |
| Equity Price Risk: | | | | | | | | |
| Options Purchased | | Net realized change in unrealized depreciation on purchased options | | $ | (289,922 | ) | | $ | (6,787 | ) |
| Options Written | | Net realized change in unrealized depreciation on written options | | | (155,113 | ) | | | (370,278 | ) |
The following table summarizes the average ending monthly fair value of derivatives outstanding during the six months ended November 30, 2024:
| | | Average Ending
Monthly Fair | |
| Derivatives | | Value(a) | |
| Options Purchased | | $ | 158,334 | |
| Options Written | | | (481,372 | ) |
| (a) | Average based on the 6 months during the period that had activity. |
The following table provides a summary of offsetting financial liabilities and derivatives and the effect of derivative instruments on the Statement of Assets and Liabilities as of November 30, 2024:
| | | Gross Amounts of | | | Gross Amounts Offset in Statement of | | | Net Amounts of Liabilities Presented in Statement of | | | Gross Amounts Not Offset in
Statements of Assets and Liabilities | | | | |
| | | Recognized
Liabilities | | | Assets and
liabilities | | | Assets and
Liabilities | | | Financial
Instruments | | | Collateral
Pledged | | | Net
Amount | |
| Written Options | | $ | 810,460 | | | $ | — | | | $ | 810,460 | | | $ | (810,460 | ) | | $ | — | | | $ | — | |
Other - The Securities and Exchange Commission (“SEC”) adopted Rule 18f-4 under the 1940 Act which, effective August 19, 2022, regulates the use of derivatives for certain funds registered under the 1940 Act (“Rule 18f-4”). The Trust has adopted a Rule 18f-4 Policy which provides, among other things, that unless a Fund qualifies as a “limited derivatives user” as defined in Rule 18f-4, the Fund is required to establish and maintain a comprehensive derivatives risk management program, subject to oversight by the Board,
LS Opportunity Fund
Notes to the Financial Statements (continued)
November 30, 2024 - (Unaudited)
to appoint a derivatives risk manager, to comply with certain value-at-risk based leverage limits and to provide additional disclosure both publicly and to the SEC regarding its derivatives positions. If a fund qualifies as a limited derivatives user, Rule 18f-4 requires the fund to have policies and procedures to manage its aggregate derivatives risk. The Fund has not qualified as a limited derivatives user and is currently complying with Rule 18f-4.
NOTE 3. SECURITIES VALUATION AND FAIR VALUE MEASUREMENTS
The Fund values its portfolio securities at fair value as of the close of regular trading on the NYSE (normally 4:00 p.m. Eastern time) on each business day the NYSE is open for business. Fair value is defined as the price that the Fund would receive upon selling an investment in a timely transaction to an independent buyer in the principal or most advantageous market of the investment. GAAP establishes a three-tier hierarchy to maximize the use of observable market data and minimize the use of unobservable inputs and to establish classification of fair value measurements for disclosure purposes.
Inputs refer broadly to the assumptions that market participants would use in pricing the asset or liability, including assumptions about risk (the risk inherent in a particular valuation technique used to measure fair value including a pricing model and/or the risk inherent in the inputs to the valuation technique). Inputs may be observable or unobservable. Observable inputs are inputs that reflect the assumptions market participants would use in pricing the asset or liability developed based on market data obtained and available from sources independent of the reporting entity. Unobservable inputs are inputs that reflect the reporting entity’s own assumptions about the assumptions market participants would use in pricing the asset or liability developed based on the best information available in the circumstances.
Various inputs are used in determining the value of the Fund’s investments. These inputs are summarized in the three broad levels listed below.
| ● | Level 1 – unadjusted quoted prices in active markets for identical investments and/or registered investment companies where the value per share is determined and published and is the basis for current transactions for identical assets or liabilities at the valuation date |
| ● | Level 2 – other significant observable inputs (including, but not limited to, quoted prices for an identical security in an inactive market, quoted prices for similar securities, interest rates, prepayment speeds, credit risk, etc.) |
| ● | Level 3 – significant unobservable inputs (including the Fund’s own assumptions in determining fair value of investments based on the best information available) |
LS Opportunity Fund
Notes to the Financial Statements (continued)
November 30, 2024 - (Unaudited)
The inputs used to measure fair value may fall into different levels of the fair value hierarchy. In such cases, for disclosure purposes, the level in the fair value hierarchy which is reported is determined based on the lowest level input that is significant to the fair value measurement in its entirety.
Equity securities that are traded on any stock exchange are generally valued at the last quoted sale price on the security’s primary exchange. Lacking a last sale price, an exchange-traded security is generally valued at its last bid price, except in the case of a security sold short, in which case the last ask price is utilized. Securities traded in the NASDAQ over-the-counter market are generally valued at the NASDAQ Official Closing Price. When using the market quotations and when the market is considered active, the security is classified as a Level 1 security. In the event that market quotations are not readily available or are considered unreliable due to market or other events, securities are valued in good faith by the Adviser as “Valuation Designee” under the oversight of the Board. The Adviser has adopted written policies and procedures for valuing securities and other assets in circumstances where market quotes are not readily available. In the event that market quotes are not readily available, and the security or asset cannot be valued pursuant to one of the valuation methods, the value of the security or asset will be determined in good faith by the Adviser pursuant to its policies and procedures. On a quarterly basis, the Adviser’s fair valuation determinations will be reviewed by the Board. Under these policies, the securities will be classified as Level 2 or 3 within the fair value hierarchy, depending on the inputs used.
In accordance with the Trust’s valuation policies, the Valuation Designee is required to consider all appropriate factors relevant to the value of securities for which it has determined other pricing sources are not available or reliable as described above. No single method exists for determining fair value, because fair value depends upon the circumstances of each individual case. As a general principle, the current fair value of a security being valued by the Valuation Designee would be the amount that the Fund might reasonably expect to receive upon the current sale. Methods that are in accordance with this principle may, for example, be based on (i) a multiple of earnings; (ii) a discount from market prices of a similar freely traded security (including a derivative security or a basket of securities traded on other markets, exchanges or among dealers); or (iii) yield to maturity with respect to debt issues, or a combination of these and other methods. Fair-value pricing is permitted if, in the Valuation Designee’s opinion, the validity of market quotations appears to be questionable based on factors such as evidence of a thin market in the security based on a small number of quotations, a significant event occurs after the close of a market but before the Fund’s NAV calculation that may affect a security’s value, or the Valuation Designee is aware of any other data that calls into question the reliability of market quotations.
LS Opportunity Fund
Notes to the Financial Statements (continued)
November 30, 2024 - (Unaudited)
Investments in mutual funds, including money market mutual funds, are generally priced at the ending NAV. These securities are categorized as Level 1 securities.
Exchange-traded options on securities and indices purchased or sold by the Fund generally will be valued at the mean of the last bid and ask prices. If there is no such reported ask on the valuation date, purchased options are valued at the most recent bid price. If there is no such reported bid on the valuation date, written options are valued at the most recent ask price. On the last business day of each month, the Cboe Options Exchange (“Cboe”) conducts special end-of-month non-trading closing rotations for the sole purpose of determining the fair value of the S&P 500® Index (SPX) option series. For month end valuations of SPX, the Cboe adjusted price will be used if the special end-of-month non-trading closing rotation fair value price differs from the price provided at market close. Options will generally be categorized as Level 2 securities.
The following is a summary of the inputs used to value the Fund’s investments as of November 30, 2024:
| | | Valuation Inputs | |
| Assets | | Level 1 | | | Level 2 | | | Level 3 | | | Total | |
| Common Stocks - Long - Domestic(a) | | $ | 166,787,552 | | | $ | — | | | $ | — | | | $ | 166,787,552 | |
| Common Stocks - Long - International(a) | | | 32,180,122 | | | | — | | | | — | | | | 32,180,122 | |
| Exchange-Traded Funds | | | 1,523,724 | | | | — | | | | — | | | | 1,523,724 | |
| Put Options Purchased | | | — | | | | 48,158 | | | | — | | | | 48,158 | |
| Money Market Funds | | | 8,661,914 | | | | — | | | | — | | | | 8,661,914 | |
| Total | | $ | 209,153,312 | | | $ | 48,158 | | | $ | — | | | $ | 209,201,470 | |
| (a) | Refer to Schedule of Investments for sector classifications. |
| | | Valuation Inputs | |
| Liabilities | | Level 1 | | | Level 2 | | | Level 3 | | | Total | |
| Common Stocks - Short - Domestic(a) | | $ | (48,782,569 | ) | | $ | — | | | $ | — | | | $ | (48,782,569 | ) |
| Common Stocks - Short - International(a) | | | (11,714,841 | ) | | | — | | | | — | | | | (11,714,841 | ) |
| Exchange-Traded Funds | | | (8,653,659 | ) | | | — | | | | — | | | | (8,653,659 | ) |
| Call Options Written | | | — | | | | (810,460 | ) | | | — | | | | (810,460 | ) |
| Total | | $ | (69,151,069 | ) | | $ | (810,460 | ) | | $ | — | | | $ | (69,961,529 | ) |
| (a) | Refer to Schedule of Securities Sold Short for sector classifications. |
The Fund did not hold any investments at the end of the reporting period for which significant unobservable inputs (Level 3) were used in determining fair value; therefore, no reconciliation of Level 3 securities is included for this reporting period.
LS Opportunity Fund
Notes to the Financial Statements (continued)
November 30, 2024 - (Unaudited)
NOTE 4. FEES AND OTHER TRANSACTIONS WITH AFFILIATES AND OTHER SERVICE PROVIDERS
The Adviser, under the terms of the management agreement (the “Agreement”), manages the Fund’s investments. As compensation for its management services, the Fund pays the Adviser a fee, computed and accrued daily and paid monthly, at an annual rate of 1.75% of the Fund’s average daily net assets.
The Adviser has contractually agreed to waive its management fee and/or reimburse certain Fund operating expenses, but only to the extent necessary so that the Fund’s net expenses (excluding borrowing costs such as interest and dividends on securities sold short, taxes, brokerage commissions, other expenditures which are capitalized in accordance with generally accepted accounting principles, other extraordinary expenses not incurred in the ordinary course of the Fund’s business, expenses incurred under a Rule 12b-1 plan of distribution, “acquired fund fees and expenses” (i.e., investment companies in which the Fund may invest), and expenses that the Fund has incurred but did not actually pay because of an expense offset arrangement) do not exceed 1.95% of the average daily net assets of the Fund.
Each fee waiver or expense reimbursement by the Adviser is subject to repayment by the Fund within the three years following the date on which the fee waiver or expense reimbursement occurred, provided that the Fund is able to make the repayment without exceeding the expense limitation that is in effect at the time of the repayment or at the time of the fee waiver or expense reimbursement, whichever is lower. The contractual agreement is in effect through September 30, 2025. The expense cap may not be terminated prior to this date except by mutual consent of the Adviser and the Board. The amounts subject to repayment by the Fund, pursuant to the aforementioned conditions, are as follows:
| Recoverable Through | | | |
| May 31, 2025 | | $ | 24,674 | |
| May 31, 2026 | | | 63,106 | |
| May 31, 2027 | | | 75,095 | |
| November 30, 2027 | | | 17,194 | |
The Trust retains Ultimus Fund Solutions, LLC (“Ultimus” or the “Administrator”) to provide the Fund with administration, fund accounting and transfer agent services, including all regulatory reporting.
Northern Lights Compliance Services, LLC (“NLCS”), an affiliate of Ultimus, provides a Chief Compliance Officer and an Anti-Money Laundering Officer to the Trust, as well as
LS Opportunity Fund
Notes to the Financial Statements (continued)
November 30, 2024 - (Unaudited)
related compliance services, pursuant to a consulting agreement between NLCS and the Trust. Under the terms of such agreement, NLCS receives fees from the Fund.
The officers of the Trust are members of management and/or employees of Ultimus or of NLCS, and are not paid by the Trust for services to the Fund. Ultimus Fund Distributors, LLC (the “Distributor”) acts as the distributor of the Fund’s shares. The Distributor is a wholly-owned subsidiary of Ultimus. There were no payments made to the Distributor by the Fund for the six months ended November 30, 2024.
NOTE 5. PURCHASES AND SALES OF SECURITIES
For the six months ended November 30, 2024, purchases and sales of investment securities, including written options, short sales and covers, other than short-term investments, were $74,325,489 and $66,792,684, respectively.
There were no purchases or sales of long-term U.S. government obligations during the six months ended November 30, 2024.
NOTE 6. FEDERAL TAX INFORMATION
At November 30, 2024, the net unrealized appreciation (depreciation) and tax cost of investments and securities sold short, including written options, for tax purposes was as follows:
| Gross unrealized appreciation | | $ | 64,244,969 | |
| Gross unrealized depreciation | | | (11,136,654 | ) |
| Net unrealized appreciation on investments | | $ | 53,108,315 | |
| Tax cost of investments and securities sold short | | $ | 86,131,626 | |
The difference between book basis and tax basis unrealized appreciation is attributable primarily to the tax deferral of losses on wash sales, grantor trust adjustments and return of capital distributions from underlying investments.
At May 31, 2024, the components of accumulated earnings (deficit) on a tax basis were as follows:
| Undistributed ordinary income | | $ | 1,172,232 | |
| Accumulated capital and other losses | | | (128,857 | ) |
| Unrealized appreciation on investments | | | 37,801,656 | |
| Total accumulated earnings | | $ | 38,845,031 | |
LS Opportunity Fund
Notes to the Financial Statements (continued)
November 30, 2024 - (Unaudited)
As of May 31, 2024, the Fund had short-term capital loss carry forwards of $127,673 These capital loss carryforwards, which do not expire, may be utilized in future years to offset net realized capital gains, if any, prior to distributing such gains to shareholders.
NOTE 7. INDEMNIFICATIONS
The Trust indemnifies its officers and Trustees for certain liabilities that may arise from their performance of their duties to the Trust or the Fund. Additionally, in the normal course of business, the Trust enters into contracts that contain a variety of representations and warranties which provide general indemnifications. The Trust’s maximum exposure under these arrangements is unknown, as this would involve future claims that may be made against the Trust that have not yet occurred.
NOTE 8. SUBSEQUENT EVENTS
Management of the Fund has evaluated the need for disclosures and/or adjustments resulting from subsequent events through the date at which these financial statements were issued. Based upon this evaluation, management has determined there were no items requiring adjustment of the financial statements or additional disclosure.
Proxy Voting Results (Unaudited)
At a Special Shareholder Meeting at which a quorum was present, held on June 27, 2024, Fund shareholders of record as of the close of business on May 13, 2024 voted to approve the following proposal:
Proposal 1: To elect the following individuals to serve on the Board of Trustees of the Trust:
Martin A. Burns
Susan J. Templeton
| | | Shares Voted in
Favor* | | Shares Voted
Against or Abstain* | | Shares Needed to
Approve* |
| Martin A. Burns | | 82,650,826 | | 53,513 | | Plurality |
| | | (99.94%) | | (0.06%) | | (greater than 50%) |
| Susan J. Templeton | | 82,570,073 | | 134,262 | | Plurality |
| | | (99.84%) | | (0.16%) | | (greater than 50%) |
| * | as a percentage of the total voting securities of the Fund voted at the meeting at which a quorum was present. |
Additional Information (Unaudited)
Changes in and Disagreements with Accountants
There were no changes in or disagreements with accountants during the period covered by this report.
Proxy Disclosures
Not applicable
Remuneration Paid to Directors, Officers and Others
Refer to the financial statements included herein.
Statement Regarding Basis for Approval of Investment Advisory Agreement
Not applicable.
Proxy Voting
A description of the policies and procedures that the Fund uses to determine how to vote proxies relating to portfolio securities and information regarding how the Fund voted those proxies during the most recent twelve month period ended June 30, are available (1) without charge upon request by calling the Fund at (877) 336-6763 and (2) in Fund documents filed with the SEC on the SEC’s website at www.sec.gov.
TRUSTEES
Andrea N. Mullins, Chairperson | INDEPENDENT REGISTERED PUBLIC ACCOUNTING FIRM |
Ira P. Cohen Martin A. Burns Susan J. Templeton | Cohen & Company, Ltd.
1350 Euclid Avenue, Suite 800 Cleveland, OH 44115 |
| | |
| OFFICERS | LEGAL COUNSEL |
Matthew J. Miller, Principal Executive Officer and President Zachary P. Richmond, Principal Financial Officer and Treasurer Michael Wittke, Chief Compliance Officer Carol J. Highsmith, Vice President and Secretary | DLA Piper LLP (US) One Atlantic Center 1201 West Peachtree Street, Suite 2900 Atlanta, Georgia 30309 |
| | |
| INVESTMENT ADVISER | CUSTODIAN |
Long Short Advisors, LLC 3330 Fairchild Gardens Avenue, Suite 30428 Palm Beach Gardens, FL 33420 | U.S. Bank, N.A.
425 Walnut Street
Cincinnati, OH 45202 |
| | |
DISTRIBUTOR
Ultimus Fund Distributors, LLC | ADMINISTRATOR, TRANSFER AGENT AND FUND ACCOUNTANT |
225 Pictoria Drive, Suite 450
Cincinnati, OH 45246 | Ultimus Fund Solutions, LLC
225 Pictoria Drive, Suite 450
Cincinnati, OH 45246 |
This report is intended only for the information of shareholders or those who have received the Fund’s prospectus which contains information about the Fund’s management fee and expenses. Please read the prospectus carefully before investing.
Distributed by Ultimus Fund Distributors, LLC, Member FINRA/SIPC
Item 8. Changes in and Disagreements with Accountants for Open-End Management Investment Companies.
Not applicable.
Item 9. Proxy Disclosures for Open-End Management Investment Companies.
Included under Item 7.
Item 10. Remuneration Paid to Directors, Officers, and Others of Open-End Management Investment Companies.
Included under Item 7.
Item 11. Statement Regarding Basis for Approval of Investment Advisory Contract.
Included under Item 7.
Item 12. Disclosure of Proxy Voting Policies and Procedures for Closed-End Management Investment Companies.
Not applicable.
Item 13. Portfolio Managers of Closed-End Management Investment Companies.
Not applicable.
Item 14. Purchases of Equity Securities by Closed-End Management Investment Company and Affiliated Purchasers.
Not applicable.
Item 15. Submission of Matters to a Vote of Security Holders.
None.
Item 16. Controls and Procedures
| (a) | The registrant’s Principal Executive Officer and Principal Financial Officer have concluded that the registrant’s disclosure controls and procedures (as defined in Rule 30a-3(c) under the Act) are effective in design and operation and are sufficient to form the basis of the certifications required by Rule 30a-(2) under the Act, based on their evaluation of these disclosure controls and procedures as of a date within 90 days of this report on Form N-CSR. |
| (b) | There were no changes in the registrant’s internal control over financial reporting (as defined in Rule 30a-3(d) under the Act) during the period covered by this report that have materially affected, or are reasonably likely to materially affect, the registrant’s internal control over financial reporting. |
Item 17. Disclosure of Securities Lending Activities for Closed-End Management Investment Companies.
Not applicable.
Item 18. Recovery of Erroneously Awarded Compensation.
Item 19. Exhibits.
| (a)(1) | Not applicable – disclosed with annual report. |
| | |
| (a)(2) | Not applicable. |
SIGNATURES
Pursuant to the requirements of the Securities Exchange Act of 1934 and the Investment Company Act of 1940, the registrant has duly caused this report to be signed on its behalf by the undersigned, thereunto duly authorized.
Valued Advisers Trust
| By | /s/ Matthew J. Miller | |
| Matthew J. Miller | |
| President and Principal Executive Officer | |
| Date: | 2/5/2025 | | |
Pursuant to the requirements of the Securities Exchange Act of 1934 and the Investment Company Act of 1940, this report has been signed below by the following persons on behalf of the registrant and in the capacities and on the dates indicated.
| By | /s/ Matthew J. Miller | |
| Matthew J. Miller | |
| President and Principal Executive Officer | |
| Date: | 2/5/2025 | | |
| By | /s/ Zachary P. Richmond | |
| Zachary P. Richmond | |
| Treasurer and Principal Financial Officer | |
| Date: | 2/5/2025 | | |