Exhibit 99.1
EVALUATIONSUMMARY
LILISENERGY, INC. INTERESTS
DELAWAREBASINPROPERTIES INTEXAS ANDNEWMEXICO
TOTALPROVEDRESERVES
AS OFDECEMBER31, 2017
Pursuant to the Guidelines of the
Securities and Exchange Commission for
Reporting Corporate Reserves and
Future Net Revenue

EVALUATIONSUMMARY
LILISENERGY, INC. INTERESTS
DELAWAREBASINPROPERTIES INTEXAS ANDNEWMEXICO
TOTALPROVEDRESERVES
AS OFDECEMBER31, 2017
Pursuant to the Guidelines of the
Securities and Exchange Commission for
Reporting Corporate Reserves and
Future Net Revenue
| | CAWLEY, GILLESPIE& ASSOCIATES, INC. |
| | PETROLEUMCONSULTANTS |
| | TEXASREGISTEREDENGINEERINGFIRMF-693 |
| |  |  |
| | W. TODDBROOKER, P.E. |
| | PRESIDENT |
| |  |  |
| | MATTHEWK. REGAN, P.E. |
| | PARTNER |
CAWLEY, GILLESPIE& ASSOCIATES, INC.
PETROLEUM CONSULTANTS
| 13640 BRIARWICK DRIVE, SUITE 100 | 306 WEST SEVENTH STREET, SUITE 302 | 1000 LOUISIANA STREET, SUITE 1900 |
| AUSTIN, TEXAS 78729-1107 | FORT WORTH, TEXAS 76102-4987 | HOUSTON, TEXAS 77002-5008 |
| 512-249-7000 | 817- 336-2461 | 713-651-9944 |
| | www.cgaus.com | |
January 10, 2018
Lilis Energy, Inc.
300 E. Sonterra Blvd, Suite 1220
San Antonio, TX 78258
| | Re: | Evaluation Summary |
| | | Lilis Energy, Inc. Interests |
| | | Total Proved Reserves |
| | | As of December 31, 2017 |
| | | |
| | | Pursuant to the Guidelines of the |
| | | Securities and Exchange Commission for |
| | | Reporting Corporate Reserves and |
| | | Future Net Revenue |
Ladies and Gentlemen:
As requested, this report was prepared on January 10, 2018 for Lilis Energy, Inc. (“LEI”) for the purpose of submitting our estimates of proved reserves and forecasts of economics attributable to the subject interests. We have evaluated 100% of LEI reserves, which are made up of oil and gas properties in the Delaware Basin. This evaluation utilized an effective date of December 31, 2017, was prepared using constant prices and costs, and conforms to Item 1202(a)(8) of Regulation S-K and other rules of theSecurities and Exchange Commission(SEC). The results of this evaluation are presented in the accompanying tabulations, with a composite summary of the values presented below:
| | | Proved Developed Producing | Proved Developed Non-Producing | Proved Undeveloped | Proved Developed | Total Proved |
| Net Reserves | | | | | | |
| Oil | - Mbbl | 1,674.2 | 857.2 | 4,639.9 | 2,531.4 | 7,171.3 |
| Gas | - MMcf | 4,298.8 | 2,295.6 | 9,465.5 | 6,594.4 | 16,059.9 |
| NGL | - Mbbl | 422.2 | 221.9 | 960.5 | 644.1 | 1,604.6 |
| Revenue | | | | | | |
| Oil | - M$ | 79,902.3 | 40,928.5 | 221,539.6 | 120,830.8 | 342,370.4 |
| Gas | - M$ | 11,188.3 | 5,953.8 | 24,789.0 | 17,142.1 | 41,931.0 |
| NGL | - M$ | 3,278.1 | 1,568.8 | 8,382.6 | 4,846.9 | 13,229.5 |
| | | | | | | |
| Severance Taxes | - M$ | 5,266.9 | 2,442.8 | 13,786.5 | 7,709.7 | 21,496.1 |
| Ad Valorem Taxes | - M$ | 2,925.4 | 1,211.3 | 7,573.2 | 4,136.6 | 11,709.8 |
| Operating Expenses | - M$ | 24,469.7 | 10,521.7 | 52,467.4 | 34,991.3 | 87,458.7 |
| Other Deductions | - M$ | 6,994.4 | 3,884.6 | 19,912.2 | 10,879.0 | 30,791.2 |
| Investments | - M$ | 0.0 | 6,266.4 | 107,460.5 | 6,266.4 | 113,726.9 |
| | | | | | | |
| Net Cash Flows | - M$ | 54,712.4 | 24,124.4 | 53,511.4 | 78,836.7 | 132,348.2 |
| | | | | | | |
| Discounted @ 10% | - M$ | 40,043.3 | 16,609.0 | 12,159.7 | 56,652.3 | 68,812.0 |
| (Present Worth) | | | | | | |
Lilis Energy, Inc. Interests
January 10, 2018
Page 2
Future revenue is prior to deducting state production taxes and ad valorem taxes. Future net cash flow is after deducting these taxes, future capital costs and operating expenses, but before consideration of federal income taxes. In accordance with SEC guidelines, the future net cash flow has been discounted at an annual rate of ten percent to determine its “present worth”. The present worth is shown to indicate the effect of time on the value of money and should not be construed as being the fair market value of the properties. The oil reserves include oil and condensate. Oil and NGL volumes are expressed in barrels (42 U.S. gallons). Gas volumes are expressed in thousands of standard cubic feet (Mcf) at contract temperature and pressure base.
Our estimates are for proved reserves only and do not include any probable or possible reserves nor have any values been attributed to interest in acreage beyond the location for which undeveloped reserves have been estimated. The Proved Developed category is the summation of the Proved Developed Producing and Proved Developed Non-Producing estimates.
Presentation
This report is divided into four main sections: Summary (Total Proved and Proved Developed), Proved Developed Producing (“PDP”), Proved Developed Non-Producing (“PDNP”) and Proved Undeveloped (“PUD”). Within each section are Tables I and Summary Plots. Tables II and Individual Figures and Tables are also included in the PDP, PDNP and PUD sections. The Tables I present composite reserve estimates and economic forecasts for the particular reserve category or property grouping. The Summary Plots are composite rate-time history-forecast curves for the corresponding Table I. Following certain Summary Plots are Table II “oneline” summaries that present estimates of ultimate recovery, gross and net reserves, ownership, revenue, expenses, investments, net income and discounted cash flow for the individual properties that make up the corresponding Table I. Individual Figures and Tables present reserve estimates, economic forecasts and rate-time plots on a lease or well level. For a more detailed explanation of the report layout, please refer to the Table of Contents following this letter.
Hydrocarbon Pricing
The base SEC oil and gas prices calculated for December 31, 2017 were $51.34/Bbl and $2.976/MMBTU, respectively. As specified by the SEC, a company must use a 12-month average price, calculated as the unweighted arithmetic average of the first-day-of-the-month price for each month within the 12-month period prior to the end of the reporting period. The base oil price is based upon WTI-Cushing spot prices (Bloomberg) from January - December 2017 and the base gas price is based upon Henry Hub spot prices (Gas Daily) from January - December 2017.
The base prices shown above were adjusted for differentials on a per-property basis, which may include local basis differentials, transportation, gas shrinkage, gas heating value (BTU content) and/or crude quality and gravity corrections. Natural gas liquid (NGL) prices were applied as a percentage of WTI. After these adjustments, the net realized prices for the SEC price case over the life of the proved properties was estimated to be $47.741 per barrel for oil, $2.611 per MCF for gas and $8.245 per barrel for NGLs. All economic factors were held constant in accordance with SEC guidelines.
Economic Parameters
Ownership was accepted as furnished and has not been independently confirmed. Oil and gas price differentials, gas shrinkage, ad valorem taxes, severance taxes, lease operating expenses and investments were calculated and prepared by LEI and were reviewed by us for accuracy and completeness. In some cases, data was accepted as provided. Lease operating expenses were either determined at the area or individual well level using averages calculated from historical lease operating statements. All economic parameters, including lease operating expenses and investments, were held constant (not escalated) throughout the life of these properties.
Lilis Energy, Inc. Interests
January 10, 2018
Page 3
SEC Conformance and Regulations
The reserve classifications and the economic considerations used herein conform to the criteria of the SEC as defined in pages 3 and 4 of the Appendix. The reserves and economics are predicated on regulatory agency classifications, rules, policies, laws, taxes and royalties currently in effect except as noted herein. The possible effects of changes in legislation or other Federal or State restrictive actions which could affect the reserves and economics have not been considered. However, we do not anticipate nor are we aware of any legislative changes or restrictive regulatory actions that may impact the recovery of reserves.
This evaluation includes 20 proved undeveloped locations. Each of the drilling locations proposed conform to the proved undeveloped standards as set forth by the SEC. In our opinion, LEI has indicated they have every intent to complete this development plan as scheduled. Furthermore, LEI has indicated that they have the proper company staffing, financial backing and prior development success to ensure this development plan will be fully executed.
Reserve Estimation Methods
The methods employed in estimating reserves are described in page 2 of the Appendix. Reserves for proved developed producing wells were estimated using production performance methods. Certain new producing properties with little production history were forecast using a combination of production performance and analogy to similar production, both of which are considered to provide a relatively high degree of accuracy.
Non-producing reserve estimates, for both developed and undeveloped properties, were forecast using a combination of volumetric and analogy methods. These methods provide a relatively high degree of accuracy for predicting proved developed non-producing and proved undeveloped reserves for LEI properties. The assumptions, data, methods and procedures used herein are appropriate for the purpose served by this report.
General Discussion
The estimates and forecasts were based upon interpretations of data furnished by your office and available from our files. To some extent information from public records has been used to check and/or supplement these data. The basic engineering and geological data were subject to third party reservations and qualifications. Nothing has come to our attention, however, that would cause us to believe that we are not justified in relying on such data. All estimates represent our best judgment based on the data available at the time of preparation. Due to inherent uncertainties in future production rates, commodity prices and geologic conditions, it should be realized that the reserve estimates, the reserves actually recovered, the revenue derived therefrom and the actual cost incurred could be more or less than the estimated amounts.
An on-site field inspection of the properties has not been performed. The mechanical operation or condition of the wells and their related facilities havenotbeen examined nor have the wells been tested by Cawley, Gillespie & Associates, Inc. Possible environmental liability related to the properties has not been investigated nor considered. The cost of plugging and the salvage value of equipment at abandonment have not been included.
Lilis Energy, Inc. Interests
January 10, 2018
Page 4
Cawley, Gillespie & Associates, Inc. is a Texas Registered Engineering Firm (F-693), made up of independent registered professional engineers and geologists that have provided petroleum consulting services to the oil and gas industry for over 50 years. This evaluation was supervised by W. Todd Brooker, President at Cawley, Gillespie & Associates, Inc. and a State of Texas Licensed Professional Engineer (License #83462). We do not own an interest in the properties or Lilis Energy, Inc. and are not employed on a contingent basis. We have used all methods and procedures that we consider necessary under the circumstances to prepare this report. Our work-papers and related data utilized in the preparation of these estimates are available in our office.
| | Yours very truly, |
| | |
| | CAWLEY, GILLESPIE & ASSOCIATES, INC. |
| | TEXASREGISTEREDENGINEERINGFIRMF-693 |
| | | |
| | W. Todd Brooker, P. E. |
| | President |
TABLE OFCONTENTS
Lilis Energy, Inc. Interests
Delaware Basin Properties in Texas and New Mexico
As of December 31, 2017
REPORTLETTER
TABLE OFCONTENTS
SUMMARYTAB
| · | Table I & Summary Plot – TP |
| · | Table I & Summary Plot – PD |
PROVEDDEVELOPEDPRODUCING
| · | Table I & Summary Plot – PDP |
| · | Table II – PDP (One-Line Summary Alphabetical by Lease Name) |
| · | Individual Figures and Tables 1-21 |
PROVEDDEVELOPEDNON-PRODUCING
| · | Table I & Summary Plot – PDNP |
| · | Table II – PDNP (One-Line Summary Alphabetical by Lease Name) |
| · | Individual Figures and Tables 1-5 |
PROVEDUNDEVELOPED
| · | Table I & Summary Plot – PUD |
| · | Table II – PUD (One-Line Summary Alphabetical by Lease Name) |
| · | Individual Figures and Tables 1-20 |
APPENDIXTAB
| · | Page 1 – Explanatory Comments for Summary Tables |
| · | Page 2 – Methods Employed in the Estimation of Reserves |
| · | Pages 3–4 – Reserve Definitions and Classifications |
| · | Page 5 – Professional Qualifications of Primary Technical Person |
| Note: | Table I’s are Grand Total Summaries of Reserves and Economics |
Table II’s are “One–Line” Lease Summaries of Economics for wells/leases in corresponding Table I’s.
Summary Plots are Grand Total Rate–Time History–Forecast Curves based on the corresponding Table I.
i
Table I - TP
Composite Reserve Estimates and Economic Forecasts
Lilis Energy, Inc. Interests
Delaware Basin Properties in Texas and New Mexico
Total Proved Reserves
As of December 31, 2017
| (1) | (2) | (3) | (4) | (5) | (6) | (7) | (8) | (9) | (10) | |
| | Gross Oil | Gross Gas | Gross NGL | Net Oil | Net Gas | Net NGL | Avg Oil | Avg Gas | Avg NGL | |
| End | Production | Production | Production | Production | Sales | Production | Price | Price | Price | |
| Mo-Year | MBBLS | MMCF | MBBLS | MBBLS | MMCF | MBBLS | $/BBL | $/MCF | $/BBL | |
| 12-2018 | 1,421.3 | 4,678.7 | 317.9 | 851.020 | 1,895.276 | 189.877 | 47.741 | 2.612 | 8.321 | |
| 12-2019 | 1,287.6 | 4,258.9 | 289.6 | 760.267 | 1,698.439 | 170.089 | 47.740 | 2.612 | 8.296 | |
| 12-2020 | 1,684.9 | 5,367.6 | 366.8 | 939.654 | 2,040.168 | 204.885 | 47.740 | 2.613 | 8.401 | |
| 12-2021 | 1,567.5 | 4,946.1 | 338.2 | 805.219 | 1,744.817 | 175.045 | 47.740 | 2.613 | 8.380 | |
| 12-2022 | 1,028.4 | 3,308.9 | 225.5 | 545.299 | 1,205.989 | 120.539 | 47.738 | 2.611 | 8.263 | |
| 12-2023 | 802.1 | 2,611.8 | 177.6 | 430.385 | 963.825 | 96.118 | 47.736 | 2.610 | 8.191 | |
| 12-2024 | 669.8 | 2,198.6 | 149.4 | 361.778 | 817.060 | 81.359 | 47.735 | 2.609 | 8.143 | |
| 12-2025 | 572.3 | 1,902.6 | 129.1 | 310.271 | 710.258 | 70.648 | 47.743 | 2.609 | 8.110 | |
| 12-2026 | 504.3 | 1,687.9 | 114.5 | 274.175 | 632.058 | 62.826 | 47.746 | 2.608 | 8.089 | |
| 12-2027 | 452.7 | 1,520.3 | 103.1 | 246.611 | 570.554 | 56.690 | 47.746 | 2.608 | 8.076 | |
| 12-2028 | 409.5 | 1,386.9 | 94.0 | 222.957 | 521.270 | 51.783 | 47.746 | 2.608 | 8.070 | |
| 12-2029 | 372.9 | 1,266.2 | 85.8 | 203.090 | 476.285 | 47.310 | 47.746 | 2.608 | 8.067 | |
| 12-2030 | 342.6 | 1,163.5 | 78.9 | 186.636 | 437.764 | 43.482 | 47.746 | 2.608 | 8.067 | |
| 12-2031 | 315.2 | 1,070.4 | 72.6 | 171.703 | 402.741 | 40.004 | 47.746 | 2.608 | 8.066 | |
| 12-2032 | 290.8 | 987.4 | 66.9 | 158.391 | 371.516 | 36.902 | 47.746 | 2.608 | 8.066 | |
| 12-2033 | 266.7 | 905.8 | 61.4 | 145.313 | 340.841 | 33.855 | 47.746 | 2.608 | 8.066 | |
| 12-2034 | 245.4 | 833.4 | 56.5 | 133.695 | 313.592 | 31.149 | 47.746 | 2.608 | 8.066 | |
| 12-2035 | 222.4 | 751.1 | 51.0 | 120.961 | 282.399 | 28.050 | 47.746 | 2.608 | 8.052 | |
| 12-2036 | 194.6 | 635.0 | 43.2 | 104.346 | 234.701 | 23.366 | 47.746 | 2.609 | 8.145 | |
| S Tot | 12,651.0 | 41,481.2 | 2,822.0 | 6,971.772 | 15,659.552 | 1,563.977 | 47.741 | 2.611 | 8.232 | |
| After | 400.7 | 1,186.7 | 81.7 | 199.567 | 400.375 | 40.592 | 47.746 | 2.619 | 8.728 | |
| Total | 13,051.6 | 42,667.9 | 2,903.6 | 7,171.339 | 16,059.927 | 1,604.570 | 47.741 | 2.611 | 8.245 | |
| Cum | 2,501.6 | 79,422.6 | .0 | | | | | | | |
| Ult | 15,553.2 | 122,090.5 | 2,903.6 | | | | | | | |
| (11) | (12) | (13) | (14) | (15) | (16) | (17) | (18) | (19) | (20) | |
| | Oil | Gas | NGL | Hedge | Other | Total | Production | Ad Valorem | | |
| End | Revenue | Revenue | Revenue | Revenue | Revenue | Revenue | Taxes | Taxes | $/ BOE6 | |
| Mo-Year | M$ | M$ | M$ | M$ | M$ | M$ | M$ | M$ | | |
| 12-2018 | 40,628.159 | 4,950.659 | 1,579.961 | 0.000 | 0.000 | 47,158.779 | 2,563.815 | 1,428.872 | 4.693 | |
| 12-2019 | 36,295.290 | 4,435.981 | 1,411.134 | 0.000 | 0.000 | 42,142.405 | 2,343.711 | 1,322.390 | 5.455 | |
| 12-2020 | 44,859.395 | 5,331.932 | 1,721.187 | 0.000 | 0.000 | 51,912.513 | 2,803.254 | 1,524.730 | 5.634 | |
| 12-2021 | 38,441.100 | 4,559.393 | 1,466.852 | 0.000 | 0.000 | 44,467.345 | 2,361.406 | 1,261.522 | 6.668 | |
| 12-2022 | 26,031.304 | 3,149.093 | 996.009 | 0.000 | 0.000 | 30,176.406 | 1,617.013 | 870.488 | 8.411 | |
| 12-2023 | 20,544.967 | 2,515.646 | 787.350 | 0.000 | 0.000 | 23,847.964 | 1,282.495 | 692.152 | 9.847 | |
| 12-2024 | 17,269.600 | 2,131.950 | 662.532 | 0.000 | 0.000 | 20,064.082 | 1,081.100 | 584.143 | 11.143 | |
| 12-2025 | 14,813.307 | 1,852.875 | 572.978 | 0.000 | 0.000 | 17,239.160 | 930.922 | 503.354 | 12.241 | |
| 12-2026 | 13,090.832 | 1,648.645 | 508.197 | 0.000 | 0.000 | 15,247.674 | 824.393 | 445.964 | 13.361 | |
| 12-2027 | 11,774.721 | 1,488.105 | 457.851 | 0.000 | 0.000 | 13,720.678 | 742.076 | 401.435 | 14.494 | |
| 12-2028 | 10,645.344 | 1,359.509 | 417.882 | 0.000 | 0.000 | 12,422.735 | 672.196 | 363.392 | 15.431 | |
| 12-2029 | 9,696.774 | 1,242.165 | 381.657 | 0.000 | 0.000 | 11,320.595 | 612.911 | 331.413 | 16.578 | |
| 12-2030 | 8,911.167 | 1,141.696 | 350.752 | 0.000 | 0.000 | 10,403.614 | 563.314 | 304.618 | 17.791 | |
| 12-2031 | 8,198.161 | 1,050.355 | 322.688 | 0.000 | 0.000 | 9,571.204 | 518.245 | 280.247 | 19.094 | |
| 12-2032 | 7,562.552 | 968.920 | 297.670 | 0.000 | 0.000 | 8,829.142 | 478.065 | 258.520 | 20.463 | |
| 12-2033 | 6,938.131 | 888.919 | 273.092 | 0.000 | 0.000 | 8,100.142 | 438.592 | 237.174 | 22.051 | |
| 12-2034 | 6,383.445 | 817.852 | 251.259 | 0.000 | 0.000 | 7,452.556 | 403.528 | 218.213 | 23.723 | |
| 12-2035 | 5,775.419 | 736.436 | 225.865 | 0.000 | 0.000 | 6,737.719 | 365.152 | 197.792 | 25.407 | |
| 12-2036 | 4,982.143 | 612.375 | 190.314 | 0.000 | 0.000 | 5,784.831 | 314.494 | 171.694 | 27.048 | |
| S Tot | 332,841.811 | 40,882.505 | 12,875.229 | 0.000 | 0.000 | 386,599.544 | 20,916.681 | 11,398.113 | 10.315 | |
| After | 9,528.556 | 1,048.535 | 354.276 | 0.000 | 0.000 | 10,931.366 | 579.445 | 311.684 | 30.489 | |
| Total | 342,370.367 | 41,931.039 | 13,229.504 | 0.000 | 0.000 | 397,530.911 | 21,496.126 | 11,709.797 | 10.858 | |
| (21) | (22) | (23) | (24) | (25) | (26) | (27) | (28) | (29) | (30) | (31) | |
| | Operating | Wells | Workover | 3rd Party | Other | | Future Net | Cumulative | Cum.Cash Flow | |
| End | Expense | Gross | Net | Expense | COPAS | Deductions | Investment | Cash Flow | Cash Flow | Disc.@ 10. % | |
| Mo-Year | M$ | Count | M$ | M$ | M$ | M$ | M$ | M$ | M$ | |
| 12-2018 | 2,401.064 | 25 | 19.7 | 0.000 | 0.000 | 3,655.002 | 32,988.409 | 4,121.618 | 4,121.618 | 3,341.770 | |
| 12-2019 | 3,092.390 | 29 | 22.6 | 0.000 | 0.000 | 3,201.842 | 38,783.407 | -6,601.336 | -2,479.718 | -2,408.935 | |
| 12-2020 | 3,976.449 | 37 | 27.1 | 0.000 | 0.000 | 3,984.007 | 41,955.067 | -2,330.995 | -4,810.713 | -4,307.497 | |
| 12-2021 | 4,572.010 | 37 | 27.5 | 0.000 | 0.000 | 3,494.574 | .000 | 32,777.834 | 27,967.121 | 19,283.317 | |
| 12-2022 | 4,589.835 | 37 | 27.5 | 0.000 | 0.000 | 2,346.323 | .000 | 20,752.747 | 48,719.867 | 32,838.394 | |
| 12-2023 | 4,589.835 | 37 | 27.5 | 0.000 | 0.000 | 1,845.323 | .000 | 15,438.158 | 64,158.026 | 41,999.679 | |
| 12-2024 | 4,589.835 | 37 | 27.5 | 0.000 | 0.000 | 1,548.079 | .000 | 12,260.925 | 76,418.951 | 48,611.585 | |
| 12-2025 | 4,471.997 | 37 | 27.5 | 0.000 | 0.000 | 1,337.075 | .000 | 9,995.813 | 86,414.764 | 53,510.381 | |
| 12-2026 | 4,431.816 | 35 | 26.1 | 0.000 | 0.000 | 1,184.652 | .000 | 8,360.849 | 94,775.613 | 57,235.079 | |
| 12-2027 | 4,420.290 | 35 | 26.1 | 0.000 | 0.000 | 1,066.417 | .000 | 7,090.459 | 101,866.072 | 60,106.564 | |
| 12-2028 | 4,334.088 | 34 | 25.2 | 0.000 | 0.000 | 966.304 | .000 | 6,086.756 | 107,952.828 | 62,347.356 | |
| 12-2029 | 4,312.708 | 33 | 24.3 | 0.000 | 0.000 | 879.946 | .000 | 5,183.617 | 113,136.445 | 64,081.934 | |
| 12-2030 | 4,312.708 | 33 | 24.3 | 0.000 | 0.000 | 808.604 | .000 | 4,414.371 | 117,550.816 | 65,424.948 | |
| 12-2031 | 4,312.708 | 32 | 23.5 | 0.000 | 0.000 | 743.901 | .000 | 3,716.102 | 121,266.918 | 66,452.890 | |
| 12-2032 | 4,312.708 | 32 | 23.5 | 0.000 | 0.000 | 686.226 | .000 | 3,093.623 | 124,360.541 | 67,230.985 | |
| 12-2033 | 4,312.708 | 32 | 23.5 | 0.000 | 0.000 | 629.566 | .000 | 2,482.101 | 126,842.642 | 67,798.491 | |
| 12-2034 | 4,312.708 | 32 | 23.5 | 0.000 | 0.000 | 579.234 | .000 | 1,938.873 | 128,781.515 | 68,201.608 | |
| 12-2035 | 4,208.507 | 32 | 23.5 | 0.000 | 0.000 | 523.719 | .000 | 1,442.549 | 130,224.064 | 68,474.374 | |
| 12-2036 | 3,840.490 | 31 | 22.7 | 0.000 | 0.000 | 450.686 | .000 | 1,007.467 | 131,231.531 | 68,647.748 | |
| S Tot | 79,394.855 | | | 0.000 | 0.000 | 29,931.480 | 113,726.884 | 131,231.531 | 131,231.531 | 68,647.748 | |
| After | 8,063.861 | | | 0.000 | 0.000 | 859.725 | .000 | 1,116.651 | 132,348.182 | 68,812.012 | |
| Total | 87,458.716 | | | 0.000 | 0.000 | 30,791.205 | 113,726.884 | 132,348.182 | 132,348.182 | 68,812.012 | |
| | SEC Pricing YE2017 | | Percent | Cum. Disc. | |
| | | WTI Cushing | Henry Hub | | 5.00 | 93,465.060 | |
| | Year | Oil $/STB | Gas $/MMBTU | | 8.00 | 77,447.306 | |
| | 2018 | 51.34 | 2.976 | | 10.00 | 68,812.012 | |
| | Thereafter | Flat | Flat | | 12.00 | 61,444.979 | |
| | Cap | 51.34 | 2.976 | | 15.00 | 52,274.588 | |
| | | | | | 20.00 | 40,670.721 | |
12 Months in first year 25.065 Year Life (01/2043)
THESE DATA ARE PART OF A CG&A REPORT AND ARE SUBJECT TO THE CONDITIONS IN THE TEXT OF THE REPORT. TEXAS REGISTERED ENGINEERING FIRM F-693. | 1/10/2018 10:34:17 Summary |
Cawley, Gillespie & Associates, Inc.

Table I - PD
Composite Reserve Estimates and Economic Forecasts
Lilis Energy, Inc. Interests
Delaware Basin Properties in Texas and New Mexico
Proved Developed Reserves
As of December 31, 2017
| (1) | (2) | (3) | (4) | (5) | (6) | (7) | (8) | (9) | (10) | |
| | Gross Oil | Gross Gas | Gross NGL | Net Oil | Net Gas | Net NGL | Avg Oil | Avg Gas | Avg NGL | |
| End | Production | Production | Production | Production | Sales | Production | Price | Price | Price | |
| Mo-Year | MBBLS | MMCF | MBBLS | MBBLS | MMCF | MBBLS | $/BBL | $/MCF | $/BBL | |
| 12-2018 | 955.4 | 3,280.8 | 221.5 | 594.985 | 1,372.964 | 136.878 | 47.733 | 2.609 | 8.145 | |
| 12-2019 | 535.8 | 2,003.8 | 134.0 | 333.593 | 828.024 | 81.767 | 47.725 | 2.604 | 7.848 | |
| 12-2020 | 378.4 | 1,448.2 | 96.3 | 235.285 | 603.255 | 59.081 | 47.711 | 2.601 | 7.645 | |
| 12-2021 | 297.4 | 1,135.9 | 75.2 | 184.836 | 479.235 | 46.626 | 47.706 | 2.598 | 7.490 | |
| 12-2022 | 247.8 | 967.0 | 63.9 | 153.969 | 407.676 | 39.534 | 47.702 | 2.597 | 7.393 | |
| 12-2023 | 213.5 | 846.0 | 55.8 | 132.666 | 356.478 | 34.490 | 47.699 | 2.596 | 7.326 | |
| 12-2024 | 188.8 | 755.5 | 49.7 | 117.257 | 318.236 | 30.743 | 47.697 | 2.595 | 7.281 | |
| 12-2025 | 164.2 | 678.5 | 44.7 | 102.205 | 285.803 | 27.579 | 47.732 | 2.595 | 7.250 | |
| 12-2026 | 147.4 | 617.5 | 40.6 | 91.852 | 260.117 | 25.085 | 47.746 | 2.594 | 7.235 | |
| 12-2027 | 134.7 | 566.3 | 37.3 | 83.839 | 238.500 | 22.996 | 47.746 | 2.594 | 7.232 | |
| 12-2028 | 121.3 | 522.2 | 34.4 | 75.247 | 219.941 | 21.207 | 47.746 | 2.594 | 7.232 | |
| 12-2029 | 110.5 | 479.1 | 31.5 | 68.529 | 201.781 | 19.456 | 47.746 | 2.594 | 7.232 | |
| 12-2030 | 101.7 | 440.8 | 29.0 | 63.050 | 185.649 | 17.900 | 47.746 | 2.612 | 8.425 | |
| 12-2031 | 93.5 | 405.6 | 26.7 | 58.010 | 170.806 | 16.469 | 47.746 | 2.617 | 8.728 | |
| 12-2032 | 86.4 | 374.1 | 24.6 | 53.512 | 157.564 | 15.192 | 47.746 | 2.617 | 8.728 | |
| 12-2033 | 79.2 | 343.2 | 22.6 | 49.094 | 144.554 | 13.938 | 47.746 | 2.617 | 8.728 | |
| 12-2034 | 72.8 | 315.8 | 20.8 | 45.169 | 132.997 | 12.823 | 47.746 | 2.617 | 8.728 | |
| 12-2035 | 63.7 | 274.9 | 18.1 | 39.511 | 116.244 | 11.190 | 47.746 | 2.617 | 8.728 | |
| 12-2036 | 48.2 | 195.7 | 12.8 | 29.212 | 81.427 | 7.813 | 47.746 | 2.615 | 8.728 | |
| S Tot | 4,040.8 | 15,650.6 | 1,039.7 | 2,511.821 | 6,561.249 | 640.767 | 47.726 | 2.603 | 7.758 | |
| After | 33.2 | 84.3 | 5.6 | 19.577 | 33.196 | 3.334 | 47.746 | 2.619 | 8.728 | |
| Total | 4,073.9 | 15,734.9 | 1,045.3 | 2,531.397 | 6,594.446 | 644.102 | 47.726 | 2.603 | 7.764 | |
| Cum | 2,501.6 | 79,422.6 | 0.0 | | | | | | | |
| Ult | 6,575.6 | 95,157.5 | 1,045.3 | | | | | | | |
| (11) | (12) | (13) | (14) | (15) | (16) | (17) | (18) | (19) | (20) | |
| | Oil | Gas | NGL | Hedge | Other | Total | Production | Ad Valorem | | |
| End | Revenue | Revenue | Revenue | Revenue | Revenue | Revenue | Taxes | Taxes | $/ BOE6 | |
| Mo-Year | M$ | M$ | M$ | M$ | M$ | M$ | M$ | M$ | | |
| 12-2018 | 28,403.455 | 3,582.787 | 1,117.403 | 0.000 | 0.000 | 33,103.646 | 1,759.560 | 961.665 | 2.203 | |
| 12-2019 | 15,923.226 | 2,156.468 | 640.297 | 0.000 | 0.000 | 18,719.991 | 1,000.332 | 540.273 | 3.994 | |
| 12-2020 | 11,228.436 | 1,568.828 | 448.660 | 0.000 | 0.000 | 13,245.923 | 717.284 | 382.893 | 5.363 | |
| 12-2021 | 8,820.173 | 1,244.987 | 346.057 | 0.000 | 0.000 | 10,411.217 | 564.058 | 301.058 | 6.686 | |
| 12-2022 | 7,346.783 | 1,058.406 | 289.025 | 0.000 | 0.000 | 8,694.214 | 471.549 | 251.358 | 7.966 | |
| 12-2023 | 6,330.002 | 925.076 | 249.485 | 0.000 | 0.000 | 7,504.564 | 407.330 | 216.920 | 9.196 | |
| 12-2024 | 5,594.628 | 825.590 | 220.775 | 0.000 | 0.000 | 6,640.994 | 360.636 | 191.925 | 10.366 | |
| 12-2025 | 4,878.936 | 741.278 | 197.082 | 0.000 | 0.000 | 5,817.295 | 316.957 | 168.576 | 11.055 | |
| 12-2026 | 4,385.548 | 674.576 | 178.808 | 0.000 | 0.000 | 5,238.932 | 285.829 | 151.971 | 11.976 | |
| 12-2027 | 4,002.996 | 618.495 | 163.785 | 0.000 | 0.000 | 4,785.276 | 260.899 | 138.553 | 13.014 | |
| 12-2028 | 3,592.738 | 570.365 | 151.027 | 0.000 | 0.000 | 4,314.129 | 235.288 | 124.545 | 13.658 | |
| 12-2029 | 3,272.002 | 523.271 | 138.557 | 0.000 | 0.000 | 3,933.828 | 214.748 | 113.659 | 14.767 | |
| 12-2030 | 3,010.413 | 481.437 | 127.480 | 0.000 | 0.000 | 3,619.328 | 197.579 | 104.573 | 16.050 | |
| 12-2031 | 2,769.738 | 442.947 | 117.287 | 0.000 | 0.000 | 3,329.973 | 181.783 | 96.212 | 17.445 | |
| 12-2032 | 2,554.999 | 408.605 | 108.194 | 0.000 | 0.000 | 3,071.797 | 167.690 | 88.753 | 18.911 | |
| 12-2033 | 2,344.039 | 374.867 | 99.261 | 0.000 | 0.000 | 2,818.167 | 153.845 | 81.425 | 20.613 | |
| 12-2034 | 2,156.639 | 344.898 | 91.325 | 0.000 | 0.000 | 2,592.862 | 141.545 | 74.915 | 22.404 | |
| 12-2035 | 1,886.534 | 301.292 | 78.717 | 0.000 | 0.000 | 2,266.544 | 124.114 | 65.950 | 24.050 | |
| 12-2036 | 1,394.767 | 210.968 | 54.575 | 0.000 | 0.000 | 1,660.310 | 92.144 | 50.074 | 25.555 | |
| S Tot | 119,896.051 | 17,055.143 | 4,817.797 | 0.000 | 0.000 | 141,768.990 | 7,653.169 | 4,105.298 | 8.498 | |
| After | 934.732 | 86.937 | 29.103 | 0.000 | 0.000 | 1,050.772 | 56.492 | 31.333 | 29.844 | |
| Total | 120,830.782 | 17,142.081 | 4,846.900 | 0.000 | 0.000 | 142,819.763 | 7,709.661 | 4,136.631 | 8.642 | |
| (21) | (22) | (23) | (24) | (25) | (26) | (27) | (28) | (29) | (30) | (31) | |
| | Operating | Wells | Workover | 3rd Party | Other | | Future Net | Cumulative | Cum.Cash Flow | |
| End | Expense | Gross | Net | Expense | COPAS | Deductions | Investment | Cash Flow | Cash Flow | Disc.@ 10. % | |
| Mo-Year | M$ | Count | M$ | M$ | M$ | M$ | M$ | M$ | M$ | |
| 12-2018 | 2,010.455 | 20 | 16.1 | 0.000 | 0.000 | 2,558.834 | 6,266.409 | 19,546.724 | 19,546.724 | 18,579.723 | |
| 12-2019 | 2,095.572 | 19 | 15.3 | 0.000 | 0.000 | 1,426.806 | 0.000 | 13,657.009 | 33,203.732 | 30,467.687 | |
| 12-2020 | 2,006.955 | 18 | 14.3 | 0.000 | 0.000 | 1,002.530 | 0.000 | 9,136.261 | 42,339.993 | 37,687.922 | |
| 12-2021 | 1,972.432 | 17 | 13.9 | 0.000 | 0.000 | 783.803 | 0.000 | 6,789.867 | 49,129.859 | 42,562.783 | |
| 12-2022 | 1,972.432 | 17 | 13.9 | 0.000 | 0.000 | 650.586 | 0.000 | 5,348.291 | 54,478.150 | 46,052.651 | |
| 12-2023 | 1,972.432 | 17 | 13.9 | 0.000 | 0.000 | 559.138 | 0.000 | 4,348.744 | 58,826.894 | 48,631.950 | |
| 12-2024 | 1,972.432 | 17 | 13.9 | 0.000 | 0.000 | 493.334 | 0.000 | 3,622.665 | 62,449.559 | 50,584.956 | |
| 12-2025 | 1,854.593 | 17 | 13.9 | 0.000 | 0.000 | 440.417 | 0.000 | 3,036.754 | 65,486.313 | 52,072.912 | |
| 12-2026 | 1,814.413 | 15 | 12.5 | 0.000 | 0.000 | 399.423 | 0.000 | 2,587.296 | 68,073.607 | 53,225.364 | |
| 12-2027 | 1,802.886 | 15 | 12.5 | 0.000 | 0.000 | 365.713 | 0.000 | 2,217.224 | 70,290.831 | 54,123.217 | |
| 12-2028 | 1,716.684 | 14 | 11.5 | 0.000 | 0.000 | 330.653 | 0.000 | 1,906.958 | 72,197.789 | 54,825.254 | |
| 12-2029 | 1,695.305 | 13 | 10.7 | 0.000 | 0.000 | 301.026 | 0.000 | 1,609.089 | 73,806.880 | 55,363.734 | |
| 12-2030 | 1,695.305 | 13 | 10.7 | 0.000 | 0.000 | 276.960 | 0.000 | 1,344.912 | 75,151.792 | 55,772.955 | |
| 12-2031 | 1,695.305 | 12 | 9.9 | 0.000 | 0.000 | 254.818 | 0.000 | 1,101.854 | 76,253.645 | 56,077.800 | |
| 12-2032 | 1,695.305 | 12 | 9.9 | 0.000 | 0.000 | 235.062 | 0.000 | 884.988 | 77,138.633 | 56,300.453 | |
| 12-2033 | 1,695.305 | 12 | 9.9 | 0.000 | 0.000 | 215.653 | 0.000 | 671.940 | 77,810.573 | 56,454.139 | |
| 12-2034 | 1,695.305 | 12 | 9.9 | 0.000 | 0.000 | 198.413 | 0.000 | 482.684 | 78,293.259 | 56,554.553 | |
| 12-2035 | 1,591.103 | 12 | 9.9 | 0.000 | 0.000 | 173.343 | 0.000 | 312.035 | 78,605.293 | 56,613.617 | |
| 12-2036 | 1,223.087 | 11 | 9.0 | 0.000 | 0.000 | 127.475 | 0.000 | 167.530 | 78,772.823 | 56,642.563 | |
| S Tot | 34,177.305 | | | 0.000 | 0.000 | 10,793.986 | 6,266.409 | 78,772.823 | 78,772.823 | 56,642.563 | |
| After | 814.045 | | | 0.000 | 0.000 | 84.990 | 0.000 | 63.912 | 78,836.735 | 56,652.286 | |
| Total | 34,991.349 | | | 0.000 | 0.000 | 10,878.976 | 6,266.409 | 78,836.735 | 78,836.735 | 56,652.286 | |
| | SEC Pricing YE2017 | | Percent | Cum. Disc. | |
| | | WTI Cushing | Henry Hub | | 5.00 | 65,629.632 | |
| | Year | Oil $/STB | Gas $/MMBTU | | 8.00 | 59,869.324 | |
| | 2018 | 51.34 | 2.976 | | 10.00 | 56,652.286 | |
| | Thereafter | Flat | Flat | | 12.00 | 53,829.641 | |
| | Cap | 51.34 | 2.976 | | 15.00 | 50,191.214 | |
| | | | | | 20.00 | 45,322.838 | |
12 Months in first year 21.656 Year Life (08/2039)
THESE DATA ARE PART OF A CG&A REPORT AND ARE SUBJECT TO THE CONDITIONS IN THE TEXT OF THE REPORT. TEXAS REGISTERED ENGINEERING FIRM F-693. | 1/10/2018 10:34:19 Summary |
Cawley, Gillespie & Associates, Inc.

Table I - PDP
Composite Reserve Estimates and Economic Forecasts
Lilis Energy, Inc. Interests
Delaware Basin Properties in Texas and New Mexico
Proved Developed Producing Reserves
As of December 31, 2017
| (1) | (2) | (3) | (4) | (5) | (6) | (7) | (8) | (9) | (10) | |
| | Gross Oil | Gross Gas | Gross NGL | Net Oil | Net Gas | Net NGL | Avg Oil | Avg Gas | Avg NGL | |
| End | Production | Production | Production | Production | Sales | Production | Price | Price | Price | |
| Mo-Year | MBBLS | MMCF | MBBLS | MBBLS | MMCF | MBBLS | $/BBL | $/MCF | $/BBL | |
| 12-2018 | 594.9 | 2,156.8 | 144.9 | 368.734 | 897.348 | 89.373 | 47.733 | 2.609 | 8.145 | |
| 12-2019 | 342.7 | 1,352.1 | 90.0 | 211.963 | 552.010 | 54.523 | 47.725 | 2.604 | 7.848 | |
| 12-2020 | 251.4 | 992.8 | 65.8 | 155.336 | 410.738 | 40.250 | 47.711 | 2.601 | 7.645 | |
| 12-2021 | 201.3 | 775.8 | 51.2 | 124.337 | 327.178 | 31.842 | 47.706 | 2.598 | 7.490 | |
| 12-2022 | 169.6 | 664.5 | 43.8 | 104.729 | 280.015 | 27.174 | 47.702 | 2.597 | 7.393 | |
| 12-2023 | 147.2 | 583.5 | 38.4 | 90.903 | 245.761 | 23.802 | 47.699 | 2.596 | 7.326 | |
| 12-2024 | 130.8 | 522.4 | 34.3 | 80.759 | 219.961 | 21.275 | 47.697 | 2.595 | 7.281 | |
| 12-2025 | 112.8 | 469.7 | 30.9 | 69.856 | 197.806 | 19.112 | 47.732 | 2.595 | 7.250 | |
| 12-2026 | 101.1 | 428.1 | 28.1 | 62.672 | 180.271 | 17.409 | 47.746 | 2.594 | 7.235 | |
| 12-2027 | 92.4 | 393.0 | 25.8 | 57.217 | 165.475 | 15.978 | 47.746 | 2.594 | 7.232 | |
| 12-2028 | 84.4 | 362.5 | 23.8 | 52.139 | 152.632 | 14.738 | 47.746 | 2.594 | 7.232 | |
| 12-2029 | 77.4 | 332.6 | 21.8 | 47.834 | 140.029 | 13.521 | 47.746 | 2.594 | 7.232 | |
| 12-2030 | 71.2 | 239.4 | 16.1 | 44.009 | 101.266 | 10.110 | 47.746 | 2.612 | 8.425 | |
| 12-2031 | 65.5 | 208.2 | 14.1 | 40.491 | 88.175 | 8.880 | 47.746 | 2.617 | 8.728 | |
| 12-2032 | 60.5 | 192.0 | 13.0 | 37.352 | 81.339 | 8.191 | 47.746 | 2.617 | 8.728 | |
| 12-2033 | 55.5 | 176.2 | 11.9 | 34.268 | 74.623 | 7.515 | 47.746 | 2.617 | 8.728 | |
| 12-2034 | 51.0 | 162.1 | 11.0 | 31.528 | 68.657 | 6.914 | 47.746 | 2.617 | 8.728 | |
| 12-2035 | 43.6 | 133.5 | 9.1 | 26.961 | 57.047 | 5.753 | 47.746 | 2.617 | 8.728 | |
| 12-2036 | 29.7 | 82.0 | 5.5 | 17.674 | 33.753 | 3.385 | 47.746 | 2.615 | 8.728 | |
| S Tot | 2,683.2 | 10,227.0 | 679.6 | 1,658.762 | 4,274.082 | 419.746 | 47.726 | 2.603 | 7.758 | |
| After | 26.5 | 64.1 | 4.2 | 15.426 | 24.728 | 2.475 | 47.746 | 2.619 | 8.728 | |
| Total | 2,709.6 | 10,291.1 | 683.8 | 1,674.187 | 4,298.810 | 422.221 | 47.726 | 2.603 | 7.764 | |
| Cum | 2,501.6 | 79,422.6 | .0 | | | | | | | |
| Ult | 5,211.3 | 89,713.7 | 683.8 | | | | | | | |
| (11) | (12) | (13) | (14) | (15) | (16) | (17) | (18) | (19) | (20) | |
| | Oil | Gas | NGL | Hedge | Other | Total | Production | Ad Valorem | | |
| End | Revenue | Revenue | Revenue | Revenue | Revenue | Revenue | Taxes | Taxes | $/ BOE6 | |
| Mo-Year | M$ | M$ | M$ | M$ | M$ | M$ | M$ | M$ | | |
| 12-2018 | 17,600.816 | 2,341.184 | 727.933 | 0.000 | 0.000 | 20,669.934 | 1,147.159 | 650.822 | 5.307 | |
| 12-2019 | 10,115.869 | 1,437.635 | 427.882 | 0.000 | 0.000 | 11,981.386 | 666.019 | 371.808 | 7.054 | |
| 12-2020 | 7,411.170 | 1,068.354 | 307.707 | 0.000 | 0.000 | 8,787.231 | 492.786 | 271.426 | 8.283 | |
| 12-2021 | 5,931.553 | 850.165 | 238.496 | 0.000 | 0.000 | 7,020.214 | 392.893 | 216.283 | 9.547 | |
| 12-2022 | 4,995.767 | 727.204 | 200.903 | 0.000 | 0.000 | 5,923.874 | 331.453 | 182.099 | 10.784 | |
| 12-2023 | 4,335.994 | 637.999 | 174.375 | 0.000 | 0.000 | 5,148.368 | 288.015 | 158.015 | 11.984 | |
| 12-2024 | 3,852.003 | 570.873 | 154.905 | 0.000 | 0.000 | 4,577.781 | 256.057 | 140.345 | 13.133 | |
| 12-2025 | 3,334.394 | 513.258 | 138.566 | 0.000 | 0.000 | 3,986.218 | 224.085 | 122.799 | 13.638 | |
| 12-2026 | 2,992.331 | 467.709 | 125.959 | 0.000 | 0.000 | 3,585.999 | 201.962 | 110.648 | 14.466 | |
| 12-2027 | 2,731.898 | 429.312 | 115.549 | 0.000 | 0.000 | 3,276.759 | 184.348 | 100.840 | 15.458 | |
| 12-2028 | 2,489.415 | 395.991 | 106.578 | 0.000 | 0.000 | 2,991.984 | 167.882 | 91.491 | 16.344 | |
| 12-2029 | 2,283.871 | 363.295 | 97.778 | 0.000 | 0.000 | 2,744.943 | 154.020 | 83.937 | 17.582 | |
| 12-2030 | 2,101.281 | 264.514 | 85.177 | 0.000 | 0.000 | 2,450.971 | 136.090 | 75.364 | 20.272 | |
| 12-2031 | 1,933.289 | 230.732 | 77.500 | 0.000 | 0.000 | 2,241.521 | 124.192 | 69.001 | 22.117 | |
| 12-2032 | 1,783.400 | 212.843 | 71.491 | 0.000 | 0.000 | 2,067.734 | 114.564 | 63.651 | 23.734 | |
| 12-2033 | 1,636.149 | 195.269 | 65.589 | 0.000 | 0.000 | 1,897.007 | 105.105 | 58.396 | 25.611 | |
| 12-2034 | 1,505.343 | 179.658 | 60.345 | 0.000 | 0.000 | 1,745.346 | 96.702 | 53.727 | 27.587 | |
| 12-2035 | 1,287.308 | 149.263 | 50.214 | 0.000 | 0.000 | 1,486.785 | 82.856 | 46.456 | 29.473 | |
| 12-2036 | 843.883 | 88.271 | 29.542 | 0.000 | 0.000 | 961.696 | 55.589 | 32.609 | 30.733 | |
| S Tot | 79,165.734 | 11,123.529 | 3,256.486 | 0.000 | 0.000 | 93,545.749 | 5,221.777 | 2,899.717 | 11.638 | |
| After | 736.528 | 64.759 | 21.603 | 0.000 | 0.000 | 822.890 | 45.109 | 25.636 | 32.825 | |
| Total | 79,902.261 | 11,188.289 | 3,278.090 | 0.000 | 0.000 | 94,368.640 | 5,266.886 | 2,925.353 | 11.806 | |
| (21) | (22) | (23) | (24) | (25) | (26) | (27) | (28) | (29) | (30) | (31) | |
| | Operating | Wells | Workover | 3rd Party | Other | | Future Net | Cumulative | Cum.Cash Flow | |
| End | Expense | Gross | Net | Expense | COPAS | Deductions | Investment | Cash Flow | Cash Flow | Disc.@ 10. % | |
| Mo-Year | M$ | Count | M$ | M$ | M$ | M$ | M$ | M$ | M$ | |
| 12-2018 | 1,524.949 | 15 | 11.9 | 0.000 | 0.000 | 1,534.043 | .000 | 15,812.961 | 15,812.961 | 15,183.947 | |
| 12-2019 | 1,519.012 | 14 | 11.1 | 0.000 | 0.000 | 875.110 | .000 | 8,549.437 | 24,362.398 | 22,622.415 | |
| 12-2020 | 1,430.395 | 13 | 10.1 | 0.000 | 0.000 | 639.949 | .000 | 5,952.675 | 30,315.073 | 27,325.808 | |
| 12-2021 | 1,395.872 | 12 | 9.7 | 0.000 | 0.000 | 509.445 | .000 | 4,505.722 | 34,820.794 | 30,560.390 | |
| 12-2022 | 1,395.872 | 12 | 9.7 | 0.000 | 0.000 | 427.296 | .000 | 3,587.155 | 38,407.949 | 32,900.919 | |
| 12-2023 | 1,395.872 | 12 | 9.7 | 0.000 | 0.000 | 369.759 | .000 | 2,936.707 | 41,344.656 | 34,642.637 | |
| 12-2024 | 1,395.872 | 12 | 9.7 | 0.000 | 0.000 | 327.832 | .000 | 2,457.674 | 43,802.330 | 35,967.546 | |
| 12-2025 | 1,278.033 | 12 | 9.7 | 0.000 | 0.000 | 293.729 | .000 | 2,067.573 | 45,869.903 | 36,980.590 | |
| 12-2026 | 1,237.853 | 10 | 8.3 | 0.000 | 0.000 | 267.107 | .000 | 1,768.429 | 47,638.331 | 37,768.274 | |
| 12-2027 | 1,226.326 | 10 | 8.3 | 0.000 | 0.000 | 244.996 | .000 | 1,520.248 | 49,158.579 | 38,383.882 | |
| 12-2028 | 1,198.530 | 9 | 7.3 | 0.000 | 0.000 | 225.975 | .000 | 1,308.105 | 50,466.684 | 38,865.457 | |
| 12-2029 | 1,198.530 | 9 | 7.3 | 0.000 | 0.000 | 207.317 | .000 | 1,101.138 | 51,567.823 | 39,233.957 | |
| 12-2030 | 1,176.813 | 9 | 7.3 | 0.000 | 0.000 | 190.742 | .000 | 871.962 | 52,439.785 | 39,499.393 | |
| 12-2031 | 1,172.761 | 8 | 6.5 | 0.000 | 0.000 | 175.493 | .000 | 700.073 | 53,139.858 | 39,693.091 | |
| 12-2032 | 1,172.761 | 8 | 6.5 | 0.000 | 0.000 | 161.887 | .000 | 554.871 | 53,694.729 | 39,832.705 | |
| 12-2033 | 1,172.761 | 8 | 6.5 | 0.000 | 0.000 | 148.520 | .000 | 412.225 | 54,106.954 | 39,927.003 | |
| 12-2034 | 1,172.761 | 8 | 6.5 | 0.000 | 0.000 | 136.647 | .000 | 285.509 | 54,392.464 | 39,986.414 | |
| 12-2035 | 1,068.559 | 8 | 6.5 | 0.000 | 0.000 | 116.515 | .000 | 172.399 | 54,564.863 | 40,019.065 | |
| 12-2036 | 708.457 | 7 | 5.7 | 0.000 | 0.000 | 75.237 | .000 | 89.804 | 54,654.667 | 40,034.550 | |
| S Tot | 23,841.988 | | | 0.000 | 0.000 | 6,927.600 | .000 | 54,654.667 | 54,654.667 | 40,034.550 | |
| After | 627.671 | | | 0.000 | 0.000 | 66.779 | .000 | 57.695 | 54,712.362 | 40,043.286 | |
| Total | 24,469.659 | | | 0.000 | 0.000 | 6,994.379 | .000 | 54,712.362 | 54,712.362 | 40,043.286 | |
| | SEC Pricing YE2017 | | Percent | Cum. Disc. | |
| | | WTI Cushing | Henry Hub | | 5.00 | 45,984.035 | |
| | Year | Oil $/STB | Gas $/MMBTU | | 8.00 | 42,172.462 | |
| | 2018 | 51.34 | 2.976 | | 10.00 | 40,043.286 | |
| | Thereafter | Flat | Flat | | 12.00 | 38,175.239 | |
| | Cap | 51.34 | 2.976 | | 15.00 | 35,768.002 | |
| | | | | | 20.00 | 32,549.673 | |
12 Months in first year 21.656 Year Life (08/2039)
THESE DATA ARE PART OF A CG&A REPORT AND ARE SUBJECT TO THE CONDITIONS IN THE TEXT OF THE REPORT. TEXAS REGISTERED ENGINEERING FIRM F-693. | 1/10/2018 10:34:19 Summary |
Cawley, Gillespie & Associates, Inc.
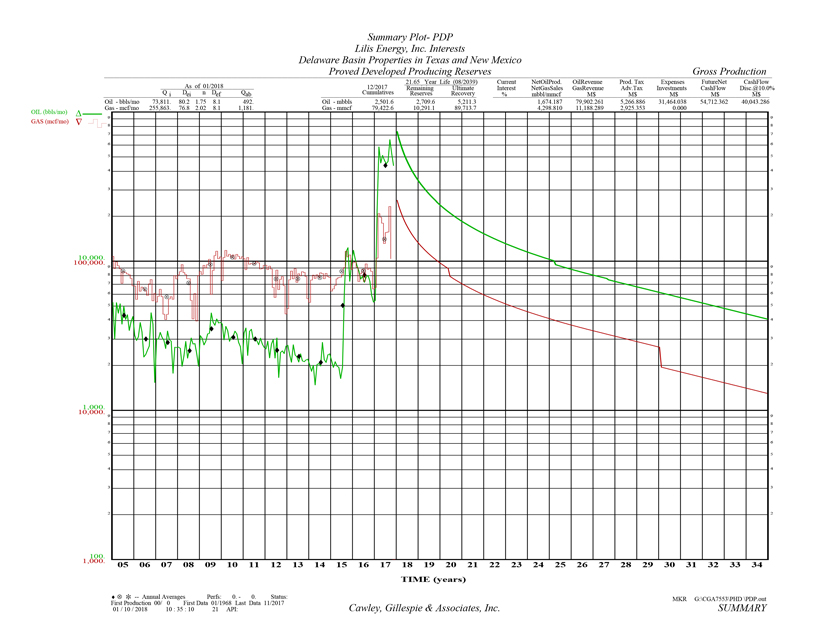
Table II - PDP
Lease Reserve Summary
Lilis Energy, Inc. Interests
Delaware Basin Properties in Texas and New Mexico
Proved Developed Producing Reserves
As of December 31, 2017
| Current | WellCnt | Ultimate | Gross | Net | Oil Revenue | Prod Tax | Expenses | Future Net | Cash Flow |
| OPERATOR | Interest | Life | Recovery | Reserves | Reserves | Gas Revenue | Adv. Tax | Investments | Cash Flow | Disc.@ 10.0 |
| LEASE NAME | Start | | % | | _____________MBBL / MMCF______________ | M$ / M$ | M$ / M$ | M$ / M$ | M$ | M$ |
| Table | Class | Major | Well No. | Date | ASN | | | | | | | |
| PHANTOM (WOLFCAMP) -- WINKLER COUNTY, TEXAS |
| IMPETRO OPERATING LLC | | | |
| BISON #1H | | 59.2198 NI | 1 | 636.4 | 451.8 | 267.6 | 12,774.8 | 697.5 | 4,550.3 | 8,604.3 | 5,965.7 |
| 1 | PDP | Oil | 1H | | 331 | 77.7399 WI | 21.7 | 1,508.5 | 1,084.3 | 411.0 | 1,076.3 | 355.2 | 0.0 | | |
| GRIZZLY #1H | | 61.0414 NI | 1 | 381.9 | 285.5 | 174.3 | 8,321.1 | 520.9 | 3,768.4 | 5,596.0 | 4,098.6 |
| 2 | PDP | Oil | 1H | 332 | 86.6526 WI | 17.4 | 1,713.1 | 1,334.7 | 521.4 | 1,365.6 | 253.5 | 0.0 | | |
| CHEYENNE (ATOKA) -- WINKLER COUNTY, TEXAS |
| TRATON OPERATING COMPANY | | | |
| HILL, A. G. 1 | | 58.3125 NI | 1 | 1.1 | 0.0 | 0.0 | 0.0 | 120.4 | 313.3 | 1,451.4 | 966.8 |
| 3 | PDP | Gas | 1 | 140 | 77.7500 WI | 12.2 | 5,632.6 | 1,727.6 | 715.3 | 1,809.3 | 48.3 | 0.0 | | |
| PHANTOM (WOLFCAMP B) -- WINKLER COUNTY, TEXAS |
| LILIS ENERGY, INC. | | | |
| HIPPO #1H | | 75.1094 NI | 1 | 396.1 | 291.1 | 218.6 | 10,438.0 | 604.2 | 4,187.4 | 6,971.2 | 5,138.1 |
| 4 | PDP | Oil | 1H | 224 | 100.0000 WI | 18.2 | 1,072.4 | 852.5 | 461.0 | 1,207.4 | 301.6 | 0.0 | | |
| PHANTOM (WOLFCAMP) -- WINKLER COUNTY, TEXAS |
| IMPETRO OPERATING LLC | | | |
| KUDU #1H | | 60.1633 NI | 1 | 227.7 | 133.3 | 80.2 | 3,828.6 | 230.9 | 1,803.6 | 2,400.7 | 1,624.7 |
| 5 | PDP | Oil | 1H | 28 | 79.2604 WI | 19.0 | 1,021.9 | 508.7 | 211.2 | 546.8 | 113.7 | 0.0 | | |
| PHANTOM (WOLFCAMP B) -- WINKLER COUNTY, TEXAS |
| LILIS ENERGY, INC. | | | |
| LION #1H | | 65.9402 NI | 1 | 369.2 | 314.8 | 207.6 | 9,910.5 | 618.1 | 4,171.4 | 6,954.3 | 5,149.0 |
| 6 | PDP | Oil | 319 | 92.4753 WI | 18.1 | 1,544.5 | 1,358.3 | 609.0 | 1,595.0 | 301.1 | 0.0 | | |
| JABALINA (WOLFCAMP, SOUTHWEST) -- LEA COUNTY, NEW MEXICO |
| IMPETRO OPERATING, LLC | | | |
| MEXICO P FEDERAL 001 | | 75.7412 NI | 1 | 30.3 | 18.6 | 14.1 | 671.5 | 47.6 | 381.7 | 208.6 | 160.2 |
| 7 | PDP | Oil | 001 | 133 | 97.0634 WI | 9.7 | 82.4 | 0.0 | 0.0 | 0.0 | 33.6 | 0.0 | | |
| TBD (WOLFCAMP B) -- LEA COUNTY, NEW MEXICO |
| LILIS ENERGY, INC. | | | |
| PRIZE HOG BWZ ST COM 1H | | 52.8125 NI | 1 | 433.3 | 416.3 | 219.9 | 10,497.4 | 823.3 | 3,360.8 | 6,734.1 | 5,016.1 |
| 8 | PDP | Oil | #1H | 317 | 65.0000 WI | 19.8 | 823.2 | 791.0 | 284.1 | 743.9 | 574.6 | 0.0 | | |
| HALEY (LWR. WOLFCAMP-PENN CONS.) -- LOVING COUNTY, TEXAS |
| IMPETRO OPERATING LLC | | | |
| SHAMMO C24-4 1 | | 37.5264 NI | 0 | 0.9 | | Non-Commercial | | | | |
| 9 | PDP | Gas | 1 | 68 | 50.0000 WI | 0.0 | 342.7 | | | | | | |
| PHANTOM (WOLFCAMP B) -- WINKLER COUNTY, TEXAS |
| LILIS ENERGY, INC. | | | |
| TIGER 1H | | 71.0940 NI | 1 | 380.3 | 364.6 | 259.2 | 12,376.1 | 747.9 | 4,284.2 | 9,323.1 | 7,124.9 |
| 10 | PDP | Oil | 322 | 87.1825 WI | 19.4 | 1,445.2 | 1,385.5 | 669.8 | 1,754.1 | 368.1 | 0.0 | | |
| CRITTENDON (ATOKA OOLITIC) -- WINKLER COUNTY, TEXAS |
| IMPETRO OPERATING LLC | | | |
| TUBB 1 UNIT 1 | | 34.6270 NI | 0 | 0.2 | | Non-Commercial | | | | |
| 11 | PDP | Gas | 1 | 24 | 46.4836 WI | 0.0 | 713.2 | | | | | | |
| CRITTENDON (MORROW) -- WINKLER COUNTY, TEXAS |
| IMPETRO OPERATING LLC | | | |
| TUBB 22 UNIT 1R | | 60.7747 NI | 0 | 0.6 | | Non-Commercial | | | | |
| 12 | PDP | Gas 1R | 104 | 84.1536 WI | 0.0 | 2,462.5 | | | | | | |
THESE DATA ARE PART OF A CG&A REPORT AND ARE SUBJECT TO THE CONDITIONS IN THE TEXT OF THE REPORT. TEXAS REGISTERED ENGINEERING FIRM F-693. | Scenario: .000 | 1/10/2018 10:34:19 AM |
Cawley, Gillespie & Associates, Inc.
Page 1
Table II - PDP (cont.)
Lease Reserve Summary
Lilis Energy, Inc. Interests
Delaware Basin Properties in Texas and New Mexico
Proved Developed Producing Reserves
As of December 31, 2017
| Current | WellCnt | Ultimate | Gross | Net | Oil Revenue | Prod Tax | Expenses | Future Net | Cash Flow |
| OPERATOR | Interest | Life | Recovery | Reserves | Reserves | Gas Revenue | Adv. Tax | Investments | Cash Flow | Disc.@ 10.0 |
| LEASE NAME | Start | | % | | _____________MBBL / MMCF______________ | M$ / M$ | M$ / M$ | M$ / M$ | M$ | M$ |
| Table | Class | Major | Well No. | Date | ASN | | | | | | | |
| CRITTENDON (MORROW) -- WINKLER COUNTY, TEXAS |
| IMPETRO OPERATING LLC | | | |
| TUBB 9 UNIT 1 | | | 36.5956 NI | 0 | 3.0 | | Non-Commercial | | | | |
| 13 | PDP | Gas | 1 | | 94 | 48.7061 WI | 0.0 | 1,418.6 | | | | | | |
| CRITTENDON (BRUSHY CANYON) -- WINKLER COUNTY, TEXAS |
| IMPETRO OPERATING LLC | | | |
| TUBB ESTATE 1-75 1 | | | 42.7447 NI | 0 | 74.3 | | Non-Commercial | | | | |
| 14 | PDP | Oil | 1 | | 23 | 55.3225 WI | 0.0 | 89.7 | | | | | | |
| TUBB ESTATE 21 2 | | | 64.2033 NI | 0 | 28.5 | | Non-Commercial | | | | |
| 15 | PDP | Oil | 2 | | 88 | 88.5433 WI | 0.0 | 19.5 | | | | | | |
| CRITTENDON (ELLEN. 21450) -- WINKLER COUNTY, TEXAS |
| IMPETRO OPERATING LLC | | | |
| TUBB ESTATE 25 1 | | | 54.8634 NI | 0 | 0.0 | | Non-Commercial | | | | |
| 16 | PDP | Gas | 1 | | 99 | 67.9589 WI | 0.0 | 60.5 | | | | | | |
| CRITTENDON (BRUSHY CANYON) -- WINKLER COUNTY, TEXAS |
| IMPETRO OPERATING LLC | | | |
| TUBB ESTATE 25 3 | | | 74.0852 NI | 1 | 14.3 | 3.0 | 2.2 | 109.7 | 5.3 | 92.9 | 11.8 | 11.1 |
| 17 | PDP | Oil | 3 | | 71 | 91.5312 WI | 1.9 | 14.5 | 1.8 | 0.8 | 2.2 | 2.8 | 0.0 | | |
| TBD (WOLFCAMP B) -- LEA COUNTY, NEW MEXICO |
| LILIS ENERGY, INC. | | | |
| WILD HOG BWX ST COM 1H | | | 52.8125 NI | 1 | 424.9 | 367.9 | 194.3 | 9,277.2 | 753.3 | 3,209.7 | 5,994.0 | 4,408.1 |
| 18 | PDP | Oil | #1H | | 314 | 65.0000 WI | 19.4 | 1,012.2 | 956.6 | 343.5 | 899.7 | 524.1 | 0.0 | | |
| CRITTENDON (BRUSHY CANYON) -- WINKLER COUNTY, TEXAS |
| IMPETRO OPERATING LLC | | | |
| WOLFE UNIT #3H | | | 68.9935 NI | 1 | 32.9 | 0.1 | 0.0 | 2.2 | 0.1 | 0.2 | 1.8 | 1.8 |
| 19 | PDP | Oil | 3H | | 111 | 85.4277 WI | 1.0 | 0.0 | 0.0 | 0.0 | 0.0 | 0.1 | 0.0 | | |
| CRITTENDON (PENN.) -- WINKLER COUNTY, TEXAS |
| IMPETRO OPERATING LLC | | | |
| WOLFE UNIT 1 | | | 38.7307 NI | 1 | 766.7 | 0.0 | 0.0 | 0.0 | 17.3 | 193.8 | 12.8 | 11.8 |
| 20 | PDP | Gas | 1 | | 50 | 48.1433 WI | 2.4 | 67,841.6 | 273.0 | 65.6 | 171.7 | 5.7 | 0.0 | | |
| CRITTENDON (BELL CANYON) -- WINKLER COUNTY, TEXAS |
| IMPETRO OPERATING LLC | | | |
| WOLFE UNIT 4,5&6 | | | 57.8050 NI | 2 | 1,008.6 | 62.8 | 36.3 | 1,695.1 | 79.9 | 1,146.3 | 448.0 | 366.1 |
| 21 | PDP | Oil | 5,6&7 | | 15 | 68.5740 WI | 7.3 | 895.0 | 17.1 | 6.1 | 16.4 | 42.9 | 0.0 | | |
| GRAND TOTAL | | | | 15 | 5,211.3 | 2,709.6 | 1,674.2 | 79,902.3 | 5,266.9 | 31,464.0 | 54,712.4 | 40,043.3 |
| | | | | | 89,713.7 | 10,291.1 | 4,298.8 | 11,188.3 | 2,925.4 | 0.0 | | |
THESE DATA ARE PART OF A CG&A REPORT AND ARE SUBJECT TO THE CONDITIONS IN THE TEXT OF THE REPORT. TEXAS REGISTERED ENGINEERING FIRM F-693. | Scenario: .000 | 1/10/2018 10:34:19 AM |
Cawley, Gillespie & Associates, Inc.
Page 2
Rate-Time History-Forecast Curves
And
Tabular Reserves and Economics
By Property
Cawley, Gillespie & Associates, Inc.
Petroleum Consultants
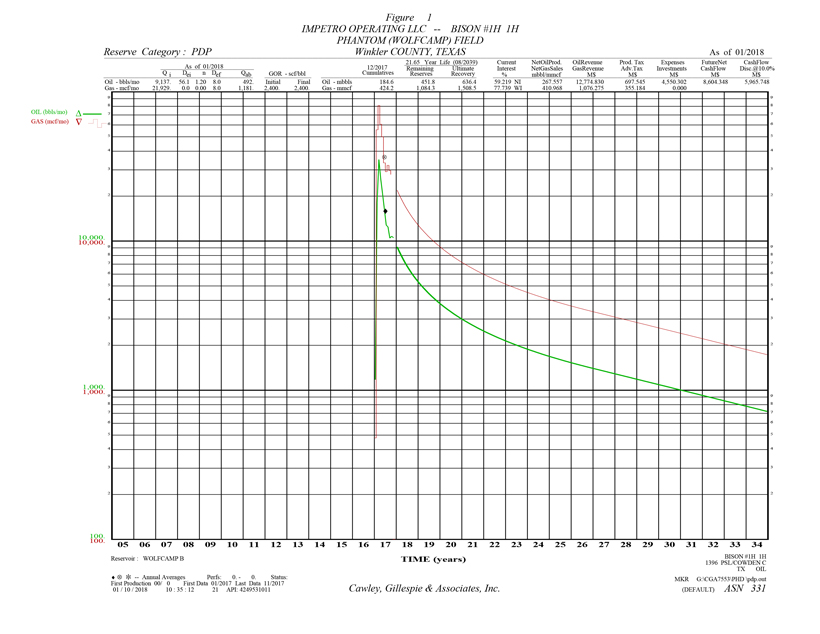
Table 1
Reserve Estimates and Economic Forecasts as of December 31, 2017
Lilis Energy, Inc. Interests
Proved Developed Producing Reserves
IMPETRO OPERATING LLC -- BISON #1H 1H
PHANTOM \(WOLFCAMP\) FIELD -- Winkler COUNTY, TEXAS
| (1) | (2) | (3) | (4) | (5) | (6) | (7) | (8) | (9) | (10) | |
| | Gross Oil | Gross Gas | Gross NGL | Net Oil | Net Gas | Net NGL | Avg Oil | Avg Gas | Avg NGL | |
| End | Production | Production | Production | Production | Sales | Production | Price | Price | Price | |
| Mo-Year | MBBLS | MMCF | MBBLS | MBBLS | MMCF | MBBLS | $/BBL | $/MCF | $/BBL | |
| 12-2018 | 83.5 | 200.5 | 12.7 | 49.470 | 75.985 | 7.548 | 47.746 | 2.619 | 8.728 | |
| 12-2019 | 53.7 | 128.9 | 8.2 | 31.806 | 48.855 | 4.853 | 47.746 | 2.619 | 8.728 | |
| 12-2020 | 40.5 | 97.3 | 6.2 | 23.997 | 36.859 | 3.661 | 47.746 | 2.619 | 8.728 | |
| 12-2021 | 32.7 | 78.5 | 5.0 | 19.379 | 29.766 | 2.957 | 47.746 | 2.619 | 8.728 | |
| 12-2022 | 27.7 | 66.4 | 4.2 | 16.386 | 25.169 | 2.500 | 47.746 | 2.619 | 8.728 | |
| 12-2023 | 24.1 | 57.8 | 3.7 | 14.254 | 21.893 | 2.175 | 47.746 | 2.619 | 8.728 | |
| 12-2024 | 21.4 | 51.4 | 3.3 | 12.683 | 19.481 | 1.935 | 47.746 | 2.619 | 8.728 | |
| 12-2025 | 19.2 | 46.2 | 2.9 | 11.393 | 17.500 | 1.738 | 47.746 | 2.619 | 8.728 | |
| 12-2026 | 17.5 | 42.1 | 2.7 | 10.385 | 15.951 | 1.584 | 47.746 | 2.619 | 8.728 | |
| 12-2027 | 16.1 | 38.7 | 2.5 | 9.541 | 14.655 | 1.456 | 47.746 | 2.619 | 8.728 | |
| 12-2028 | 14.9 | 35.7 | 2.3 | 8.802 | 13.519 | 1.343 | 47.746 | 2.619 | 8.728 | |
| 12-2029 | 13.6 | 32.7 | 2.1 | 8.075 | 12.403 | 1.232 | 47.746 | 2.619 | 8.728 | |
| 12-2030 | 12.5 | 30.1 | 1.9 | 7.429 | 11.411 | 1.133 | 47.746 | 2.619 | 8.728 | |
| 12-2031 | 11.5 | 27.7 | 1.8 | 6.835 | 10.499 | 1.043 | 47.746 | 2.619 | 8.728 | |
| 12-2032 | 10.6 | 25.6 | 1.6 | 6.305 | 9.685 | .962 | 47.746 | 2.619 | 8.728 | |
| 12-2033 | 9.8 | 23.4 | 1.5 | 5.785 | 8.885 | .883 | 47.746 | 2.619 | 8.728 | |
| 12-2034 | 9.0 | 21.6 | 1.4 | 5.322 | 8.175 | .812 | 47.746 | 2.619 | 8.728 | |
| 12-2035 | 8.3 | 19.8 | 1.3 | 4.897 | 7.521 | .747 | 47.746 | 2.619 | 8.728 | |
| 12-2036 | 7.6 | 18.3 | 1.2 | 4.517 | 6.938 | .689 | 47.746 | 2.619 | 8.728 | |
| S Tot | 434.4 | 1,042.6 | 66.3 | 257.261 | 395.152 | 39.251 | 47.746 | 2.619 | 8.728 | |
| After | 17.4 | 41.7 | 2.7 | 10.296 | 15.815 | 1.571 | 47.746 | 2.619 | 8.728 | |
| Total | 451.8 | 1,084.3 | 68.9 | 267.557 | 410.968 | 40.822 | 47.746 | 2.619 | 8.728 | |
| Cum | 184.6 | 424.2 | .0 | | | | | | | |
| Ult | 636.4 | 1,508.5 | 68.9 | | | | | | | |
| (11) | (12) | (13) | (14) | (15) | (16) | (17) | (18) | (19) | (20) | |
| | Oil | Gas | NGL | Hedge | Other | Total | Production | Ad Valorem | | |
| End | Revenue | Revenue | Revenue | Revenue | Revenue | Revenue | Taxes | Taxes | $/BOE6 | |
| Mo-Year | M$ | M$ | M$ | M$ | M$ | M$ | M$ | M$ | | |
| 12-2018 | 2,361.982 | 198.996 | 65.873 | 0.000 | 0.000 | 2,626.852 | 128.972 | 65.671 | 5.613 | |
| 12-2019 | 1,518.638 | 127.945 | 42.353 | 0.000 | 0.000 | 1,688.936 | 82.922 | 42.223 | 6.896 | |
| 12-2020 | 1,145.748 | 96.529 | 31.954 | 0.000 | 0.000 | 1,274.230 | 62.561 | 31.856 | 8.065 | |
| 12-2021 | 925.258 | 77.953 | 25.804 | 0.000 | 0.000 | 1,029.015 | 50.522 | 25.725 | 9.200 | |
| 12-2022 | 782.382 | 65.915 | 21.820 | 0.000 | 0.000 | 870.117 | 42.720 | 21.753 | 10.277 | |
| 12-2023 | 680.552 | 57.336 | 18.980 | 0.000 | 0.000 | 756.868 | 37.160 | 18.922 | 11.320 | |
| 12-2024 | 605.552 | 51.018 | 16.888 | 0.000 | 0.000 | 673.458 | 33.065 | 16.836 | 12.313 | |
| 12-2025 | 543.993 | 45.831 | 15.171 | 0.000 | 0.000 | 604.996 | 29.704 | 15.125 | 13.333 | |
| 12-2026 | 495.846 | 41.775 | 13.829 | 0.000 | 0.000 | 551.450 | 27.075 | 13.786 | 14.307 | |
| 12-2027 | 455.559 | 38.381 | 12.705 | 0.000 | 0.000 | 506.645 | 24.875 | 12.666 | 15.280 | |
| 12-2028 | 420.239 | 35.405 | 11.720 | 0.000 | 0.000 | 467.364 | 22.946 | 11.684 | 16.286 | |
| 12-2029 | 385.541 | 32.482 | 10.752 | 0.000 | 0.000 | 428.775 | 21.052 | 10.719 | 17.455 | |
| 12-2030 | 354.718 | 29.885 | 9.893 | 0.000 | 0.000 | 394.496 | 19.369 | 9.862 | 18.685 | |
| 12-2031 | 326.359 | 27.496 | 9.102 | 0.000 | 0.000 | 362.957 | 17.820 | 9.074 | 20.021 | |
| 12-2032 | 301.056 | 25.364 | 8.396 | 0.000 | 0.000 | 334.816 | 16.439 | 8.370 | 21.426 | |
| 12-2033 | 276.199 | 23.270 | 7.703 | 0.000 | 0.000 | 307.172 | 15.081 | 7.679 | 23.057 | |
| 12-2034 | 254.118 | 21.409 | 7.087 | 0.000 | 0.000 | 282.614 | 13.876 | 7.065 | 24.774 | |
| 12-2035 | 233.802 | 19.698 | 6.520 | 0.000 | 0.000 | 260.020 | 12.766 | 6.500 | 26.639 | |
| 12-2036 | 215.675 | 18.171 | 6.015 | 0.000 | 0.000 | 239.860 | 11.777 | 5.997 | 28.601 | |
| S Tot | 12,283.218 | 1,034.857 | 342.565 | 0.000 | 0.000 | 13,660.639 | 670.701 | 341.516 | 11.743 | |
| After | 491.612 | 41.418 | 13.710 | 0.000 | 0.000 | 546.741 | 26.844 | 13.669 | 32.708 | |
| Total | 12,774.830 | 1,076.275 | 356.275 | 0.000 | 0.000 | 14,207.380 | 697.545 | 355.184 | 12.550 | |
| (21) | (22) | (23) | (24) | (25) | (26) | (27) | (28) | (29) | (30) | (31) | |
| | Operating | Wells | Workover | 3rd Party | Other | | Future Net | Cumulative | Cum.Cash Flow | |
| End | Expense | Gross | Net | Expense | COPAS | Deductions | Investment | Cash Flow | Cash Flow | Disc.@ 10. % | |
| Mo-Year | M$ | Count | M$ | M$ | M$ | M$ | M$ | M$ | M$ | |
| 12-2018 | 154.858 | 1 | 0.8 | 0.000 | 0.000 | 221.447 | .000 | 2,055.904 | 2,055.904 | 1,970.292 | |
| 12-2019 | 154.858 | 1 | 0.8 | 0.000 | 0.000 | 142.379 | .000 | 1,266.553 | 3,322.457 | 3,071.785 | |
| 12-2020 | 154.858 | 1 | 0.8 | 0.000 | 0.000 | 107.419 | .000 | 917.536 | 4,239.993 | 3,796.607 | |
| 12-2021 | 154.858 | 1 | 0.8 | 0.000 | 0.000 | 86.747 | .000 | 711.162 | 4,951.155 | 4,307.067 | |
| 12-2022 | 154.858 | 1 | 0.8 | 0.000 | 0.000 | 73.352 | .000 | 577.433 | 5,528.589 | 4,683.780 | |
| 12-2023 | 154.858 | 1 | 0.8 | 0.000 | 0.000 | 63.805 | .000 | 482.123 | 6,010.712 | 4,969.684 | |
| 12-2024 | 154.858 | 1 | 0.8 | 0.000 | 0.000 | 56.773 | .000 | 411.925 | 6,422.637 | 5,191.715 | |
| 12-2025 | 154.858 | 1 | 0.8 | 0.000 | 0.000 | 51.002 | .000 | 354.307 | 6,776.944 | 5,365.292 | |
| 12-2026 | 154.858 | 1 | 0.8 | 0.000 | 0.000 | 46.488 | .000 | 309.243 | 7,086.187 | 5,503.016 | |
| 12-2027 | 154.858 | 1 | 0.8 | 0.000 | 0.000 | 42.711 | .000 | 271.535 | 7,357.722 | 5,612.957 | |
| 12-2028 | 154.858 | 1 | 0.8 | 0.000 | 0.000 | 39.399 | .000 | 238.476 | 7,596.199 | 5,700.739 | |
| 12-2029 | 154.858 | 1 | 0.8 | 0.000 | 0.000 | 36.146 | .000 | 206.000 | 7,802.199 | 5,769.667 | |
| 12-2030 | 154.858 | 1 | 0.8 | 0.000 | 0.000 | 33.256 | .000 | 177.150 | 7,979.349 | 5,823.560 | |
| 12-2031 | 154.858 | 1 | 0.8 | 0.000 | 0.000 | 30.598 | .000 | 150.607 | 8,129.956 | 5,865.218 | |
| 12-2032 | 154.858 | 1 | 0.8 | 0.000 | 0.000 | 28.225 | .000 | 126.924 | 8,256.880 | 5,897.139 | |
| 12-2033 | 154.858 | 1 | 0.8 | 0.000 | 0.000 | 25.895 | .000 | 103.658 | 8,360.538 | 5,920.837 | |
| 12-2034 | 154.858 | 1 | 0.8 | 0.000 | 0.000 | 23.825 | .000 | 82.990 | 8,443.528 | 5,938.089 | |
| 12-2035 | 154.858 | 1 | 0.8 | 0.000 | 0.000 | 21.920 | .000 | 63.975 | 8,507.503 | 5,950.182 | |
| 12-2036 | 154.858 | 1 | 0.8 | 0.000 | 0.000 | 20.221 | .000 | 47.009 | 8,554.512 | 5,958.266 | |
| S Tot | 2,942.301 | | | 0.000 | 0.000 | 1,151.608 | .000 | 8,554.512 | 8,554.512 | 5,958.266 | |
| After | 410.301 | | | 0.000 | 0.000 | 46.091 | .000 | 49.837 | 8,604.348 | 5,965.748 | |
| Total | 3,352.603 | | | 0.000 | 0.000 | 1,197.699 | .000 | 8,604.348 | 8,604.348 | 5,965.748 | |
| Evaluation Parameters (Gross) | | Expenses (Gross) | | Percent Interests | | Percent | Cum. Disc. | |
| | Initial | Final | Units | | Dei | n | Def | | Initial | Final | Units | | | Initial | Final | | 5.00 | 7,006.537 | |
| Oil Rate | 9,430. | 487. | bbls/mo | | 56.1% | 1.20 | 0.0% | | 16,598. | 16,598. | $/w/mo | | Expense | 77.7399 | 77.7399 | | 8.00 | 6,334.257 | |
| Gas Rate | 22,632. | 1,169. | Mcf/mo | | 0.0% | 0.00 | 0.0% | | | | | | Revenue | | | | 10.00 | 5,965.748 | |
| GOR | 2,400. | 2,400. | scf/bbl | | | | | | | | | | Oil | 59.2198 | 59.2198 | | 12.00 | 5,646.640 | |
| NGL Rate | 1,419. | 76. | bbls/mo | | | | | | | | | | Gas | 59.2198 | 59.2198 | | 15.00 | 5,241.246 | |
| NGL Yield | 62.7 | 65.4 | bbl/MMcf | | | | | | | | | | | | | | 20.00 | 4,709.444 | |
| Gas Shrinkage | 38.0 | 35.5 | % | | | | | | | | | | | | | | | | |
| Oil Severance | 4.6 | 4.6 | % | | | | | | | | | | | | | | | | |
| Gas Severance | 7.5 | 7.5 | % | | | | | | | | | | | | | | | | |
| NGL Severance | 7.5 | 7.5 | % | | | | | | | | | | | | | | | | |
| Ad Valorem | 39.4 | | % | | | | | | | | | | | | | | | | |
12 Months in first year 21.656 Year Life (08/2039)
THESE DATA ARE PART OF A CG&A REPORT AND ARE SUBJECT TO THE CONDITIONS IN THE TEXT OF THE REPORT. TEXAS REGISTERED ENGINEERING FIRM F-693. | ASN 331 | DEFAULT 1/10/2018 10:34:19 OIL PDP Table 1 |
Cawley, Gillespie & Associates, Inc.

Table 2
Reserve Estimates and Economic Forecasts as of December 31, 2017
Lilis Energy, Inc. Interests
Proved Developed Producing Reserves
IMPETRO OPERATING LLC -- GRIZZLY #1H 1H
PHANTOM \(WOLFCAMP\) FIELD -- Winkler COUNTY, TEXAS
| (1) | (2) | (3) | (4) | (5) | (6) | (7) | (8) | (9) | (10) | |
| | Gross Oil | Gross Gas | Gross NGL | Net Oil | Net Gas | Net NGL | Avg Oil | Avg Gas | Avg NGL | |
| End | Production | Production | Production | Production | Sales | Production | Price | Price | Price | |
| Mo-Year | MBBLS | MMCF | MBBLS | MBBLS | MMCF | MBBLS | $/BBL | $/MCF | $/BBL | |
| 12-2018 | 55.3 | 258.6 | 16.4 | 33.766 | 101.029 | 10.035 | 47.746 | 2.619 | 8.728 | |
| 12-2019 | 36.1 | 168.9 | 10.7 | 22.055 | 65.988 | 6.555 | 47.746 | 2.619 | 8.728 | |
| 12-2020 | 27.4 | 128.2 | 8.2 | 16.745 | 50.103 | 4.977 | 47.746 | 2.619 | 8.728 | |
| 12-2021 | 22.2 | 103.9 | 6.6 | 13.570 | 40.601 | 4.033 | 47.746 | 2.619 | 8.728 | |
| 12-2022 | 18.8 | 88.1 | 5.6 | 11.500 | 34.407 | 3.418 | 47.746 | 2.619 | 8.728 | |
| 12-2023 | 16.4 | 76.7 | 4.9 | 10.018 | 29.974 | 2.977 | 47.746 | 2.619 | 8.728 | |
| 12-2024 | 14.6 | 68.3 | 4.3 | 8.924 | 26.701 | 2.652 | 47.746 | 2.619 | 8.728 | |
| 12-2025 | 13.1 | 61.5 | 3.9 | 8.024 | 24.007 | 2.385 | 47.746 | 2.619 | 8.728 | |
| 12-2026 | 12.0 | 56.0 | 3.6 | 7.318 | 21.897 | 2.175 | 47.746 | 2.619 | 8.728 | |
| 12-2027 | 11.0 | 51.5 | 3.3 | 6.726 | 20.123 | 1.999 | 47.746 | 2.619 | 8.728 | |
| 12-2028 | 10.2 | 47.5 | 3.0 | 6.204 | 18.563 | 1.844 | 47.746 | 2.619 | 8.728 | |
| 12-2029 | 9.3 | 43.6 | 2.8 | 5.692 | 17.030 | 1.692 | 47.746 | 2.619 | 8.728 | |
| 12-2030 | 8.6 | 40.1 | 2.5 | 5.237 | 15.669 | 1.556 | 47.746 | 2.619 | 8.728 | |
| 12-2031 | 7.9 | 36.9 | 2.3 | 4.818 | 14.416 | 1.432 | 47.746 | 2.619 | 8.728 | |
| 12-2032 | 7.3 | 34.0 | 2.2 | 4.445 | 13.298 | 1.321 | 47.746 | 2.619 | 8.728 | |
| 12-2033 | 6.7 | 31.2 | 2.0 | 4.078 | 12.200 | 1.212 | 47.746 | 2.619 | 8.728 | |
| 12-2034 | 6.1 | 28.7 | 1.8 | 3.752 | 11.225 | 1.115 | 47.746 | 2.619 | 8.728 | |
| 05-2035 | 2.3 | 10.8 | .7 | 1.406 | 4.206 | .418 | 47.746 | 2.619 | 8.728 | |
| 12-2036 | | | | | | | | | | |
| S Tot | 285.5 | 1,334.7 | 84.9 | 174.277 | 521.436 | 51.794 | 47.746 | 2.619 | 8.728 | |
| After | .0 | .0 | .0 | .000 | .000 | .000 | .000 | .000 | .000 | |
| Total | 285.5 | 1,334.7 | 84.9 | 174.277 | 521.436 | 51.794 | 47.746 | 2.619 | 8.728 | |
| Cum | 96.3 | 378.4 | .0 | | | | | | | |
| Ult | 381.9 | 1,713.1 | 84.9 | | | | | | | |
| (11) | (12) | (13) | (14) | (15) | (16) | (17) | (18) | (19) | (20) | |
| | Oil | Gas | NGL | Hedge | Other | Total | Production | Ad Valorem | | |
| End | Revenue | Revenue | Revenue | Revenue | Revenue | Revenue | Taxes | Taxes | $/BOE6 | |
| Mo-Year | M$ | M$ | M$ | M$ | M$ | M$ | M$ | M$ | | |
| 12-2018 | 1,612.209 | 264.582 | 87.583 | 0.000 | 0.000 | 1,964.374 | 100.919 | 49.109 | 5.663 | |
| 12-2019 | 1,053.033 | 172.815 | 57.206 | 0.000 | 0.000 | 1,283.054 | 65.916 | 32.076 | 7.258 | |
| 12-2020 | 799.534 | 131.213 | 43.435 | 0.000 | 0.000 | 974.181 | 50.048 | 24.355 | 8.716 | |
| 12-2021 | 647.917 | 106.330 | 35.198 | 0.000 | 0.000 | 789.445 | 40.557 | 19.736 | 10.133 | |
| 12-2022 | 549.070 | 90.109 | 29.828 | 0.000 | 0.000 | 669.007 | 34.370 | 16.725 | 11.478 | |
| 12-2023 | 478.330 | 78.499 | 25.985 | 0.000 | 0.000 | 582.815 | 29.942 | 14.570 | 12.783 | |
| 12-2024 | 426.089 | 69.926 | 23.147 | 0.000 | 0.000 | 519.163 | 26.672 | 12.979 | 14.024 | |
| 12-2025 | 383.099 | 62.871 | 20.812 | 0.000 | 0.000 | 466.782 | 23.981 | 11.670 | 15.299 | |
| 12-2026 | 349.426 | 57.345 | 18.983 | 0.000 | 0.000 | 425.753 | 21.873 | 10.644 | 16.517 | |
| 12-2027 | 321.121 | 52.700 | 17.445 | 0.000 | 0.000 | 391.265 | 20.101 | 9.782 | 17.738 | |
| 12-2028 | 296.224 | 48.614 | 16.092 | 0.000 | 0.000 | 360.930 | 18.543 | 9.023 | 19.006 | |
| 12-2029 | 271.766 | 44.600 | 14.764 | 0.000 | 0.000 | 331.129 | 17.012 | 8.278 | 20.477 | |
| 12-2030 | 250.039 | 41.034 | 13.583 | 0.000 | 0.000 | 304.656 | 15.652 | 7.616 | 22.025 | |
| 12-2031 | 230.049 | 37.754 | 12.497 | 0.000 | 0.000 | 280.300 | 14.400 | 7.007 | 23.708 | |
| 12-2032 | 212.213 | 34.827 | 11.528 | 0.000 | 0.000 | 258.568 | 13.284 | 6.464 | 25.477 | |
| 12-2033 | 194.691 | 31.951 | 10.577 | 0.000 | 0.000 | 237.219 | 12.187 | 5.930 | 27.530 | |
| 12-2034 | 179.126 | 29.397 | 9.731 | 0.000 | 0.000 | 218.253 | 11.213 | 5.456 | 29.691 | |
| 05-2035 | 67.119 | 11.015 | 3.646 | 0.000 | 0.000 | 81.780 | 4.201 | 2.045 | 30.987 | |
| 12-2036 | | | | | | | | | | |
| S Tot | 8,321.054 | 1,365.579 | 452.042 | 0.000 | 0.000 | 10,138.675 | 520.871 | 253.467 | 12.781 | |
| After | .000 | .000 | .000 | 0.000 | 0.000 | .000 | .000 | .000 | .000 | |
| Total | 8,321.054 | 1,365.579 | 452.042 | 0.000 | 0.000 | 10,138.675 | 520.871 | 253.467 | 12.781 | |
| (21) | (22) | (23) | (24) | (25) | (26) | (27) | (28) | (29) | (30) | (31) | |
| | Operating | Wells | Workover | 3rd Party | Other | | Future Net | Cumulative | Cum.Cash Flow | |
| End | Expense | Gross | Net | Expense | COPAS | Deductions | Investment | Cash Flow | Cash Flow | Disc.@ 10. % | |
| Mo-Year | M$ | Count | M$ | M$ | M$ | M$ | M$ | M$ | M$ | |
| 12-2018 | 171.572 | 1 | 0.9 | 0.000 | 0.000 | 151.949 | .000 | 1,490.824 | 1,490.824 | 1,428.673 | |
| 12-2019 | 171.572 | 1 | 0.9 | 0.000 | 0.000 | 99.248 | .000 | 914.241 | 2,405.065 | 2,223.831 | |
| 12-2020 | 171.572 | 1 | 0.9 | 0.000 | 0.000 | 75.355 | .000 | 652.851 | 3,057.916 | 2,739.624 | |
| 12-2021 | 171.572 | 1 | 0.9 | 0.000 | 0.000 | 61.066 | .000 | 496.514 | 3,554.430 | 3,096.060 | |
| 12-2022 | 171.572 | 1 | 0.9 | 0.000 | 0.000 | 51.749 | .000 | 394.590 | 3,949.020 | 3,353.524 | |
| 12-2023 | 171.572 | 1 | 0.9 | 0.000 | 0.000 | 45.082 | .000 | 321.648 | 4,270.668 | 3,544.294 | |
| 12-2024 | 171.572 | 1 | 0.9 | 0.000 | 0.000 | 40.159 | .000 | 267.781 | 4,538.449 | 3,688.658 | |
| 12-2025 | 171.572 | 1 | 0.9 | 0.000 | 0.000 | 36.107 | .000 | 223.453 | 4,761.902 | 3,798.148 | |
| 12-2026 | 171.572 | 1 | 0.9 | 0.000 | 0.000 | 32.933 | .000 | 188.731 | 4,950.633 | 3,882.217 | |
| 12-2027 | 171.572 | 1 | 0.9 | 0.000 | 0.000 | 30.265 | .000 | 159.545 | 5,110.178 | 3,946.829 | |
| 12-2028 | 171.572 | 1 | 0.9 | 0.000 | 0.000 | 27.919 | .000 | 133.873 | 5,244.051 | 3,996.124 | |
| 12-2029 | 171.572 | 1 | 0.9 | 0.000 | 0.000 | 25.614 | .000 | 108.653 | 5,352.705 | 4,032.494 | |
| 12-2030 | 171.572 | 1 | 0.9 | 0.000 | 0.000 | 23.566 | .000 | 86.250 | 5,438.955 | 4,058.746 | |
| 12-2031 | 171.572 | 1 | 0.9 | 0.000 | 0.000 | 21.682 | .000 | 65.638 | 5,504.592 | 4,076.914 | |
| 12-2032 | 171.572 | 1 | 0.9 | 0.000 | 0.000 | 20.001 | .000 | 47.247 | 5,551.839 | 4,088.812 | |
| 12-2033 | 171.572 | 1 | 0.9 | 0.000 | 0.000 | 18.349 | .000 | 29.179 | 5,581.018 | 4,095.496 | |
| 12-2034 | 171.572 | 1 | 0.9 | 0.000 | 0.000 | 16.882 | .000 | 13.130 | 5,594.148 | 4,098.239 | |
| 05-2035 | 67.371 | 1 | 0.9 | 0.000 | 0.000 | 6.326 | .000 | 1.838 | 5,595.986 | 4,098.597 | |
| 12-2036 | | | | | | | | | | | |
| S Tot | 2,984.098 | | | 0.000 | 0.000 | 784.253 | .000 | 5,595.986 | 5,595.986 | 4,098.597 | |
| After | .000 | | | 0.000 | 0.000 | 0.000 | .000 | .000 | 5,595.986 | 4,098.597 | |
| Total | 2,984.098 | | | 0.000 | 0.000 | 784.253 | .000 | 5,595.986 | 5,595.986 | 4,098.597 | |
| Evaluation Parameters (Gross) | | Expenses (Gross) | | Percent Interests | | Percent | Cum. Disc. | |
| | Initial | Final | Units | | Dei | n | Def | | Initial | Final | Units | | | Initial | Final | | 5.00 | 4,712.875 | |
| Oil Rate | 6,156. | 475. | bbls/mo | | 53.9% | 1.20 | 0.0% | | 16,499. | 16,262. | $/w/mo | | Expense | 86.6526 | 86.6526 | | 8.00 | 4,319.970 | |
| Gas Rate | 28,781. | 2,222. | Mcf/mo | | 0.0% | 0.00 | 0.0% | | | | | | Revenue | | | | 10.00 | 4,098.597 | |
| GOR | 4,670. | 4,670. | scf/bbl | | | | | | | | | | Oil | 61.0414 | 61.0414 | | 12.00 | 3,903.301 | |
| NGL Rate | 1,809. | 140. | bbls/mo | | | | | | | | | | Gas | 61.0414 | 61.0414 | | 15.00 | 3,650.240 | |
| NGL Yield | 62.9 | 63.2 | bbl/MMcf | | | | | | | | | | | | | | 20.00 | 3,309.723 | |
| Gas Shrinkage | 37.9 | 35.5 | % | | | | | | | | | | | | | | | | |
| Oil Severance | 4.6 | 4.6 | % | | | | | | | | | | | | | | | | |
| Gas Severance | 7.5 | 7.5 | % | | | | | | | | | | | | | | | | |
| NGL Severance | 7.5 | 7.5 | % | | | | | | | | | | | | | | | | |
| Ad Valorem | 42.0 | | % | | | | | | | | | | | | | | | | |
12 Months in first year 17.396 Year Life (05/2035)
THESE DATA ARE PART OF A CG&A REPORT AND ARE SUBJECT TO THE CONDITIONS IN THE TEXT OF THE REPORT. TEXAS REGISTERED ENGINEERING FIRM F-693. | ASN 332 | DEFAULT 1/10/2018 | 10:34:19 OIL PDP Table 2 |
Cawley, Gillespie & Associates, Inc.
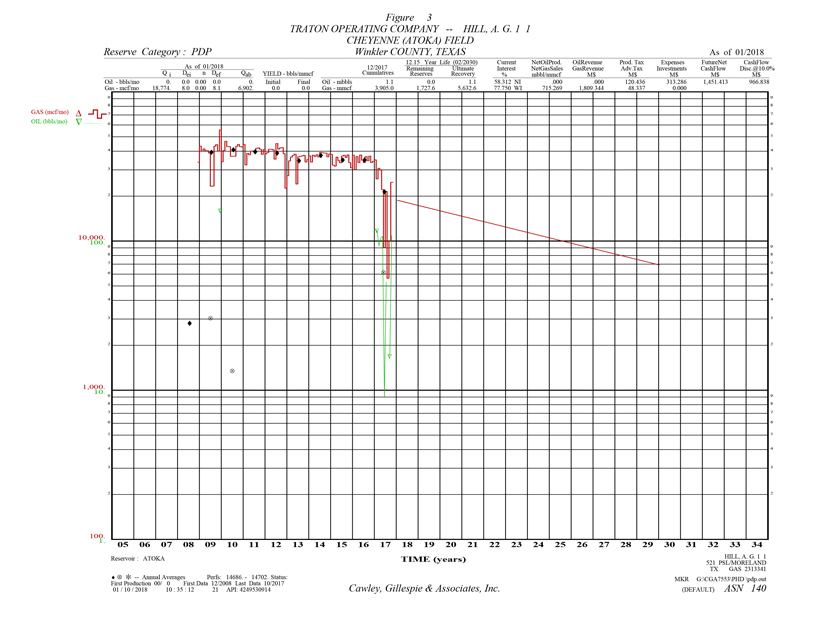
Table 3
Reserve Estimates and Economic Forecasts as of December 31, 2017
Lilis Energy, Inc. Interests
Proved Developed Producing Reserves
TRATON OPERATING COMPANY -- HILL, A. G. 1 1
CHEYENNE \(ATOKA\) FIELD -- Winkler COUNTY, TEXAS
| (1) | (2) | (3) | (4) | (5) | (6) | (7) | (8) | (9) | (10) | |
| | Gross Oil | Gross Gas | Gross NGL | Net Oil | Net Gas | Net NGL | Avg Oil | Avg Gas | Avg NGL | |
| End | Production | Production | Production | Production | Sales | Production | Price | Price | Price | |
| Mo-Year | MBBLS | MMCF | MBBLS | MBBLS | MMCF | MBBLS | $/BBL | $/MCF | $/BBL | |
| 12-2018 | .0 | 216.8 | 13.0 | .000 | 89.747 | 7.584 | .000 | 2.530 | 2.054 | |
| 12-2019 | .0 | 199.4 | 12.0 | .000 | 82.572 | 6.978 | .000 | 2.530 | 2.054 | |
| 12-2020 | .0 | 184.0 | 11.0 | .000 | 76.170 | 6.437 | .000 | 2.530 | 2.054 | |
| 12-2021 | .0 | 168.8 | 10.1 | .000 | 69.881 | 5.905 | .000 | 2.530 | 2.054 | |
| 12-2022 | .0 | 155.3 | 9.3 | .000 | 64.294 | 5.433 | .000 | 2.530 | 2.054 | |
| 12-2023 | .0 | 142.9 | 8.6 | .000 | 59.154 | 4.999 | .000 | 2.530 | 2.054 | |
| 12-2024 | .0 | 131.8 | 7.9 | .000 | 54.568 | 4.611 | .000 | 2.530 | 2.054 | |
| 12-2025 | .0 | 120.9 | 7.3 | .000 | 50.062 | 4.231 | .000 | 2.530 | 2.054 | |
| 12-2026 | .0 | 111.3 | 6.7 | .000 | 46.060 | 3.892 | .000 | 2.530 | 2.054 | |
| 12-2027 | .0 | 102.4 | 6.1 | .000 | 42.377 | 3.581 | .000 | 2.530 | 2.054 | |
| 12-2028 | .0 | 94.4 | 5.7 | .000 | 39.092 | 3.304 | .000 | 2.530 | 2.054 | |
| 12-2029 | .0 | 86.6 | 5.2 | .000 | 35.864 | 3.031 | .000 | 2.530 | 2.054 | |
| 02-2030 | .0 | 13.1 | .8 | .000 | 5.429 | .459 | .000 | 2.530 | 2.054 | |
| 12-2031 | | | | | | | | | | |
| 12-2032 | | | | | | | | | | |
| 12-2033 | | | | | | | | | | |
| 12-2034 | | | | | | | | | | |
| 12-2035 | | | | | | | | | | |
| 12-2036 | | | | | | | | | | |
| S Tot | .0 | 1,727.6 | 103.7 | .000 | 715.269 | 60.445 | .000 | 2.530 | 2.054 | |
| After | .0 | .0 | .0 | .000 | .000 | .000 | .000 | .000 | .000 | |
| Total | .0 | 1,727.6 | 103.7 | .000 | 715.269 | 60.445 | .000 | 2.530 | 2.054 | |
| Cum | 1.1 | 3,905.0 | .0 | | | | | | | |
| Ult | 1.1 | 5,632.6 | 103.7 | | | | | | | |
| (11) | (12) | (13) | (14) | (15) | (16) | (17) | (18) | (19) | (20) | |
| | Oil | Gas | NGL | Hedge | Other | Total | Production | Ad Valorem | | |
| End | Revenue | Revenue | Revenue | Revenue | Revenue | Revenue | Taxes | Taxes | $/BOE6 | |
| Mo-Year | M$ | M$ | M$ | M$ | M$ | M$ | M$ | M$ | | |
| 12-2018 | .000 | 227.024 | 15.575 | 0.000 | 0.000 | 242.598 | .090 | 6.065 | 1.296 | |
| 12-2019 | .000 | 208.874 | 14.330 | 0.000 | 0.000 | 223.203 | 9.728 | 5.580 | 1.408 | |
| 12-2020 | .000 | 192.679 | 13.219 | 0.000 | 0.000 | 205.898 | 15.519 | 5.147 | 1.527 | |
| 12-2021 | .000 | 176.770 | 12.127 | 0.000 | 0.000 | 188.898 | 14.237 | 4.722 | 1.664 | |
| 12-2022 | .000 | 162.638 | 11.158 | 0.000 | 0.000 | 173.796 | 13.099 | 4.345 | 1.809 | |
| 12-2023 | .000 | 149.636 | 10.266 | 0.000 | 0.000 | 159.901 | 12.052 | 3.998 | 1.966 | |
| 12-2024 | .000 | 138.034 | 9.470 | 0.000 | 0.000 | 147.504 | 11.117 | 3.688 | 2.131 | |
| 12-2025 | .000 | 126.637 | 8.688 | 0.000 | 0.000 | 135.325 | 10.199 | 3.383 | 2.323 | |
| 12-2026 | .000 | 116.513 | 7.993 | 0.000 | 0.000 | 124.506 | 9.384 | 3.113 | 2.525 | |
| 12-2027 | .000 | 107.198 | 7.354 | 0.000 | 0.000 | 114.552 | 8.634 | 2.864 | 2.744 | |
| 12-2028 | .000 | 98.887 | 6.784 | 0.000 | 0.000 | 105.671 | 7.964 | 2.642 | 2.975 | |
| 12-2029 | .000 | 90.722 | 6.224 | 0.000 | 0.000 | 96.946 | 7.307 | 2.424 | 3.243 | |
| 02-2030 | .000 | 13.733 | .942 | 0.000 | 0.000 | 14.675 | 1.106 | .367 | 3.369 | |
| 12-2031 | | | | | | | | | | |
| 12-2032 | | | | | | | | | | |
| 12-2033 | | | | | | | | | | |
| 12-2034 | | | | | | | | | | |
| 12-2035 | | | | | | | | | | |
| 12-2036 | | | | | | | | | | |
| S Tot | .000 | 1,809.344 | 124.128 | 0.000 | 0.000 | 1,933.472 | 120.436 | 48.337 | 1.977 | |
| After | .000 | .000 | .000 | 0.000 | 0.000 | .000 | .000 | .000 | .000 | |
| Total | .000 | 1,809.344 | 124.128 | 0.000 | 0.000 | 1,933.472 | 120.436 | 48.337 | 1.977 | |
| (21) | (22) | (23) | (24) | (25) | (26) | (27) | (28) | (29) | (30) | (31) | |
| | Operating | Wells | Workover | 3rd Party | Other | | Future Net | Cumulative | Cum.Cash Flow | |
| End | Expense | Gross | Net | Expense | COPAS | Deductions | Investment | Cash Flow | Cash Flow | Disc.@ 10. % | |
| Mo-Year | M$ | Count | M$ | M$ | M$ | M$ | M$ | M$ | M$ | |
| 12-2018 | 25.769 | 1 | 0.8 | 0.000 | 0.000 | 0.000 | .000 | 210.674 | 210.674 | 201.079 | |
| 12-2019 | 25.769 | 1 | 0.8 | 0.000 | 0.000 | 0.000 | .000 | 182.126 | 392.800 | 359.288 | |
| 12-2020 | 25.769 | 1 | 0.8 | 0.000 | 0.000 | 0.000 | .000 | 159.463 | 552.262 | 485.077 | |
| 12-2021 | 25.769 | 1 | 0.8 | 0.000 | 0.000 | 0.000 | .000 | 144.168 | 696.431 | 588.455 | |
| 12-2022 | 25.769 | 1 | 0.8 | 0.000 | 0.000 | 0.000 | .000 | 130.582 | 827.013 | 673.586 | |
| 12-2023 | 25.769 | 1 | 0.8 | 0.000 | 0.000 | 0.000 | .000 | 118.082 | 945.095 | 743.574 | |
| 12-2024 | 25.769 | 1 | 0.8 | 0.000 | 0.000 | 0.000 | .000 | 106.929 | 1,052.025 | 801.188 | |
| 12-2025 | 25.769 | 1 | 0.8 | 0.000 | 0.000 | 0.000 | .000 | 95.973 | 1,147.998 | 848.194 | |
| 12-2026 | 25.769 | 1 | 0.8 | 0.000 | 0.000 | 0.000 | .000 | 86.240 | 1,234.238 | 886.596 | |
| 12-2027 | 25.769 | 1 | 0.8 | 0.000 | 0.000 | 0.000 | .000 | 77.285 | 1,311.523 | 917.885 | |
| 12-2028 | 25.769 | 1 | 0.8 | 0.000 | 0.000 | 0.000 | .000 | 69.295 | 1,380.818 | 943.388 | |
| 12-2029 | 25.769 | 1 | 0.8 | 0.000 | 0.000 | 0.000 | .000 | 61.446 | 1,442.263 | 963.945 | |
| 02-2030 | 4.052 | 1 | 0.8 | 0.000 | 0.000 | 0.000 | .000 | 9.150 | 1,451.413 | 966.838 | |
| 12-2031 | | | | | | | | | | | |
| 12-2032 | | | | | | | | | | | |
| 12-2033 | | | | | | | | | | | |
| 12-2034 | | | | | | | | | | | |
| 12-2035 | | | | | | | | | | | |
| 12-2036 | | | | | | | | | | | |
| S Tot | 313.286 | | | 0.000 | 0.000 | 0.000 | .000 | 1,451.413 | 1,451.413 | 966.838 | |
| After | .000 | | | 0.000 | 0.000 | 0.000 | .000 | .000 | 1,451.413 | 966.838 | |
| Total | 313.286 | | | 0.000 | 0.000 | 0.000 | .000 | 1,451.413 | 1,451.413 | 966.838 | |
| Evaluation Parameters (Gross) | | Expenses (Gross) | | Percent Interests | | Percent | Cum. Disc. | |
| | Initial | Final | Units | | Dei | n | Def | | Initial | Final | Units | | | Initial | Final | | 5.00 | 4,712.875 | |
| Gas Rate | 18,835. | 6,835. | Mcf/mo | | 8.0% | 0.00 | 0.0% | | 2,761. | 2,761. | $/w/mo | | Expense | 77.7500 | 77.7500 | | 8.00 | 1,037.958 | |
| Oil Rate | 0. | 0. | bbls/mo | | 0.0% | 0.00 | 0.0% | | | | | | Revenue | | | | 10.00 | 966.838 | |
| NGL Rate | 1,147. | 421. | bbls/mo | | | | | | | | | | Oil | 58.3125 | 58.3125 | | 12.00 | 904.520 | |
| CondRate | 0.0 | 0.0 | bbl/MMcf | | | | | | | | | | Gas | 58.3125 | 58.3125 | | 15.00 | 824.587 | |
| NGL Yield | 60.9 | 61.7 | bbl/MMcf | | | | | | | | | | | | | | 20.00 | 719.053 | |
| Gas Shrinkage | 29.2 | 28.3 | % | | | | | | | | | | | | | | | | |
| Oil Severance | 0.0 | 0.0 | % | | | | | | | | | | | | | | | | |
| Gas Severance | 0.0 | 7.5 | % | | | | | | | | | | | | | | | | |
| NGL Severance | 0.0 | 7.5 | % | | | | | | | | | | | | | | | | |
| Ad Valorem | 19.7 | | % | | | | | | | | | | | | | | | | |
12 Months in first year 12.159 Year Life (02/2030)
THESE DATA ARE PART OF A CG&A REPORT AND ARE SUBJECT TO THE CONDITIONS IN THE TEXT OF THE REPORT. TEXAS REGISTERED ENGINEERING FIRM F-693. | ASN 140 | DEFAULT 1/10/2018 | 10:34:19 GAS PDP Table 3 |
Cawley, Gillespie & Associates, Inc.
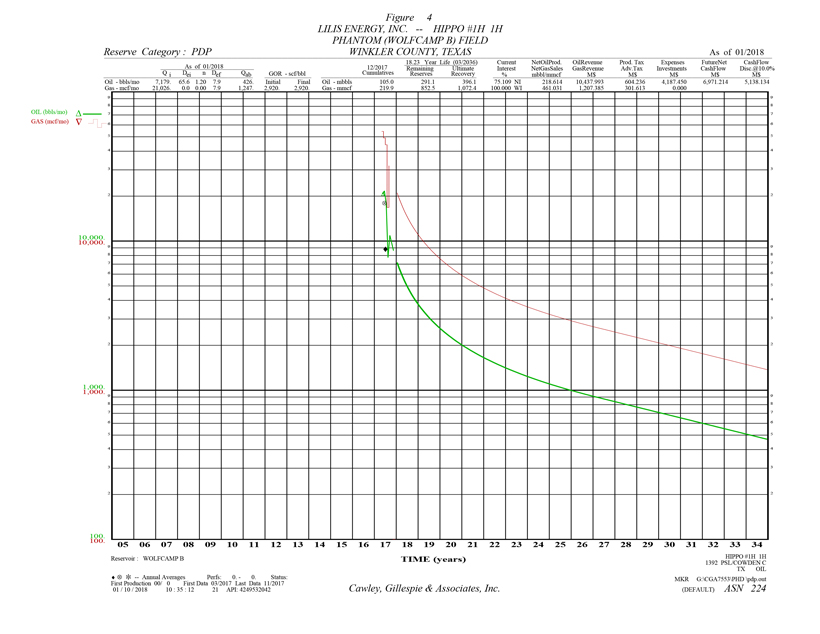
Table 4
Reserve Estimates and Economic Forecasts as of December 31, 2017
Lilis Energy, Inc. Interests
Proved Developed Producing Reserves
LILIS ENERGY, INC. -- HIPPO #1H 1H
PHANTOM (WOLFCAMP B) FIELD -- WINKLER COUNTY, TEXAS
| (1) | (2) | (3) | (4) | (5) | (6) | (7) | (8) | (9) | (10) | |
| | Gross Oil | Gross Gas | Gross NGL | Net Oil | Net Gas | Net NGL | Avg Oil | Avg Gas | Avg NGL | |
| End | Production | Production | Production | Production | Sales | Production | Price | Price | Price | |
| Mo-Year | MBBLS | MMCF | MBBLS | MBBLS | MMCF | MBBLS | $/BBL | $/MCF | $/BBL | |
| 12-2018 | 62.0 | 181.7 | 13.6 | 46.593 | 98.258 | 10.235 | 47.746 | 2.619 | 8.728 | |
| 12-2019 | 37.2 | 109.1 | 8.2 | 27.975 | 58.995 | 6.145 | 47.746 | 2.619 | 8.728 | |
| 12-2020 | 27.4 | 80.2 | 6.0 | 20.576 | 43.393 | 4.520 | 47.746 | 2.619 | 8.728 | |
| 12-2021 | 21.8 | 63.9 | 4.8 | 16.395 | 34.575 | 3.602 | 47.746 | 2.619 | 8.728 | |
| 12-2022 | 18.3 | 53.6 | 4.0 | 13.748 | 28.993 | 3.020 | 47.746 | 2.619 | 8.728 | |
| 12-2023 | 15.8 | 46.4 | 3.5 | 11.891 | 25.076 | 2.612 | 47.746 | 2.619 | 8.728 | |
| 12-2024 | 14.0 | 41.1 | 3.1 | 10.536 | 22.220 | 2.315 | 47.746 | 2.619 | 8.728 | |
| 12-2025 | 12.6 | 36.8 | 2.8 | 9.436 | 19.898 | 2.073 | 47.746 | 2.619 | 8.728 | |
| 12-2026 | 11.4 | 33.5 | 2.5 | 8.579 | 18.092 | 1.885 | 47.746 | 2.619 | 8.728 | |
| 12-2027 | 10.5 | 30.7 | 2.3 | 7.872 | 16.602 | 1.729 | 47.746 | 2.619 | 8.728 | |
| 12-2028 | 9.7 | 28.3 | 2.1 | 7.262 | 15.314 | 1.595 | 47.746 | 2.619 | 8.728 | |
| 12-2029 | 8.9 | 26.0 | 1.9 | 6.662 | 14.050 | 1.464 | 47.746 | 2.619 | 8.728 | |
| 12-2030 | 8.2 | 23.9 | 1.8 | 6.130 | 12.926 | 1.347 | 47.746 | 2.619 | 8.728 | |
| 12-2031 | 7.5 | 22.0 | 1.6 | 5.640 | 11.893 | 1.239 | 47.746 | 2.619 | 8.728 | |
| 12-2032 | 6.9 | 20.3 | 1.5 | 5.202 | 10.971 | 1.143 | 47.746 | 2.619 | 8.728 | |
| 12-2033 | 6.4 | 18.6 | 1.4 | 4.773 | 10.065 | 1.048 | 47.746 | 2.619 | 8.728 | |
| 12-2034 | 5.8 | 17.1 | 1.3 | 4.391 | 9.260 | .965 | 47.746 | 2.619 | 8.728 | |
| 12-2035 | 5.4 | 15.8 | 1.2 | 4.040 | 8.520 | .888 | 47.746 | 2.619 | 8.728 | |
| 03-2036 | 1.2 | 3.6 | .3 | .914 | 1.928 | .201 | 47.746 | 2.619 | 8.728 | |
| S Tot | 291.1 | 852.5 | 63.9 | 218.614 | 461.031 | 48.024 | 47.746 | 2.619 | 8.728 | |
| After | .0 | .0 | .0 | .000 | .000 | .000 | .000 | .000 | .000 | |
| Total | 291.1 | 852.5 | 63.9 | 218.614 | 461.031 | 48.024 | 47.746 | 2.619 | 8.728 | |
| Cum | 105.0 | 219.9 | .0 | | | | | | | |
| Ult | 396.1 | 1,072.4 | 63.9 | | | | | | | |
| (11) | (12) | (13) | (14) | (15) | (16) | (17) | (18) | (19) | (20) | |
| | Oil | Gas | NGL | Hedge | Other | Total | Production | Ad Valorem | | |
| End | Revenue | Revenue | Revenue | Revenue | Revenue | Revenue | Taxes | Taxes | $/BOE6 | |
| Mo-Year | M$ | M$ | M$ | M$ | M$ | M$ | M$ | M$ | | |
| 12-2018 | 2,224.617 | 257.326 | 89.329 | 0.000 | 0.000 | 2,571.272 | 128.779 | 64.282 | 5.456 | |
| 12-2019 | 1,335.688 | 154.502 | 53.634 | 0.000 | 0.000 | 1,543.824 | 77.320 | 38.596 | 7.153 | |
| 12-2020 | 982.449 | 113.642 | 39.450 | 0.000 | 0.000 | 1,135.542 | 56.872 | 28.389 | 8.681 | |
| 12-2021 | 782.788 | 90.547 | 31.433 | 0.000 | 0.000 | 904.768 | 45.314 | 22.619 | 10.154 | |
| 12-2022 | 656.412 | 75.929 | 26.358 | 0.000 | 0.000 | 758.698 | 37.998 | 18.967 | 11.550 | |
| 12-2023 | 567.732 | 65.671 | 22.797 | 0.000 | 0.000 | 656.200 | 32.865 | 16.405 | 12.900 | |
| 12-2024 | 503.075 | 58.192 | 20.201 | 0.000 | 0.000 | 581.467 | 29.122 | 14.537 | 14.185 | |
| 12-2025 | 450.511 | 52.112 | 18.090 | 0.000 | 0.000 | 520.713 | 26.079 | 13.018 | 15.501 | |
| 12-2026 | 409.623 | 47.382 | 16.448 | 0.000 | 0.000 | 473.454 | 23.712 | 11.836 | 16.758 | |
| 12-2027 | 375.868 | 43.477 | 15.093 | 0.000 | 0.000 | 434.438 | 21.758 | 10.861 | 18.003 | |
| 12-2028 | 346.722 | 40.106 | 13.923 | 0.000 | 0.000 | 400.750 | 20.071 | 10.019 | 19.272 | |
| 12-2029 | 318.094 | 36.795 | 12.773 | 0.000 | 0.000 | 367.661 | 18.414 | 9.192 | 20.745 | |
| 12-2030 | 292.663 | 33.853 | 11.752 | 0.000 | 0.000 | 338.268 | 16.942 | 8.457 | 22.295 | |
| 12-2031 | 269.265 | 31.146 | 10.812 | 0.000 | 0.000 | 311.224 | 15.587 | 7.781 | 23.980 | |
| 12-2032 | 248.389 | 28.732 | 9.974 | 0.000 | 0.000 | 287.095 | 14.379 | 7.177 | 25.751 | |
| 12-2033 | 227.880 | 26.359 | 9.150 | 0.000 | 0.000 | 263.390 | 13.192 | 6.585 | 27.807 | |
| 12-2034 | 209.662 | 24.252 | 8.419 | 0.000 | 0.000 | 242.333 | 12.137 | 6.058 | 29.971 | |
| 12-2035 | 192.900 | 22.313 | 7.746 | 0.000 | 0.000 | 222.959 | 11.167 | 5.574 | 32.323 | |
| 03-2036 | 43.655 | 5.050 | 1.753 | 0.000 | 0.000 | 50.458 | 2.527 | 1.261 | 33.494 | |
| S Tot | 10,437.993 | 1,207.385 | 419.136 | 0.000 | 0.000 | 12,064.513 | 604.236 | 301.613 | 12.819 | |
| After | .000 | .000 | .000 | 0.000 | 0.000 | .000 | .000 | .000 | .000 | |
| Total | 10,437.993 | 1,207.385 | 419.136 | 0.000 | 0.000 | 12,064.513 | 604.236 | 301.613 | 12.819 | |
| (21) | (22) | (23) | (24) | (25) | (26) | (27) | (28) | (29) | (30) | (31) | |
| | Operating | Wells | Workover | 3rd Party | Other | | Future Net | Cumulative | Cum.Cash Flow | |
| End | Expense | Gross | Net | Expense | COPAS | Deductions | Investment | Cash Flow | Cash Flow | Disc.@ 10. % | |
| Mo-Year | M$ | Count | M$ | M$ | M$ | M$ | M$ | M$ | M$ | |
| 12-2018 | 177.600 | 1 | 1.0 | 0.000 | 0.000 | 202.227 | .000 | 1,998.384 | 1,998.384 | 1,917.116 | |
| 12-2019 | 177.600 | 1 | 1.0 | 0.000 | 0.000 | 121.420 | .000 | 1,128.889 | 3,127.273 | 2,899.283 | |
| 12-2020 | 177.600 | 1 | 1.0 | 0.000 | 0.000 | 89.309 | .000 | 783.372 | 3,910.645 | 3,518.286 | |
| 12-2021 | 177.600 | 1 | 1.0 | 0.000 | 0.000 | 71.159 | .000 | 588.076 | 4,498.720 | 3,940.485 | |
| 12-2022 | 177.600 | 1 | 1.0 | 0.000 | 0.000 | 59.671 | .000 | 464.462 | 4,963.182 | 4,243.553 | |
| 12-2023 | 177.600 | 1 | 1.0 | 0.000 | 0.000 | 51.609 | .000 | 377.721 | 5,340.903 | 4,467.584 | |
| 12-2024 | 177.600 | 1 | 1.0 | 0.000 | 0.000 | 45.732 | .000 | 314.477 | 5,655.380 | 4,637.121 | |
| 12-2025 | 177.600 | 1 | 1.0 | 0.000 | 0.000 | 40.953 | .000 | 263.062 | 5,918.442 | 4,766.019 | |
| 12-2026 | 177.600 | 1 | 1.0 | 0.000 | 0.000 | 37.237 | .000 | 223.068 | 6,141.511 | 4,865.381 | |
| 12-2027 | 177.600 | 1 | 1.0 | 0.000 | 0.000 | 34.168 | .000 | 190.051 | 6,331.562 | 4,942.344 | |
| 12-2028 | 177.600 | 1 | 1.0 | 0.000 | 0.000 | 31.519 | .000 | 161.542 | 6,493.104 | 5,001.821 | |
| 12-2029 | 177.600 | 1 | 1.0 | 0.000 | 0.000 | 28.916 | .000 | 133.540 | 6,626.643 | 5,046.516 | |
| 12-2030 | 177.600 | 1 | 1.0 | 0.000 | 0.000 | 26.604 | .000 | 108.665 | 6,735.308 | 5,079.585 | |
| 12-2031 | 177.600 | 1 | 1.0 | 0.000 | 0.000 | 24.477 | .000 | 85.779 | 6,821.087 | 5,103.323 | |
| 12-2032 | 177.600 | 1 | 1.0 | 0.000 | 0.000 | 22.580 | .000 | 65.359 | 6,886.446 | 5,119.773 | |
| 12-2033 | 177.600 | 1 | 1.0 | 0.000 | 0.000 | 20.715 | .000 | 45.298 | 6,931.744 | 5,130.141 | |
| 12-2034 | 177.600 | 1 | 1.0 | 0.000 | 0.000 | 19.059 | .000 | 27.478 | 6,959.223 | 5,135.864 | |
| 12-2035 | 177.600 | 1 | 1.0 | 0.000 | 0.000 | 17.535 | .000 | 11.083 | 6,970.305 | 5,137.972 | |
| 03-2036 | 41.791 | 1 | 1.0 | 0.000 | 0.000 | 3.968 | .000 | .909 | 6,971.214 | 5,138.134 | |
| S Tot | 3,238.591 | | | 0.000 | 0.000 | 948.859 | .000 | 6,971.214 | 6,971.214 | 5,138.134 | |
| After | .000 | | | 0.000 | 0.000 | 0.000 | .000 | .000 | 6,971.214 | 5,138.134 | |
| Total | 3,238.591 | | | 0.000 | 0.000 | 948.859 | .000 | 6,971.214 | 6,971.214 | 5,138.134 | |
| Evaluation Parameters (Gross) | | Expenses (Gross) | | Percent Interests | | Percent | Cum. Disc. | |
| | Initial | Final | Units | | Dei | n | Def | | Initial | Final | Units | | | Initial | Final | | 5.00 | 5,886.663 | |
| Oil Rate | 7,475. | 421. | bbls/mo | | 65.7% | 1.20 | 0.0% | | 14,800. | 14,101. | $/w/mo | | Expense | 100.0000 | 100.0000 | | 8.00 | 5,407.389 | |
| Gas Rate | 21,897. | 1,235. | Mcf/mo | | 0.0% | 0.00 | 0.0% | | | | | | Revenue | | | | 10.00 | 5,138.134 | |
| GOR | 2,920. | 2,920. | scf/bbl | | | | | | | | | | Oil | 75.1094 | 75.1094 | | 12.00 | 4,901.002 | |
| NGL Rate | 1,606. | 89. | bbls/mo | | | | | | | | | | Gas | 75.1094 | 75.1094 | | 15.00 | 4,594.203 | |
| NGL Yield | 73.3 | 72.1 | bbl/MMcf | | | | | | | | | | | | | | 20.00 | 4,181.953 | |
| Gas Shrinkage | 30.9 | 27.5 | % | | | | | | | | | | | | | | | | |
| Oil Severance | 4.6 | 4.6 | % | | | | | | | | | | | | | | | | |
| Gas Severance | 7.5 | 7.5 | % | | | | | | | | | | | | | | | | |
| NGL Severance | 7.5 | 7.5 | % | | | | | | | | | | | | | | | | |
| Ad Valorem | 42.0 | | % | | | | | | | | | | | | | | | | |
| | | | | | | | | | | | | | | | | | | | |
12 Months in first year 18.237 Year Life (03/2036)
THESE DATA ARE PART OF A CG&A REPORT AND ARE SUBJECT TO THE CONDITIONS IN THE TEXT OF THE REPORT. TEXAS REGISTERED ENGINEERING FIRM F-693. | ASN 224 | DEFAULT 1/10/2018 | 10:34:19 OIL PDP Table 4 |
Cawley, Gillespie & Associates, Inc.
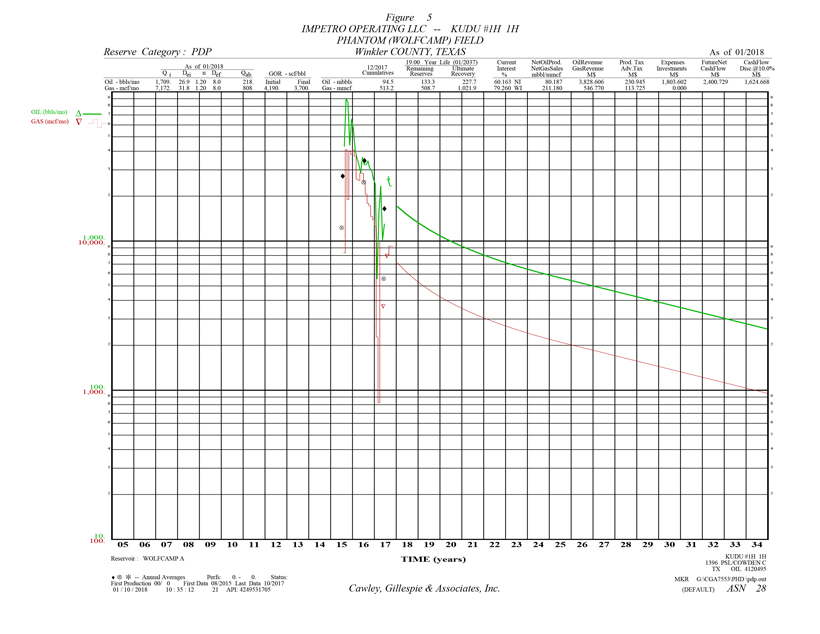
Table 5
Reserve Estimates and Economic Forecasts as of December 31, 2017
Lilis Energy, Inc. Interests
Proved Developed Producing Reserves
IMPETRO OPERATING LLC -- KUDU #1H 1H
PHANTOM \(WOLFCAMP\) FIELD -- Winkler COUNTY, TEXAS
| (1) | (2) | (3) | (4) | (5) | (6) | (7) | (8) | (9) | (10) | |
| | Gross Oil | Gross Gas | Gross NGL | Net Oil | Net Gas | Net NGL | Avg Oil | Avg Gas | Avg NGL | |
| End | Production | Production | Production | Production | Sales | Production | Price | Price | Price | |
| Mo-Year | MBBLS | MMCF | MBBLS | MBBLS | MMCF | MBBLS | $/BBL | $/MCF | $/BBL | |
| 12-2018 | 18.1 | 74.2 | 4.8 | 10.893 | 30.812 | 2.903 | 47.746 | 2.589 | 8.728 | |
| 12-2019 | 14.4 | 56.7 | 3.7 | 8.640 | 23.549 | 2.218 | 47.746 | 2.589 | 8.728 | |
| 12-2020 | 12.0 | 46.5 | 3.0 | 7.229 | 19.285 | 1.817 | 47.746 | 2.589 | 8.728 | |
| 12-2021 | 10.3 | 39.4 | 2.6 | 6.214 | 16.346 | 1.540 | 47.746 | 2.589 | 8.728 | |
| 12-2022 | 9.1 | 34.4 | 2.2 | 5.480 | 14.272 | 1.344 | 47.746 | 2.589 | 8.728 | |
| 12-2023 | 8.2 | 30.6 | 2.0 | 4.913 | 12.701 | 1.196 | 47.746 | 2.589 | 8.728 | |
| 12-2024 | 7.4 | 27.7 | 1.8 | 4.473 | 11.496 | 1.083 | 47.746 | 2.589 | 8.728 | |
| 12-2025 | 6.8 | 25.2 | 1.6 | 4.089 | 10.466 | .986 | 47.746 | 2.589 | 8.728 | |
| 12-2026 | 6.3 | 23.2 | 1.5 | 3.762 | 9.621 | .906 | 47.746 | 2.589 | 8.728 | |
| 12-2027 | 5.8 | 21.3 | 1.4 | 3.462 | 8.852 | .834 | 47.746 | 2.589 | 8.728 | |
| 12-2028 | 5.3 | 19.7 | 1.3 | 3.193 | 8.166 | .769 | 47.746 | 2.589 | 8.728 | |
| 12-2029 | 4.9 | 18.0 | 1.2 | 2.929 | 7.492 | .706 | 47.746 | 2.589 | 8.728 | |
| 12-2030 | 4.5 | 16.6 | 1.1 | 2.695 | 6.893 | .649 | 47.746 | 2.589 | 8.728 | |
| 12-2031 | 4.1 | 15.3 | 1.0 | 2.480 | 6.342 | .597 | 47.746 | 2.589 | 8.728 | |
| 12-2032 | 3.8 | 14.1 | .9 | 2.288 | 5.850 | .551 | 47.746 | 2.589 | 8.728 | |
| 12-2033 | 3.5 | 12.9 | .8 | 2.099 | 5.367 | .506 | 47.746 | 2.589 | 8.728 | |
| 12-2034 | 3.2 | 11.9 | .8 | 1.931 | 4.938 | .465 | 47.746 | 2.589 | 8.728 | |
| 12-2035 | 3.0 | 10.9 | .7 | 1.777 | 4.543 | .428 | 47.746 | 2.589 | 8.728 | |
| 12-2036 | 2.7 | 10.1 | .7 | 1.639 | 4.191 | .395 | 47.746 | 2.589 | 8.728 | |
| S Tot | 133.3 | 508.7 | 33.1 | 80.187 | 211.180 | 19.894 | 47.746 | 2.589 | 8.728 | |
| After | .0 | .0 | .0 | .000 | .000 | .000 | .000 | .000 | .000 | |
| Total | 133.3 | 508.7 | 33.1 | 80.187 | 211.180 | 19.894 | 47.746 | 2.589 | 8.728 | |
| Cum | 94.5 | 513.2 | .0 | | | | | | | |
| Ult | 227.7 | 1,021.9 | 33.1 | | | | | | | |
| (11) | (12) | (13) | (14) | (15) | (16) | (17) | (18) | (19) | (20) | |
| | Oil | Gas | NGL | Hedge | Other | Total | Production | Ad Valorem | | |
| End | Revenue | Revenue | Revenue | Revenue | Revenue | Revenue | Taxes | Taxes | $/BOE6 | |
| Mo-Year | M$ | M$ | M$ | M$ | M$ | M$ | M$ | M$ | | |
| 12-2018 | 520.121 | 79.775 | 25.332 | 0.000 | 0.000 | 625.229 | 31.919 | 15.631 | 7.129 | |
| 12-2019 | 412.507 | 60.972 | 19.362 | 0.000 | 0.000 | 492.841 | 25.087 | 12.321 | 8.328 | |
| 12-2020 | 345.155 | 49.930 | 15.855 | 0.000 | 0.000 | 410.940 | 20.883 | 10.273 | 9.438 | |
| 12-2021 | 296.717 | 42.321 | 13.439 | 0.000 | 0.000 | 352.477 | 17.893 | 8.812 | 10.536 | |
| 12-2022 | 261.661 | 36.951 | 11.734 | 0.000 | 0.000 | 310.345 | 15.742 | 7.759 | 11.579 | |
| 12-2023 | 234.597 | 32.884 | 10.442 | 0.000 | 0.000 | 277.922 | 14.090 | 6.948 | 12.594 | |
| 12-2024 | 213.575 | 29.765 | 9.452 | 0.000 | 0.000 | 252.792 | 12.810 | 6.320 | 13.558 | |
| 12-2025 | 195.256 | 27.098 | 8.605 | 0.000 | 0.000 | 230.958 | 11.700 | 5.774 | 14.562 | |
| 12-2026 | 179.636 | 24.911 | 7.910 | 0.000 | 0.000 | 212.457 | 10.762 | 5.311 | 15.563 | |
| 12-2027 | 165.274 | 22.919 | 7.278 | 0.000 | 0.000 | 195.472 | 9.902 | 4.887 | 16.645 | |
| 12-2028 | 152.460 | 21.142 | 6.714 | 0.000 | 0.000 | 180.317 | 9.134 | 4.508 | 17.783 | |
| 12-2029 | 139.872 | 19.397 | 6.159 | 0.000 | 0.000 | 165.428 | 8.380 | 4.136 | 19.104 | |
| 12-2030 | 128.690 | 17.846 | 5.667 | 0.000 | 0.000 | 152.203 | 7.710 | 3.805 | 20.495 | |
| 12-2031 | 118.401 | 16.419 | 5.214 | 0.000 | 0.000 | 140.034 | 7.094 | 3.501 | 22.006 | |
| 12-2032 | 109.222 | 15.146 | 4.810 | 0.000 | 0.000 | 129.177 | 6.544 | 3.229 | 23.594 | |
| 12-2033 | 100.203 | 13.896 | 4.413 | 0.000 | 0.000 | 118.512 | 6.003 | 2.963 | 25.438 | |
| 12-2034 | 92.192 | 12.785 | 4.060 | 0.000 | 0.000 | 109.037 | 5.523 | 2.726 | 27.379 | |
| 12-2035 | 84.822 | 11.763 | 3.735 | 0.000 | 0.000 | 100.320 | 5.082 | 2.508 | 29.488 | |
| 12-2036 | 78.246 | 10.851 | 3.446 | 0.000 | 0.000 | 92.542 | 4.688 | 2.314 | 31.706 | |
| S Tot | 3,828.606 | 546.770 | 173.625 | 0.000 | 0.000 | 4,549.002 | 230.945 | 113.725 | 14.056 | |
| After | .000 | .000 | .000 | 0.000 | 0.000 | .000 | .000 | .000 | .000 | |
| Total | 3,828.606 | 546.770 | 173.625 | 0.000 | 0.000 | 4,549.002 | 230.945 | 113.725 | 14.056 | |
| (21) | (22) | (23) | (24) | (25) | (26) | (27) | (28) | (29) | (30) | (31) | |
| | Operating | Wells | Workover | 3rd Party | Other | | Future Net | Cumulative | Cum.Cash Flow | |
| End | Expense | Gross | Net | Expense | COPAS | Deductions | Investment | Cash Flow | Cash Flow | Disc.@ 10. % | |
| Mo-Year | M$ | Count | M$ | M$ | M$ | M$ | M$ | M$ | M$ | |
| 12-2018 | 74.188 | 1 | 0.8 | 0.000 | 0.000 | 53.530 | .000 | 449.962 | 449.962 | 430.230 | |
| 12-2019 | 74.188 | 1 | 0.8 | 0.000 | 0.000 | 42.455 | .000 | 338.790 | 788.752 | 724.572 | |
| 12-2020 | 74.188 | 1 | 0.8 | 0.000 | 0.000 | 35.523 | .000 | 270.072 | 1,058.824 | 937.801 | |
| 12-2021 | 74.188 | 1 | 0.8 | 0.000 | 0.000 | 30.538 | .000 | 221.047 | 1,279.871 | 1,096.408 | |
| 12-2022 | 74.188 | 1 | 0.8 | 0.000 | 0.000 | 26.930 | .000 | 185.726 | 1,465.597 | 1,217.546 | |
| 12-2023 | 74.188 | 1 | 0.8 | 0.000 | 0.000 | 24.144 | .000 | 158.552 | 1,624.150 | 1,311.553 | |
| 12-2024 | 74.188 | 1 | 0.8 | 0.000 | 0.000 | 21.981 | .000 | 137.494 | 1,761.643 | 1,385.655 | |
| 12-2025 | 74.188 | 1 | 0.8 | 0.000 | 0.000 | 20.095 | .000 | 119.201 | 1,880.844 | 1,444.048 | |
| 12-2026 | 74.188 | 1 | 0.8 | 0.000 | 0.000 | 18.488 | .000 | 103.708 | 1,984.552 | 1,490.237 | |
| 12-2027 | 74.188 | 1 | 0.8 | 0.000 | 0.000 | 17.010 | .000 | 89.485 | 2,074.038 | 1,526.473 | |
| 12-2028 | 74.188 | 1 | 0.8 | 0.000 | 0.000 | 15.691 | .000 | 76.796 | 2,150.833 | 1,554.746 | |
| 12-2029 | 74.188 | 1 | 0.8 | 0.000 | 0.000 | 14.395 | .000 | 64.329 | 2,215.163 | 1,576.275 | |
| 12-2030 | 74.188 | 1 | 0.8 | 0.000 | 0.000 | 13.245 | .000 | 53.255 | 2,268.418 | 1,592.480 | |
| 12-2031 | 74.188 | 1 | 0.8 | 0.000 | 0.000 | 12.186 | .000 | 43.067 | 2,311.485 | 1,604.396 | |
| 12-2032 | 74.188 | 1 | 0.8 | 0.000 | 0.000 | 11.241 | .000 | 33.976 | 2,345.461 | 1,612.945 | |
| 12-2033 | 74.188 | 1 | 0.8 | 0.000 | 0.000 | 10.313 | .000 | 25.045 | 2,370.506 | 1,618.675 | |
| 12-2034 | 74.188 | 1 | 0.8 | 0.000 | 0.000 | 9.488 | .000 | 17.112 | 2,387.617 | 1,622.236 | |
| 12-2035 | 74.188 | 1 | 0.8 | 0.000 | 0.000 | 8.730 | .000 | 9.812 | 2,397.430 | 1,624.095 | |
| 12-2036 | 74.188 | 1 | 0.8 | 0.000 | 0.000 | 8.053 | .000 | 3.300 | 2,400.729 | 1,624.668 | |
| S Tot | 1,409.567 | | | 0.000 | 0.000 | 394.035 | .000 | 2,400.729 | 2,400.729 | 1,624.668 | |
| After | .000 | | | 0.000 | 0.000 | 0.000 | .000 | .000 | 2,400.729 | 1,624.668 | |
| Total | 1,409.567 | | | 0.000 | 0.000 | 394.035 | .000 | 2,400.729 | 2,400.729 | 1,624.668 | |
| Evaluation Parameters (Gross) | | Expenses (Gross) | | Percent Interests | | Percent | Cum. Disc. | |
| | Initial | Final | Units | | Dei | n | Def | | Initial | Final | Units | | | Initial | Final | | 5.00 | 1,934.777 | |
| Oil Rate | 1,730. | 217. | bbls/mo | | 26.9% | 1.20 | 0.0% | | 7,799. | 7,799. | $/w/mo | | Expense | 79.2604 | 79.2604 | | 8.00 | 1,734.978 | |
| Gas Rate | 7,279. | 805. | Mcf/mo | | 31.8% | 1.20 | 0.0% | | | | | | Revenue | | | | 10.00 | 1,624.668 | |
| GOR | 4,200. | 3,700. | scf/bbl | | | | | | | | | | Oil | 60.1633 | 60.1633 | | 12.00 | 1,528.786 | |
| NGL Rate | 474. | 53. | bbls/mo | | | | | | | | | | Gas | 60.1633 | 60.1633 | | 15.00 | 1,406.644 | |
| NGL Yield | 65.2 | 66.4 | bbl/MMcf | | | | | | | | | | | | | | 20.00 | 1,246.252 | |
| Gas Shrinkage | 32.1 | 31.0 | % | | | | | | | | | | | | | | | | |
| Oil Severance | 4.6 | 4.6 | % | | | | | | | | | | | | | | | | |
| Gas Severance | 7.5 | 7.5 | % | | | | | | | | | | | | | | | | |
| NGL Severance | 7.5 | 7.5 | % | | | | | | | | | | | | | | | | |
| Ad Valorem | 18.9 | | % | | | | | | | | | | | | | | | | |
12 Months in first year 19.001 Year Life (01/2037)
THESE DATA ARE PART OF A CG&A REPORT AND ARE SUBJECT TO THE CONDITIONS IN THE TEXT OF THE REPORT. TEXAS REGISTERED ENGINEERING FIRM F-693. | ASN 28 | DEFAULT 1/10/2018 | 10:34:19 OIL PDP Table 5 |
Cawley, Gillespie & Associates, Inc.
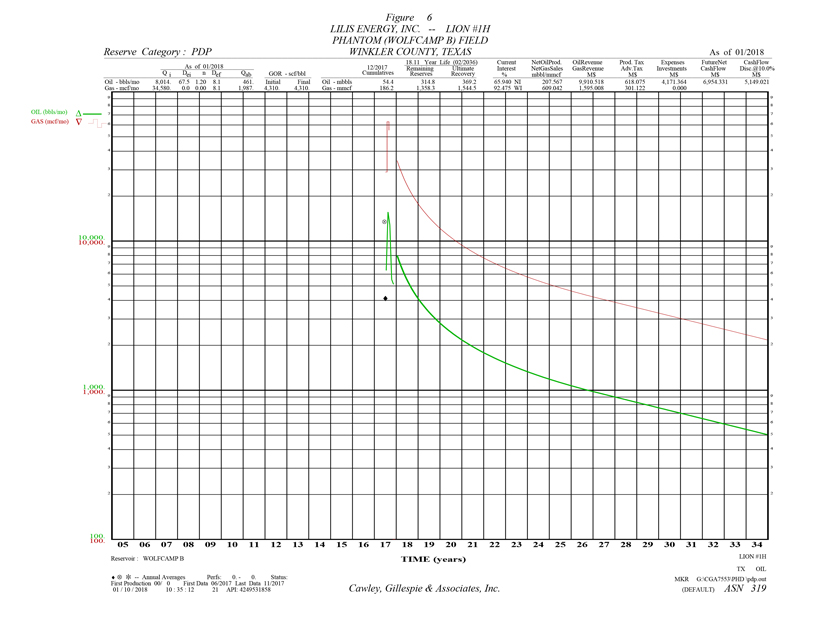
Table 6
Reserve Estimates and Economic Forecasts as of December 31, 2017
Lilis Energy, Inc. Interests
Proved Developed Producing Reserves
LILIS ENERGY, INC. -- LION #1H
PHANTOM (WOLFCAMP B) FIELD -- WINKLER COUNTY, TEXAS
| (1) | (2) | (3) | (4) | (5) | (6) | (7) | (8) | (9) | (10) |
| | Gross Oil | Gross Gas | Gross NGL | Net Oil | Net Gas | Net NGL | Avg Oil | Avg Gas | Avg NGL |
| End | Production | Production | Production | Production | Sales | Production | Price | Price | Price |
| Mo-Year | MBBLS | MMCF | MBBLS | MBBLS | MMCF | MBBLS | $/BBL | $/MCF | $/BBL |
| 12-2018 | 68.4 | 295.2 | 20.4 | 45.111 | 132.366 | 13.431 | 47.746 | 2.619 | 8.728 | |
| 12-2019 | 40.5 | 174.8 | 12.1 | 26.706 | 78.359 | 7.951 | 47.746 | 2.619 | 8.728 | |
| 12-2020 | 29.6 | 127.9 | 8.8 | 19.548 | 57.359 | 5.820 | 47.746 | 2.619 | 8.728 | |
| 12-2021 | 23.6 | 101.7 | 7.0 | 15.537 | 45.589 | 4.626 | 47.746 | 2.619 | 8.728 | |
| 12-2022 | 19.7 | 85.1 | 5.9 | 13.009 | 38.171 | 3.873 | 47.746 | 2.619 | 8.728 | |
| 12-2023 | 17.0 | 73.6 | 5.1 | 11.240 | 32.981 | 3.347 | 47.746 | 2.619 | 8.728 | |
| 12-2024 | 15.1 | 65.1 | 4.5 | 9.953 | 29.203 | 2.963 | 47.746 | 2.619 | 8.728 | |
| 12-2025 | 13.5 | 58.3 | 4.0 | 8.908 | 26.137 | 2.652 | 47.746 | 2.619 | 8.728 | |
| 12-2026 | 12.3 | 53.0 | 3.7 | 8.096 | 23.755 | 2.410 | 47.746 | 2.619 | 8.728 | |
| 12-2027 | 11.3 | 48.6 | 3.4 | 7.427 | 21.792 | 2.211 | 47.746 | 2.619 | 8.728 | |
| 12-2028 | 10.4 | 44.8 | 3.1 | 6.851 | 20.102 | 2.040 | 47.746 | 2.619 | 8.728 | |
| 12-2029 | 9.5 | 41.1 | 2.8 | 6.285 | 18.442 | 1.871 | 47.746 | 2.619 | 8.728 | |
| 12-2030 | 8.8 | 37.8 | 2.6 | 5.783 | 16.967 | 1.722 | 47.746 | 2.619 | 8.728 | |
| 12-2031 | 8.1 | 34.8 | 2.4 | 5.320 | 15.611 | 1.584 | 47.746 | 2.619 | 8.728 | |
| 12-2032 | 7.4 | 32.1 | 2.2 | 4.908 | 14.401 | 1.461 | 47.746 | 2.619 | 8.728 | |
| 12-2033 | 6.8 | 29.5 | 2.0 | 4.503 | 13.212 | 1.341 | 47.746 | 2.619 | 8.728 | |
| 12-2034 | 6.3 | 27.1 | 1.9 | 4.143 | 12.155 | 1.233 | 47.746 | 2.619 | 8.728 | |
| 12-2035 | 5.8 | 24.9 | 1.7 | 3.811 | 11.184 | 1.135 | 47.746 | 2.619 | 8.728 | |
| 02-2036 | .6 | 2.8 | .2 | .428 | 1.257 | .128 | 47.746 | 2.619 | 8.728 | |
| S Tot | 314.8 | 1,358.3 | 93.7 | 207.567 | 609.042 | 61.800 | 47.746 | 2.619 | 8.728 | |
| After | .0 | .0 | .0 | .000 | .000 | .000 | .000 | .000 | .000 | |
| Total | 314.8 | 1,358.3 | 93.7 | 207.567 | 609.042 | 61.800 | 47.746 | 2.619 | 8.728 | |
| Cum | 54.4 | 186.2 | .0 | | | | | | | |
| Ult | 369.2 | 1,544.5 | 93.7 | | | | | | | |
| (11) | (12) | (13) | (14) | (15) | (16) | (17) | (18) | (19) | (20) |
| | Oil | Gas | NGL | Hedge | Other | Total | Production | Ad Valorem | |
| End | Revenue | Revenue | Revenue | Revenue | Revenue | Revenue | Taxes | Taxes | $/BOE6 |
| Mo-Year | M$ | M$ | M$ | M$ | M$ | M$ | M$ | M$ | |
| 12-2018 | 2,153.893 | 346.649 | 117.223 | 0.000 | 0.000 | 2,617.765 | 134.329 | 65.444 | 5.073 | |
| 12-2019 | 1,275.087 | 205.214 | 69.395 | 0.000 | 0.000 | 1,549.695 | 79.521 | 38.742 | 6.685 | |
| 12-2020 | 933.366 | 150.217 | 50.797 | 0.000 | 0.000 | 1,134.380 | 58.210 | 28.360 | 8.132 | |
| 12-2021 | 741.842 | 119.393 | 40.374 | 0.000 | 0.000 | 901.608 | 46.265 | 22.540 | 9.526 | |
| 12-2022 | 621.136 | 99.966 | 33.804 | 0.000 | 0.000 | 754.907 | 38.737 | 18.873 | 10.846 | |
| 12-2023 | 536.674 | 86.373 | 29.208 | 0.000 | 0.000 | 652.254 | 33.470 | 16.306 | 12.122 | |
| 12-2024 | 475.202 | 76.480 | 25.862 | 0.000 | 0.000 | 577.544 | 29.636 | 14.439 | 13.337 | |
| 12-2025 | 425.314 | 68.450 | 23.147 | 0.000 | 0.000 | 516.911 | 26.525 | 12.923 | 14.580 | |
| 12-2026 | 386.544 | 62.211 | 21.037 | 0.000 | 0.000 | 469.792 | 24.107 | 11.745 | 15.768 | |
| 12-2027 | 354.598 | 57.069 | 19.299 | 0.000 | 0.000 | 430.966 | 22.115 | 10.774 | 16.943 | |
| 12-2028 | 327.098 | 52.643 | 17.802 | 0.000 | 0.000 | 397.544 | 20.400 | 9.939 | 18.137 | |
| 12-2029 | 300.091 | 48.297 | 16.332 | 0.000 | 0.000 | 364.719 | 18.715 | 9.118 | 19.524 | |
| 12-2030 | 276.099 | 44.436 | 15.026 | 0.000 | 0.000 | 335.561 | 17.219 | 8.389 | 20.982 | |
| 12-2031 | 254.026 | 40.883 | 13.825 | 0.000 | 0.000 | 308.734 | 15.842 | 7.718 | 22.568 | |
| 12-2032 | 234.331 | 37.713 | 12.753 | 0.000 | 0.000 | 284.797 | 14.614 | 7.120 | 24.235 | |
| 12-2033 | 214.983 | 34.600 | 11.700 | 0.000 | 0.000 | 261.282 | 13.408 | 6.532 | 26.170 | |
| 12-2034 | 197.795 | 31.833 | 10.765 | 0.000 | 0.000 | 240.394 | 12.336 | 6.010 | 28.207 | |
| 12-2035 | 181.982 | 29.288 | 9.904 | 0.000 | 0.000 | 221.175 | 11.349 | 5.529 | 30.420 | |
| 02-2036 | 20.458 | 3.292 | 1.113 | 0.000 | 0.000 | 24.863 | 1.276 | .622 | 31.349 | |
| S Tot | 9,910.518 | 1,595.008 | 539.366 | 0.000 | 0.000 | 12,044.892 | 618.075 | 301.122 | 11.944 | |
| After | .000 | .000 | .000 | 0.000 | 0.000 | .000 | .000 | .000 | .000 | |
| Total | 9,910.518 | 1,595.008 | 539.366 | 0.000 | 0.000 | 12,044.892 | 618.075 | 301.122 | 11.944 | |
| (21) | (22) | (23) | (24) | (25) | (26) | (27) | (28) | (29) | (30) | (31) |
| | Operating | Wells | Workover | 3rd Party | Other | | Future Net | Cumulative | Cum.Cash Flow |
| End | Expense | Gross | Net | Expense | COPAS | Deductions | Investment | Cash Flow | Cash Flow | Disc.@ 10. % |
| Mo-Year | M$ | Count | M$ | M$ | M$ | M$ | M$ | M$ | M$ |
| 12-2018 | 177.553 | 1 | 0.9 | 0.000 | 0.000 | 207.508 | .000 | 2,032.932 | 2,032.932 | 1,950.642 | |
| 12-2019 | 177.553 | 1 | 0.9 | 0.000 | 0.000 | 122.843 | .000 | 1,131.036 | 3,163.967 | 2,934.737 | |
| 12-2020 | 177.553 | 1 | 0.9 | 0.000 | 0.000 | 89.921 | .000 | 780.337 | 3,944.304 | 3,551.362 | |
| 12-2021 | 177.553 | 1 | 0.9 | 0.000 | 0.000 | 71.470 | .000 | 583.780 | 4,528.084 | 3,970.486 | |
| 12-2022 | 177.553 | 1 | 0.9 | 0.000 | 0.000 | 59.841 | .000 | 459.903 | 4,987.988 | 4,270.584 | |
| 12-2023 | 177.553 | 1 | 0.9 | 0.000 | 0.000 | 51.704 | .000 | 373.222 | 5,361.210 | 4,491.950 | |
| 12-2024 | 177.553 | 1 | 0.9 | 0.000 | 0.000 | 45.781 | .000 | 310.135 | 5,671.345 | 4,659.150 | |
| 12-2025 | 177.553 | 1 | 0.9 | 0.000 | 0.000 | 40.975 | .000 | 258.936 | 5,930.281 | 4,786.027 | |
| 12-2026 | 177.553 | 1 | 0.9 | 0.000 | 0.000 | 37.240 | .000 | 219.148 | 6,149.428 | 4,883.644 | |
| 12-2027 | 177.553 | 1 | 0.9 | 0.000 | 0.000 | 34.162 | .000 | 186.363 | 6,335.791 | 4,959.114 | |
| 12-2028 | 177.553 | 1 | 0.9 | 0.000 | 0.000 | 31.513 | .000 | 158.140 | 6,493.931 | 5,017.339 | |
| 12-2029 | 177.553 | 1 | 0.9 | 0.000 | 0.000 | 28.911 | .000 | 130.423 | 6,624.353 | 5,060.991 | |
| 12-2030 | 177.553 | 1 | 0.9 | 0.000 | 0.000 | 26.600 | .000 | 105.801 | 6,730.154 | 5,093.189 | |
| 12-2031 | 177.553 | 1 | 0.9 | 0.000 | 0.000 | 24.473 | .000 | 83.147 | 6,813.301 | 5,116.199 | |
| 12-2032 | 177.553 | 1 | 0.9 | 0.000 | 0.000 | 22.576 | .000 | 62.935 | 6,876.236 | 5,132.041 | |
| 12-2033 | 177.553 | 1 | 0.9 | 0.000 | 0.000 | 20.712 | .000 | 43.079 | 6,919.315 | 5,141.901 | |
| 12-2034 | 177.553 | 1 | 0.9 | 0.000 | 0.000 | 19.056 | .000 | 25.440 | 6,944.755 | 5,147.201 | |
| 12-2035 | 177.553 | 1 | 0.9 | 0.000 | 0.000 | 17.532 | .000 | 9.211 | 6,953.965 | 5,148.956 | |
| 02-2036 | 20.629 | 1 | 0.9 | 0.000 | 0.000 | 1.971 | .000 | .366 | 6,954.331 | 5,149.021 | |
| S Tot | 3,216.576 | | | 0.000 | 0.000 | 954.788 | .000 | 6,954.331 | 6,954.331 | 5,149.021 | |
| After | .000 | | | 0.000 | 0.000 | 0.000 | .000 | .000 | 6,954.331 | 5,149.021 | |
| Total | 3,216.576 | | | 0.000 | 0.000 | 954.788 | .000 | 6,954.331 | 6,954.331 | 5,149.021 | |
| Evaluation Parameters (Gross) | | Expenses (Gross) | | Percent Interests | | Percent | Cum. Disc. | |
| | Initial | Final | Units | | Dei | n | Def | | Initial | Final | Units | | | Initial | Final | | 5.00 | 5,887.468 | |
| Oil Rate | 8,363. | 457. | bbls/mo | | 67.6% | 1.20 | 0.0% | | 15,999. | 15,999. | $/w/mo | | Expense | 92.4753 | 92.4753 | | 8.00 | 5,414.870 | |
| Gas Rate | 36,087. | 1,974. | Mcf/mo | | 0.0% | 0.00 | 0.0% | | | | | | Revenue | | | | 10.00 | 5,149.021 | |
| GOR | 4,310. | 4,310. | scf/bbl | | | | | | | | | | Oil | 65.9402 | 65.9402 | | 12.00 | 4,914.672 | |
| NGL Rate | 2,430. | 139. | bbls/mo | | | | | | | | | | Gas | 65.9402 | 65.9402 | | 15.00 | 4,611.156 | |
| NGL Yield | 67.3 | 70.7 | bbl/MMcf | | | | | | | | | | | | | | 20.00 | 4,202.721 | |
| Gas Shrinkage | 34.8 | 31.7 | % | | | | | | | | | | | | | | | | |
| Oil Severance | 4.6 | 4.6 | % | | | | | | | | | | | | | | | | |
| Gas Severance | 7.5 | 7.5 | % | | | | | | | | | | | | | | | | |
| NGL Severance | 7.5 | 7.5 | % | | | | | | | | | | | | | | | | |
| Ad Valorem | 44.9 | | % | | | | | | | | | | | | | | | | |
12 Months in first year 18.116 Year Life (02/2036)
THESE DATA ARE PART OF A CG&A REPORT AND ARE SUBJECT TO THE CONDITIONS IN THE TEXT OF THE REPORT. TEXAS REGISTERED ENGINEERING FIRM F-693. | ASN 319 | DEFAULT 1/10/2018 10:34:19
OIL PDP
Table 6 |
Cawley, Gillespie & Associates, Inc.
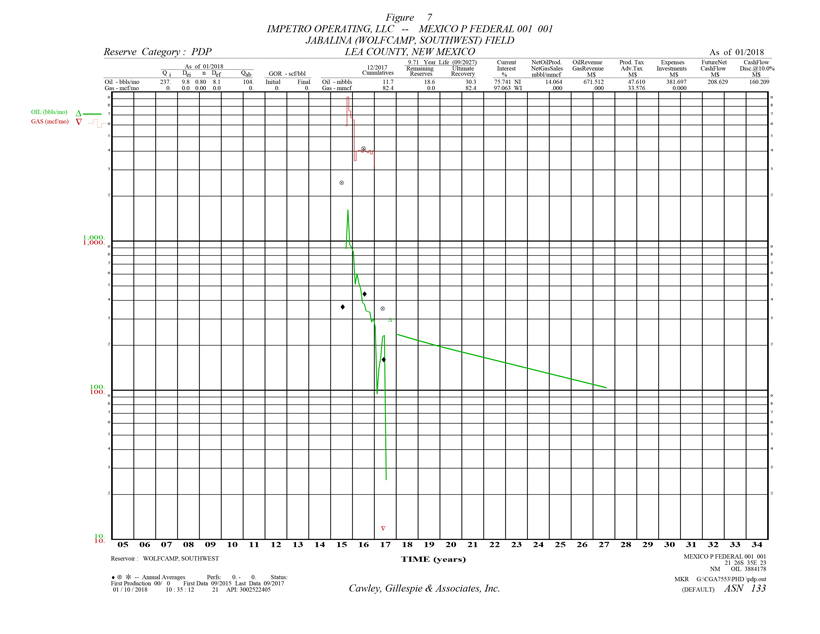
Table 7
Reserve Estimates and Economic Forecasts as of December 31, 2017
Lilis Energy, Inc. Interests
Proved Developed Producing Reserves
IMPETRO OPERATING, LLC -- MEXICO P FEDERAL 001 001
JABALINA (WOLFCAMP, SOUTHWEST) FIELD -- LEA COUNTY, NEW MEXICO
| (1) | (2) | (3) | (4) | (5) | (6) | (7) | (8) | (9) | (10) |
| | Gross Oil | Gross Gas | Gross NGL | Net Oil | Net Gas | Net NGL | Avg Oil | Avg Gas | Avg NGL |
| End | Production | Production | Production | Production | Sales | Production | Price | Price | Price |
| Mo-Year | MBBLS | MMCF | MBBLS | MBBLS | MMCF | MBBLS | $/BBL | $/MCF | $/BBL |
| 12-2018 | 2.7 | .0 | .0 | 2.056 | .000 | .000 | 47.746 | .000 | .000 | |
| 12-2019 | 2.5 | .0 | .0 | 1.869 | .000 | .000 | 47.746 | .000 | .000 | |
| 12-2020 | 2.3 | .0 | .0 | 1.714 | .000 | .000 | 47.746 | .000 | .000 | |
| 12-2021 | 2.1 | .0 | .0 | 1.571 | .000 | .000 | 47.746 | .000 | .000 | |
| 12-2022 | 1.9 | .0 | .0 | 1.446 | .000 | .000 | 47.746 | .000 | .000 | |
| 12-2023 | 1.8 | .0 | .0 | 1.330 | .000 | .000 | 47.746 | .000 | .000 | |
| 12-2024 | 1.6 | .0 | .0 | 1.227 | .000 | .000 | 47.746 | .000 | .000 | |
| 12-2025 | 1.5 | .0 | .0 | 1.126 | .000 | .000 | 47.746 | .000 | .000 | |
| 12-2026 | 1.4 | .0 | .0 | 1.036 | .000 | .000 | 47.746 | .000 | .000 | |
| 09-2027 | .9 | .0 | .0 | .689 | .000 | .000 | 47.746 | .000 | .000 | |
| 12-2028 | | | | | | | | | | |
| 12-2029 | | | | | | | | | | |
| 12-2030 | | | | | | | | | | |
| 12-2031 | | | | | | | | | | |
| 12-2032 | | | | | | | | | | |
| 12-2033 | | | | | | | | | | |
| 12-2034 | | | | | | | | | | |
| 12-2035 | | | | | | | | | | |
| 12-2036 | | | | | | | | | | |
| S Tot | 18.6 | .0 | .0 | 14.064 | .000 | .000 | 47.746 | .000 | .000 | |
| After | .0 | .0 | .0 | .000 | .000 | .000 | .000 | .000 | .000 | |
| Total | 18.6 | .0 | .0 | 14.064 | .000 | .000 | 47.746 | .000 | .000 | |
| Cum | 11.7 | 82.4 | .0 | | | | | | | |
| Ult | 30.3 | 82.4 | .0 | | | | | | | |
| (11) | (12) | (13) | (14) | (15) | (16) | (17) | (18) | (19) | (20) |
| | Oil | Gas | NGL | Hedge | Other | Total | Production | Ad Valorem | |
| End | Revenue | Revenue | Revenue | Revenue | Revenue | Revenue | Taxes | Taxes | $/BOE6 |
| Mo-Year | M$ | M$ | M$ | M$ | M$ | M$ | M$ | M$ | |
| 12-2018 | 98.172 | .000 | .000 | 0.000 | 0.000 | 98.172 | 6.960 | 4.909 | 19.125 | |
| 12-2019 | 89.215 | .000 | .000 | 0.000 | 0.000 | 89.215 | 6.325 | 4.461 | 21.045 | |
| 12-2020 | 81.843 | .000 | .000 | 0.000 | 0.000 | 81.843 | 5.803 | 4.092 | 22.940 | |
| 12-2021 | 75.029 | .000 | .000 | 0.000 | 0.000 | 75.029 | 5.320 | 3.751 | 25.023 | |
| 12-2022 | 69.031 | .000 | .000 | 0.000 | 0.000 | 69.031 | 4.894 | 3.452 | 27.198 | |
| 12-2023 | 63.512 | .000 | .000 | 0.000 | 0.000 | 63.512 | 4.503 | 3.176 | 29.561 | |
| 12-2024 | 58.588 | .000 | .000 | 0.000 | 0.000 | 58.588 | 4.154 | 2.929 | 32.046 | |
| 12-2025 | 53.750 | .000 | .000 | 0.000 | 0.000 | 53.750 | 3.811 | 2.688 | 34.930 | |
| 12-2026 | 49.453 | .000 | .000 | 0.000 | 0.000 | 49.453 | 3.506 | 2.473 | 37.965 | |
| 09-2027 | 32.919 | .000 | .000 | 0.000 | 0.000 | 32.919 | 2.334 | 1.646 | 40.316 | |
| 12-2028 | | | | | | | | | | |
| 12-2029 | | | | | | | | | | |
| 12-2030 | | | | | | | | | | |
| 12-2031 | | | | | | | | | | |
| 12-2032 | | | | | | | | | | |
| 12-2033 | | | | | | | | | | |
| 12-2034 | | | | | | | | | | |
| 12-2035 | | | | | | | | | | |
| 12-2036 | | | | | | | | | | |
| S Tot | 671.512 | .000 | .000 | 0.000 | 0.000 | 671.512 | 47.610 | 33.576 | 27.140 | |
| After | .000 | .000 | .000 | 0.000 | 0.000 | .000 | .000 | .000 | .000 | |
| Total | 671.512 | .000 | .000 | 0.000 | 0.000 | 671.512 | 47.610 | 33.576 | 27.140 | |
| (21) | (22) | (23) | (24) | (25) | (26) | (27) | (28) | (29) | (30) | (31) |
| | Operating | Wells | Workover | 3rd Party | Other | | Future Net | Cumulative | Cum.Cash Flow |
| End | Expense | Gross | Net | Expense | COPAS | Deductions | Investment | Cash Flow | Cash Flow | Disc.@ 10. % |
| Mo-Year | M$ | Count | M$ | M$ | M$ | M$ | M$ | M$ | M$ |
| 12-2018 | 39.322 | 1 | 1.0 | 0.000 | 0.000 | 0.000 | .000 | 46.980 | 46.980 | 44.866 | |
| 12-2019 | 39.322 | 1 | 1.0 | 0.000 | 0.000 | 0.000 | .000 | 39.106 | 86.087 | 78.818 | |
| 12-2020 | 39.322 | 1 | 1.0 | 0.000 | 0.000 | 0.000 | .000 | 32.626 | 118.712 | 104.570 | |
| 12-2021 | 39.322 | 1 | 1.0 | 0.000 | 0.000 | 0.000 | .000 | 26.636 | 145.348 | 123.681 | |
| 12-2022 | 39.322 | 1 | 1.0 | 0.000 | 0.000 | 0.000 | .000 | 21.363 | 166.711 | 137.618 | |
| 12-2023 | 39.322 | 1 | 1.0 | 0.000 | 0.000 | 0.000 | .000 | 16.511 | 183.222 | 147.414 | |
| 12-2024 | 39.322 | 1 | 1.0 | 0.000 | 0.000 | 0.000 | .000 | 12.182 | 195.404 | 153.988 | |
| 12-2025 | 39.322 | 1 | 1.0 | 0.000 | 0.000 | 0.000 | .000 | 7.930 | 203.334 | 157.880 | |
| 12-2026 | 39.322 | 1 | 1.0 | 0.000 | 0.000 | 0.000 | .000 | 4.152 | 207.486 | 159.737 | |
| 09-2027 | 27.796 | 1 | 1.0 | 0.000 | 0.000 | 0.000 | .000 | 1.143 | 208.629 | 160.209 | |
| 12-2028 | | | | | | | | | | | |
| 12-2029 | | | | | | | | | | | |
| 12-2030 | | | | | | | | | | | |
| 12-2031 | | | | | | | | | | | |
| 12-2032 | | | | | | | | | | | |
| 12-2033 | | | | | | | | | | | |
| 12-2034 | | | | | | | | | | | |
| 12-2035 | | | | | | | | | | | |
| 12-2036 | | | | | | | | | | | |
| S Tot | 381.697 | | | 0.000 | 0.000 | 0.000 | .000 | 208.629 | 208.629 | 160.209 | |
| After | .000 | | | 0.000 | 0.000 | 0.000 | .000 | .000 | 208.629 | 160.209 | |
| Total | 381.697 | | | 0.000 | 0.000 | 0.000 | .000 | 208.629 | 208.629 | 160.209 | |
| Evaluation Parameters (Gross) | | Expenses (Gross) | | Percent Interests | | Percent | Cum. Disc. | |
| | Initial | Final | Units | | Dei | n | Def | | Initial | Final | Units | | | Initial | Final | | 5.00 | 181.299 | |
| Oil Rate | 237. | 103. | bbls/mo | | 9.8% | 0.80 | 0.0% | | 3,375. | 3,375. | $/w/mo | | Expense | 97.0634 | 97.0634 | | 8.00 | 168.026 | |
| Gas Rate | 0. | 0. | Mcf/mo | | 0.0% | 0.00 | 0.0% | | | | | | Revenue | | | | 10.00 | 160.209 | |
| GOR | 0. | 0. | scf/bbl | | | | | | | | | | Oil | 75.7412 | 75.7412 | | 12.00 | 153.099 | |
| NGL Rate | 0. | 0. | bbls/mo | | | | | | | | | | Gas | 75.7412 | 75.7412 | | 15.00 | 143.577 | |
| NGL Yield | 0.0 | 0.0 | bbl/MMcf | | | | | | | | | | | | | | 20.00 | 130.206 | |
| Gas Shrinkage | 0.0 | 0.0 | % | | | | | | | | | | | | | | | | |
| Oil Severance | 7.1 | 7.1 | % | | | | | | | | | | | | | | | | |
| Gas Severance | 0.0 | 0.0 | % | | | | | | | | | | | | | | | | |
| NGL Severance | 0.0 | 0.0 | % | | | | | | | | | | | | | | | | |
| Ad Valorem | 19.1 | | % | | | | | | | | | | | | | | | | |
12 Months in first year 9.714 Year Life (09/2027)
| THESE DATA ARE PART OF A CG&A REPORT AND ARE SUBJECT TO THE CONDITIONS IN THE TEXT OF THE REPORT. | ASN 133 | DEFAULT 1/10/2018 10:34:19 |
| TEXAS REGISTERED ENGINEERING FIRM F-693. | | OIL PDP |
| | | Table 7 |
Cawley, Gillespie & Associates, Inc.

Table 8
Reserve Estimates and Economic Forecasts as of December 31, 2017
Lilis Energy, Inc. Interests
Proved Developed Producing Reserves
LILIS ENERGY, INC. -- PRIZE HOG BWZ ST COM 1H #1H
TBD (WOLFCAMP B) FIELD -- LEA COUNTY, NEW MEXICO
| (1) | (2) | (3) | (4) | (5) | (6) | (7) | (8) | (9) | (10) |
| | Gross Oil | Gross Gas | Gross NGL | Net Oil | Net Gas | Net NGL | Avg Oil | Avg Gas | Avg NGL |
| End | Production | Production | Production | Production | Sales | Production | Price | Price | Price |
| Mo-Year | MBBLS | MMCF | MBBLS | MBBLS | MMCF | MBBLS | $/BBL | $/MCF | $/BBL |
| 12-2018 | 104.4 | 198.4 | 13.7 | 55.160 | 71.266 | 7.231 | 47.746 | 2.619 | 8.728 | |
| 12-2019 | 53.2 | 101.0 | 7.0 | 28.079 | 36.279 | 3.681 | 47.746 | 2.619 | 8.728 | |
| 12-2020 | 37.3 | 70.8 | 4.9 | 19.677 | 25.422 | 2.580 | 47.746 | 2.619 | 8.728 | |
| 12-2021 | 29.0 | 55.1 | 3.8 | 15.308 | 19.779 | 2.007 | 47.746 | 2.619 | 8.728 | |
| 12-2022 | 24.0 | 45.5 | 3.1 | 12.655 | 16.351 | 1.659 | 47.746 | 2.619 | 8.728 | |
| 12-2023 | 20.5 | 39.0 | 2.7 | 10.842 | 14.008 | 1.421 | 47.746 | 2.619 | 8.728 | |
| 12-2024 | 18.1 | 34.3 | 2.4 | 9.542 | 12.329 | 1.251 | 47.746 | 2.619 | 8.728 | |
| 12-2025 | 16.1 | 30.6 | 2.1 | 8.502 | 10.984 | 1.115 | 47.746 | 2.619 | 8.728 | |
| 12-2026 | 14.6 | 27.7 | 1.9 | 7.699 | 9.948 | 1.009 | 47.746 | 2.619 | 8.728 | |
| 12-2027 | 13.3 | 25.3 | 1.7 | 7.046 | 9.104 | .924 | 47.746 | 2.619 | 8.728 | |
| 12-2028 | 12.3 | 23.4 | 1.6 | 6.498 | 8.396 | .852 | 47.746 | 2.619 | 8.728 | |
| 12-2029 | 11.3 | 21.4 | 1.5 | 5.962 | 7.702 | .782 | 47.746 | 2.619 | 8.728 | |
| 12-2030 | 10.4 | 19.7 | 1.4 | 5.485 | 7.087 | .719 | 47.746 | 2.619 | 8.728 | |
| 12-2031 | 9.6 | 18.2 | 1.3 | 5.046 | 6.520 | .662 | 47.746 | 2.619 | 8.728 | |
| 12-2032 | 8.8 | 16.7 | 1.2 | 4.655 | 6.015 | .610 | 47.746 | 2.619 | 8.728 | |
| 12-2033 | 8.1 | 15.4 | 1.1 | 4.271 | 5.518 | .560 | 47.746 | 2.619 | 8.728 | |
| 12-2034 | 7.4 | 14.1 | 1.0 | 3.929 | 5.077 | .515 | 47.746 | 2.619 | 8.728 | |
| 12-2035 | 6.8 | 13.0 | .9 | 3.615 | 4.671 | .474 | 47.746 | 2.619 | 8.728 | |
| 12-2036 | 6.3 | 12.0 | .8 | 3.335 | 4.309 | .437 | 47.746 | 2.619 | 8.728 | |
| S Tot | 411.5 | 781.8 | 53.9 | 217.308 | 280.763 | 28.489 | 47.746 | 2.619 | 8.728 | |
| After | 4.8 | 9.2 | .6 | 2.550 | 3.294 | .334 | 47.746 | 2.619 | 8.728 | |
| Total | 416.3 | 791.0 | 54.6 | 219.858 | 284.057 | 28.823 | 47.746 | 2.619 | 8.728 | |
| Cum | 17.0 | 32.2 | .0 | | | | | | | |
| Ult | 433.3 | 823.2 | 54.6 | | | | | | | |
| (11) | (12) | (13) | (14) | (15) | (16) | (17) | (18) | (19) | (20) |
| | Oil | Gas | NGL | Hedge | Other | Total | Production | Ad Valorem | |
| End | Revenue | Revenue | Revenue | Revenue | Revenue | Revenue | Taxes | Taxes | $/BOE6 |
| Mo-Year | M$ | M$ | M$ | M$ | M$ | M$ | M$ | M$ | |
| 12-2018 | 2,633.669 | 186.638 | 63.113 | 0.000 | 0.000 | 2,883.420 | 206.557 | 144.171 | 4.844 | |
| 12-2019 | 1,340.683 | 95.009 | 32.128 | 0.000 | 0.000 | 1,467.820 | 105.149 | 73.391 | 6.521 | |
| 12-2020 | 939.483 | 66.578 | 22.514 | 0.000 | 0.000 | 1,028.574 | 73.683 | 51.429 | 7.981 | |
| 12-2021 | 730.921 | 51.798 | 17.516 | 0.000 | 0.000 | 800.235 | 57.326 | 40.012 | 9.372 | |
| 12-2022 | 604.251 | 42.821 | 14.480 | 0.000 | 0.000 | 661.552 | 47.391 | 33.078 | 10.686 | |
| 12-2023 | 517.676 | 36.686 | 12.406 | 0.000 | 0.000 | 566.767 | 40.601 | 28.338 | 11.955 | |
| 12-2024 | 455.608 | 32.287 | 10.918 | 0.000 | 0.000 | 498.814 | 35.733 | 24.941 | 13.160 | |
| 12-2025 | 405.924 | 28.766 | 9.728 | 0.000 | 0.000 | 444.418 | 31.836 | 22.221 | 14.391 | |
| 12-2026 | 367.619 | 26.052 | 8.810 | 0.000 | 0.000 | 402.480 | 28.832 | 20.124 | 15.567 | |
| 12-2027 | 336.428 | 23.841 | 8.062 | 0.000 | 0.000 | 368.331 | 26.386 | 18.417 | 16.723 | |
| 12-2028 | 310.262 | 21.987 | 7.435 | 0.000 | 0.000 | 339.684 | 24.334 | 16.984 | 17.871 | |
| 12-2029 | 284.644 | 20.172 | 6.821 | 0.000 | 0.000 | 311.637 | 22.325 | 15.582 | 19.200 | |
| 12-2030 | 261.888 | 18.559 | 6.276 | 0.000 | 0.000 | 286.722 | 20.540 | 14.336 | 20.599 | |
| 12-2031 | 240.950 | 17.075 | 5.774 | 0.000 | 0.000 | 263.800 | 18.898 | 13.190 | 22.119 | |
| 12-2032 | 222.269 | 15.751 | 5.326 | 0.000 | 0.000 | 243.347 | 17.432 | 12.167 | 23.717 | |
| 12-2033 | 203.917 | 14.451 | 4.887 | 0.000 | 0.000 | 223.255 | 15.993 | 11.163 | 25.572 | |
| 12-2034 | 187.614 | 13.296 | 4.496 | 0.000 | 0.000 | 205.406 | 14.715 | 10.270 | 27.525 | |
| 12-2035 | 172.615 | 12.233 | 4.137 | 0.000 | 0.000 | 188.984 | 13.538 | 9.449 | 29.647 | |
| 12-2036 | 159.232 | 11.284 | 3.816 | 0.000 | 0.000 | 174.332 | 12.488 | 8.717 | 31.878 | |
| S Tot | 10,375.652 | 735.283 | 248.643 | 0.000 | 0.000 | 11,359.578 | 813.757 | 567.979 | 11.494 | |
| After | 121.731 | 8.627 | 2.917 | 0.000 | 0.000 | 133.275 | 9.547 | 6.664 | 33.880 | |
| Total | 10,497.384 | 743.910 | 251.560 | 0.000 | 0.000 | 11,492.853 | 823.305 | 574.643 | 11.754 | |
| (21) | (22) | (23) | (24) | (25) | (26) | (27) | (28) | (29) | (30) | (31) |
| | Operating | Wells | Workover | 3rd Party | Other | | Future Net | Cumulative | Cum.Cash Flow |
| End | Expense | Gross | Net | Expense | COPAS | Deductions | Investment | Cash Flow | Cash Flow | Disc.@ 10. % |
| Mo-Year | M$ | Count | M$ | M$ | M$ | M$ | M$ | M$ | M$ |
| 12-2018 | 124.800 | 1 | 0.7 | 0.000 | 0.000 | 222.676 | .000 | 2,185.216 | 2,185.216 | 2,101.198 | |
| 12-2019 | 124.800 | 1 | 0.7 | 0.000 | 0.000 | 113.354 | .000 | 1,051.126 | 3,236.342 | 3,016.173 | |
| 12-2020 | 124.800 | 1 | 0.7 | 0.000 | 0.000 | 79.433 | .000 | 699.229 | 3,935.571 | 3,568.798 | |
| 12-2021 | 124.800 | 1 | 0.7 | 0.000 | 0.000 | 61.799 | .000 | 516.298 | 4,451.869 | 3,939.498 | |
| 12-2022 | 124.800 | 1 | 0.7 | 0.000 | 0.000 | 51.089 | .000 | 405.194 | 4,857.064 | 4,203.904 | |
| 12-2023 | 124.800 | 1 | 0.7 | 0.000 | 0.000 | 43.769 | .000 | 329.259 | 5,186.322 | 4,399.193 | |
| 12-2024 | 124.800 | 1 | 0.7 | 0.000 | 0.000 | 38.521 | .000 | 274.818 | 5,461.140 | 4,547.347 | |
| 12-2025 | 124.800 | 1 | 0.7 | 0.000 | 0.000 | 34.321 | .000 | 231.240 | 5,692.380 | 4,660.649 | |
| 12-2026 | 124.800 | 1 | 0.7 | 0.000 | 0.000 | 31.082 | .000 | 197.642 | 5,890.022 | 4,748.683 | |
| 12-2027 | 124.800 | 1 | 0.7 | 0.000 | 0.000 | 28.445 | .000 | 170.284 | 6,060.306 | 4,817.635 | |
| 12-2028 | 124.800 | 1 | 0.7 | 0.000 | 0.000 | 26.233 | .000 | 147.333 | 6,207.639 | 4,871.873 | |
| 12-2029 | 124.800 | 1 | 0.7 | 0.000 | 0.000 | 24.067 | .000 | 124.864 | 6,332.504 | 4,913.658 | |
| 12-2030 | 124.800 | 1 | 0.7 | 0.000 | 0.000 | 22.142 | .000 | 104.904 | 6,437.408 | 4,945.577 | |
| 12-2031 | 124.800 | 1 | 0.7 | 0.000 | 0.000 | 20.372 | .000 | 86.540 | 6,523.947 | 4,969.518 | |
| 12-2032 | 124.800 | 1 | 0.7 | 0.000 | 0.000 | 18.793 | .000 | 70.154 | 6,594.102 | 4,987.167 | |
| 12-2033 | 124.800 | 1 | 0.7 | 0.000 | 0.000 | 17.241 | .000 | 54.058 | 6,648.160 | 4,999.530 | |
| 12-2034 | 124.800 | 1 | 0.7 | 0.000 | 0.000 | 15.863 | .000 | 39.758 | 6,687.918 | 5,007.799 | |
| 12-2035 | 124.800 | 1 | 0.7 | 0.000 | 0.000 | 14.595 | .000 | 26.602 | 6,714.520 | 5,012.833 | |
| 12-2036 | 124.800 | 1 | 0.7 | 0.000 | 0.000 | 13.463 | .000 | 14.864 | 6,729.384 | 5,015.397 | |
| S Tot | 2,371.200 | | | 0.000 | 0.000 | 877.257 | .000 | 6,729.384 | 6,729.384 | 5,015.397 | |
| After | 102.048 | | | 0.000 | 0.000 | 10.292 | .000 | 4.724 | 6,734.108 | 5,016.147 | |
| Total | 2,473.248 | | | 0.000 | 0.000 | 887.550 | .000 | 6,734.108 | 6,734.108 | 5,016.147 | |
| Evaluation Parameters (Gross) | | Expenses (Gross) | | Percent Interests | | Percent | Cum. Disc. | |
| | Initial | Final | Units | | Dei | n | Def | | Initial | Final | Units | | | Initial | Final | | 5.00 | 5,710.824 | |
| Oil Rate | 15,144. | 470. | bbls/mo | | 85.6% | 1.20 | 0.0% | | 16,000. | 15,769. | $/w/mo | | Expense | 65.0000 | 65.0000 | | 8.00 | 5,265.044 | |
| Gas Rate | 28,774. | 892. | Mcf/mo | | 0.0% | 0.00 | 0.0% | | | | | | Revenue | | | | 10.00 | 5,016.147 | |
| GOR | 1,900. | 1,900. | scf/bbl | | | | | | | | | | Oil | 52.8125 | 52.8125 | | 12.00 | 4,797.759 | |
| NGL Rate | 1,883. | 61. | bbls/mo | | | | | | | | | | Gas | 52.8125 | 52.8125 | | 15.00 | 4,516.181 | |
| NGL Yield | 65.5 | 68.7 | bbl/MMcf | | | | | | | | | | | | | | 20.00 | 4,139.095 | |
| Gas Shrinkage | 36.7 | 31.5 | % | | | | | | | | | | | | | | | | |
| Oil Severance | 7.1 | 7.1 | % | | | | | | | | | | | | | | | | |
| Gas Severance | 7.9 | 7.9 | % | | | | | | | | | | | | | | | | |
| NGL Severance | 7.9 | 7.9 | % | | | | | | | | | | | | | | | | |
| Ad Valorem | 64.6 | | % | | | | | | | | | | | | | | | | |
12 Months in first year 19.828 Year Life (10/2037)
| THESE DATA ARE PART OF A CG&A REPORT AND ARE SUBJECT TO THE CONDITIONS IN THE TEXT OF THE REPORT. | ASN 317 | DEFAULT 1/10/2018 10:34:19 |
| TEXAS REGISTERED ENGINEERING FIRM F-693. | | OIL PDP |
| | | Table 8 |
Cawley, Gillespie & Associates, Inc.
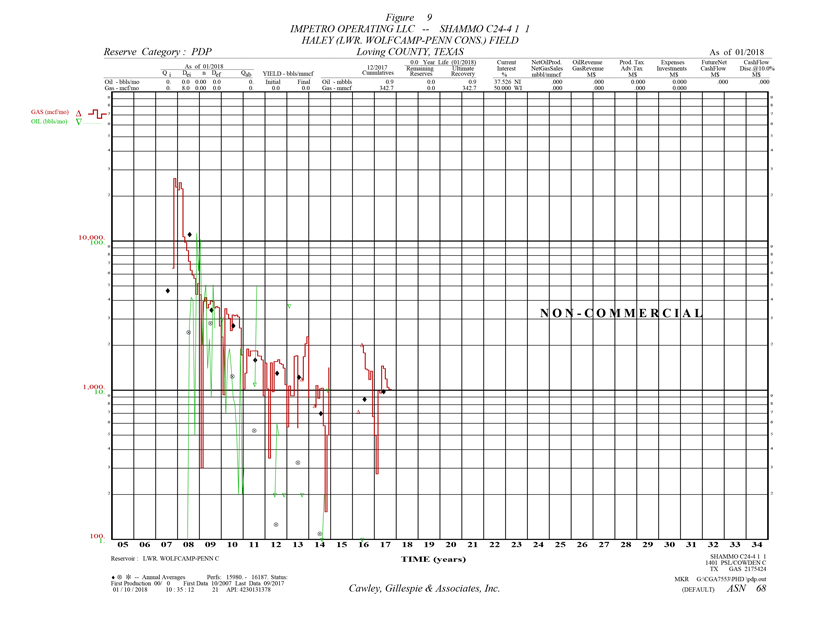
Table 9
Reserve Estimates and Economic Forecasts as of December 31, 2017
Lilis Energy, Inc. Interests
Proved Developed Producing Reserves
IMPETRO OPERATING LLC -- SHAMMO C24-4 1 1
HALEY \(LWR. WOLFCAMP-PENN CONS.\) FIELD -- Loving COUNTY, TEXAS
| (1) | (2) | (3) | (4) | (5) | (6) | (7) | (8) | (9) | (10) |
| | Gross Oil | Gross Gas | Gross NGL | Net Oil | Net Gas | Net NGL | Avg Oil | Avg Gas | Avg NGL |
| End | Production | Production | Production | Production | Sales | Production | Price | Price | Price |
| Mo-Year | MBBLS | MMCF | MBBLS | MBBLS | MMCF | MBBLS | $/BBL | $/MCF | $/BBL |
| | | | | | | | | | | |
| | | | | | | | | | | |
| | | | | | | | | | | |
| | | | | | | | | | | |
| | | | | | | | | | | |
| | | | | | | | | | | |
| | | | | | | | | | | |
| | | | | | | | | | | |
| | | | | | | | | | | |
| | | | | | | | | | | |
| | | | | | | | | | | |
| | | | | | | | | | | |
| | | | | | | | | | | |
| | | | | | | | | | | |
| | | | | | | | | | | |
| | | | | | | | | | | |
| | | | | | | | | | | |
| | | | | | | | | | | |
| | | | | Non-Commercial | | | | | |
| | | | | | | | | | | |
| | | | | | | | | | |
| | | | | | | | | | | |
| Cum | .9 | 342.7 | .0 | | | | | | | |
| Ult | .9 | 342.7 | .0 | | | | | | | |
| (11) | (12) | (13) | (14) | (15) | (16) | (17) | (18) | (19) | (20) |
| | Oil | Gas | NGL | Hedge | Other | Total | Production | Ad Valorem | |
| End | Revenue | Revenue | Revenue | Revenue | Revenue | Revenue | Taxes | Taxes | $/BOE6 |
| Mo-Year | M$ | M$ | M$ | M$ | M$ | M$ | M$ | M$ | |
| | | | | | | | | | | |
| | | | | | | | | | | |
| | | | | | | | | | | |
| | | | | | | | | | | |
| | | | | | | | | | | |
| | | | | | | | | | | |
| | | | | | | | | | | |
| | | | | | | | | | | |
| | | | | | | | | | | |
| | | | | | | | | | | |
| | | | | | | | | | | |
| | | | | | | | | | | |
| | | | | | | | | | | |
| | | | | | | | | | | |
| | | | | | | | | | | |
| | | | | | | | | | | |
| | | | | | | | | | | |
| | | | | | | | | | | |
| | | | | | | | | | | |
| | | | | | | | | | | |
| | | | | | | | | | | |
| | | | | | | | | | | |
| (21) | (22) | (23) | (24) | (25) | (26) | (27) | (28) | (29) | (30) | (31) |
| | Operating | Wells | Workover | 3rd Party | Other | | Future Net | Cumulative | Cum.Cash Flow |
| End | Expense | Gross | Net | Expense | COPAS | Deductions | Investment | Cash Flow | Cash Flow | Disc.@ 10. % |
| Mo-Year | M$ | Count | M$ | M$ | M$ | M$ | M$ | M$ | M$ |
| | | | | | | | | | | | |
| | | | | | | | | | | | |
| | | | | | | | | | | | |
| | | | | | | | | | | | |
| | | | | | | | | | | | |
| | | | | | | | | | | | |
| | | | | | | | | | | | |
| | | | | | | | | | | | |
| | | | | | | | | | | | |
| | | | | | | | | | | | |
| | | | | | | | | | | | |
| | | | | | | | | | | | |
| | | | | | | | | | | | |
| | | | | | | | | | | | |
| | | | | | | | | | | | |
| | | | | | | | | | | | |
| | | | | | | | | | | | |
| | | | | | | | | | | | |
| | | | | | | | | | | | |
| | | | | | | | | | | | |
| | | | | | | | | | | | |
| | | | | | | | | | | | |
| Evaluation Parameters (Gross) | | Expenses (Gross) | | Percent Interests | | Percent | Cum. Disc. | |
| | Initial | Final | Units | | Dei | n | Def | | Initial | Final | Units | | | Initial | Final | | 5.00 | .000 | |
| Gas Rate | 947. | 947. | Mcf/mo | | 8.0% | 0.00 | 0.0% | | 0. | 0. | $/w/mo | | Expense | 65.0000 | 65.0000 | | 8.00 | .000 | |
| Oil Rate | 0. | 0. | bbls/mo | | 0.0% | 0.00 | 0.0% | | | | | | Revenue | | | | 10.00 | .000 | |
| NGL Rate | 0. | 0. | bbls/mo | | | | | | | | | | Oil | 52.8125 | 52.8125 | | 12.00 | .000 | |
| Cond Yield | 0.0 | 0.0 | bbl/MMcf | | | | | | | | | | Gas | 52.8125 | 52.8125 | | 15.00 | .000 | |
| NGL Yield | 0.0 | 0.0 | bbl/MMcf | | | | | | | | | | | | | | 20.00 | .000 | |
| Gas Shrinkage | 100.0 | 100.0 | % | | | | | | | | | | | | | | | | |
| Oil Severance | 0.0 | 0.0 | % | | | | | | | | | | | | | | | | |
| Gas Severance | 0.0 | 0.0 | % | | | | | | | | | | | | | | | | |
| NGL Severance | 0.0 | 0.0 | % | | | | | | | | | | | | | | | | |
| Ad Valorem | 0.0 | | % | | | | | | | | | | | | | | | | |
1 Months in first year .000 Year Life (01/2018)
| THESE DATA ARE PART OF A CG&A REPORT AND ARE SUBJECT TO THE CONDITIONS IN THE TEXT OF THE REPORT. | ASN 68 | DEFAULT 1/10/2018 10:34:19 |
| TEXAS REGISTERED ENGINEERING FIRM F-693. | | GAS PDP |
| | | Table 9 |
Cawley, Gillespie & Associates, Inc.

Table 10
Reserve Estimates and Economic Forecasts as of December 31, 2017
Lilis Energy, Inc. Interests
Proved Developed Producing Reserves
LILIS ENERGY, INC. -- TIGER 1H
PHANTOM (WOLFCAMP B) FIELD -- WINKLER COUNTY, TEXAS
| (1) | (2) | (3) | (4) | (5) | (6) | (7) | (8) | (9) | (10) |
| | Gross Oil | Gross Gas | Gross NGL | Net Oil | Net Gas | Net NGL | Avg Oil | Avg Gas | Avg NGL |
| End | Production | Production | Production | Production | Sales | Production | Price | Price | Price |
| Mo-Year | MBBLS | MMCF | MBBLS | MBBLS | MMCF | MBBLS | $/BBL | $/MCF | $/BBL |
| 12-2018 | 103.6 | 393.7 | 27.2 | 73.659 | 190.336 | 19.313 | 47.746 | 2.619 | 8.728 | |
| 12-2019 | 46.7 | 177.5 | 12.2 | 33.211 | 85.818 | 8.708 | 47.746 | 2.619 | 8.728 | |
| 12-2020 | 31.9 | 121.2 | 8.4 | 22.671 | 58.582 | 5.944 | 47.746 | 2.619 | 8.728 | |
| 12-2021 | 24.5 | 93.2 | 6.4 | 17.428 | 45.035 | 4.570 | 47.746 | 2.619 | 8.728 | |
| 12-2022 | 20.1 | 76.5 | 5.3 | 14.309 | 36.975 | 3.752 | 47.746 | 2.619 | 8.728 | |
| 12-2023 | 17.2 | 65.2 | 4.5 | 12.204 | 31.535 | 3.200 | 47.746 | 2.619 | 8.728 | |
| 12-2024 | 15.1 | 57.2 | 3.9 | 10.707 | 27.666 | 2.807 | 47.746 | 2.619 | 8.728 | |
| 12-2025 | 13.4 | 50.9 | 3.5 | 9.517 | 24.591 | 2.495 | 47.746 | 2.619 | 8.728 | |
| 12-2026 | 12.1 | 46.0 | 3.2 | 8.603 | 22.230 | 2.256 | 47.746 | 2.619 | 8.728 | |
| 12-2027 | 11.1 | 42.0 | 2.9 | 7.862 | 20.316 | 2.061 | 47.746 | 2.619 | 8.728 | |
| 12-2028 | 10.2 | 38.7 | 2.7 | 7.249 | 18.731 | 1.901 | 47.746 | 2.619 | 8.728 | |
| 12-2029 | 9.4 | 35.5 | 2.5 | 6.650 | 17.184 | 1.744 | 47.746 | 2.619 | 8.728 | |
| 12-2030 | 8.6 | 32.7 | 2.3 | 6.118 | 15.810 | 1.604 | 47.746 | 2.619 | 8.728 | |
| 12-2031 | 7.9 | 30.1 | 2.1 | 5.629 | 14.546 | 1.476 | 47.746 | 2.619 | 8.728 | |
| 12-2032 | 7.3 | 27.8 | 1.9 | 5.193 | 13.418 | 1.362 | 47.746 | 2.619 | 8.728 | |
| 12-2033 | 6.7 | 25.5 | 1.8 | 4.764 | 12.310 | 1.249 | 47.746 | 2.619 | 8.728 | |
| 12-2034 | 6.2 | 23.4 | 1.6 | 4.383 | 11.326 | 1.149 | 47.746 | 2.619 | 8.728 | |
| 12-2035 | 5.7 | 21.6 | 1.5 | 4.033 | 10.421 | 1.057 | 47.746 | 2.619 | 8.728 | |
| 12-2036 | 5.2 | 19.9 | 1.4 | 3.720 | 9.613 | .975 | 47.746 | 2.619 | 8.728 | |
| S Tot | 362.8 | 1,378.5 | 95.1 | 257.911 | 666.442 | 67.624 | 47.746 | 2.619 | 8.728 | |
| After | 1.8 | 6.9 | .5 | 1.296 | 3.348 | .340 | 47.746 | 2.619 | 8.728 | |
| Total | 364.6 | 1,385.5 | 95.6 | 259.206 | 669.789 | 67.964 | 47.746 | 2.619 | 8.728 | |
| Cum | 15.7 | 59.7 | .0 | | | | | | | |
| Ult | 380.3 | 1,445.2 | 95.6 | | | | | | | |
| (11) | (12) | (13) | (14) | (15) | (16) | (17) | (18) | (19) | (20) |
| | Oil | Gas | NGL | Hedge | Other | Total | Production | Ad Valorem | |
| End | Revenue | Revenue | Revenue | Revenue | Revenue | Revenue | Taxes | Taxes | $/BOE6 |
| Mo-Year | M$ | M$ | M$ | M$ | M$ | M$ | M$ | M$ | |
| 12-2018 | 3,516.950 | 498.466 | 168.561 | 0.000 | 0.000 | 4,183.976 | 212.538 | 104.599 | 3.932 | |
| 12-2019 | 1,585.712 | 224.747 | 76.000 | 0.000 | 0.000 | 1,886.459 | 95.829 | 47.161 | 5.660 | |
| 12-2020 | 1,082.453 | 153.419 | 51.880 | 0.000 | 0.000 | 1,287.752 | 65.415 | 32.194 | 7.124 | |
| 12-2021 | 832.138 | 117.941 | 39.883 | 0.000 | 0.000 | 989.962 | 50.288 | 24.749 | 8.511 | |
| 12-2022 | 683.202 | 96.832 | 32.745 | 0.000 | 0.000 | 812.779 | 41.288 | 20.319 | 9.819 | |
| 12-2023 | 582.688 | 82.586 | 27.927 | 0.000 | 0.000 | 693.201 | 35.213 | 17.330 | 11.079 | |
| 12-2024 | 511.200 | 72.454 | 24.501 | 0.000 | 0.000 | 608.155 | 30.893 | 15.204 | 12.277 | |
| 12-2025 | 454.380 | 64.400 | 21.778 | 0.000 | 0.000 | 540.558 | 27.459 | 13.514 | 13.498 | |
| 12-2026 | 410.754 | 58.217 | 19.687 | 0.000 | 0.000 | 488.658 | 24.823 | 12.216 | 14.665 | |
| 12-2027 | 375.389 | 53.205 | 17.992 | 0.000 | 0.000 | 446.585 | 22.686 | 11.165 | 15.810 | |
| 12-2028 | 346.096 | 49.053 | 16.588 | 0.000 | 0.000 | 411.737 | 20.915 | 10.293 | 16.935 | |
| 12-2029 | 317.520 | 45.003 | 15.218 | 0.000 | 0.000 | 377.741 | 19.189 | 9.444 | 18.233 | |
| 12-2030 | 292.135 | 41.405 | 14.001 | 0.000 | 0.000 | 347.541 | 17.654 | 8.689 | 19.599 | |
| 12-2031 | 268.779 | 38.095 | 12.882 | 0.000 | 0.000 | 319.756 | 16.243 | 7.994 | 21.084 | |
| 12-2032 | 247.941 | 35.141 | 11.883 | 0.000 | 0.000 | 294.965 | 14.984 | 7.374 | 22.645 | |
| 12-2033 | 227.469 | 32.240 | 10.902 | 0.000 | 0.000 | 270.611 | 13.747 | 6.765 | 24.457 | |
| 12-2034 | 209.283 | 29.662 | 10.031 | 0.000 | 0.000 | 248.976 | 12.648 | 6.224 | 26.364 | |
| 12-2035 | 192.552 | 27.291 | 9.229 | 0.000 | 0.000 | 229.071 | 11.636 | 5.727 | 28.436 | |
| 12-2036 | 177.623 | 25.175 | 8.513 | 0.000 | 0.000 | 211.311 | 10.734 | 5.283 | 30.615 | |
| S Tot | 12,314.264 | 1,745.331 | 590.199 | 0.000 | 0.000 | 14,649.794 | 744.183 | 366.245 | 10.214 | |
| After | 61.860 | 8.768 | 2.965 | 0.000 | 0.000 | 73.592 | 3.738 | 1.840 | 32.029 | |
| Total | 12,376.124 | 1,754.098 | 593.164 | 0.000 | 0.000 | 14,723.386 | 747.921 | 368.085 | 10.323 | |
| (21) | (22) | (23) | (24) | (25) | (26) | (27) | (28) | (29) | (30) | (31) |
| | Operating | Wells | Workover | 3rd Party | Other | | Future Net | Cumulative | Cum.Cash Flow |
| End | Expense | Gross | Net | Expense | COPAS | Deductions | Investment | Cash Flow | Cash Flow | Disc.@ 10. % |
| Mo-Year | M$ | Count | M$ | M$ | M$ | M$ | M$ | M$ | M$ |
| 12-2018 | 167.390 | 1 | 0.9 | 0.000 | 0.000 | 296.277 | .000 | 3,403.172 | 3,403.172 | 3,278.697 | |
| 12-2019 | 167.390 | 1 | 0.9 | 0.000 | 0.000 | 133.584 | .000 | 1,442.494 | 4,845.665 | 4,534.766 | |
| 12-2020 | 167.390 | 1 | 0.9 | 0.000 | 0.000 | 91.189 | .000 | 931.564 | 5,777.229 | 5,271.123 | |
| 12-2021 | 167.390 | 1 | 0.9 | 0.000 | 0.000 | 70.101 | .000 | 677.433 | 6,454.663 | 5,757.563 | |
| 12-2022 | 167.390 | 1 | 0.9 | 0.000 | 0.000 | 57.555 | .000 | 526.227 | 6,980.889 | 6,100.970 | |
| 12-2023 | 167.390 | 1 | 0.9 | 0.000 | 0.000 | 49.087 | .000 | 424.180 | 7,405.069 | 6,352.573 | |
| 12-2024 | 167.390 | 1 | 0.9 | 0.000 | 0.000 | 43.065 | .000 | 351.602 | 7,756.672 | 6,542.130 | |
| 12-2025 | 167.390 | 1 | 0.9 | 0.000 | 0.000 | 38.278 | .000 | 293.917 | 8,050.588 | 6,686.149 | |
| 12-2026 | 167.390 | 1 | 0.9 | 0.000 | 0.000 | 34.603 | .000 | 249.626 | 8,300.214 | 6,797.341 | |
| 12-2027 | 167.390 | 1 | 0.9 | 0.000 | 0.000 | 31.624 | .000 | 213.721 | 8,513.935 | 6,883.885 | |
| 12-2028 | 167.390 | 1 | 0.9 | 0.000 | 0.000 | 29.156 | .000 | 183.981 | 8,697.916 | 6,951.618 | |
| 12-2029 | 167.390 | 1 | 0.9 | 0.000 | 0.000 | 26.749 | .000 | 154.970 | 8,852.886 | 7,003.479 | |
| 12-2030 | 167.390 | 1 | 0.9 | 0.000 | 0.000 | 24.610 | .000 | 129.198 | 8,982.083 | 7,042.791 | |
| 12-2031 | 167.390 | 1 | 0.9 | 0.000 | 0.000 | 22.643 | .000 | 105.486 | 9,087.569 | 7,071.976 | |
| 12-2032 | 167.390 | 1 | 0.9 | 0.000 | 0.000 | 20.887 | .000 | 84.330 | 9,171.899 | 7,093.193 | |
| 12-2033 | 167.390 | 1 | 0.9 | 0.000 | 0.000 | 19.163 | .000 | 63.546 | 9,235.445 | 7,107.728 | |
| 12-2034 | 167.390 | 1 | 0.9 | 0.000 | 0.000 | 17.631 | .000 | 45.083 | 9,280.529 | 7,117.107 | |
| 12-2035 | 167.390 | 1 | 0.9 | 0.000 | 0.000 | 16.221 | .000 | 28.096 | 9,308.625 | 7,122.427 | |
| 12-2036 | 167.390 | 1 | 0.9 | 0.000 | 0.000 | 14.963 | .000 | 12.940 | 9,321.565 | 7,124.664 | |
| S Tot | 3,180.416 | | | 0.000 | 0.000 | 1,037.385 | .000 | 9,321.565 | 9,321.565 | 7,124.664 | |
| After | 61.229 | | | 0.000 | 0.000 | 5.211 | .000 | 1.574 | 9,323.139 | 7,124.918 | |
| Total | 3,241.645 | | | 0.000 | 0.000 | 1,042.596 | .000 | 9,323.139 | 9,323.139 | 7,124.918 | |
| Evaluation Parameters (Gross) | | Expenses (Gross) | | Percent Interests | | Percent | Cum. Disc. | |
| | Initial | Final | Units | | Dei | n | Def | | Initial | Final | Units | | | Initial | Final | | 5.00 | 8,020.337 | |
| Oil Rate | 17,723. | 404. | bbls/mo | | 95.0% | 1.20 | 0.0% | | 15,999. | 15,769. | $/w/mo | | Expense | 87.1825 | 87.1825 | | 8.00 | 7,446.892 | |
| Gas Rate | 67,350. | 1,537. | Mcf/mo | | 0.0% | 0.00 | 0.0% | | | | | | Revenue | | | | 10.00 | 7,124.918 | |
| GOR | 3,800. | 3,800. | scf/bbl | | | | | | | | | | Oil | 71.0940 | 71.0940 | | 12.00 | 6,841.262 | |
| NGL Rate | 4,259. | 105. | bbls/mo | | | | | | | | | | Gas | 71.0940 | 71.0940 | | 15.00 | 6,473.833 | |
| NGL Yield | 63.2 | 68.5 | bbl/MMcf | | | | | | | | | | | | | | 20.00 | 5,978.527 | |
| Gas Shrinkage | 38.8 | 31.7 | % | | | | | | | | | | | | | | | | |
| Oil Severance | 4.6 | 4.6 | % | | | | | | | | | | | | | | | | |
| Gas Severance | 7.5 | 7.5 | % | | | | | | | | | | | | | | | | |
| NGL Severance | 7.5 | 7.5 | % | | | | | | | | | | | | | | | | |
| Ad Valorem | 40.5 | | % | | | | | | | | | | | | | | | | |
12 Months in first year 19.370 Year Life (05/2037)
| THESE DATA ARE PART OF A CG&A REPORT AND ARE SUBJECT TO THE CONDITIONS IN THE TEXT OF THE REPORT. | ASN 322 | DEFAULT 1/10/2018 10:34:19 |
| TEXAS REGISTERED ENGINEERING FIRM F-693. | | OIL PDP |
| | | Table 10 |
Cawley, Gillespie & Associates, Inc.
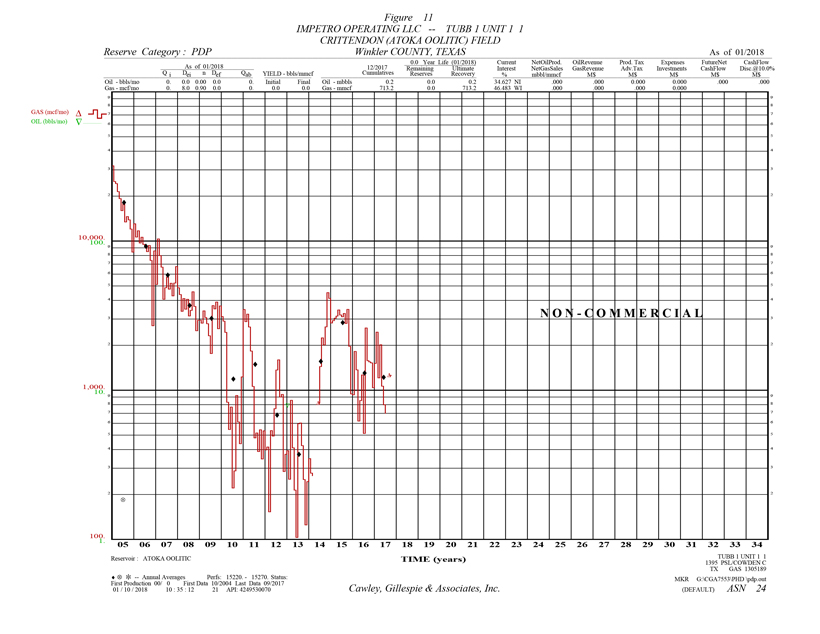
Table 11
Reserve Estimates and Economic Forecasts as of December 31, 2017
Lilis Energy, Inc. Interests
Proved Developed Producing Reserves
IMPETRO OPERATING LLC -- TUBB 1 UNIT 1 1
CRITTENDON \(ATOKA OOLITIC\) FIELD -- Winkler COUNTY, TEXAS
| (1) | (2) | (3) | (4) | (5) | (6) | (7) | (8) | (9) | (10) |
| | Gross Oil | Gross Gas | Gross NGL | Net Oil | Net Gas | Net NGL | Avg Oil | Avg Gas | Avg NGL |
| End | Production | Production | Production | Production | Sales | Production | Price | Price | Price |
| Mo-Year | MBBLS | MMCF | MBBLS | MBBLS | MMCF | MBBLS | $/BBL | $/MCF | $/BBL |
| | | | | | | | | | | |
| | | | | | | | | | | |
| | | | | | | | | | | |
| | | | | | | | | | | |
| | | | | | | | | | | |
| | | | | | | | | | | |
| | | | | | | | | | | |
| | | | | | | | | | | |
| | | | | | | | | | | |
| | | | | | | | | | | |
| | | | | | | | | | | |
| | | | | | | | | | | |
| | | | | | | | | | | |
| | | | | | | | | | | |
| | | | | | | | | | | |
| | | | | | | | | | | |
| | | | | | | | | | | |
| | | | | | | | | | | |
| | | | | Non-Commercial | | | | | |
| | | | | | | | | | | |
| | | | | | | | | | |
| | | | | | | | | | | |
| Cum | .2 | 713.2 | .0 | | | | | | | |
| Ult | .2 | 713.2 | .0 | | | | | | | |
| (11) | (12) | (13) | (14) | (15) | (16) | (17) | (18) | (19) | (20) |
| | Oil | Gas | NGL | Hedge | Other | Total | Production | Ad Valorem | |
| End | Revenue | Revenue | Revenue | Revenue | Revenue | Revenue | Taxes | Taxes | $/BOE6 |
| Mo-Year | M$ | M$ | M$ | M$ | M$ | M$ | M$ | M$ | |
| | | | | | | | | | | |
| | | | | | | | | | | |
| | | | | | | | | | | |
| | | | | | | | | | | |
| | | | | | | | | | | |
| | | | | | | | | | | |
| | | | | | | | | | | |
| | | | | | | | | | | |
| | | | | | | | | | | |
| | | | | | | | | | | |
| | | | | | | | | | | |
| | | | | | | | | | | |
| | | | | | | | | | | |
| | | | | | | | | | | |
| | | | | | | | | | | |
| | | | | | | | | | | |
| | | | | | | | | | | |
| | | | | | | | | | | |
| | | | | | | | | | | |
| | | | | | | | | | | |
| | | | | | | | | | | |
| | | | | | | | | | | |
| (21) | (22) | (23) | (24) | (25) | (26) | (27) | (28) | (29) | (30) | (31) |
| | Operating | Wells | Workover | 3rd Party | Other | | Future Net | Cumulative | Cum.Cash Flow |
| End | Expense | Gross | Net | Expense | COPAS | Deductions | Investment | Cash Flow | Cash Flow | Disc.@ 10. % |
| Mo-Year | M$ | Count | M$ | M$ | M$ | M$ | M$ | M$ | M$ |
| | | | | | | | | | | | |
| | | | | | | | | | | | |
| | | | | | | | | | | | |
| | | | | | | | | | | | |
| | | | | | | | | | | | |
| | | | | | | | | | | | |
| | | | | | | | | | | | |
| | | | | | | | | | | | |
| | | | | | | | | | | | |
| | | | | | | | | | | | |
| | | | | | | | | | | | |
| | | | | | | | | | | | |
| | | | | | | | | | | | |
| | | | | | | | | | | | |
| | | | | | | | | | | | |
| | | | | | | | | | | | |
| | | | | | | | | | | | |
| | | | | | | | | | | | |
| | | | | | | | | | | | |
| | | | | | | | | | | | |
| | | | | | | | | | | | |
| | | | | | | | | | | | |
| Evaluation Parameters (Gross) | | Expenses (Gross) | | Percent Interests | | Percent | Cum. Disc. | |
| | Initial | Final | Units | | Dei | n | Def | | Initial | Final | Units | | | Initial | Final | | 5.00 | .000 | |
| Gas Rate | 1,395. | 1,395. | Mcf/mo | | 8.1% | 0.90 | 0.0% | | 0. | 0. | $/w/mo | | Expense | 87.1825 | 87.1825 | | 8.00 | .000 | |
| Oil Rate | 0. | 0. | bbls/mo | | 0.0% | 0.00 | 0.0% | | | | | | Revenue | | | | 10.00 | .000 | |
| NGL Rate | 0. | 0. | bbls/mo | | | | | | | | | | Oil | 71.0940 | 71.0940 | | 12.00 | .000 | |
| Cond Yield | 0.0 | 0.0 | bbl/MMcf | | | | | | | | | | Gas | 71.0940 | 71.0940 | | 15.00 | .000 | |
| NGL Yield | 0.0 | 0.0 | bbl/MMcf | | | | | | | | | | | | | | 20.00 | .000 | |
| Gas Shrinkage | 100.0 | 100.0 | % | | | | | | | | | | | | | | | | |
| Oil Severance | 0.0 | 0.0 | % | | | | | | | | | | | | | | | | |
| Gas Severance | 0.0 | 0.0 | % | | | | | | | | | | | | | | | | |
| NGL Severance | 0.0 | 0.0 | % | | | | | | | | | | | | | | | | |
| Ad Valorem | 0.0 | | % | | | | | | | | | | | | | | | | |
1 Months in first year .000 Year Life (01/2018)
| THESE DATA ARE PART OF A CG&A REPORT AND ARE SUBJECT TO THE CONDITIONS IN THE TEXT OF THE REPORT. | ASN 24 | DEFAULT 1/10/2018 10:34:19 |
| TEXAS REGISTERED ENGINEERING FIRM F-693. | | GAS PDP |
| | | Table 11 |
Cawley, Gillespie & Associates, Inc.
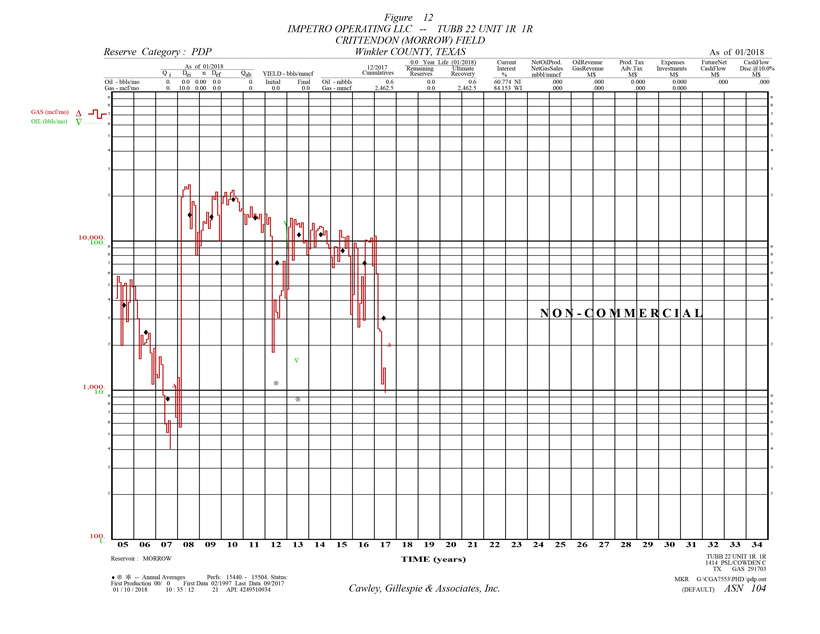
Table 12
Reserve Estimates and Economic Forecasts as of December 31, 2017
Lilis Energy, Inc. Interests
Proved Developed Producing Reserves
IMPETRO OPERATING LLC -- TUBB 22 UNIT 1R 1R
CRITTENDON \(MORROW\) FIELD -- Winkler COUNTY, TEXAS
| (1) | (2) | (3) | (4) | (5) | (6) | (7) | (8) | (9) | (10) |
| | Gross Oil | Gross Gas | Gross NGL | Net Oil | Net Gas | Net NGL | Avg Oil | Avg Gas | Avg NGL |
| End | Production | Production | Production | Production | Sales | Production | Price | Price | Price |
| Mo-Year | MBBLS | MMCF | MBBLS | MBBLS | MMCF | MBBLS | $/BBL | $/MCF | $/BBL |
| | | | | | | | | | | |
| | | | | | | | | | | |
| | | | | | | | | | | |
| | | | | | | | | | | |
| | | | | | | | | | | |
| | | | | | | | | | | |
| | | | | | | | | | | |
| | | | | | | | | | | |
| | | | | | | | | | | |
| | | | | | | | | | | |
| | | | | | | | | | | |
| | | | | | | | | | | |
| | | | | | | | | | | |
| | | | | | | | | | | |
| | | | | | | | | | | |
| | | | | | | | | | | |
| | | | | | | | | | | |
| | | | | | | | | | | |
| | | | | Non-Commercial | | | | | |
| | | | | | | | | | | |
| | | | | | | | | | |
| | | | | | | | | | | |
| Cum | .6 | 2,462.5 | .0 | | | | | | | |
| Ult | .6 | 2,462.5 | .0 | | | | | | | |
| (11) | (12) | (13) | (14) | (15) | (16) | (17) | (18) | (19) | (20) |
| | Oil | Gas | NGL | Hedge | Other | Total | Production | Ad Valorem | |
| End | Revenue | Revenue | Revenue | Revenue | Revenue | Revenue | Taxes | Taxes | $/BOE6 |
| Mo-Year | M$ | M$ | M$ | M$ | M$ | M$ | M$ | M$ | |
| | | | | | | | | | | |
| | | | | | | | | | | |
| | | | | | | | | | | |
| | | | | | | | | | | |
| | | | | | | | | | | |
| | | | | | | | | | | |
| | | | | | | | | | | |
| | | | | | | | | | | |
| | | | | | | | | | | |
| | | | | | | | | | | |
| | | | | | | | | | | |
| | | | | | | | | | | |
| | | | | | | | | | | |
| | | | | | | | | | | |
| | | | | | | | | | | |
| | | | | | | | | | | |
| | | | | | | | | | | |
| | | | | | | | | | | |
| | | | | | | | | | | |
| | | | | | | | | | | |
| | | | | | | | | | | |
| | | | | | | | | | | |
| (21) | (22) | (23) | (24) | (25) | (26) | (27) | (28) | (29) | (30) | (31) |
| | Operating | Wells | Workover | 3rd Party | Other | | Future Net | Cumulative | Cum.Cash Flow |
| End | Expense | Gross | Net | Expense | COPAS | Deductions | Investment | Cash Flow | Cash Flow | Disc.@ 10. % |
| Mo-Year | M$ | Count | M$ | M$ | M$ | M$ | M$ | M$ | M$ |
| | | | | | | | | | | | |
| | | | | | | | | | | | |
| | | | | | | | | | | | |
| | | | | | | | | | | | |
| | | | | | | | | | | | |
| | | | | | | | | | | | |
| | | | | | | | | | | | |
| | | | | | | | | | | | |
| | | | | | | | | | | | |
| | | | | | | | | | | | |
| | | | | | | | | | | | |
| | | | | | | | | | | | |
| | | | | | | | | | | | |
| | | | | | | | | | | | |
| | | | | | | | | | | | |
| | | | | | | | | | | | |
| | | | | | | | | | | | |
| | | | | | | | | | | | |
| | | | | | | | | | | | |
| | | | | | | | | | | | |
| | | | | | | | | | | | |
| | | | | | | | | | | | |
| Evaluation Parameters (Gross) | | Expenses (Gross) | | Percent Interests | | Percent | Cum. Disc. | |
| | Initial | Final | Units | | Dei | n | Def | | Initial | Final | Units | | | Initial | Final | | 5.00 | .000 | |
| Gas Rate | 1,530. | 1,530. | Mcf/mo | | 10.0% | 0.00 | 0.0% | | 0. | 0. | $/w/mo | | Expense | 87.1825 | 87.1825 | | 8.00 | .000 | |
| Oil Rate | 0. | 0. | bbls/mo | | 0.0% | 0.00 | 0.0% | | | | | | Revenue | | | | 10.00 | .000 | |
| NGL Rate | 0. | 0. | bbls/mo | | | | | | | | | | Oil | 71.0940 | 71.0940 | | 12.00 | .000 | |
| Cond Yield | 0.0 | 0.0 | bbl/MMcf | | | | | | | | | | Gas | 71.0940 | 71.0940 | | 15.00 | .000 | |
| NGL Yield | 0.0 | 0.0 | bbl/MMcf | | | | | | | | | | | | | | 20.00 | .000 | |
| Gas Shrinkage | 100.0 | 100.0 | % | | | | | | | | | | | | | | | | |
| Oil Severance | 0.0 | 0.0 | % | | | | | | | | | | | | | | | | |
| Gas Severance | 0.0 | 0.0 | % | | | | | | | | | | | | | | | | |
| NGL Severance | 0.0 | 0.0 | % | | | | | | | | | | | | | | | | |
| Ad Valorem | 0.0 | | % | | | | | | | | | | | | | | | | |
1 Months in first year .000 Year Life (01/2018)
| THESE DATA ARE PART OF A CG&A REPORT AND ARE SUBJECT TO THE CONDITIONS IN THE TEXT OF THE REPORT. | ASN 104 | DEFAULT 1/10/2018 10:34:19 |
| TEXAS REGISTERED ENGINEERING FIRM F-693. | | GAS PDP |
| | | Table 12 |
Cawley, Gillespie & Associates, Inc.
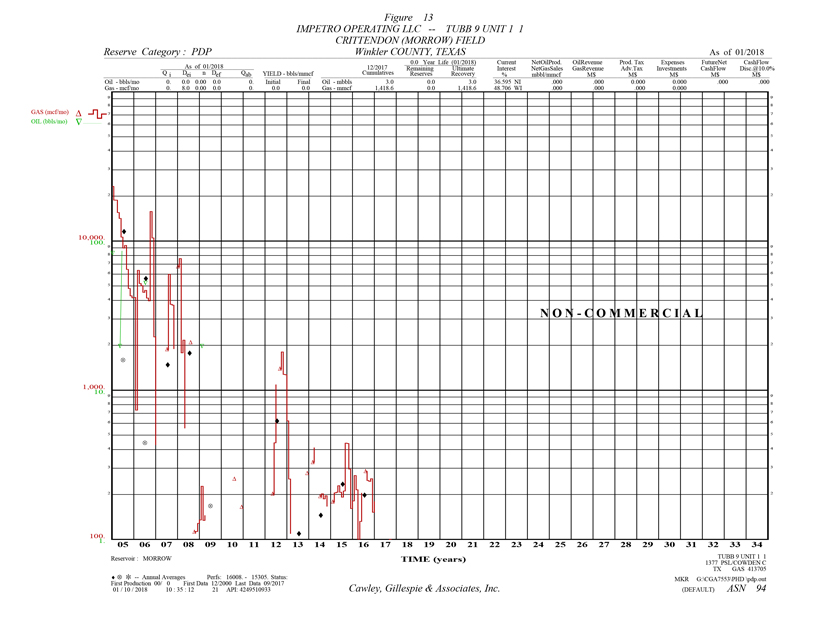
Table 13
Reserve Estimates and Economic Forecasts as of December 31, 2017
Lilis Energy, Inc. Interests
Proved Developed Producing Reserves
IMPETRO OPERATING LLC -- TUBB 9 UNIT 1 1
CRITTENDON \(MORROW\) FIELD -- Winkler COUNTY, TEXAS
| (1) | (2) | (3) | (4) | (5) | (6) | (7) | (8) | (9) | (10) |
| | Gross Oil | Gross Gas | Gross NGL | Net Oil | Net Gas | Net NGL | Avg Oil | Avg Gas | Avg NGL |
| End | Production | Production | Production | Production | Sales | Production | Price | Price | Price |
| Mo-Year | MBBLS | MMCF | MBBLS | MBBLS | MMCF | MBBLS | $/BBL | $/MCF | $/BBL |
| | | | | | | | | | | |
| | | | | | | | | | | |
| | | | | | | | | | | |
| | | | | | | | | | | |
| | | | | | | | | | | |
| | | | | | | | | | | |
| | | | | | | | | | | |
| | | | | | | | | | | |
| | | | | | | | | | | |
| | | | | | | | | | | |
| | | | | | | | | | | |
| | | | | | | | | | | |
| | | | | | | | | | | |
| | | | | | | | | | | |
| | | | | | | | | | | |
| | | | | | | | | | | |
| | | | | | | | | | | |
| | | | | | | | | | | |
| | | | | Non-Commercial | | | | | |
| | | | | | | | | | | |
| | | | | | | | | | |
| | | | | | | | | | | |
| Cum | 3.0 | 1,418.6 | .0 | | | | | | | |
| Ult | 3.0 | 1,418.6 | .0 | | | | | | | |
| (11) | (12) | (13) | (14) | (15) | (16) | (17) | (18) | (19) | (20) |
| | Oil | Gas | NGL | Hedge | Other | Total | Production | Ad Valorem | |
| End | Revenue | Revenue | Revenue | Revenue | Revenue | Revenue | Taxes | Taxes | $/BOE6 |
| Mo-Year | M$ | M$ | M$ | M$ | M$ | M$ | M$ | M$ | |
| | | | | | | | | | | |
| | | | | | | | | | | |
| | | | | | | | | | | |
| | | | | | | | | | | |
| | | | | | | | | | | |
| | | | | | | | | | | |
| | | | | | | | | | | |
| | | | | | | | | | | |
| | | | | | | | | | | |
| | | | | | | | | | | |
| | | | | | | | | | | |
| | | | | | | | | | | |
| | | | | | | | | | | |
| | | | | | | | | | | |
| | | | | | | | | | | |
| | | | | | | | | | | |
| | | | | | | | | | | |
| | | | | | | | | | | |
| | | | | | | | | | | |
| | | | | | | | | | | |
| | | | | | | | | | | |
| | | | | | | | | | | |
| (21) | (22) | (23) | (24) | (25) | (26) | (27) | (28) | (29) | (30) | (31) |
| | Operating | Wells | Workover | 3rd Party | Other | | Future Net | Cumulative | Cum.Cash Flow |
| End | Expense | Gross | Net | Expense | COPAS | Deductions | Investment | Cash Flow | Cash Flow | Disc.@ 10. % |
| Mo-Year | M$ | Count | M$ | M$ | M$ | M$ | M$ | M$ | M$ |
| | | | | | | | | | | | |
| | | | | | | | | | | | |
| | | | | | | | | | | | |
| | | | | | | | | | | | |
| | | | | | | | | | | | |
| | | | | | | | | | | | |
| | | | | | | | | | | | |
| | | | | | | | | | | | |
| | | | | | | | | | | | |
| | | | | | | | | | | | |
| | | | | | | | | | | | |
| | | | | | | | | | | | |
| | | | | | | | | | | | |
| | | | | | | | | | | | |
| | | | | | | | | | | | |
| | | | | | | | | | | | |
| | | | | | | | | | | | |
| | | | | | | | | | | | |
| | | | | | | | | | | | |
| | | | | | | | | | | | |
| | | | | | | | | | | | |
| | | | | | | | | | | | |
| Evaluation Parameters (Gross) | | Expenses (Gross) | | Percent Interests | | Percent | Cum. Disc. | |
| | Initial | Final | Units | | Dei | n | Def | | Initial | Final | Units | | | Initial | Final | | 5.00 | .000 | |
| Gas Rate | 24. | 24. | Mcf/mo | | 8.0% | 0.00 | 0.0% | | 0. | 0. | $/w/mo | | Expense | 87.1825 | 87.1825 | | 8.00 | .000 | |
| Oil Rate | 0. | 0. | bbls/mo | | 0.0% | 0.00 | 0.0% | | | | | | Revenue | | | | 10.00 | .000 | |
| NGL Rate | 0. | 0. | bbls/mo | | | | | | | | | | Oil | 71.0940 | 71.0940 | | 12.00 | .000 | |
| cond Yield | 0.0 | 0.0 | bbl/MMcf | | | | | | | | | | Gas | 71.0940 | 71.0940 | | 15.00 | .000 | |
| NGL Yield | 0.0 | 0.0 | bbl/MMcf | | | | | | | | | | | | | | 20.00 | .000 | |
| Gas Shrinkage | 100.0 | 100.0 | % | | | | | | | | | | | | | | | | |
| Oil Severance | 0.0 | 0.0 | % | | | | | | | | | | | | | | | | |
| Gas Severance | 0.0 | 0.0 | % | | | | | | | | | | | | | | | | |
| NGL Severance | 0.0 | 0.0 | % | | | | | | | | | | | | | | | | |
| Ad Valorem | 0.0 | | % | | | | | | | | | | | | | | | | |
1 Months in first year .000 Year Life (01/2018)
| THESE DATA ARE PART OF A CG&A REPORT AND ARE SUBJECT TO THE CONDITIONS IN THE TEXT OF THE REPORT. | ASN 94 | DEFAULT 1/10/2018 10:34:19 |
| TEXAS REGISTERED ENGINEERING FIRM F-693. | | GAS PDP |
| | | Table 13 |
Cawley, Gillespie & Associates, Inc.
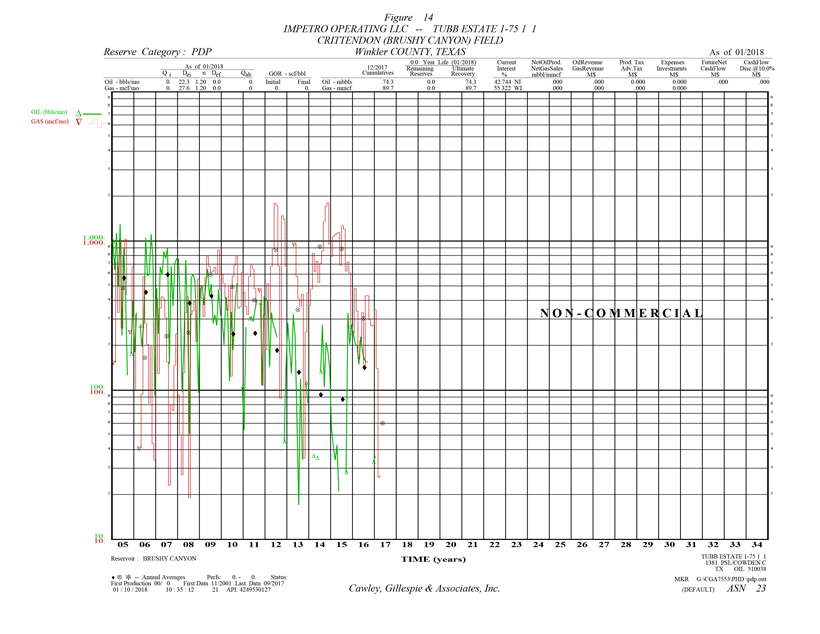
Table 14
Reserve Estimates and Economic Forecasts as of December 31, 2017
Lilis Energy, Inc. Interests
Proved Developed Producing Reserves
IMPETRO OPERATING LLC -- TUBB ESTATE 1-75 1 1
CRITTENDON \(BRUSHY CANYON\) FIELD -- Winkler COUNTY, TEXAS
| (1) | (2) | (3) | (4) | (5) | (6) | (7) | (8) | (9) | (10) |
| | Gross Oil | Gross Gas | Gross NGL | Net Oil | Net Gas | Net NGL | Avg Oil | Avg Gas | Avg NGL |
| End | Production | Production | Production | Production | Sales | Production | Price | Price | Price |
| Mo-Year | MBBLS | MMCF | MBBLS | MBBLS | MMCF | MBBLS | $/BBL | $/MCF | $/BBL |
| | | | | | | | | | | |
| | | | | | | | | | | |
| | | | | | | | | | | |
| | | | | | | | | | | |
| | | | | | | | | | | |
| | | | | | | | | | | |
| | | | | | | | | | | |
| | | | | | | | | | | |
| | | | | | | | | | | |
| | | | | | | | | | | |
| | | | | | | | | | | |
| | | | | | | | | | | |
| | | | | | | | | | | |
| | | | | | | | | | | |
| | | | | | | | | | | |
| | | | | | | | | | | |
| | | | | | | | | | | |
| | | | | | | | | | | |
| | | | | Non-Commercial | | | | | |
| | | | | | | | | | | |
| | | | | | | | | | |
| | | | | | | | | | | |
| Cum | 74.3 | 89.7 | .0 | | | | | | | |
| Ult | 74.3 | 89.7 | .0 | | | | | | | |
| (11) | (12) | (13) | (14) | (15) | (16) | (17) | (18) | (19) | (20) |
| | Oil | Gas | NGL | Hedge | Other | Total | Production | Ad Valorem | |
| End | Revenue | Revenue | Revenue | Revenue | Revenue | Revenue | Taxes | Taxes | $/BOE6 |
| Mo-Year | M$ | M$ | M$ | M$ | M$ | M$ | M$ | M$ | |
| | | | | | | | | | | |
| | | | | | | | | | | |
| | | | | | | | | | | |
| | | | | | | | | | | |
| | | | | | | | | | | |
| | | | | | | | | | | |
| | | | | | | | | | | |
| | | | | | | | | | | |
| | | | | | | | | | | |
| | | | | | | | | | | |
| | | | | | | | | | | |
| | | | | | | | | | | |
| | | | | | | | | | | |
| | | | | | | | | | | |
| | | | | | | | | | | |
| | | | | | | | | | | |
| | | | | | | | | | | |
| | | | | | | | | | | |
| | | | | | | | | | | |
| | | | | | | | | | | |
| | | | | | | | | | | |
| | | | | | | | | | | |
| (21) | (22) | (23) | (24) | (25) | (26) | (27) | (28) | (29) | (30) | (31) |
| | Operating | Wells | Workover | 3rd Party | Other | | Future Net | Cumulative | Cum.Cash Flow |
| End | Expense | Gross | Net | Expense | COPAS | Deductions | Investment | Cash Flow | Cash Flow | Disc.@ 10. % |
| Mo-Year | M$ | Count | M$ | M$ | M$ | M$ | M$ | M$ | M$ |
| | | | | | | | | | | | |
| | | | | | | | | | | | |
| | | | | | | | | | | | |
| | | | | | | | | | | | |
| | | | | | | | | | | | |
| | | | | | | | | | | | |
| | | | | | | | | | | | |
| | | | | | | | | | | | |
| | | | | | | | | | | | |
| | | | | | | | | | | | |
| | | | | | | | | | | | |
| | | | | | | | | | | | |
| | | | | | | | | | | | |
| | | | | | | | | | | | |
| | | | | | | | | | | | |
| | | | | | | | | | | | |
| | | | | | | | | | | | |
| | | | | | | | | | | | |
| | | | | | | | | | | | |
| | | | | | | | | | | | |
| | | | | | | | | | | | |
| | | | | | | | | | | | |
| Evaluation Parameters (Gross) | | Expenses (Gross) | | Percent Interests | | Percent | Cum. Disc. | |
| | Initial | Final | Units | | Dei | n | Def | | Initial | Final | Units | | | Initial | Final | | 5.00 | .000 | |
| Oil Rate | 4. | 4. | bbls/mo | | 22.4% | 1.20 | 0.0% | | 0. | 0. | $/w/mo | | Expense | 87.1825 | 87.1825 | | 8.00 | .000 | |
| Gas Rate | 94. | 94. | Mcf/mo | | 27.6% | 1.20 | 0.0% | | | | | | Revenue | | | | 10.00 | .000 | |
| GOR | 19,800. | 19,800. | scf/bbl | | | | | | | | | | Oil | 71.0940 | 71.0940 | | 12.00 | .000 | |
| NGL Rate | 0. | 0. | bbls/mo | | | | | | | | | | Gas | 71.0940 | 71.0940 | | 15.00 | .000 | |
| NGL Yield | 0.0 | 0.0 | bbl/MMcf | | | | | | | | | | | | | | 20.00 | .000 | |
| Gas Shrinkage | 100.0 | 100.0 | % | | | | | | | | | | | | | | | | |
| Oil Severance | 0.0 | 0.0 | % | | | | | | | | | | | | | | | | |
| Gas Severance | 0.0 | 0.0 | % | | | | | | | | | | | | | | | | |
| NGL Severance | 0.0 | 0.0 | % | | | | | | | | | | | | | | | | |
| Ad Valorem | 0.0 | | % | | | | | | | | | | | | | | | | |
1 Months in first year .000 Year Life (01/2018)
| THESE DATA ARE PART OF A CG&A REPORT AND ARE SUBJECT TO THE CONDITIONS IN THE TEXT OF THE REPORT. | ASN 23 | DEFAULT 1/10/2018 10:34:19 |
| TEXAS REGISTERED ENGINEERING FIRM F-693. | | OIL PDP |
| | | Table 14 |
Cawley, Gillespie & Associates, Inc.

Table 15
Reserve Estimates and Economic Forecasts as of December 31, 2017
Lilis Energy, Inc. Interests
Proved Developed Producing Reserves
IMPETRO OPERATING LLC -- TUBB ESTATE 21 2 2
CRITTENDON \(BRUSHY CANYON\) FIELD -- Winkler COUNTY, TEXAS
| (1) | (2) | (3) | (4) | (5) | (6) | (7) | (8) | (9) | (10) |
| | Gross Oil | Gross Gas | Gross NGL | Net Oil | Net Gas | Net NGL | Avg Oil | Avg Gas | Avg NGL |
| End | Production | Production | Production | Production | Sales | Production | Price | Price | Price |
| Mo-Year | MBBLS | MMCF | MBBLS | MBBLS | MMCF | MBBLS | $/BBL | $/MCF | $/BBL |
| | | | | | | | | | | |
| | | | | | | | | | | |
| | | | | | | | | | | |
| | | | | | | | | | | |
| | | | | | | | | | | |
| | | | | | | | | | | |
| | | | | | | | | | | |
| | | | | | | | | | | |
| | | | | | | | | | | |
| | | | | | | | | | | |
| | | | | | | | | | | |
| | | | | | | | | | | |
| | | | | | | | | | | |
| | | | | | | | | | | |
| | | | | | | | | | | |
| | | | | | | | | | | |
| | | | | | | | | | | |
| | | | | | | | | | | |
| | | | | Non-Commercial | | | | | |
| | | | | | | | | | | |
| | | | | | | | | | |
| | | | | | | | | | | |
| Cum | 28.5 | 19.5 | .0 | | | | | | | |
| Ult | 28.5 | 19.5 | .0 | | | | | | | |
| (11) | (12) | (13) | (14) | (15) | (16) | (17) | (18) | (19) | (20) |
| | Oil | Gas | NGL | Hedge | Other | Total | Production | Ad Valorem | |
| End | Revenue | Revenue | Revenue | Revenue | Revenue | Revenue | Taxes | Taxes | $/BOE6 |
| Mo-Year | M$ | M$ | M$ | M$ | M$ | M$ | M$ | M$ | |
| | | | | | | | | | | |
| | | | | | | | | | | |
| | | | | | | | | | | |
| | | | | | | | | | | |
| | | | | | | | | | | |
| | | | | | | | | | | |
| | | | | | | | | | | |
| | | | | | | | | | | |
| | | | | | | | | | | |
| | | | | | | | | | | |
| | | | | | | | | | | |
| | | | | | | | | | | |
| | | | | | | | | | | |
| | | | | | | | | | | |
| | | | | | | | | | | |
| | | | | | | | | | | |
| | | | | | | | | | | |
| | | | | | | | | | | |
| | | | | | | | | | | |
| | | | | | | | | | | |
| | | | | | | | | | | |
| | | | | | | | | | | |
| (21) | (22) | (23) | (24) | (25) | (26) | (27) | (28) | (29) | (30) | (31) |
| | Operating | Wells | Workover | 3rd Party | Other | | Future Net | Cumulative | Cum.Cash Flow |
| End | Expense | Gross | Net | Expense | COPAS | Deductions | Investment | Cash Flow | Cash Flow | Disc.@ 10. % |
| Mo-Year | M$ | Count | M$ | M$ | M$ | M$ | M$ | M$ | M$ |
| | | | | | | | | | | | |
| | | | | | | | | | | | |
| | | | | | | | | | | | |
| | | | | | | | | | | | |
| | | | | | | | | | | | |
| | | | | | | | | | | | |
| | | | | | | | | | | | |
| | | | | | | | | | | | |
| | | | | | | | | | | | |
| | | | | | | | | | | | |
| | | | | | | | | | | | |
| | | | | | | | | | | | |
| | | | | | | | | | | | |
| | | | | | | | | | | | |
| | | | | | | | | | | | |
| | | | | | | | | | | | |
| | | | | | | | | | | | |
| | | | | | | | | | | | |
| | | | | | | | | | | | |
| | | | | | | | | | | | |
| | | | | | | | | | | | |
| | | | | | | | | | | | |
| Evaluation Parameters (Gross) | | Expenses (Gross) | | Percent Interests | | Percent | Cum. Disc. | |
| | Initial | Final | Units | | Dei | n | Def | | Initial | Final | Units | | | Initial | Final | | 5.00 | .000 | |
| Oil Rate | 99. | 99. | bbls/mo | | 8.0% | 0.0 | 0.0% | | 0. | 0. | $/w/mo | | Expense | 87.1825 | 87.1825 | | 8.00 | .000 | |
| Gas Rate | 0. | 0. | Mcf/mo | | 0.0% | 0.0 | 0.0% | | | | | | Revenue | | | | 10.00 | .000 | |
| GOR | 0. | 0. | scf/bbl | | | | | | | | | | Oil | 71.0940 | 71.0940 | | 12.00 | .000 | |
| NGL Rate | 0. | 0. | bbls/mo | | | | | | | | | | Gas | 71.0940 | 71.0940 | | 15.00 | .000 | |
| NGL Yield | 0.0 | 0.0 | bbl/MMcf | | | | | | | | | | | | | | 20.00 | .000 | |
| Gas Shrinkage | 0.0 | 0.0 | % | | | | | | | | | | | | | | | | |
| Oil Severance | 0.0 | 0.0 | % | | | | | | | | | | | | | | | | |
| Gas Severance | 0.0 | 0.0 | % | | | | | | | | | | | | | | | | |
| NGL Severance | 0.0 | 0.0 | % | | | | | | | | | | | | | | | | |
| Ad Valorem | 0.0 | | % | | | | | | | | | | | | | | | | |
1 Months in first year .000 Year Life (01/2018)
| THESE DATA ARE PART OF A CG&A REPORT AND ARE SUBJECT TO THE CONDITIONS IN THE TEXT OF THE REPORT. | ASN 88 | DEFAULT 1/10/2018 10:34:19 |
| TEXAS REGISTERED ENGINEERING FIRM F-693. | | OIL PDP |
| | | Table 15 |
Cawley, Gillespie & Associates, Inc.
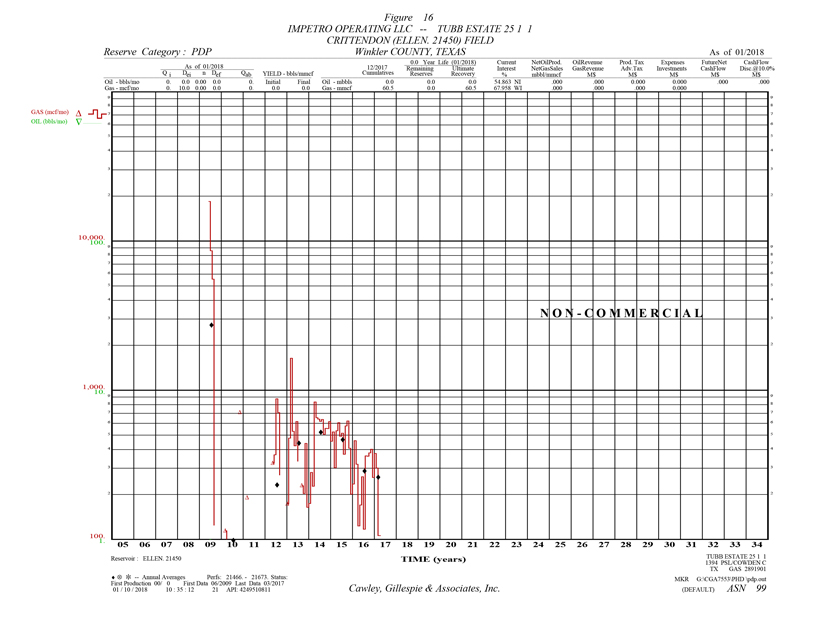
Table 16
Reserve Estimates and Economic Forecasts as of December 31, 2017
Lilis Energy, Inc. Interests
Proved Developed Producing Reserves
IMPETRO OPERATING LLC -- TUBB ESTATE 25 1 1
CRITTENDON \(ELLEN. 21450\) FIELD -- Winkler COUNTY, TEXAS
| (1) | (2) | (3) | (4) | (5) | (6) | (7) | (8) | (9) | (10) |
| | Gross Oil | Gross Gas | Gross NGL | Net Oil | Net Gas | Net NGL | Avg Oil | Avg Gas | Avg NGL |
| End | Production | Production | Production | Production | Sales | Production | Price | Price | Price |
| Mo-Year | MBBLS | MMCF | MBBLS | MBBLS | MMCF | MBBLS | $/BBL | $/MCF | $/BBL |
| | | | | | | | | | | |
| | | | | | | | | | | |
| | | | | | | | | | | |
| | | | | | | | | | | |
| | | | | | | | | | | |
| | | | | | | | | | | |
| | | | | | | | | | | |
| | | | | | | | | | | |
| | | | | | | | | | | |
| | | | | | | | | | | |
| | | | | | | | | | | |
| | | | | | | | | | | |
| | | | | | | | | | | |
| | | | | | | | | | | |
| | | | | | | | | | | |
| | | | | | | | | | | |
| | | | | | | | | | | |
| | | | | | | | | | | |
| | | | | | | | | | | |
| | | | | | | | | | | |
| | | | | Non-Commercial | | | | | |
| | | | | | | | | | | |
| Cum | .0 | 60.5 | .0 | | | | | | | |
| Ult | .0 | 60.5 | .0 | | | | | | | |
| (11) | (12) | (13) | (14) | (15) | (16) | (17) | (18) | (19) | (20) |
| | Oil | Gas | NGL | Hedge | Other | Total | Production | Ad Valorem | |
| End | Revenue | Revenue | Revenue | Revenue | Revenue | Revenue | Taxes | Taxes | $/BOE6 |
| Mo-Year | M$ | M$ | M$ | M$ | M$ | M$ | M$ | M$ | |
| | | | | | | | | | | |
| | | | | | | | | | | |
| | | | | | | | | | | |
| | | | | | | | | | | |
| | | | | | | | | | | |
| | | | | | | | | | | |
| | | | | | | | | | | |
| | | | | | | | | | | |
| | | | | | | | | | | |
| | | | | | | | | | | |
| | | | | | | | | | | |
| | | | | | | | | | | |
| | | | | | | | | | | |
| | | | | | | | | | | |
| | | | | | | | | | | |
| | | | | | | | | | | |
| | | | | | | | | | | |
| | | | | | | | | | | |
| | | | | | | | | | | |
| | | | | | | | | | | |
| | | | | | | | | | | |
| | | | | | | | | | | |
| (21) | (22) | (23) | (24) | (25) | (26) | (27) | (28) | (29) | (30) | (31) |
| | Operating | Wells | Workover | 3rd Party | Other | | Future Net | Cumulative | Cum.Cash Flow |
| End | Expense | Gross | Net | Expense | COPAS | Deductions | Investment | Cash Flow | Cash Flow | Disc.@ 10. % |
| Mo-Year | M$ | Count | M$ | M$ | M$ | M$ | M$ | M$ | M$ |
| | | | | | | | | | | | |
| | | | | | | | | | | | |
| | | | | | | | | | | | |
| | | | | | | | | | | | |
| | | | | | | | | | | | |
| | | | | | | | | | | | |
| | | | | | | | | | | | |
| | | | | | | | | | | | |
| | | | | | | | | | | | |
| | | | | | | | | | | | |
| | | | | | | | | | | | |
| | | | | | | | | | | | |
| | | | | | | | | | | | |
| | | | | | | | | | | | |
| | | | | | | | | | | | |
| | | | | | | | | | | | |
| | | | | | | | | | | | |
| | | | | | | | | | | | |
| | | | | | | | | | | | |
| | | | | | | | | | | | |
| | | | | | | | | | | | |
| | | | | | | | | | | | |
| Evaluation Parameters (Gross) | | Expenses (Gross) | | Percent Interests | | Percent | Cum. Disc. | |
| | Initial | Final | Units | | Dei | n | Def | | Initial | Final | Units | | | Initial | Final | | 5.00 | .000 | |
| Gas Rate | 308. | 308. | Mcf/mo | | 10.0% | 0.0 | 0.0% | | 0. | 0. | $/w/mo | | Expense | 87.1825 | 87.1825 | | 8.00 | .000 | |
| Oil Rate | 0. | 0. | bbls/mo | | 0.0% | 0.0 | 0.0% | | | | | | Revenue | | | | 10.00 | .000 | |
| NGL Rate | 0. | 0. | bbls/mo | | | | | | | | | | Oil | 71.0940 | 71.0940 | | 12.00 | .000 | |
| Cond Yield | 0.0 | 0.0 | bbl/MMcf | | | | | | | | | | Gas | 71.0940 | 71.0940 | | 15.00 | .000 | |
| NGL Yield | 0.0 | 0.0 | bbl/MMcf | | | | | | | | | | | | | | 20.00 | .000 | |
| Gas Shrinkage | 100.0 | 100.0 | % | | | | | | | | | | | | | | | | |
| Oil Severance | 0.0 | 0.0 | % | | | | | | | | | | | | | | | | |
| Gas Severance | 0.0 | 0.0 | % | | | | | | | | | | | | | | | | |
| NGL Severance | 0.0 | 0.0 | % | | | | | | | | | | | | | | | | |
| Ad Valorem | 0.0 | | % | | | | | | | | | | | | | | | | |
1 Months in first year .000 Year Life (01/2018)
| THESE DATA ARE PART OF A CG&A REPORT AND ARE SUBJECT TO THE CONDITIONS IN THE TEXT OF THE REPORT. | ASN 99 | DEFAULT 1/10/2018 10:34:19 |
| TEXAS REGISTERED ENGINEERING FIRM F-693. | | GAS PDP |
| | | Table 16 |
Cawley, Gillespie & Associates, Inc.
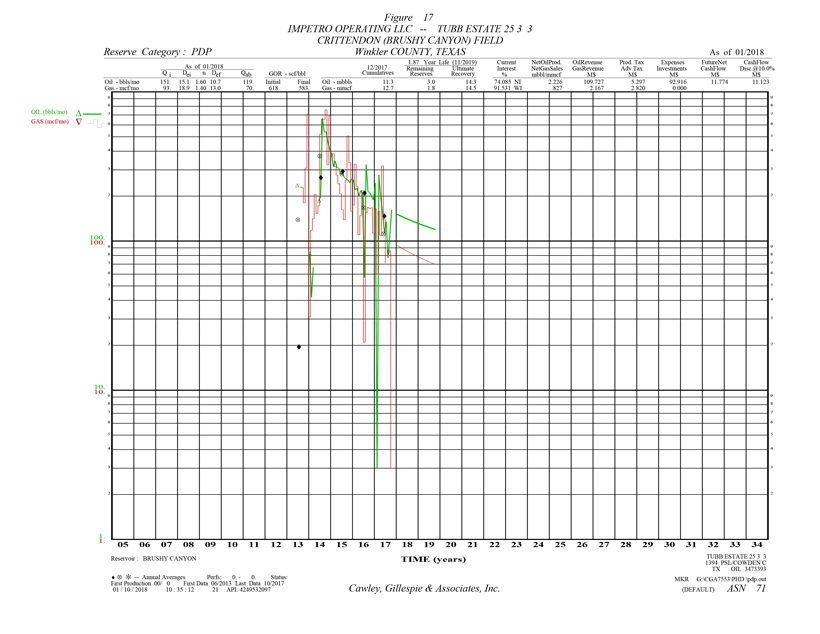
Table 17
Reserve Estimates and Economic Forecasts as of December 31, 2017
Lilis Energy, Inc. Interests
Proved Developed Producing Reserves
IMPETRO OPERATING LLC -- TUBB ESTATE 25 3 3
CRITTENDON \(BRUSHY CANYON\) FIELD -- Winkler COUNTY, TEXAS
| (1) | (2) | (3) | (4) | (5) | (6) | (7) | (8) | (9) | (10) |
| | Gross Oil | Gross Gas | Gross NGL | Net Oil | Net Gas | Net NGL | Avg Oil | Avg Gas | Avg NGL |
| End | Production | Production | Production | Production | Sales | Production | Price | Price | Price |
| Mo-Year | MBBLS | MMCF | MBBLS | MBBLS | MMCF | MBBLS | $/BBL | $/MCF | $/BBL |
| 12-2018 | 1.7 | 1.0 | .1 | 1.253 | .472 | .051 | 49.286 | 2.619 | 10.268 | |
| 11-2019 | 1.3 | .8 | .1 | .973 | .355 | .038 | 49.286 | 2.619 | 10.268 | |
| 12-2020 | | | | | | | | | | |
| 12-2021 | | | | | | | | | | |
| 12-2022 | | | | | | | | | | |
| 12-2023 | | | | | | | | | | |
| 12-2024 | | | | | | | | | | |
| 12-2025 | | | | | | | | | | |
| 12-2026 | | | | | | | | | | |
| 12-2027 | | | | | | | | | | |
| 12-2028 | | | | | | | | | | |
| 12-2029 | | | | | | | | | | |
| 12-2030 | | | | | | | | | | |
| 12-2031 | | | | | | | | | | |
| 12-2032 | | | | | | | | | | |
| 12-2033 | | | | | | | | | | |
| 12-2034 | | | | | | | | | | |
| 12-2035 | | | | | | | | | | |
| 12-2036 | | | | | | | | | | |
| S Tot | 3.0 | 1.8 | .1 | 2.226 | .827 | .089 | 49.286 | 2.619 | 10.268 | |
| After | .0 | .0 | .0 | .000 | .000 | .000 | .000 | .000 | .000 | |
| Total | 3.0 | 1.8 | .1 | 2.226 | .827 | .089 | 49.286 | 2.619 | 10.268 | |
| Cum | 11.3 | 12.7 | .0 | | | | | | | |
| Ult | 14.3 | 14.5 | .1 | | | | | | | |
| (11) | (12) | (13) | (14) | (15) | (16) | (17) | (18) | (19) | (20) |
| | Oil | Gas | NGL | Hedge | Other | Total | Production | Ad Valorem | |
| End | Revenue | Revenue | Revenue | Revenue | Revenue | Revenue | Taxes | Taxes | $/BOE6 |
| Mo-Year | M$ | M$ | M$ | M$ | M$ | M$ | M$ | M$ | |
| 12-2018 | 61.772 | 1.237 | .521 | 0.000 | 0.000 | 63.530 | 2.984 | 1.588 | 36.210 | |
| 11-2019 | 47.955 | .930 | .392 | 0.000 | 0.000 | 49.278 | 2.313 | 1.232 | 41.143 | |
| 12-2020 | | | | | | | | | | |
| 12-2021 | | | | | | | | | | |
| 12-2022 | | | | | | | | | | |
| 12-2023 | | | | | | | | | | |
| 12-2024 | | | | | | | | | | |
| 12-2025 | | | | | | | | | | |
| 12-2026 | | | | | | | | | | |
| 12-2027 | | | | | | | | | | |
| 12-2028 | | | | | | | | | | |
| 12-2029 | | | | | | | | | | |
| 12-2030 | | | | | | | | | | |
| 12-2031 | | | | | | | | | | |
| 12-2032 | | | | | | | | | | |
| 12-2033 | | | | | | | | | | |
| 12-2034 | | | | | | | | | | |
| 12-2035 | | | | | | | | | | |
| 12-2036 | | | | | | | | | | |
| S Tot | 109.727 | 2.167 | .914 | 0.000 | 0.000 | 112.807 | 5.297 | 2.820 | 38.363 | |
| After | .000 | .000 | .000 | 0.000 | 0.000 | .000 | .000 | .000 | .000 | |
| Total | 109.727 | 2.167 | .914 | 0.000 | 0.000 | 112.807 | 5.297 | 2.820 | 38.363 | |
| (21) | (22) | (23) | (24) | (25) | (26) | (27) | (28) | (29) | (30) | (31) |
| | Operating | Wells | Workover | 3rd Party | Other | | Future Net | Cumulative | Cum.Cash Flow |
| End | Expense | Gross | Net | Expense | COPAS | Deductions | Investment | Cash Flow | Cash Flow | Disc.@ 10. % |
| Mo-Year | M$ | Count | M$ | M$ | M$ | M$ | M$ | M$ | M$ |
| 12-2018 | 49.427 | 1 | 0.9 | 0.000 | 0.000 | 0.000 | .000 | 9.531 | 9.531 | 9.145 | |
| 11-2019 | 43.490 | 1 | 0.9 | 0.000 | 0.000 | 0.000 | .000 | 2.243 | 11.774 | 11.123 | |
| 12-2020 | | | | | | | | | | | |
| 12-2021 | | | | | | | | | | | |
| 12-2022 | | | | | | | | | | | |
| 12-2023 | | | | | | | | | | | |
| 12-2024 | | | | | | | | | | | |
| 12-2025 | | | | | | | | | | | |
| 12-2026 | | | | | | | | | | | |
| 12-2027 | | | | | | | | | | | |
| 12-2028 | | | | | | | | | | | |
| 12-2029 | | | | | | | | | | | |
| 12-2030 | | | | | | | | | | | |
| 12-2031 | | | | | | | | | | | |
| 12-2032 | | | | | | | | | | | |
| 12-2033 | | | | | | | | | | | |
| 12-2034 | | | | | | | | | | | |
| 12-2035 | | | | | | | | | | | |
| 12-2036 | | | | | | | | | | | |
| S Tot | 92.916 | | | 0.000 | 0.000 | 0.000 | .000 | 11.774 | 11.774 | 11.123 | |
| After | .000 | | | 0.000 | 0.000 | 0.000 | .000 | .000 | 11.774 | 11.123 | |
| Total | 92.916 | | | 0.000 | 0.000 | 0.000 | .000 | 11.774 | 11.774 | 11.123 | |
| Evaluation Parameters (Gross) | | Expenses (Gross) | | Percent Interests | | Percent | Cum. Disc. | |
| | Initial | Final | Units | | Dei | n | Def | | Initial | Final | Units | | | Initial | Final | | 5.00 | 11.433 | |
| Oil Rate | 152. | 118. | bbls/mo | | 15.2% | 1.60 | 0.0% | | 4,499. | 4,499. | $/w/mo | | Expense | 91.5312 | 91.5312 | | 8.00 | 11.244 | |
| Gas Rate | 94. | 68. | Mcf/mo | | 19.0% | 1.40 | 0.0% | | | | | | Revenue | | | | 10.00 | 11.123 | |
| GOR | 619. | 581. | scf/bbl | | | | | | | | | | Oil | 74.0852 | 74.0852 | | 12.00 | 11.006 | |
| NGL Rate | 6. | 4. | bbls/mo | | | | | | | | | | Gas | 74.0852 | 74.0852 | | 15.00 | 10.838 | |
| NGL Yield | 67.3 | 68.7 | bbl/MMcf | | | | | | | | | | | | | | 20.00 | 10.576 | |
| Gas Shrinkage | 39.8 | 39.2 | % | | | | | | | | | | | | | | | | |
| Oil Severance | 4.6 | 4.6 | % | | | | | | | | | | | | | | | | |
| Gas Severance | 7.5 | 7.5 | % | | | | | | | | | | | | | | | | |
| NGL Severance | 7.5 | 7.5 | % | | | | | | | | | | | | | | | | |
| Ad Valorem | 11.4 | | % | | | | | | | | | | | | | | | | |
12 Months in first year 1.878 Year Life (11/2019)
| THESE DATA ARE PART OF A CG&A REPORT AND ARE SUBJECT TO THE CONDITIONS IN THE TEXT OF THE REPORT. | ASN 71 | DEFAULT 1/10/2018 10:34:19 |
| TEXAS REGISTERED ENGINEERING FIRM F-693. | | OIL PDP |
| | | Table 17 |
Cawley, Gillespie & Associates, Inc.
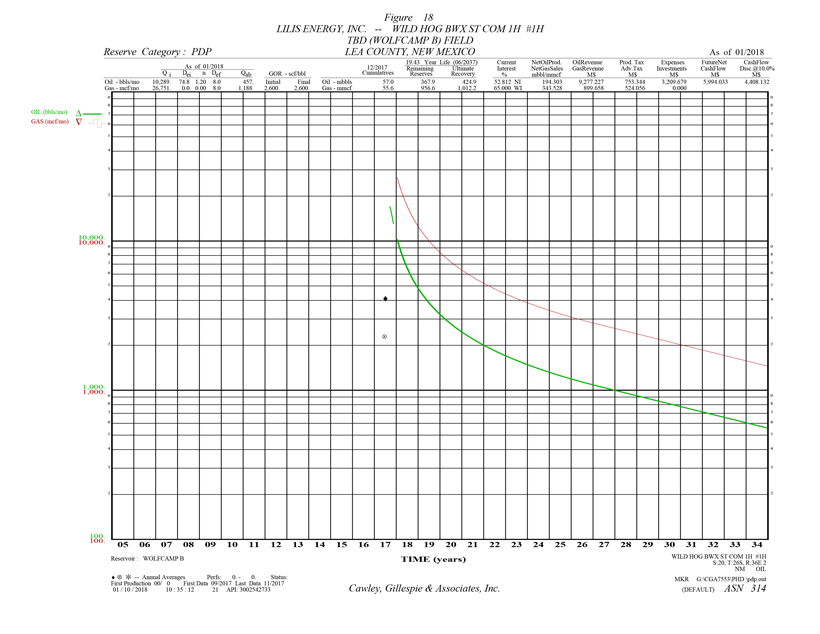
Table 18
Reserve Estimates and Economic Forecasts as of December 31, 2017
Lilis Energy, Inc. Interests
Proved Developed Producing Reserves
LILIS ENERGY, INC. -- WILD HOG BWX ST COM 1H #1H
TBD (WOLFCAMP B) FIELD -- LEA COUNTY, NEW MEXICO
| (1) | (2) | (3) | (4) | (5) | (6) | (7) | (8) | (9) | (10) |
| | Gross Oil | Gross Gas | Gross NGL | Net Oil | Net Gas | Net NGL | Avg Oil | Avg Gas | Avg NGL |
| End | Production | Production | Production | Production | Sales | Production | Price | Price | Price |
| Mo-Year | MBBLS | MMCF | MBBLS | MBBLS | MMCF | MBBLS | $/BBL | $/MCF | $/BBL |
| 12-2018 | 83.6 | 217.3 | 15.0 | 44.146 | 78.051 | 7.920 | 47.746 | 2.619 | 8.728 | |
| 12-2019 | 46.8 | 121.7 | 8.4 | 24.729 | 43.720 | 4.436 | 47.746 | 2.619 | 8.728 | |
| 12-2020 | 33.7 | 87.6 | 6.0 | 17.786 | 31.445 | 3.191 | 47.746 | 2.619 | 8.728 | |
| 12-2021 | 26.5 | 69.0 | 4.8 | 14.012 | 24.773 | 2.514 | 47.746 | 2.619 | 8.728 | |
| 12-2022 | 22.1 | 57.5 | 4.0 | 11.670 | 20.632 | 2.094 | 47.746 | 2.619 | 8.728 | |
| 12-2023 | 19.0 | 49.5 | 3.4 | 10.047 | 17.763 | 1.802 | 47.746 | 2.619 | 8.728 | |
| 12-2024 | 16.8 | 43.7 | 3.0 | 8.873 | 15.688 | 1.592 | 47.746 | 2.619 | 8.728 | |
| 12-2025 | 15.0 | 39.0 | 2.7 | 7.926 | 14.014 | 1.422 | 47.746 | 2.619 | 8.728 | |
| 12-2026 | 13.6 | 35.4 | 2.4 | 7.193 | 12.717 | 1.290 | 47.746 | 2.619 | 8.728 | |
| 12-2027 | 12.5 | 32.5 | 2.2 | 6.592 | 11.655 | 1.183 | 47.746 | 2.619 | 8.728 | |
| 12-2028 | 11.5 | 29.9 | 2.1 | 6.080 | 10.750 | 1.091 | 47.746 | 2.619 | 8.728 | |
| 12-2029 | 10.6 | 27.5 | 1.9 | 5.578 | 9.862 | 1.001 | 47.746 | 2.619 | 8.728 | |
| 12-2030 | 9.7 | 25.3 | 1.7 | 5.132 | 9.074 | .921 | 47.746 | 2.619 | 8.728 | |
| 12-2031 | 8.9 | 23.2 | 1.6 | 4.722 | 8.349 | .847 | 47.746 | 2.619 | 8.728 | |
| 12-2032 | 8.2 | 21.4 | 1.5 | 4.356 | 7.701 | .781 | 47.746 | 2.619 | 8.728 | |
| 12-2033 | 7.6 | 19.7 | 1.4 | 3.996 | 7.065 | .717 | 47.746 | 2.619 | 8.728 | |
| 12-2034 | 7.0 | 18.1 | 1.2 | 3.677 | 6.501 | .660 | 47.746 | 2.619 | 8.728 | |
| 12-2035 | 6.4 | 16.7 | 1.1 | 3.383 | 5.981 | .607 | 47.746 | 2.619 | 8.728 | |
| 12-2036 | 5.9 | 15.4 | 1.1 | 3.121 | 5.517 | .560 | 47.746 | 2.619 | 8.728 | |
| S Tot | 365.5 | 950.2 | 65.6 | 193.019 | 341.257 | 34.628 | 47.746 | 2.619 | 8.728 | |
| After | 2.4 | 6.3 | .4 | 1.284 | 2.271 | .230 | 47.746 | 2.619 | 8.728 | |
| Total | 367.9 | 956.6 | 66.0 | 194.303 | 343.528 | 34.858 | 47.746 | 2.619 | 8.728 | |
| Cum | 57.0 | 55.6 | .0 | | | | | | | |
| Ult | 424.9 | 1,012.2 | 66.0 | | | | | | | |
| (11) | (12) | (13) | (14) | (15) | (16) | (17) | (18) | (19) | (20) |
| | Oil | Gas | NGL | Hedge | Other | Total | Production | Ad Valorem | |
| End | Revenue | Revenue | Revenue | Revenue | Revenue | Revenue | Taxes | Taxes | $/BOE6 |
| Mo-Year | M$ | M$ | M$ | M$ | M$ | M$ | M$ | M$ | |
| 12-2018 | 2,107.820 | 204.406 | 69.122 | 0.000 | 0.000 | 2,381.347 | 171.162 | 119.067 | 4.864 | |
| 12-2019 | 1,180.694 | 114.498 | 38.718 | 0.000 | 0.000 | 1,333.910 | 95.877 | 66.695 | 6.437 | |
| 12-2020 | 849.205 | 82.352 | 27.848 | 0.000 | 0.000 | 959.404 | 68.958 | 47.970 | 7.832 | |
| 12-2021 | 669.014 | 64.878 | 21.939 | 0.000 | 0.000 | 755.831 | 54.326 | 37.792 | 9.172 | |
| 12-2022 | 557.180 | 54.032 | 18.272 | 0.000 | 0.000 | 629.484 | 45.245 | 31.474 | 10.438 | |
| 12-2023 | 479.695 | 46.518 | 15.731 | 0.000 | 0.000 | 541.944 | 38.953 | 27.097 | 11.662 | |
| 12-2024 | 423.658 | 41.084 | 13.893 | 0.000 | 0.000 | 478.635 | 34.403 | 23.932 | 12.827 | |
| 12-2025 | 378.446 | 36.700 | 12.410 | 0.000 | 0.000 | 427.557 | 30.731 | 21.378 | 14.017 | |
| 12-2026 | 343.430 | 33.304 | 11.262 | 0.000 | 0.000 | 387.996 | 27.888 | 19.400 | 15.155 | |
| 12-2027 | 314.742 | 30.522 | 10.321 | 0.000 | 0.000 | 355.585 | 25.558 | 17.779 | 16.275 | |
| 12-2028 | 290.314 | 28.153 | 9.520 | 0.000 | 0.000 | 327.988 | 23.575 | 16.399 | 17.404 | |
| 12-2029 | 266.344 | 25.829 | 8.734 | 0.000 | 0.000 | 300.907 | 21.628 | 15.045 | 18.713 | |
| 12-2030 | 245.050 | 23.764 | 8.036 | 0.000 | 0.000 | 276.850 | 19.899 | 13.842 | 20.091 | |
| 12-2031 | 225.459 | 21.864 | 7.393 | 0.000 | 0.000 | 254.716 | 18.308 | 12.736 | 21.588 | |
| 12-2032 | 207.979 | 20.169 | 6.820 | 0.000 | 0.000 | 234.968 | 16.889 | 11.748 | 23.162 | |
| 12-2033 | 190.807 | 18.503 | 6.257 | 0.000 | 0.000 | 215.567 | 15.494 | 10.778 | 24.989 | |
| 12-2034 | 175.552 | 17.024 | 5.757 | 0.000 | 0.000 | 198.333 | 14.255 | 9.917 | 26.912 | |
| 12-2035 | 161.517 | 15.663 | 5.297 | 0.000 | 0.000 | 182.477 | 13.116 | 9.124 | 29.001 | |
| 12-2036 | 148.995 | 14.449 | 4.886 | 0.000 | 0.000 | 168.329 | 12.099 | 8.416 | 31.199 | |
| S Tot | 9,215.903 | 893.711 | 302.216 | 0.000 | 0.000 | 10,411.829 | 748.364 | 520.591 | 11.565 | |
| After | 61.324 | 5.947 | 2.011 | 0.000 | 0.000 | 69.282 | 4.980 | 3.464 | 32.703 | |
| Total | 9,277.227 | 899.658 | 304.227 | 0.000 | 0.000 | 10,481.112 | 753.344 | 524.056 | 11.705 | |
| (21) | (22) | (23) | (24) | (25) | (26) | (27) | (28) | (29) | (30) | (31) |
| | Operating | Wells | Workover | 3rd Party | Other | | Future Net | Cumulative | Cum.Cash Flow |
| End | Expense | Gross | Net | Expense | COPAS | Deductions | Investment | Cash Flow | Cash Flow | Disc.@ 10. % |
| Mo-Year | M$ | Count | M$ | M$ | M$ | M$ | M$ | M$ | M$ |
| 12-2018 | 124.800 | 1 | 0.7 | 0.000 | 0.000 | 178.215 | .000 | 1,788.102 | 1,788.102 | 1,716.955 | |
| 12-2019 | 124.800 | 1 | 0.7 | 0.000 | 0.000 | 99.827 | .000 | 946.710 | 2,734.812 | 2,540.798 | |
| 12-2020 | 124.800 | 1 | 0.7 | 0.000 | 0.000 | 71.800 | .000 | 645.876 | 3,380.688 | 3,051.193 | |
| 12-2021 | 124.800 | 1 | 0.7 | 0.000 | 0.000 | 56.565 | .000 | 482.348 | 3,863.036 | 3,397.495 | |
| 12-2022 | 124.800 | 1 | 0.7 | 0.000 | 0.000 | 47.109 | .000 | 380.856 | 4,243.892 | 3,646.008 | |
| 12-2023 | 124.800 | 1 | 0.7 | 0.000 | 0.000 | 40.558 | .000 | 310.536 | 4,554.428 | 3,830.188 | |
| 12-2024 | 124.800 | 1 | 0.7 | 0.000 | 0.000 | 35.820 | .000 | 259.681 | 4,814.108 | 3,970.180 | |
| 12-2025 | 124.800 | 1 | 0.7 | 0.000 | 0.000 | 31.998 | .000 | 218.650 | 5,032.759 | 4,077.312 | |
| 12-2026 | 124.800 | 1 | 0.7 | 0.000 | 0.000 | 29.037 | .000 | 186.872 | 5,219.630 | 4,160.548 | |
| 12-2027 | 124.800 | 1 | 0.7 | 0.000 | 0.000 | 26.611 | .000 | 160.836 | 5,380.466 | 4,225.676 | |
| 12-2028 | 124.800 | 1 | 0.7 | 0.000 | 0.000 | 24.546 | .000 | 138.668 | 5,519.134 | 4,276.726 | |
| 12-2029 | 124.800 | 1 | 0.7 | 0.000 | 0.000 | 22.519 | .000 | 116.914 | 5,636.048 | 4,315.851 | |
| 12-2030 | 124.800 | 1 | 0.7 | 0.000 | 0.000 | 20.719 | .000 | 97.590 | 5,733.638 | 4,345.545 | |
| 12-2031 | 124.800 | 1 | 0.7 | 0.000 | 0.000 | 19.062 | .000 | 79.810 | 5,813.448 | 4,367.626 | |
| 12-2032 | 124.800 | 1 | 0.7 | 0.000 | 0.000 | 17.585 | .000 | 63.946 | 5,877.394 | 4,383.714 | |
| 12-2033 | 124.800 | 1 | 0.7 | 0.000 | 0.000 | 16.133 | .000 | 48.362 | 5,925.756 | 4,394.776 | |
| 12-2034 | 124.800 | 1 | 0.7 | 0.000 | 0.000 | 14.843 | .000 | 34.518 | 5,960.275 | 4,401.957 | |
| 12-2035 | 124.800 | 1 | 0.7 | 0.000 | 0.000 | 13.656 | .000 | 21.781 | 5,982.056 | 4,406.081 | |
| 12-2036 | 124.800 | 1 | 0.7 | 0.000 | 0.000 | 12.597 | .000 | 10.417 | 5,992.473 | 4,407.881 | |
| S Tot | 2,371.200 | | 0.000 | 0.000 | 779.201 | .000 | 5,992.473 | 5,992.473 | 4,407.881 | |
| After | 54.093 | | 0.000 | 0.000 | 5.185 | .000 | 1.561 | 5,994.033 | 4,408.132 | |
| Total | 2,425.293 | | 0.000 | 0.000 | 784.386 | .000 | 5,994.033 | 5,994.033 | 4,408.132 | |
| Evaluation Parameters (Gross) | | Expenses(Gross) | | Percent Interests | | Percent | Cum. Disc. | |
| | Initial | Final | Units | | Dei | n | Def | | Initial | Final | Units | | | Initial | Final | | 5.00 | 5,049.916 | |
| Oil Rate | 10,834. | 454. | bbls/mo | | 74.8% | 1.20 | 0.0% | | 16,000. | 16,000. | $/w/mo | | Expense | 65.0000 | 65.0000 | | 8.00 | 4,638.095 | |
| Gas Rate | 28,169. | 1,181. | Mcf/mo | | 0.0% | 0.00 | 0.0% | | | | | | Revenue | | | | 10.00 | 4,408.132 | |
| GOR | 2,600. | 2,600. | scf/bbl | | | | | | | | | | Oil | 52.8125 | 52.8125 | | 12.00 | 4,206.396 | |
| NGL Rate | 1,879. | 83. | bbls/mo | | | | | | | | | | Gas | 52.8125 | 52.8125 | | 15.00 | 3,946.421 | |
| NGL Yield | 66.7 | 70.7 | bbl/MMcf | | | | | | | | | | | | | | 20.00 | 3,598.704 | |
| Gas Shrinkage | 35.4 | 31.7 | % | | | | | | | | | | | | | | | | |
| Oil Severance | 7.1 | 7.1 | % | | | | | | | | | | | | | | | | |
| Gas Severance | 7.9 | 7.9 | % | | | | | | | | | | | | | | | | |
| NGL Severance | 7.9 | 7.9 | % | | | | | | | | | | | | | | | | |
| Ad Valorem | 66.3 | | % | | | | | | | | | | | | | | | | |
| | | | | | | | | 12 Months in first year 19.439 Year Life (06/2037) | |
| THESE DATA ARE PART OF A CG&A REPORT AND ARE SUBJECT TO THE CONDITIONS IN THE TEXT OF THE REPORT. | ASN 314 | DEFAULT | 1/10/2018 | 10:34:19 |
| TEXAS REGISTERED ENGINEERING FIRM F-693. | | | | OIL | PDP |
| | | | Table | 18 |
Cawley, Gillespie & Associates, Inc.

Table 19
Reserve Estimates and Economic Forecasts as of December 31, 2017
Lilis Energy, Inc. Interests
Proved Developed Producing Reserves
IMPETRO OPERATING LLC -- WOLFE UNIT #3H 3H
CRITTENDON \(BRUSHY CANYON\) FIELD -- Winkler COUNTY, TEXAS
(1) End Mo-Year | (2) Gross Oil Production MBBLS | (3) Gross Gas Production MMCF | (4) Gross NGL Production MBBLS | (5) Net Oil Production MBBLS | (6) Net Gas Sales MMCF | (7) Net NGL Production MBBLS | (8) Avg Oil Price $/BBL | (9) Avg Gas Price $/MCF | (10) Avg NGL Price $/BBL |
| 12-2018 | .1 | .0 | .0 | .046 | .000 | .000 | 47.746 | .000 | .000 | |
| 12-2019 | | | | | | | | | | |
| 12-2020 | | | | | | | | | | |
| 12-2021 | | | | | | | | | | |
| 12-2022 | | | | | | | | | | |
| 12-2023 | | | | | | | | | | |
| 12-2024 | | | | | | | | | | |
| 12-2025 | | | | | | | | | | |
| 12-2026 | | | | | | | | | | |
| 12-2027 | | | | | | | | | | |
| 12-2028 | | | | | | | | | | |
| 12-2029 | | | | | | | | | | |
| 12-2030 | | | | | | | | | | |
| 12-2031 | | | | | | | | | | |
| 12-2032 | | | | | | | | | | |
| 12-2033 | | | | | | | | | | |
| 12-2034 | | | | | | | | | | |
| 12-2035 | | | | | | | | | | |
| 12-2036 | | | | | | | | | | |
| S Tot | .1 | .0 | .0 | .046 | .000 | .000 | 47.746 | .000 | .000 | |
| After | .0 | .0 | .0 | .000 | .000 | .000 | .000 | .000 | .000 | |
| Total | .1 | .0 | .0 | .046 | .000 | .000 | 47.746 | .000 | .000 | |
| Cum | 32.9 | .0 | .0 | | | | | | | |
| Ult | 32.9 | .0 | .0 | | | | | | |
| (11) | (12) | (13) | (14) | (15) | (16) | (17) | (18) | (19) | (20) |
| | Oil | Gas | NGL | Hedge | Other | Total | Production | Ad Valorem | | |
| End | Revenue | Revenue | Revenue | Revenue | Revenue | Revenue | Taxes | Taxes | $/BOE6 |
| Mo-Year | M$ | M$ | M$ | M$ | M$ | M$ | M$ | M$ | |
| 12-2018 | 2.209 | .000 | .000 | 0.000 | 0.000 | 2.209 | .102 | .055 | .000 | |
| 12-2019 | | | | | | | | | | |
| 12-2020 | | | | | | | | | | |
| 12-2021 | | | | | | | | | | |
| 12-2022 | | | | | | | | | | |
| 12-2023 | | | | | | | | | | |
| 12-2024 | | | | | | | | | | |
| 12-2025 | | | | | | | | | | |
| 12-2026 | | | | | | | | | | |
| 12-2027 | | | | | | | | | | |
| 12-2028 | | | | | | | | | | |
| 12-2029 | | | | | | | | | | |
| 12-2030 | | | | | | | | | | |
| 12-2031 | | | | | | | | | | |
| 12-2032 | | | | | | | | | | |
| 12-2033 | | | | | | | | | | |
| 12-2034 | | | | | | | | | | |
| 12-2035 | | | | | | | | | | |
| 12-2036 | | | | | | | | | | |
| S Tot | 2.209 | .000 | .000 | 0.000 | 0.000 | 2.209 | .102 | .055 | 4.618 | |
| After | .000 | .000 | .000 | 0.000 | 0.000 | .000 | .000 | .000 | .000 | |
| Total | 2.209 | .000 | .000 | 0.000 | 0.000 | 2.209 | .102 | .055 | 4.618 | |
| (21) | (22) | (23) | (24) | (25) | (26) | (27) | (28) | (29) | (30) | (31) |
| | Operating | Wells | Workover | 3rd Party | Other | | Future Net | Cumulative | Cum.Cash Flow |
| End | Expense | Gross | Net | Expense | COPAS | Deductions | Investment | Cash Flow | Cash Flow | Disc.@ 10. % |
| Mo-Year | M$ | Count | M$ | M$ | M$ | M$ | M$ | M$ | M$ |
| 12-2018 | .000 | 1 | 0.8 | 0.000 | 0.000 | 0.214 | .000 | 1.838 | 1.838 | 1.830 | |
| 12-2019 | | | | | | | | | | | |
| 12-2020 | | | | | | | | | | | |
12-2021 12-2022 12-2023 | | | | | | | | | | | |
| 12-2024 | | | | | | | | | | | |
| 12-2025 | | | | | | | | | | | |
| 12-2026 | | | | | | | | | | | |
| 12-2027 | | | | | | | | | | | |
| 12-2028 | | | | | | | | | | | |
| 12-2029 | | | | | | | | | | | |
| 12-2030 | | | | | | | | | | | |
| 12-2031 | | | | | | | | | | | |
| 12-2032 | | | | | | | | | | | |
| 12-2033 | | | | | | | | | | | |
| 12-2034 | | | | | | | | | | | |
| 12-2035 | | | | | | | | | | | |
| 12-2036 | | | | | | | | | | | |
| S Tot | .000 | | | 0.000 | 0.000 | 0.214 | .000 | 1.838 | 1.838 | 1.830 | |
| After | .000 | | | 0.000 | 0.000 | 0.000 | .000 | .000 | 1.838 | 1.830 | |
| Total | .000 | | | 0.000 | 0.000 | 0.214 | .000 | 1.838 | 1.838 | 1.830 | |
| Evaluation Parameters (Gross) | | Expenses (Gross) | | Percent Interests | | Percent | Cum. Disc. | |
| | Initial | Final | Units | | Dei | n | Def | | Initial | Final | Units | | | Initial | Final | | 5.00 | 1.834 | |
| Oil Rate | 147. | 0. | bbls/mo | | 49.1% | 1.20 | 0.0% | | 0. | 0. | $/w/mo | | Expense | 85.4277 | 85.4277 | | 8.00 | 1.832 | |
| Gas Rate | 0. | 0. | Mcf/mo | | 0.0% | 0 00 | 0.0% | | | | | | Revenue | | | | 10.00 | 1.830 | |
| GOR | 0. | 0. | scf/bbl | | | | | | | | | | Oil | 68.9935 | 68.9935 | | 12.00 | 1.829 | |
| NGL Rate | 0. | 0. | bbls/mo | | | | | | | | | | Gas | 68.9935 | 68.9935 | | 15.00 | 1.827 | |
| NGL Yield | 0.0 | 0.0 | bbl/MMcf | | | | | | | | | | | | | | 20.00 | 1.823 | |
| Gas Shrinkage | 0.0 | 0.0 | % | | | | | | | | | | | | | | | | |
| Oil Severance | 4.6 | 0.0 | % | | | | | | | | | | | | | | | | |
| Gas Severance | 0.0 | 0.0 | % | | | | | | | | | | | | | | | | |
| NGL Severance | 0.0 | 0.0 | % | | | | | | | | | | | | | | | | |
| Ad Valorem | 0.0 | | % | | | | | | | | | | | | | | | | |
| | | | | | | 12 Months in first year .999 Year Life (12/2018) | |
| THESE DATA ARE PART OF A CG&A REPORT AND ARE SUBJECT TO THE CONDITIONS IN THE TEXT OF THE REPORT. | ASN 111 | DEFAULT | 1/10/2018 | 10:34:19 |
| TEXAS REGISTERED ENGINEERING FIRM F-693. | | | | OIL | PDP |
| | Table | 19 |
Cawley, Gillespie & Associates, Inc.
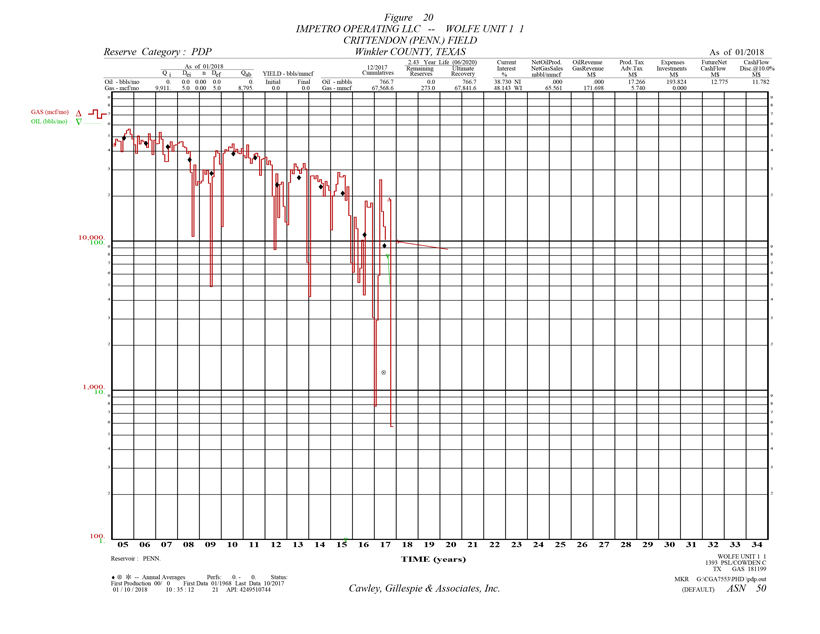
Table 20
Reserve Estimates and Economic Forecasts as of December 31, 2017
Lilis Energy, Inc. Interests
Proved Developed Producing Reserves
IMPETRO OPERATING LLC -- WOLFE UNIT 1 1
CRITTENDON \(PENN.\) FIELD -- Winkler COUNTY, TEXAS
| (1) | (2) | (3) | (4) | (5) | (6) | (7) | (8) | (9) | (10) |
| | Gross Oil | Gross Gas | Gross NGL | Net Oil | Net Gas | Net NGL | Avg Oil | Avg Gas | Avg NGL |
| End | Production | Production | Production | Production | Sales | Production | Price | Price | Price |
| Mo-Year | MBBLS | MMCF | MBBLS | MBBLS | MMCF | MBBLS | $/BBL | $/MCF | $/BBL |
| 12-2018 | .0 | 116.1 | 7.7 | .000 | 27.882 | 2.998 | .000 | 2.619 | 8.214 | |
| 12-2019 | .0 | 110.3 | 7.4 | .000 | 26.489 | 2.848 | .000 | 2.619 | 8.214 | |
| 06-2020 | .0 | 46.6 | 3.1 | .000 | 11.190 | 1.203 | .000 | 2.619 | 8.214 | |
| 12-2021 | | | | | | | | | | |
| 12-2022 | | | | | | | | | | |
| 12-2023 | | | | | | | | | | |
| 12-2024 | | | | | | | | | | |
| 12-2025 | | | | | | | | | | |
| 12-2026 | | | | | | | | | | |
| 12-2027 | | | | | | | | | | |
| 12-2028 | | | | | | | | | | |
| 12-2029 | | | | | | | | | | |
| 12-2030 | | | | | | | | | | |
| 12-2031 | | | | | | | | | | |
| 12-2032 | | | | | | | | | | |
| 12-2033 | | | | | | | | | | |
| 12-2034 | | | | | | | | | | |
| 12-2035 | | | | | | | | | | |
| 12-2036 | | | | | | | | | | |
| S Tot | .0 | 273.0 | 18.2 | .000 | 65.561 | 7.050 | .000 | 2.619 | 8.214 | |
| After | .0 | .0 | .0 | .000 | .000 | .000 | .000 | .000 | .000 | |
| Total | .0 | 273.0 | 18.2 | .000 | 65.561 | 7.050 | .000 | 2.619 | 8.214 | |
| Cum | 766.7 | 67,568.6 | .0 | | | | | | | |
| Ult | 766.7 | 67,841.6 | 18.2 | | | | | | | |
| (11) | (12) | (13) | (14) | (15) | (16) | (17) | (18) | (19) | (20) |
| | Oil | Gas | NGL | Hedge | Other | Total | Production | Ad Valorem | |
| End | Revenue | Revenue | Revenue | Revenue | Revenue | Revenue | Taxes | Taxes | $/BOE6 |
| Mo-Year | M$ | M$ | M$ | M$ | M$ | M$ | M$ | M$ | |
| 12-2018 | .000 | 73.020 | 24.627 | 0.000 | 0.000 | 97.647 | 7.343 | 2.441 | 12.076 | |
| 12-2019 | .000 | 69.371 | 23.396 | 0.000 | 0.000 | 92.768 | 6.976 | 2.319 | 12.711 | |
| 06-2020 | .000 | 29.306 | 9.884 | 0.000 | 0.000 | 39.190 | 2.947 | .980 | 13.042 | |
| 12-2021 | | | | | | | | | | |
| 12-2022 | | | | | | | | | | |
| 12-2023 | | | | | | | | | | |
| 12-2024 | | | | | | | | | | |
| 12-2025 | | | | | | | | | | |
| 12-2026 | | | | | | | | | | |
| 12-2027 | | | | | | | | | | |
| 12-2028 | | | | | | | | | | |
| 12-2029 | | | | | | | | | | |
| 12-2030 | | | | | | | | | | |
| 12-2031 | | | | | | | | | | |
| 12-2032 | | | | | | | | | | |
| 12-2033 | | | | | | | | | | |
| 12-2034 | | | | | | | | | | |
| 12-2035 | | | | | | | | | | |
| 12-2036 | | | | | | | | | | |
| S Tot | .000 | 171.698 | 57.907 | 0.000 | 0.000 | 229.605 | 17.266 | 5.740 | 12.497 | |
| After | .000 | .000 | .000 | 0.000 | 0.000 | .000 | .000 | .000 | .000 | |
| Total | .000 | 171.698 | 57.907 | 0.000 | 0.000 | 229.605 | 17.266 | 5.740 | 12.497 | |
| (21) | (22) | (23) | (24) | (25) | (26) | (27) | (28) | (29) | (30) | (31) |
| | Operating | Wells | Workover | 3rd Party | Other | | Future Net | Cumulative | Cum.Cash Flow |
| End | Expense | Gross | Net | Expense | COPAS | Deductions | Investment | Cash Flow | Cash Flow | Disc.@ 10. % |
| Mo-Year | M$ | Count | M$ | M$ | M$ | M$ | M$ | M$ | M$ |
| 12-2018 | 79.650 | 1 | 0.5 | 0.000 | 0.000 | 0.000 | .000 | 8.212 | 8.212 | 7.851 | |
| 12-2019 | 79.650 | 1 | 0.5 | 0.000 | 0.000 | 0.000 | .000 | 3.822 | 12.035 | 11.180 | |
| 06-2020 | 34.523 | 1 | 0.5 | 0.000 | 0.000 | 0.000 | .000 | .740 | 12.775 | 11.782 | |
| 12-2021 | | | | | | | | | | |
| 12-2022 | | | | | | | | | | |
| 12-2023 | | | | | | | | | | |
| 12-2024 | | | | | | | | | | |
| 12-2025 | | | | | | | | | | |
| 12-2026 | | | | | | | | | | |
| 12-2027 | | | | | | | | | | |
| 12-2028 | | | | | | | | | | |
| 12-2029 | | | | | | | | | | |
| 12-2030 | | | | | | | | | | |
| 12-2031 | | | | | | | | | | |
| 12-2032 | | | | | | | | | | |
12-2033 12-2034 | | | | | | | | | | |
| 12-2035 | | | | | | | | | | |
| 12-2036 | | | | | | | | | | |
S Tot | 193.824 | | 0.000 | 0.000 | 0.000 | .000 | 12.775 | 12.775 | 11.782 | |
| After | .000 | | 0.000 | 0.000 | 0.000 | .000 | .000 | 12.775 | 11.782 | |
| Total | 193.824 | | 0.000 | 0.000 | 0.000 | .000 | 12.775 | 12.775 | 11.782 | |
| Evaluation Parameters (Gross) | | Expenses (Gross) | | Percent Interests | | Percent | Cum. Disc. | |
| | Initial | Final | Units | | Dei | N | Def | | Initial | Final | Units | | | Initial | Final | | 5.00 | 12.251 | |
| Gas Rate | 9,931. | 8,765. | Mcf/mo | | 5.0% | 0.00 | 0.0% | | 13,785. | 13,785. | $/w/mo | | Expense | 48.1433 | 48.1433 | | 8.00 | 11.963 | |
| Oil Rate | 0. | 0. | bbls/mo | | 0.0% | 0.00 | 0.0% | | | | | Revenue | | | | 10.00 | 11.782 | |
| NGL Rate | 673. | 597. | bbls/mo | | | | | | | | | Oil | 38.7307 | 38.7307 | | 12.00 | 11.607 | |
| Cond Yield | 0.0 | 0.0 | bbl/MMcf | | | | | | | | | Gas | 38.7307 | 38.7307 | | 15.00 | 11.358 | |
| NGL Yield | 67.8 | 68.1 | bbl/MMcf | | | | | | | | | | | | | 20.002 | 10.971 | |
| Gas Shrinkage | 38.1 | 37.9 | % | | | | | | | | | | | | | | | |
| Oil Severance | 0.0 | 0.0 | % | | | | | | | | | | | | | | | |
| Gas Severance | 7.5 | 7.5 | % | | | | | | | | | | | | | | | |
| NGL Severance | 7.5 | 7.5 | % | | | | | | | | | | | | | | | |
| Ad Valorem | 18.8 | | % | | | | | | | | | | | | | | | |
| | | | | | | 12 Months in first year 2.437 Year Life (06/2020) | |
| THESE DATA ARE PART OF A CG&A REPORT AND ARE SUBJECT TO THE CONDITIONS IN THE TEXT OF THE REPORT. | ASN 50 | DEFAULT | 1/10/2018 | 10:34:19 |
| TEXAS REGISTERED ENGINEERING FIRM F-693. | | | | GAS | PDP |
| | | | | Table | 20 |
Cawley, Gillespie & Associates, Inc.

Table 21
Reserve Estimates and Economic Forecasts as of December 31, 2017
Lilis Energy, Inc. Interests
Proved Developed Producing Reserves
IMPETRO OPERATING LLC -- WOLFE UNIT 4,5&6 4,5,6&7
CRITTENDON \(BELL CANYON\) FIELD -- Winkler COUNTY, TEXAS
| (1) | (2) | (3) | (4) | (5) | (6) | (7) | (8) | (9) | (10) |
| | Gross Oil | Gross Gas | Gross NGL | Net Oil | Net Gas | Net NGL | Avg Oil | Avg Gas | Avg NGL |
| End | Production | Production | Production | Production | Sales | Production | Price | Price | Price |
| Mo-Year | MBBLS | MMCF | MBBLS | MBBLS | MMCF | MBBLS | $/BBL | $/MCF | $/BBL |
| 12-2018 | 11.4 | 3.2 | .2 | 6.580 | 1.145 | .123 | 46.719 | 2.678 | 8.728 | |
| 12-2019 | 10.2 | 2.9 | .2 | 5.922 | 1.030 | .111 | 46.719 | 2.678 | 8.728 | |
| 12-2020 | 9.3 | 2.6 | .2 | 5.393 | .930 | .100 | 46.719 | 2.678 | 8.728 | |
| 12-2021 | 8.5 | 2.3 | .2 | 4.921 | .834 | .090 | 46.719 | 2.678 | 8.728 | |
| 12-2022 | 7.8 | 2.1 | .1 | 4.526 | .751 | .081 | 46.719 | 2.678 | 8.728 | |
| 12-2023 | 7.2 | 1.9 | .1 | 4.164 | .676 | .073 | 46.719 | 2.678 | 8.728 | |
| 12-2024 | 6.6 | 1.7 | .1 | 3.841 | .610 | .066 | 46.719 | 2.678 | 8.728 | |
| 04-2025 | 1.6 | .4 | .0 | .936 | .147 | .016 | 46.719 | 2.678 | 8.728 | |
| 12-2026 | | | | | | | | | | |
| 12-2027 | | | | | | | | | | |
| 12-2028 | | | | | | | | | | |
| 12-2029 | | | | | | | | | | |
| 12-2030 | | | | | | | | | | |
| 12-2031 | | | | | | | | | | |
| 12-2032 | | | | | | | | | | |
| 12-2033 | | | | | | | | | | |
| 12-2034 | | | | | | | | | | |
| 12-2035 | | | | | | | | | | |
| 12-2036 | | | | | | | | | | |
| S Tot | 62.8 | 17.1 | 1.1 | 36.282 | 6.122 | .658 | 46.719 | 2.678 | 8.728 | |
| After | .0 | .0 | .0 | .000 | .000 | .000 | .000 | .000 | .000 | |
| Total | 62.8 | 17.1 | 1.1 | 36.282 | 6.122 | .658 | 46.719 | 2.678 | 8.728 | |
| Cum | 945.8 | 877.9 | .0 | | | | | | | |
| Ult | 1,008.6 | 895.0 | 1.1 | | | | | | | |
| (11) | (12) | (13) | (14) | (15) | (16) | (17) | (18) | (19) | (20) |
| | Oil | Gas | NGL | Hedge | Other | Total | Production | Ad Valorem | |
| End | Revenue | Revenue | Revenue | Revenue | Revenue | Revenue | Taxes | Taxes | $/BOE6 |
| Mo-Year | M$ | M$ | M$ | M$ | M$ | M$ | M$ | M$ | |
| 12-2018 | 307.403 | 3.066 | 1.074 | 0.000 | 0.000 | 311.543 | 14.505 | 7.789 | 23.067 | |
| 12-2019 | 276.659 | 2.759 | .967 | 0.000 | 0.000 | 280.385 | 13.055 | 7.010 | 25.630 | |
| 12-2020 | 251.935 | 2.490 | .872 | 0.000 | 0.000 | 255.297 | 11.886 | 6.382 | 28.155 | |
| 12-2021 | 229.928 | 2.235 | .783 | 0.000 | 0.000 | 232.945 | 10.844 | 5.824 | 30.870 | |
| 12-2022 | 211.442 | 2.011 | .705 | 0.000 | 0.000 | 214.158 | 9.967 | 5.354 | 33.597 | |
| 12-2023 | 194.538 | 1.810 | .634 | 0.000 | 0.000 | 196.983 | 9.166 | 4.925 | 36.546 | |
| 12-2024 | 179.455 | 1.634 | .572 | 0.000 | 0.000 | 181.661 | 8.452 | 4.542 | 39.649 | |
| 04-2025 | 43.720 | .392 | .138 | 0.000 | 0.000 | 44.250 | 2.059 | 1.106 | 41.403 | |
| 12-2026 | | | | | | | | | | |
| 12-2027 | | | | | | | | | | |
| 12-2028 | | | | | | | | | | |
| 12-2029 | | | | | | | | | | |
| 12-2030 | | | | | | | | | | |
| 12-2031 | | | | | | | | | | |
| 12-2032 | | | | | | | | | | |
| 12-2033 | | | | | | | | | | |
12-2034 12-2035 | | | | | | | | | | |
| 12-2036 | | | | | | | | | | |
| S Tot | 1,695.079 | 16.398 | 5.746 | 0.000 | 0.000 | 1,717.223 | 79.934 | 42.931 | 30.382 | |
| After | .000 | .000 | .000 | 0.000 | 0.000 | .000 | .000 | .000 | .000 | |
| Total | 1,695.079 | 16.398 | 5.746 | 0.000 | 0.000 | 1,717.223 | 79.934 | 42.931 | 30.382 | |
| (21) | (22) | (23) | (24) | (25) | (26) | (27) | (28) | (29) | (30) | (31) |
| | Operating | Wells | Workover | 3rd Party | Other | | Future Net | Cumulative | Cum.Cash Flow |
| End | Expense | Gross | Net | Expense | COPAS | Deductions | Investment | Cash Flow | Cash Flow | Disc.@ 10. % |
| Mo-Year | M$ | Count | M$ | M$ | M$ | M$ | M$ | M$ | M$ |
| 12-2018 | 158.019 | 2 | 1.4 | 0.000 | 0.000 | 0.000 | .000 | 131.230 | 131.230 | 125.372 | |
| 12-2019 | 158.019 | 2 | 1.4 | 0.000 | 0.000 | 0.000 | .000 | 102.302 | 233.531 | 214.231 | |
| 12-2020 | 158.019 | 2 | 1.4 | 0.000 | 0.000 | 0.000 | .000 | 79.010 | 312.541 | 276.633 | |
| 12-2021 | 158.019 | 2 | 1.4 | 0.000 | 0.000 | 0.000 | .000 | 58.259 | 370.800 | 318.459 | |
| 12-2022 | 158.019 | 2 | 1.4 | 0.000 | 0.000 | 0.000 | .000 | 40.818 | 411.618 | 345.113 | |
| 12-2023 | 158.019 | 2 | 1.4 | 0.000 | 0.000 | 0.000 | .000 | 24.872 | 436.491 | 359.896 | |
| 12-2024 | 158.019 | 2 | 1.4 | 0.000 | 0.000 | 0.000 | .000 | 10.649 | 447.139 | 365.679 | |
| 04-2025 | 40.181 | 2 | 1.4 | 0.000 | 0.000 | 0.000 | .000 | .905 | 448.044 | 366.139 | |
| 12-2026 | | | | | | | | | | | |
| 12-2027 | | | | | | | | | | | |
| 12-2028 | | | | | | | | | | | |
| 12-2029 | | | | | | | | | | | |
| 12-2030 | | | | | | | | | | | |
| 12-2031 | | | | | | | | | | | |
| 12-2032 | | | | | | | | | | | |
12-2033 | | | | | | | | | | | |
| 12-2034 | | | | | | | | | | | |
| 12-2035 | | | | | | | | | | | |
| 12-2036 | | | | | | | | | | | |
| S Tot | 1,146.315 | | | 0.000 | 0.000 | 0.000 | .000 | 448.044 | 448.044 | 366.139 | |
| After | .000 | | | 0.000 | 0.000 | 0.000 | .000 | .000 | 448.044 | 366.139 | |
| Total | 1,146.315 | | | 0.000 | 0.000 | 0.000 | .000 | 448.044 | 448.044 | 366.139 | |
| Evaluation Parameter (Gross) | | Expenses (Gross) | | Percent Interests | | Percent | Cum. Disc. | |
| | Initial | Final | Units | | Dei | n | Def | | Initial | Final | Units | | | Initial | Final | | 5.00 | 402.837 | |
| Oil Rate | 1,003. | 518. | bbls/mo | | 11.0% | 0.90 | 0.0% | | 0. | 0. | $/w/mo | | Expense | 68.5740 | 68.5740 | | 8.00 | 379.944 | |
| Gas Rate | 280. | 130. | Mcf/mo | | 10.0% | 0.00 | 0.0% | | 19,202. | 19,202. | $/mo | | Revenue | | | | 10.00 | 366.139 | |
| GOR | 279. | 251. | scf/bbl | | | | | | | | | | Oil | 57.8050 | 57.8050 | | 12.00 | 353.359 | |
| NGL Rate | 19. | 8. | bbls/mo | | | | | | | | | | Gas | 57.8050 | 57.8050 | | 15.00 | 335.892 | |
| NGL Yield | 67.6 | 68.3 | bbl/MMcf | | | | | | | | | | | | | | 20.00 | 310.621 | |
| Gas Shrinkage | 38.9 | 39.1 | % | | | | | | | | | | | | | | | | |
| Oil Severance | 4.6 | 4.6 | % | | | | | | | | | | | | | | | | |
| Gas Severance | 7.5 | 7.5 | % | | | | | | | | | | | | | | | | |
| NGL Severance | 7.5 | 7.5 | % | | | | | | | | | | | | | | | | |
| Ad Valorem | 36.3 | | % | | | | | | | | | | | | | | | | |
| | | | | | | 12 Months in first year 7.258 Year Life (04/2025) | |
| THESE DATA ARE PART OF A CG&A REPORT AND ARE SUBJECT TO THE CONDITIONS IN THE TEXT OF THE REPORT. | ASN 15 | DEFAULT | 1/10/2018 | 10:34:19 |
| TEXAS REGISTERED ENGINEERING FIRM F-693. | | | | OIL | PDP |
| | | | | Table | 21 |
Cawley, Gillespie & Associates, Inc.
Table I - PDNP
Composite Reserve Estimates and Economic Forecasts
Lilis Energy, Inc. Interests
Delaware Basin Properties in Texas and New Mexico
Proved Developed Non-Producing Reserves
As of December 31, 2017
| (1) | (2) | (3) | (4) | (5) | (6) | (7) | (8) | (9) | (10) |
| | Gross Oil | Gross Gas | Gross NGL | Net Oil | Net Gas | Net NGL | Avg Oil | Avg Gas | Avg NGL |
| End | Production | Production | Production | Production | Sales | Production | Price | Price | Price |
| Mo-Year | MBBLS | MMCF | MBBLS | MBBLS | MMCF | MBBLS | $/BBL | $/MCF | $/BBL |
| 12-2018 | 360.5 | 1,124.0 | 76.6 | 226.251 | 475.616 | 47.505 | 47.746 | 2.611 | 8.198 | |
| 12-2019 | 193.1 | 651.7 | 44.0 | 121.630 | 276.014 | 27.244 | 47.746 | 2.604 | 7.797 | |
| 12-2020 | 127.0 | 455.4 | 30.5 | 79.949 | 192.517 | 18.831 | 47.746 | 2.600 | 7.485 | |
| 12-2021 | 96.1 | 360.1 | 24.0 | 60.499 | 152.057 | 14.784 | 47.746 | 2.597 | 7.276 | |
| 12-2022 | 78.2 | 302.5 | 20.1 | 49.240 | 127.661 | 12.360 | 47.746 | 2.594 | 7.130 | |
| 12-2023 | 66.3 | 262.5 | 17.4 | 41.763 | 110.717 | 10.688 | 47.746 | 2.593 | 7.028 | |
| 12-2024 | 58.0 | 233.1 | 15.4 | 36.498 | 98.275 | 9.468 | 47.746 | 2.592 | 6.957 | |
| 12-2025 | 51.4 | 208.8 | 13.8 | 32.349 | 87.997 | 8.467 | 47.746 | 2.591 | 6.911 | |
| 12-2026 | 46.3 | 189.4 | 12.5 | 29.180 | 79.846 | 7.676 | 47.746 | 2.591 | 6.885 | |
| 12-2027 | 42.3 | 173.3 | 11.5 | 26.622 | 73.025 | 7.018 | 47.746 | 2.591 | 6.873 | |
| 12-2028 | 36.9 | 159.7 | 10.6 | 23.108 | 67.309 | 6.469 | 47.746 | 2.591 | 6.871 | |
| 12-2029 | 33.1 | 146.5 | 9.7 | 20.695 | 61.752 | 5.935 | 47.746 | 2.591 | 6.871 | |
| 12-2030 | 30.5 | 201.4 | 12.9 | 19.041 | 84.383 | 7.790 | 47.746 | 2.571 | 5.430 | |
| 12-2031 | 28.0 | 197.4 | 12.6 | 17.519 | 82.631 | 7.589 | 47.746 | 2.568 | 5.243 | |
| 12-2032 | 25.9 | 182.1 | 11.6 | 16.160 | 76.225 | 7.001 | 47.746 | 2.568 | 5.243 | |
| 12-2033 | 23.7 | 167.0 | 10.7 | 14.826 | 69.931 | 6.423 | 47.746 | 2.568 | 5.243 | |
| 12-2034 | 21.8 | 153.7 | 9.8 | 13.641 | 64.340 | 5.909 | 47.746 | 2.568 | 5.243 | |
| 12-2035 | 20.1 | 141.4 | 9.0 | 12.550 | 59.197 | 5.437 | 47.746 | 2.568 | 5.243 | |
| 12-2036 | 18.5 | 113.7 | 7.3 | 11.538 | 47.674 | 4.428 | 47.746 | 2.574 | 5.653 | |
| S Tot | 1,357.6 | 5,423.6 | 360.1 | 853.059 | 2,287.167 | 221.021 | 47.746 | 2.593 | 7.064 | |
| After | 6.7 | 20.2 | 1.4 | 4.151 | 8.468 | .859 | 47.746 | 2.619 | 8.728 | |
| Total | 1,364.3 | 5,443.8 | 361.5 | 857.210 | 2,295.636 | 221.881 | 47.746 | 2.594 | 7.071 | |
| Cum | .0 | .0 | .0 | | | | | | | |
| Ult | 1,364.3 | 5,443.8 | 361.5 | | | | | | |
| (11) | (12) | (13) | (14) | (15) | (16) | (17) | (18) | (19) | (20) |
| | Oil | Gas | NGL | Hedge | Other | Total | Production | Ad Valorem | |
| End | Revenue | Revenue | Revenue | Revenue | Revenue | Revenue | Taxes | Taxes | $/BOE6 |
| Mo-Year | M$ | M$ | M$ | M$ | M$ | M$ | M$ | M$ | |
| 12-2018 | 10,802.639 | 1,241.603 | 389.470 | 0.000 | 0.000 | 12,433.712 | 612.401 | 310.843 | 4.490 | |
| 12-2019 | 5,807.357 | 718.833 | 212.415 | 0.000 | 0.000 | 6,738.605 | 334.313 | 168.465 | 6.087 | |
| 12-2020 | 3,817.266 | 500.474 | 140.953 | 0.000 | 0.000 | 4,458.692 | 224.498 | 111.467 | 7.557 | |
| 12-2021 | 2,888.620 | 394.822 | 107.561 | 0.000 | 0.000 | 3,391.003 | 171.165 | 84.775 | 8.915 | |
| 12-2022 | 2,351.016 | 331.202 | 88.122 | 0.000 | 0.000 | 2,770.340 | 140.096 | 69.259 | 10.183 | |
| 12-2023 | 1,994.008 | 287.077 | 75.110 | 0.000 | 0.000 | 2,356.196 | 119.315 | 58.905 | 11.404 | |
| 12-2024 | 1,742.625 | 254.717 | 65.870 | 0.000 | 0.000 | 2,063.213 | 104.579 | 51.580 | 12.571 | |
| 12-2025 | 1,544.542 | 228.020 | 58.516 | 0.000 | 0.000 | 1,831.077 | 92.872 | 45.777 | 13.771 | |
| 12-2026 | 1,393.217 | 206.867 | 52.849 | 0.000 | 0.000 | 1,652.933 | 83.867 | 41.323 | 14.931 | |
| 12-2027 | 1,271.098 | 189.183 | 48.236 | 0.000 | 0.000 | 1,508.517 | 76.551 | 37.713 | 16.083 | |
| 12-2028 | 1,103.323 | 174.374 | 44.449 | 0.000 | 0.000 | 1,322.145 | 67.406 | 33.054 | 16.164 | |
| 12-2029 | 988.131 | 159.976 | 40.779 | 0.000 | 0.000 | 1,188.885 | 60.728 | 29.722 | 16.946 | |
| 12-2030 | 909.132 | 216.923 | 42.303 | 0.000 | 0.000 | 1,168.357 | 61.489 | 29.209 | 15.843 | |
| 12-2031 | 836.449 | 212.215 | 39.787 | 0.000 | 0.000 | 1,088.452 | 57.591 | 27.211 | 16.615 | |
| 12-2032 | 771.599 | 195.762 | 36.703 | 0.000 | 0.000 | 1,004.063 | 53.126 | 25.102 | 17.828 | |
| 12-2033 | 707.890 | 179.598 | 33.672 | 0.000 | 0.000 | 921.160 | 48.740 | 23.029 | 19.235 | |
| 12-2034 | 651.296 | 165.240 | 30.980 | 0.000 | 0.000 | 847.516 | 44.843 | 21.188 | 20.716 | |
| 12-2035 | 599.226 | 152.029 | 28.503 | 0.000 | 0.000 | 779.759 | 41.258 | 19.494 | 22.326 | |
| 12-2036 | 550.884 | 122.697 | 25.033 | 0.000 | 0.000 | 698.614 | 36.555 | 17.465 | 25.350 | |
| S Tot | 40,730.317 | 5,931.614 | 1,561.311 | 0.000 | 0.000 | 48,223.241 | 2,431.392 | 1,205.581 | 10.307 | |
| After | 198.204 | 22.178 | 7.500 | 0.000 | 0.000 | 227.882 | 11.383 | 5.697 | 33.423 | |
| Total | 40,928.521 | 5,953.792 | 1,568.810 | 0.000 | 0.000 | 48,451.123 | 2,442.775 | 1,211.278 | 10.409 | |
| (21) | (22) | (23) | (24) | (25) | (26) | (27) | (28) | (29) | (30) | (31) |
| | Operating | Wells | Workover | 3rd Party | Other | | Future Net | Cumulative | Cum.Cash Flow |
| End | Expense | Gross | Net | Expense | COPAS | Deductions | Investment | Cash Flow | Cash Flow | Disc.@ 10. % |
| Mo-Year | M$ | Count | M$ | M$ | M$ | M$ | M$ | M$ | M$ |
| 12-2018 | 485.506 | 5 | 4.2 | 0.000 | 0.000 | 1,024.791 | 6,266.409 | 3,733.763 | 3,733.763 | 3,395.776 | |
| 12-2019 | 576.560 | 5 | 4.2 | 0.000 | 0.000 | 551.696 | .000 | 5,107.572 | 8,841.334 | 7,845.272 | |
| 12-2020 | 576.560 | 5 | 4.2 | 0.000 | 0.000 | 362.581 | .000 | 3,183.586 | 12,024.920 | 10,362.114 | |
| 12-2021 | 576.560 | 5 | 4.2 | 0.000 | 0.000 | 274.358 | .000 | 2,284.145 | 14,309.065 | 12,002.393 | |
| 12-2022 | 576.560 | 5 | 4.2 | 0.000 | 0.000 | 223.290 | .000 | 1,761.136 | 16,070.201 | 13,151.732 | |
| 12-2023 | 576.560 | 5 | 4.2 | 0.000 | 0.000 | 189.379 | .000 | 1,412.037 | 17,482.238 | 13,989.313 | |
| 12-2024 | 576.560 | 5 | 4.2 | 0.000 | 0.000 | 165.502 | .000 | 1,164.991 | 18,647.229 | 14,617.410 | |
| 12-2025 | 576.560 | 5 | 4.2 | 0.000 | 0.000 | 146.688 | .000 | 969.181 | 19,616.410 | 15,092.322 | |
| 12-2026 | 576.560 | 5 | 4.2 | 0.000 | 0.000 | 132.316 | .000 | 818.867 | 20,435.276 | 15,457.090 | |
| 12-2027 | 576.560 | 5 | 4.2 | 0.000 | 0.000 | 120.717 | .000 | 696.976 | 21,132.252 | 15,739.335 | |
| 12-2028 | 518.154 | 5 | 4.2 | 0.000 | 0.000 | 104.678 | .000 | 598.853 | 21,731.105 | 15,959.797 | |
| 12-2029 | 496.775 | 4 | 3.4 | 0.000 | 0.000 | 93.709 | .000 | 507.951 | 22,239.057 | 16,129.777 | |
| 12-2030 | 518.492 | 4 | 3.4 | 0.000 | 0.000 | 86.218 | .000 | 472.950 | 22,712.007 | 16,273.562 | |
| 12-2031 | 522.544 | 4 | 3.4 | 0.000 | 0.000 | 79.325 | .000 | 401.781 | 23,113.787 | 16,384.709 | |
| 12-2032 | 522.544 | 4 | 3.4 | 0.000 | 0.000 | 73.175 | .000 | 330.117 | 23,443.904 | 16,467.748 | |
| 12-2033 | 522.544 | 4 | 3.4 | 0.000 | 0.000 | 67.133 | .000 | 259.715 | 23,703.619 | 16,527.136 | |
| 12-2034 | 522.544 | 4 | 3.4 | 0.000 | 0.000 | 61.766 | .000 | 197.175 | 23,900.795 | 16,568.139 | |
| 12-2035 | 522.544 | 4 | 3.4 | 0.000 | 0.000 | 56.828 | .000 | 139.636 | 24,040.430 | 16,594.552 | |
| 12-2036 | 514.630 | 4 | 3.4 | 0.000 | 0.000 | 52.238 | .000 | 77.726 | 24,118.156 | 16,608.013 | |
| S Tot | 10,335.317 | | | 0.000 | 0.000 | 3,866.386 | 6,266.409 | 24,118.156 | 24,118.156 | 16,608.013 | |
| After | 186.374 | | | 0.000 | 0.000 | 18.211 | .000 | 6.217 | 24,124.373 | 16,609.000 | |
| Total | 10,521.690 | | | 0.000 | 0.000 | 3,884.597 | 6,266.409 | 24,124.373 | 24,124.373 | 16,609.000 | |
| | SEC Pricing YE2017 | | Percent | Cum. Disc. | |
| | | WTI Cushing | Henry Hub | | 5.00 | | 19,645.597 | |
| | Year | Oil $/STB | Gas $/MMBTU | | 8.00 | | 17,696.862 | |
| | 2018 | 51.34 | 2.976 | | 10.00 | | 16,609.000 | |
| | Thereafter | Flat | Flat | | 12.00 | | 15,654.402 | |
| | Cap | 51.34 | 2.976 | | 15.00 | | 14,423.212 | |
| | | | | | 20.00 | | 12.773.115 | |
| | |
| | |
| | |
| 12 Months in first year 19.929 Year Life (12/2037) | |
| THESE DATA ARE PART OF A CG&A REPORT AND ARE SUBJECT TO THE CONDITIONS IN THE TEXT OF THE REPORT. | 1/10/2018 | 10:34:19 |
| TEXAS REGISTERED ENGINEERING FIRM F-693. | | Summary |
Cawley, Gillespie & Associates, Inc.
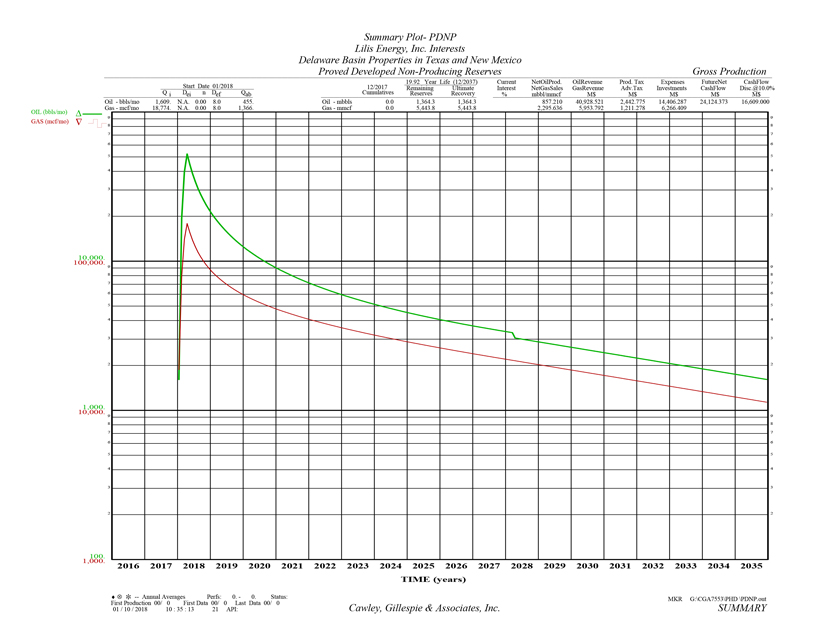
Table II - PDNP
Lease Reserve Summary
Lilis Energy, Inc. Interests
Delaware Basin Properties in Texas and New Mexico
Proved Developed Non-Producing Reserves
As of December 31, 2017
| OPERATOR | Current Interest | | WellCnt Life | Ultimate Recovery | Gross Reserves | Net Reserves | Oil Revenue Gas Revenue | Prod Tax Adv. Tax | Expenses Investments | Future Net Cash Flow | Cash Flow Disc.@ 10.0 |
| LEASE NAME | Start | | % | | | | ____________MBBL / MMCF____________ | M$ / M$ | M$ / M$ | M$ / M$ | M$ | M$ |
| Table | Class | Major | Well No. | Date | ASN | | | | | | | | | | | |
| PHANTOM (WOLFCAMP B) -- WINKLER COUNTY, TEXAS |
| LILIS ENERGY, INC. |
| GRIZZLY #2H | 61.0414 | NI | 1 | 427.7 | 427.7 | 261.1 | 12,466.0 | 715.9 | 4,348.7 | 7,003.2 | 4,906.7 |
| 1 PDNP | Oil | | 02/18 | 426 | 86.6526 | WI | 18.8 | 1,283.2 | 1,283.2 | 532.6 | 1,394.9 | 358.3 | 1,906.4 | | |
| CHEYENNE (ATOKA) -- WINKLER COUNTY, TEXAS |
| TRATON OPERATING COMPANY |
| HILL, A. G. 1{INCR} | 58.3125 | NI | 1 | 1.1 | 0.0 | 0.0 | 0.0 | 119.9 | 170.2 | 1,428.0 | 732.0 |
| 2 PDNP | Gas | 1 | 01/18 | 478 | 77.7500 | WI | 18.7 | 5,479.6 | 1,574.6 | 651.9 | 1,649.1 | 44.1 | 0.0 | | |
| PHANTOM (WOLFCAMP B) -- WINKLER COUNTY, TEXAS |
| LILIS ENERGY, INC. |
| KUDU #2H | 60.1633 | NI | 1 | 433.3 | 433.3 | 260.7 | 12,446.8 | 714.8 | 4,142.7 | 8,897.1 | 6,681.3 |
| 3 PDNP | Oil | | 02/18 | 320 | 79.2604 | WI | 19.8 | 1,299.9 | 1,299.9 | 531.8 | 1,392.7 | 357.8 | 198.2 | | |
| LION #3H | 66.2369 | NI | 1 | 428.7 | 428.7 | 284.0 | 13,558.5 | 778.7 | 4,691.3 | 5,737.6 | 3,429.4 |
| 4 PDNP | Oil | | 04/18 | 427 | 92.8237 | WI | 18.9 | 1,286.2 | 1,286.2 | 579.3 | 1,517.1 | 389.7 | 3,991.4 | | |
| CRITTENDON (BRUSHY CANYON) -- WINKLER COUNTY, TEXAS |
| IMPETRO OPERATING LLC |
| WOLFE UNIT #3H WORKOVER | 68.9934 | NI | 1 | 74.6 | 74.6 | 51.5 | 2,457.2 | 113.4 | 1,053.4 | 1,058.4 | 859.6 |
| 5 | PDNP | Oil | 3H | 01/18 | 425 | 85.2409 | WI | 10.2 | 0.0 | 0.0 | 0.0 | 0.0 | 61.4 | 170.5 | | |
| | | | | | | | | | | | | | | | | |
| GRAND TOTAL | | 4 | 1,364.3 | 1,364.3 | 857.2 | 40,928.5 | 2,442.8 | 14,406.3 | 24,124.4 | 16,609.0 |
| | | | | 5,443.8 | 5,443.8 | 2,295.6 | 5,953.8 | 1,211.3 | 6,266.4 | | |
THESE DATA ARE PART OF A CG&A REPORT AND ARE SUBJECT TO THE CONDITIONS IN THE TEXT OF THE REPORT. TEXAS REGISTERED ENGINEERING FIRM F-693. | | Scenario: | .550 | 1/10/2018 10:34:19 AM |
Cawley, Gillespie & Associates, Inc.
Page 1
Rate-Time History-Forecast Curves
And
Tabular Reserves and Economics
By Property
Cawley, Gillespie & Associates, Inc.
Petroleum Consultants

Table 1
Reserve Estimates and Economic Forecasts as of December 31, 2017
Lilis Energy, Inc. Interests
Proved Developed Non-Producing Reserves
LILIS ENERGY, INC. -- GRIZZLY #2H
PHANTOM (WOLFCAMP B) FIELD -- WINKLER COUNTY, TEXAS
| (1) | (2) | (3) | (4) | (5) | (6) | (7) | (8) | (9) | (10) |
| | Gross Oil | Gross Gas | Gross NGL | Net Oil | Net Gas | Net NGL | Avg Oil | AvgGas | Avg NGL |
| End | Production | Production | Production | Production | Sales | Production | Price | Price | Price |
| Mo-Year | MBBLS | MMCF | MBBLS | MBBLS | MMCF | MBBLS | $/BBL | $/MCF | $/BBL |
| 12-2018 | 114.4 | 343.3 | 23.7 | 69.847 | 142.488 | 14.458 | 47.746 | 2.619 | 8.728 | |
| 12-2019 | 59.7 | 179.0 | 12.4 | 36.428 | 74.314 | 7.541 | 47.746 | 2.619 | 8.728 | |
| 12-2020 | 39.2 | 117.7 | 8.1 | 23.943 | 48.843 | 4.956 | 47.746 | 2.619 | 8.728 | |
| 12-2021 | 29.7 | 89.0 | 6.1 | 18.110 | 36.944 | 3.749 | 47.746 | 2.619 | 8.728 | |
| 12-2022 | 24.1 | 72.4 | 5.0 | 14.734 | 30.057 | 3.050 | 47.746 | 2.619 | 8.728 | |
| 12-2023 | 20.5 | 61.4 | 4.2 | 12.493 | 25.486 | 2.586 | 47.746 | 2.619 | 8.728 | |
| 12-2024 | 17.9 | 53.6 | 3.7 | 10.916 | 22.268 | 2.260 | 47.746 | 2.619 | 8.728 | |
| 12-2025 | 15.8 | 47.5 | 3.3 | 9.673 | 19.734 | 2.002 | 47.746 | 2.619 | 8.728 | |
| 12-2026 | 14.3 | 42.9 | 3.0 | 8.724 | 17.798 | 1.806 | 47.746 | 2.619 | 8.728 | |
| 12-2027 | 13.0 | 39.1 | 2.7 | 7.959 | 16.236 | 1.648 | 47.746 | 2.619 | 8.728 | |
| 12-2028 | 12.0 | 36.0 | 2.5 | 7.334 | 14.961 | 1.518 | 47.746 | 2.619 | 8.728 | |
| 12-2029 | 11.0 | 33.1 | 2.3 | 6.728 | 13.726 | 1.393 | 47.746 | 2.619 | 8.728 | |
| 12-2030 | 10.1 | 30.4 | 2.1 | 6.190 | 12.629 | 1.281 | 47.746 | 2.619 | 8.728 | |
| 12-2031 | 9.3 | 28.0 | 1.9 | 5.696 | 11.619 | 1.179 | 47.746 | 2.619 | 8.728 | |
| 12-2032 | 8.6 | 25.8 | 1.8 | 5.254 | 10.718 | 1.088 | 47.746 | 2.619 | 8.728 | |
| 12-2033 | 7.9 | 23.7 | 1.6 | 4.820 | 9.833 | .998 | 47.746 | 2.619 | 8.728 | |
| 12-2034 | 7.3 | 21.8 | 1.5 | 4.435 | 9.047 | .918 | 47.746 | 2.619 | 8.728 | |
| 12-2035 | 6.7 | 20.1 | 1.4 | 4.080 | 8.324 | .845 | 47.746 | 2.619 | 8.728 | |
| 12-2036 | 6.1 | 18.3 | 1.3 | 3.724 | 7.598 | .771 | 47.746 | 2.619 | 8.728 | |
| S Tot | 427.7 | 1,283.2 | 88.5 | 261.089 | 532.622 | 54.045 | 47.746 | 2.619 | 8.728 | |
| After | .0 | .0 | .0 | .000 | .000 | .000 | .000 | .000 | .000 | |
| Total | 427.7 | 1,283.2 | 88.5 | 261.089 | 532.622 | 54.045 | 47.746 | 2.619 | 8.728 | |
| Cum | .0 | .0 | .0 | | | | | | | |
| Ult | 427.7 | 1,283.2 | 88.5 | | | | | | | |
| (11) | (12) | (13) | (14) | (15) | (16) | (17) | (18) | (19) | (20) |
| | Oil | Gas | NGL | Hedge | Other | Total | Production | Ad Valorem | |
| End | Revenue | Revenue | Revenue | Revenue | Revenue | Revenue | Taxes | Taxes | $/BOE6 |
| Mo-Year | M$ | M$ | M$ | M$ | M$ | M$ | M$ | M$ | |
| 12-2018 | 3,334.932 | 373.159 | 126.187 | 0.000 | 0.000 | 3,834.278 | 191.525 | 95.857 | 4.518 | |
| 12-2019 | 1,739.321 | 194.620 | 65.812 | 0.000 | 0.000 | 1,999.753 | 99.889 | 49.994 | 6.255 | |
| 12-2020 | 1,143.172 | 127.914 | 43.255 | 0.000 | 0.000 | 1,314.342 | 65.652 | 32.859 | 7.870 | |
| 12-2021 | 864.666 | 96.751 | 32.717 | 0.000 | 0.000 | 994.134 | 49.658 | 24.853 | 9.388 | |
| 12-2022 | 703.484 | 78.716 | 26.618 | 0.000 | 0.000 | 808.818 | 40.401 | 20.220 | 10.816 | |
| 12-2023 | 596.494 | 66.744 | 22.570 | 0.000 | 0.000 | 685.809 | 34.257 | 17.145 | 12.189 | |
| 12-2024 | 521.185 | 58.317 | 19.721 | 0.000 | 0.000 | 599.223 | 29.932 | 14.981 | 13.494 | |
| 12-2025 | 461.866 | 51.680 | 17.476 | 0.000 | 0.000 | 531.022 | 26.525 | 13.276 | 14.822 | |
| 12-2026 | 416.560 | 46.611 | 15.762 | 0.000 | 0.000 | 478.933 | 23.923 | 11.973 | 16.090 | |
| 12-2027 | 380.011 | 42.521 | 14.379 | 0.000 | 0.000 | 436.911 | 21.824 | 10.923 | 17.334 | |
| 12-2028 | 350.168 | 39.182 | 13.250 | 0.000 | 0.000 | 402.599 | 20.110 | 10.065 | 18.542 | |
| 12-2029 | 321.255 | 35.947 | 12.156 | 0.000 | 0.000 | 369.358 | 18.450 | 9.234 | 19.927 | |
| 12-2030 | 295.572 | 33.073 | 11.184 | 0.000 | 0.000 | 339.828 | 16.975 | 8.496 | 21.384 | |
| 12-2031 | 271.942 | 30.429 | 10.290 | 0.000 | 0.000 | 312.660 | 15.618 | 7.816 | 22.968 | |
| 12-2032 | 250.858 | 28.069 | 9.492 | 0.000 | 0.000 | 288.419 | 14.407 | 7.210 | 24.633 | |
| 12-2033 | 230.145 | 25.752 | 8.708 | 0.000 | 0.000 | 264.605 | 13.217 | 6.615 | 26.566 | |
| 12-2034 | 211.746 | 23.693 | 8.012 | 0.000 | 0.000 | 243.451 | 12.161 | 6.086 | 28.600 | |
| 12-2035 | 194.817 | 21.799 | 7.371 | 0.000 | 0.000 | 223.987 | 11.188 | 5.600 | 30.810 | |
| 12-2036 | 177.829 | 19.898 | 6.729 | 0.000 | 0.000 | 204.455 | 10.213 | 5.111 | 33.126 | |
| S Tot | 12,466.022 | 1,394.874 | 471.689 | 0.000 | 0.000 | 14,332.584 | 715.923 | 358.315 | 11.296 | |
| After | .000 | .000 | .000 | 0.000 | 0.000 | .000 | .000 | .000 | .000 | |
| Total | 12,466.022 | 1,394.874 | 471.689 | 0.000 | 0.000 | 14,332.584 | 715.923 | 358.315 | 11.296 | |
| (21) | (22) | (23) | (24) | (25) | (26) | (27) | (28) | (29) | (30) | (31) |
| | Operating | Wells | Workover | 3rd Party | Other | | Future Net | Cumulative | Cum.Cash Flow |
| End | Expense | Gross | Net | Expense | COPAS | Deductions | Investment | Cash Flow | Cash Flow | Disc.@ 10. % |
| Mo-Year | M$ | Count | M$ | M$ | M$ | M$ | M$ | M$ | M$ |
| 12-2018 | 140.130 | 1 | 0.9 | 0.000 | 0.000 | 325.222 | 1,906.358 | 1,175.187 | 1,175.187 | 1,062.893 | |
| 12-2019 | 166.373 | 1 | 0.9 | 0.000 | 0.000 | 169.618 | .000 | 1,513.879 | 2,689.066 | 2,381.760 | |
| 12-2020 | 166.373 | 1 | 0.9 | 0.000 | 0.000 | 111.482 | .000 | 937.976 | 3,627.042 | 3,123.332 | |
| 12-2021 | 166.373 | 1 | 0.9 | 0.000 | 0.000 | 84.322 | .000 | 668.928 | 4,295.969 | 3,603.720 | |
| 12-2022 | 166.373 | 1 | 0.9 | 0.000 | 0.000 | 68.604 | .000 | 513.220 | 4,809.190 | 3,938.666 | |
| 12-2023 | 166.373 | 1 | 0.9 | 0.000 | 0.000 | 58.170 | .000 | 409.864 | 5,219.053 | 4,181.793 | |
| 12-2024 | 166.373 | 1 | 0.9 | 0.000 | 0.000 | 50.826 | .000 | 337.112 | 5,556.165 | 4,363.548 | |
| 12-2025 | 166.373 | 1 | 0.9 | 0.000 | 0.000 | 45.041 | .000 | 279.807 | 5,835.973 | 4,500.660 | |
| 12-2026 | 166.373 | 1 | 0.9 | 0.000 | 0.000 | 40.623 | .000 | 236.040 | 6,072.013 | 4,605.806 | |
| 12-2027 | 166.373 | 1 | 0.9 | 0.000 | 0.000 | 37.059 | .000 | 200.732 | 6,272.746 | 4,687.094 | |
| 12-2028 | 166.373 | 1 | 0.9 | 0.000 | 0.000 | 34.148 | .000 | 171.903 | 6,444.648 | 4,750.381 | |
| 12-2029 | 166.373 | 1 | 0.9 | 0.000 | 0.000 | 31.329 | .000 | 143.972 | 6,588.620 | 4,798.564 | |
| 12-2030 | 166.373 | 1 | 0.9 | 0.000 | 0.000 | 28.824 | .000 | 119.161 | 6,707.781 | 4,834.823 | |
| 12-2031 | 166.373 | 1 | 0.9 | 0.000 | 0.000 | 26.520 | .000 | 96.333 | 6,804.114 | 4,861.478 | |
| 12-2032 | 166.373 | 1 | 0.9 | 0.000 | 0.000 | 24.464 | .000 | 75.965 | 6,880.080 | 4,880.593 | |
| 12-2033 | 166.373 | 1 | 0.9 | 0.000 | 0.000 | 22.444 | .000 | 55.956 | 6,936.036 | 4,893.393 | |
| 12-2034 | 166.373 | 1 | 0.9 | 0.000 | 0.000 | 20.649 | .000 | 38.181 | 6,974.217 | 4,901.339 | |
| 12-2035 | 166.373 | 1 | 0.9 | 0.000 | 0.000 | 18.998 | .000 | 21.828 | 6,996.045 | 4,905.475 | |
| 12-2036 | 164.584 | 1 | 0.9 | 0.000 | 0.000 | 17.342 | .000 | 7.205 | 7,003.250 | 4,906.728 | |
| S Tot | 3,133.056 | | | 0.000 | 0.000 | 1,215.683 | 1,906.358 | 7,003.250 | 7,003.250 | 4,906.728 | |
| After | .000 | | | 0.000 | 0.000 | 0.000 | .000 | .000 | 7,003.250 | 4,906.728 | |
| Total | 3,133.056 | | | 0.000 | 0.000 | 1,215.683 | 1,906.358 | 7,003.250 | 7,003.250 | 4,906.728 | |
| Evaluation Parameters (Gross) | | Expenses (Gross) | | Percent Interests | | Percent | Cum. Disc. | |
| | Initial | Final | Units | | Dei | n | Def | | Initial | Final | Units | | | | Final | | 5.00 | 5,765.007 | |
| Oil Rate | 22,812. | 492. | bbls/mo | | 96.5% | 1.20 | 0.0% | | 1,713. | 15,999. | $/w/mo | | Expense | 86.6526 | 86.6526 | | 8.00 | 5,216.055 | |
| Gas Rate | 68,437. | 1,476. | Mcf/mo | | 0.0% | 0.00 | 0.0% | | | | | | Revenue | | | | 10.00 | 4,906.728 | |
| GOR | 3,000. | 3,000. | scf/bbl | | | | | | | | | | Oil | 61.0414 | 61.0414 | | 12.00 | 4,633.554 | |
| NGL Rate | 459. | 101. | bbls/mo | | | | | | | | | | Gas | 61.0414 | 61.0414 | | 15.00 | 4,278.801 | |
| NGL Yield | 6.7 | 68.7 | bbl/MMcf | | | | | | | | | | | | | | 20.00 | 3,799.071 | |
| Gas Shrinkage | 92.8 | 31.5 | % | | | | | | | | | | | | | | | | |
| Oil Severance | 4.6 | 4.6 | % | | | | | | | | | | | | | | | | |
| Gas Severance | 7.5 | 7.5 | % | | | | | | | | | | | | | | | | |
| NGL Severance | 7.5 | 7.5 | % | | | | | | | | | | | | | | | | |
| Ad Valorem | 41.0 | | % | | | | | | | | | | | | | | | | |
| Start Date: 02/2018 11 Months in year ’18 18.907 Year Life (12/2036) | |
| THESE DATA ARE PART OF A CG&A REPORT AND ARE SUBJECT TO THE CONDITIONS IN THE TEXT OF THE REPORT. | ASN 426 | DEFAULT | 1/10/2018 | 10:34:19 |
| TEXAS REGISTERED ENGINEERING FIRM F-693. | | | | OIL | PDNP |
| | | | | | Table | 1 |
Cawley, Gillespie & Associates, Inc.
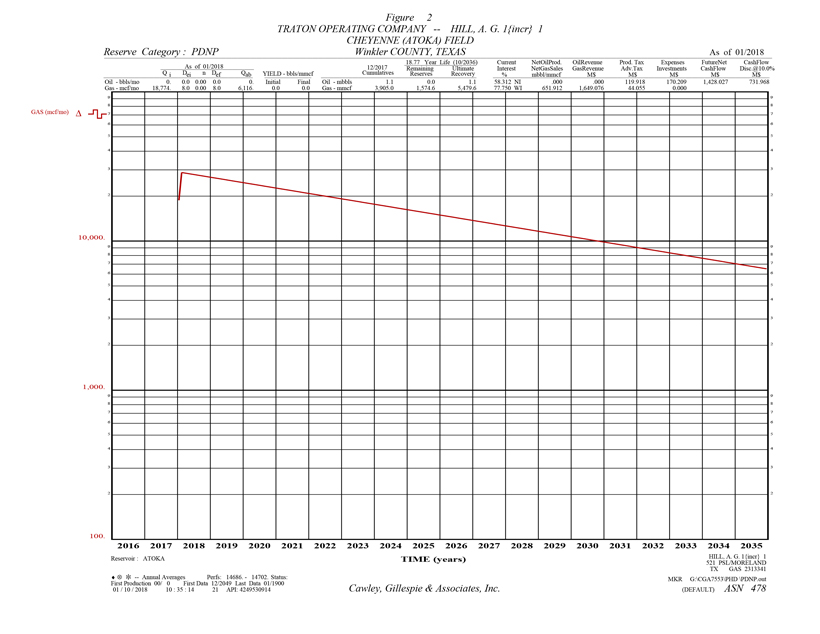
Table 2
Reserve Estimates and Economic Forecasts as of December 31, 2017
Lilis Energy, Inc. Interests
Proved Developed Non-Producing Reserves
TRATON OPERATING COMPANY -- HILL, A. G. 1{INCR} 1
CHEYENNE \(ATOKA\) FIELD -- Winkler COUNTY, TEXAS
| (1) | (2) | (3) | (4) | (5) | (6) | (7) | (8) | (9) | (10) | |
| | Gross Oil | Gross Gas | Gross NGL | Net Oil | Net Gas | Net NGL | Avg Oil | Avg Gas | Avg NGL | |
| End | Production | Production | Production | Production | Sales | Production | Price | Price | Price | |
| Mo-Year | MBBLS | MMCF | MBBLS | MBBLS | MMCF | MBBLS | $/BBL | $/MCF | $/BBL | |
| 12-2018 | .0 | 107.6 | 6.5 | .000 | 44.568 | 3.766 | .000 | 2.530 | 2.054 | |
| 12-2019 | .0 | 108.6 | 6.5 | .000 | 44.971 | 3.800 | .000 | 2.530 | 2.054 | |
| 12-2020 | .0 | 100.2 | 6.0 | .000 | 41.485 | 3.506 | .000 | 2.530 | 2.054 | |
| 12-2021 | .0 | 91.9 | 5.5 | .000 | 38.059 | 3.216 | .000 | 2.530 | 2.054 | |
| 12-2022 | .0 | 84.6 | 5.1 | .000 | 35.017 | 2.959 | .000 | 2.530 | 2.054 | |
| 12-2023 | .0 | 77.8 | 4.7 | .000 | 32.217 | 2.723 | .000 | 2.530 | 2.054 | |
| 12-2024 | .0 | 71.8 | 4.3 | .000 | 29.719 | 2.511 | .000 | 2.530 | 2.054 | |
| 12-2025 | .0 | 65.9 | 4.0 | .000 | 27.266 | 2.304 | .000 | 2.530 | 2.054 | |
| 12-2026 | .0 | 60.6 | 3.6 | .000 | 25.086 | 2.120 | .000 | 2.530 | 2.054 | |
| 12-2027 | .0 | 55.7 | 3.3 | .000 | 23.080 | 1.950 | .000 | 2.530 | 2.054 | |
| 12-2028 | .0 | 51.4 | 3.1 | .000 | 21.291 | 1.799 | .000 | 2.530 | 2.054 | |
| 12-2029 | .0 | 47.2 | 2.8 | .000 | 19.533 | 1.651 | .000 | 2.530 | 2.054 | |
| 12-2030 | .0 | 110.0 | 6.6 | .000 | 45.539 | 3.848 | .000 | 2.530 | 2.054 | |
| 12-2031 | .0 | 113.3 | 6.8 | .000 | 46.893 | 3.963 | .000 | 2.530 | 2.054 | |
| 12-2032 | .0 | 104.5 | 6.3 | .000 | 43.258 | 3.656 | .000 | 2.530 | 2.054 | |
| 12-2033 | .0 | 95.9 | 5.8 | .000 | 39.686 | 3.354 | .000 | 2.530 | 2.054 | |
| 12-2034 | .0 | 88.2 | 5.3 | .000 | 36.513 | 3.086 | .000 | 2.530 | 2.054 | |
| 12-2035 | .0 | 81.1 | 4.9 | .000 | 33.594 | 2.839 | .000 | 2.530 | 2.054 | |
| 10-2036 | .0 | 58.3 | 3.5 | .000 | 24.137 | 2.040 | .000 | 2.530 | 2.054 | |
| S Tot | .0 | 1,574.6 | 94.5 | .000 | 651.912 | 55.091 | .000 | 2.530 | 2.054 | |
| After | .0 | .0 | .0 | .000 | .000 | .000 | .000 | .000 | .000 | |
| Total | .0 | 1,574.6 | 94.5 | .000 | 651.912 | 55.091 | .000 | 2.530 | 2.054 | |
| Cum | 1.1 | 3,905.0 | .0 | | | | | | | |
| Ult | 1.1 | 5,479.6 | 94.5 | | | | | | | |
| (11) | (12) | (13) | (14) | (15) | (16) | (17) | (18) | (19) | (20) | |
| | Oil | Gas | NGL | Hedge | Other | Total | Production | Ad Valorem | | |
| End | Revenue | Revenue | Revenue | Revenue | Revenue | Revenue | Taxes | Taxes | $/BOE6 | |
| Mo-Year | M$ | M$ | M$ | M$ | M$ | M$ | M$ | M$ | | |
| 12-2018 | .000 | 112.738 | 7.734 | 0.000 | 0.000 | 120.473 | .045 | 3.012 | .000 | |
| 12-2019 | .000 | 113.760 | 7.804 | 0.000 | 0.000 | 121.564 | 5.298 | 3.039 | .000 | |
| 12-2020 | .000 | 104.940 | 7.199 | 0.000 | 0.000 | 112.139 | 8.452 | 2.803 | .000 | |
| 12-2021 | .000 | 96.275 | 6.605 | 0.000 | 0.000 | 102.880 | 7.754 | 2.572 | .000 | |
| 12-2022 | .000 | 88.578 | 6.077 | 0.000 | 0.000 | 94.655 | 7.134 | 2.366 | .000 | |
| 12-2023 | .000 | 81.497 | 5.591 | 0.000 | 0.000 | 87.088 | 6.564 | 2.177 | .000 | |
| 12-2024 | .000 | 75.178 | 5.158 | 0.000 | 0.000 | 80.336 | 6.055 | 2.008 | .000 | |
| 12-2025 | .000 | 68.971 | 4.732 | 0.000 | 0.000 | 73.702 | 5.555 | 1.843 | .000 | |
| 12-2026 | .000 | 63.457 | 4.353 | 0.000 | 0.000 | 67.810 | 5.111 | 1.695 | .000 | |
| 12-2027 | .000 | 58.384 | 4.005 | 0.000 | 0.000 | 62.389 | 4.702 | 1.560 | .000 | |
| 12-2028 | .000 | 53.857 | 3.695 | 0.000 | 0.000 | 57.552 | 4.338 | 1.439 | .000 | |
| 12-2029 | .000 | 49.410 | 3.390 | 0.000 | 0.000 | 52.800 | 3.980 | 1.320 | .000 | |
| 12-2030 | .000 | 115.196 | 7.903 | 0.000 | 0.000 | 123.099 | 9.278 | 3.077 | 2.152 | |
| 12-2031 | .000 | 118.621 | 8.138 | 0.000 | 0.000 | 126.759 | 9.554 | 3.169 | 2.480 | |
| 12-2032 | .000 | 109.425 | 7.507 | 0.000 | 0.000 | 116.932 | 8.813 | 2.923 | 2.688 | |
| 12-2033 | .000 | 100.390 | 6.887 | 0.000 | 0.000 | 107.277 | 8.085 | 2.682 | 2.930 | |
| 12-2034 | .000 | 92.364 | 6.337 | 0.000 | 0.000 | 98.700 | 7.439 | 2.468 | 3.185 | |
| 12-2035 | .000 | 84.980 | 5.830 | 0.000 | 0.000 | 90.809 | 6.844 | 2.270 | 3.462 | |
| 10-2036 | .000 | 61.057 | 4.189 | 0.000 | 0.000 | 65.245 | 4.918 | 1.631 | 3.673 | |
| S Tot | .000 | 1,649.076 | 113.133 | 0.000 | 0.000 | 1,762.209 | 119.918 | 44.055 | 1.178 | |
| After | .000 | .000 | .000 | 0.000 | 0.000 | .000 | .000 | .000 | .000 | |
| Total | .000 | 1,649.076 | 113.133 | 0.000 | 0.000 | 1,762.209 | 119.918 | 44.055 | 1.178 | |
| (21) | (22) | (23) | (24) | (25) | (26) | (27) | (28) | (29) | (30) | (31) | |
| | Operating | Wells | Workover | 3rd Party | Other | | Future Net | Cumulative | Cum.Cash Flow | |
| End | Expense | Gross | Net | Expense | COPAS | Deductions | Investment | Cash Flow | Cash Flow | Disc.@ 10. % | |
| Mo-Year | M$ | Count | M$ | M$ | M$ | M$ | M$ | M$ | M$ | |
| 12-2018 | .000 | 1 | 0.8 | 0.000 | 0.000 | 0.000 | .000 | 117.416 | 117.416 | 111.592 | |
| 12-2019 | .000 | 1 | 0.8 | 0.000 | 0.000 | 0.000 | .000 | 113.227 | 230.643 | 209.930 | |
| 12-2020 | .000 | 1 | 0.8 | 0.000 | 0.000 | 0.000 | .000 | 100.884 | 331.527 | 289.503 | |
| 12-2021 | .000 | 1 | 0.8 | 0.000 | 0.000 | 0.000 | .000 | 92.554 | 424.081 | 355.865 | |
| 12-2022 | .000 | 1 | 0.8 | 0.000 | 0.000 | 0.000 | .000 | 85.154 | 509.235 | 411.375 | |
| 12-2023 | .000 | 1 | 0.8 | 0.000 | 0.000 | 0.000 | .000 | 78.347 | 587.582 | 457.807 | |
| 12-2024 | .000 | 1 | 0.8 | 0.000 | 0.000 | 0.000 | .000 | 72.272 | 659.854 | 496.743 | |
| 12-2025 | .000 | 1 | 0.8 | 0.000 | 0.000 | 0.000 | .000 | 66.305 | 726.159 | 529.214 | |
| 12-2026 | .000 | 1 | 0.8 | 0.000 | 0.000 | 0.000 | .000 | 61.004 | 787.163 | 556.375 | |
| 12-2027 | .000 | 1 | 0.8 | 0.000 | 0.000 | 0.000 | .000 | 56.127 | 843.290 | 579.095 | |
| 12-2028 | .000 | 1 | 0.8 | 0.000 | 0.000 | 0.000 | .000 | 51.775 | 895.065 | 598.146 | |
| 12-2029 | .000 | 1 | 0.8 | 0.000 | 0.000 | 0.000 | .000 | 47.500 | 942.566 | 614.035 | |
| 12-2030 | 21.717 | 1 | 0.8 | 0.000 | 0.000 | 0.000 | .000 | 89.027 | 1,031.592 | 641.001 | |
| 12-2031 | 25.769 | 1 | 0.8 | 0.000 | 0.000 | 0.000 | .000 | 88.267 | 1,119.859 | 665.407 | |
| 12-2032 | 25.769 | 1 | 0.8 | 0.000 | 0.000 | 0.000 | .000 | 79.426 | 1,199.285 | 685.372 | |
| 12-2033 | 25.769 | 1 | 0.8 | 0.000 | 0.000 | 0.000 | .000 | 70.740 | 1,270.025 | 701.537 | |
| 12-2034 | 25.769 | 1 | 0.8 | 0.000 | 0.000 | 0.000 | .000 | 63.024 | 1,333.049 | 714.629 | |
| 12-2035 | 25.769 | 1 | 0.8 | 0.000 | 0.000 | 0.000 | .000 | 55.925 | 1,388.974 | 725.192 | |
| 10-2036 | 19.644 | 1 | 0.8 | 0.000 | 0.000 | 0.000 | .000 | 39.052 | 1,428.027 | 731.968 | |
| S Tot | 170.209 | | | 0.000 | 0.000 | 0.000 | .000 | 1,428.027 | 1,428.027 | 731.968 | |
| After | .000 | | | 0.000 | 0.000 | 0.000 | .000 | .000 | 1,428.027 | 731.968 | |
| Total | 170.209 | | | 0.000 | 0.000 | 0.000 | .000 | 1,428.027 | 1,428.027 | 731.968 | |
| Evaluation Parameters (Gross) | | Expenses (Gross) | | Percent Interests | | Percent | Cum. Disc. | |
| | Initial | Final | Units | | Dei | n | Def | | Initial | Final | Units | | | | Final | | 5.00 | 2,147.204 | |
| Gas Rate | 18,835. | 6,835. | Mcf/mo | | 8.0% | 0.00 | 0.0% | | 2,761. | 2,721. | $/w/mo | | Expense | 77.7500 | 77.7500 | | 8.00 | 1,854.416 | |
| Oil Rate | 0. | 0. | bbls/mo | | 0.0% | 0.00 | 0.0% | | | | | | Revenue | | | | 10.00 | 1,698.806 | |
| NGL Rate | 1,147. | 361. | bbls/mo | | | | | | | | | | Oil | 58.3125 | 58.3125 | | 12.00 | 1,567.224 | |
| Cond Yield | 0.0 | 0.0 | bbl/MMcf | | | | | | | | | | Gas | 58.3125 | 58.3125 | | 15.00 | 1,404.751 | |
| NGL Yield | 60.9 | 52.9 | bbl/MMcf | | | | | | | | | | | | | | 20.00 | 1,200.504 | |
| Gas Shrinkage | 29.2 | 36.5 | % | | | | | | | | | | | | | | | | |
| Oil Severance | 0.0 | 0.0 | % | | | | | | | | | | | | | | | | |
| Gas Severance | 0.0 | 7.5 | % | | | | | | | | | | | | | | | | |
| NGL Severance | 0.0 | 7.5 | % | | | | | | | | | | | | | | | | |
| Ad Valorem | 16.9 | | % | | | | | | | | | | | | | | | | |
| | Start Date: 01/2018 | 12 Months in year ‘18 | 18.771 Year Life (10/2036) |
THESE DATA ARE PART OF A CG&A REPORT AND ARE SUBJECT TO THE CONDITIONS IN THE TEXT OF THE REPORT.
TEXAS REGISTERED ENGINEERING FIRM F-693. | ASN 478 | DEFAULT 1/10/2018 10:34:19 GAS PDNP Table 2 |
Cawley, Gillespie & Associates, Inc.
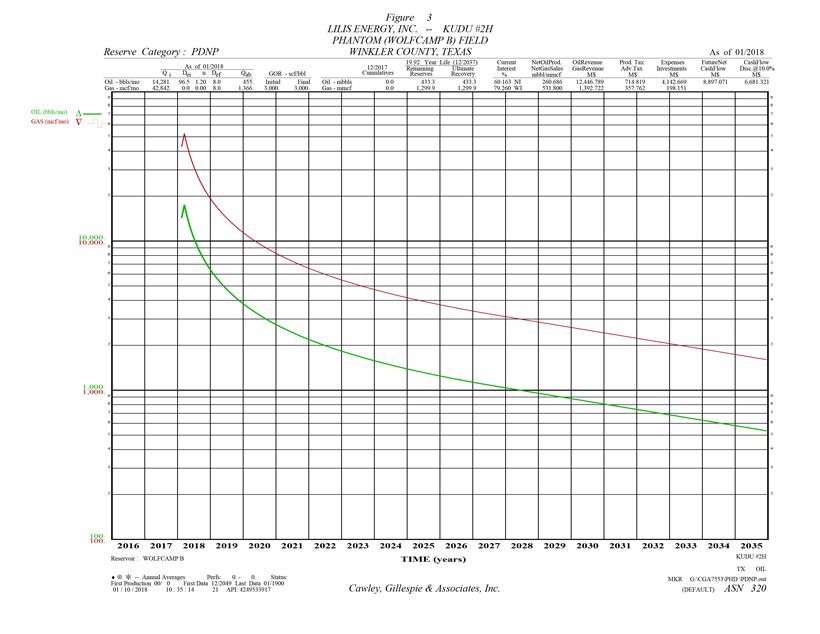
Table 3
Reserve Estimates and Economic Forecasts as of December 31, 2017
Lilis Energy, Inc. Interests
Proved Developed Non-Producing Reserves
LILIS ENERGY, INC. -- KUDU #2H
PHANTOM (WOLFCAMP B) FIELD -- WINKLER COUNTY, TEXAS
| (1) | (2) | (3) | (4) | (5) | (6) | (7) | (8) | (9) | (10) | |
| | Gross Oil | Gross Gas | Gross NGL | Net Oil | Net Gas | Net NGL | Avg Oil | Avg Gas | Avg NGL | |
| End | Production | Production | Production | Production | Sales | Production | Price | Price | Price | |
| Mo-Year | MBBLS | MMCF | MBBLS | MBBLS | MMCF | MBBLS | $/BBL | $/MCF | $/BBL | |
| 12-2018 | 117.9 | 353.6 | 24.4 | 70.906 | 144.648 | 14.678 | 47.746 | 2.619 | 8.728 | |
| 12-2019 | 58.3 | 174.8 | 12.1 | 35.052 | 71.506 | 7.256 | 47.746 | 2.619 | 8.728 | |
| 12-2020 | 38.7 | 116.0 | 8.0 | 23.264 | 47.458 | 4.816 | 47.746 | 2.619 | 8.728 | |
| 12-2021 | 29.4 | 88.1 | 6.1 | 17.668 | 36.042 | 3.657 | 47.746 | 2.619 | 8.728 | |
| 12-2022 | 23.9 | 71.8 | 5.0 | 14.407 | 29.390 | 2.982 | 47.746 | 2.619 | 8.728 | |
| 12-2023 | 20.3 | 61.0 | 4.2 | 12.233 | 24.956 | 2.532 | 47.746 | 2.619 | 8.728 | |
| 12-2024 | 17.8 | 53.4 | 3.7 | 10.699 | 21.827 | 2.215 | 47.746 | 2.619 | 8.728 | |
| 12-2025 | 15.8 | 47.3 | 3.3 | 9.489 | 19.357 | 1.964 | 47.746 | 2.619 | 8.728 | |
| 12-2026 | 14.2 | 42.7 | 2.9 | 8.563 | 17.468 | 1.772 | 47.746 | 2.619 | 8.728 | |
| 12-2027 | 13.0 | 39.0 | 2.7 | 7.815 | 15.942 | 1.618 | 47.746 | 2.619 | 8.728 | |
| 12-2028 | 12.0 | 35.9 | 2.5 | 7.202 | 14.692 | 1.491 | 47.746 | 2.619 | 8.728 | |
| 12-2029 | 11.0 | 32.9 | 2.3 | 6.607 | 13.479 | 1.368 | 47.746 | 2.619 | 8.728 | |
| 12-2030 | 10.1 | 30.3 | 2.1 | 6.079 | 12.402 | 1.258 | 47.746 | 2.619 | 8.728 | |
| 12-2031 | 9.3 | 27.9 | 1.9 | 5.593 | 11.410 | 1.158 | 47.746 | 2.619 | 8.728 | |
| 12-2032 | 8.6 | 25.7 | 1.8 | 5.160 | 10.525 | 1.068 | 47.746 | 2.619 | 8.728 | |
| 12-2033 | 7.9 | 23.6 | 1.6 | 4.734 | 9.656 | .980 | 47.746 | 2.619 | 8.728 | |
| 12-2034 | 7.2 | 21.7 | 1.5 | 4.355 | 8.884 | .902 | 47.746 | 2.619 | 8.728 | |
| 12-2035 | 6.7 | 20.0 | 1.4 | 4.007 | 8.174 | .829 | 47.746 | 2.619 | 8.728 | |
| 12-2036 | 6.1 | 18.4 | 1.3 | 3.696 | 7.540 | .765 | 47.746 | 2.619 | 8.728 | |
| S Tot | 428.0 | 1,284.1 | 88.6 | 257.528 | 525.357 | 53.308 | 47.746 | 2.619 | 8.728 | |
| After | 5.3 | 15.8 | 1.1 | 3.159 | 6.444 | .654 | 47.746 | 2.619 | 8.728 | |
| Total | 433.3 | 1,299.9 | 89.7 | 260.686 | 531.800 | 53.962 | 47.746 | 2.619 | 8.728 | |
| Cum | .0 | .0 | .0 | | | | | | | |
| Ult | 433.3 | 1,299.9 | 89.7 | | | | | | | |
| (11) | (12) | (13) | (14) | (15) | (16) | (17) | (18) | (19) | (20) | |
| | Oil | Gas | NGL | Hedge | Other | Total | Production | Ad Valorem | | |
| End | Revenue | Revenue | Revenue | Revenue | Revenue | Revenue | Taxes | Taxes | $/BOE6 | |
| Mo-Year | M$ | M$ | M$ | M$ | M$ | M$ | M$ | M$ | | |
| 12-2018 | 3,385.484 | 378.816 | 128.100 | 0.000 | 0.000 | 3,892.400 | 194.428 | 97.310 | 4.226 | |
| 12-2019 | 1,673.608 | 187.267 | 63.326 | 0.000 | 0.000 | 1,924.201 | 96.115 | 48.105 | 5.875 | |
| 12-2020 | 1,110.761 | 124.288 | 42.029 | 0.000 | 0.000 | 1,277.077 | 63.791 | 31.927 | 7.367 | |
| 12-2021 | 843.570 | 94.390 | 31.919 | 0.000 | 0.000 | 969.880 | 48.446 | 24.247 | 8.772 | |
| 12-2022 | 687.865 | 76.968 | 26.027 | 0.000 | 0.000 | 790.860 | 39.504 | 19.772 | 10.094 | |
| 12-2023 | 584.087 | 65.356 | 22.101 | 0.000 | 0.000 | 671.543 | 33.544 | 16.789 | 11.367 | |
| 12-2024 | 510.852 | 57.161 | 19.330 | 0.000 | 0.000 | 587.343 | 29.338 | 14.684 | 12.576 | |
| 12-2025 | 453.040 | 50.692 | 17.142 | 0.000 | 0.000 | 520.875 | 26.018 | 13.022 | 13.807 | |
| 12-2026 | 408.829 | 45.746 | 15.469 | 0.000 | 0.000 | 470.044 | 23.479 | 11.751 | 14.983 | |
| 12-2027 | 373.122 | 41.750 | 14.118 | 0.000 | 0.000 | 428.991 | 21.428 | 10.725 | 16.137 | |
| 12-2028 | 343.872 | 38.477 | 13.011 | 0.000 | 0.000 | 395.361 | 19.749 | 9.884 | 17.260 | |
| 12-2029 | 315.480 | 35.300 | 11.937 | 0.000 | 0.000 | 362.717 | 18.118 | 9.068 | 18.550 | |
| 12-2030 | 290.258 | 32.478 | 10.983 | 0.000 | 0.000 | 333.719 | 16.670 | 8.343 | 19.907 | |
| 12-2031 | 267.053 | 29.882 | 10.105 | 0.000 | 0.000 | 307.039 | 15.337 | 7.676 | 21.382 | |
| 12-2032 | 246.348 | 27.565 | 9.321 | 0.000 | 0.000 | 283.234 | 14.148 | 7.081 | 22.933 | |
| 12-2033 | 226.008 | 25.289 | 8.552 | 0.000 | 0.000 | 259.848 | 12.980 | 6.496 | 24.733 | |
| 12-2034 | 207.939 | 23.267 | 7.868 | 0.000 | 0.000 | 239.074 | 11.942 | 5.977 | 26.628 | |
| 12-2035 | 191.315 | 21.407 | 7.239 | 0.000 | 0.000 | 219.961 | 10.987 | 5.499 | 28.687 | |
| 12-2036 | 176.482 | 19.747 | 6.678 | 0.000 | 0.000 | 202.907 | 10.135 | 5.073 | 30.852 | |
| S Tot | 12,295.971 | 1,375.846 | 465.254 | 0.000 | 0.000 | 14,137.072 | 706.157 | 353.427 | 10.501 | |
| After | 150.818 | 16.876 | 5.707 | 0.000 | 0.000 | 173.400 | 8.661 | 4.335 | 33.320 | |
| Total | 12,446.789 | 1,392.722 | 470.961 | 0.000 | 0.000 | 14,310.472 | 714.819 | 357.762 | 10.777 | |
| (21) | (22) | (23) | (24) | (25) | (26) | (27) | (28) | (29) | (30) | (31) | |
| | Operating | Wells | Workover | 3rd Party | Other | | Future Net | Cumulative | Cum.Cash Flow | |
| End | Expense | Gross | Net | Expense | COPAS | Deductions | Investment | Cash Flow | Cash Flow | Disc.@ 10. % | |
| Mo-Year | M$ | Count | M$ | M$ | M$ | M$ | M$ | M$ | M$ | |
| 12-2018 | 135.422 | 1 | 0.8 | 0.000 | 0.000 | 306.394 | 198.151 | 2,960.694 | 2,960.694 | 2,827.567 | |
| 12-2019 | 152.180 | 1 | 0.8 | 0.000 | 0.000 | 151.465 | .000 | 1,476.335 | 4,437.029 | 4,113.523 | |
| 12-2020 | 152.180 | 1 | 0.8 | 0.000 | 0.000 | 100.526 | .000 | 928.653 | 5,365.682 | 4,847.663 | |
| 12-2021 | 152.180 | 1 | 0.8 | 0.000 | 0.000 | 76.345 | .000 | 668.661 | 6,034.344 | 5,327.830 | |
| 12-2022 | 152.180 | 1 | 0.8 | 0.000 | 0.000 | 62.253 | .000 | 517.151 | 6,551.495 | 5,665.323 | |
| 12-2023 | 152.180 | 1 | 0.8 | 0.000 | 0.000 | 52.861 | .000 | 416.169 | 6,967.664 | 5,912.177 | |
| 12-2024 | 152.180 | 1 | 0.8 | 0.000 | 0.000 | 46.233 | .000 | 344.908 | 7,312.572 | 6,098.125 | |
| 12-2025 | 152.180 | 1 | 0.8 | 0.000 | 0.000 | 41.001 | .000 | 288.654 | 7,601.225 | 6,239.564 | |
| 12-2026 | 152.180 | 1 | 0.8 | 0.000 | 0.000 | 37.000 | .000 | 245.634 | 7,846.859 | 6,348.978 | |
| 12-2027 | 152.180 | 1 | 0.8 | 0.000 | 0.000 | 33.768 | .000 | 210.889 | 8,057.748 | 6,434.374 | |
| 12-2028 | 152.180 | 1 | 0.8 | 0.000 | 0.000 | 31.121 | .000 | 182.427 | 8,240.175 | 6,501.532 | |
| 12-2029 | 152.180 | 1 | 0.8 | 0.000 | 0.000 | 28.552 | .000 | 154.800 | 8,394.975 | 6,553.334 | |
| 12-2030 | 152.180 | 1 | 0.8 | 0.000 | 0.000 | 26.269 | .000 | 130.257 | 8,525.232 | 6,592.966 | |
| 12-2031 | 152.180 | 1 | 0.8 | 0.000 | 0.000 | 24.169 | .000 | 107.677 | 8,632.910 | 6,622.755 | |
| 12-2032 | 152.180 | 1 | 0.8 | 0.000 | 0.000 | 22.295 | .000 | 87.530 | 8,720.440 | 6,644.774 | |
| 12-2033 | 152.180 | 1 | 0.8 | 0.000 | 0.000 | 20.454 | .000 | 67.738 | 8,788.178 | 6,660.265 | |
| 12-2034 | 152.180 | 1 | 0.8 | 0.000 | 0.000 | 18.819 | .000 | 50.156 | 8,838.334 | 6,670.697 | |
| 12-2035 | 152.180 | 1 | 0.8 | 0.000 | 0.000 | 17.314 | .000 | 33.980 | 8,872.314 | 6,677.127 | |
| 12-2036 | 152.180 | 1 | 0.8 | 0.000 | 0.000 | 15.972 | .000 | 19.547 | 8,891.861 | 6,680.496 | |
| S Tot | 2,874.662 | | | 0.000 | 0.000 | 1,112.814 | 198.151 | 8,891.861 | 8,891.861 | 6,680.496 | |
| After | 141.544 | | | 0.000 | 0.000 | 13.649 | .000 | 5.210 | 8,897.071 | 6,681.321 | |
| Total | 3,016.206 | | | 0.000 | 0.000 | 1,126.463 | 198.151 | 8,897.071 | 8,897.071 | 6,681.321 | |
| Evaluation Parameters (Gross) | | Expenses (Gross) | | Percent Interests | | Percent | Cum. Disc. | |
| | Initial | Final | Units | | Dei | n | Def | | Initial | Final | Units | | | | Final | | 5.00 | 7,581.893 | |
| Oil Rate | 22,812. | 453. | bbls/mo | | 96.5% | 1.20 | 0.0% | | 10,856. | 15,999. | $/w/mo | | Expense | 79.2604 | 79.2604 | | 8.00 | 7,004.908 | |
| Gas Rate | 68,437. | 1,360. | Mcf/mo | | 0.0% | 0.00 | 0.0% | | | | | | Revenue | | | | 10.00 | 6,681.321 | |
| GOR | 3,000. | 3,000. | scf/bbl | | | | | | | | | | Oil | 60.1633 | 60.1633 | | 12.00 | 6,396.397 | |
| NGL Rate | 2,719. | 92. | bbls/mo | | | | | | | | | | Gas | 60.1633 | 60.1633 | | 15.00 | 6,027.436 | |
| NGL Yield | 39.7 | 68.3 | bbl/MMcf | | | | | | | | | | | | | | 20.00 | 5,529.989 | |
| Gas Shrinkage | 57.4 | 31.8 | % | | | | | | | | | | | | | | | | |
| Oil Severance | 4.6 | 4.6 | % | | | | | | | | | | | | | | | | |
| Gas Severance | 7.5 | 7.5 | % | | | | | | | | | | | | | | | | |
| NGL Severance | 7.5 | 7.5 | % | | | | | | | | | | | | | | | | |
| Ad Valorem | 37.1 | | % | | | | | | | | | | | | | | | | |
| | Start Date: 02/2018 | 11 Months in year ‘18 | 19.846 Year Life (12/2037) |
THESE DATA ARE PART OF A CG&A REPORT AND ARE SUBJECT TO THE CONDITIONS IN THE TEXT OF THE REPORT.
TEXAS REGISTERED ENGINEERING FIRM F-693. | ASN 320 | DEFAULT 1/10/2018 10:34:19 OIL PDNP Table 3 |
Cawley, Gillespie & Associates, Inc.
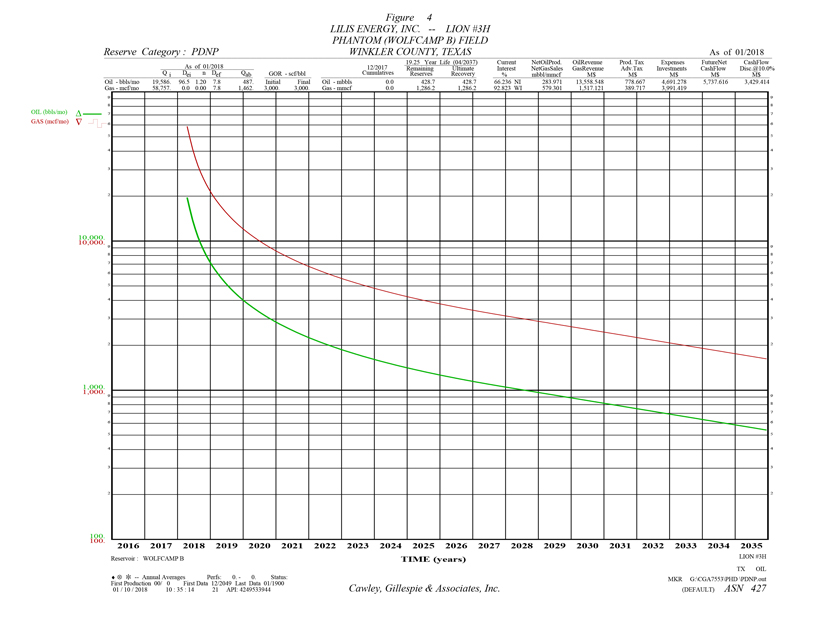
Table 4
Reserve Estimates and Economic Forecasts as of December 31, 2017
Lilis Energy, Inc. Interests
Proved Developed Non-Producing Reserves
LILIS ENERGY, INC. -- LION #3H
PHANTOM (WOLFCAMP B) FIELD -- WINKLER COUNTY, TEXAS
| (1) | (2) | (3) | (4) | (5) | (6) | (7) | (8) | (9) | (10) | |
| | Gross Oil | Gross Gas | Gross NGL | Net Oil | Net Gas | Net NGL | Avg Oil | Avg Gas | Avg NGL | |
| End | Production | Production | Production | Production | Sales | Production | Price | Price | Price | |
| Mo-Year | MBBLS | MMCF | MBBLS | MBBLS | MMCF | MBBLS | $/BBL | $/MCF | $/BBL | |
| 12-2018 | 106.5 | 319.5 | 22.0 | 70.546 | 143.913 | 14.603 | 47.746 | 2.619 | 8.728 | |
| 12-2019 | 63.1 | 189.2 | 13.1 | 41.776 | 85.222 | 8.648 | 47.746 | 2.619 | 8.728 | |
| 12-2020 | 40.5 | 121.5 | 8.4 | 26.829 | 54.731 | 5.554 | 47.746 | 2.619 | 8.728 | |
| 12-2021 | 30.4 | 91.1 | 6.3 | 20.104 | 41.012 | 4.162 | 47.746 | 2.619 | 8.728 | |
| 12-2022 | 24.6 | 73.7 | 5.1 | 16.273 | 33.198 | 3.369 | 47.746 | 2.619 | 8.728 | |
| 12-2023 | 20.8 | 62.3 | 4.3 | 13.754 | 28.058 | 2.847 | 47.746 | 2.619 | 8.728 | |
| 12-2024 | 18.1 | 54.3 | 3.7 | 11.991 | 24.461 | 2.482 | 47.746 | 2.619 | 8.728 | |
| 12-2025 | 16.0 | 48.0 | 3.3 | 10.609 | 21.642 | 2.196 | 47.746 | 2.619 | 8.728 | |
| 12-2026 | 14.4 | 43.3 | 3.0 | 9.556 | 19.494 | 1.978 | 47.746 | 2.619 | 8.728 | |
| 12-2027 | 13.1 | 39.4 | 2.7 | 8.709 | 17.767 | 1.803 | 47.746 | 2.619 | 8.728 | |
| 12-2028 | 12.1 | 36.3 | 2.5 | 8.022 | 16.365 | 1.661 | 47.746 | 2.619 | 8.728 | |
| 12-2029 | 11.1 | 33.3 | 2.3 | 7.360 | 15.014 | 1.523 | 47.746 | 2.619 | 8.728 | |
| 12-2030 | 10.2 | 30.7 | 2.1 | 6.771 | 13.813 | 1.402 | 47.746 | 2.619 | 8.728 | |
| 12-2031 | 9.4 | 28.2 | 1.9 | 6.230 | 12.709 | 1.290 | 47.746 | 2.619 | 8.728 | |
| 12-2032 | 8.7 | 26.0 | 1.8 | 5.747 | 11.724 | 1.190 | 47.746 | 2.619 | 8.728 | |
| 12-2033 | 8.0 | 23.9 | 1.6 | 5.272 | 10.756 | 1.091 | 47.746 | 2.619 | 8.728 | |
| 12-2034 | 7.3 | 22.0 | 1.5 | 4.851 | 9.896 | 1.004 | 47.746 | 2.619 | 8.728 | |
| 12-2035 | 6.7 | 20.2 | 1.4 | 4.463 | 9.105 | .924 | 47.746 | 2.619 | 8.728 | |
| 12-2036 | 6.2 | 18.6 | 1.3 | 4.117 | 8.399 | .852 | 47.746 | 2.619 | 8.728 | |
| S Tot | 427.2 | 1,281.7 | 88.4 | 282.979 | 577.277 | 58.577 | 47.746 | 2.619 | 8.728 | |
| After | 1.5 | 4.5 | .3 | .992 | 2.025 | .205 | 47.746 | 2.619 | 8.728 | |
| Total | 428.7 | 1,286.2 | 88.7 | 283.971 | 579.301 | 58.782 | 47.746 | 2.619 | 8.728 | |
| Cum | .0 | .0 | .0 | | | | | | | |
| Ult | 428.7 | 1,286.2 | 88.7 | | | | | | | |
| (11) | (12) | (13) | (14) | (15) | (16) | (17) | (18) | (19) | (20) | |
| | Oil | Gas | NGL | Hedge | Other | Total | Production | Ad Valorem | | |
| End | Revenue | Revenue | Revenue | Revenue | Revenue | Revenue | Taxes | Taxes | $/BOE6 | |
| Mo-Year | M$ | M$ | M$ | M$ | M$ | M$ | M$ | M$ | | |
| 12-2018 | 3,368.280 | 376.890 | 127.449 | 0.000 | 0.000 | 3,872.620 | 193.440 | 96.815 | 4.397 | |
| 12-2019 | 1,994.627 | 223.187 | 75.473 | 0.000 | 0.000 | 2,293.287 | 114.551 | 57.332 | 6.010 | |
| 12-2020 | 1,280.968 | 143.333 | 48.469 | 0.000 | 0.000 | 1,472.769 | 73.566 | 36.819 | 7.622 | |
| 12-2021 | 959.888 | 107.406 | 36.320 | 0.000 | 0.000 | 1,103.614 | 55.126 | 27.590 | 9.129 | |
| 12-2022 | 776.988 | 86.940 | 29.400 | 0.000 | 0.000 | 893.328 | 44.622 | 22.333 | 10.544 | |
| 12-2023 | 656.699 | 73.481 | 24.848 | 0.000 | 0.000 | 755.028 | 37.714 | 18.876 | 11.905 | |
| 12-2024 | 572.511 | 64.061 | 21.663 | 0.000 | 0.000 | 658.234 | 32.879 | 16.456 | 13.197 | |
| 12-2025 | 506.523 | 56.677 | 19.166 | 0.000 | 0.000 | 582.365 | 29.090 | 14.559 | 14.510 | |
| 12-2026 | 456.268 | 51.054 | 17.264 | 0.000 | 0.000 | 524.586 | 26.203 | 13.115 | 15.765 | |
| 12-2027 | 415.826 | 46.528 | 15.734 | 0.000 | 0.000 | 478.088 | 23.881 | 11.952 | 16.995 | |
| 12-2028 | 383.021 | 42.858 | 14.493 | 0.000 | 0.000 | 440.371 | 21.997 | 11.009 | 18.184 | |
| 12-2029 | 351.395 | 39.319 | 13.296 | 0.000 | 0.000 | 404.011 | 20.181 | 10.100 | 19.540 | |
| 12-2030 | 323.302 | 36.176 | 12.233 | 0.000 | 0.000 | 371.711 | 18.567 | 9.293 | 20.967 | |
| 12-2031 | 297.455 | 33.283 | 11.255 | 0.000 | 0.000 | 341.994 | 17.083 | 8.550 | 22.518 | |
| 12-2032 | 274.393 | 30.703 | 10.382 | 0.000 | 0.000 | 315.479 | 15.758 | 7.887 | 24.149 | |
| 12-2033 | 251.737 | 28.168 | 9.525 | 0.000 | 0.000 | 289.430 | 14.457 | 7.236 | 26.041 | |
| 12-2034 | 231.611 | 25.916 | 8.764 | 0.000 | 0.000 | 266.291 | 13.301 | 6.657 | 28.033 | |
| 12-2035 | 213.095 | 23.844 | 8.063 | 0.000 | 0.000 | 245.002 | 12.238 | 6.125 | 30.198 | |
| 12-2036 | 196.573 | 21.995 | 7.438 | 0.000 | 0.000 | 226.007 | 11.289 | 5.650 | 32.474 | |
| S Tot | 13,511.162 | 1,511.818 | 511.235 | 0.000 | 0.000 | 15,534.215 | 775.946 | 388.355 | 11.125 | |
| After | 47.387 | 5.302 | 1.793 | 0.000 | 0.000 | 54.482 | 2.721 | 1.362 | 33.750 | |
| Total | 13,558.548 | 1,517.121 | 513.028 | 0.000 | 0.000 | 15,588.697 | 778.667 | 389.717 | 11.204 | |
| (21) | (22) | (23) | (24) | (25) | (26) | (27) | (28) | (29) | (30) | (31) | |
| | Operating | Wells | Workover | 3rd Party | Other | | Future Net | Cumulative | Cum.Cash Flow | |
| End | Expense | Gross | Net | Expense | COPAS | Deductions | Investment | Cash Flow | Cash Flow | Disc.@ 10. % | |
| Mo-Year | M$ | Count | M$ | M$ | M$ | M$ | M$ | M$ | M$ | |
| 12-2018 | 133.171 | 1 | 0.9 | 0.000 | 0.000 | 324.266 | 3,991.419 | -866.492 | -866.492 | -932.695 | |
| 12-2019 | 178.221 | 1 | 0.9 | 0.000 | 0.000 | 192.024 | .000 | 1,751.158 | 884.666 | 593.319 | |
| 12-2020 | 178.221 | 1 | 0.9 | 0.000 | 0.000 | 123.320 | .000 | 1,060.843 | 1,945.509 | 1,432.110 | |
| 12-2021 | 178.221 | 1 | 0.9 | 0.000 | 0.000 | 92.409 | .000 | 750.267 | 2,695.776 | 1,970.936 | |
| 12-2022 | 178.221 | 1 | 0.9 | 0.000 | 0.000 | 74.801 | .000 | 573.350 | 3,269.126 | 2,345.133 | |
| 12-2023 | 178.221 | 1 | 0.9 | 0.000 | 0.000 | 63.221 | .000 | 456.996 | 3,726.121 | 2,616.221 | |
| 12-2024 | 178.221 | 1 | 0.9 | 0.000 | 0.000 | 55.116 | .000 | 375.562 | 4,101.683 | 2,818.708 | |
| 12-2025 | 178.221 | 1 | 0.9 | 0.000 | 0.000 | 48.763 | .000 | 311.732 | 4,413.415 | 2,971.464 | |
| 12-2026 | 178.221 | 1 | 0.9 | 0.000 | 0.000 | 43.925 | .000 | 263.121 | 4,676.536 | 3,088.673 | |
| 12-2027 | 178.221 | 1 | 0.9 | 0.000 | 0.000 | 40.032 | .000 | 224.002 | 4,900.538 | 3,179.384 | |
| 12-2028 | 178.221 | 1 | 0.9 | 0.000 | 0.000 | 36.874 | .000 | 192.270 | 5,092.808 | 3,250.168 | |
| 12-2029 | 178.221 | 1 | 0.9 | 0.000 | 0.000 | 33.829 | .000 | 161.679 | 5,254.487 | 3,304.275 | |
| 12-2030 | 178.221 | 1 | 0.9 | 0.000 | 0.000 | 31.125 | .000 | 134.505 | 5,388.992 | 3,345.203 | |
| 12-2031 | 178.221 | 1 | 0.9 | 0.000 | 0.000 | 28.636 | .000 | 109.503 | 5,498.495 | 3,375.500 | |
| 12-2032 | 178.221 | 1 | 0.9 | 0.000 | 0.000 | 26.416 | .000 | 87.196 | 5,585.691 | 3,397.439 | |
| 12-2033 | 178.221 | 1 | 0.9 | 0.000 | 0.000 | 24.235 | .000 | 65.281 | 5,650.972 | 3,412.371 | |
| 12-2034 | 178.221 | 1 | 0.9 | 0.000 | 0.000 | 22.297 | .000 | 45.814 | 5,696.785 | 3,421.903 | |
| 12-2035 | 178.221 | 1 | 0.9 | 0.000 | 0.000 | 20.515 | .000 | 27.903 | 5,724.688 | 3,427.188 | |
| 12-2036 | 178.221 | 1 | 0.9 | 0.000 | 0.000 | 18.924 | .000 | 11.922 | 5,736.609 | 3,429.251 | |
| S Tot | 3,341.158 | | | 0.000 | 0.000 | 1,300.728 | 3,991.419 | 5,736.609 | 5,736.609 | 3,429.251 | |
| After | 44.830 | | | 0.000 | 0.000 | 4.562 | .000 | 1.007 | 5,737.616 | 3,429.414 | |
| Total | 3,385.988 | | | 0.000 | 0.000 | 1,305.290 | 3,991.419 | 5,737.616 | 5,737.616 | 3,429.414 | |
| Evaluation Parameters (Gross) | | Expenses (Gross) | | Percent Interests | | Percent | Cum. Disc. | |
| | Initial | Final | Units | | Dei | n | Def | | Initial | Final | Units | | | | Final | | 5.00 | 4,368.771 | |
| Oil Rate | 22,812. | 485. | bbls/mo | | 96.5% | 1.20 | 0.0% | | 15,465. | 15,999. | $/w/mo | | Expense | 92.8237 | 92.8237 | | 8.00 | 3,766.881 | |
| Gas Rate | 68,437. | 1,455. | Mcf/mo | | 0.0% | 0.00 | 0.0% | | | | | | Revenue | | | | 10.00 | 3,429.414 | |
| GOR | 3,000. | 3,000. | scf/bbl | | | | | | | | | | Oil | 66.2369 | 66.2369 | | 12.00 | 3,132.557 | |
| NGL Rate | 3,996. | 102. | bbls/mo | | | | | | | | | | Gas | 66.2369 | 66.2369 | | 15.00 | 2,748.922 | |
| NGL Yield | 58.4 | 70.6 | bbl/MMcf | | | | | | | | | | | | | | 20.00 | 2,234.147 | |
| Gas Shrinkage | 41.6 | 31.9 | % | | | | | | | | | | | | | | | | |
| Oil Severance | 4.6 | 4.6 | % | | | | | | | | | | | | | | | | |
| Gas Severance | 7.5 | 7.5 | % | | | | | | | | | | | | | | | | |
| NGL Severance | 7.5 | 7.5 | % | | | | | | | | | | | | | | | | |
| Ad Valorem | 45.1 | | % | | | | | | | | | | | | | | | | |
| | Start Date: 04/2018 | 9 Months in year ‘18 | 19.005 Year Life (04/2037) |
THESE DATA ARE PART OF A CG&A REPORT AND ARE SUBJECT TO THE CONDITIONS IN THE TEXT OF THE REPORT.
TEXAS REGISTERED ENGINEERING FIRM F-693. | ASN 427 | DEFAULT 1/10/2018 10:34:19 OIL PDNP Table 4 |
Cawley, Gillespie & Associates, Inc.
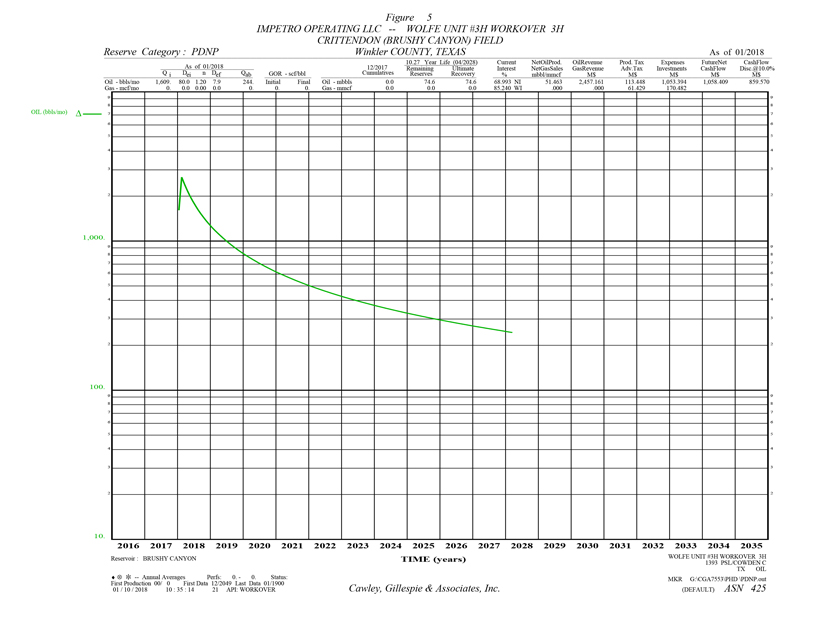
Table 5
Reserve Estimates and Economic Forecasts as of December 31, 2017
Lilis Energy, Inc. Interests
Proved Developed Non-Producing Reserves
IMPETRO OPERATING LLC -- WOLFE UNIT #3H WORKOVER 3H
CRITTENDON \(BRUSHY CANYON\) FIELD -- Winkler COUNTY, TEXAS
| (1) | (2) | (3) | (4) | (5) | (6) | (7) | (8) | (9) | (10) | |
| | Gross Oil | Gross Gas | Gross NGL | Net Oil | Net Gas | Net NGL | Avg Oil | Avg Gas | Avg NGL | |
| End | Production | Production | Production | Production | Sales | Production | Price | Price | Price | |
| Mo-Year | MBBLS | MMCF | MBBLS | MBBLS | MMCF | MBBLS | $/BBL | $/MCF | $/BBL | |
| 12-2018 | 21.7 | .0 | .0 | 14.953 | .000 | .000 | 47.746 | .000 | .000 | |
| 12-2019 | 12.1 | .0 | .0 | 8.373 | .000 | .000 | 47.746 | .000 | .000 | |
| 12-2020 | 8.6 | .0 | .0 | 5.914 | .000 | .000 | 47.746 | .000 | .000 | |
| 12-2021 | 6.7 | .0 | .0 | 4.618 | .000 | .000 | 47.746 | .000 | .000 | |
| 12-2022 | 5.5 | .0 | .0 | 3.826 | .000 | .000 | 47.746 | .000 | .000 | |
| 12-2023 | 4.8 | .0 | .0 | 3.283 | .000 | .000 | 47.746 | .000 | .000 | |
| 12-2024 | 4.2 | .0 | .0 | 2.892 | .000 | .000 | 47.746 | .000 | .000 | |
| 12-2025 | 3.7 | .0 | .0 | 2.578 | .000 | .000 | 47.746 | .000 | .000 | |
| 12-2026 | 3.4 | .0 | .0 | 2.337 | .000 | .000 | 47.746 | .000 | .000 | |
| 12-2027 | 3.1 | .0 | .0 | 2.139 | .000 | .000 | 47.746 | .000 | .000 | |
| 04-2028 | .8 | .0 | .0 | .550 | .000 | .000 | 47.746 | .000 | .000 | |
| 12-2029 | | | | | | | | | | |
| 12-2030 | | | | | | | | | | |
| 12-2031 | | | | | | | | | | |
| 12-2032 | | | | | | | | | | |
| 12-2033 | | | | | | | | | | |
| 12-2034 | | | | | | | | | | |
| 12-2035 | | | | | | | | | | |
| 12-2036 | | | | | | | | | | |
| S Tot | 74.6 | .0 | .0 | 51.463 | .000 | .000 | 47.746 | .000 | .000 | |
| After | .0 | .0 | .0 | .000 | .000 | .000 | .000 | .000 | .000 | |
| Total | 74.6 | .0 | .0 | 51.463 | .000 | .000 | 47.746 | .000 | .000 | |
| Cum | .0 | .0 | .0 | | | | | | | |
| Ult | 74.6 | .0 | .0 | | | | | | | |
| (11) | (12) | (13) | (14) | (15) | (16) | (17) | (18) | (19) | (20) | |
| | Oil | Gas | NGL | Hedge | Other | Total | Production | Ad Valorem | | |
| End | Revenue | Revenue | Revenue | Revenue | Revenue | Revenue | Taxes | Taxes | $/BOE6 | |
| Mo-Year | M$ | M$ | M$ | M$ | M$ | M$ | M$ | M$ | | |
| 12-2018 | 713.942 | .000 | .000 | 0.000 | 0.000 | 713.942 | 32.963 | 17.849 | 9.743 | |
| 12-2019 | 399.801 | .000 | .000 | 0.000 | 0.000 | 399.801 | 18.459 | 9.995 | 14.137 | |
| 12-2020 | 282.365 | .000 | .000 | 0.000 | 0.000 | 282.365 | 13.037 | 7.059 | 18.100 | |
| 12-2021 | 220.495 | .000 | .000 | 0.000 | 0.000 | 220.495 | 10.180 | 5.512 | 21.885 | |
| 12-2022 | 182.678 | .000 | .000 | 0.000 | 0.000 | 182.678 | 8.434 | 4.567 | 25.462 | |
| 12-2023 | 156.728 | .000 | .000 | 0.000 | 0.000 | 156.728 | 7.236 | 3.918 | 28.914 | |
| 12-2024 | 138.077 | .000 | .000 | 0.000 | 0.000 | 138.077 | 6.375 | 3.452 | 32.198 | |
| 12-2025 | 123.113 | .000 | .000 | 0.000 | 0.000 | 123.113 | 5.684 | 3.078 | 35.551 | |
| 12-2026 | 111.561 | .000 | .000 | 0.000 | 0.000 | 111.561 | 5.151 | 2.789 | 38.755 | |
| 12-2027 | 102.139 | .000 | .000 | 0.000 | 0.000 | 102.139 | 4.716 | 2.553 | 41.905 | |
| 04-2028 | 26.262 | .000 | .000 | 0.000 | 0.000 | 26.262 | 1.213 | .657 | 43.479 | |
| 12-2029 | | | | | | | | | | |
| 12-2030 | | | | | | | | | | |
| 12-2031 | | | | | | | | | | |
| 12-2032 | | | | | | | | | | |
| 12-2033 | | | | | | | | | | |
| 12-2034 | | | | | | | | | | |
| 12-2035 | | | | | | | | | | |
| 12-2036 | | | | | | | | | | |
| S Tot | 2,457.161 | .000 | .000 | 0.000 | 0.000 | 2,457.161 | 113.448 | 61.429 | 20.469 | |
| After | .000 | .000 | .000 | 0.000 | 0.000 | .000 | .000 | .000 | .000 | |
| Total | 2,457.161 | .000 | .000 | 0.000 | 0.000 | 2,457.161 | 113.448 | 61.429 | 20.469 | |
| (21) | (22) | (23) | (24) | (25) | (26) | (27) | (28) | (29) | (30) | (31) | |
| | Operating | Wells | Workover | 3rd Party | Other | | Future Net | Cumulative | Cum.Cash Flow | |
| End | Expense | Gross | Net | Expense | COPAS | Deductions | Investment | Cash Flow | Cash Flow | Disc.@ 10. % | |
| Mo-Year | M$ | Count | M$ | M$ | M$ | M$ | M$ | M$ | M$ | |
| 12-2018 | 76.783 | 1 | 0.8 | 0.000 | 0.000 | 68.909 | 170.482 | 346.958 | 346.958 | 326.419 | |
| 12-2019 | 79.786 | 1 | 0.8 | 0.000 | 0.000 | 38.588 | .000 | 252.973 | 599.931 | 546.740 | |
| 12-2020 | 79.786 | 1 | 0.8 | 0.000 | 0.000 | 27.253 | .000 | 155.230 | 755.161 | 669.505 | |
| 12-2021 | 79.786 | 1 | 0.8 | 0.000 | 0.000 | 21.282 | .000 | 103.735 | 858.896 | 744.042 | |
| 12-2022 | 79.786 | 1 | 0.8 | 0.000 | 0.000 | 17.632 | .000 | 72.260 | 931.156 | 791.235 | |
| 12-2023 | 79.786 | 1 | 0.8 | 0.000 | 0.000 | 15.127 | .000 | 50.661 | 981.817 | 821.315 | |
| 12-2024 | 79.786 | 1 | 0.8 | 0.000 | 0.000 | 13.327 | .000 | 35.138 | 1,016.955 | 840.286 | |
| 12-2025 | 79.786 | 1 | 0.8 | 0.000 | 0.000 | 11.883 | .000 | 22.683 | 1,039.638 | 851.420 | |
| 12-2026 | 79.786 | 1 | 0.8 | 0.000 | 0.000 | 10.768 | .000 | 13.068 | 1,052.705 | 857.257 | |
| 12-2027 | 79.786 | 1 | 0.8 | 0.000 | 0.000 | 9.858 | .000 | 5.226 | 1,057.931 | 859.387 | |
| 04-2028 | 21.380 | 1 | 0.8 | 0.000 | 0.000 | 2.535 | .000 | .478 | 1,058.409 | 859.570 | |
| 12-2029 | | | | | | | | | | | |
| 12-2030 | | | | | | | | | | | |
| 12-2031 | | | | | | | | | | | |
| 12-2032 | | | | | | | | | | | |
| 12-2033 | | | | | | | | | | | |
| 12-2034 | | | | | | | | | | | |
| 12-2035 | | | | | | | | | | | |
| 12-2036 | | | | | | | | | | | |
| S Tot | 816.232 | | | 0.000 | 0.000 | 237.162 | 170.482 | 1,058.409 | 1,058.409 | 859.570 | |
| After | .000 | | | 0.000 | 0.000 | 0.000 | .000 | .000 | 1,058.409 | 859.570 | |
| Total | 816.232 | | | 0.000 | 0.000 | 237.162 | 170.482 | 1,058.409 | 1,058.409 | 859.570 | |
| Evaluation Parameters (Gross) | | Expenses (Gross) | | Percent Interests | | Percent | Cum. Disc. | |
| | Initial | Final | Units | | Dei | n | Def | | Initial | Final | Units | | | | Final | | 5.00 | 947.704 | |
| Oil Rate | 3,041. | 242. | bbls/mo | | 80.0% | 1.20 | 0.0% | | 4,277. | 7,799. | $/w/mo | | Expense | 85.2409 | 85.2409 | | 8.00 | 892.560 | |
| Gas Rate | 0. | 0. | Mcf/mo | | 0.0% | 0.00 | 0.0% | | | | | | Revenue | | | | 10.00 | 859.570 | |
| GOR | 0. | 0. | scf/bbl | | | | | | | | | | Oil | 68.9934 | 68.9934 | | 12.00 | 829.190 | |
| NGL Rate | 0. | 0. | bbls/mo | | | | | | | | | | Gas | 68.9934 | 68.9934 | | 15.00 | 787.889 | |
| NGL Yield | 0.0 | 0.0 | bbl/MMcf | | | | | | | | | | | | | | 20.00 | 728.507 | |
| Gas Shrinkage | 0.0 | 0.0 | % | | | | | | | | | | | | | | | | |
| Oil Severance | 4.6 | 4.6 | % | | | | | | | | | | | | | | | | |
| Gas Severance | 0.0 | 0.0 | % | | | | | | | | | | | | | | | | |
| NGL Severance | 0.0 | 0.0 | % | | | | | | | | | | | | | | | | |
| Ad Valorem | 20.4 | | % | | | | | | | | | | | | | | | | |
| | Start Date: 01/2018 | 12 Months in year ‘18 | 10.270 Year Life (04/2028) |
THESE DATA ARE PART OF A CG&A REPORT AND ARE SUBJECT TO THE CONDITIONS IN THE TEXT OF THE REPORT.
TEXAS REGISTERED ENGINEERING FIRM F-693. | ASN 425 | DEFAULT 1/10/2018 10:34:19 OIL PDNP Table 5 |
Cawley, Gillespie & Associates, Inc.
Table I - PUD
Composite Reserve Estimates and Economic Forecasts
Lilis Energy, Inc. Interests
Delaware Basin Properties in Texas and New Mexico
Proved Undeveloped Reserves
As of December 31, 2017
| (1) | (2) | (3) | (4) | (5) | (6) | (7) | (8) | (9) | (10) | |
| | Gross Oil | Gross Gas | Gross NGL | Net Oil | Net Gas | Net NGL | Avg Oil | Avg Gas | Avg NGL | |
| End | Production | Production | Production | Production | Sales | Production | Price | Price | Price | |
| Mo-Year | MBBLS | MMCF | MBBLS | MBBLS | MMCF | MBBLS | $/BBL | $/MCF | $/BBL | |
| 12-2018 | 466.0 | 1,397.9 | 96.5 | 256.035 | 522.312 | 52.999 | 47.746 | 2.619 | 8.728 | |
| 12-2019 | 751.7 | 2,255.2 | 155.6 | 426.674 | 870.415 | 88.322 | 47.746 | 2.619 | 8.728 | |
| 12-2020 | 1,306.5 | 3,919.4 | 270.4 | 704.369 | 1,436.913 | 145.804 | 47.746 | 2.619 | 8.728 | |
| 12-2021 | 1,270.1 | 3,810.3 | 262.9 | 620.383 | 1,265.581 | 128.419 | 47.746 | 2.619 | 8.728 | |
| 12-2022 | 780.6 | 2,341.9 | 161.6 | 391.330 | 798.313 | 81.005 | 47.746 | 2.619 | 8.728 | |
| 12-2023 | 588.6 | 1,765.8 | 121.8 | 297.719 | 607.347 | 61.628 | 47.746 | 2.619 | 8.728 | |
| 12-2024 | 481.0 | 1,443.1 | 99.6 | 244.521 | 498.824 | 50.616 | 47.746 | 2.619 | 8.728 | |
| 12-2025 | 408.0 | 1,224.1 | 84.5 | 208.066 | 424.455 | 43.070 | 47.746 | 2.619 | 8.728 | |
| 12-2026 | 356.8 | 1,070.4 | 73.9 | 182.324 | 371.941 | 37.741 | 47.746 | 2.619 | 8.728 | |
| 12-2027 | 318.0 | 954.1 | 65.8 | 162.772 | 332.054 | 33.694 | 47.746 | 2.619 | 8.728 | |
| 12-2028 | 288.2 | 864.7 | 59.7 | 147.710 | 301.329 | 30.576 | 47.746 | 2.619 | 8.728 | |
| 12-2029 | 262.4 | 787.1 | 54.3 | 134.561 | 274.504 | 27.854 | 47.746 | 2.619 | 8.728 | |
| 12-2030 | 240.9 | 722.7 | 49.9 | 123.586 | 252.115 | 25.582 | 47.746 | 2.619 | 8.728 | |
| 12-2031 | 221.6 | 664.8 | 45.9 | 113.693 | 231.934 | 23.535 | 47.746 | 2.619 | 8.728 | |
| 12-2032 | 204.4 | 613.3 | 42.3 | 104.879 | 213.952 | 21.710 | 47.746 | 2.619 | 8.728 | |
| 12-2033 | 187.5 | 562.6 | 38.8 | 96.219 | 196.287 | 19.917 | 47.746 | 2.619 | 8.728 | |
| 12-2034 | 172.6 | 517.7 | 35.7 | 88.527 | 180.594 | 18.325 | 47.746 | 2.619 | 8.728 | |
| 12-2035 | 158.8 | 476.3 | 32.9 | 81.449 | 166.156 | 16.860 | 47.746 | 2.619 | 8.728 | |
| 12-2036 | 146.4 | 439.3 | 30.3 | 75.134 | 153.274 | 15.553 | 47.746 | 2.619 | 8.728 | |
| S Tot | 8,610.2 | 25,830.6 | 1,782.3 | 4,459.952 | 9,098.302 | 923.210 | 47.746 | 2.619 | 8.728 | |
| After | 367.4 | 1,102.3 | 76.1 | 179.990 | 367.179 | 37.258 | 47.746 | 2.619 | 8.728 | |
| Total | 8,977.7 | 26,933.0 | 1,858.4 | 4,639.942 | 9,465.481 | 960.468 | 47.746 | 2.619 | 8.728 | |
| Cum | .0 | .0 | .0 | | | | | | | |
| Ult | 8,977.7 | 26,933.0 | 1,858.4 | | | | | | | |
| (11) | (12) | (13) | (14) | (15) | (16) | (17) | (18) | (19) | (20) | |
| | Oil | Gas | NGL | Hedge | Other | Total | Production | Ad Valorem | | |
| End | Revenue | Revenue | Revenue | Revenue | Revenue | Revenue | Taxes | Taxes | $/BOE6 | |
| Mo-Year | M$ | M$ | M$ | M$ | M$ | M$ | M$ | M$ | | |
| 12-2018 | 12,224.704 | 1,367.871 | 462.558 | 0.000 | 0.000 | 14,055.133 | 804.254 | 467.207 | 3.938 | |
| 12-2019 | 20,372.064 | 2,279.513 | 770.837 | 0.000 | 0.000 | 23,422.413 | 1,343.379 | 782.117 | 4.406 | |
| 12-2020 | 33,630.959 | 3,763.104 | 1,272.527 | 0.000 | 0.000 | 38,666.589 | 2,085.970 | 1,141.836 | 4.767 | |
| 12-2021 | 29,620.928 | 3,314.405 | 1,120.795 | 0.000 | 0.000 | 34,056.128 | 1,797.349 | 960.465 | 5.805 | |
| 12-2022 | 18,684.521 | 2,090.687 | 706.984 | 0.000 | 0.000 | 21,482.192 | 1,145.464 | 619.131 | 7.475 | |
| 12-2023 | 14,214.965 | 1,590.570 | 537.865 | 0.000 | 0.000 | 16,343.400 | 875.165 | 475.232 | 8.892 | |
| 12-2024 | 11,674.972 | 1,306.360 | 441.757 | 0.000 | 0.000 | 13,423.089 | 720.464 | 392.217 | 10.185 | |
| 12-2025 | 9,934.371 | 1,111.597 | 375.896 | 0.000 | 0.000 | 11,421.865 | 613.965 | 334.778 | 11.454 | |
| 12-2026 | 8,705.283 | 974.069 | 329.390 | 0.000 | 0.000 | 10,008.742 | 538.564 | 293.992 | 12.656 | |
| 12-2027 | 7,771.726 | 869.610 | 294.066 | 0.000 | 0.000 | 8,935.402 | 481.177 | 262.883 | 13.825 | |
| 12-2028 | 7,052.606 | 789.145 | 266.856 | 0.000 | 0.000 | 8,108.606 | 436.908 | 238.847 | 14.936 | |
| 12-2029 | 6,424.773 | 718.894 | 243.100 | 0.000 | 0.000 | 7,386.767 | 398.163 | 217.753 | 16.109 | |
| 12-2030 | 5,900.754 | 660.259 | 223.272 | 0.000 | 0.000 | 6,784.285 | 365.734 | 200.045 | 17.280 | |
| 12-2031 | 5,428.423 | 607.408 | 205.400 | 0.000 | 0.000 | 6,241.231 | 336.461 | 184.035 | 18.530 | |
| 12-2032 | 5,007.554 | 560.315 | 189.476 | 0.000 | 0.000 | 5,757.345 | 310.375 | 169.767 | 19.842 | |
| 12-2033 | 4,594.093 | 514.052 | 173.831 | 0.000 | 0.000 | 5,281.975 | 284.748 | 155.750 | 21.365 | |
| 12-2034 | 4,226.806 | 472.954 | 159.934 | 0.000 | 0.000 | 4,859.695 | 261.983 | 143.298 | 22.968 | |
| 12-2035 | 3,888.884 | 435.143 | 147.147 | 0.000 | 0.000 | 4,471.174 | 241.038 | 131.842 | 24.711 | |
| 12-2036 | 3,587.376 | 401.406 | 135.739 | 0.000 | 0.000 | 4,124.521 | 222.351 | 121.620 | 26.542 | |
| S Tot | 212,945.760 | 23,827.361 | 8,057.432 | 0.000 | 0.000 | 244,830.554 | 13,263.512 | 7,292.816 | 9.786 | |
| After | 8,593.824 | 961.598 | 325.173 | 0.000 | 0.000 | 9,880.594 | 522.954 | 280.351 | 30.235 | |
| Total | 221,539.584 | 24,788.959 | 8,382.604 | 0.000 | 0.000 | 254,711.148 | 13,786.465 | 7,573.166 | 10.579 | |
| (21) | (22) | (23) | (24) | (25) | (26) | (27) | (28) | (29) | (30) | (31) | |
| | Operating | Wells | Workover | 3rd Party | Other | | Future Net | Cumulative | Cum.Cash Flow | |
| End | Expense | Gross | Net | Expense | COPAS | Deductions | Investment | Cash Flow | Cash Flow | Disc.@ 10. % | |
| Mo-Year | M$ | Count | M$ | M$ | M$ | M$ | M$ | M$ | M$ | |
| 12-2018 | 390.609 | 5 | 3.5 | 0.000 | 0.000 | 1,096.168 | 26,722.000 | -15,425.105 | -15,425.105 | -15,237.953 | |
| 12-2019 | 996.819 | 10 | 7.4 | 0.000 | 0.000 | 1,775.036 | 38,783.407 | -20,258.345 | -35,683.450 | -32,876.622 | |
| 12-2020 | 1,969.493 | 19 | 12.8 | 0.000 | 0.000 | 2,981.477 | 41,955.067 | -11,467.255 | -47,150.705 | -41,995.420 | |
| 12-2021 | 2,599.578 | 20 | 13.6 | 0.000 | 0.000 | 2,710.771 | .000 | 25,987.966 | -21,162.739 | -23,279.466 | |
| 12-2022 | 2,617.403 | 20 | 13.6 | 0.000 | 0.000 | 1,695.738 | .000 | 15,404.456 | -5,758.283 | -13,214.258 | |
| 12-2023 | 2,617.403 | 20 | 13.6 | 0.000 | 0.000 | 1,286.185 | .000 | 11,089.415 | 5,331.132 | -6,632.271 | |
| 12-2024 | 2,617.403 | 20 | 13.6 | 0.000 | 0.000 | 1,054.744 | .000 | 8,638.260 | 13,969.392 | -1,973.371 | |
| 12-2025 | 2,617.403 | 20 | 13.6 | 0.000 | 0.000 | 896.657 | .000 | 6,959.060 | 20,928.452 | 1,437.469 | |
| 12-2026 | 2,617.403 | 20 | 13.6 | 0.000 | 0.000 | 785.229 | .000 | 5,773.554 | 26,702.005 | 4,009.715 | |
| 12-2027 | 2,617.403 | 20 | 13.6 | 0.000 | 0.000 | 700.704 | .000 | 4,873.235 | 31,575.241 | 5,983.348 | |
| 12-2028 | 2,617.403 | 20 | 13.6 | 0.000 | 0.000 | 635.650 | .000 | 4,179.798 | 35,755.038 | 7,522.101 | |
| 12-2029 | 2,617.403 | 20 | 13.6 | 0.000 | 0.000 | 578.919 | .000 | 3,574.528 | 39,329.566 | 8,718.200 | |
| 12-2030 | 2,617.403 | 20 | 13.6 | 0.000 | 0.000 | 531.644 | .000 | 3,069.459 | 42,399.025 | 9,651.992 | |
| 12-2031 | 2,617.403 | 20 | 13.6 | 0.000 | 0.000 | 489.084 | .000 | 2,614.248 | 45,013.273 | 10,375.089 | |
| 12-2032 | 2,617.403 | 20 | 13.6 | 0.000 | 0.000 | 451.165 | .000 | 2,208.635 | 47,221.907 | 10,930.532 | |
| 12-2033 | 2,617.403 | 20 | 13.6 | 0.000 | 0.000 | 413.913 | .000 | 1,810.161 | 49,032.068 | 11,344.352 | |
| 12-2034 | 2,617.403 | 20 | 13.6 | 0.000 | 0.000 | 380.822 | .000 | 1,456.188 | 50,488.256 | 11,647.055 | |
| 12-2035 | 2,617.403 | 20 | 13.6 | 0.000 | 0.000 | 350.376 | .000 | 1,130.515 | 51,618.771 | 11,860.758 | |
| 12-2036 | 2,617.403 | 20 | 13.6 | 0.000 | 0.000 | 323.211 | .000 | 839.936 | 52,458.707 | 12,005.186 | |
| S Tot | 45,217.550 | | | 0.000 | 0.000 | 19,137.494 | 107,460.474 | 52,458.707 | 52,458.707 | 12,005.186 | |
| After | 7,249.817 | | | 0.000 | 0.000 | 774.734 | .000 | 1,052.739 | 53,511.446 | 12,159.725 | |
| Total | 52,467.366 | | | 0.000 | 0.000 | 19,912.229 | 107,460.474 | 53,511.446 | 53,511.446 | 12,159.725 | |
| | SEC Pricing YE2017 | | Percent | Cum. Disc. | |
| | | WTI Cushing | Henry Hub | | 5.00 | 27,835.429 | |
| | Year | Oil $/STB | Gas $/MMBTU | | 8.00 | 17,577.982 | |
| | 2018 | 51.34 | 2.976 | | 10.00 | 12,159.725 | |
| | Thereafter | Flat | Flat | | 12.00 | 7,615.337 | |
| | Cap | 51.34 | 2.976 | | 15.00 | 2,083.374 | |
| | | | | | 20.00 | -4,652.116 | |
12 Months in first year 25.065 Year Life (01/2043)
THESE DATA ARE PART OF A CG&A REPORT AND ARE SUBJECT TO THE CONDITIONS IN THE TEXT OF THE REPORT.
TEXAS REGISTERED ENGINEERING FIRM F-693. | | 1/10/2018 10:34:19
Summary |
Cawley, Gillespie & Associates, Inc.
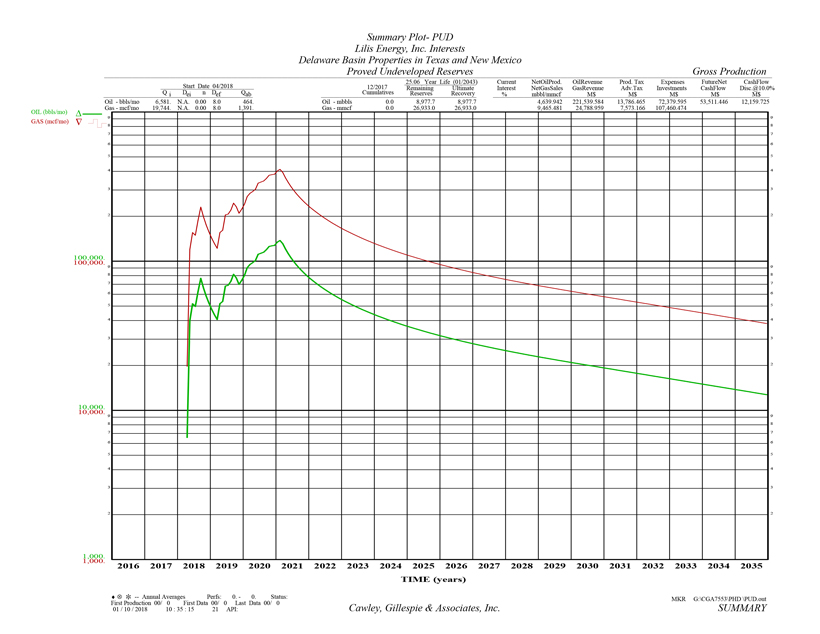
Table II – PUD
Lease Reserve Summary
Lilis Energy, Inc. Interests
Delaware Basin Properties in Texas and New Mexico
Proved Undeveloped Reserves
As of December 31, 2017
| | | | | | | | | | | |
| OPERATOR | Current | WellCnt | Ultimate | Gross | Net | Oil Revenue | Prod Tax | Expenses | Future Net | Cash Flow |
| LEASE NAME | | | Interest | Life | Recovery | Reserves | Reserves | Gas Revenue | Adv. Tax | Investments | Cash Flow | Disc.@ 10.0 |
| Table | Class | Major | Well No. | Start
Date | ASN | % | | __________________MBBL / MMCF__________________ | M$ / M$ | M$ / M$ | M$ / M$ | M$ | M$ |
| PHANTOM (WOLFCAMP B) -- WINKLER COUNTY, TEXAS | |
| LILIS ENERGY, INC. | | | | | |
| BISON PUD-2 | 39.0000 NI | 1 | 438.3 | 438.3 | 170.9 | 8,161.1 | 468.7 | 2,726.5 | 1,793.3 | 256.7 |
| 1 | PUD | Oil | | 04/20 | 486 | 52.0000 WI | 19.8 | 1,314.8 | 1,314.8 | 348.7 | 913.2 | 234.6 | 4,160.0 | | |
| BISON PUD-3 | 4.5000 NI | 1 | 438.3 | 438.3 | 19.7 | 941.7 | 54.1 | 314.6 | 207.0 | 28.3 |
| 2 | PUD | Oil | | 10/20 | 494 | 6.0000 WI | 19.8 | 1,314.8 | 1,314.8 | 40.2 | 105.4 | 27.1 | 480.0 | | |
| GRIZZLY PUD-1 | 61.0414 NI | 1 | 439.2 | 439.2 | 268.1 | 12,801.4 | 735.2 | 4,435.2 | 2,247.7 | 12.4 |
| 3 | PUD | Oil | | 12/20 | 496 | 86.6526 WI | 19.1 | 1,317.7 | 1,317.7 | 547.0 | 1,432.4 | 368.0 | 6,932.2 | | |
| GRIZZLY PUD-3 | 61.0414 NI | 1 | 439.2 | 439.2 | 268.1 | 12,801.4 | 735.2 | 4,434.9 | 2,248.0 | 12.3 |
| 4 | PUD | Oil | | 02/21 | 488 | 86.6526 WI | 19.1 | 1,317.7 | 1,317.7 | 547.0 | 1,432.4 | 368.0 | 6,932.2 | | |
| HIPPO #2H | 75.1094 NI | 1 | 438.4 | 438.4 | 329.3 | 15,721.1 | 902.9 | 5,246.8 | 5,173.6 | 2,387.8 |
| 5 | PUD | Oil | | 04/18 | 432 | 100.0000 WI | 19.8 | 1,315.1 | 1,315.1 | 671.7 | 1,759.1 | 451.9 | 6,300.0 | | |
| HIPPO PUD-1 | 68.9935 NI | 1 | 443.4 | 443.4 | 305.9 | 14,606.1 | 838.8 | 4,651.2 | 4,049.1 | 1,059.4 |
| 6 | PUD | Oil | | 12/19 | 491 | 85.4277 WI | 20.7 | 1,330.2 | 1,330.2 | 624.1 | 1,634.3 | 419.8 | 6,834.2 | | |
| HIPPO PUD-2 | 75.1094 NI | 1 | 438.4 | 438.4 | 329.3 | 15,721.1 | 902.9 | 5,248.5 | 3,471.9 | 517.7 |
| 7 | PUD | Oil | | 01/20 | 492 | 100.0000 WI | 19.8 | 1,315.1 | 1,315.1 | 671.7 | 1,759.1 | 451.9 | 8,000.0 | | |
| HIPPO PUD-3 | 3.7500 NI | 1 | 438.3 | 438.3 | 16.4 | 784.7 | 45.1 | 262.1 | 172.5 | 23.4 |
| 8 | PUD | Oil | | 11/20 | 493 | 5.0000 WI | 19.8 | 1,314.8 | 1,314.8 | 33.5 | 87.8 | 22.6 | 400.0 | | |
| PHANTOM (WOLFCAMP A) -- WINKLER COUNTY, TEXAS |
| LILIS ENERGY, INC. | | | | | |
| KUDU 1 PUD-2 | 71.0940 NI | 1 | 400.3 | 400.3 | 284.6 | 13,588.7 | 780.4 | 4,463.8 | 3,014.0 | 439.4 |
| 9 | PUD | Oil | | 03/20 | 484 | 87.1825 WI | 19.8 | 1,201.0 | 1,201.0 | 580.6 | 1,520.5 | 390.6 | 6,974.6 | | |
| PHANTOM (WOLFCAMP B) -- WINKLER COUNTY, TEXAS |
| LILIS ENERGY, INC. | | | | | |
| LION 1 PUD-2 | 65.9402 NI | 1 | 434.5 | 434.5 | 286.5 | 13,679.9 | 785.6 | 4,718.1 | 2,433.2 | 38.0 |
| 10 | PUD | Oil | | 07/20 | 490 | 92.4753 WI | 19.1 | 1,303.5 | 1,303.5 | 584.5 | 1,530.7 | 393.2 | 7,398.0 | | |
| LION 3 PUD-1 | 65.9402 NI | 1 | 434.5 | 434.5 | 286.5 | 13,679.9 | 785.6 | 4,718.2 | 2,433.1 | 37.3 |
| 11 | PUD | Oil | | 08/20 | 497 | 92.4753 WI | 19.1 | 1,303.5 | 1,303.5 | 584.5 | 1,530.7 | 393.2 | 7,398.0 | | |
| MEERKAT #1H | 59.2500 NI | 1 | 438.3 | 438.3 | 259.7 | 12,398.6 | 712.1 | 4,141.7 | 3,672.9 | 1,486.1 |
| 12 | PUD | Oil | | 05/18 | 435 | 79.0000 WI | 19.7 | 1,314.8 | 1,314.8 | 529.7 | 1,387.3 | 356.4 | 5,372.0 | | |
| MOOSE #1H | 37.5000 NI | 1 | 673.6 | 673.6 | 252.6 | 12,061.5 | 692.7 | 3,448.5 | 4,329.6 | 1,590.4 |
| 13 | PUD | Oil | | 08/18 | 498 | 50.0000 WI | 24.4 | 2,020.9 | 2,020.9 | 515.3 | 1,349.6 | 346.7 | 5,050.0 | | |
| PHANTOM (WOLFCAMP B) -- LEA COUNTY, NEW MEXICO |
| LILIS ENERGY, INC. | | | | | |
| PRIZE HOG 2H | 50.0000 NI | 1 | 439.2 | 439.2 | 219.6 | 10,484.1 | 868.0 | 3,297.6 | 2,285.6 | 408.3 |
| 14 | PUD | Oil | | 07/19 | 479 | 62.5000 WI | 19.9 | 1,317.5 | 1,317.5 | 447.9 | 1,173.1 | 602.7 | 5,000.0 | | |
| PRIZE HOG 3H | 50.0000 NI | 1 | 439.2 | 439.2 | 219.6 | 10,484.1 | 868.0 | 3,297.5 | 2,285.7 | 402.8 |
| 15 | PUD | Oil | | 09/19 | 480 | 62.5000 WI | 19.9 | 1,317.5 | 1,317.5 | 447.9 | 1,173.1 | 602.7 | 5,000.0 | | |
| PHANTOM (WOLFCAMP B) -- WINKLER COUNTY, TEXAS |
| LILIS ENERGY, INC. | | | | | |
| TIGER #2H | 71.0940 NI | 1 | 444.0 | 444.0 | 315.7 | 15,072.5 | 865.6 | 4,770.2 | 4,285.7 | 1,246.9 |
| 16 | PUD | Oil | | 04/19 | 485 | 87.1825 WI | 20.9 | 1,332.1 | 1,332.1 | 644.0 | 1,686.5 | 433.2 | 6,974.6 | | |
| TIGER 1 PUD-2 | 71.0940 NI | 1 | 444.0 | 444.0 | 315.7 | 15,072.6 | 865.6 | 4,770.1 | 4,285.8 | 1,230.7 |
| 17 | PUD | Oil | | 05/19 | 489 | 87.1825 WI | 20.9 | 1,332.1 | 1,332.1 | 644.0 | 1,686.5 | 433.2 | 6,974.6 | | |
| TIGER PUD-3 | 12.0000 NI | 1 | 438.3 | 438.3 | 52.6 | 2,511.1 | 144.2 | 838.9 | 551.8 | 78.1 |
| 18 | PUD | Oil | | 06/20 | 495 | 16.0000 WI | 19.7 | 1,314.8 | 1,314.8 | 107.3 | 281.0 | 72.2 | 1,280.0 | | |
| PHANTOM (WOLFCAMP B) -- LEA COUNTY, NEW MEXICO |
| LILIS ENERGY, INC. | | | | | |
| WILD HOG 2H | 50.0000 NI | 1 | 439.2 | 439.2 | 219.6 | 10,484.1 | 868.0 | 3,297.7 | 2,285.5 | 455.0 |
| 19 | PUD | Oil | | 05/18 | 481 | 62.5000 WI | 20.0 | 1,317.5 | 1,317.5 | 447.9 | 1,173.1 | 602.7 | 5,000.0 | | |
| THESE DATA ARE PART OF A CG&A REPORT AND ARE SUBJECT TO THE CONDITIONS IN THE TEXT OF THE REPORT. TEXAS REGISTERED ENGINEERING FIRM F-693. | Scenario: 6.428 | 1/10/2018 10:34:19 AM |
Cawley, Gillespie & Associates, Inc.
Page 1
Table II - PUD (cont.)
Lease Reserve Summary
Lilis Energy, Inc. Interests
Delaware Basin Properties in Texas and New Mexico
Proved Undeveloped Reserves
As of December 31, 2017
| | | | | | | | | | | |
| OPERATOR | Current | WellCnt | Ultimate | Gross | Net | Oil Revenue | Prod Tax | Expenses | Future Net | Cash Flow |
| LEASE NAME | | | Interest | Life | Recovery | Reserves | Reserves | Gas Revenue | Adv. Tax | Investments | Cash Flow | Disc.@ 10.0 |
| Table | Class | Major | Well No. | Start
Date | ASN | % | | _________________MBBL / MMCF_________________ | M$ / M$ | M$ / M$ | M$ / M$ | M$ | M$ |
| PHANTOM (WOLFCAMP B) -- LEA COUNTY, NEW MEXICO | |
| LILIS ENERGY, INC. | | | | | |
| WILD HOG 3H | 50.0000 NI | 1 | 439.2 | 439.2 | 219.6 | 10,484.1 | 868.0 | 3,297.6 | 2,285.6 | 448.7 |
| 20 | PUD | Oil | | 07/18 | 483 | 62.5000 WI | 20.0 | 1,317.5 | 1,317.5 | 447.9 | 1,173.1 | 602.7 | 5,000.0 | | |
| | | | | | | | | | | | | | | | |
| GRAND TOTAL | | 20 | 8,977.7 | 8,977.7 | 4,639.9 | 221,539.6 | 13,786.5 | 72,379.6 | 53,511.4 | 12,159.7 |
| | | | | | | | | 26,933.0 | 26,933.0 | 9,465.5 | 24,789.0 | 7,573.2 | 107,460.5 | | |
| | | | | | | | | | | | | | | | |
| | | | | | | | | | | | | | | | |
| | | | | | | | | | | | | | | | |
| | | | | | | | | | | | | | | | |
THESE DATA ARE PART OF A CG&A REPORT AND ARE SUBJECT TO THE CONDITIONS IN THE TEXT OF THE REPORT.
TEXAS REGISTERED ENGINEERING FIRM F-693. | Scenario: 6.428 | 1/10/2018 10:34:19 AM |
Cawley, Gillespie & Associates, Inc.
Page 2
Rate-Time History-Forecast Curves
And
Tabular Reserves and Economics
By Property
Cawley, Gillespie & Associates, Inc.
Petroleum Consultants

Table 1
Reserve Estimates and Economic Forecasts as of December 31, 2017
Lilis Energy, Inc. Interests
Proved Undeveloped Reserves
LILIS ENERGY, INC. -- BISON PUD-2
PHANTOM (WOLFCAMP B) FIELD -- WINKLER COUNTY, TEXAS
| (1) | (2) | (3) | (4) | (5) | (6) | (7) | (8) | (9) | (10) | |
| | Gross Oil | Gross Gas | Gross NGL | Net Oil | Net Gas | Net NGL | Avg Oil | Avg Gas | Avg NGL | |
| End | Production | Production | Production | Production | Sales | Production | Price | Price | Price | |
| Mo-Year | MBBLS | MMCF | MBBLS | MBBLS | MMCF | MBBLS | $/BBL | $/MCF | $/BBL | |
| 12-2018 | .0 | .0 | .0 | .000 | .000 | .000 | .000 | .000 | .000 | |
| 12-2019 | .0 | .0 | .0 | .000 | .000 | .000 | .000 | .000 | .000 | |
| 12-2020 | 102.6 | 307.8 | 21.2 | 40.011 | 81.622 | 8.282 | 47.746 | 2.619 | 8.728 | |
| 12-2021 | 65.8 | 197.5 | 13.6 | 25.680 | 52.387 | 5.316 | 47.746 | 2.619 | 8.728 | |
| 12-2022 | 41.7 | 125.0 | 8.6 | 16.247 | 33.144 | 3.363 | 47.746 | 2.619 | 8.728 | |
| 12-2023 | 31.2 | 93.5 | 6.4 | 12.152 | 24.789 | 2.515 | 47.746 | 2.619 | 8.728 | |
| 12-2024 | 25.2 | 75.6 | 5.2 | 9.833 | 20.060 | 2.035 | 47.746 | 2.619 | 8.728 | |
| 12-2025 | 21.2 | 63.6 | 4.4 | 8.272 | 16.875 | 1.712 | 47.746 | 2.619 | 8.728 | |
| 12-2026 | 18.4 | 55.3 | 3.8 | 7.185 | 14.657 | 1.487 | 47.746 | 2.619 | 8.728 | |
| 12-2027 | 16.3 | 49.0 | 3.4 | 6.370 | 12.994 | 1.319 | 47.746 | 2.619 | 8.728 | |
| 12-2028 | 14.7 | 44.2 | 3.1 | 5.749 | 11.728 | 1.190 | 47.746 | 2.619 | 8.728 | |
| 12-2029 | 13.4 | 40.2 | 2.8 | 5.222 | 10.652 | 1.081 | 47.746 | 2.619 | 8.728 | |
| 12-2030 | 12.3 | 36.9 | 2.5 | 4.796 | 9.784 | .993 | 47.746 | 2.619 | 8.728 | |
| 12-2031 | 11.3 | 33.9 | 2.3 | 4.413 | 9.002 | .913 | 47.746 | 2.619 | 8.728 | |
| 12-2032 | 10.4 | 31.3 | 2.2 | 4.071 | 8.304 | .843 | 47.746 | 2.619 | 8.728 | |
| 12-2033 | 9.6 | 28.7 | 2.0 | 3.734 | 7.618 | .773 | 47.746 | 2.619 | 8.728 | |
| 12-2034 | 8.8 | 26.4 | 1.8 | 3.436 | 7.009 | .711 | 47.746 | 2.619 | 8.728 | |
| 12-2035 | 8.1 | 24.3 | 1.7 | 3.161 | 6.449 | .654 | 47.746 | 2.619 | 8.728 | |
| 12-2036 | 7.5 | 22.4 | 1.5 | 2.916 | 5.949 | .604 | 47.746 | 2.619 | 8.728 | |
| S Tot | 418.6 | 1,255.7 | 86.6 | 163.247 | 333.024 | 33.792 | 47.746 | 2.619 | 8.728 | |
| After | 19.7 | 59.1 | 4.1 | 7.680 | 15.666 | 1.590 | 47.746 | 2.619 | 8.728 | |
| Total | 438.3 | 1,314.8 | 90.7 | 170.927 | 348.691 | 35.382 | 47.746 | 2.619 | 8.728 | |
| Cum | .0 | .0 | .0 | | | | | | | |
| Ult | 438.3 | 1,314.8 | 90.7 | | | | | | | |
| (11) | (12) | (13) | (14) | (15) | (16) | (17) | (18) | (19) | (20) | |
| | Oil | Gas | NGL | Hedge | Other | Total | Production | Ad Valorem | | |
| End | Revenue | Revenue | Revenue | Revenue | Revenue | Revenue | Taxes | Taxes | $/BOE6 | |
| Mo-Year | M$ | M$ | M$ | M$ | M$ | M$ | M$ | M$ | | |
| 12-2018 | .000 | .000 | .000 | 0.000 | 0.000 | .000 | .000 | .000 | .000 | |
| 12-2019 | .000 | .000 | .000 | 0.000 | 0.000 | .000 | .000 | .000 | .000 | |
| 12-2020 | 1,910.360 | 213.758 | 72.284 | 0.000 | 0.000 | 2,196.402 | 109.712 | 54.910 | 4.141 | |
| 12-2021 | 1,226.107 | 137.194 | 46.393 | 0.000 | 0.000 | 1,409.694 | 70.415 | 35.242 | 5.603 | |
| 12-2022 | 775.747 | 86.801 | 29.353 | 0.000 | 0.000 | 891.901 | 44.551 | 22.298 | 7.133 | |
| 12-2023 | 580.189 | 64.920 | 21.953 | 0.000 | 0.000 | 667.062 | 33.320 | 16.677 | 8.538 | |
| 12-2024 | 469.498 | 52.534 | 17.765 | 0.000 | 0.000 | 539.797 | 26.963 | 13.495 | 9.852 | |
| 12-2025 | 394.965 | 44.194 | 14.945 | 0.000 | 0.000 | 454.104 | 22.683 | 11.353 | 11.151 | |
| 12-2026 | 343.057 | 38.386 | 12.981 | 0.000 | 0.000 | 394.423 | 19.702 | 9.861 | 12.389 | |
| 12-2027 | 304.136 | 34.031 | 11.508 | 0.000 | 0.000 | 349.675 | 17.467 | 8.742 | 13.595 | |
| 12-2028 | 274.492 | 30.714 | 10.386 | 0.000 | 0.000 | 315.592 | 15.764 | 7.890 | 14.743 | |
| 12-2029 | 249.319 | 27.897 | 9.434 | 0.000 | 0.000 | 286.650 | 14.318 | 7.166 | 15.933 | |
| 12-2030 | 228.996 | 25.623 | 8.665 | 0.000 | 0.000 | 263.285 | 13.151 | 6.582 | 17.083 | |
| 12-2031 | 210.689 | 23.575 | 7.972 | 0.000 | 0.000 | 242.235 | 12.100 | 6.056 | 18.310 | |
| 12-2032 | 194.354 | 21.747 | 7.354 | 0.000 | 0.000 | 223.455 | 11.162 | 5.586 | 19.600 | |
| 12-2033 | 178.307 | 19.951 | 6.747 | 0.000 | 0.000 | 205.005 | 10.240 | 5.125 | 21.097 | |
| 12-2034 | 164.051 | 18.356 | 6.207 | 0.000 | 0.000 | 188.615 | 9.421 | 4.715 | 22.672 | |
| 12-2035 | 150.936 | 16.889 | 5.711 | 0.000 | 0.000 | 173.536 | 8.668 | 4.338 | 24.384 | |
| 12-2036 | 139.234 | 15.579 | 5.268 | 0.000 | 0.000 | 160.081 | 7.996 | 4.002 | 26.185 | |
| S Tot | 7,794.436 | 872.151 | 294.926 | 0.000 | 0.000 | 8,961.513 | 447.634 | 224.038 | 9.890 | |
| After | 366.672 | 41.028 | 13.874 | 0.000 | 0.000 | 421.575 | 21.058 | 10.539 | 30.537 | |
| Total | 8,161.109 | 913.179 | 308.800 | 0.000 | 0.000 | 9,383.088 | 468.692 | 234.577 | 10.818 | |
| (21) | (22) | (23) | (24) | (25) | (26) | (27) | (28) | (29) | (30) | (31) | |
| | Operating | Wells | Workover | 3rd Party | Other | | Future Net | Cumulative | Cum.Cash Flow | |
| End | Expense | Gross | Net | Expense | COPAS | Deductions | Investment | Cash Flow | Cash Flow | Disc.@ 10. % | |
| Mo-Year | M$ | Count | M$ | M$ | M$ | M$ | M$ | M$ | M$ | |
| 12-2018 | .000 | 0 | 0.0 | 0.000 | 0.000 | 0.000 | .000 | .000 | .000 | .000 | |
| 12-2019 | .000 | 0 | 0.0 | 0.000 | 0.000 | 0.000 | .000 | .000 | .000 | .000 | |
| 12-2020 | 69.333 | 1 | 0.5 | 0.000 | 0.000 | 174.980 | 4,160.000 | -2,372.533 | -2,372.533 | -1,996.105 | |
| 12-2021 | 99.840 | 1 | 0.5 | 0.000 | 0.000 | 112.306 | .000 | 1,091.891 | -1,280.643 | -1,209.737 | |
| 12-2022 | 99.840 | 1 | 0.5 | 0.000 | 0.000 | 71.055 | .000 | 654.158 | -626.485 | -782.272 | |
| 12-2023 | 99.840 | 1 | 0.5 | 0.000 | 0.000 | 53.143 | .000 | 464.082 | -162.403 | -506.787 | |
| 12-2024 | 99.840 | 1 | 0.5 | 0.000 | 0.000 | 43.004 | .000 | 356.495 | 194.093 | -314.498 | |
| 12-2025 | 99.840 | 1 | 0.5 | 0.000 | 0.000 | 36.177 | .000 | 284.051 | 478.144 | -175.265 | |
| 12-2026 | 99.840 | 1 | 0.5 | 0.000 | 0.000 | 31.422 | .000 | 233.599 | 711.743 | -71.185 | |
| 12-2027 | 99.840 | 1 | 0.5 | 0.000 | 0.000 | 27.857 | .000 | 195.769 | 907.512 | 8.105 | |
| 12-2028 | 99.840 | 1 | 0.5 | 0.000 | 0.000 | 25.142 | .000 | 166.956 | 1,074.468 | 69.571 | |
| 12-2029 | 99.840 | 1 | 0.5 | 0.000 | 0.000 | 22.836 | .000 | 142.489 | 1,216.957 | 117.250 | |
| 12-2030 | 99.840 | 1 | 0.5 | 0.000 | 0.000 | 20.975 | .000 | 122.736 | 1,339.693 | 154.588 | |
| 12-2031 | 99.840 | 1 | 0.5 | 0.000 | 0.000 | 19.298 | .000 | 104.942 | 1,444.634 | 183.614 | |
| 12-2032 | 99.840 | 1 | 0.5 | 0.000 | 0.000 | 17.802 | .000 | 89.065 | 1,533.699 | 206.012 | |
| 12-2033 | 99.840 | 1 | 0.5 | 0.000 | 0.000 | 16.332 | .000 | 73.467 | 1,607.167 | 222.807 | |
| 12-2034 | 99.840 | 1 | 0.5 | 0.000 | 0.000 | 15.026 | .000 | 59.612 | 1,666.778 | 235.198 | |
| 12-2035 | 99.840 | 1 | 0.5 | 0.000 | 0.000 | 13.825 | .000 | 46.864 | 1,713.643 | 244.056 | |
| 12-2036 | 99.840 | 1 | 0.5 | 0.000 | 0.000 | 12.753 | .000 | 35.490 | 1,749.133 | 250.157 | |
| S Tot | 1,666.773 | | | 0.000 | 0.000 | 713.935 | 4,160.000 | 1,749.133 | 1,749.133 | 250.157 | |
| After | 312.214 | | | 0.000 | 0.000 | 33.586 | .000 | 44.178 | 1,793.311 | 256.716 | |
| Total | 1,978.987 | | | 0.000 | 0.000 | 747.520 | 4,160.000 | 1,793.311 | 1,793.311 | 256.716 | |
| Evaluation Parameters (Gross) | | Expenses (Gross) | | Percent Interests | | Percent | Cum. Disc. | |
| | Initial | Final | Units | | Dei | n | Def | | Initial | Final | Units | | | | Final | | 5.00 | 825.261 | |
| Oil Rate | 22,812. | 459. | bbls/mo | | 96.3% | 1.20 | 0.0% | | 5,332. | 16,000. | $/w/mo | | Expense | 52.0000 | 52.0000 | | 8.00 | 450.311 | |
| Gas Rate | 68,437. | 1,378. | Mcf/mo | | 0.0% | 0.00 | 0.0% | | | | | | Revenue | | | | 10.00 | 256.716 | |
| GOR | 3,000. | 3,000. | scf/bbl | | | | | | | | | | Oil | 39.0000 | 39.0000 | | 12.00 | 97.605 | |
| NGL Rate | 1,485. | 97. | bbls/mo | | | | | | | | | | Gas | 39.0000 | 39.0000 | | 15.00 | -90.710 | |
| NGL Yield | 21.7 | 70.8 | bbl/MMcf | | | | | | | | | | | | | | 20.00 | -308.244 | |
| Gas Shrinkage | 78.3 | 31.7 | % | | | | | | | | | | | | | | | | |
| Oil Severance | 4.6 | 4.6 | % | | | | | | | | | | | | | | | | |
| Gas Severance | 7.5 | 7.5 | % | | | | | | | | | | | | | | | | |
| NGL Severance | 7.5 | 7.5 | % | | | | | | | | | | | | | | | | |
| Ad Valorem | 25.2 | | % | | | | | | | | | | | | | | | | |
| | Start Date: 04/2020 | 9 Months in year ‘20 | 19.877 Year Life (02/2040) |
THESE DATA ARE PART OF A CG&A REPORT AND ARE SUBJECT TO THE CONDITIONS IN THE TEXT OF THE REPORT.
TEXAS REGISTERED ENGINEERING FIRM F-693. | ASN 486 | DEFAULT 1/10/2018 10:34:19 OIL PUD Table 1 |
Cawley, Gillespie & Associates, Inc.
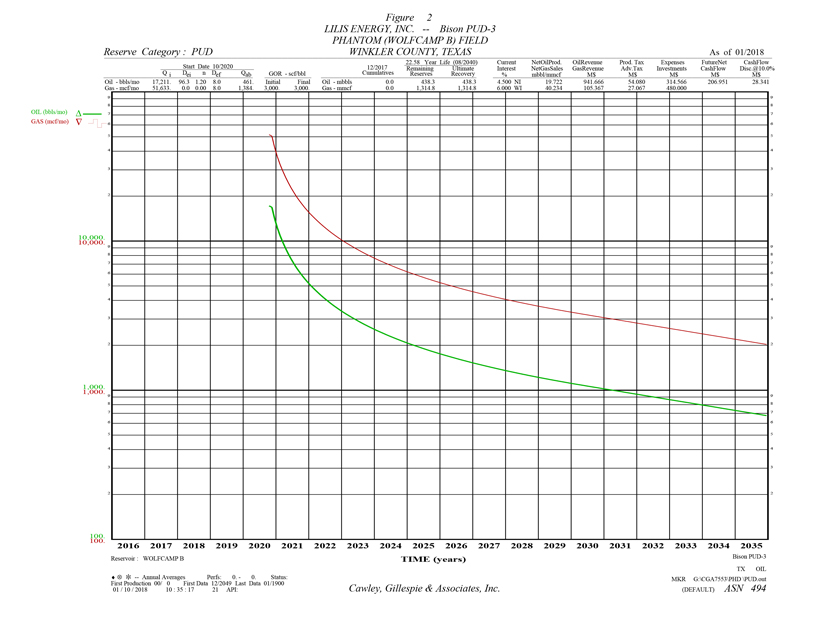
Table 2
Reserve Estimates and Economic Forecasts as of December 31, 2017
Lilis Energy, Inc. Interests
Proved Undeveloped Reserves
LILIS ENERGY, INC. -- BISON PUD-3
PHANTOM (WOLFCAMP B) FIELD -- WINKLER COUNTY, TEXAS
| (1) | (2) | (3) | (4) | (5) | (6) | (7) | (8) | (9) | (10) | |
| | Gross Oil | Gross Gas | Gross NGL | Net Oil | Net Gas | Net NGL | Avg Oil | Avg Gas | Avg NGL | |
| End | Production | Production | Production | Production | Sales | Production | Price | Price | Price | |
| Mo-Year | MBBLS | MMCF | MBBLS | MBBLS | MMCF | MBBLS | $/BBL | $/MCF | $/BBL | |
| 12-2018 | .0 | .0 | .0 | .000 | .000 | .000 | .000 | .000 | .000 | |
| 12-2019 | .0 | .0 | .0 | .000 | .000 | .000 | .000 | .000 | .000 | |
| 12-2020 | 48.6 | 145.7 | 10.1 | 2.186 | 4.459 | .452 | 47.746 | 2.619 | 8.728 | |
| 12-2021 | 94.3 | 282.8 | 19.5 | 4.242 | 8.654 | .878 | 47.746 | 2.619 | 8.728 | |
| 12-2022 | 49.8 | 149.5 | 10.3 | 2.242 | 4.574 | .464 | 47.746 | 2.619 | 8.728 | |
| 12-2023 | 35.2 | 105.5 | 7.3 | 1.583 | 3.228 | .328 | 47.746 | 2.619 | 8.728 | |
| 12-2024 | 27.6 | 82.9 | 5.7 | 1.244 | 2.537 | .257 | 47.746 | 2.619 | 8.728 | |
| 12-2025 | 22.8 | 68.5 | 4.7 | 1.028 | 2.096 | .213 | 47.746 | 2.619 | 8.728 | |
| 12-2026 | 19.6 | 58.8 | 4.1 | .882 | 1.799 | .183 | 47.746 | 2.619 | 8.728 | |
| 12-2027 | 17.2 | 51.7 | 3.6 | .775 | 1.581 | .160 | 47.746 | 2.619 | 8.728 | |
| 12-2028 | 15.4 | 46.3 | 3.2 | .695 | 1.418 | .144 | 47.746 | 2.619 | 8.728 | |
| 12-2029 | 14.0 | 41.9 | 2.9 | .628 | 1.281 | .130 | 47.746 | 2.619 | 8.728 | |
| 12-2030 | 12.8 | 38.3 | 2.6 | .575 | 1.173 | .119 | 47.746 | 2.619 | 8.728 | |
| 12-2031 | 11.8 | 35.3 | 2.4 | .529 | 1.079 | .110 | 47.746 | 2.619 | 8.728 | |
| 12-2032 | 10.8 | 32.5 | 2.2 | .488 | .996 | .101 | 47.746 | 2.619 | 8.728 | |
| 12-2033 | 9.9 | 29.8 | 2.1 | .448 | .913 | .093 | 47.746 | 2.619 | 8.728 | |
| 12-2034 | 9.2 | 27.5 | 1.9 | .412 | .840 | .085 | 47.746 | 2.619 | 8.728 | |
| 12-2035 | 8.4 | 25.3 | 1.7 | .379 | .773 | .078 | 47.746 | 2.619 | 8.728 | |
| 12-2036 | 7.8 | 23.3 | 1.6 | .350 | .713 | .072 | 47.746 | 2.619 | 8.728 | |
| S Tot | 415.2 | 1,245.7 | 86.0 | 18.685 | 38.118 | 3.868 | 47.746 | 2.619 | 8.728 | |
| After | 23.0 | 69.1 | 4.8 | 1.037 | 2.116 | .215 | 47.746 | 2.619 | 8.728 | |
| Total | 438.3 | 1,314.8 | 90.7 | 19.722 | 40.234 | 4.083 | 47.746 | 2.619 | 8.728 | |
| Cum | .0 | .0 | .0 | | | | | | | |
| Ult | 438.3 | 1,314.8 | 90.7 | | | | | | | |
| (11) | (12) | (13) | (14) | (15) | (16) | (17) | (18) | (19) | (20) | |
| | Oil | Gas | NGL | Hedge | Other | Total | Production | Ad Valorem | | |
| End | Revenue | Revenue | Revenue | Revenue | Revenue | Revenue | Taxes | Taxes | $/BOE6 | |
| Mo-Year | M$ | M$ | M$ | M$ | M$ | M$ | M$ | M$ | | |
| 12-2018 | .000 | .000 | .000 | 0.000 | 0.000 | .000 | .000 | .000 | .000 | |
| 12-2019 | .000 | .000 | .000 | 0.000 | 0.000 | .000 | .000 | .000 | .000 | |
| 12-2020 | 104.370 | 11.678 | 3.949 | 0.000 | 0.000 | 119.997 | 5.994 | 3.000 | 3.811 | |
| 12-2021 | 202.557 | 22.665 | 7.664 | 0.000 | 0.000 | 232.886 | 11.633 | 5.822 | 4.807 | |
| 12-2022 | 107.055 | 11.979 | 4.051 | 0.000 | 0.000 | 123.084 | 6.148 | 3.077 | 6.450 | |
| 12-2023 | 75.561 | 8.455 | 2.859 | 0.000 | 0.000 | 86.875 | 4.339 | 2.172 | 7.903 | |
| 12-2024 | 59.376 | 6.644 | 2.247 | 0.000 | 0.000 | 68.267 | 3.410 | 1.707 | 9.248 | |
| 12-2025 | 49.067 | 5.490 | 1.857 | 0.000 | 0.000 | 56.414 | 2.818 | 1.410 | 10.568 | |
| 12-2026 | 42.111 | 4.712 | 1.593 | 0.000 | 0.000 | 48.416 | 2.418 | 1.210 | 11.824 | |
| 12-2027 | 37.013 | 4.141 | 1.400 | 0.000 | 0.000 | 42.555 | 2.126 | 1.064 | 13.044 | |
| 12-2028 | 33.188 | 3.714 | 1.256 | 0.000 | 0.000 | 38.157 | 1.906 | .954 | 14.205 | |
| 12-2029 | 29.991 | 3.356 | 1.135 | 0.000 | 0.000 | 34.482 | 1.722 | .862 | 15.404 | |
| 12-2030 | 27.461 | 3.073 | 1.039 | 0.000 | 0.000 | 31.573 | 1.577 | .789 | 16.550 | |
| 12-2031 | 25.261 | 2.827 | .956 | 0.000 | 0.000 | 29.043 | 1.451 | .726 | 17.733 | |
| 12-2032 | 23.302 | 2.607 | .882 | 0.000 | 0.000 | 26.791 | 1.338 | .670 | 18.974 | |
| 12-2033 | 21.378 | 2.392 | .809 | 0.000 | 0.000 | 24.579 | 1.228 | .614 | 20.414 | |
| 12-2034 | 19.669 | 2.201 | .744 | 0.000 | 0.000 | 22.614 | 1.130 | .565 | 21.931 | |
| 12-2035 | 18.097 | 2.025 | .685 | 0.000 | 0.000 | 20.806 | 1.039 | .520 | 23.579 | |
| 12-2036 | 16.694 | 1.868 | .632 | 0.000 | 0.000 | 19.193 | .959 | .480 | 25.311 | |
| S Tot | 892.150 | 99.826 | 33.757 | 0.000 | 0.000 | 1,025.734 | 51.236 | 25.643 | 9.755 | |
| After | 49.516 | 5.541 | 1.874 | 0.000 | 0.000 | 56.930 | 2.844 | 1.423 | 29.953 | |
| Total | 941.666 | 105.367 | 35.631 | 0.000 | 0.000 | 1,082.664 | 54.080 | 27.067 | 10.817 | |
| (21) | (22) | (23) | (24) | (25) | (26) | (27) | (28) | (29) | (30) | (31) | |
| | Operating | Wells | Workover | 3rd Party | Other | | Future Net | Cumulative | Cum.Cash Flow | |
| End | Expense | Gross | Net | Expense | COPAS | Deductions | Investment | Cash Flow | Cash Flow | Disc.@ 10. % | |
| Mo-Year | M$ | Count | M$ | M$ | M$ | M$ | M$ | M$ | M$ | |
| 12-2018 | .000 | 0 | 0.0 | 0.000 | 0.000 | 0.000 | .000 | .000 | .000 | .000 | |
| 12-2019 | .000 | 0 | 0.0 | 0.000 | 0.000 | 0.000 | .000 | .000 | .000 | .000 | |
| 12-2020 | 2.725 | 1 | 0.1 | 0.000 | 0.000 | 9.560 | 480.000 | -381.282 | -381.282 | -299.629 | |
| 12-2021 | 11.520 | 1 | 0.1 | 0.000 | 0.000 | 18.553 | .000 | 185.358 | -195.924 | -165.804 | |
| 12-2022 | 11.520 | 1 | 0.1 | 0.000 | 0.000 | 9.806 | .000 | 92.533 | -103.391 | -105.298 | |
| 12-2023 | 11.520 | 1 | 0.1 | 0.000 | 0.000 | 6.921 | .000 | 61.923 | -41.468 | -68.529 | |
| 12-2024 | 11.520 | 1 | 0.1 | 0.000 | 0.000 | 5.439 | .000 | 46.192 | 4.724 | -43.609 | |
| 12-2025 | 11.520 | 1 | 0.1 | 0.000 | 0.000 | 4.494 | .000 | 36.172 | 40.896 | -25.877 | |
| 12-2026 | 11.520 | 1 | 0.1 | 0.000 | 0.000 | 3.857 | .000 | 29.410 | 70.306 | -12.772 | |
| 12-2027 | 11.520 | 1 | 0.1 | 0.000 | 0.000 | 3.390 | .000 | 24.455 | 94.761 | -2.867 | |
| 12-2028 | 11.520 | 1 | 0.1 | 0.000 | 0.000 | 3.040 | .000 | 20.737 | 115.498 | 4.768 | |
| 12-2029 | 11.520 | 1 | 0.1 | 0.000 | 0.000 | 2.747 | .000 | 17.630 | 133.129 | 10.668 | |
| 12-2030 | 11.520 | 1 | 0.1 | 0.000 | 0.000 | 2.515 | .000 | 15.171 | 148.300 | 15.283 | |
| 12-2031 | 11.520 | 1 | 0.1 | 0.000 | 0.000 | 2.314 | .000 | 13.032 | 161.332 | 18.887 | |
| 12-2032 | 11.520 | 1 | 0.1 | 0.000 | 0.000 | 2.134 | .000 | 11.129 | 172.461 | 21.686 | |
| 12-2033 | 11.520 | 1 | 0.1 | 0.000 | 0.000 | 1.958 | .000 | 9.259 | 181.720 | 23.802 | |
| 12-2034 | 11.520 | 1 | 0.1 | 0.000 | 0.000 | 1.802 | .000 | 7.598 | 189.317 | 25.382 | |
| 12-2035 | 11.520 | 1 | 0.1 | 0.000 | 0.000 | 1.658 | .000 | 6.069 | 195.387 | 26.529 | |
| 12-2036 | 11.520 | 1 | 0.1 | 0.000 | 0.000 | 1.529 | .000 | 4.706 | 200.092 | 27.337 | |
| S Tot | 187.045 | | | 0.000 | 0.000 | 81.717 | 480.000 | 200.092 | 200.092 | 27.337 | |
| After | 41.269 | | | 0.000 | 0.000 | 4.535 | .000 | 6.859 | 206.951 | 28.341 | |
| Total | 228.314 | | | 0.000 | 0.000 | 86.252 | 480.000 | 206.951 | 206.951 | 28.341 | |
| Evaluation Parameters (Gross) | | Expenses (Gross) | | Percent Interests | | Percent | Cum. Disc. | |
| | Initial | Final | Units | | Dei | n | Def | | Initial | Final | Units | | | | Final | | 5.00 | 93.108 | |
| Oil Rate | 22,812. | 459. | bbls/mo | | 96.3% | 1.20 | 0.0% | | 13,416. | 16,000. | $/w/mo | | Expense | 6.0000 | 6.0000 | | 8.00 | 50.145 | |
| Gas Rate | 68,437. | 1,378. | Mcf/mo | | 0.0% | 0.00 | 0.0% | | | | | | Revenue | | | | 10.00 | 28.341 | |
| GOR | 3,000. | 3,000. | scf/bbl | | | | | | | | | | Oil | 4.5000 | 4.5000 | | 12.00 | 10.680 | |
| NGL Rate | 3,628. | 97. | bbls/mo | | | | | | | | | | Gas | 4.5000 | 4.5000 | | 15.00 | -9.825 | |
| NGL Yield | 53.0 | 70.6 | bbl/MMcf | | | | | | | | | | | | | | 20.00 | -32.715 | |
| Gas Shrinkage | 48.7 | 32.3 | % | | | | | | | | | | | | | | | | |
| Oil Severance | 4.6 | 4.6 | % | | | | | | | | | | | | | | | | |
| Gas Severance | 7.5 | 7.5 | % | | | | | | | | | | | | | | | | |
| NGL Severance | 7.5 | 7.5 | % | | | | | | | | | | | | | | | | |
| Ad Valorem | 2.9 | | % | | | | | | | | | | | | | | | | |
| | Start Date: 10/2020 | 3 Months in year ‘20 | 19.837 Year Life (08/2040) |
THESE DATA ARE PART OF A CG&A REPORT AND ARE SUBJECT TO THE CONDITIONS IN THE TEXT OF THE REPORT.
TEXAS REGISTERED ENGINEERING FIRM F-693. | ASN 494 | DEFAULT 1/10/2018 10:34:19
OIL PUD
Table 2 |
Cawley, Gillespie & Associates, Inc.
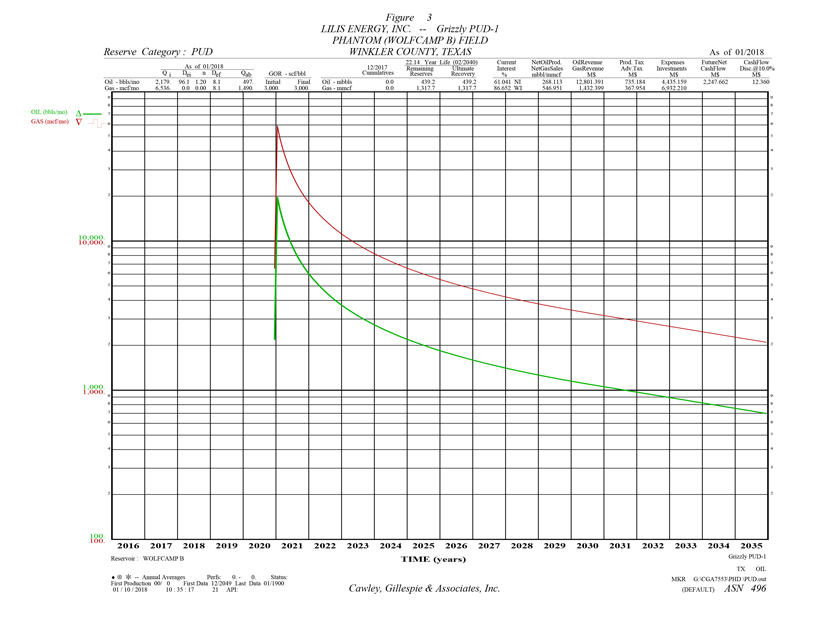
Table 3
Reserve Estimates and Economic Forecasts as of December 31, 2017
Lilis Energy, Inc. Interests
Proved Undeveloped Reserves
LILIS ENERGY, INC. -- GRIZZLY PUD-1
PHANTOM (WOLFCAMP B) FIELD -- WINKLER COUNTY, TEXAS
| (1) | (2) | (3) | (4) | (5) | (6) | (7) | (8) | (9) | (10) | |
| | Gross Oil | Gross Gas | Gross NGL | Net Oil | Net Gas | Net NGL | Avg Oil | Avg Gas | Avg NGL | |
| End | Production | Production | Production | Production | Sales | Production | Price | Price | Price | |
| Mo-Year | MBBLS | MMCF | MBBLS | MBBLS | MMCF | MBBLS | $/BBL | $/MCF | $/BBL | |
| 12-2018 | .0 | .0 | .0 | .000 | .000 | .000 | .000 | .000 | .000 | |
| 12-2019 | .0 | .0 | .0 | .000 | .000 | .000 | .000 | .000 | .000 | |
| 12-2020 | 2.2 | 6.7 | .5 | 1.355 | 2.763 | .280 | 47.746 | 2.619 | 8.728 | |
| 12-2021 | 126.1 | 378.4 | 26.1 | 77.002 | 157.085 | 15.939 | 47.746 | 2.619 | 8.728 | |
| 12-2022 | 56.1 | 168.3 | 11.6 | 34.240 | 69.849 | 7.088 | 47.746 | 2.619 | 8.728 | |
| 12-2023 | 38.1 | 114.3 | 7.9 | 23.258 | 47.446 | 4.814 | 47.746 | 2.619 | 8.728 | |
| 12-2024 | 29.4 | 88.3 | 6.1 | 17.957 | 36.631 | 3.717 | 47.746 | 2.619 | 8.728 | |
| 12-2025 | 24.1 | 72.2 | 5.0 | 14.688 | 29.964 | 3.040 | 47.746 | 2.619 | 8.728 | |
| 12-2026 | 20.5 | 61.5 | 4.2 | 12.522 | 25.545 | 2.592 | 47.746 | 2.619 | 8.728 | |
| 12-2027 | 17.9 | 53.8 | 3.7 | 10.954 | 22.346 | 2.267 | 47.746 | 2.619 | 8.728 | |
| 12-2028 | 16.0 | 48.1 | 3.3 | 9.788 | 19.967 | 2.026 | 47.746 | 2.619 | 8.728 | |
| 12-2029 | 14.5 | 43.4 | 3.0 | 8.821 | 17.995 | 1.826 | 47.746 | 2.619 | 8.728 | |
| 12-2030 | 13.2 | 39.6 | 2.7 | 8.060 | 16.443 | 1.669 | 47.746 | 2.619 | 8.728 | |
| 12-2031 | 12.1 | 36.4 | 2.5 | 7.412 | 15.120 | 1.534 | 47.746 | 2.619 | 8.728 | |
| 12-2032 | 11.2 | 33.6 | 2.3 | 6.837 | 13.948 | 1.415 | 47.746 | 2.619 | 8.728 | |
| 12-2033 | 10.3 | 30.8 | 2.1 | 6.273 | 12.796 | 1.298 | 47.746 | 2.619 | 8.728 | |
| 12-2034 | 9.5 | 28.4 | 2.0 | 5.771 | 11.773 | 1.195 | 47.746 | 2.619 | 8.728 | |
| 12-2035 | 8.7 | 26.1 | 1.8 | 5.310 | 10.832 | 1.099 | 47.746 | 2.619 | 8.728 | |
| 12-2036 | 8.0 | 24.1 | 1.7 | 4.898 | 9.992 | 1.014 | 47.746 | 2.619 | 8.728 | |
| S Tot | 418.0 | 1,254.0 | 86.5 | 255.145 | 520.496 | 52.815 | 47.746 | 2.619 | 8.728 | |
| After | 21.2 | 63.7 | 4.4 | 12.968 | 26.455 | 2.684 | 47.746 | 2.619 | 8.728 | |
| Total | 439.2 | 1,317.7 | 90.9 | 268.113 | 546.951 | 55.499 | 47.746 | 2.619 | 8.728 | |
| Cum | .0 | .0 | .0 | | | | | | | |
| Ult | 439.2 | 1,317.7 | 90.9 | | | | | | | |
| (11) | (12) | (13) | (14) | (15) | (16) | (17) | (18) | (19) | (20) | |
| | Oil | Gas | NGL | Hedge | Other | Total | Production | Ad Valorem | | |
| End | Revenue | Revenue | Revenue | Revenue | Revenue | Revenue | Taxes | Taxes | $/BOE6 | |
| Mo-Year | M$ | M$ | M$ | M$ | M$ | M$ | M$ | M$ | | |
| 12-2018 | .000 | .000 | .000 | 0.000 | 0.000 | .000 | .000 | .000 | .000 | |
| 12-2019 | .000 | .000 | .000 | 0.000 | 0.000 | .000 | .000 | .000 | .000 | |
| 12-2020 | 64.675 | 7.237 | 2.447 | 0.000 | 0.000 | 74.359 | 3.714 | 1.859 | 3.829 | |
| 12-2021 | 3,676.569 | 411.386 | 139.114 | 0.000 | 0.000 | 4,227.069 | 211.145 | 105.677 | 4.623 | |
| 12-2022 | 1,634.816 | 182.926 | 61.858 | 0.000 | 0.000 | 1,879.601 | 93.887 | 46.990 | 6.453 | |
| 12-2023 | 1,110.485 | 124.257 | 42.018 | 0.000 | 0.000 | 1,276.760 | 63.775 | 31.919 | 8.009 | |
| 12-2024 | 857.358 | 95.933 | 32.441 | 0.000 | 0.000 | 985.731 | 49.238 | 24.643 | 9.441 | |
| 12-2025 | 701.297 | 78.471 | 26.536 | 0.000 | 0.000 | 806.304 | 40.275 | 20.158 | 10.839 | |
| 12-2026 | 597.870 | 66.898 | 22.622 | 0.000 | 0.000 | 687.390 | 34.336 | 17.185 | 12.168 | |
| 12-2027 | 523.017 | 58.522 | 19.790 | 0.000 | 0.000 | 601.329 | 30.037 | 15.033 | 13.458 | |
| 12-2028 | 467.328 | 52.291 | 17.683 | 0.000 | 0.000 | 537.302 | 26.839 | 13.433 | 14.685 | |
| 12-2029 | 421.170 | 47.126 | 15.936 | 0.000 | 0.000 | 484.232 | 24.188 | 12.106 | 15.949 | |
| 12-2030 | 384.858 | 43.063 | 14.562 | 0.000 | 0.000 | 442.483 | 22.102 | 11.062 | 17.156 | |
| 12-2031 | 353.885 | 39.598 | 13.390 | 0.000 | 0.000 | 406.873 | 20.324 | 10.172 | 18.381 | |
| 12-2032 | 326.448 | 36.528 | 12.352 | 0.000 | 0.000 | 375.328 | 18.748 | 9.383 | 19.660 | |
| 12-2033 | 299.494 | 33.512 | 11.332 | 0.000 | 0.000 | 344.338 | 17.200 | 8.608 | 21.145 | |
| 12-2034 | 275.550 | 30.832 | 10.426 | 0.000 | 0.000 | 316.809 | 15.825 | 7.920 | 22.708 | |
| 12-2035 | 253.521 | 28.367 | 9.593 | 0.000 | 0.000 | 291.481 | 14.560 | 7.287 | 24.407 | |
| 12-2036 | 233.865 | 26.168 | 8.849 | 0.000 | 0.000 | 268.882 | 13.431 | 6.722 | 26.193 | |
| S Tot | 12,182.206 | 1,363.116 | 460.950 | 0.000 | 0.000 | 14,006.271 | 699.624 | 350.157 | 10.237 | |
| After | 619.186 | 69.283 | 23.429 | 0.000 | 0.000 | 711.898 | 35.560 | 17.797 | 30.532 | |
| Total | 12,801.391 | 1,432.399 | 484.378 | 0.000 | 0.000 | 14,718.169 | 735.184 | 367.954 | 11.218 | |
| (21) | (22) | (23) | (24) | (25) | (26) | (27) | (28) | (29) | (30) | (31) | |
| | Operating | Wells | Workover | 3rd Party | Other | | Future Net | Cumulative | Cum.Cash Flow | |
| End | Expense | Gross | Net | Expense | COPAS | Deductions | Investment | Cash Flow | Cash Flow | Disc.@ 10. % | |
| Mo-Year | M$ | Count | M$ | M$ | M$ | M$ | M$ | M$ | M$ | |
| 12-2018 | .000 | 0 | 0.0 | 0.000 | 0.000 | 0.000 | .000 | .000 | .000 | .000 | |
| 12-2019 | .000 | 0 | 0.0 | 0.000 | 0.000 | 0.000 | .000 | .000 | .000 | .000 | |
| 12-2020 | 1.342 | 1 | 0.9 | 0.000 | 0.000 | 6.307 | 6,932.210 | -6,871.074 | -6,871.074 | -5,248.314 | |
| 12-2021 | 166.373 | 1 | 0.9 | 0.000 | 0.000 | 358.538 | .000 | 3,385.336 | -3,485.738 | -2,797.464 | |
| 12-2022 | 166.373 | 1 | 0.9 | 0.000 | 0.000 | 159.427 | .000 | 1,412.923 | -2,072.815 | -1,873.130 | |
| 12-2023 | 166.373 | 1 | 0.9 | 0.000 | 0.000 | 108.294 | .000 | 906.399 | -1,166.416 | -1,334.803 | |
| 12-2024 | 166.373 | 1 | 0.9 | 0.000 | 0.000 | 83.609 | .000 | 661.868 | -504.548 | -977.693 | |
| 12-2025 | 166.373 | 1 | 0.9 | 0.000 | 0.000 | 68.390 | .000 | 511.108 | 6.560 | -727.112 | |
| 12-2026 | 166.373 | 1 | 0.9 | 0.000 | 0.000 | 58.304 | .000 | 411.193 | 417.752 | -543.876 | |
| 12-2027 | 166.373 | 1 | 0.9 | 0.000 | 0.000 | 51.004 | .000 | 338.881 | 756.634 | -406.607 | |
| 12-2028 | 166.373 | 1 | 0.9 | 0.000 | 0.000 | 45.574 | .000 | 285.084 | 1,041.718 | -301.641 | |
| 12-2029 | 166.373 | 1 | 0.9 | 0.000 | 0.000 | 41.072 | .000 | 240.493 | 1,282.211 | -221.161 | |
| 12-2030 | 166.373 | 1 | 0.9 | 0.000 | 0.000 | 37.531 | .000 | 205.414 | 1,487.626 | -158.669 | |
| 12-2031 | 166.373 | 1 | 0.9 | 0.000 | 0.000 | 34.511 | .000 | 175.494 | 1,663.119 | -110.129 | |
| 12-2032 | 166.373 | 1 | 0.9 | 0.000 | 0.000 | 31.835 | .000 | 148.989 | 1,812.108 | -72.662 | |
| 12-2033 | 166.373 | 1 | 0.9 | 0.000 | 0.000 | 29.207 | .000 | 122.950 | 1,935.058 | -44.555 | |
| 12-2034 | 166.373 | 1 | 0.9 | 0.000 | 0.000 | 26.872 | .000 | 99.819 | 2,034.877 | -23.807 | |
| 12-2035 | 166.373 | 1 | 0.9 | 0.000 | 0.000 | 24.723 | .000 | 78.538 | 2,113.415 | -8.962 | |
| 12-2036 | 166.373 | 1 | 0.9 | 0.000 | 0.000 | 22.806 | .000 | 59.550 | 2,172.965 | 1.276 | |
| S Tot | 2,663.311 | | | 0.000 | 0.000 | 1,188.005 | 6,932.210 | 2,172.965 | 2,172.965 | 1.276 | |
| After | 523.460 | | | 0.000 | 0.000 | 60.383 | .000 | 74.698 | 2,247.662 | 12.360 | |
| Total | 3,186.771 | | | 0.000 | 0.000 | 1,248.388 | 6,932.210 | 2,247.662 | 2,247.662 | 12.360 | |
| Evaluation Parameters (Gross) | | Expenses (Gross) | | Percent Interests | | Percent | Cum. Disc. | |
| | Initial | Final | Units | | Dei | n | Def | | Initial | Final | Units | | | | Final | | 5.00 | 809.355 | |
| Oil Rate | 22,812. | 492. | bbls/mo | | 96.1% | 1.20 | 0.0% | | 1,547. | 15,999. | $/w/mo | | Expense | 86.6526 | 86.6526 | | 8.00 | 277.684 | |
| Gas Rate | 68,437. | 1,476. | Mcf/mo | | 0.0% | 0.00 | 0.0% | | | | | | Revenue | | | | 10.00 | 12.360 | |
| GOR | 3,000. | 3,000. | scf/bbl | | | | | | | | | | Oil | 61.0414 | 61.0414 | | 12.00 | -199.211 | |
| NGL Rate | 459. | 104. | bbls/mo | | | | | | | | | | Gas | 61.0414 | 61.0414 | | 15.00 | -439.270 | |
| NGL Yield | 6.7 | 70.9 | bbl/MMcf | | | | | | | | | | | | | | 20.00 | -695.012 | |
| Gas Shrinkage | 93.5 | 31.5 | % | | | | | | | | | | | | | | | | |
| Oil Severance | 4.6 | 4.6 | % | | | | | | | | | | | | | | | | |
| Gas Severance | 7.5 | 7.5 | % | | | | | | | | | | | | | | | | |
| NGL Severance | 7.5 | 7.5 | % | | | | | | | | | | | | | | | | |
| Ad Valorem | 42.4 | | % | | | | | | | | | | | | | | | | |
| | Start Date: 12/2020 | 1 Months in year ‘20 | 19.229 Year Life (02/2040) |
THESE DATA ARE PART OF A CG&A REPORT AND ARE SUBJECT TO THE CONDITIONS IN THE TEXT OF THE REPORT.
TEXAS REGISTERED ENGINEERING FIRM F-693. | ASN 496 | DEFAULT 1/10/2018 10:34:19 OIL PUD Table 3 |
Cawley, Gillespie & Associates, Inc.
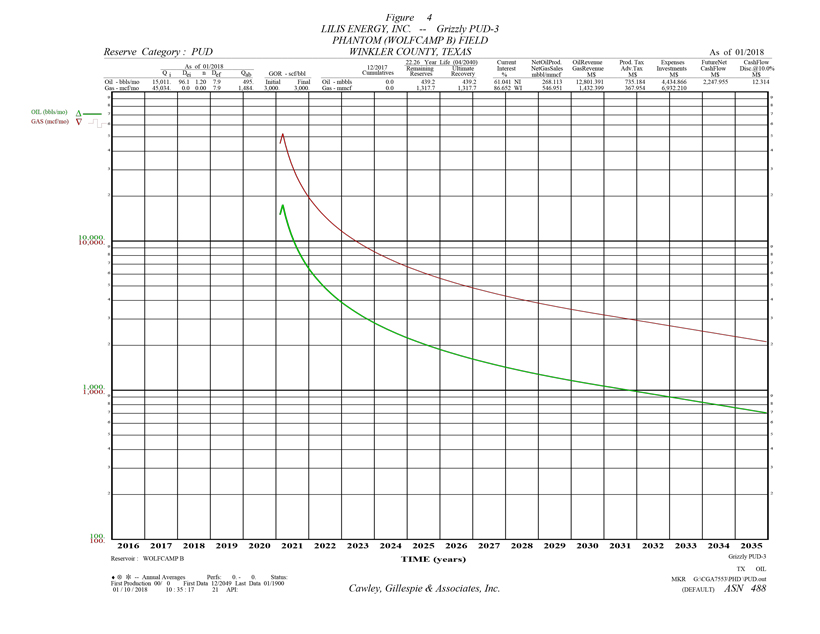
Table 4
Reserve Estimates and Economic Forecasts as of December 31, 2017
Lilis Energy, Inc. Interests
Proved Undeveloped Reserves
LILIS ENERGY, INC. -- GRIZZLY PUD-3
PHANTOM (WOLFCAMP B) FIELD -- WINKLER COUNTY, TEXAS
| (1) | (2) | (3) | (4) | (5) | (6) | (7) | (8) | (9) | (10) | |
| | Gross Oil | Gross Gas | Gross NGL | Net Oil | Net Gas | Net NGL | Avg Oil | Avg Gas | Avg NGL | |
| End | Production | Production | Production | Production | Sales | Production | Price | Price | Price | |
| Mo-Year | MBBLS | MMCF | MBBLS | MBBLS | MMCF | MBBLS | $/BBL | $/MCF | $/BBL | |
| 12-2018 | .0 | .0 | .0 | .000 | .000 | .000 | .000 | .000 | .000 | |
| 12-2019 | .0 | .0 | .0 | .000 | .000 | .000 | .000 | .000 | .000 | |
| 12-2020 | .0 | .0 | .0 | .000 | .000 | .000 | .000 | .000 | .000 | |
| 12-2021 | 119.7 | 359.1 | 24.8 | 73.061 | 149.045 | 15.124 | 47.746 | 2.619 | 8.728 | |
| 12-2022 | 59.5 | 178.6 | 12.3 | 36.333 | 74.120 | 7.521 | 47.746 | 2.619 | 8.728 | |
| 12-2023 | 39.5 | 118.5 | 8.2 | 24.115 | 49.194 | 4.992 | 47.746 | 2.619 | 8.728 | |
| 12-2024 | 30.2 | 90.6 | 6.3 | 18.432 | 37.602 | 3.815 | 47.746 | 2.619 | 8.728 | |
| 12-2025 | 24.6 | 73.7 | 5.1 | 14.992 | 30.584 | 3.103 | 47.746 | 2.619 | 8.728 | |
| 12-2026 | 20.9 | 62.6 | 4.3 | 12.735 | 25.979 | 2.636 | 47.746 | 2.619 | 8.728 | |
| 12-2027 | 18.2 | 54.6 | 3.8 | 11.112 | 22.669 | 2.300 | 47.746 | 2.619 | 8.728 | |
| 12-2028 | 16.2 | 48.7 | 3.4 | 9.911 | 20.218 | 2.051 | 47.746 | 2.619 | 8.728 | |
| 12-2029 | 14.6 | 43.8 | 3.0 | 8.919 | 18.194 | 1.846 | 47.746 | 2.619 | 8.728 | |
| 12-2030 | 13.3 | 40.0 | 2.8 | 8.141 | 16.607 | 1.685 | 47.746 | 2.619 | 8.728 | |
| 12-2031 | 12.3 | 36.8 | 2.5 | 7.483 | 15.266 | 1.549 | 47.746 | 2.619 | 8.728 | |
| 12-2032 | 11.3 | 33.9 | 2.3 | 6.903 | 14.082 | 1.429 | 47.746 | 2.619 | 8.728 | |
| 12-2033 | 10.4 | 31.1 | 2.1 | 6.333 | 12.919 | 1.311 | 47.746 | 2.619 | 8.728 | |
| 12-2034 | 9.5 | 28.6 | 2.0 | 5.827 | 11.887 | 1.206 | 47.746 | 2.619 | 8.728 | |
| 12-2035 | 8.8 | 26.3 | 1.8 | 5.361 | 10.936 | 1.110 | 47.746 | 2.619 | 8.728 | |
| 12-2036 | 8.1 | 24.3 | 1.7 | 4.945 | 10.088 | 1.024 | 47.746 | 2.619 | 8.728 | |
| S Tot | 417.1 | 1,251.3 | 86.3 | 254.604 | 519.391 | 52.703 | 47.746 | 2.619 | 8.728 | |
| After | 22.1 | 66.4 | 4.6 | 13.510 | 27.560 | 2.797 | 47.746 | 2.619 | 8.728 | |
| Total | 439.2 | 1,317.7 | 90.9 | 268.113 | 546.951 | 55.499 | 47.746 | 2.619 | 8.728 | |
| Cum | .0 | .0 | .0 | | | | | | | |
| Ult | 439.2 | 1,317.7 | 90.9 | | | | | | | |
| (11) | (12) | (13) | (14) | (15) | (16) | (17) | (18) | (19) | (20) | |
| | Oil | Gas | NGL | Hedge | Other | Total | Production | Ad Valorem | | |
| End | Revenue | Revenue | Revenue | Revenue | Revenue | Revenue | Taxes | Taxes | $/BOE6 | |
| Mo-Year | M$ | M$ | M$ | M$ | M$ | M$ | M$ | M$ | | |
| 12-2018 | .000 | .000 | .000 | 0.000 | 0.000 | .000 | .000 | .000 | .000 | |
| 12-2019 | .000 | .000 | .000 | 0.000 | 0.000 | .000 | .000 | .000 | .000 | |
| 12-2020 | .000 | .000 | .000 | 0.000 | 0.000 | .000 | .000 | .000 | .000 | |
| 12-2021 | 3,488.395 | 390.331 | 131.994 | 0.000 | 0.000 | 4,010.719 | 200.338 | 100.268 | 4.537 | |
| 12-2022 | 1,734.778 | 194.111 | 65.640 | 0.000 | 0.000 | 1,994.530 | 99.628 | 49.863 | 6.263 | |
| 12-2023 | 1,151.397 | 128.834 | 43.567 | 0.000 | 0.000 | 1,323.798 | 66.125 | 33.095 | 7.837 | |
| 12-2024 | 880.071 | 98.475 | 33.300 | 0.000 | 0.000 | 1,011.846 | 50.542 | 25.296 | 9.279 | |
| 12-2025 | 715.822 | 80.096 | 27.085 | 0.000 | 0.000 | 823.003 | 41.110 | 20.575 | 10.684 | |
| 12-2026 | 608.043 | 68.036 | 23.007 | 0.000 | 0.000 | 699.086 | 34.920 | 17.477 | 12.018 | |
| 12-2027 | 530.570 | 59.368 | 20.076 | 0.000 | 0.000 | 610.013 | 30.471 | 15.250 | 13.311 | |
| 12-2028 | 473.191 | 52.947 | 17.905 | 0.000 | 0.000 | 544.043 | 27.175 | 13.601 | 14.543 | |
| 12-2029 | 425.840 | 47.649 | 16.113 | 0.000 | 0.000 | 489.602 | 24.456 | 12.240 | 15.808 | |
| 12-2030 | 388.690 | 43.492 | 14.707 | 0.000 | 0.000 | 446.890 | 22.322 | 11.172 | 17.018 | |
| 12-2031 | 357.294 | 39.979 | 13.519 | 0.000 | 0.000 | 410.793 | 20.519 | 10.270 | 18.235 | |
| 12-2032 | 329.593 | 36.880 | 12.471 | 0.000 | 0.000 | 378.944 | 18.929 | 9.474 | 19.503 | |
| 12-2033 | 302.379 | 33.834 | 11.441 | 0.000 | 0.000 | 347.655 | 17.366 | 8.691 | 20.974 | |
| 12-2034 | 278.205 | 31.129 | 10.527 | 0.000 | 0.000 | 319.861 | 15.977 | 7.997 | 22.522 | |
| 12-2035 | 255.963 | 28.641 | 9.685 | 0.000 | 0.000 | 294.289 | 14.700 | 7.357 | 24.204 | |
| 12-2036 | 236.118 | 26.420 | 8.934 | 0.000 | 0.000 | 271.473 | 13.560 | 6.787 | 25.973 | |
| S Tot | 12,156.350 | 1,360.223 | 459.971 | 0.000 | 0.000 | 13,976.545 | 698.139 | 349.414 | 10.201 | |
| After | 645.041 | 72.176 | 24.407 | 0.000 | 0.000 | 741.624 | 37.045 | 18.541 | 30.382 | |
| Total | 12,801.391 | 1,432.399 | 484.378 | 0.000 | 0.000 | 14,718.169 | 735.184 | 367.954 | 11.218 | |
| (21) | (22) | (23) | (24) | (25) | (26) | (27) | (28) | (29) | (30) | (31) | |
| | Operating | Wells | Workover | 3rd Party | Other | | Future Net | Cumulative | Cum.Cash Flow | |
| End | Expense | Gross | Net | Expense | COPAS | Deductions | Investment | Cash Flow | Cash Flow | Disc.@ 10. % | |
| Mo-Year | M$ | Count | M$ | M$ | M$ | M$ | M$ | M$ | M$ | |
| 12-2018 | .000 | 0 | 0.0 | 0.000 | 0.000 | 0.000 | .000 | .000 | .000 | .000 | |
| 12-2019 | .000 | 0 | 0.0 | 0.000 | 0.000 | 0.000 | .000 | .000 | .000 | .000 | |
| 12-2020 | .000 | 0 | 0.0 | 0.000 | 0.000 | 0.000 | 6,932.210 | -6,932.210 | -6,932.210 | -5,236.550 | |
| 12-2021 | 148.547 | 1 | 0.9 | 0.000 | 0.000 | 340.187 | .000 | 3,221.378 | -3,710.832 | -2,919.833 | |
| 12-2022 | 166.373 | 1 | 0.9 | 0.000 | 0.000 | 169.175 | .000 | 1,509.490 | -2,201.342 | -1,932.046 | |
| 12-2023 | 166.373 | 1 | 0.9 | 0.000 | 0.000 | 112.284 | .000 | 945.921 | -1,255.421 | -1,370.186 | |
| 12-2024 | 166.373 | 1 | 0.9 | 0.000 | 0.000 | 85.824 | .000 | 683.810 | -571.610 | -1,001.215 | |
| 12-2025 | 166.373 | 1 | 0.9 | 0.000 | 0.000 | 69.807 | .000 | 525.139 | -46.471 | -743.746 | |
| 12-2026 | 166.373 | 1 | 0.9 | 0.000 | 0.000 | 59.296 | .000 | 421.020 | 374.548 | -556.127 | |
| 12-2027 | 166.373 | 1 | 0.9 | 0.000 | 0.000 | 51.741 | .000 | 346.178 | 720.727 | -415.899 | |
| 12-2028 | 166.373 | 1 | 0.9 | 0.000 | 0.000 | 46.145 | .000 | 290.748 | 1,011.474 | -308.847 | |
| 12-2029 | 166.373 | 1 | 0.9 | 0.000 | 0.000 | 41.528 | .000 | 245.005 | 1,256.479 | -226.856 | |
| 12-2030 | 166.373 | 1 | 0.9 | 0.000 | 0.000 | 37.905 | .000 | 209.117 | 1,465.596 | -163.238 | |
| 12-2031 | 166.373 | 1 | 0.9 | 0.000 | 0.000 | 34.843 | .000 | 178.787 | 1,644.383 | -113.787 | |
| 12-2032 | 166.373 | 1 | 0.9 | 0.000 | 0.000 | 32.142 | .000 | 152.027 | 1,796.410 | -75.556 | |
| 12-2033 | 166.373 | 1 | 0.9 | 0.000 | 0.000 | 29.488 | .000 | 125.737 | 1,922.148 | -46.813 | |
| 12-2034 | 166.373 | 1 | 0.9 | 0.000 | 0.000 | 27.130 | .000 | 102.384 | 2,024.531 | -25.532 | |
| 12-2035 | 166.373 | 1 | 0.9 | 0.000 | 0.000 | 24.961 | .000 | 80.897 | 2,105.429 | -10.242 | |
| 12-2036 | 166.373 | 1 | 0.9 | 0.000 | 0.000 | 23.026 | .000 | 61.726 | 2,167.155 | .370 | |
| S Tot | 2,644.143 | | | 0.000 | 0.000 | 1,185.484 | 6,932.210 | 2,167.155 | 2,167.155 | .370 | |
| After | 542.335 | | | 0.000 | 0.000 | 62.904 | .000 | 80.800 | 2,247.955 | 12.314 | |
| Total | 3,186.478 | | | 0.000 | 0.000 | 1,248.388 | 6,932.210 | 2,247.955 | 2,247.955 | 12.314 | |
| Evaluation Parameters (Gross) | | Expenses (Gross) | | Percent Interests | | Percent | Cum. Disc. | |
| | Initial | Final | Units | | Dei | n | Def | | Initial | Final | Units | | | | Final | | 5.00 | 804.964 | |
| Oil Rate | 22,812. | 492. | bbls/mo | | 96.1% | 1.20 | 0.0% | | 11,428. | 15,999. | $/w/mo | | Expense | 86.6526 | 86.6526 | | 8.00 | 275.339 | |
| Gas Rate | 68,437. | 1,476. | Mcf/mo | | 0.0% | 0.00 | 0.0% | | | | | | Revenue | | | | 10.00 | 12.314 | |
| GOR | 3,000. | 3,000. | scf/bbl | | | | | | | | | | Oil | 61.0414 | 61.0414 | | 12.00 | -196.551 | |
| NGL Rate | 2,858. | 104. | bbls/mo | | | | | | | | | | Gas | 61.0414 | 61.0414 | | 15.00 | -432.193 | |
| NGL Yield | 41.8 | 70.6 | bbl/MMcf | | | | | | | | | | | | | | 20.00 | -680.523 | |
| Gas Shrinkage | 55.3 | 31.8 | % | | | | | | | | | | | | | | | | |
| Oil Severance | 4.6 | 4.6 | % | | | | | | | | | | | | | | | | |
| Gas Severance | 7.5 | 7.5 | % | | | | | | | | | | | | | | | | |
| NGL Severance | 7.5 | 7.5 | % | | | | | | | | | | | | | | | | |
| Ad Valorem | 42.2 | | % | | | | | | | | | | | | | | | | |
| | Start Date: 02/2021 | 11 Months in year ‘21 | 19.178 Year Life (04/2040) |
| THESE DATA ARE PART OF A CG&A REPORT AND ARE SUBJECT TO THE CONDITIONS IN THE TEXT OF THE REPORT. TEXAS REGISTERED ENGINEERING FIRM F-693. | ASN 488 | DEFAULT 1/10/2018 10:34:19 OIL PUD Table 4 |
Cawley, Gillespie & Associates, Inc.
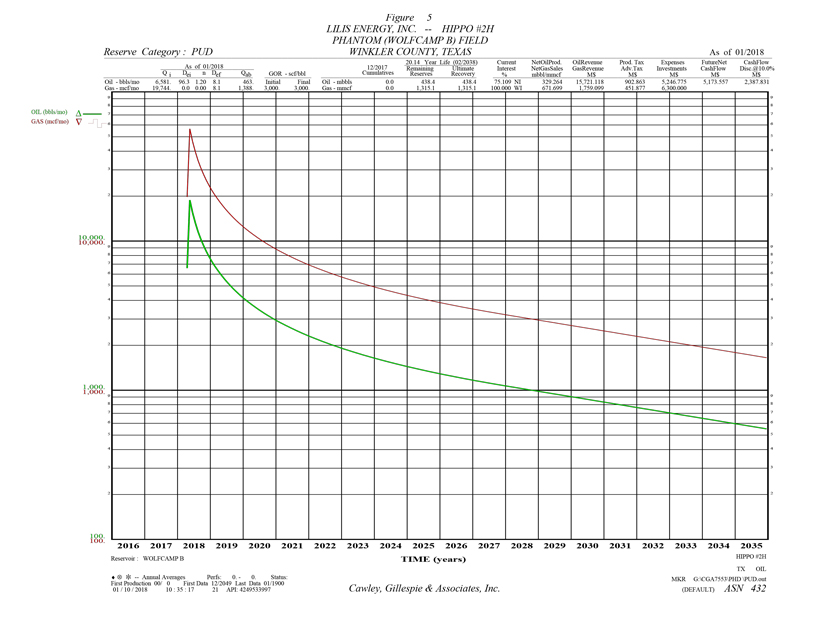
Table 5
Reserve Estimates and Economic Forecasts as of December 31, 2017
Lilis Energy, Inc. Interests
Proved Undeveloped Reserves
LILIS ENERGY, INC. -- HIPPO #2H
PHANTOM (WOLFCAMP B) FIELD -- WINKLER COUNTY, TEXAS
| (1) | (2) | (3) | (4) | (5) | (6) | (7) | (8) | (9) | (10) | |
| | Gross Oil | Gross Gas | Gross NGL | Net Oil | Net Gas | Net NGL | Avg Oil | Avg Gas | Avg NGL | |
| End | Production | Production | Production | Production | Sales | Production | Price | Price | Price | |
| Mo-Year | MBBLS | MMCF | MBBLS | MBBLS | MMCF | MBBLS | $/BBL | $/MCF | $/BBL | |
| 12-2018 | 102.3 | 307.0 | 21.2 | 76.869 | 156.813 | 15.912 | 47.746 | 2.619 | 8.728 | |
| 12-2019 | 66.0 | 197.9 | 13.7 | 49.540 | 101.062 | 10.255 | 47.746 | 2.619 | 8.728 | |
| 12-2020 | 41.8 | 125.4 | 8.7 | 31.393 | 64.042 | 6.498 | 47.746 | 2.619 | 8.728 | |
| 12-2021 | 31.2 | 93.5 | 6.4 | 23.402 | 47.741 | 4.844 | 47.746 | 2.619 | 8.728 | |
| 12-2022 | 25.2 | 75.5 | 5.2 | 18.890 | 38.536 | 3.910 | 47.746 | 2.619 | 8.728 | |
| 12-2023 | 21.2 | 63.7 | 4.4 | 15.938 | 32.513 | 3.299 | 47.746 | 2.619 | 8.728 | |
| 12-2024 | 18.5 | 55.4 | 3.8 | 13.878 | 28.311 | 2.873 | 47.746 | 2.619 | 8.728 | |
| 12-2025 | 16.3 | 49.0 | 3.4 | 12.268 | 25.026 | 2.539 | 47.746 | 2.619 | 8.728 | |
| 12-2026 | 14.7 | 44.1 | 3.0 | 11.043 | 22.528 | 2.286 | 47.746 | 2.619 | 8.728 | |
| 12-2027 | 13.4 | 40.2 | 2.8 | 10.059 | 20.520 | 2.082 | 47.746 | 2.619 | 8.728 | |
| 12-2028 | 12.3 | 37.0 | 2.6 | 9.263 | 18.897 | 1.917 | 47.746 | 2.619 | 8.728 | |
| 12-2029 | 11.3 | 33.9 | 2.3 | 8.498 | 17.337 | 1.759 | 47.746 | 2.619 | 8.728 | |
| 12-2030 | 10.4 | 31.2 | 2.2 | 7.819 | 15.951 | 1.619 | 47.746 | 2.619 | 8.728 | |
| 12-2031 | 9.6 | 28.7 | 2.0 | 7.194 | 14.675 | 1.489 | 47.746 | 2.619 | 8.728 | |
| 12-2032 | 8.8 | 26.5 | 1.8 | 6.636 | 13.538 | 1.374 | 47.746 | 2.619 | 8.728 | |
| 12-2033 | 8.1 | 24.3 | 1.7 | 6.088 | 12.420 | 1.260 | 47.746 | 2.619 | 8.728 | |
| 12-2034 | 7.5 | 22.4 | 1.5 | 5.601 | 11.427 | 1.159 | 47.746 | 2.619 | 8.728 | |
| 12-2035 | 6.9 | 20.6 | 1.4 | 5.154 | 10.513 | 1.067 | 47.746 | 2.619 | 8.728 | |
| 12-2036 | 6.3 | 19.0 | 1.3 | 4.754 | 9.698 | .984 | 47.746 | 2.619 | 8.728 | |
| S Tot | 431.8 | 1,295.3 | 89.4 | 324.288 | 661.547 | 67.128 | 47.746 | 2.619 | 8.728 | |
| After | 6.6 | 19.9 | 1.4 | 4.976 | 10.152 | 1.030 | 47.746 | 2.619 | 8.728 | |
| Total | 438.4 | 1,315.1 | 90.7 | 329.264 | 671.699 | 68.158 | 47.746 | 2.619 | 8.728 | |
| Cum | .0 | .0 | .0 | | | | | | | |
| Ult | 438.4 | 1,315.1 | 90.7 | | | | | | | |
| (11) | (12) | (13) | (14) | (15) | (16) | (17) | (18) | (19) | (20) | |
| | Oil | Gas | NGL | Hedge | Other | Total | Production | Ad Valorem | | |
| End | Revenue | Revenue | Revenue | Revenue | Revenue | Revenue | Taxes | Taxes | $/BOE6 | |
| Mo-Year | M$ | M$ | M$ | M$ | M$ | M$ | M$ | M$ | | |
| 12-2018 | 3,670.208 | 410.674 | 138.873 | 0.000 | 0.000 | 4,219.755 | 210.780 | 105.494 | 4.133 | |
| 12-2019 | 2,365.358 | 264.669 | 89.500 | 0.000 | 0.000 | 2,719.528 | 135.842 | 67.988 | 5.590 | |
| 12-2020 | 1,498.897 | 167.718 | 56.715 | 0.000 | 0.000 | 1,723.330 | 86.082 | 43.083 | 7.109 | |
| 12-2021 | 1,117.376 | 125.028 | 42.279 | 0.000 | 0.000 | 1,284.682 | 64.171 | 32.117 | 8.525 | |
| 12-2022 | 901.945 | 100.922 | 34.128 | 0.000 | 0.000 | 1,036.995 | 51.799 | 25.925 | 9.854 | |
| 12-2023 | 760.976 | 85.149 | 28.794 | 0.000 | 0.000 | 874.918 | 43.703 | 21.873 | 11.131 | |
| 12-2024 | 662.620 | 74.143 | 25.072 | 0.000 | 0.000 | 761.836 | 38.054 | 19.046 | 12.344 | |
| 12-2025 | 585.730 | 65.540 | 22.163 | 0.000 | 0.000 | 673.433 | 33.638 | 16.836 | 13.576 | |
| 12-2026 | 527.263 | 58.998 | 19.951 | 0.000 | 0.000 | 606.212 | 30.281 | 15.155 | 14.753 | |
| 12-2027 | 480.275 | 53.740 | 18.173 | 0.000 | 0.000 | 552.188 | 27.582 | 13.805 | 15.906 | |
| 12-2028 | 442.280 | 49.488 | 16.735 | 0.000 | 0.000 | 508.503 | 25.400 | 12.713 | 17.018 | |
| 12-2029 | 405.761 | 45.402 | 15.353 | 0.000 | 0.000 | 466.517 | 23.303 | 11.663 | 18.283 | |
| 12-2030 | 373.322 | 41.772 | 14.126 | 0.000 | 0.000 | 429.220 | 21.440 | 10.731 | 19.615 | |
| 12-2031 | 343.476 | 38.433 | 12.996 | 0.000 | 0.000 | 394.905 | 19.726 | 9.873 | 21.062 | |
| 12-2032 | 316.846 | 35.453 | 11.989 | 0.000 | 0.000 | 364.288 | 18.196 | 9.107 | 22.583 | |
| 12-2033 | 290.685 | 32.526 | 10.999 | 0.000 | 0.000 | 334.209 | 16.694 | 8.355 | 24.349 | |
| 12-2034 | 267.445 | 29.926 | 10.120 | 0.000 | 0.000 | 307.490 | 15.359 | 7.687 | 26.207 | |
| 12-2035 | 246.064 | 27.533 | 9.311 | 0.000 | 0.000 | 282.907 | 14.131 | 7.073 | 28.227 | |
| 12-2036 | 226.986 | 25.398 | 8.589 | 0.000 | 0.000 | 260.973 | 13.036 | 6.524 | 30.351 | |
| S Tot | 15,483.512 | 1,732.513 | 585.864 | 0.000 | 0.000 | 17,801.889 | 889.218 | 445.047 | 10.467 | |
| After | 237.606 | 26.587 | 8.991 | 0.000 | 0.000 | 273.183 | 13.646 | 6.830 | 32.955 | |
| Total | 15,721.118 | 1,759.099 | 594.855 | 0.000 | 0.000 | 18,075.073 | 902.863 | 451.877 | 10.807 | |
| (21) | (22) | (23) | (24) | (25) | (26) | (27) | (28) | (29) | (30) | (31) | |
| | Operating | Wells | Workover | 3rd Party | Other | | Future Net | Cumulative | Cum.Cash Flow | |
| End | Expense | Gross | Net | Expense | COPAS | Deductions | Investment | Cash Flow | Cash Flow | Disc.@ 10. % | |
| Mo-Year | M$ | Count | M$ | M$ | M$ | M$ | M$ | M$ | M$ | |
| 12-2018 | 132.800 | 1 | 1.0 | 0.000 | 0.000 | 335.685 | 6,300.000 | -2,865.003 | -2,865.003 | -2,872.118 | |
| 12-2019 | 192.000 | 1 | 1.0 | 0.000 | 0.000 | 216.340 | .000 | 2,107.357 | -757.647 | -1,035.449 | |
| 12-2020 | 192.000 | 1 | 1.0 | 0.000 | 0.000 | 137.092 | .000 | 1,265.073 | 507.426 | -35.153 | |
| 12-2021 | 192.000 | 1 | 1.0 | 0.000 | 0.000 | 102.197 | .000 | 894.197 | 1,401.623 | 607.037 | |
| 12-2022 | 192.000 | 1 | 1.0 | 0.000 | 0.000 | 82.494 | .000 | 684.778 | 2,086.401 | 1,053.951 | |
| 12-2023 | 192.000 | 1 | 1.0 | 0.000 | 0.000 | 69.600 | .000 | 547.742 | 2,634.143 | 1,378.862 | |
| 12-2024 | 192.000 | 1 | 1.0 | 0.000 | 0.000 | 60.605 | .000 | 452.131 | 3,086.274 | 1,622.623 | |
| 12-2025 | 192.000 | 1 | 1.0 | 0.000 | 0.000 | 53.572 | .000 | 377.386 | 3,463.661 | 1,807.545 | |
| 12-2026 | 192.000 | 1 | 1.0 | 0.000 | 0.000 | 48.225 | .000 | 320.551 | 3,784.212 | 1,950.332 | |
| 12-2027 | 192.000 | 1 | 1.0 | 0.000 | 0.000 | 43.927 | .000 | 274.874 | 4,059.086 | 2,061.639 | |
| 12-2028 | 192.000 | 1 | 1.0 | 0.000 | 0.000 | 40.452 | .000 | 237.939 | 4,297.024 | 2,149.230 | |
| 12-2029 | 192.000 | 1 | 1.0 | 0.000 | 0.000 | 37.112 | .000 | 202.439 | 4,499.464 | 2,216.973 | |
| 12-2030 | 192.000 | 1 | 1.0 | 0.000 | 0.000 | 34.145 | .000 | 170.905 | 4,670.368 | 2,268.972 | |
| 12-2031 | 192.000 | 1 | 1.0 | 0.000 | 0.000 | 31.415 | .000 | 141.892 | 4,812.260 | 2,308.225 | |
| 12-2032 | 192.000 | 1 | 1.0 | 0.000 | 0.000 | 28.979 | .000 | 116.005 | 4,928.265 | 2,337.406 | |
| 12-2033 | 192.000 | 1 | 1.0 | 0.000 | 0.000 | 26.587 | .000 | 90.574 | 5,018.839 | 2,358.119 | |
| 12-2034 | 192.000 | 1 | 1.0 | 0.000 | 0.000 | 24.461 | .000 | 67.983 | 5,086.821 | 2,372.257 | |
| 12-2035 | 192.000 | 1 | 1.0 | 0.000 | 0.000 | 22.505 | .000 | 47.198 | 5,134.019 | 2,381.186 | |
| 12-2036 | 192.000 | 1 | 1.0 | 0.000 | 0.000 | 20.761 | .000 | 28.652 | 5,162.671 | 2,386.122 | |
| S Tot | 3,588.800 | | | 0.000 | 0.000 | 1,416.153 | 6,300.000 | 5,162.671 | 5,162.671 | 2,386.122 | |
| After | 220.090 | | | 0.000 | 0.000 | 21.732 | .000 | 10.886 | 5,173.557 | 2,387.831 | |
| Total | 3,808.890 | | | 0.000 | 0.000 | 1,437.885 | 6,300.000 | 5,173.557 | 5,173.557 | 2,387.831 | |
| Evaluation Parameters (Gross) | | Expenses (Gross) | | Percent Interests | | Percent | Cum. Disc. | |
| | Initial | Final | Units | | Dei | n | Def | | Initial | Final | Units | | | | Final | | 5.00 | 3,507.651 | |
| Oil Rate | 22,812. | 458. | bbls/mo | | 96.3% | 1.20 | 0.0% | | 4,799. | 16,000. | $/w/mo | | Expense | 100.0000 | 100.0000 | | 8.00 | 2,787.667 | |
| Gas Rate | 68,437. | 1,376. | Mcf/mo | | 0.0% | 0.00 | 0.0% | | | | | | Revenue | | | | 10.00 | 2,387.831 | |
| GOR | 3,000. | 3,000. | scf/bbl | | | | | | | | | | Oil | 75.1094 | 75.1094 | | 12.00 | 2,038.602 | |
| NGL Rate | 1,342. | 97. | bbls/mo | | | | | | | | | | Gas | 75.1094 | 75.1094 | | 15.00 | 1,591.031 | |
| NGL Yield | 19.6 | 70.9 | bbl/MMcf | | | | | | | | | | | | | | 20.00 | 997.882 | |
| Gas Shrinkage | 80.4 | 31.5 | % | | | | | | | | | | | | | | | | |
| Oil Severance | 4.6 | 4.6 | % | | | | | | | | | | | | | | | | |
| Gas Severance | 7.5 | 7.5 | % | | | | | | | | | | | | | | | | |
| NGL Severance | 7.5 | 7.5 | % | | | | | | | | | | | | | | | | |
| Ad Valorem | 48.6 | | % | | | | | | | | | | | | | | | | |
| | Start Date: 04/2018 | 9 Months in year ‘18 | 19.898 Year Life (02/2038) |
| THESE DATA ARE PART OF A CG&A REPORT AND ARE SUBJECT TO THE CONDITIONS IN THE TEXT OF THE REPORT. TEXAS REGISTERED ENGINEERING FIRM F-693. | ASN 432 | DEFAULT 1/10/2018 10:34:19 OIL PUD Table 5 |
Cawley, Gillespie & Associates, Inc.
��

Table 6
Reserve Estimates and Economic Forecasts as of December 31, 2017
Lilis Energy, Inc. Interests
Proved Undeveloped Reserves
LILIS ENERGY, INC. -- HIPPO PUD-1
PHANTOM (WOLFCAMP B) FIELD -- WINKLER COUNTY, TEXAS
| (1) | (2) | (3) | (4) | (5) | (6) | (7) | (8) | (9) | (10) | |
| | Gross Oil | Gross Gas | Gross NGL | Net Oil | Net Gas | Net NGL | Avg Oil | Avg Gas | Avg NGL | |
| End | Production | Production | Production | Production | Sales | Production | Price | Price | Price | |
| Mo-Year | MBBLS | MMCF | MBBLS | MBBLS | MMCF | MBBLS | $/BBL | $/MCF | $/BBL | |
| 12-2018 | .0 | .0 | .0 | .000 | .000 | .000 | .000 | .000 | .000 | |
| 12-2019 | 10.5 | 31.6 | 2.2 | 7.278 | 14.847 | 1.507 | 47.746 | 2.619 | 8.728 | |
| 12-2020 | 119.5 | 358.4 | 24.7 | 82.415 | 168.127 | 17.060 | 47.746 | 2.619 | 8.728 | |
| 12-2021 | 54.5 | 163.5 | 11.3 | 37.597 | 76.698 | 7.783 | 47.746 | 2.619 | 8.728 | |
| 12-2022 | 37.2 | 111.7 | 7.7 | 25.689 | 52.406 | 5.318 | 47.746 | 2.619 | 8.728 | |
| 12-2023 | 28.8 | 86.3 | 6.0 | 19.837 | 40.467 | 4.106 | 47.746 | 2.619 | 8.728 | |
| 12-2024 | 23.7 | 71.0 | 4.9 | 16.339 | 33.331 | 3.382 | 47.746 | 2.619 | 8.728 | |
| 12-2025 | 20.1 | 60.4 | 4.2 | 13.901 | 28.358 | 2.878 | 47.746 | 2.619 | 8.728 | |
| 12-2026 | 17.6 | 52.9 | 3.7 | 12.169 | 24.824 | 2.519 | 47.746 | 2.619 | 8.728 | |
| 12-2027 | 15.7 | 47.2 | 3.3 | 10.850 | 22.135 | 2.246 | 47.746 | 2.619 | 8.728 | |
| 12-2028 | 14.3 | 42.8 | 3.0 | 9.836 | 20.066 | 2.036 | 47.746 | 2.619 | 8.728 | |
| 12-2029 | 13.0 | 39.0 | 2.7 | 8.965 | 18.288 | 1.856 | 47.746 | 2.619 | 8.728 | |
| 12-2030 | 11.9 | 35.8 | 2.5 | 8.244 | 16.818 | 1.707 | 47.746 | 2.619 | 8.728 | |
| 12-2031 | 11.0 | 33.0 | 2.3 | 7.585 | 15.473 | 1.570 | 47.746 | 2.619 | 8.728 | |
| 12-2032 | 10.1 | 30.4 | 2.1 | 6.997 | 14.274 | 1.448 | 47.746 | 2.619 | 8.728 | |
| 12-2033 | 9.3 | 27.9 | 1.9 | 6.419 | 13.095 | 1.329 | 47.746 | 2.619 | 8.728 | |
| 12-2034 | 8.6 | 25.7 | 1.8 | 5.906 | 12.048 | 1.223 | 47.746 | 2.619 | 8.728 | |
| 12-2035 | 7.9 | 23.6 | 1.6 | 5.434 | 11.085 | 1.125 | 47.746 | 2.619 | 8.728 | |
| 12-2036 | 7.3 | 21.8 | 1.5 | 5.013 | 10.226 | 1.038 | 47.746 | 2.619 | 8.728 | |
| S Tot | 421.0 | 1,263.0 | 87.2 | 290.473 | 592.566 | 60.128 | 47.746 | 2.619 | 8.728 | |
| After | 22.4 | 67.1 | 4.6 | 15.439 | 31.495 | 3.196 | 47.746 | 2.619 | 8.728 | |
| Total | 443.4 | 1,330.2 | 91.8 | 305.912 | 624.061 | 63.324 | 47.746 | 2.619 | 8.728 | |
| Cum | .0 | .0 | .0 | | | | | | | |
| Ult | 443.4 | 1,330.2 | 91.8 | | | | | | | |
| (11) | (12) | (13) | (14) | (15) | (16) | (17) | (18) | (19) | (20) | |
| | Oil | Gas | NGL | Hedge | Other | Total | Production | Ad Valorem | | |
| End | Revenue | Revenue | Revenue | Revenue | Revenue | Revenue | Taxes | Taxes | $/BOE6 | |
| Mo-Year | M$ | M$ | M$ | M$ | M$ | M$ | M$ | M$ | | |
| 12-2018 | .000 | .000 | .000 | 0.000 | 0.000 | .000 | .000 | .000 | .000 | |
| 12-2019 | 347.505 | 38.884 | 13.149 | 0.000 | 0.000 | 399.537 | 19.957 | 9.988 | 3.371 | |
| 12-2020 | 3,935.005 | 440.304 | 148.893 | 0.000 | 0.000 | 4,524.201 | 225.987 | 113.105 | 4.104 | |
| 12-2021 | 1,795.120 | 200.863 | 67.924 | 0.000 | 0.000 | 2,063.907 | 103.094 | 51.598 | 5.713 | |
| 12-2022 | 1,226.554 | 137.244 | 46.410 | 0.000 | 0.000 | 1,410.209 | 70.441 | 35.255 | 7.084 | |
| 12-2023 | 947.120 | 105.977 | 35.837 | 0.000 | 0.000 | 1,088.935 | 54.393 | 27.223 | 8.362 | |
| 12-2024 | 780.116 | 87.290 | 29.518 | 0.000 | 0.000 | 896.924 | 44.802 | 22.423 | 9.562 | |
| 12-2025 | 663.719 | 74.266 | 25.114 | 0.000 | 0.000 | 763.098 | 38.117 | 19.077 | 10.756 | |
| 12-2026 | 581.014 | 65.012 | 21.984 | 0.000 | 0.000 | 668.011 | 33.368 | 16.700 | 11.895 | |
| 12-2027 | 518.066 | 57.968 | 19.603 | 0.000 | 0.000 | 595.637 | 29.752 | 14.891 | 13.006 | |
| 12-2028 | 469.636 | 52.549 | 17.770 | 0.000 | 0.000 | 539.956 | 26.971 | 13.499 | 14.063 | |
| 12-2029 | 428.042 | 47.895 | 16.196 | 0.000 | 0.000 | 492.134 | 24.582 | 12.303 | 15.162 | |
| 12-2030 | 393.623 | 44.044 | 14.894 | 0.000 | 0.000 | 452.560 | 22.606 | 11.314 | 16.247 | |
| 12-2031 | 362.153 | 40.523 | 13.703 | 0.000 | 0.000 | 416.379 | 20.798 | 10.409 | 17.419 | |
| 12-2032 | 334.075 | 37.381 | 12.641 | 0.000 | 0.000 | 384.097 | 19.186 | 9.602 | 18.652 | |
| 12-2033 | 306.492 | 34.295 | 11.597 | 0.000 | 0.000 | 352.383 | 17.602 | 8.810 | 20.083 | |
| 12-2034 | 281.988 | 31.553 | 10.670 | 0.000 | 0.000 | 324.211 | 16.195 | 8.105 | 21.588 | |
| 12-2035 | 259.444 | 29.030 | 9.817 | 0.000 | 0.000 | 298.291 | 14.900 | 7.457 | 23.225 | |
| 12-2036 | 239.329 | 26.780 | 9.056 | 0.000 | 0.000 | 275.165 | 13.745 | 6.879 | 24.946 | |
| S Tot | 13,869.002 | 1,551.859 | 524.775 | 0.000 | 0.000 | 15,945.636 | 796.497 | 398.641 | 9.280 | |
| After | 737.142 | 82.482 | 27.892 | 0.000 | 0.000 | 847.515 | 42.334 | 21.188 | 29.718 | |
| Total | 14,606.144 | 1,634.340 | 552.667 | 0.000 | 0.000 | 16,793.151 | 838.831 | 419.829 | 10.311 | |
| (21) | (22) | (23) | (24) | (25) | (26) | (27) | (28) | (29) | (30) | (31) | |
| | Operating | Wells | Workover | 3rd Party | Other | | Future Net | Cumulative | Cum.Cash Flow | |
| End | Expense | Gross | Net | Expense | COPAS | Deductions | Investment | Cash Flow | Cash Flow | Disc.@ 10. % | |
| Mo-Year | M$ | Count | M$ | M$ | M$ | M$ | M$ | M$ | M$ | |
| 12-2018 | .000 | 0 | 0.0 | 0.000 | 0.000 | 0.000 | .000 | .000 | .000 | .000 | |
| 12-2019 | 6.614 | 1 | 0.8 | 0.000 | 0.000 | 29.559 | 6,834.214 | -6,500.794 | -6,500.794 | -5,484.396 | |
| 12-2020 | 164.021 | 1 | 0.8 | 0.000 | 0.000 | 334.712 | .000 | 3,686.376 | -2,814.418 | -2,550.011 | |
| 12-2021 | 164.021 | 1 | 0.8 | 0.000 | 0.000 | 152.693 | .000 | 1,592.501 | -1,221.917 | -1,404.239 | |
| 12-2022 | 164.021 | 1 | 0.8 | 0.000 | 0.000 | 104.331 | .000 | 1,036.161 | -185.756 | -727.408 | |
| 12-2023 | 164.021 | 1 | 0.8 | 0.000 | 0.000 | 80.562 | .000 | 762.735 | 576.979 | -274.737 | |
| 12-2024 | 164.021 | 1 | 0.8 | 0.000 | 0.000 | 66.357 | .000 | 599.321 | 1,176.300 | 48.482 | |
| 12-2025 | 164.021 | 1 | 0.8 | 0.000 | 0.000 | 56.456 | .000 | 485.427 | 1,661.727 | 286.397 | |
| 12-2026 | 164.021 | 1 | 0.8 | 0.000 | 0.000 | 49.421 | .000 | 404.501 | 2,066.227 | 466.607 | |
| 12-2027 | 164.021 | 1 | 0.8 | 0.000 | 0.000 | 44.067 | .000 | 342.905 | 2,409.133 | 605.479 | |
| 12-2028 | 164.021 | 1 | 0.8 | 0.000 | 0.000 | 39.947 | .000 | 295.517 | 2,704.650 | 714.266 | |
| 12-2029 | 164.021 | 1 | 0.8 | 0.000 | 0.000 | 36.409 | .000 | 254.818 | 2,959.468 | 799.527 | |
| 12-2030 | 164.021 | 1 | 0.8 | 0.000 | 0.000 | 33.482 | .000 | 221.138 | 3,180.606 | 866.798 | |
| 12-2031 | 164.021 | 1 | 0.8 | 0.000 | 0.000 | 30.805 | .000 | 190.346 | 3,370.951 | 919.444 | |
| 12-2032 | 164.021 | 1 | 0.8 | 0.000 | 0.000 | 28.416 | .000 | 162.871 | 3,533.823 | 960.400 | |
| 12-2033 | 164.021 | 1 | 0.8 | 0.000 | 0.000 | 26.070 | .000 | 135.881 | 3,669.703 | 991.461 | |
| 12-2034 | 164.021 | 1 | 0.8 | 0.000 | 0.000 | 23.986 | .000 | 111.904 | 3,781.607 | 1,014.719 | |
| 12-2035 | 164.021 | 1 | 0.8 | 0.000 | 0.000 | 22.068 | .000 | 89.845 | 3,871.452 | 1,031.699 | |
| 12-2036 | 164.021 | 1 | 0.8 | 0.000 | 0.000 | 20.357 | .000 | 70.162 | 3,941.614 | 1,043.758 | |
| S Tot | 2,794.973 | | | 0.000 | 0.000 | 1,179.697 | 6,834.214 | 3,941.614 | 3,941.614 | 1,043.758 | |
| After | 613.844 | | | 0.000 | 0.000 | 62.701 | .000 | 107.448 | 4,049.062 | 1,059.410 | |
| Total | 3,408.817 | | | 0.000 | 0.000 | 1,242.399 | 6,834.214 | 4,049.062 | 4,049.062 | 1,059.410 | |
| Evaluation Parameters (Gross) | | Expenses (Gross) | | Percent Interests | | Percent | Cum. Disc. | |
| | Initial | Final | Units | | Dei | n | Def | | Initial | Final | Units | | | | Final | | 5.00 | 2,182.729 | |
| Oil Rate | 22,812. | 423. | bbls/mo | | 96.3% | 1.20 | 0.0% | | 7,741. | 15,768. | $/w/mo | | Expense | 85.4277 | 85.4277 | | 8.00 | 1,445.838 | |
| Gas Rate | 68,437. | 1,271. | Mcf/mo | | 0.0% | 0.00 | 0.0% | | | | | | Revenue | | | | 10.00 | 1,059.410 | |
| GOR | 3,000. | 3,000. | scf/bbl | | | | | | | | | | Oil | 68.9935 | 68.9935 | | 12.00 | 737.240 | |
| NGL Rate | 2,183. | 86. | bbls/mo | | | | | | | | | | Gas | 68.9935 | 68.9935 | | 15.00 | 348.155 | |
| NGL Yield | 31.9 | 68.2 | bbl/MMcf | | | | | | | | | | | | | | 20.00 | -118.834 | |
| Gas Shrinkage | 69.1 | 31.9 | % | | | | | | | | | | | | | | | | |
| Oil Severance | 4.6 | 4.6 | % | | | | | | | | | | | | | | | | |
| Gas Severance | 7.5 | 7.5 | % | | | | | | | | | | | | | | | | |
| NGL Severance | 7.5 | 7.5 | % | | | | | | | | | | | | | | | | |
| Ad Valorem | 39.7 | | % | | | | | | | | | | | | | | | | |
| | Start Date: 12/2019 | 1 Months in year ‘19 | 20.832 Year Life (09/2040) |
| THESE DATA ARE PART OF A CG&A REPORT AND ARE SUBJECT TO THE CONDITIONS IN THE TEXT OF THE REPORT. TEXAS REGISTERED ENGINEERING FIRM F-693. | ASN 491 | DEFAULT 1/10/2018 10:34:19 OIL PUD Table 6 |
Cawley, Gillespie & Associates, Inc.
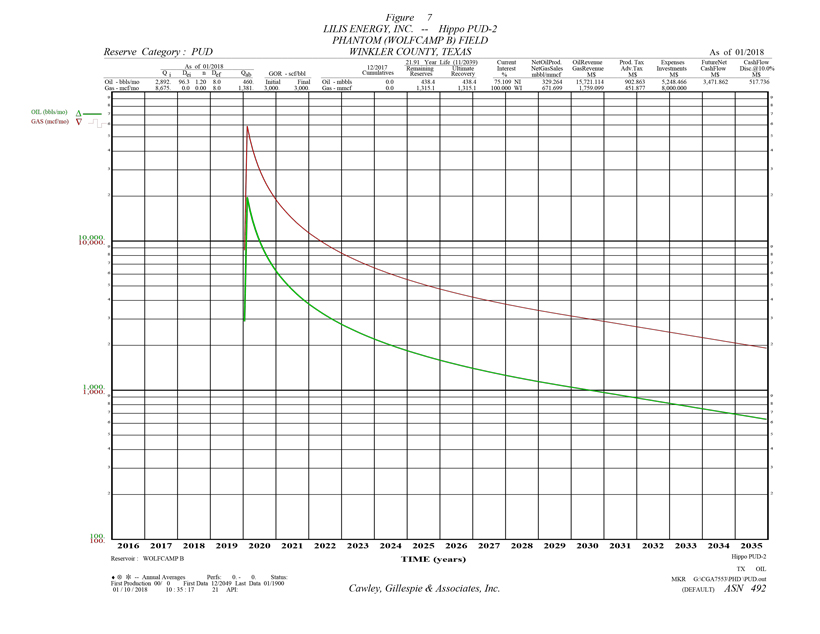
Table 7
Reserve Estimates and Economic Forecasts as of December 31, 2017
Lilis Energy, Inc. Interests
Proved Undeveloped Reserves
LILIS ENERGY, INC. -- HIPPO PUD-2
PHANTOM (WOLFCAMP B) FIELD -- WINKLER COUNTY, TEXAS
| (1) | (2) | (3) | (4) | (5) | (6) | (7) | (8) | (9) | (10) | |
| | Gross Oil | Gross Gas | Gross NGL | Net Oil | Net Gas | Net NGL | Avg Oil | Avg Gas | Avg NGL | |
| End | Production | Production | Production | Production | Sales | Production | Price | Price | Price | |
| Mo-Year | MBBLS | MMCF | MBBLS | MBBLS | MMCF | MBBLS | $/BBL | $/MCF | $/BBL | |
| 12-2018 | .0 | .0 | .0 | .000 | .000 | .000 | .000 | .000 | .000 | |
| 12-2019 | .0 | .0 | .0 | .000 | .000 | .000 | .000 | .000 | .000 | |
| 12-2020 | 121.6 | 364.9 | 25.2 | 91.351 | 186.357 | 18.910 | 47.746 | 2.619 | 8.728 | |
| 12-2021 | 57.8 | 173.3 | 12.0 | 43.381 | 88.496 | 8.980 | 47.746 | 2.619 | 8.728 | |
| 12-2022 | 38.6 | 115.8 | 8.0 | 28.984 | 59.127 | 6.000 | 47.746 | 2.619 | 8.728 | |
| 12-2023 | 29.5 | 88.5 | 6.1 | 22.162 | 45.211 | 4.588 | 47.746 | 2.619 | 8.728 | |
| 12-2024 | 24.2 | 72.5 | 5.0 | 18.153 | 37.032 | 3.758 | 47.746 | 2.619 | 8.728 | |
| 12-2025 | 20.5 | 61.5 | 4.2 | 15.389 | 31.394 | 3.186 | 47.746 | 2.619 | 8.728 | |
| 12-2026 | 17.9 | 53.7 | 3.7 | 13.438 | 27.413 | 2.782 | 47.746 | 2.619 | 8.728 | |
| 12-2027 | 15.9 | 47.8 | 3.3 | 11.960 | 24.398 | 2.476 | 47.746 | 2.619 | 8.728 | |
| 12-2028 | 14.4 | 43.2 | 3.0 | 10.826 | 22.086 | 2.241 | 47.746 | 2.619 | 8.728 | |
| 12-2029 | 13.1 | 39.4 | 2.7 | 9.857 | 20.107 | 2.040 | 47.746 | 2.619 | 8.728 | |
| 12-2030 | 12.1 | 36.2 | 2.5 | 9.061 | 18.485 | 1.876 | 47.746 | 2.619 | 8.728 | |
| 12-2031 | 11.1 | 33.3 | 2.3 | 8.337 | 17.007 | 1.726 | 47.746 | 2.619 | 8.728 | |
| 12-2032 | 10.2 | 30.7 | 2.1 | 7.691 | 15.689 | 1.592 | 47.746 | 2.619 | 8.728 | |
| 12-2033 | 9.4 | 28.2 | 1.9 | 7.056 | 14.393 | 1.460 | 47.746 | 2.619 | 8.728 | |
| 12-2034 | 8.6 | 25.9 | 1.8 | 6.491 | 13.243 | 1.344 | 47.746 | 2.619 | 8.728 | |
| 12-2035 | 8.0 | 23.9 | 1.6 | 5.972 | 12.184 | 1.236 | 47.746 | 2.619 | 8.728 | |
| 12-2036 | 7.3 | 22.0 | 1.5 | 5.509 | 11.239 | 1.140 | 47.746 | 2.619 | 8.728 | |
| S Tot | 420.2 | 1,260.6 | 87.0 | 315.619 | 643.863 | 65.333 | 47.746 | 2.619 | 8.728 | |
| After | 18.2 | 54.5 | 3.8 | 13.645 | 27.836 | 2.825 | 47.746 | 2.619 | 8.728 | |
| Total | 438.4 | 1,315.1 | 90.7 | 329.264 | 671.699 | 68.158 | 47.746 | 2.619 | 8.728 | |
| Cum | .0 | .0 | .0 | | | | | | | |
| Ult | 438.4 | 1,315.1 | 90.7 | | | | | | | |
| (11) | (12) | (13) | (14) | (15) | (16) | (17) | (18) | (19) | (20) | |
| | Oil | Gas | NGL | Hedge | Other | Total | Production | Ad Valorem | | |
| End | Revenue | Revenue | Revenue | Revenue | Revenue | Revenue | Taxes | Taxes | $/BOE6 | |
| Mo-Year | M$ | M$ | M$ | M$ | M$ | M$ | M$ | M$ | | |
| 12-2018 | .000 | .000 | .000 | 0.000 | 0.000 | .000 | .000 | .000 | .000 | |
| 12-2019 | .000 | .000 | .000 | 0.000 | 0.000 | .000 | .000 | .000 | .000 | |
| 12-2020 | 4,361.681 | 488.046 | 165.037 | 0.000 | 0.000 | 5,014.764 | 250.491 | 125.369 | 4.283 | |
| 12-2021 | 2,071.260 | 231.762 | 78.372 | 0.000 | 0.000 | 2,381.394 | 118.952 | 59.535 | 5.963 | |
| 12-2022 | 1,383.874 | 154.847 | 52.363 | 0.000 | 0.000 | 1,591.085 | 79.476 | 39.777 | 7.454 | |
| 12-2023 | 1,058.164 | 118.402 | 40.039 | 0.000 | 0.000 | 1,216.605 | 60.770 | 30.415 | 8.837 | |
| 12-2024 | 866.744 | 96.984 | 32.796 | 0.000 | 0.000 | 996.523 | 49.777 | 24.913 | 10.134 | |
| 12-2025 | 734.779 | 82.217 | 27.803 | 0.000 | 0.000 | 844.799 | 42.198 | 21.120 | 11.423 | |
| 12-2026 | 641.610 | 71.792 | 24.277 | 0.000 | 0.000 | 737.679 | 36.848 | 18.442 | 12.651 | |
| 12-2027 | 571.036 | 63.896 | 21.607 | 0.000 | 0.000 | 656.539 | 32.795 | 16.413 | 13.849 | |
| 12-2028 | 516.916 | 57.840 | 19.559 | 0.000 | 0.000 | 594.315 | 29.686 | 14.858 | 14.989 | |
| 12-2029 | 470.614 | 52.659 | 17.807 | 0.000 | 0.000 | 541.080 | 27.027 | 13.527 | 16.172 | |
| 12-2030 | 432.643 | 48.410 | 16.370 | 0.000 | 0.000 | 497.424 | 24.847 | 12.436 | 17.331 | |
| 12-2031 | 398.055 | 44.540 | 15.062 | 0.000 | 0.000 | 457.656 | 22.860 | 11.441 | 18.580 | |
| 12-2032 | 367.193 | 41.087 | 13.894 | 0.000 | 0.000 | 422.174 | 21.088 | 10.554 | 19.893 | |
| 12-2033 | 336.875 | 37.694 | 12.747 | 0.000 | 0.000 | 387.316 | 19.347 | 9.683 | 21.416 | |
| 12-2034 | 309.943 | 34.681 | 11.728 | 0.000 | 0.000 | 356.351 | 17.800 | 8.909 | 23.020 | |
| 12-2035 | 285.164 | 31.908 | 10.790 | 0.000 | 0.000 | 327.862 | 16.377 | 8.197 | 24.763 | |
| 12-2036 | 263.055 | 29.434 | 9.953 | 0.000 | 0.000 | 302.442 | 15.107 | 7.561 | 26.595 | |
| S Tot | 15,069.606 | 1,686.199 | 570.203 | 0.000 | 0.000 | 17,326.008 | 865.447 | 433.150 | 9.945 | |
| After | 651.509 | 72.900 | 24.652 | 0.000 | 0.000 | 749.060 | 37.416 | 18.727 | 30.819 | |
| Total | 15,721.114 | 1,759.099 | 594.855 | 0.000 | 0.000 | 18,075.068 | 902.863 | 451.877 | 10.810 | |
| (21) | (22) | (23) | (24) | (25) | (26) | (27) | (28) | (29) | (30) | (31) | |
| | Operating | Wells | Workover | 3rd Party | Other | | Future Net | Cumulative | Cum.Cash Flow | |
| End | Expense | Gross | Net | Expense | COPAS | Deductions | Investment | Cash Flow | Cash Flow | Disc.@ 10. % | |
| Mo-Year | M$ | Count | M$ | M$ | M$ | M$ | M$ | M$ | M$ | |
| 12-2018 | .000 | 0 | 0.0 | 0.000 | 0.000 | 0.000 | .000 | .000 | .000 | .000 | |
| 12-2019 | .000 | 0 | 0.0 | 0.000 | 0.000 | 0.000 | 8,000.000 | -8,000.000 | -8,000.000 | -6,669.620 | |
| 12-2020 | 178.065 | 1 | 1.0 | 0.000 | 0.000 | 398.928 | .000 | 4,061.911 | -3,938.089 | -3,449.158 | |
| 12-2021 | 192.000 | 1 | 1.0 | 0.000 | 0.000 | 189.442 | .000 | 1,821.465 | -2,116.624 | -2,138.252 | |
| 12-2022 | 192.000 | 1 | 1.0 | 0.000 | 0.000 | 126.572 | .000 | 1,153.260 | -963.364 | -1,384.827 | |
| 12-2023 | 192.000 | 1 | 1.0 | 0.000 | 0.000 | 96.782 | .000 | 836.637 | -126.727 | -888.251 | |
| 12-2024 | 192.000 | 1 | 1.0 | 0.000 | 0.000 | 79.274 | .000 | 650.559 | 523.832 | -537.374 | |
| 12-2025 | 192.000 | 1 | 1.0 | 0.000 | 0.000 | 67.204 | .000 | 522.276 | 1,046.109 | -281.383 | |
| 12-2026 | 192.000 | 1 | 1.0 | 0.000 | 0.000 | 58.683 | .000 | 431.707 | 1,477.815 | -89.043 | |
| 12-2027 | 192.000 | 1 | 1.0 | 0.000 | 0.000 | 52.228 | .000 | 363.102 | 1,840.918 | 58.016 | |
| 12-2028 | 192.000 | 1 | 1.0 | 0.000 | 0.000 | 47.278 | .000 | 310.493 | 2,151.410 | 172.323 | |
| 12-2029 | 192.000 | 1 | 1.0 | 0.000 | 0.000 | 43.043 | .000 | 265.483 | 2,416.893 | 261.157 | |
| 12-2030 | 192.000 | 1 | 1.0 | 0.000 | 0.000 | 39.570 | .000 | 228.571 | 2,645.464 | 330.692 | |
| 12-2031 | 192.000 | 1 | 1.0 | 0.000 | 0.000 | 36.407 | .000 | 194.948 | 2,840.411 | 384.614 | |
| 12-2032 | 192.000 | 1 | 1.0 | 0.000 | 0.000 | 33.584 | .000 | 164.947 | 3,005.359 | 426.095 | |
| 12-2033 | 192.000 | 1 | 1.0 | 0.000 | 0.000 | 30.811 | .000 | 135.475 | 3,140.834 | 457.066 | |
| 12-2034 | 192.000 | 1 | 1.0 | 0.000 | 0.000 | 28.348 | .000 | 109.294 | 3,250.128 | 479.785 | |
| 12-2035 | 192.000 | 1 | 1.0 | 0.000 | 0.000 | 26.082 | .000 | 85.207 | 3,335.334 | 495.891 | |
| 12-2036 | 192.000 | 1 | 1.0 | 0.000 | 0.000 | 24.060 | .000 | 63.715 | 3,399.049 | 506.846 | |
| S Tot | 3,250.065 | | | 0.000 | 0.000 | 1,378.297 | 8,000.000 | 3,399.049 | 3,399.049 | 506.846 | |
| After | 560.516 | | | 0.000 | 0.000 | 59.588 | .000 | 72.813 | 3,471.862 | 517.736 | |
| Total | 3,810.581 | | | 0.000 | 0.000 | 1,437.885 | 8,000.000 | 3,471.862 | 3,471.862 | 517.736 | |
| Evaluation Parameters (Gross) | | Expenses (Gross) | | Percent Interests | | Percent | Cum. Disc. | |
| | Initial | Final | Units | | Dei | n | Def | | Initial | Final | Units | | | | Final | | 5.00 | 1,621.919 | |
| Oil Rate | 22,812. | 458. | bbls/mo | | 96.3% | 1.20 | 0.0% | | 2,064. | 16,000. | $/w/mo | | Expense | 100.0000 | 100.0000 | | 8.00 | 895.904 | |
| Gas Rate | 68,437. | 1,376. | Mcf/mo | | 0.0% | 0.00 | 0.0% | | | | | | Revenue | | | | 10.00 | 517.736 | |
| GOR | 3,000. | 3,000. | scf/bbl | | | | | | | | | | Oil | 75.1094 | 75.1094 | | 12.00 | 204.618 | |
| NGL Rate | 609. | 93. | bbls/mo | | | | | | | | | | Gas | 75.1094 | 75.1094 | | 15.00 | -169.616 | |
| NGL Yield | 8.9 | 68.3 | bbl/MMcf | | | | | | | | | | | | | | 20.00 | -609.471 | |
| Gas Shrinkage | 91.4 | 31.8 | % | | | | | | | | | | | | | | | | |
| Oil Severance | 4.6 | 4.6 | % | | | | | | | | | | | | | | | | |
| Gas Severance | 7.5 | 7.5 | % | | | | | | | | | | | | | | | | |
| NGL Severance | 7.5 | 7.5 | % | | | | | | | | | | | | | | | | |
| Ad Valorem | 46.8 | | % | | | | | | | | | | | | | | | | |
| | Start Date: 01/2020 | 12 Months in year ‘20 | 19.916 Year Life (11/2039) |
| THESE DATA ARE PART OF A CG&A REPORT AND ARE SUBJECT TO THE CONDITIONS IN THE TEXT OF THE REPORT. TEXAS REGISTERED ENGINEERING FIRM F-693. | ASN 492 | DEFAULT 1/10/2018 10:34:19 OIL PUD Table 7 |
Cawley, Gillespie & Associates, Inc.

Table 8
Reserve Estimates and Economic Forecasts as of December 31, 2017
Lilis Energy, Inc. Interests
Proved Undeveloped Reserves
LILIS ENERGY, INC. -- HIPPO PUD-3
PHANTOM (WOLFCAMP B) FIELD -- WINKLER COUNTY, TEXAS
| (1) | (2) | (3) | (4) | (5) | (6) | (7) | (8) | (9) | (10) | |
| | Gross Oil | Gross Gas | Gross NGL | Net Oil | Net Gas | Net NGL | Avg Oil | Avg Gas | Avg NGL | |
| End | Production | Production | Production | Production | Sales | Production | Price | Price | Price | |
| Mo-Year | MBBLS | MMCF | MBBLS | MBBLS | MMCF | MBBLS | $/BBL | $/MCF | $/BBL | |
| 12-2018 | .0 | .0 | .0 | .000 | .000 | .000 | .000 | .000 | .000 | |
| 12-2019 | .0 | .0 | .0 | .000 | .000 | .000 | .000 | .000 | .000 | |
| 12-2020 | 28.4 | 85.2 | 5.9 | 1.065 | 2.173 | .220 | 47.746 | 2.619 | 8.728 | |
| 12-2021 | 107.0 | 321.1 | 22.2 | 4.014 | 8.188 | .831 | 47.746 | 2.619 | 8.728 | |
| 12-2022 | 52.5 | 157.4 | 10.9 | 1.968 | 4.014 | .407 | 47.746 | 2.619 | 8.728 | |
| 12-2023 | 36.4 | 109.1 | 7.5 | 1.363 | 2.781 | .282 | 47.746 | 2.619 | 8.728 | |
| 12-2024 | 28.3 | 85.0 | 5.9 | 1.062 | 2.167 | .220 | 47.746 | 2.619 | 8.728 | |
| 12-2025 | 23.3 | 69.9 | 4.8 | .873 | 1.782 | .181 | 47.746 | 2.619 | 8.728 | |
| 12-2026 | 19.9 | 59.8 | 4.1 | .747 | 1.524 | .155 | 47.746 | 2.619 | 8.728 | |
| 12-2027 | 17.5 | 52.4 | 3.6 | .655 | 1.336 | .136 | 47.746 | 2.619 | 8.728 | |
| 12-2028 | 15.6 | 46.9 | 3.2 | .586 | 1.196 | .121 | 47.746 | 2.619 | 8.728 | |
| 12-2029 | 14.1 | 42.3 | 2.9 | .529 | 1.079 | .110 | 47.746 | 2.619 | 8.728 | |
| 12-2030 | 12.9 | 38.7 | 2.7 | .484 | .987 | .100 | 47.746 | 2.619 | 8.728 | |
| 12-2031 | 11.9 | 35.6 | 2.5 | .445 | .908 | .092 | 47.746 | 2.619 | 8.728 | |
| 12-2032 | 10.9 | 32.8 | 2.3 | .411 | .838 | .085 | 47.746 | 2.619 | 8.728 | |
| 12-2033 | 10.0 | 30.1 | 2.1 | .377 | .769 | .078 | 47.746 | 2.619 | 8.728 | |
| 12-2034 | 9.2 | 27.7 | 1.9 | .347 | .707 | .072 | 47.746 | 2.619 | 8.728 | |
| 12-2035 | 8.5 | 25.5 | 1.8 | .319 | .651 | .066 | 47.746 | 2.619 | 8.728 | |
| 12-2036 | 7.8 | 23.5 | 1.6 | .294 | .600 | .061 | 47.746 | 2.619 | 8.728 | |
| S Tot | 414.4 | 1,243.1 | 85.8 | 15.539 | 31.699 | 3.217 | 47.746 | 2.619 | 8.728 | |
| After | 23.9 | 71.7 | 4.9 | .896 | 1.829 | .186 | 47.746 | 2.619 | 8.728 | |
| Total | 438.3 | 1,314.8 | 90.7 | 16.435 | 33.528 | 3.402 | 47.746 | 2.619 | 8.728 | |
| Cum | .0 | .0 | .0 | | | | | | | |
| Ult | 438.3 | 1,314.8 | 90.7 | | | | | | | |
| (11) | (12) | (13) | (14) | (15) | (16) | (17) | (18) | (19) | (20) | |
| | Oil | Gas | NGL | Hedge | Other | Total | Production | Ad Valorem | | |
| End | Revenue | Revenue | Revenue | Revenue | Revenue | Revenue | Taxes | Taxes | $/BOE6 | |
| Mo-Year | M$ | M$ | M$ | M$ | M$ | M$ | M$ | M$ | | |
| 12-2018 | .000 | .000 | .000 | 0.000 | 0.000 | .000 | .000 | .000 | .000 | |
| 12-2019 | .000 | .000 | .000 | 0.000 | 0.000 | .000 | .000 | .000 | .000 | |
| 12-2020 | 50.855 | 5.690 | 1.924 | 0.000 | 0.000 | 58.469 | 2.921 | 1.462 | 3.713 | |
| 12-2021 | 191.635 | 21.443 | 7.251 | 0.000 | 0.000 | 220.329 | 11.006 | 5.508 | 4.588 | |
| 12-2022 | 93.951 | 10.513 | 3.555 | 0.000 | 0.000 | 108.018 | 5.396 | 2.700 | 6.275 | |
| 12-2023 | 65.099 | 7.284 | 2.463 | 0.000 | 0.000 | 74.846 | 3.739 | 1.871 | 7.741 | |
| 12-2024 | 50.713 | 5.675 | 1.919 | 0.000 | 0.000 | 58.307 | 2.912 | 1.458 | 9.095 | |
| 12-2025 | 41.697 | 4.666 | 1.578 | 0.000 | 0.000 | 47.940 | 2.395 | 1.199 | 10.421 | |
| 12-2026 | 35.666 | 3.991 | 1.350 | 0.000 | 0.000 | 41.007 | 2.048 | 1.025 | 11.681 | |
| 12-2027 | 31.275 | 3.499 | 1.183 | 0.000 | 0.000 | 35.957 | 1.796 | .899 | 12.905 | |
| 12-2028 | 27.994 | 3.132 | 1.059 | 0.000 | 0.000 | 32.185 | 1.608 | .805 | 14.070 | |
| 12-2029 | 25.263 | 2.827 | .956 | 0.000 | 0.000 | 29.045 | 1.451 | .726 | 15.271 | |
| 12-2030 | 23.108 | 2.586 | .874 | 0.000 | 0.000 | 26.568 | 1.327 | .664 | 16.418 | |
| 12-2031 | 21.253 | 2.378 | .804 | 0.000 | 0.000 | 24.436 | 1.221 | .611 | 17.592 | |
| 12-2032 | 19.606 | 2.194 | .742 | 0.000 | 0.000 | 22.541 | 1.126 | .564 | 18.821 | |
| 12-2033 | 17.987 | 2.013 | .681 | 0.000 | 0.000 | 20.680 | 1.033 | .517 | 20.248 | |
| 12-2034 | 16.549 | 1.852 | .626 | 0.000 | 0.000 | 19.027 | .950 | .476 | 21.750 | |
| 12-2035 | 15.226 | 1.704 | .576 | 0.000 | 0.000 | 17.506 | .874 | .438 | 23.382 | |
| 12-2036 | 14.045 | 1.572 | .531 | 0.000 | 0.000 | 16.148 | .807 | .404 | 25.098 | |
| S Tot | 741.921 | 83.016 | 28.073 | 0.000 | 0.000 | 853.010 | 42.608 | 21.325 | 9.721 | |
| After | 42.801 | 4.789 | 1.620 | 0.000 | 0.000 | 49.210 | 2.458 | 1.230 | 29.808 | |
| Total | 784.722 | 87.806 | 29.692 | 0.000 | 0.000 | 902.220 | 45.067 | 22.555 | 10.816 | |
| (21) | (22) | (23) | (24) | (25) | (26) | (27) | (28) | (29) | (30) | (31) | |
| | Operating | Wells | Workover | 3rd Party | Other | | Future Net | Cumulative | Cum.Cash Flow | |
| End | Expense | Gross | Net | Expense | COPAS | Deductions | Investment | Cash Flow | Cash Flow | Disc.@ 10. % | |
| Mo-Year | M$ | Count | M$ | M$ | M$ | M$ | M$ | M$ | M$ | |
| 12-2018 | .000 | 0 | 0.0 | 0.000 | 0.000 | 0.000 | .000 | .000 | .000 | .000 | |
| 12-2019 | .000 | 0 | 0.0 | 0.000 | 0.000 | 0.000 | .000 | .000 | .000 | .000 | |
| 12-2020 | 1.173 | 1 | 0.1 | 0.000 | 0.000 | 4.658 | 400.000 | -351.745 | -351.745 | -272.383 | |
| 12-2021 | 9.600 | 1 | 0.1 | 0.000 | 0.000 | 17.553 | .000 | 176.662 | -175.083 | -144.691 | |
| 12-2022 | 9.600 | 1 | 0.1 | 0.000 | 0.000 | 8.605 | .000 | 81.717 | -93.366 | -91.246 | |
| 12-2023 | 9.600 | 1 | 0.1 | 0.000 | 0.000 | 5.963 | .000 | 53.674 | -39.692 | -59.372 | |
| 12-2024 | 9.600 | 1 | 0.1 | 0.000 | 0.000 | 4.645 | .000 | 39.692 | -.001 | -37.958 | |
| 12-2025 | 9.600 | 1 | 0.1 | 0.000 | 0.000 | 3.819 | .000 | 30.928 | 30.927 | -22.796 | |
| 12-2026 | 9.600 | 1 | 0.1 | 0.000 | 0.000 | 3.267 | .000 | 25.067 | 55.994 | -11.626 | |
| 12-2027 | 9.600 | 1 | 0.1 | 0.000 | 0.000 | 2.865 | .000 | 20.798 | 76.791 | -3.202 | |
| 12-2028 | 9.600 | 1 | 0.1 | 0.000 | 0.000 | 2.564 | .000 | 17.609 | 94.400 | 3.281 | |
| 12-2029 | 9.600 | 1 | 0.1 | 0.000 | 0.000 | 2.314 | .000 | 14.954 | 109.355 | 8.285 | |
| 12-2030 | 9.600 | 1 | 0.1 | 0.000 | 0.000 | 2.117 | .000 | 12.860 | 122.215 | 12.198 | |
| 12-2031 | 9.600 | 1 | 0.1 | 0.000 | 0.000 | 1.947 | .000 | 11.058 | 133.272 | 15.256 | |
| 12-2032 | 9.600 | 1 | 0.1 | 0.000 | 0.000 | 1.796 | .000 | 9.456 | 142.728 | 17.634 | |
| 12-2033 | 9.600 | 1 | 0.1 | 0.000 | 0.000 | 1.648 | .000 | 7.883 | 150.611 | 19.436 | |
| 12-2034 | 9.600 | 1 | 0.1 | 0.000 | 0.000 | 1.516 | .000 | 6.485 | 157.096 | 20.783 | |
| 12-2035 | 9.600 | 1 | 0.1 | 0.000 | 0.000 | 1.395 | .000 | 5.199 | 162.295 | 21.766 | |
| 12-2036 | 9.600 | 1 | 0.1 | 0.000 | 0.000 | 1.286 | .000 | 4.052 | 166.346 | 22.462 | |
| S Tot | 154.773 | | | 0.000 | 0.000 | 67.957 | 400.000 | 166.346 | 166.346 | 22.462 | |
| After | 35.481 | | | 0.000 | 0.000 | 3.920 | .000 | 6.121 | 172.467 | 23.355 | |
| Total | 190.254 | | | 0.000 | 0.000 | 71.877 | 400.000 | 172.467 | 172.467 | 23.355 | |
| Evaluation Parameters (Gross) | | Expenses (Gross) | | Percent Interests | | Percent | Cum. Disc. | |
| | Initial | Final | Units | | Dei | n | Def | | Initial | Final | Units | | | | Final | | 5.00 | 77.154 | |
| Oil Rate | 22,812. | 459. | bbls/mo | | 96.3% | 1.20 | 0.0% | | 7,460. | 16,000. | $/w/mo | | Expense | 5.0000 | 5.0000 | | 8.00 | 41.415 | |
| Gas Rate | 68,437. | 1,378. | Mcf/mo | | 0.0% | 0.00 | 0.0% | | | | | | Revenue | | | | 10.00 | 23.355 | |
| GOR | 3,000. | 3,000. | scf/bbl | | | | | | | | | | Oil | 3.7500 | 3.7500 | | 12.00 | 8.779 | |
| NGL Rate | 2,046. | 97. | bbls/mo | | | | | | | | | | Gas | 3.7500 | 3.7500 | | 15.00 | -8.064 | |
| NGL Yield | 29.9 | 70.7 | bbl/MMcf | | | | | | | | | | | | | | 20.00 | -26.704 | |
| Gas Shrinkage | 70.1 | 32.3 | % | | | | | | | | | | | | | | | | |
| Oil Severance | 4.6 | 4.6 | % | | | | | | | | | | | | | | | | |
| Gas Severance | 7.5 | 7.5 | % | | | | | | | | | | | | | | | | |
| NGL Severance | 7.5 | 7.5 | % | | | | | | | | | | | | | | | | |
| Ad Valorem | 2.4 | | % | | | | | | | | | | | | | | | | |
| | Start Date: 11/2020 | 2 Months in year ‘20 | 19.869 Year Life (09/2040) |
| THESE DATA ARE PART OF A CG&A REPORT AND ARE SUBJECT TO THE CONDITIONS IN THE TEXT OF THE REPORT. TEXAS REGISTERED ENGINEERING FIRM F-693. | ASN 493 | DEFAULT 1/10/2018 10:34:19 OIL PUD Table 8 |
Cawley, Gillespie & Associates, Inc.
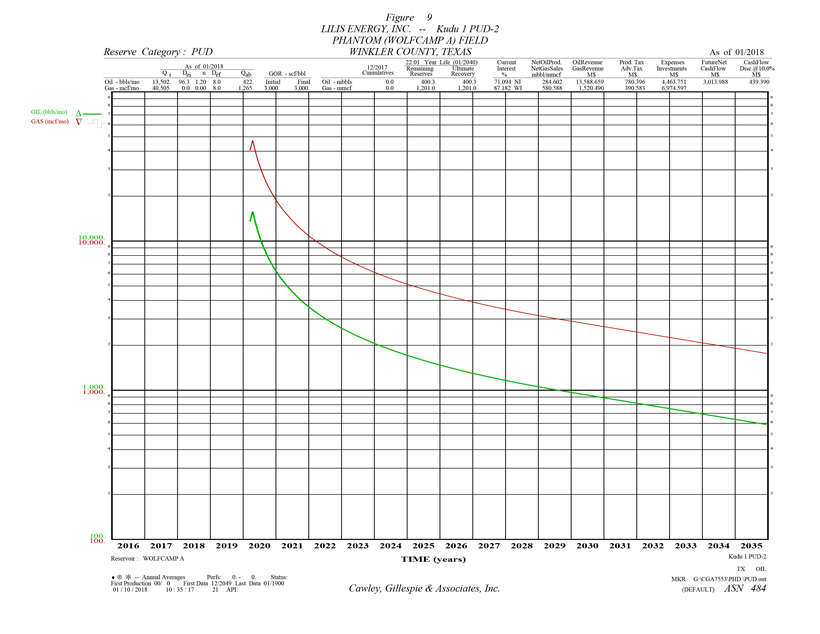
Table 9
Reserve Estimates and Economic Forecasts as of December 31, 2017
Lilis Energy, Inc. Interests
Proved Undeveloped Reserves
LILIS ENERGY, INC. -- KUDU 1 PUD-2
PHANTOM (WOLFCAMP A) FIELD -- WINKLER COUNTY, TEXAS
| (1) | (2) | (3) | (4) | (5) | (6) | (7) | (8) | (9) | (10) | |
| | Gross Oil | Gross Gas | Gross NGL | Net Oil | Net Gas | Net NGL | Avg Oil | Avg Gas | Avg NGL | |
| End | Production | Production | Production | Production | Sales | Production | Price | Price | Price | |
| Mo-Year | MBBLS | MMCF | MBBLS | MBBLS | MMCF | MBBLS | $/BBL | $/MCF | $/BBL | |
| 12-2018 | .0 | .0 | .0 | .000 | .000 | .000 | .000 | .000 | .000 | |
| 12-2019 | .0 | .0 | .0 | .000 | .000 | .000 | .000 | .000 | .000 | |
| 12-2020 | 102.8 | 308.4 | 21.3 | 73.073 | 149.069 | 15.126 | 47.746 | 2.619 | 8.728 | |
| 12-2021 | 56.2 | 168.5 | 11.6 | 39.933 | 81.463 | 8.266 | 47.746 | 2.619 | 8.728 | |
| 12-2022 | 36.6 | 109.8 | 7.6 | 26.011 | 53.063 | 5.384 | 47.746 | 2.619 | 8.728 | |
| 12-2023 | 27.7 | 83.0 | 5.7 | 19.679 | 40.146 | 4.074 | 47.746 | 2.619 | 8.728 | |
| 12-2024 | 22.5 | 67.6 | 4.7 | 16.025 | 32.690 | 3.317 | 47.746 | 2.619 | 8.728 | |
| 12-2025 | 19.0 | 57.1 | 3.9 | 13.534 | 27.609 | 2.802 | 47.746 | 2.619 | 8.728 | |
| 12-2026 | 16.6 | 49.7 | 3.4 | 11.787 | 24.046 | 2.440 | 47.746 | 2.619 | 8.728 | |
| 12-2027 | 14.7 | 44.2 | 3.0 | 10.471 | 21.360 | 2.167 | 47.746 | 2.619 | 8.728 | |
| 12-2028 | 13.3 | 39.9 | 2.8 | 9.464 | 19.307 | 1.959 | 47.746 | 2.619 | 8.728 | |
| 12-2029 | 12.1 | 36.3 | 2.5 | 8.607 | 17.557 | 1.782 | 47.746 | 2.619 | 8.728 | |
| 12-2030 | 11.1 | 33.4 | 2.3 | 7.909 | 16.134 | 1.637 | 47.746 | 2.619 | 8.728 | |
| 12-2031 | 10.2 | 30.7 | 2.1 | 7.277 | 14.845 | 1.506 | 47.746 | 2.619 | 8.728 | |
| 12-2032 | 9.4 | 28.3 | 2.0 | 6.713 | 13.694 | 1.389 | 47.746 | 2.619 | 8.728 | |
| 12-2033 | 8.7 | 26.0 | 1.8 | 6.158 | 12.563 | 1.275 | 47.746 | 2.619 | 8.728 | |
| 12-2034 | 8.0 | 23.9 | 1.6 | 5.666 | 11.559 | 1.173 | 47.746 | 2.619 | 8.728 | |
| 12-2035 | 7.3 | 22.0 | 1.5 | 5.213 | 10.635 | 1.079 | 47.746 | 2.619 | 8.728 | |
| 12-2036 | 6.8 | 20.3 | 1.4 | 4.809 | 9.810 | .995 | 47.746 | 2.619 | 8.728 | |
| S Tot | 383.1 | 1,149.2 | 79.3 | 272.328 | 555.549 | 56.372 | 47.746 | 2.619 | 8.728 | |
| After | 17.3 | 51.8 | 3.6 | 12.274 | 25.039 | 2.541 | 47.746 | 2.619 | 8.728 | |
| Total | 400.3 | 1,201.0 | 82.9 | 284.602 | 580.588 | 58.913 | 47.746 | 2.619 | 8.728 | |
| Cum | .0 | .0 | .0 | | | | | | | |
| Ult | 400.3 | 1,201.0 | 82.9 | | | | | | | |
| (11) | (12) | (13) | (14) | (15) | (16) | (17) | (18) | (19) | (20) | |
| | Oil | Gas | NGL | Hedge | Other | Total | Production | Ad Valorem | | |
| End | Revenue | Revenue | Revenue | Revenue | Revenue | Revenue | Taxes | Taxes | $/BOE6 | |
| Mo-Year | M$ | M$ | M$ | M$ | M$ | M$ | M$ | M$ | | |
| 12-2018 | .000 | .000 | .000 | 0.000 | 0.000 | .000 | .000 | .000 | .000 | |
| 12-2019 | .000 | .000 | .000 | 0.000 | 0.000 | .000 | .000 | .000 | .000 | |
| 12-2020 | 3,488.953 | 390.393 | 132.015 | 0.000 | 0.000 | 4,011.360 | 200.370 | 100.284 | 3.985 | |
| 12-2021 | 1,906.651 | 213.343 | 72.144 | 0.000 | 0.000 | 2,192.138 | 109.499 | 54.803 | 5.571 | |
| 12-2022 | 1,241.939 | 138.966 | 46.992 | 0.000 | 0.000 | 1,427.897 | 71.325 | 35.697 | 7.092 | |
| 12-2023 | 939.612 | 105.137 | 35.553 | 0.000 | 0.000 | 1,080.302 | 53.962 | 27.008 | 8.496 | |
| 12-2024 | 765.117 | 85.612 | 28.950 | 0.000 | 0.000 | 879.679 | 43.941 | 21.992 | 9.812 | |
| 12-2025 | 646.192 | 72.305 | 24.451 | 0.000 | 0.000 | 742.948 | 37.111 | 18.574 | 11.116 | |
| 12-2026 | 562.788 | 62.973 | 21.295 | 0.000 | 0.000 | 647.056 | 32.321 | 16.176 | 12.359 | |
| 12-2027 | 499.927 | 55.939 | 18.916 | 0.000 | 0.000 | 574.782 | 28.711 | 14.370 | 13.570 | |
| 12-2028 | 451.882 | 50.563 | 17.098 | 0.000 | 0.000 | 519.543 | 25.952 | 12.989 | 14.722 | |
| 12-2029 | 410.930 | 45.981 | 15.549 | 0.000 | 0.000 | 472.460 | 23.600 | 11.811 | 15.918 | |
| 12-2030 | 377.626 | 42.254 | 14.289 | 0.000 | 0.000 | 434.169 | 21.687 | 10.854 | 17.081 | |
| 12-2031 | 347.436 | 38.876 | 13.146 | 0.000 | 0.000 | 399.458 | 19.953 | 9.986 | 18.328 | |
| 12-2032 | 320.499 | 35.862 | 12.127 | 0.000 | 0.000 | 368.488 | 18.406 | 9.212 | 19.639 | |
| 12-2033 | 294.036 | 32.901 | 11.126 | 0.000 | 0.000 | 338.063 | 16.886 | 8.452 | 21.161 | |
| 12-2034 | 270.529 | 30.271 | 10.236 | 0.000 | 0.000 | 311.036 | 15.536 | 7.776 | 22.763 | |
| 12-2035 | 248.901 | 27.850 | 9.418 | 0.000 | 0.000 | 286.169 | 14.294 | 7.154 | 24.504 | |
| 12-2036 | 229.603 | 25.691 | 8.688 | 0.000 | 0.000 | 263.982 | 13.186 | 6.600 | 26.334 | |
| S Tot | 13,002.621 | 1,454.916 | 491.993 | 0.000 | 0.000 | 14,949.529 | 746.740 | 373.738 | 9.735 | |
| After | 586.037 | 65.574 | 22.174 | 0.000 | 0.000 | 673.786 | 33.656 | 16.845 | 30.648 | |
| Total | 13,588.659 | 1,520.490 | 514.167 | 0.000 | 0.000 | 15,623.315 | 780.396 | 390.583 | 10.637 | |
| (21) | (22) | (23) | (24) | (25) | (26) | (27) | (28) | (29) | (30) | (31) | |
| | Operating | Wells | Workover | 3rd Party | Other | | Future Net | Cumulative | Cum.Cash Flow | |
| End | Expense | Gross | Net | Expense | COPAS | Deductions | Investment | Cash Flow | Cash Flow | Disc.@ 10. % | |
| Mo-Year | M$ | Count | M$ | M$ | M$ | M$ | M$ | M$ | M$ | |
| 12-2018 | .000 | 0 | 0.0 | 0.000 | 0.000 | 0.000 | .000 | .000 | .000 | .000 | |
| 12-2019 | .000 | 0 | 0.0 | 0.000 | 0.000 | 0.000 | .000 | .000 | .000 | .000 | |
| 12-2020 | 135.442 | 1 | 0.9 | 0.000 | 0.000 | 293.918 | 6,974.597 | -3,693.251 | -3,693.251 | -3,168.503 | |
| 12-2021 | 167.390 | 1 | 0.9 | 0.000 | 0.000 | 160.621 | .000 | 1,699.824 | -1,993.427 | -1,944.757 | |
| 12-2022 | 167.390 | 1 | 0.9 | 0.000 | 0.000 | 104.624 | .000 | 1,048.861 | -944.566 | -1,259.457 | |
| 12-2023 | 167.390 | 1 | 0.9 | 0.000 | 0.000 | 79.155 | .000 | 752.787 | -191.780 | -812.623 | |
| 12-2024 | 167.390 | 1 | 0.9 | 0.000 | 0.000 | 64.455 | .000 | 581.901 | 390.122 | -498.765 | |
| 12-2025 | 167.390 | 1 | 0.9 | 0.000 | 0.000 | 54.437 | .000 | 465.436 | 855.558 | -270.628 | |
| 12-2026 | 167.390 | 1 | 0.9 | 0.000 | 0.000 | 47.411 | .000 | 383.757 | 1,239.315 | -99.647 | |
| 12-2027 | 167.390 | 1 | 0.9 | 0.000 | 0.000 | 42.115 | .000 | 322.196 | 1,561.511 | 30.846 | |
| 12-2028 | 167.390 | 1 | 0.9 | 0.000 | 0.000 | 38.068 | .000 | 275.145 | 1,836.656 | 132.141 | |
| 12-2029 | 167.390 | 1 | 0.9 | 0.000 | 0.000 | 34.618 | .000 | 235.041 | 2,071.697 | 210.789 | |
| 12-2030 | 167.390 | 1 | 0.9 | 0.000 | 0.000 | 31.812 | .000 | 202.425 | 2,274.122 | 272.369 | |
| 12-2031 | 167.390 | 1 | 0.9 | 0.000 | 0.000 | 29.269 | .000 | 172.859 | 2,446.981 | 320.181 | |
| 12-2032 | 167.390 | 1 | 0.9 | 0.000 | 0.000 | 27.000 | .000 | 146.479 | 2,593.461 | 357.018 | |
| 12-2033 | 167.390 | 1 | 0.9 | 0.000 | 0.000 | 24.770 | .000 | 120.564 | 2,714.025 | 384.580 | |
| 12-2034 | 167.390 | 1 | 0.9 | 0.000 | 0.000 | 22.790 | .000 | 97.543 | 2,811.567 | 404.855 | |
| 12-2035 | 167.390 | 1 | 0.9 | 0.000 | 0.000 | 20.968 | .000 | 76.362 | 2,887.929 | 419.289 | |
| 12-2036 | 167.390 | 1 | 0.9 | 0.000 | 0.000 | 19.342 | .000 | 57.464 | 2,945.393 | 429.169 | |
| S Tot | 2,813.687 | | 0.000 | 0.000 | 1,095.373 | 6,974.597 | 2,945.393 | 2,945.393 | 429.169 | | |
| After | 505.321 | | 0.000 | 0.000 | 49.369 | .000 | 68.595 | 3,013.988 | 439.390 | | |
| Total | 3,319.008 | | 0.000 | 0.000 | 1,144.743 | 6,974.597 | 3,013.988 | 3,013.988 | 439.390 | | |
| Evaluation Parameters (Gross) | | Expenses (Gross) | | Percent Interests | | Percent | Cum. Disc. | |
| | Initial | Final | Units | | Dei | n | Def | | Initial | Final | Units | | | | Final | | 5.00 | 1,396.836 | |
| Oil Rate | 20,835. | 419. | bbls/mo | | 96.3% | 1.20 | 0.0% | | 11,354. | 15,999. | $/w/mo | | Expense | 87.1825 | 87.1825 | | 8.00 | 766.351 | |
| Gas Rate | 62,506. | 1,258. | Mcf/mo | | 0.0% | 0.00 | 0.0% | | | | | | Revenue | | | | 10.00 | 439.390 | |
| GOR | 3,000. | 3,000. | scf/bbl | | | | | | | | | | Oil | 71.0940 | 71.0940 | | 12.00 | 169.674 | |
| NGL Rate | 2,846. | 88. | bbls/mo | | | | | | | | | | Gas | 71.0940 | 71.0940 | | 15.00 | -151.106 | |
| NGL Yield | 45.5 | 70.6 | bbl/MMcf | | | | | | | | | | | | | | 20.00 | -524.873 | |
| Gas Shrinkage | 55.9 | 31.8 | % | | | | | | | | | | | | | | | | |
| Oil Severance | 4.6 | 4.6 | % | | | | | | | | | | | | | | | | |
| Gas Severance | 7.5 | 7.5 | % | | | | | | | | | | | | | | | | |
| NGL Severance | 7.5 | 7.5 | % | | | | | | | | | | | | | | | | |
| Ad Valorem | 41.9 | | % | | | | | | | | | | | | | | | | |
| | Start Date: 03/2020 | 10 Months in year ‘20 | 19.851 Year Life (01/2040) |
| THESE DATA ARE PART OF A CG&A REPORT AND ARE SUBJECT TO THE CONDITIONS IN THE TEXT OF THE REPORT. TEXAS REGISTERED ENGINEERING FIRM F-693. | ASN 484 | DEFAULT 1/10/2018 10:34:19 OIL PUD Table 9 |
Cawley, Gillespie & Associates, Inc.
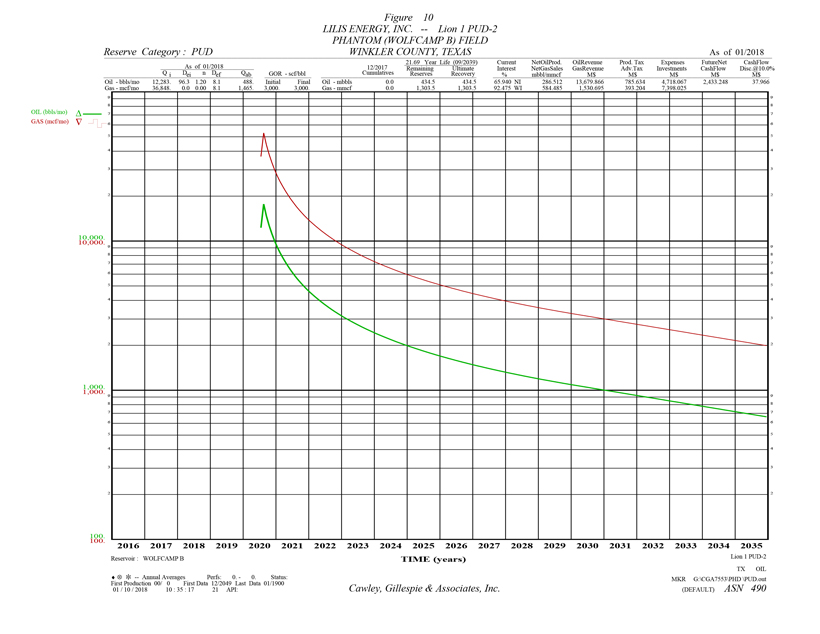
Table 10
Reserve Estimates and Economic Forecasts as of December 31, 2017
Lilis Energy, Inc. Interests
Proved Undeveloped Reserves
LILIS ENERGY, INC. -- LION 1 PUD-2
PHANTOM (WOLFCAMP B) FIELD -- WINKLER COUNTY, TEXAS
| (1) | (2) | (3) | (4) | (5) | (6) | (7) | (8) | (9) | (10) |
| | Gross Oil | Gross Gas | Gross NGL | Net Oil | Net Gas | Net NGL | Avg Oil | Avg Gas | Avg NGL |
| End | Production | Production | Production | Production | Sales | Production | Price | Price | Price |
| Mo-Year | MBBLS | MMCF | MBBLS | MBBLS | MMCF | MBBLS | $/BBL | $/MCF | $/BBL |
| 12-2018 | .0 | .0 | .0 | .000 | .000 | .000 | .000 | .000 | .000 | |
| 12-2019 | .0 | .0 | .0 | .000 | .000 | .000 | .000 | .000 | .000 | |
| 12-2020 | 79.2 | 237.7 | 16.4 | 52.252 | 106.595 | 10.816 | 47.746 | 2.619 | 8.728 | |
| 12-2021 | 77.1 | 231.4 | 16.0 | 50.851 | 103.736 | 10.526 | 47.746 | 2.619 | 8.728 | |
| 12-2022 | 45.3 | 136.0 | 9.4 | 29.894 | 60.984 | 6.188 | 47.746 | 2.619 | 8.728 | |
| 12-2023 | 33.0 | 99.1 | 6.8 | 21.779 | 44.429 | 4.508 | 47.746 | 2.619 | 8.728 | |
| 12-2024 | 26.4 | 79.1 | 5.5 | 17.384 | 35.463 | 3.598 | 47.746 | 2.619 | 8.728 | |
| 12-2025 | 22.0 | 66.0 | 4.6 | 14.501 | 29.582 | 3.002 | 47.746 | 2.619 | 8.728 | |
| 12-2026 | 19.0 | 57.0 | 3.9 | 12.523 | 25.547 | 2.592 | 47.746 | 2.619 | 8.728 | |
| 12-2027 | 16.8 | 50.3 | 3.5 | 11.056 | 22.554 | 2.289 | 47.746 | 2.619 | 8.728 | |
| 12-2028 | 15.1 | 45.3 | 3.1 | 9.947 | 20.292 | 2.059 | 47.746 | 2.619 | 8.728 | |
| 12-2029 | 13.7 | 41.0 | 2.8 | 9.012 | 18.385 | 1.866 | 47.746 | 2.619 | 8.728 | |
| 12-2030 | 12.5 | 37.6 | 2.6 | 8.266 | 16.863 | 1.711 | 47.746 | 2.619 | 8.728 | |
| 12-2031 | 11.5 | 34.6 | 2.4 | 7.605 | 15.515 | 1.574 | 47.746 | 2.619 | 8.728 | |
| 12-2032 | 10.6 | 31.9 | 2.2 | 7.016 | 14.312 | 1.452 | 47.746 | 2.619 | 8.728 | |
| 12-2033 | 9.8 | 29.3 | 2.0 | 6.436 | 13.130 | 1.332 | 47.746 | 2.619 | 8.728 | |
| 12-2034 | 9.0 | 26.9 | 1.9 | 5.922 | 12.081 | 1.226 | 47.746 | 2.619 | 8.728 | |
| 12-2035 | 8.3 | 24.8 | 1.7 | 5.448 | 11.115 | 1.128 | 47.746 | 2.619 | 8.728 | |
| 12-2036 | 7.6 | 22.9 | 1.6 | 5.026 | 10.253 | 1.040 | 47.746 | 2.619 | 8.728 | |
| S Tot | 416.9 | 1,250.8 | 86.3 | 274.919 | 560.835 | 56.908 | 47.746 | 2.619 | 8.728 | |
| After | 17.6 | 52.7 | 3.6 | 11.593 | 23.650 | 2.400 | 47.746 | 2.619 | 8.728 | |
| Total | 434.5 | 1,303.5 | 89.9 | 286.512 | 584.485 | 59.308 | 47.746 | 2.619 | 8.728 | |
| Cum | .0 | .0 | .0 | | | | | | | |
| Ult | 434.5 | 1,303.5 | 89.9 | | | | | | | |
| (11) | (12) | (13) | (14) | (15) | (16) | (17) | (18) | (19) | (20) |
| | Oil | Gas | NGL | Hedge | Other | Total | Production | Ad Valorem | |
| End | Revenue | Revenue | Revenue | Revenue | Revenue | Revenue | Taxes | Taxes | $/BOE6 |
| Mo-Year | M$ | M$ | M$ | M$ | M$ | M$ | M$ | M$ | |
| 12-2018 | .000 | .000 | .000 | 0.000 | 0.000 | .000 | .000 | .000 | .000 | |
| 12-2019 | .000 | .000 | .000 | 0.000 | 0.000 | .000 | .000 | .000 | .000 | |
| 12-2020 | 2,494.853 | 279.159 | 94.400 | 0.000 | 0.000 | 2,868.412 | 143.279 | 71.710 | 4.191 | |
| 12-2021 | 2,427.939 | 271.672 | 91.868 | 0.000 | 0.000 | 2,791.479 | 139.436 | 69.787 | 5.487 | |
| 12-2022 | 1,427.330 | 159.710 | 54.007 | 0.000 | 0.000 | 1,641.047 | 81.972 | 41.026 | 7.147 | |
| 12-2023 | 1,039.868 | 116.355 | 39.346 | 0.000 | 0.000 | 1,195.569 | 59.720 | 29.889 | 8.648 | |
| 12-2024 | 830.011 | 92.873 | 31.406 | 0.000 | 0.000 | 954.290 | 47.667 | 23.857 | 10.046 | |
| 12-2025 | 692.357 | 77.471 | 26.197 | 0.000 | 0.000 | 796.025 | 39.762 | 19.901 | 11.423 | |
| 12-2026 | 597.919 | 66.904 | 22.624 | 0.000 | 0.000 | 687.446 | 34.338 | 17.186 | 12.735 | |
| 12-2027 | 527.880 | 59.067 | 19.974 | 0.000 | 0.000 | 606.921 | 30.316 | 15.173 | 14.011 | |
| 12-2028 | 474.924 | 53.141 | 17.970 | 0.000 | 0.000 | 546.035 | 27.275 | 13.651 | 15.225 | |
| 12-2029 | 430.302 | 48.148 | 16.282 | 0.000 | 0.000 | 494.731 | 24.712 | 12.368 | 16.480 | |
| 12-2030 | 394.689 | 44.163 | 14.934 | 0.000 | 0.000 | 453.787 | 22.667 | 11.345 | 17.686 | |
| 12-2031 | 363.124 | 40.631 | 13.740 | 0.000 | 0.000 | 417.495 | 20.854 | 10.437 | 18.952 | |
| 12-2032 | 334.971 | 37.481 | 12.675 | 0.000 | 0.000 | 385.127 | 19.237 | 9.628 | 20.283 | |
| 12-2033 | 307.313 | 34.387 | 11.628 | 0.000 | 0.000 | 353.328 | 17.649 | 8.833 | 21.827 | |
| 12-2034 | 282.744 | 31.637 | 10.698 | 0.000 | 0.000 | 325.080 | 16.238 | 8.127 | 23.453 | |
| 12-2035 | 260.139 | 29.108 | 9.843 | 0.000 | 0.000 | 299.091 | 14.940 | 7.477 | 25.220 | |
| 12-2036 | 239.971 | 26.851 | 9.080 | 0.000 | 0.000 | 275.902 | 13.782 | 6.898 | 27.077 | |
| S Tot | 13,126.334 | 1,468.758 | 496.674 | 0.000 | 0.000 | 15,091.766 | 753.845 | 377.294 | 10.331 | |
| After | 553.532 | 61.937 | 20.945 | 0.000 | 0.000 | 636.414 | 31.789 | 15.910 | 31.007 | |
| Total | 13,679.866 | 1,530.695 | 517.618 | 0.000 | 0.000 | 15,728.179 | 785.634 | 393.204 | 11.168 | |
| (21) | (22) | (23) | (24) | (25) | (26) | (27) | (28) | (29) | (30) | (31) |
| | Operating | Wells | Workover | 3rd Party | Other | | Future Net | Cumulative | Cum.Cash Flow |
| End | Expense | Gross | Net | Expense | COPAS | Deductions | Investment | Cash Flow | Cash Flow | Disc.@ 10. % |
| Mo-Year | M$ | Count | M$ | M$ | M$ | M$ | M$ | M$ | M$ |
| 12-2018 | .000 | 0 | 0.0 | 0.000 | 0.000 | 0.000 | .000 | .000 | .000 | .000 | |
| 12-2019 | .000 | 0 | 0.0 | 0.000 | 0.000 | 0.000 | .000 | .000 | .000 | .000 | |
| 12-2020 | 82.572 | 1 | 0.9 | 0.000 | 0.000 | 240.356 | 7,398.025 | -5,067.530 | -5,067.530 | -4,107.117 | |
| 12-2021 | 177.553 | 1 | 0.9 | 0.000 | 0.000 | 233.910 | .000 | 2,170.793 | -2,896.737 | -2,542.175 | |
| 12-2022 | 177.553 | 1 | 0.9 | 0.000 | 0.000 | 137.510 | .000 | 1,202.986 | -1,693.751 | -1,755.824 | |
| 12-2023 | 177.553 | 1 | 0.9 | 0.000 | 0.000 | 100.182 | .000 | 828.226 | -865.524 | -1,264.098 | |
| 12-2024 | 177.553 | 1 | 0.9 | 0.000 | 0.000 | 79.964 | .000 | 625.249 | -240.276 | -926.810 | |
| 12-2025 | 177.553 | 1 | 0.9 | 0.000 | 0.000 | 66.702 | .000 | 492.108 | 251.832 | -685.574 | |
| 12-2026 | 177.553 | 1 | 0.9 | 0.000 | 0.000 | 57.604 | .000 | 400.765 | 652.597 | -507.000 | |
| 12-2027 | 177.553 | 1 | 0.9 | 0.000 | 0.000 | 50.856 | .000 | 333.023 | 985.620 | -372.112 | |
| 12-2028 | 177.553 | 1 | 0.9 | 0.000 | 0.000 | 45.755 | .000 | 281.802 | 1,267.422 | -268.359 | |
| 12-2029 | 177.553 | 1 | 0.9 | 0.000 | 0.000 | 41.456 | .000 | 238.643 | 1,506.065 | -188.501 | |
| 12-2030 | 177.553 | 1 | 0.9 | 0.000 | 0.000 | 38.025 | .000 | 204.198 | 1,710.263 | -126.380 | |
| 12-2031 | 177.553 | 1 | 0.9 | 0.000 | 0.000 | 34.984 | .000 | 173.667 | 1,883.930 | -78.343 | |
| 12-2032 | 177.553 | 1 | 0.9 | 0.000 | 0.000 | 32.271 | .000 | 146.437 | 2,030.368 | -41.515 | |
| 12-2033 | 177.553 | 1 | 0.9 | 0.000 | 0.000 | 29.607 | .000 | 119.686 | 2,150.054 | -14.153 | |
| 12-2034 | 177.553 | 1 | 0.9 | 0.000 | 0.000 | 27.240 | .000 | 95.923 | 2,245.976 | 5.787 | |
| 12-2035 | 177.553 | 1 | 0.9 | 0.000 | 0.000 | 25.062 | .000 | 74.059 | 2,320.035 | 19.787 | |
| 12-2036 | 177.553 | 1 | 0.9 | 0.000 | 0.000 | 23.119 | .000 | 54.551 | 2,374.587 | 29.168 | |
| S Tot | 2,923.413 | | | 0.000 | 0.000 | 1,264.602 | 7,398.025 | 2,374.587 | 2,374.587 | 29.168 | |
| After | 476.724 | | | 0.000 | 0.000 | 53.328 | .000 | 58.662 | 2,433.248 | 37.966 | |
| Total | 3,400.137 | | | 0.000 | 0.000 | 1,317.930 | 7,398.025 | 2,433.248 | 2,433.248 | 37.966 | |
| Evaluation Parameters (Gross) | | Expenses (Gross) | | Percent Interests | | Percent | Cum Disc. | |
| | Initial | Final | Units | | Dei | n | Def | | Initial | Final | Units | | | | Final | | 5.00 | 911.841 | |
| Oil Rate | 22,812. | 485. | bbls/mo | | 96.3% | 1.20 | 0.0% | | 9,290. | 15,999. | $/w/mo | | Expense | 92.4753 | 92.4753 | | 8.00 | 332.782 | |
| Gas Rate | 68,437. | 1,456. | Mcf/mo | | 0.0% | 0.00 | 0.0% | | | | | | Revenue | | | | 10.00 | 37.966 | |
| GOR | 3,000. | 3,000. | scf/bbl | | | | | | | | | | Oil | 65.9402 | 65.9402 | | 12.00 | -201.209 | |
| NGL Rate | 2,589. | 103. | bbls/mo | | | | | | | | | | Gas | 65.9402 | 65.9402 | | 15.00 | -479.037 | |
| NGL Yield | 37.8 | 70.7 | bbl/MMcf | | | | | | | | | | | | | | 20.00 | -788.367 | |
| Gas Shrinkage | 63.4 | 31.7 | % | | | | | | | | | | | | | | | | |
| Oil Severance | 4.6 | 4.6 | % | | | | | | | | | | | | | | | | |
| Gas Severance | 7.5 | 7.5 | % | | | | | | | | | | | | | | | | |
| NGL Severance | 7.5 | 7.5 | % | | | | | | | | | | | | | | | | |
| Ad Valorem | 45.0 | | % | | | | | | | | | | | | | | | | |
Start Date: 07/2020 6 Months in year ‘20 19.192 Year Life (09/2039)
| THESE DATA ARE PART OF A CG&A REPORT AND ARE SUBJECT TO THE CONDITIONS IN THE TEXT OF THE REPORT. | ASN 490 | DEFAULT 1/10/2018 10:34:19 |
| TEXAS REGISTERED ENGINEERING FIRM F-693. | | OIL PUD |
| | | Table 10 |
Cawley, Gillespie & Associates, Inc.
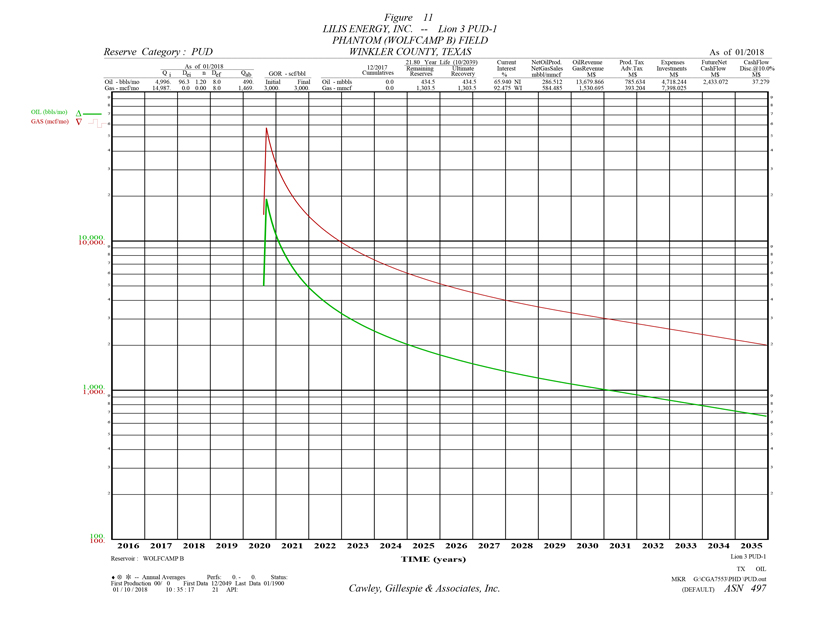
Table 11
Reserve Estimates and Economic Forecasts as of December 31, 2017
Lilis Energy, Inc. Interests
Proved Undeveloped Reserves
LILIS ENERGY, INC. -- LION 3 PUD-1
PHANTOM (WOLFCAMP B) FIELD -- WINKLER COUNTY, TEXAS
| (1) | (2) | (3) | (4) | (5) | (6) | (7) | (8) | (9) | (10) |
| | Gross Oil | Gross Gas | Gross NGL | Net Oil | Net Gas | Net NGL | Avg Oil | Avg Gas | Avg NGL |
| End | Production | Production | Production | Production | Sales | Production | Price | Price | Price |
| Mo-Year | MBBLS | MMCF | MBBLS | MBBLS | MMCF | MBBLS | $/BBL | $/MCF | $/BBL |
| 12-2018 | .0 | .0 | .0 | .000 | .000 | .000 | .000 | .000 | .000 | |
| 12-2019 | .0 | .0 | .0 | .000 | .000 | .000 | .000 | .000 | .000 | |
| 12-2020 | 65.1 | 195.4 | 13.5 | 42.946 | 87.611 | 8.890 | 47.746 | 2.619 | 8.728 | |
| 12-2021 | 84.7 | 254.0 | 17.5 | 55.836 | 113.906 | 11.558 | 47.746 | 2.619 | 8.728 | |
| 12-2022 | 47.5 | 142.4 | 9.8 | 31.296 | 63.845 | 6.478 | 47.746 | 2.619 | 8.728 | |
| 12-2023 | 34.1 | 102.2 | 7.1 | 22.460 | 45.818 | 4.649 | 47.746 | 2.619 | 8.728 | |
| 12-2024 | 27.0 | 80.9 | 5.6 | 17.792 | 36.296 | 3.683 | 47.746 | 2.619 | 8.728 | |
| 12-2025 | 22.4 | 67.2 | 4.6 | 14.774 | 30.139 | 3.058 | 47.746 | 2.619 | 8.728 | |
| 12-2026 | 19.3 | 57.9 | 4.0 | 12.720 | 25.949 | 2.633 | 47.746 | 2.619 | 8.728 | |
| 12-2027 | 17.0 | 51.0 | 3.5 | 11.205 | 22.859 | 2.320 | 47.746 | 2.619 | 8.728 | |
| 12-2028 | 15.3 | 45.8 | 3.2 | 10.065 | 20.532 | 2.083 | 47.746 | 2.619 | 8.728 | |
| 12-2029 | 13.8 | 41.4 | 2.9 | 9.107 | 18.579 | 1.885 | 47.746 | 2.619 | 8.728 | |
| 12-2030 | 12.7 | 38.0 | 2.6 | 8.347 | 17.027 | 1.728 | 47.746 | 2.619 | 8.728 | |
| 12-2031 | 11.6 | 34.9 | 2.4 | 7.679 | 15.664 | 1.589 | 47.746 | 2.619 | 8.728 | |
| 12-2032 | 10.7 | 32.2 | 2.2 | 7.083 | 14.450 | 1.466 | 47.746 | 2.619 | 8.728 | |
| 12-2033 | 9.9 | 29.6 | 2.0 | 6.498 | 13.257 | 1.345 | 47.746 | 2.619 | 8.728 | |
| 12-2034 | 9.1 | 27.2 | 1.9 | 5.979 | 12.197 | 1.238 | 47.746 | 2.619 | 8.728 | |
| 12-2035 | 8.3 | 25.0 | 1.7 | 5.501 | 11.222 | 1.139 | 47.746 | 2.619 | 8.728 | |
| 12-2036 | 7.7 | 23.1 | 1.6 | 5.074 | 10.352 | 1.050 | 47.746 | 2.619 | 8.728 | |
| S Tot | 416.1 | 1,248.2 | 86.1 | 274.363 | 559.701 | 56.793 | 47.746 | 2.619 | 8.728 | |
| After | 18.4 | 55.3 | 3.8 | 12.149 | 24.784 | 2.515 | 47.746 | 2.619 | 8.728 | |
| Total | 434.5 | 1,303.5 | 89.9 | 286.512 | 584.485 | 59.308 | 47.746 | 2.619 | 8.728 | |
| Cum | .0 | .0 | .0 | | | | | | | |
| Ult | 434.5 | 1,303.5 | 89.9 | | | | | | | |
| (11) | (12) | (13) | (14) | (15) | (16) | (17) | (18) | (19) | (20) |
| | Oil | Gas | NGL | Hedge | Other | Total | Production | Ad Valorem | |
| End | Revenue | Revenue | Revenue | Revenue | Revenue | Revenue | Taxes | Taxes | $/BOE6 |
| Mo-Year | M$ | M$ | M$ | M$ | M$ | M$ | M$ | M$ | |
| 12-2018 | .000 | .000 | .000 | 0.000 | 0.000 | .000 | .000 | .000 | .000 | |
| 12-2019 | .000 | .000 | .000 | 0.000 | 0.000 | .000 | .000 | .000 | .000 | |
| 12-2020 | 2,050.529 | 229.442 | 77.588 | 0.000 | 0.000 | 2,357.559 | 117.762 | 58.939 | 4.107 | |
| 12-2021 | 2,665.972 | 298.306 | 100.875 | 0.000 | 0.000 | 3,065.154 | 153.107 | 76.629 | 5.276 | |
| 12-2022 | 1,494.281 | 167.201 | 56.541 | 0.000 | 0.000 | 1,718.023 | 85.817 | 42.951 | 6.967 | |
| 12-2023 | 1,072.377 | 119.993 | 40.577 | 0.000 | 0.000 | 1,232.946 | 61.587 | 30.824 | 8.481 | |
| 12-2024 | 849.517 | 95.056 | 32.144 | 0.000 | 0.000 | 976.717 | 48.788 | 24.418 | 9.887 | |
| 12-2025 | 705.403 | 78.930 | 26.691 | 0.000 | 0.000 | 811.025 | 40.511 | 20.276 | 11.270 | |
| 12-2026 | 607.328 | 67.956 | 22.980 | 0.000 | 0.000 | 698.264 | 34.879 | 17.457 | 12.586 | |
| 12-2027 | 535.012 | 59.865 | 20.244 | 0.000 | 0.000 | 615.121 | 30.726 | 15.378 | 13.865 | |
| 12-2028 | 480.545 | 53.770 | 18.183 | 0.000 | 0.000 | 552.498 | 27.598 | 13.812 | 15.083 | |
| 12-2029 | 434.833 | 48.655 | 16.453 | 0.000 | 0.000 | 499.942 | 24.972 | 12.499 | 16.341 | |
| 12-2030 | 398.514 | 44.591 | 15.079 | 0.000 | 0.000 | 458.185 | 22.887 | 11.455 | 17.546 | |
| 12-2031 | 366.622 | 41.023 | 13.872 | 0.000 | 0.000 | 421.518 | 21.055 | 10.538 | 18.801 | |
| 12-2032 | 338.198 | 37.842 | 12.797 | 0.000 | 0.000 | 388.837 | 19.423 | 9.721 | 20.119 | |
| 12-2033 | 310.274 | 34.718 | 11.740 | 0.000 | 0.000 | 356.732 | 17.819 | 8.918 | 21.649 | |
| 12-2034 | 285.468 | 31.942 | 10.802 | 0.000 | 0.000 | 328.212 | 16.394 | 8.205 | 23.259 | |
| 12-2035 | 262.646 | 29.388 | 9.938 | 0.000 | 0.000 | 301.972 | 15.084 | 7.549 | 25.009 | |
| 12-2036 | 242.283 | 27.110 | 9.167 | 0.000 | 0.000 | 278.560 | 13.914 | 6.964 | 26.849 | |
| S Tot | 13,099.803 | 1,465.790 | 495.670 | 0.000 | 0.000 | 15,061.263 | 752.321 | 376.532 | 10.296 | |
| After | 580.062 | 64.906 | 21.948 | 0.000 | 0.000 | 666.916 | 33.313 | 16.673 | 30.860 | |
| Total | 13,679.866 | 1,530.695 | 517.618 | 0.000 | 0.000 | 15,728.179 | 785.634 | 393.204 | 11.168 | |
| (21) | (22) | (23) | (24) | (25) | (26) | (27) | (28) | (29) | (30) | (31) |
| | Operating | Wells | Workover | 3rd Party | Other | | Future Net | Cumulative | Cum.Cash Flow |
| End | Expense | Gross | Net | Expense | COPAS | Deductions | Investment | Cash Flow | Cash Flow | Disc.@ 10. % |
| Mo-Year | M$ | Count | M$ | M$ | M$ | M$ | M$ | M$ | M$ |
| 12-2018 | .000 | 0 | 0.0 | 0.000 | 0.000 | 0.000 | .000 | .000 | .000 | .000 | |
| 12-2019 | .000 | 0 | 0.0 | 0.000 | 0.000 | 0.000 | .000 | .000 | .000 | .000 | |
| 12-2020 | 62.525 | 1 | 0.9 | 0.000 | 0.000 | 197.550 | 7,398.025 | -5,477.241 | -5,477.241 | -4,368.485 | |
| 12-2021 | 177.553 | 1 | 0.9 | 0.000 | 0.000 | 256.842 | .000 | 2,401.023 | -3,076.218 | -2,636.423 | |
| 12-2022 | 177.553 | 1 | 0.9 | 0.000 | 0.000 | 143.960 | .000 | 1,267.743 | -1,808.475 | -1,807.601 | |
| 12-2023 | 177.553 | 1 | 0.9 | 0.000 | 0.000 | 103.314 | .000 | 859.669 | -948.806 | -1,297.166 | |
| 12-2024 | 177.553 | 1 | 0.9 | 0.000 | 0.000 | 81.843 | .000 | 644.115 | -304.690 | -949.685 | |
| 12-2025 | 177.553 | 1 | 0.9 | 0.000 | 0.000 | 67.959 | .000 | 504.726 | 200.036 | -702.256 | |
| 12-2026 | 177.553 | 1 | 0.9 | 0.000 | 0.000 | 58.510 | .000 | 409.865 | 609.901 | -519.624 | |
| 12-2027 | 177.553 | 1 | 0.9 | 0.000 | 0.000 | 51.544 | .000 | 339.921 | 949.822 | -381.940 | |
| 12-2028 | 177.553 | 1 | 0.9 | 0.000 | 0.000 | 46.296 | .000 | 287.239 | 1,237.061 | -276.184 | |
| 12-2029 | 177.553 | 1 | 0.9 | 0.000 | 0.000 | 41.892 | .000 | 243.026 | 1,480.088 | -194.859 | |
| 12-2030 | 177.553 | 1 | 0.9 | 0.000 | 0.000 | 38.393 | .000 | 207.898 | 1,687.985 | -131.612 | |
| 12-2031 | 177.553 | 1 | 0.9 | 0.000 | 0.000 | 35.321 | .000 | 177.051 | 1,865.036 | -82.640 | |
| 12-2032 | 177.553 | 1 | 0.9 | 0.000 | 0.000 | 32.582 | .000 | 149.559 | 2,014.595 | -45.028 | |
| 12-2033 | 177.553 | 1 | 0.9 | 0.000 | 0.000 | 29.892 | .000 | 122.550 | 2,137.145 | -17.012 | |
| 12-2034 | 177.553 | 1 | 0.9 | 0.000 | 0.000 | 27.502 | .000 | 98.557 | 2,235.702 | 3.476 | |
| 12-2035 | 177.553 | 1 | 0.9 | 0.000 | 0.000 | 25.304 | .000 | 76.483 | 2,312.185 | 17.934 | |
| 12-2036 | 177.553 | 1 | 0.9 | 0.000 | 0.000 | 23.342 | .000 | 56.787 | 2,368.972 | 27.698 | |
| S Tot | 2,903.367 | | | 0.000 | 0.000 | 1,262.046 | 7,398.025 | 2,368.972 | 2,368.972 | 27.698 | |
| After | 496.947 | | | 0.000 | 0.000 | 55.884 | .000 | 64.100 | 2,433.072 | 37.279 | |
| Total | 3,400.314 | | | 0.000 | 0.000 | 1,317.930 | 7,398.025 | 2,433.072 | 2,433.072 | 37.279 | |
| Evaluation Parameters (Gross) | | Expenses (Gross) | | Percent Interests | | Percent | Cum Disc. | |
| | Initial | Final | Units | | Dei | n | Def | | Initial | Final | Units | | | | Final | | 5.00 | 906.478 | |
| Oil Rate | 22,812. | 485. | bbls/mo | | 96.3% | 1.20 | 0.0% | | 3,612. | 15,769. | $/w/mo | | Expense | 92.4753 | 92.4753 | | 8.00 | 329.577 | |
| Gas Rate | 68,437. | 1,456. | Mcf/mo | | 0.0% | 0.00 | 0.0% | | | | | | Revenue | | | | 10.00 | 37.279 | |
| GOR | 3,000. | 3,000. | scf/bbl | | | | | | | | | | Oil | 65.9402 | 65.9402 | | 12.00 | -198.873 | |
| NGL Rate | 1,053. | 99. | bbls/mo | | | | | | | | | | Gas | 65.9402 | 65.9402 | | 15.00 | -471.660 | |
| NGL Yield | 15.4 | 68.6 | bbl/MMcf | | | | | | | | | | | | | | 20.00 | -772.253 | |
| Gas Shrinkage | 85.1 | 31.5 | % | | | | | | | | | | | | | | | | |
| Oil Severance | 4.6 | 4.6 | % | | | | | | | | | | | | | | | | |
| Gas Severance | 7.5 | 7.5 | % | | | | | | | | | | | | | | | | |
| NGL Severance | 7.5 | 7.5 | % | | | | | | | | | | | | | | | | |
| Ad Valorem | 43.7 | | % | | | | | | | | | | | | | | | | |
Start Date: 08/2020 5 Months in year ‘20 19.224 Year Life (10/2039)
| THESE DATA ARE PART OF A CG&A REPORT AND ARE SUBJECT TO THE CONDITIONS IN THE TEXT OF THE REPORT. | ASN 497 | DEFAULT | 1/10/2018 | 10:34:19 |
| TEXAS REGISTERED ENGINEERING FIRM F-693. | | | | OIL PUD | |
| | | | | Table 11 | |
Cawley, Gillespie & Associates, Inc.

Table 12
Reserve Estimates and Economic Forecasts as of December 31, 2017
Lilis Energy, Inc. Interests
Proved Undeveloped Reserves
LILIS ENERGY, INC. -- MEERKAT #1H
PHANTOM (WOLFCAMP B) FIELD -- WINKLER COUNTY, TEXAS
| (1) | (2) | (3) | (4) | (5) | (6) | (7) | (8) | (9) | (10) |
| | Gross Oil | Gross Gas | Gross NGL | Net Oil | Net Gas | Net NGL | Avg Oil | Avg Gas | Avg NGL |
| End | Production | Production | Production | Production | Sales | Production | Price | Price | Price |
| Mo-Year | MBBLS | MMCF | MBBLS | MBBLS | MMCF | MBBLS | $/BBL | $/MCF | $/BBL |
| 12-2018 | 99.8 | 299.5 | 20.7 | 59.144 | 120.655 | 12.243 | 47.746 | 2.619 | 8.728 | |
| 12-2019 | 67.1 | 201.3 | 13.9 | 39.759 | 81.108 | 8.230 | 47.746 | 2.619 | 8.728 | |
| 12-2020 | 42.2 | 126.6 | 8.7 | 25.004 | 51.008 | 5.176 | 47.746 | 2.619 | 8.728 | |
| 12-2021 | 31.4 | 94.1 | 6.5 | 18.586 | 37.915 | 3.847 | 47.746 | 2.619 | 8.728 | |
| 12-2022 | 25.3 | 75.8 | 5.2 | 14.979 | 30.557 | 3.101 | 47.746 | 2.619 | 8.728 | |
| 12-2023 | 21.3 | 63.9 | 4.4 | 12.626 | 25.757 | 2.614 | 47.746 | 2.619 | 8.728 | |
| 12-2024 | 18.5 | 55.6 | 3.8 | 10.987 | 22.413 | 2.274 | 47.746 | 2.619 | 8.728 | |
| 12-2025 | 16.4 | 49.1 | 3.4 | 9.707 | 19.802 | 2.009 | 47.746 | 2.619 | 8.728 | |
| 12-2026 | 14.7 | 44.2 | 3.1 | 8.735 | 17.819 | 1.808 | 47.746 | 2.619 | 8.728 | |
| 12-2027 | 13.4 | 40.3 | 2.8 | 7.954 | 16.227 | 1.647 | 47.746 | 2.619 | 8.728 | |
| 12-2028 | 12.4 | 37.1 | 2.6 | 7.324 | 14.941 | 1.516 | 47.746 | 2.619 | 8.728 | |
| 12-2029 | 11.3 | 34.0 | 2.3 | 6.719 | 13.707 | 1.391 | 47.746 | 2.619 | 8.728 | |
| 12-2030 | 10.4 | 31.3 | 2.2 | 6.182 | 12.611 | 1.280 | 47.746 | 2.619 | 8.728 | |
| 12-2031 | 9.6 | 28.8 | 2.0 | 5.688 | 11.603 | 1.177 | 47.746 | 2.619 | 8.728 | |
| 12-2032 | 8.9 | 26.6 | 1.8 | 5.247 | 10.703 | 1.086 | 47.746 | 2.619 | 8.728 | |
| 12-2033 | 8.1 | 24.4 | 1.7 | 4.814 | 9.820 | .996 | 47.746 | 2.619 | 8.728 | |
| 12-2034 | 7.5 | 22.4 | 1.5 | 4.429 | 9.035 | .917 | 47.746 | 2.619 | 8.728 | |
| 12-2035 | 6.9 | 20.6 | 1.4 | 4.075 | 8.312 | .843 | 47.746 | 2.619 | 8.728 | |
| 12-2036 | 6.3 | 19.0 | 1.3 | 3.759 | 7.668 | .778 | 47.746 | 2.619 | 8.728 | |
| S Tot | 431.6 | 1,294.8 | 89.3 | 255.716 | 521.660 | 52.933 | 47.746 | 2.619 | 8.728 | |
| After | 6.7 | 20.1 | 1.4 | 3.961 | 8.081 | .820 | 47.746 | 2.619 | 8.728 | |
| Total | 438.3 | 1,314.8 | 90.7 | 259.677 | 529.742 | 53.753 | 47.746 | 2.619 | 8.728 | |
| Cum | .0 | .0 | .0 | | | | | | | |
| Ult | 438.3 | 1,314.8 | 90.7 | | | | | | | |
| (11) | (12) | (13) | (14) | (15) | (16) | (17) | (18) | (19) | (20) |
| | Oil | Gas | NGL | Hedge | Other | Total | Production | Ad Valorem | |
| End | Revenue | Revenue | Revenue | Revenue | Revenue | Revenue | Taxes | Taxes | $/BOE6 |
| Mo-Year | M$ | M$ | M$ | M$ | M$ | M$ | M$ | M$ | |
| 12-2018 | 2,823.922 | 315.980 | 106.851 | 0.000 | 0.000 | 3,246.754 | 162.178 | 81.169 | 4.121 | |
| 12-2019 | 1,898.326 | 212.411 | 71.829 | 0.000 | 0.000 | 2,182.567 | 109.021 | 54.564 | 5.553 | |
| 12-2020 | 1,193.836 | 133.583 | 45.172 | 0.000 | 0.000 | 1,372.591 | 68.562 | 34.315 | 7.080 | |
| 12-2021 | 887.392 | 99.294 | 33.577 | 0.000 | 0.000 | 1,020.263 | 50.963 | 25.507 | 8.501 | |
| 12-2022 | 715.197 | 80.026 | 27.062 | 0.000 | 0.000 | 822.285 | 41.074 | 20.557 | 9.833 | |
| 12-2023 | 602.834 | 67.454 | 22.810 | 0.000 | 0.000 | 693.098 | 34.621 | 17.327 | 11.113 | |
| 12-2024 | 524.571 | 58.696 | 19.849 | 0.000 | 0.000 | 603.116 | 30.126 | 15.078 | 12.329 | |
| 12-2025 | 463.477 | 51.860 | 17.537 | 0.000 | 0.000 | 532.874 | 26.617 | 13.322 | 13.563 | |
| 12-2026 | 417.060 | 46.667 | 15.781 | 0.000 | 0.000 | 479.508 | 23.952 | 11.988 | 14.742 | |
| 12-2027 | 379.784 | 42.496 | 14.370 | 0.000 | 0.000 | 436.649 | 21.811 | 10.916 | 15.898 | |
| 12-2028 | 349.689 | 39.128 | 13.232 | 0.000 | 0.000 | 402.049 | 20.083 | 10.051 | 17.011 | |
| 12-2029 | 320.816 | 35.897 | 12.139 | 0.000 | 0.000 | 368.853 | 18.424 | 9.221 | 18.275 | |
| 12-2030 | 295.168 | 33.028 | 11.169 | 0.000 | 0.000 | 339.364 | 16.951 | 8.484 | 19.605 | |
| 12-2031 | 271.570 | 30.387 | 10.276 | 0.000 | 0.000 | 312.233 | 15.596 | 7.806 | 21.051 | |
| 12-2032 | 250.515 | 28.031 | 9.479 | 0.000 | 0.000 | 288.025 | 14.387 | 7.201 | 22.571 | |
| 12-2033 | 229.830 | 25.717 | 8.696 | 0.000 | 0.000 | 264.243 | 13.199 | 6.606 | 24.336 | |
| 12-2034 | 211.456 | 23.661 | 8.001 | 0.000 | 0.000 | 243.118 | 12.144 | 6.078 | 26.193 | |
| 12-2035 | 194.551 | 21.769 | 7.361 | 0.000 | 0.000 | 223.681 | 11.173 | 5.592 | 28.211 | |
| 12-2036 | 179.467 | 20.081 | 6.791 | 0.000 | 0.000 | 206.339 | 10.307 | 5.158 | 30.333 | |
| S Tot | 12,209.462 | 1,366.166 | 461.981 | 0.000 | 0.000 | 14,037.609 | 701.189 | 350.940 | 10.474 | |
| After | 189.145 | 21.164 | 7.157 | 0.000 | 0.000 | 217.466 | 10.863 | 5.437 | 32.945 | |
| Total | 12,398.607 | 1,387.330 | 469.138 | 0.000 | 0.000 | 14,255.075 | 712.052 | 356.377 | 10.817 | |
| (21) | (22) | (23) | (24) | (25) | (26) | (27) | (28) | (29) | (30) | (31) |
| | Operating | Wells | Workover | 3rd Party | Other | | Future Net | Cumulative | Cum.Cash Flow |
| End | Expense | Gross | Net | Expense | COPAS | Deductions | Investment | Cash Flow | Cash Flow | Disc.@ 10. % |
| Mo-Year | M$ | Count | M$ | M$ | M$ | M$ | M$ | M$ | M$ |
| 12-2018 | 100.712 | 1 | 0.8 | 0.000 | 0.000 | 258.658 | 5,372.000 | -2,727.964 | -2,727.964 | -2,709.079 | |
| 12-2019 | 151.680 | 1 | 0.8 | 0.000 | 0.000 | 173.878 | .000 | 1,693.424 | -1,034.540 | -1,233.028 | |
| 12-2020 | 151.680 | 1 | 0.8 | 0.000 | 0.000 | 109.350 | .000 | 1,008.685 | -25.855 | -435.433 | |
| 12-2021 | 151.680 | 1 | 0.8 | 0.000 | 0.000 | 81.281 | .000 | 710.832 | 684.977 | 75.077 | |
| 12-2022 | 151.680 | 1 | 0.8 | 0.000 | 0.000 | 65.509 | .000 | 543.466 | 1,228.442 | 429.768 | |
| 12-2023 | 151.680 | 1 | 0.8 | 0.000 | 0.000 | 55.217 | .000 | 434.253 | 1,662.695 | 687.361 | |
| 12-2024 | 151.680 | 1 | 0.8 | 0.000 | 0.000 | 48.048 | .000 | 358.184 | 2,020.879 | 880.473 | |
| 12-2025 | 151.680 | 1 | 0.8 | 0.000 | 0.000 | 42.452 | .000 | 298.802 | 2,319.681 | 1,026.889 | |
| 12-2026 | 151.680 | 1 | 0.8 | 0.000 | 0.000 | 38.201 | .000 | 253.687 | 2,573.369 | 1,139.892 | |
| 12-2027 | 151.680 | 1 | 0.8 | 0.000 | 0.000 | 34.786 | .000 | 217.456 | 2,790.824 | 1,227.949 | |
| 12-2028 | 151.680 | 1 | 0.8 | 0.000 | 0.000 | 32.030 | .000 | 188.205 | 2,979.030 | 1,297.232 | |
| 12-2029 | 151.680 | 1 | 0.8 | 0.000 | 0.000 | 29.385 | .000 | 160.142 | 3,139.171 | 1,350.821 | |
| 12-2030 | 151.680 | 1 | 0.8 | 0.000 | 0.000 | 27.036 | .000 | 135.212 | 3,274.383 | 1,391.960 | |
| 12-2031 | 151.680 | 1 | 0.8 | 0.000 | 0.000 | 24.875 | .000 | 112.276 | 3,386.659 | 1,423.020 | |
| 12-2032 | 151.680 | 1 | 0.8 | 0.000 | 0.000 | 22.946 | .000 | 91.811 | 3,478.471 | 1,446.115 | |
| 12-2033 | 151.680 | 1 | 0.8 | 0.000 | 0.000 | 21.051 | .000 | 71.707 | 3,550.177 | 1,462.513 | |
| 12-2034 | 151.680 | 1 | 0.8 | 0.000 | 0.000 | 19.368 | .000 | 53.848 | 3,604.025 | 1,473.711 | |
| 12-2035 | 151.680 | 1 | 0.8 | 0.000 | 0.000 | 17.820 | .000 | 37.416 | 3,641.441 | 1,480.790 | |
| 12-2036 | 151.680 | 1 | 0.8 | 0.000 | 0.000 | 16.438 | .000 | 22.755 | 3,664.197 | 1,484.710 | |
| S Tot | 2,830.952 | | | 0.000 | 0.000 | 1,118.331 | 5,372.000 | 3,664.197 | 3,664.197 | 1,484.710 | |
| After | 175.117 | | | 0.000 | 0.000 | 17.325 | .000 | 8.725 | 3,672.922 | 1,486.079 | |
| Total | 3,006.069 | | | 0.000 | 0.000 | 1,135.656 | 5,372.000 | 3,672.922 | 3,672.922 | 1,486.079 | |
| Evaluation Parameters (Gross) | | Expenses (Gross) | | Percent Interests | | Percent | Cum Disc. | |
| | Initial | Final | Units | | Dei | n | Def | | Initial | Final | Units | | | | Final | | 5.00 | 2,363.518 | |
| Oil Rate | 22,812. | 459. | bbls/mo | | 96.3% | 1.20 | 0.0% | | 15,483. | 16,000. | $/w/mo | | Expense | 79.0000 | 79.0000 | | 8.00 | 1,799.026 | |
| Gas Rate | 68,437. | 1,378. | Mcf/mo | | 0.0% | 0.00 | 0.0% | | | | | | Revenue | | | | 10.00 | 1,486.079 | |
| GOR | 3,000. | 3,000. | scf/bbl | | | | | | | | | | Oil | 59.2500 | 59.2500 | | 12.00 | 1,213.137 | |
| NGL Rate | 4,126. | 97. | bbls/mo | | | | | | | | | | Gas | 59.2500 | 59.2500 | | 15.00 | 863.994 | |
| NGL Yield | 60.3 | 70.9 | bbl/MMcf | | | | | | | | | | | | | | 20.00 | 402.767 | |
| Gas Shrinkage | 41.7 | 31.5 | % | | | | | | | | | | | | | | | | |
| Oil Severance | 4.6 | 4.6 | % | | | | | | | | | | | | | | | | |
| Gas Severance | 7.5 | 7.5 | % | | | | | | | | | | | | | | | | |
| NGL Severance | 7.5 | 7.5 | % | | | | | | | | | | | | | | | | |
| Ad Valorem | 38.4 | | % | | | | | | | | | | | | | | | | |
Start Date: 05/2018 8 Months in year ‘18 19.823 Year Life (02/2038)
| THESE DATA ARE PART OF A CG&A REPORT AND ARE SUBJECT TO THE CONDITIONS IN THE TEXT OF THE REPORT. | ASN 435 | DEFAULT | 1/10/2018 | 10:34:19 |
| TEXAS REGISTERED ENGINEERING FIRM F-693. | | | | OIL PUD | |
| | | | | Table 12 | |
Cawley, Gillespie & Associates, Inc.
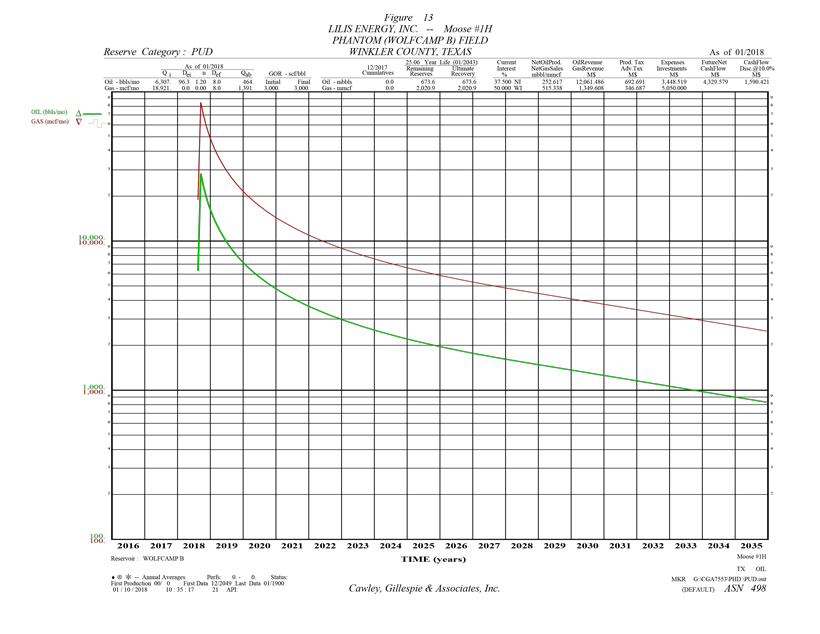
Table 13
Reserve Estimates and Economic Forecasts as of December 31, 2017
Lilis Energy, Inc. Interests
Proved Undeveloped Reserves
LILIS ENERGY, INC. -- MOOSE #1H
PHANTOM (WOLFCAMP B) FIELD -- WINKLER COUNTY, TEXAS
| (1) | (2) | (3) | (4) | (5) | (6) | (7) | (8) | (9) | (10) |
| | Gross Oil | Gross Gas | Gross NGL | Net Oil | Net Gas | Net NGL | Avg Oil | Avg Gas | Avg NGL |
| End | Production | Production | Production | Production | Sales | Production | Price | Price | Price |
| Mo-Year | MBBLS | MMCF | MBBLS | MBBLS | MMCF | MBBLS | $/BBL | $/MCF | $/BBL |
| 12-2018 | 95.0 | 285.0 | 19.7 | 35.622 | 72.669 | 7.374 | 47.746 | 2.619 | 8.728 | |
| 12-2019 | 124.5 | 373.5 | 25.8 | 46.683 | 95.234 | 9.663 | 47.746 | 2.619 | 8.728 | |
| 12-2020 | 69.8 | 209.5 | 14.5 | 26.192 | 53.432 | 5.422 | 47.746 | 2.619 | 8.728 | |
| 12-2021 | 50.0 | 149.9 | 10.3 | 18.734 | 38.217 | 3.878 | 47.746 | 2.619 | 8.728 | |
| 12-2022 | 39.5 | 118.4 | 8.2 | 14.804 | 30.200 | 3.064 | 47.746 | 2.619 | 8.728 | |
| 12-2023 | 32.9 | 98.6 | 6.8 | 12.328 | 25.150 | 2.552 | 47.746 | 2.619 | 8.728 | |
| 12-2024 | 28.4 | 85.1 | 5.9 | 10.641 | 21.707 | 2.203 | 47.746 | 2.619 | 8.728 | |
| 12-2025 | 24.9 | 74.8 | 5.2 | 9.346 | 19.066 | 1.935 | 47.746 | 2.619 | 8.728 | |
| 12-2026 | 22.3 | 67.0 | 4.6 | 8.373 | 17.081 | 1.733 | 47.746 | 2.619 | 8.728 | |
| 12-2027 | 20.3 | 60.8 | 4.2 | 7.598 | 15.500 | 1.573 | 47.746 | 2.619 | 8.728 | |
| 12-2028 | 18.6 | 55.9 | 3.9 | 6.982 | 14.243 | 1.445 | 47.746 | 2.619 | 8.728 | |
| 12-2029 | 17.1 | 51.2 | 3.5 | 6.405 | 13.065 | 1.326 | 47.746 | 2.619 | 8.728 | |
| 12-2030 | 15.7 | 47.1 | 3.3 | 5.893 | 12.021 | 1.220 | 47.746 | 2.619 | 8.728 | |
| 12-2031 | 14.5 | 43.4 | 3.0 | 5.421 | 11.060 | 1.122 | 47.746 | 2.619 | 8.728 | |
| 12-2032 | 13.3 | 40.0 | 2.8 | 5.001 | 10.202 | 1.035 | 47.746 | 2.619 | 8.728 | |
| 12-2033 | 12.2 | 36.7 | 2.5 | 4.588 | 9.360 | .950 | 47.746 | 2.619 | 8.728 | |
| 12-2034 | 11.3 | 33.8 | 2.3 | 4.221 | 8.612 | .874 | 47.746 | 2.619 | 8.728 | |
| 12-2035 | 10.4 | 31.1 | 2.1 | 3.884 | 7.923 | .804 | 47.746 | 2.619 | 8.728 | |
| 12-2036 | 9.6 | 28.7 | 2.0 | 3.583 | 7.309 | .742 | 47.746 | 2.619 | 8.728 | |
| S Tot | 630.1 | 1,890.4 | 130.4 | 236.299 | 482.050 | 48.914 | 47.746 | 2.619 | 8.728 | |
| After | 43.5 | 130.5 | 9.0 | 16.318 | 33.288 | 3.378 | 47.746 | 2.619 | 8.728 | |
| Total | 673.6 | 2,020.9 | 139.4 | 252.617 | 515.338 | 52.292 | 47.746 | 2.619 | 8.728 | |
| Cum | .0 | .0 | .0 | | | | | | | |
| Ult | 673.6 | 2,020.9 | 139.4 | | | | | | | |
| (11) | (12) | (13) | (14) | (15) | (16) | (17) | (18) | (19) | (20) |
| | Oil | Gas | NGL | Hedge | Other | Total | Production | Ad Valorem | |
| End | Revenue | Revenue | Revenue | Revenue | Revenue | Revenue | Taxes | Taxes | $/BOE6 |
| Mo-Year | M$ | M$ | M$ | M$ | M$ | M$ | M$ | M$ | |
| 12-2018 | 1,700.808 | 190.310 | 64.355 | 0.000 | 0.000 | 1,955.473 | 97.677 | 48.887 | 3.605 | |
| 12-2019 | 2,228.953 | 249.407 | 84.339 | 0.000 | 0.000 | 2,562.699 | 128.009 | 64.067 | 4.360 | |
| 12-2020 | 1,250.583 | 139.933 | 47.320 | 0.000 | 0.000 | 1,437.836 | 71.821 | 35.946 | 5.452 | |
| 12-2021 | 894.457 | 100.084 | 33.844 | 0.000 | 0.000 | 1,028.386 | 51.369 | 25.710 | 6.441 | |
| 12-2022 | 706.820 | 79.089 | 26.745 | 0.000 | 0.000 | 812.654 | 40.593 | 20.316 | 7.364 | |
| 12-2023 | 588.634 | 65.865 | 22.273 | 0.000 | 0.000 | 676.771 | 33.805 | 16.919 | 8.247 | |
| 12-2024 | 508.053 | 56.848 | 19.224 | 0.000 | 0.000 | 584.125 | 29.177 | 14.603 | 9.084 | |
| 12-2025 | 446.248 | 49.932 | 16.885 | 0.000 | 0.000 | 513.065 | 25.628 | 12.827 | 9.932 | |
| 12-2026 | 399.777 | 44.733 | 15.127 | 0.000 | 0.000 | 459.636 | 22.959 | 11.491 | 10.741 | |
| 12-2027 | 362.781 | 40.593 | 13.727 | 0.000 | 0.000 | 417.101 | 20.834 | 10.428 | 11.534 | |
| 12-2028 | 333.346 | 37.299 | 12.613 | 0.000 | 0.000 | 383.259 | 19.144 | 9.581 | 12.291 | |
| 12-2029 | 305.796 | 34.217 | 11.571 | 0.000 | 0.000 | 351.583 | 17.562 | 8.790 | 13.131 | |
| 12-2030 | 281.348 | 31.481 | 10.646 | 0.000 | 0.000 | 323.475 | 16.158 | 8.087 | 14.014 | |
| 12-2031 | 258.855 | 28.964 | 9.795 | 0.000 | 0.000 | 297.614 | 14.866 | 7.440 | 14.975 | |
| 12-2032 | 238.786 | 26.719 | 9.035 | 0.000 | 0.000 | 274.540 | 13.713 | 6.863 | 15.984 | |
| 12-2033 | 219.070 | 24.513 | 8.289 | 0.000 | 0.000 | 251.872 | 12.581 | 6.297 | 17.155 | |
| 12-2034 | 201.556 | 22.553 | 7.626 | 0.000 | 0.000 | 231.735 | 11.575 | 5.793 | 18.388 | |
| 12-2035 | 185.442 | 20.750 | 7.017 | 0.000 | 0.000 | 213.208 | 10.650 | 5.330 | 19.729 | |
| 12-2036 | 171.064 | 19.141 | 6.473 | 0.000 | 0.000 | 196.678 | 9.824 | 4.917 | 21.137 | |
| S Tot | 11,282.376 | 1,262.431 | 426.902 | 0.000 | 0.000 | 12,971.709 | 647.947 | 324.293 | 8.021 | |
| After | 779.109 | 87.178 | 29.480 | 0.000 | 0.000 | 895.767 | 44.744 | 22.394 | 27.162 | |
| Total | 12,061.486 | 1,349.608 | 456.382 | 0.000 | 0.000 | 13,867.476 | 692.691 | 346.687 | 9.258 | |
| (21) | (22) | (23) | (24) | (25) | (26) | (27) | (28) | (29) | (30) | (31) |
| | Operating | Wells | Workover | 3rd Party | Other | | Future Net | Cumulative | Cum.Cash Flow |
| End | Expense | Gross | Net | Expense | COPAS | Deductions | Investment | Cash Flow | Cash Flow | Disc.@ 10. % |
| Mo-Year | M$ | Count | M$ | M$ | M$ | M$ | M$ | M$ | M$ |
| 12-2018 | 33.548 | 1 | 0.5 | 0.000 | 0.000 | 155.786 | 5,050.000 | -3,430.426 | -3,430.426 | -3,321.964 | |
| 12-2019 | 96.000 | 1 | 0.5 | 0.000 | 0.000 | 204.162 | .000 | 2,070.461 | -1,359.965 | -1,514.742 | |
| 12-2020 | 96.000 | 1 | 0.5 | 0.000 | 0.000 | 114.548 | .000 | 1,119.521 | -240.444 | -629.246 | |
| 12-2021 | 96.000 | 1 | 0.5 | 0.000 | 0.000 | 81.928 | .000 | 773.380 | 532.936 | -73.775 | |
| 12-2022 | 96.000 | 1 | 0.5 | 0.000 | 0.000 | 64.741 | .000 | 591.003 | 1,123.939 | 311.936 | |
| 12-2023 | 96.000 | 1 | 0.5 | 0.000 | 0.000 | 53.916 | .000 | 476.130 | 1,600.069 | 594.354 | |
| 12-2024 | 96.000 | 1 | 0.5 | 0.000 | 0.000 | 46.535 | .000 | 397.809 | 1,997.878 | 808.808 | |
| 12-2025 | 96.000 | 1 | 0.5 | 0.000 | 0.000 | 40.874 | .000 | 337.737 | 2,335.615 | 974.285 | |
| 12-2026 | 96.000 | 1 | 0.5 | 0.000 | 0.000 | 36.618 | .000 | 292.568 | 2,628.183 | 1,104.593 | |
| 12-2027 | 96.000 | 1 | 0.5 | 0.000 | 0.000 | 33.229 | .000 | 256.610 | 2,884.793 | 1,208.492 | |
| 12-2028 | 96.000 | 1 | 0.5 | 0.000 | 0.000 | 30.533 | .000 | 228.000 | 3,112.793 | 1,292.407 | |
| 12-2029 | 96.000 | 1 | 0.5 | 0.000 | 0.000 | 28.009 | .000 | 201.222 | 3,314.015 | 1,359.729 | |
| 12-2030 | 96.000 | 1 | 0.5 | 0.000 | 0.000 | 25.770 | .000 | 177.460 | 3,491.475 | 1,413.708 | |
| 12-2031 | 96.000 | 1 | 0.5 | 0.000 | 0.000 | 23.710 | .000 | 155.598 | 3,647.073 | 1,456.738 | |
| 12-2032 | 96.000 | 1 | 0.5 | 0.000 | 0.000 | 21.872 | .000 | 136.091 | 3,783.164 | 1,490.954 | |
| 12-2033 | 96.000 | 1 | 0.5 | 0.000 | 0.000 | 20.066 | .000 | 116.928 | 3,900.091 | 1,517.678 | |
| 12-2034 | 96.000 | 1 | 0.5 | 0.000 | 0.000 | 18.462 | .000 | 99.905 | 3,999.996 | 1,538.438 | |
| 12-2035 | 96.000 | 1 | 0.5 | 0.000 | 0.000 | 16.986 | .000 | 84.243 | 4,084.239 | 1,554.354 | |
| 12-2036 | 96.000 | 1 | 0.5 | 0.000 | 0.000 | 15.669 | .000 | 70.268 | 4,154.507 | 1,566.425 | |
| S Tot | 1,761.548 | | | 0.000 | 0.000 | 1,033.414 | 5,050.000 | 4,154.507 | 4,154.507 | 1,566.425 | |
| After | 582.194 | | | 0.000 | 0.000 | 71.363 | .000 | 175.072 | 4,329.579 | 1,590.421 | |
| Total | 2,343.742 | | | 0.000 | 0.000 | 1,104.777 | 5,050.000 | 4,329.579 | 4,329.579 | 1,590.421 | |
| Evaluation Parameters (Gross) | | Expenses (Gross) | | Percent Interests | | Percent | Cum Disc. | |
| | Initial | Final | Units | | Dei | n | Def | | Initial | Final | Units | | | | Final | | 5.00 | 2,643.355 | |
| Oil Rate | 33,458. | 459. | bbls/mo | | 96.3% | 1.20 | 0.0% | | 3,096. | 16,000. | $/w/mo | | Expense | 50.0000 | 50.0000 | | 8.00 | 1,958.920 | |
| Gas Rate | 100,375. | 1,378. | Mcf/mo | | 0.0% | 0.00 | 0.0% | | | | | | Revenue | | | | 10.00 | 1,590.421 | |
| GOR | 3,000. | 3,000. | scf/bbl | | | | | | | | | | Oil | 37.5000 | 37.5000 | | 12.00 | 1,275.334 | |
| NGL Rate | 1,329. | 97. | bbls/mo | | | | | | | | | | Gas | 37.5000 | 37.5000 | | 15.00 | 880.759 | |
| NGL Yield | 13.2 | 70.9 | bbl/MMcf | | | | | | | | | | | | | | 20.00 | 373.988 | |
| Gas Shrinkage | 87.2 | 31.5 | % | | | | | | | | | | | | | | | | |
| Oil Severance | 4.6 | 4.6 | % | | | | | | | | | | | | | | | | |
| Gas Severance | 7.5 | 7.5 | % | | | | | | | | | | | | | | | | |
| NGL Severance | 7.5 | 7.5 | % | | | | | | | | | | | | | | | | |
| Ad Valorem | _24.3 | | % | | | | | | | | | | | | | | | | |
Start Date: 08/2018 5 Months in year ‘18 24.482 Year Life (01/2043)
| THESE DATA ARE PART OF A CG&A REPORT AND ARE SUBJECT TO THE CONDITIONS IN THE TEXT OF THE REPORT. | ASN 498 | DEFAULT | 1/10/2018 | 10:34:19 |
| TEXAS REGISTERED ENGINEERING FIRM F-693. | | | | OIL PUD | |
| | | | | Table 13 | |
Cawley, Gillespie & Associates, Inc.
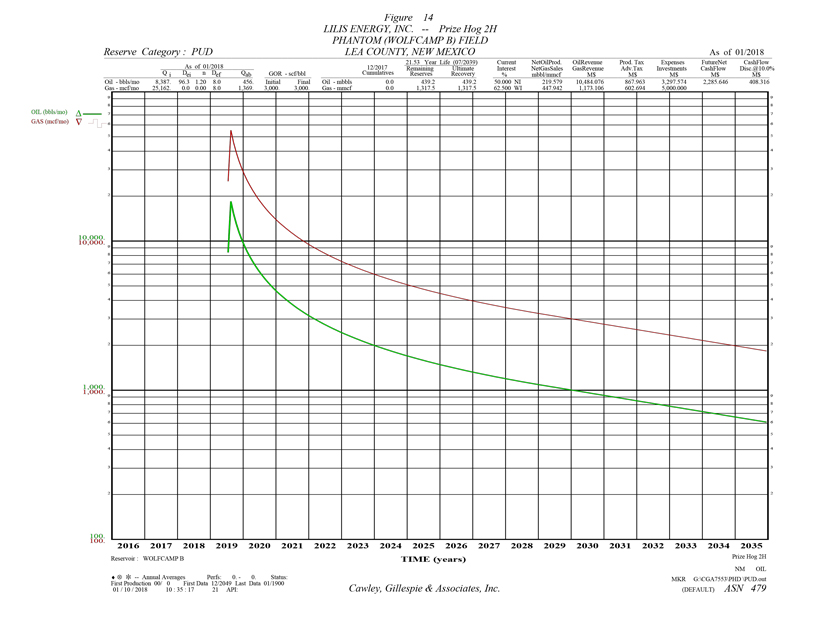
Table 14
Reserve Estimates and Economic Forecasts as of December 31, 2017
Lilis Energy, Inc. Interests
Proved Undeveloped Reserves
LILIS ENERGY, INC. -- PRIZE HOG 2H
PHANTOM (WOLFCAMP B) FIELD -- LEA COUNTY, NEW MEXICO
| (1) | (2) | (3) | (4) | (5) | (6) | (7) | (8) | (9) | (10) |
| | Gross Oil | Gross Gas | Gross NGL | Net Oil | Net Gas | Net NGL | Avg Oil | Avg Gas | Avg NGL |
| End | Production | Production | Production | Production | Sales | Production | Price | Price | Price |
| Mo-Year | MBBLS | MMCF | MBBLS | MBBLS | MMCF | MBBLS | $/BBL | $/MCF | $/BBL |
| 12-2018 | .0 | .0 | .0 | .000 | .000 | .000 | .000 | .000 | .000 | |
| 12-2019 | 77.3 | 232.0 | 16.0 | 38.673 | 78.893 | 8.005 | 47.746 | 2.619 | 8.728 | |
| 12-2020 | 78.3 | 234.8 | 16.2 | 39.126 | 79.817 | 8.099 | 47.746 | 2.619 | 8.728 | |
| 12-2021 | 45.6 | 136.7 | 9.4 | 22.789 | 46.489 | 4.717 | 47.746 | 2.619 | 8.728 | |
| 12-2022 | 33.1 | 99.4 | 6.9 | 16.574 | 33.811 | 3.431 | 47.746 | 2.619 | 8.728 | |
| 12-2023 | 26.4 | 79.1 | 5.5 | 13.185 | 26.897 | 2.729 | 47.746 | 2.619 | 8.728 | |
| 12-2024 | 22.1 | 66.3 | 4.6 | 11.052 | 22.547 | 2.288 | 47.746 | 2.619 | 8.728 | |
| 12-2025 | 19.0 | 57.1 | 3.9 | 9.513 | 19.407 | 1.969 | 47.746 | 2.619 | 8.728 | |
| 12-2026 | 16.8 | 50.4 | 3.5 | 8.397 | 17.129 | 1.738 | 47.746 | 2.619 | 8.728 | |
| 12-2027 | 15.1 | 45.2 | 3.1 | 7.533 | 15.368 | 1.559 | 47.746 | 2.619 | 8.728 | |
| 12-2028 | 13.7 | 41.2 | 2.8 | 6.862 | 13.998 | 1.420 | 47.746 | 2.619 | 8.728 | |
| 12-2029 | 12.6 | 37.7 | 2.6 | 6.275 | 12.802 | 1.299 | 47.746 | 2.619 | 8.728 | |
| 12-2030 | 11.5 | 34.6 | 2.4 | 5.773 | 11.778 | 1.195 | 47.746 | 2.619 | 8.728 | |
| 12-2031 | 10.6 | 31.9 | 2.2 | 5.312 | 10.836 | 1.100 | 47.746 | 2.619 | 8.728 | |
| 12-2032 | 9.8 | 29.4 | 2.0 | 4.900 | 9.996 | 1.014 | 47.746 | 2.619 | 8.728 | |
| 12-2033 | 9.0 | 27.0 | 1.9 | 4.495 | 9.171 | .931 | 47.746 | 2.619 | 8.728 | |
| 12-2034 | 8.3 | 24.8 | 1.7 | 4.136 | 8.437 | .856 | 47.746 | 2.619 | 8.728 | |
| 12-2035 | 7.6 | 22.8 | 1.6 | 3.805 | 7.763 | .788 | 47.746 | 2.619 | 8.728 | |
| 12-2036 | 7.0 | 21.1 | 1.5 | 3.510 | 7.161 | .727 | 47.746 | 2.619 | 8.728 | |
| S Tot | 423.8 | 1,271.5 | 87.7 | 211.911 | 432.299 | 43.866 | 47.746 | 2.619 | 8.728 | |
| After | 15.3 | 46.0 | 3.2 | 7.668 | 15.643 | 1.587 | 47.746 | 2.619 | 8.728 | |
| Total | 439.2 | 1,317.5 | 90.9 | 219.579 | 447.942 | 45.453 | 47.746 | 2.619 | 8.728 | |
| Cum | .0 | .0 | .0 | | | | | | | |
| Ult | 439.2 | 1,317.5 | 90.9 | | | | | | | |
| (11) | (12) | (13) | (14) | (15) | (16) | (17) | (18) | (19) | (20) |
| | Oil | Gas | NGL | Hedge | Other | Total | Production | Ad Valorem | |
| End | Revenue | Revenue | Revenue | Revenue | Revenue | Revenue | Taxes | Taxes | $/BOE6 |
| Mo-Year | M$ | M$ | M$ | M$ | M$ | M$ | M$ | M$ | |
| 12-2018 | .000 | .000 | .000 | 0.000 | 0.000 | .000 | .000 | .000 | .000 | |
| 12-2019 | 1,846.498 | 206.612 | 69.868 | 0.000 | 0.000 | 2,122.978 | 152.869 | 106.149 | 3.725 | |
| 12-2020 | 1,868.114 | 209.031 | 70.686 | 0.000 | 0.000 | 2,147.831 | 154.659 | 107.392 | 4.860 | |
| 12-2021 | 1,088.066 | 121.748 | 41.170 | 0.000 | 0.000 | 1,250.985 | 90.080 | 62.549 | 6.352 | |
| 12-2022 | 791.340 | 88.546 | 29.943 | 0.000 | 0.000 | 909.829 | 65.514 | 45.491 | 7.691 | |
| 12-2023 | 629.523 | 70.440 | 23.820 | 0.000 | 0.000 | 723.783 | 52.117 | 36.189 | 8.953 | |
| 12-2024 | 527.710 | 59.048 | 19.967 | 0.000 | 0.000 | 606.725 | 43.688 | 30.336 | 10.144 | |
| 12-2025 | 454.216 | 50.824 | 17.187 | 0.000 | 0.000 | 522.227 | 37.604 | 26.111 | 11.335 | |
| 12-2026 | 400.907 | 44.859 | 15.170 | 0.000 | 0.000 | 460.936 | 33.191 | 23.047 | 12.473 | |
| 12-2027 | 359.682 | 40.246 | 13.610 | 0.000 | 0.000 | 413.537 | 29.778 | 20.677 | 13.583 | |
| 12-2028 | 327.624 | 36.659 | 12.397 | 0.000 | 0.000 | 376.679 | 27.124 | 18.834 | 14.641 | |
| 12-2029 | 299.622 | 33.526 | 11.337 | 0.000 | 0.000 | 344.484 | 24.805 | 17.224 | 15.749 | |
| 12-2030 | 275.658 | 30.844 | 10.430 | 0.000 | 0.000 | 316.933 | 22.821 | 15.847 | 16.876 | |
| 12-2031 | 253.620 | 28.379 | 9.596 | 0.000 | 0.000 | 291.595 | 20.997 | 14.580 | 18.101 | |
| 12-2032 | 233.956 | 26.178 | 8.852 | 0.000 | 0.000 | 268.987 | 19.369 | 13.449 | 19.389 | |
| 12-2033 | 214.639 | 24.017 | 8.122 | 0.000 | 0.000 | 246.778 | 17.770 | 12.339 | 20.884 | |
| 12-2034 | 197.479 | 22.097 | 7.472 | 0.000 | 0.000 | 227.048 | 16.349 | 11.352 | 22.457 | |
| 12-2035 | 181.691 | 20.330 | 6.875 | 0.000 | 0.000 | 208.896 | 15.042 | 10.445 | 24.166 | |
| 12-2036 | 167.605 | 18.754 | 6.342 | 0.000 | 0.000 | 192.700 | 13.876 | 9.635 | 25.964 | |
| S Tot | 10,117.950 | 1,132.138 | 382.843 | 0.000 | 0.000 | 11,632.931 | 837.652 | 581.647 | 9.481 | |
| After | 366.125 | 40.967 | 13.853 | 0.000 | 0.000 | 420.946 | 30.311 | 21.047 | 29.616 | |
| Total | 10,484.076 | 1,173.106 | 396.696 | 0.000 | 0.000 | 12,053.877 | 867.963 | 602.694 | 10.185 | |
| (21) | (22) | (23) | (24) | (25) | (26) | (27) | (28) | (29) | (30) | (31) |
| | Operating | Wells | Workover | 3rd Party | Other | | Future Net | Cumulative | Cum.Cash Flow |
| End | Expense | Gross | Net | Expense | COPAS | Deductions | Investment | Cash Flow | Cash Flow | Disc.@ 10. % |
| Mo-Year | M$ | Count | M$ | M$ | M$ | M$ | M$ | M$ | M$ |
| 12-2018 | .000 | 0 | 0.0 | 0.000 | 0.000 | 0.000 | .000 | .000 | .000 | .000 | |
| 12-2019 | 53.871 | 1 | 0.6 | 0.000 | 0.000 | 158.560 | 5,000.000 | -3,348.471 | -3,348.471 | -2,983.690 | |
| 12-2020 | 120.000 | 1 | 0.6 | 0.000 | 0.000 | 160.416 | .000 | 1,605.364 | -1,743.107 | -1,710.459 | |
| 12-2021 | 120.000 | 1 | 0.6 | 0.000 | 0.000 | 93.433 | .000 | 884.923 | -858.184 | -1,074.219 | |
| 12-2022 | 120.000 | 1 | 0.6 | 0.000 | 0.000 | 67.953 | .000 | 610.871 | -247.313 | -675.306 | |
| 12-2023 | 120.000 | 1 | 0.6 | 0.000 | 0.000 | 54.058 | .000 | 461.418 | 214.105 | -401.501 | |
| 12-2024 | 120.000 | 1 | 0.6 | 0.000 | 0.000 | 45.315 | .000 | 367.385 | 581.490 | -203.383 | |
| 12-2025 | 120.000 | 1 | 0.6 | 0.000 | 0.000 | 39.004 | .000 | 299.508 | 880.998 | -56.596 | |
| 12-2026 | 120.000 | 1 | 0.6 | 0.000 | 0.000 | 34.426 | .000 | 250.272 | 1,131.270 | 54.900 | |
| 12-2027 | 120.000 | 1 | 0.6 | 0.000 | 0.000 | 30.886 | .000 | 212.197 | 1,343.467 | 140.836 | |
| 12-2028 | 120.000 | 1 | 0.6 | 0.000 | 0.000 | 28.133 | .000 | 182.589 | 1,526.056 | 208.052 | |
| 12-2029 | 120.000 | 1 | 0.6 | 0.000 | 0.000 | 25.729 | .000 | 156.726 | 1,682.782 | 260.494 | |
| 12-2030 | 120.000 | 1 | 0.6 | 0.000 | 0.000 | 23.671 | .000 | 134.594 | 1,817.376 | 301.440 | |
| 12-2031 | 120.000 | 1 | 0.6 | 0.000 | 0.000 | 21.779 | .000 | 114.240 | 1,931.615 | 333.039 | |
| 12-2032 | 120.000 | 1 | 0.6 | 0.000 | 0.000 | 20.090 | .000 | 96.079 | 2,027.694 | 357.203 | |
| 12-2033 | 120.000 | 1 | 0.6 | 0.000 | 0.000 | 18.431 | .000 | 78.238 | 2,105.932 | 375.089 | |
| 12-2034 | 120.000 | 1 | 0.6 | 0.000 | 0.000 | 16.958 | .000 | 62.389 | 2,168.321 | 388.059 | |
| 12-2035 | 120.000 | 1 | 0.6 | 0.000 | 0.000 | 15.602 | .000 | 47.808 | 2,216.128 | 397.097 | |
| 12-2036 | 120.000 | 1 | 0.6 | 0.000 | 0.000 | 14.392 | .000 | 34.797 | 2,250.926 | 403.082 | |
| S Tot | 2,093.871 | | | 0.000 | 0.000 | 868.836 | 5,000.000 | 2,250.926 | 2,250.926 | 403.082 | |
| After | 303.428 | | | 0.000 | 0.000 | 31.439 | .000 | 34.721 | 2,285.646 | 408.316 | |
| Total | 2,397.299 | | | 0.000 | 0.000 | 900.275 | 5,000.000 | 2,285.646 | 2,285.646 | 408.316 | |
| Evaluation Parameters (Gross) | | Expenses (Gross) | | Percent Interests | | Percent | Cum Disc. | |
| | Initial | Final | Units | | Dei | n | Def | | Initial | Final | Units | | | | Final | | 5.00 | 1,126.125 | |
| Oil Rate | 22,812. | 453. | bbls/mo | | 96.3% | 1.20 | 0.0% | | 6,192. | 15,769. | $/w/mo | | Expense | 62.5000 | 62.5000 | | 8.00 | 657.414 | |
| Gas Rate | 68,437. | 1,359. | Mcf/mo | | 0.0% | 0.00 | 0.0% | | | | | | Revenue | | | | 10.00 | 408.316 | |
| GOR | 3,000. | 3,000. | scf/bbl | | | | | | | | | | Oil | 50.0000 | 50.0000 | | 12.00 | 198.529 | |
| NGL Rate | 1,768. | 93. | bbls/mo | | | | | | | | | | Gas | 50.0000 | 50.0000 | | 15.00 | -57.924 | |
| NGL Yield | 25.8 | 68.5 | bbl/MMcf | | | | | | | | | | | | | | 20.00 | -371.562 | |
| Gas Shrinkage | 75.0 | 31.8 | % | | | | | | | | | | | | | | | | |
| Oil Severance | 7.1 | 7.1 | % | | | | | | | | | | | | | | | | |
| Gas Severance | 7.9 | 7.9 | % | | | | | | | | | | | | | | | | |
| NGL Severance | 7.9 | 7.9 | % | | | | | | | | | | | | | | | | |
| Ad Valorem | 61.7 | | % | | | | | | | | | | | | | | | | |
Start Date: 07/2019 6 Months in year ‘19 20.033 Year Life (07/2039)
| THESE DATA ARE PART OF A CG&A REPORT AND ARE SUBJECT TO THE CONDITIONS IN THE TEXT OF THE REPORT. | ASN 479 | DEFAULT | 1/10/2018 | 10:34:19 |
| TEXAS REGISTERED ENGINEERING FIRM F-693. | | | | OIL PUD | |
| | | | | Table 14 | |
Cawley, Gillespie & Associates, Inc.
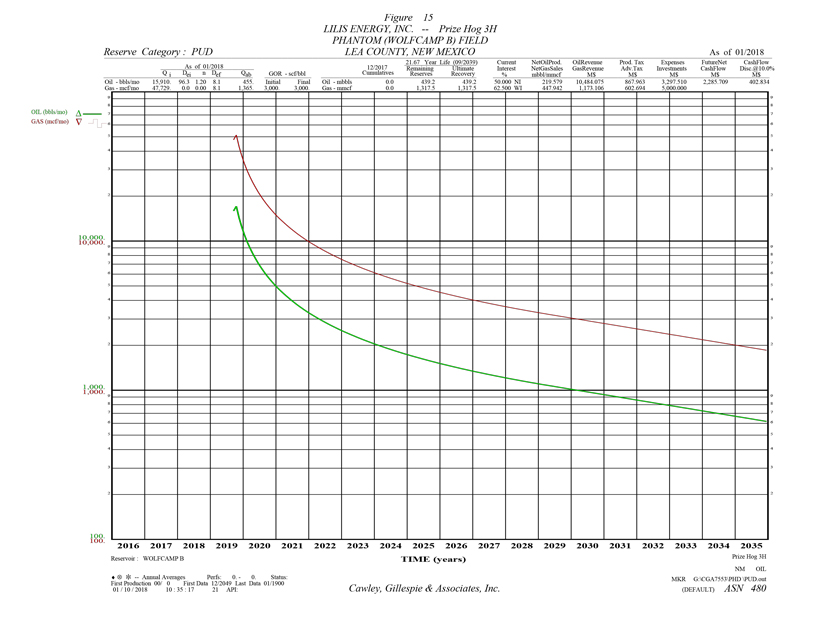
Table 15
Reserve Estimates and Economic Forecasts as of December 31, 2017
Lilis Energy, Inc. Interests
Proved Undeveloped Reserves
LILIS ENERGY, INC. -- PRIZE HOG 3H
PHANTOM (WOLFCAMP B) FIELD -- LEA COUNTY, NEW MEXICO
| (1) | (2) | (3) | (4) | (5) | (6) | (7) | (8) | (9) | (10) |
| | Gross Oil | Gross Gas | Gross NGL | Net Oil | Net Gas | Net NGL | Avg Oil | Avg Gas | Avg NGL |
| End | Production | Production | Production | Production | Sales | Production | Price | Price | Price |
| Mo-Year | MBBLS | MMCF | MBBLS | MBBLS | MMCF | MBBLS | $/BBL | $/MCF | $/BBL |
| 12-2018 | .0 | .0 | .0 | .000 | .000 | .000 | .000 | .000 | .000 | |
| 12-2019 | 59.9 | 179.8 | 12.4 | 29.963 | 61.125 | 6.202 | 47.746 | 2.619 | 8.728 | |
| 12-2020 | 87.8 | 263.3 | 18.2 | 43.886 | 89.528 | 9.084 | 47.746 | 2.619 | 8.728 | |
| 12-2021 | 48.2 | 144.5 | 10.0 | 24.083 | 49.129 | 4.985 | 47.746 | 2.619 | 8.728 | |
| 12-2022 | 34.4 | 103.2 | 7.1 | 17.198 | 35.083 | 3.560 | 47.746 | 2.619 | 8.728 | |
| 12-2023 | 27.1 | 81.3 | 5.6 | 13.557 | 27.656 | 2.806 | 47.746 | 2.619 | 8.728 | |
| 12-2024 | 22.6 | 67.8 | 4.7 | 11.302 | 23.056 | 2.340 | 47.746 | 2.619 | 8.728 | |
| 12-2025 | 19.4 | 58.2 | 4.0 | 9.692 | 19.772 | 2.006 | 47.746 | 2.619 | 8.728 | |
| 12-2026 | 17.1 | 51.2 | 3.5 | 8.532 | 17.406 | 1.766 | 47.746 | 2.619 | 8.728 | |
| 12-2027 | 15.3 | 45.8 | 3.2 | 7.640 | 15.585 | 1.581 | 47.746 | 2.619 | 8.728 | |
| 12-2028 | 13.9 | 41.7 | 2.9 | 6.948 | 14.174 | 1.438 | 47.746 | 2.619 | 8.728 | |
| 12-2029 | 12.7 | 38.1 | 2.6 | 6.348 | 12.950 | 1.314 | 47.746 | 2.619 | 8.728 | |
| 12-2030 | 11.7 | 35.0 | 2.4 | 5.840 | 11.913 | 1.209 | 47.746 | 2.619 | 8.728 | |
| 12-2031 | 10.7 | 32.2 | 2.2 | 5.373 | 10.961 | 1.112 | 47.746 | 2.619 | 8.728 | |
| 12-2032 | 9.9 | 29.7 | 2.1 | 4.956 | 10.111 | 1.026 | 47.746 | 2.619 | 8.728 | |
| 12-2033 | 9.1 | 27.3 | 1.9 | 4.547 | 9.276 | .941 | 47.746 | 2.619 | 8.728 | |
| 12-2034 | 8.4 | 25.1 | 1.7 | 4.184 | 8.534 | .866 | 47.746 | 2.619 | 8.728 | |
| 12-2035 | 7.7 | 23.1 | 1.6 | 3.849 | 7.852 | .797 | 47.746 | 2.619 | 8.728 | |
| 12-2036 | 7.1 | 21.3 | 1.5 | 3.551 | 7.243 | .735 | 47.746 | 2.619 | 8.728 | |
| S Tot | 422.9 | 1,268.7 | 87.5 | 211.449 | 431.355 | 43.770 | 47.746 | 2.619 | 8.728 | |
| After | 16.3 | 48.8 | 3.4 | 8.131 | 16.586 | 1.683 | 47.746 | 2.619 | 8.728 | |
| Total | 439.2 | 1,317.5 | 90.9 | 219.579 | 447.942 | 45.453 | 47.746 | 2.619 | 8.728 | |
| Cum | .0 | .0 | .0 | | | | | | | |
| Ult | 439.2 | 1,317.5 | 90.9 | | | | | | | |
| (11) | (12) | (13) | (14) | (15) | (16) | (17) | (18) | (19) | (20) |
| | Oil | Gas | NGL | Hedge | Other | Total | Production | Ad Valorem | |
| End | Revenue | Revenue | Revenue | Revenue | Revenue | Revenue | Taxes | Taxes | $/BOE6 |
| Mo-Year | M$ | M$ | M$ | M$ | M$ | M$ | M$ | M$ | |
| 12-2018 | .000 | .000 | .000 | 0.000 | 0.000 | .000 | .000 | .000 | .000 | |
| 12-2019 | 1,430.640 | 160.080 | 54.132 | 0.000 | 0.000 | 1,644.853 | 118.441 | 82.243 | 3.633 | |
| 12-2020 | 2,095.398 | 234.463 | 79.286 | 0.000 | 0.000 | 2,409.146 | 173.475 | 120.457 | 4.635 | |
| 12-2021 | 1,149.875 | 128.664 | 43.509 | 0.000 | 0.000 | 1,322.049 | 95.197 | 66.102 | 6.160 | |
| 12-2022 | 821.124 | 91.879 | 31.070 | 0.000 | 0.000 | 944.073 | 67.980 | 47.204 | 7.513 | |
| 12-2023 | 647.289 | 72.428 | 24.492 | 0.000 | 0.000 | 744.209 | 53.588 | 37.210 | 8.783 | |
| 12-2024 | 539.630 | 60.381 | 20.419 | 0.000 | 0.000 | 620.430 | 44.675 | 31.022 | 9.981 | |
| 12-2025 | 462.772 | 51.781 | 17.510 | 0.000 | 0.000 | 532.064 | 38.312 | 26.603 | 11.177 | |
| 12-2026 | 407.387 | 45.584 | 15.415 | 0.000 | 0.000 | 468.385 | 33.727 | 23.419 | 12.318 | |
| 12-2027 | 364.772 | 40.816 | 13.802 | 0.000 | 0.000 | 419.390 | 30.199 | 20.970 | 13.433 | |
| 12-2028 | 331.747 | 37.121 | 12.553 | 0.000 | 0.000 | 381.420 | 27.465 | 19.071 | 14.493 | |
| 12-2029 | 303.084 | 33.913 | 11.468 | 0.000 | 0.000 | 348.466 | 25.092 | 17.423 | 15.601 | |
| 12-2030 | 278.822 | 31.199 | 10.550 | 0.000 | 0.000 | 320.571 | 23.083 | 16.029 | 16.716 | |
| 12-2031 | 256.531 | 28.704 | 9.707 | 0.000 | 0.000 | 294.942 | 21.238 | 14.747 | 17.927 | |
| 12-2032 | 236.642 | 26.479 | 8.954 | 0.000 | 0.000 | 272.075 | 19.591 | 13.604 | 19.200 | |
| 12-2033 | 217.103 | 24.293 | 8.215 | 0.000 | 0.000 | 249.610 | 17.974 | 12.481 | 20.678 | |
| 12-2034 | 199.746 | 22.350 | 7.558 | 0.000 | 0.000 | 229.655 | 16.537 | 11.483 | 22.233 | |
| 12-2035 | 183.777 | 20.564 | 6.954 | 0.000 | 0.000 | 211.294 | 15.215 | 10.565 | 23.924 | |
| 12-2036 | 169.529 | 18.969 | 6.415 | 0.000 | 0.000 | 194.913 | 14.035 | 9.746 | 25.701 | |
| S Tot | 10,095.871 | 1,129.668 | 382.007 | 0.000 | 0.000 | 11,607.545 | 835.824 | 580.377 | 9.444 | |
| After | 388.205 | 43.438 | 14.689 | 0.000 | 0.000 | 446.332 | 32.139 | 22.317 | 29.436 | |
| Total | 10,484.075 | 1,173.106 | 396.696 | 0.000 | 0.000 | 12,053.877 | 867.963 | 602.694 | 10.184 | |
| (21) | (22) | (23) | (24) | (25) | (26) | (27) | (28) | (29) | (30) | (31) |
| | Operating | Wells | Workover | 3rd Party | Other | | Future Net | Cumulative | Cum.Cash Flow |
| End | Expense | Gross | Net | Expense | COPAS | Deductions | Investment | Cash Flow | Cash Flow | Disc.@ 10. % |
| Mo-Year | M$ | Count | M$ | M$ | M$ | M$ | M$ | M$ | M$ |
| 12-2018 | .000 | 0 | 0.0 | 0.000 | 0.000 | 0.000 | .000 | .000 | .000 | .000 | |
| 12-2019 | 37.667 | 1 | 0.6 | 0.000 | 0.000 | 122.850 | 5,000.000 | -3,716.348 | -3,716.348 | -3,247.162 | |
| 12-2020 | 120.000 | 1 | 0.6 | 0.000 | 0.000 | 179.933 | .000 | 1,815.280 | -1,901.067 | -1,806.240 | |
| 12-2021 | 120.000 | 1 | 0.6 | 0.000 | 0.000 | 98.741 | .000 | 942.009 | -959.059 | -1,128.816 | |
| 12-2022 | 120.000 | 1 | 0.6 | 0.000 | 0.000 | 70.511 | .000 | 638.379 | -320.680 | -711.899 | |
| 12-2023 | 120.000 | 1 | 0.6 | 0.000 | 0.000 | 55.583 | .000 | 477.827 | 157.147 | -428.343 | |
| 12-2024 | 120.000 | 1 | 0.6 | 0.000 | 0.000 | 46.338 | .000 | 378.395 | 535.542 | -224.280 | |
| 12-2025 | 120.000 | 1 | 0.6 | 0.000 | 0.000 | 39.739 | .000 | 307.410 | 842.952 | -73.617 | |
| 12-2026 | 120.000 | 1 | 0.6 | 0.000 | 0.000 | 34.983 | .000 | 256.257 | 1,099.209 | 40.547 | |
| 12-2027 | 120.000 | 1 | 0.6 | 0.000 | 0.000 | 31.323 | .000 | 216.898 | 1,316.107 | 128.388 | |
| 12-2028 | 120.000 | 1 | 0.6 | 0.000 | 0.000 | 28.487 | .000 | 186.397 | 1,502.504 | 197.007 | |
| 12-2029 | 120.000 | 1 | 0.6 | 0.000 | 0.000 | 26.026 | .000 | 159.925 | 1,662.429 | 250.519 | |
| 12-2030 | 120.000 | 1 | 0.6 | 0.000 | 0.000 | 23.943 | .000 | 137.516 | 1,799.945 | 292.354 | |
| 12-2031 | 120.000 | 1 | 0.6 | 0.000 | 0.000 | 22.029 | .000 | 116.929 | 1,916.874 | 324.697 | |
| 12-2032 | 120.000 | 1 | 0.6 | 0.000 | 0.000 | 20.321 | .000 | 98.559 | 2,015.433 | 349.484 | |
| 12-2033 | 120.000 | 1 | 0.6 | 0.000 | 0.000 | 18.643 | .000 | 80.513 | 2,095.946 | 367.890 | |
| 12-2034 | 120.000 | 1 | 0.6 | 0.000 | 0.000 | 17.152 | .000 | 64.483 | 2,160.429 | 381.295 | |
| 12-2035 | 120.000 | 1 | 0.6 | 0.000 | 0.000 | 15.781 | .000 | 49.734 | 2,210.163 | 390.697 | |
| 12-2036 | 120.000 | 1 | 0.6 | 0.000 | 0.000 | 14.558 | .000 | 36.574 | 2,246.738 | 396.986 | |
| S Tot | 2,077.667 | | | 0.000 | 0.000 | 866.940 | 5,000.000 | 2,246.738 | 2,246.738 | 396.986 | |
| After | 319.569 | | | 0.000 | 0.000 | 33.335 | .000 | 38.972 | 2,285.709 | 402.834 | |
| Total | 2,397.235 | | | 0.000 | 0.000 | 900.275 | 5,000.000 | 2,285.709 | 2,285.709 | 402.834 | |
| Evaluation Parameters (Gross) | | Expenses (Gross) | | Percent Interests | | Percent | Cum. Disc. | |
| | Initial | Final | Units | | Dei | n | Def | | Initial | Final | Units | | | | Final | | 5.00 | 1,118.504 | |
| Oil Rate | 22,812. | 453. | bbls/mo | | 96.3% | 1.20 | 0.0% | | 12,265. | 16,000. | $/w/mo | | Expense | 62.5000 | 62.5000 | | 8.00 | 650.354 | |
| Gas Rate | 68,437. | 1,359. | Mcf/mo | | 0.0% | 0.00 | 0.0% | | | | | | Revenue | | | | 10.00 | 402.834 | |
| GOR | 3,000. | 3,000. | scf/bbl | | | | | | | | | | Oil | 50.0000 | 50.0000 | | 12.00 | 195.272 | |
| NGL Rate | 3,245. | 95. | bbls/mo | | | | | | | | | | Gas | 50.0000 | 50.0000 | | 15.00 | -57.039 | |
| NGL Yield | 47.4 | 70.6 | bbl/MMcf | | | | | | | | | | | | | | 20.00 | -362.622 | |
| Gas Shrinkage | 52.6 | 31.9 | % | | | | | | | | | | | | | | | | |
| Oil Severance | 7.1 | 7.1 | % | | | | | | | | | | | | | | | | |
| Gas Severance | 7.9 | 7.9 | % | | | | | | | | | | | | | | | | |
| NGL Severance | 7.9 | 7.9 | % | | | | | | | | | | | | | | | | |
| Ad Valorem | 63.6 | | % | | | | | | | | | | | | | | | | |
Start Date: 09/2019 4 Months in year ‘19 20.003 Year Life (09/2039)
| THESE DATA ARE PART OF A CG&A REPORT AND ARE SUBJECT TO THE CONDITIONS IN THE TEXT OF THE REPORT. | ASN 480 | DEFAULT | 1/10/2018 | 10:34:19 |
| TEXAS REGISTERED ENGINEERING FIRM F-693. | | | | OIL PUD | |
| | | | | Table 15 | |
Cawley, Gillespie & Associates, Inc.
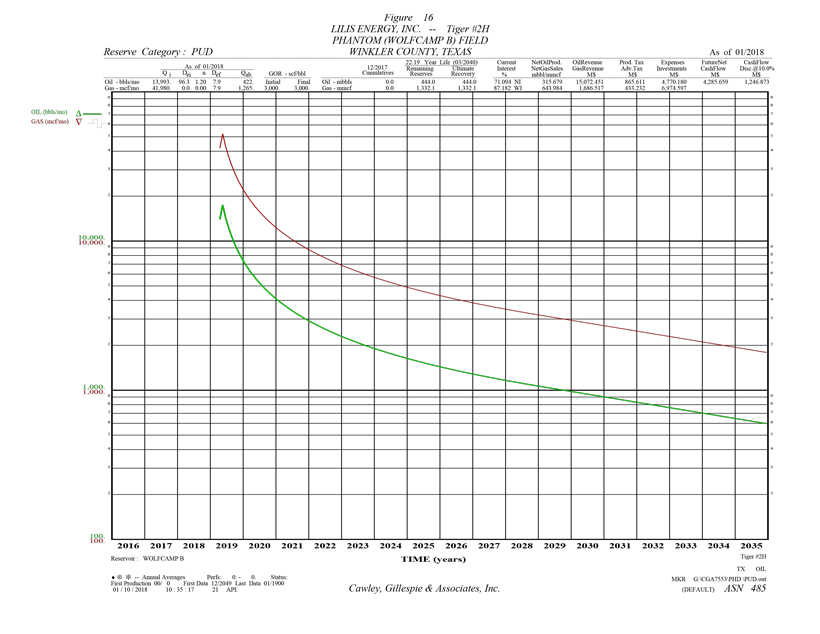
Table 16
Reserve Estimates and Economic Forecasts as of December 31, 2017
Lilis Energy, Inc. Interests
Proved Undeveloped Reserves
LILIS ENERGY, INC. -- TIGER #2H
PHANTOM (WOLFCAMP B) FIELD -- WINKLER COUNTY, TEXAS
| (1) | (2) | (3) | (4) | (5) | (6) | (7) | (8) | (9) | (10) |
| | Gross Oil | Gross Gas | Gross NGL | Net Oil | Net Gas | Net NGL | Avg Oil | Avg Gas | Avg NGL |
| End | Production | Production | Production | Production | Sales | Production | Price | Price | Price |
| Mo-Year | MBBLS | MMCF | MBBLS | MBBLS | MMCF | MBBLS | $/BBL | $/MCF | $/BBL |
| 12-2018 | .0 | .0 | .0 | .000 | .000 | .000 | .000 | .000 | .000 | |
| 12-2019 | 105.0 | 315.1 | 21.7 | 74.682 | 152.351 | 15.459 | 47.746 | 2.619 | 8.728 | |
| 12-2020 | 64.9 | 194.6 | 13.4 | 46.128 | 94.100 | 9.548 | 47.746 | 2.619 | 8.728 | |
| 12-2021 | 41.2 | 123.7 | 8.5 | 29.310 | 59.792 | 6.067 | 47.746 | 2.619 | 8.728 | |
| 12-2022 | 30.9 | 92.8 | 6.4 | 21.989 | 44.858 | 4.552 | 47.746 | 2.619 | 8.728 | |
| 12-2023 | 25.0 | 75.0 | 5.2 | 17.779 | 36.270 | 3.680 | 47.746 | 2.619 | 8.728 | |
| 12-2024 | 21.2 | 63.5 | 4.4 | 15.055 | 30.711 | 3.116 | 47.746 | 2.619 | 8.728 | |
| 12-2025 | 18.4 | 55.1 | 3.8 | 13.047 | 26.615 | 2.701 | 47.746 | 2.619 | 8.728 | |
| 12-2026 | 16.3 | 48.8 | 3.4 | 11.573 | 23.608 | 2.396 | 47.746 | 2.619 | 8.728 | |
| 12-2027 | 14.7 | 44.0 | 3.0 | 10.422 | 21.260 | 2.157 | 47.746 | 2.619 | 8.728 | |
| 12-2028 | 13.4 | 40.2 | 2.8 | 9.521 | 19.422 | 1.971 | 47.746 | 2.619 | 8.728 | |
| 12-2029 | 12.3 | 36.8 | 2.5 | 8.721 | 17.791 | 1.805 | 47.746 | 2.619 | 8.728 | |
| 12-2030 | 11.3 | 33.9 | 2.3 | 8.024 | 16.369 | 1.661 | 47.746 | 2.619 | 8.728 | |
| 12-2031 | 10.4 | 31.2 | 2.1 | 7.382 | 15.060 | 1.528 | 47.746 | 2.619 | 8.728 | |
| 12-2032 | 9.6 | 28.7 | 2.0 | 6.810 | 13.892 | 1.410 | 47.746 | 2.619 | 8.728 | |
| 12-2033 | 8.8 | 26.4 | 1.8 | 6.248 | 12.745 | 1.293 | 47.746 | 2.619 | 8.728 | |
| 12-2034 | 8.1 | 24.3 | 1.7 | 5.748 | 11.726 | 1.190 | 47.746 | 2.619 | 8.728 | |
| 12-2035 | 7.4 | 22.3 | 1.5 | 5.289 | 10.789 | 1.095 | 47.746 | 2.619 | 8.728 | |
| 12-2036 | 6.9 | 20.6 | 1.4 | 4.879 | 9.952 | 1.010 | 47.746 | 2.619 | 8.728 | |
| S Tot | 425.6 | 1,276.9 | 88.1 | 302.605 | 617.314 | 62.639 | 47.746 | 2.619 | 8.728 | |
| After | 18.4 | 55.2 | 3.8 | 13.074 | 26.670 | 2.706 | 47.746 | 2.619 | 8.728 | |
| Total | 444.0 | 1,332.1 | 91.9 | 315.679 | 643.984 | 65.345 | 47.746 | 2.619 | 8.728 | |
| Cum | .0 | .0 | .0 | | | | | | | |
| Ult | 444.0 | 1,332.1 | 91.9 | | | | | | | |
| (11) | (12) | (13) | (14) | (15) | (16) | (17) | (18) | (19) | (20) |
| | Oil | Gas | NGL | Hedge | Other | Total | Production | Ad Valorem | |
| End | Revenue | Revenue | Revenue | Revenue | Revenue | Revenue | Taxes | Taxes | $/BOE6 |
| Mo-Year | M$ | M$ | M$ | M$ | M$ | M$ | M$ | M$ | |
| 12-2018 | .000 | .000 | .000 | 0.000 | 0.000 | .000 | .000 | .000 | .000 | |
| 12-2019 | 3,565.781 | 398.990 | 134.922 | 0.000 | 0.000 | 4,099.693 | 204.783 | 102.492 | 3.826 | |
| 12-2020 | 2,202.417 | 246.437 | 83.335 | 0.000 | 0.000 | 2,532.189 | 126.485 | 63.305 | 5.189 | |
| 12-2021 | 1,399.431 | 156.588 | 52.952 | 0.000 | 0.000 | 1,608.971 | 80.369 | 40.224 | 6.601 | |
| 12-2022 | 1,049.907 | 117.478 | 39.726 | 0.000 | 0.000 | 1,207.111 | 60.296 | 30.178 | 7.890 | |
| 12-2023 | 848.903 | 94.987 | 32.121 | 0.000 | 0.000 | 976.010 | 48.752 | 24.400 | 9.113 | |
| 12-2024 | 718.797 | 80.429 | 27.198 | 0.000 | 0.000 | 826.424 | 41.281 | 20.661 | 10.268 | |
| 12-2025 | 622.934 | 69.703 | 23.571 | 0.000 | 0.000 | 716.207 | 35.775 | 17.905 | 11.429 | |
| 12-2026 | 552.550 | 61.827 | 20.907 | 0.000 | 0.000 | 635.285 | 31.733 | 15.882 | 12.537 | |
| 12-2027 | 497.594 | 55.678 | 18.828 | 0.000 | 0.000 | 572.100 | 28.577 | 14.303 | 13.620 | |
| 12-2028 | 454.582 | 50.865 | 17.200 | 0.000 | 0.000 | 522.648 | 26.107 | 13.066 | 14.651 | |
| 12-2029 | 416.396 | 46.592 | 15.756 | 0.000 | 0.000 | 478.743 | 23.914 | 11.969 | 15.745 | |
| 12-2030 | 383.106 | 42.867 | 14.496 | 0.000 | 0.000 | 440.469 | 22.002 | 11.012 | 16.876 | |
| 12-2031 | 352.478 | 39.440 | 13.337 | 0.000 | 0.000 | 405.255 | 20.243 | 10.131 | 18.105 | |
| 12-2032 | 325.150 | 36.382 | 12.303 | 0.000 | 0.000 | 373.835 | 18.673 | 9.346 | 19.397 | |
| 12-2033 | 298.303 | 33.378 | 11.287 | 0.000 | 0.000 | 342.968 | 17.132 | 8.574 | 20.898 | |
| 12-2034 | 274.454 | 30.710 | 10.385 | 0.000 | 0.000 | 315.549 | 15.762 | 7.889 | 22.477 | |
| 12-2035 | 252.512 | 28.255 | 9.555 | 0.000 | 0.000 | 290.322 | 14.502 | 7.258 | 24.193 | |
| 12-2036 | 232.935 | 26.064 | 8.814 | 0.000 | 0.000 | 267.813 | 13.377 | 6.695 | 25.997 | |
| S Tot | 14,448.230 | 1,616.671 | 546.691 | 0.000 | 0.000 | 16,611.592 | 829.762 | 415.290 | 9.376 | |
| After | 624.220 | 69.847 | 23.619 | 0.000 | 0.000 | 717.686 | 35.849 | 17.942 | 30.423 | |
| Total | 15,072.451 | 1,686.517 | 570.311 | 0.000 | 0.000 | 17,329.279 | 865.611 | 433.232 | 10.248 | |
| (21) | (22) | (23) | (24) | (25) | (26) | (27) | (28) | (29) | (30) | (31) |
| | Operating | Wells | Workover | 3rd Party | Other | | Future Net | Cumulative | Cum.Cash Flow |
| End | Expense | Gross | Net | Expense | COPAS | Deductions | Investment | Cash Flow | Cash Flow | Disc.@ 10. % |
| Mo-Year | M$ | Count | M$ | M$ | M$ | M$ | M$ | M$ | M$ |
| 12-2018 | .000 | 0 | 0.0 | 0.000 | 0.000 | 0.000 | .000 | .000 | .000 | .000 | |
| 12-2019 | 120.893 | 1 | 0.9 | 0.000 | 0.000 | 300.390 | 6,974.597 | -3,603.463 | -3,603.463 | -3,371.682 | |
| 12-2020 | 167.390 | 1 | 0.9 | 0.000 | 0.000 | 185.537 | .000 | 1,989.472 | -1,613.990 | -1,795.678 | |
| 12-2021 | 167.390 | 1 | 0.9 | 0.000 | 0.000 | 117.892 | .000 | 1,203.095 | -410.895 | -931.007 | |
| 12-2022 | 167.390 | 1 | 0.9 | 0.000 | 0.000 | 88.447 | .000 | 860.800 | 449.905 | -368.996 | |
| 12-2023 | 167.390 | 1 | 0.9 | 0.000 | 0.000 | 71.514 | .000 | 663.954 | 1,113.859 | 24.941 | |
| 12-2024 | 167.390 | 1 | 0.9 | 0.000 | 0.000 | 60.553 | .000 | 536.539 | 1,650.398 | 314.249 | |
| 12-2025 | 167.390 | 1 | 0.9 | 0.000 | 0.000 | 52.478 | .000 | 442.659 | 2,093.058 | 531.176 | |
| 12-2026 | 167.390 | 1 | 0.9 | 0.000 | 0.000 | 46.548 | .000 | 373.731 | 2,466.789 | 697.661 | |
| 12-2027 | 167.390 | 1 | 0.9 | 0.000 | 0.000 | 41.919 | .000 | 319.912 | 2,786.701 | 827.211 | |
| 12-2028 | 167.390 | 1 | 0.9 | 0.000 | 0.000 | 38.295 | .000 | 277.789 | 3,064.490 | 929.467 | |
| 12-2029 | 167.390 | 1 | 0.9 | 0.000 | 0.000 | 35.078 | .000 | 240.393 | 3,304.883 | 1,009.901 | |
| 12-2030 | 167.390 | 1 | 0.9 | 0.000 | 0.000 | 32.274 | .000 | 207.791 | 3,512.674 | 1,073.114 | |
| 12-2031 | 167.390 | 1 | 0.9 | 0.000 | 0.000 | 29.694 | .000 | 177.797 | 3,690.471 | 1,122.291 | |
| 12-2032 | 167.390 | 1 | 0.9 | 0.000 | 0.000 | 27.391 | .000 | 151.034 | 3,841.505 | 1,160.272 | |
| 12-2033 | 167.390 | 1 | 0.9 | 0.000 | 0.000 | 25.130 | .000 | 124.743 | 3,966.248 | 1,188.788 | |
| 12-2034 | 167.390 | 1 | 0.9 | 0.000 | 0.000 | 23.121 | .000 | 101.387 | 4,067.635 | 1,209.863 | |
| 12-2035 | 167.390 | 1 | 0.9 | 0.000 | 0.000 | 21.272 | .000 | 79.899 | 4,147.534 | 1,224.965 | |
| 12-2036 | 167.390 | 1 | 0.9 | 0.000 | 0.000 | 19.623 | .000 | 60.727 | 4,208.261 | 1,235.405 | |
| S Tot | 2,966.529 | | | 0.000 | 0.000 | 1,217.155 | 6,974.597 | 4,208.261 | 4,208.261 | 1,235.405 | |
| After | 533.910 | | | 0.000 | 0.000 | 52.586 | .000 | 77.399 | 4,285.659 | 1,246.873 | |
| Total | 3,500.439 | | | 0.000 | 0.000 | 1,269.741 | 6,974.597 | 4,285.659 | 4,285.659 | 1,246.873 | |
| Evaluation Parameters (Gross) | | Expenses (Gross) | | Percent Interests | | Percent | Cum. Disc. | |
| | Initial | Final | Units | | Dei | n | Def | | Initial | Final | Units | | | | Final | | 5.00 | 2,418.995 | |
| Oil Rate | 22,812. | 419. | bbls/mo | | 96.3% | 1.20 | 0.0% | | 10,666. | 15,243. | $/w/mo | | Expense | 87.1825 | 87.1825 | | 8.00 | 1,656.162 | |
| Gas Rate | 68,437. | 1,258. | Mcf/mo | | 0.0% | 0.00 | 0.0% | | | | | | Revenue | | | | 10.00 | 1,246.873 | |
| GOR | 3,000. | 3,000. | scf/bbl | | | | | | | | | | Oil | 71.0940 | 71.0940 | | 12.00 | 899.079 | |
| NGL Rate | 2,855. | 83. | bbls/mo | | | | | | | | | | Gas | 71.0940 | 71.0940 | | 15.00 | 468.477 | |
| NGL Yield | 41.7 | 66.1 | bbl/MMcf | | | | | | | | | | | | | | 20.00 | -70.836 | |
| Gas Shrinkage | 58.3 | 31.8 | % | | | | | | | | | | | | | | | | |
| Oil Severance | 4.6 | 4.6 | % | | | | | | | | | | | | | | | | |
| Gas Severance | 7.5 | 7.5 | % | | | | | | | | | | | | | | | | |
| NGL Severance | 7.5 | 7.5 | % | | | | | | | | | | | | | | | | |
| Ad Valorem | 39.2 | | % | | | | | | | | | | | | | | | | |
Start Date: 04/2019 9 Months in year ‘19 20.940 Year Life (03/2040)
| THESE DATA ARE PART OF A CG&A REPORT AND ARE SUBJECT TO THE CONDITIONS IN THE TEXT OF THE REPORT. | ASN 485 | DEFAULT | 1/10/2018 | 10:34:19 |
| TEXAS REGISTERED ENGINEERING FIRM F-693. | | | | OIL PUD | |
| | | | | Table 16 | |
Cawley, Gillespie & Associates, Inc.
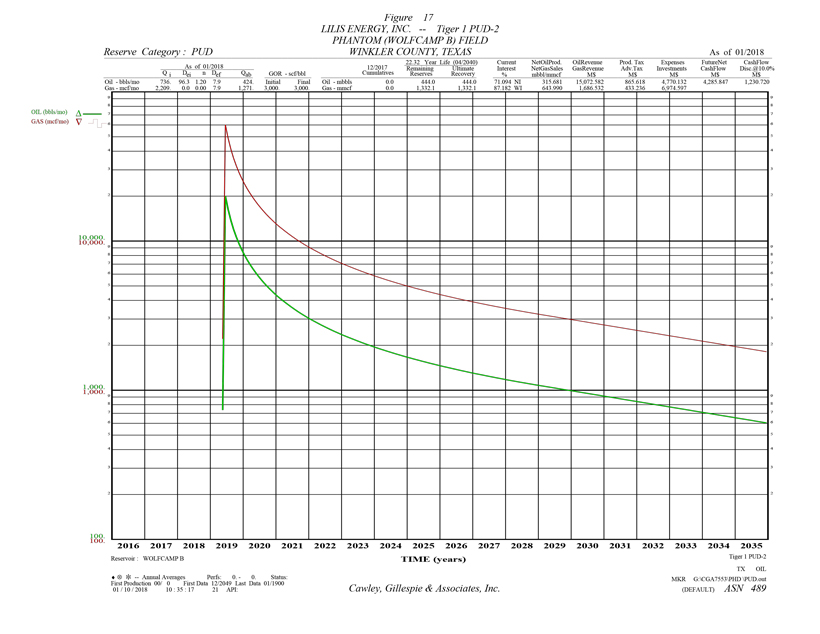
Table 17
Reserve Estimates and Economic Forecasts as of December 31, 2017
Lilis Energy, Inc. Interests
Proved Undeveloped Reserves
LILIS ENERGY, INC. -- TIGER 1 PUD-2
PHANTOM (WOLFCAMP B) FIELD -- WINKLER COUNTY, TEXAS
| (1) | (2) | (3) | (4) | (5) | (6) | (7) | (8) | (9) | (10) | |
| | Gross Oil | Gross Gas | Gross NGL | Net Oil | Net Gas | Net NGL | Avg Oil | Avg Gas | Avg NGL | |
| End | Production | Production | Production | Production | Sales | Production | Price | Price | Price | |
| Mo-Year | MBBLS | MMCF | MBBLS | MBBLS | MMCF | MBBLS | $/BBL | $/MCF | $/BBL | |
| 12-2018 | .0 | .0 | .0 | .000 | .000 | .000 | .000 | .000 | .000 | |
| 12-2019 | 92.1 | 276.4 | 19.1 | 65.509 | 133.638 | 13.560 | 47.746 | 2.619 | 8.728 | |
| 12-2020 | 70.8 | 212.5 | 14.7 | 50.367 | 102.749 | 10.426 | 47.746 | 2.619 | 8.728 | |
| 12-2021 | 43.3 | 129.8 | 9.0 | 30.770 | 62.770 | 6.369 | 47.746 | 2.619 | 8.728 | |
| 12-2022 | 32.0 | 96.0 | 6.6 | 22.747 | 46.405 | 4.709 | 47.746 | 2.619 | 8.728 | |
| 12-2023 | 25.7 | 77.0 | 5.3 | 18.249 | 37.228 | 3.778 | 47.746 | 2.619 | 8.728 | |
| 12-2024 | 21.6 | 64.9 | 4.5 | 15.377 | 31.369 | 3.183 | 47.746 | 2.619 | 8.728 | |
| 12-2025 | 18.7 | 56.0 | 3.9 | 13.282 | 27.095 | 2.749 | 47.746 | 2.619 | 8.728 | |
| 12-2026 | 16.5 | 49.6 | 3.4 | 11.753 | 23.975 | 2.433 | 47.746 | 2.619 | 8.728 | |
| 12-2027 | 14.9 | 44.6 | 3.1 | 10.564 | 21.551 | 2.187 | 47.746 | 2.619 | 8.728 | |
| 12-2028 | 13.6 | 40.7 | 2.8 | 9.637 | 19.660 | 1.995 | 47.746 | 2.619 | 8.728 | |
| 12-2029 | 12.4 | 37.2 | 2.6 | 8.821 | 17.995 | 1.826 | 47.746 | 2.619 | 8.728 | |
| 12-2030 | 11.4 | 34.2 | 2.4 | 8.116 | 16.556 | 1.680 | 47.746 | 2.619 | 8.728 | |
| 12-2031 | 10.5 | 31.5 | 2.2 | 7.467 | 15.233 | 1.546 | 47.746 | 2.619 | 8.728 | |
| 12-2032 | 9.7 | 29.1 | 2.0 | 6.888 | 14.052 | 1.426 | 47.746 | 2.619 | 8.728 | |
| 12-2033 | 8.9 | 26.7 | 1.8 | 6.319 | 12.892 | 1.308 | 47.746 | 2.619 | 8.728 | |
| 12-2034 | 8.2 | 24.5 | 1.7 | 5.814 | 11.861 | 1.204 | 47.746 | 2.619 | 8.728 | |
| 12-2035 | 7.5 | 22.6 | 1.6 | 5.349 | 10.913 | 1.107 | 47.746 | 2.619 | 8.728 | |
| 12-2036 | 6.9 | 20.8 | 1.4 | 4.935 | 10.067 | 1.021 | 47.746 | 2.619 | 8.728 | |
| S Tot | 424.7 | 1,274.2 | 87.9 | 301.965 | 616.008 | 62.507 | 47.746 | 2.619 | 8.728 | |
| After | 19.3 | 57.9 | 4.0 | 13.716 | 27.981 | 2.839 | 47.746 | 2.619 | 8.728 | |
| Total | 444.0 | 1,332.1 | 91.9 | 315.681 | 643.990 | 65.346 | 47.746 | 2.619 | 8.728 | |
| Cum | .0 | .0 | .0 | | | | | | | |
| Ult | 444.0 | 1,332.1 | 91.9 | | | | | | | |
| (11) | (12) | (13) | (14) | (15) | (16) | (17) | (18) | (19) | (20) | |
| | Oil | Gas | NGL | Hedge | Other | Total | Production | Ad Valorem | | |
| End | Revenue | Revenue | Revenue | Revenue | Revenue | Revenue | Taxes | Taxes | $/BOE6 | |
| Mo-Year | M$ | M$ | M$ | M$ | M$ | M$ | M$ | M$ | | |
| 12-2018 | .000 | .000 | .000 | 0.000 | 0.000 | .000 | .000 | .000 | .000 | |
| 12-2019 | 3,127.794 | 349.981 | 118.349 | 0.000 | 0.000 | 3,596.125 | 179.629 | 89.903 | 3.743 | |
| 12-2020 | 2,404.836 | 269.087 | 90.994 | 0.000 | 0.000 | 2,764.916 | 138.110 | 69.123 | 4.982 | |
| 12-2021 | 1,469.132 | 164.387 | 55.589 | 0.000 | 0.000 | 1,689.108 | 84.372 | 42.228 | 6.417 | |
| 12-2022 | 1,086.105 | 121.529 | 41.096 | 0.000 | 0.000 | 1,248.730 | 62.375 | 31.218 | 7.718 | |
| 12-2023 | 871.328 | 97.496 | 32.969 | 0.000 | 0.000 | 1,001.794 | 50.040 | 25.045 | 8.948 | |
| 12-2024 | 734.195 | 82.152 | 27.780 | 0.000 | 0.000 | 844.127 | 42.165 | 21.103 | 10.110 | |
| 12-2025 | 634.159 | 70.959 | 23.995 | 0.000 | 0.000 | 729.113 | 36.420 | 18.228 | 11.275 | |
| 12-2026 | 561.146 | 62.789 | 21.233 | 0.000 | 0.000 | 645.168 | 32.227 | 16.129 | 12.387 | |
| 12-2027 | 504.405 | 56.440 | 19.086 | 0.000 | 0.000 | 579.930 | 28.968 | 14.498 | 13.473 | |
| 12-2028 | 460.136 | 51.486 | 17.411 | 0.000 | 0.000 | 529.033 | 26.426 | 13.226 | 14.507 | |
| 12-2029 | 421.178 | 47.127 | 15.937 | 0.000 | 0.000 | 484.242 | 24.188 | 12.106 | 15.597 | |
| 12-2030 | 387.504 | 43.359 | 14.662 | 0.000 | 0.000 | 445.526 | 22.254 | 11.138 | 16.715 | |
| 12-2031 | 356.524 | 39.893 | 13.490 | 0.000 | 0.000 | 409.907 | 20.475 | 10.248 | 17.931 | |
| 12-2032 | 328.882 | 36.800 | 12.444 | 0.000 | 0.000 | 378.127 | 18.888 | 9.453 | 19.208 | |
| 12-2033 | 301.727 | 33.761 | 11.417 | 0.000 | 0.000 | 346.906 | 17.328 | 8.673 | 20.691 | |
| 12-2034 | 277.605 | 31.062 | 10.504 | 0.000 | 0.000 | 319.171 | 15.943 | 7.979 | 22.252 | |
| 12-2035 | 255.411 | 28.579 | 9.664 | 0.000 | 0.000 | 293.654 | 14.668 | 7.341 | 23.949 | |
| 12-2036 | 235.609 | 26.363 | 8.915 | 0.000 | 0.000 | 270.887 | 13.531 | 6.772 | 25.733 | |
| S Tot | 14,417.676 | 1,613.252 | 545.535 | 0.000 | 0.000 | 16,576.463 | 828.007 | 414.412 | 9.339 | |
| After | 654.906 | 73.280 | 24.780 | 0.000 | 0.000 | 752.966 | 37.611 | 18.824 | 30.250 | |
| Total | 15,072.582 | 1,686.532 | 570.316 | 0.000 | 0.000 | 17,329.430 | 865.618 | 433.236 | 10.248 | |
| (21) | (22) | (23) | (24) | (25) | (26) | (27) | (28) | (29) | (30) | (31) | |
| | Operating | Wells | Workover | 3rd Party | Other | | Future Net | Cumulative | Cum.Cash Flow | |
| End | Expense | Gross | Net | Expense | COPAS | Deductions | Investment | Cash Flow | Cash Flow | Disc.@ 10. % | |
| Mo-Year | M$ | Count | M$ | M$ | M$ | M$ | M$ | M$ | M$ | |
| 12-2018 | .000 | 0 | 0.0 | 0.000 | 0.000 | 0.000 | .000 | .000 | .000 | .000 | |
| 12-2019 | 98.094 | 1 | 0.9 | 0.000 | 0.000 | 263.493 | 6,974.597 | -4,009.592 | -4,009.592 | -3,661.506 | |
| 12-2020 | 167.390 | 1 | 0.9 | 0.000 | 0.000 | 202.589 | .000 | 2,187.704 | -1,821.888 | -1,927.585 | |
| 12-2021 | 167.390 | 1 | 0.9 | 0.000 | 0.000 | 123.763 | .000 | 1,271.355 | -550.533 | -1,013.706 | |
| 12-2022 | 167.390 | 1 | 0.9 | 0.000 | 0.000 | 91.496 | .000 | 896.250 | 345.717 | -428.504 | |
| 12-2023 | 167.390 | 1 | 0.9 | 0.000 | 0.000 | 73.403 | .000 | 685.915 | 1,031.632 | -21.518 | |
| 12-2024 | 167.390 | 1 | 0.9 | 0.000 | 0.000 | 61.850 | .000 | 551.619 | 1,583.251 | 275.931 | |
| 12-2025 | 167.390 | 1 | 0.9 | 0.000 | 0.000 | 53.423 | .000 | 453.652 | 2,036.903 | 498.250 | |
| 12-2026 | 167.390 | 1 | 0.9 | 0.000 | 0.000 | 47.272 | .000 | 382.149 | 2,419.052 | 668.488 | |
| 12-2027 | 167.390 | 1 | 0.9 | 0.000 | 0.000 | 42.492 | .000 | 326.582 | 2,745.633 | 800.741 | |
| 12-2028 | 167.390 | 1 | 0.9 | 0.000 | 0.000 | 38.763 | .000 | 283.228 | 3,028.862 | 904.999 | |
| 12-2029 | 167.390 | 1 | 0.9 | 0.000 | 0.000 | 35.481 | .000 | 245.076 | 3,273.938 | 987.000 | |
| 12-2030 | 167.390 | 1 | 0.9 | 0.000 | 0.000 | 32.644 | .000 | 212.098 | 3,486.036 | 1,051.523 | |
| 12-2031 | 167.390 | 1 | 0.9 | 0.000 | 0.000 | 30.034 | .000 | 181.759 | 3,667.795 | 1,101.795 | |
| 12-2032 | 167.390 | 1 | 0.9 | 0.000 | 0.000 | 27.706 | .000 | 154.689 | 3,822.485 | 1,140.695 | |
| 12-2033 | 167.390 | 1 | 0.9 | 0.000 | 0.000 | 25.418 | .000 | 128.096 | 3,950.581 | 1,169.978 | |
| 12-2034 | 167.390 | 1 | 0.9 | 0.000 | 0.000 | 23.386 | .000 | 104.473 | 4,055.054 | 1,191.693 | |
| 12-2035 | 167.390 | 1 | 0.9 | 0.000 | 0.000 | 21.516 | .000 | 82.738 | 4,137.792 | 1,207.331 | |
| 12-2036 | 167.390 | 1 | 0.9 | 0.000 | 0.000 | 19.848 | .000 | 63.345 | 4,201.137 | 1,218.220 | |
| S Tot | 2,943.730 | | | 0.000 | 0.000 | 1,214.581 | 6,974.597 | 4,201.137 | 4,201.137 | 1,218.220 | |
| After | 556.650 | | | 0.000 | 0.000 | 55.171 | .000 | 84.710 | 4,285.847 | 1,230.720 | |
| Total | 3,500.380 | | | 0.000 | 0.000 | 1,269.752 | 6,974.597 | 4,285.847 | 4,285.847 | 1,230.720 | |
| Evaluation Parameters (Gross) | | Expenses (Gross) | | Percent Interests | | Percent | Cum. Disc. | |
| | Initial | Final | Units | | Dei | n | Def | | Initial | Final | Units | | | | Final | | 5.00 | 2,402.951 | |
| Oil Rate | 22,812. | 419. | bbls/mo | | 96.3% | 1.20 | 0.0% | | 515. | 15,999. | $/w/mo | | Expense | 87.1825 | 87.1825 | | 8.00 | 1,638.830 | |
| Gas Rate | 68,437. | 1,258. | Mcf/mo | | 0.0% | 0.00 | 0.0% | | | | | | Revenue | | | | 10.00 | 1,230.720 | |
| GOR | 3,000. | 3,000. | scf/bbl | | | | | | | | | | Oil | 71.0940 | 71.0940 | | 12.00 | 885.237 | |
| NGL Rate | 155. | 89. | bbls/mo | | | | | | | | | | Gas | 71.0940 | 71.0940 | | 15.00 | 459.586 | |
| NGL Yield | 2.3 | 71.0 | bbl/MMcf | | | | | | | | | | | | | | 20.00 | -69.117 | |
| Gas Shrinkage | 97.8 | 31.5 | % | | | | | | | | | | | | | | | | |
| Oil Severance | 4.6 | 4.6 | % | | | | | | | | | | | | | | | | |
| Gas Severance | 7.5 | 7.5 | % | | | | | | | | | | | | | | | | |
| NGL Severance | 7.5 | 7.5 | % | | | | | | | | | | | | | | | | |
| Ad Valorem | 42.1 | | % | | | | | | | | | | | | | | | | |
Start Date: 05/2019 8 Months in year ‘19 20.994 Year Life (04/2040)
THESE DATA ARE PART OF A CG&A REPORT AND ARE SUBJECT TO THE CONDITIONS IN THE TEXT OF THE REPORT.
TEXAS REGISTERED ENGINEERING FIRM F-693. | ASN 489 | DEFAULT 1/10/2018 10:34:19
OIL PUD
Table 17 |
Cawley, Gillespie & Associates, Inc.
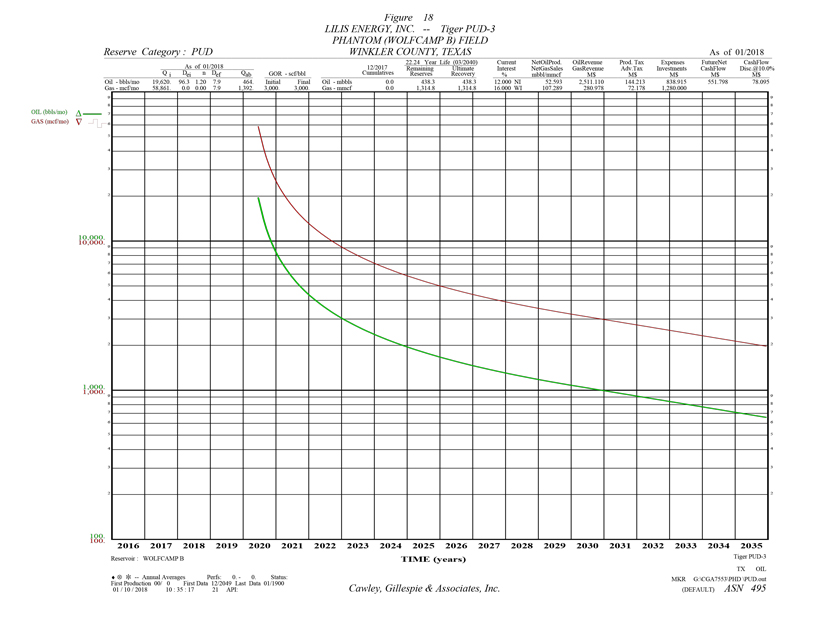
Table 18
Reserve Estimates and Economic Forecasts as of December 31, 2017
Lilis Energy, Inc. Interests
Proved Undeveloped Reserves
LILIS ENERGY, INC. -- TIGER PUD-3
PHANTOM (WOLFCAMP B) FIELD -- WINKLER COUNTY, TEXAS
| (1) | (2) | (3) | (4) | (5) | (6) | (7) | (8) | (9) | (10) | |
| | Gross Oil | Gross Gas | Gross NGL | Net Oil | Net Gas | Net NGL | Avg Oil | Avg Gas | Avg NGL | |
| End | Production | Production | Production | Production | Sales | Production | Price | Price | Price | |
| Mo-Year | MBBLS | MMCF | MBBLS | MBBLS | MMCF | MBBLS | $/BBL | $/MCF | $/BBL | |
| 12-2018 | .0 | .0 | .0 | .000 | .000 | .000 | .000 | .000 | .000 | |
| 12-2019 | .0 | .0 | .0 | .000 | .000 | .000 | .000 | .000 | .000 | |
| 12-2020 | 91.6 | 274.8 | 19.0 | 10.991 | 22.421 | 2.275 | 47.746 | 2.619 | 8.728 | |
| 12-2021 | 71.0 | 212.9 | 14.7 | 8.516 | 17.373 | 1.763 | 47.746 | 2.619 | 8.728 | |
| 12-2022 | 43.4 | 130.2 | 9.0 | 5.209 | 10.627 | 1.078 | 47.746 | 2.619 | 8.728 | |
| 12-2023 | 32.1 | 96.2 | 6.6 | 3.848 | 7.849 | .796 | 47.746 | 2.619 | 8.728 | |
| 12-2024 | 25.8 | 77.3 | 5.3 | 3.093 | 6.309 | .640 | 47.746 | 2.619 | 8.728 | |
| 12-2025 | 21.6 | 64.8 | 4.5 | 2.591 | 5.286 | .536 | 47.746 | 2.619 | 8.728 | |
| 12-2026 | 18.7 | 56.1 | 3.9 | 2.244 | 4.578 | .465 | 47.746 | 2.619 | 8.728 | |
| 12-2027 | 16.5 | 49.6 | 3.4 | 1.986 | 4.051 | .411 | 47.746 | 2.619 | 8.728 | |
| 12-2028 | 14.9 | 44.7 | 3.1 | 1.789 | 3.650 | .370 | 47.746 | 2.619 | 8.728 | |
| 12-2029 | 13.5 | 40.6 | 2.8 | 1.623 | 3.311 | .336 | 47.746 | 2.619 | 8.728 | |
| 12-2030 | 12.4 | 37.2 | 2.6 | 1.490 | 3.040 | .308 | 47.746 | 2.619 | 8.728 | |
| 12-2031 | 11.4 | 34.3 | 2.4 | 1.371 | 2.796 | .284 | 47.746 | 2.619 | 8.728 | |
| 12-2032 | 10.5 | 31.6 | 2.2 | 1.265 | 2.580 | .262 | 47.746 | 2.619 | 8.728 | |
| 12-2033 | 9.7 | 29.0 | 2.0 | 1.160 | 2.367 | .240 | 47.746 | 2.619 | 8.728 | |
| 12-2034 | 8.9 | 26.7 | 1.8 | 1.067 | 2.177 | .221 | 47.746 | 2.619 | 8.728 | |
| 12-2035 | 8.2 | 24.6 | 1.7 | .982 | 2.003 | .203 | 47.746 | 2.619 | 8.728 | |
| 12-2036 | 7.5 | 22.6 | 1.6 | .906 | 1.848 | .188 | 47.746 | 2.619 | 8.728 | |
| S Tot | 417.8 | 1,253.3 | 86.5 | 50.131 | 102.267 | 10.377 | 47.746 | 2.619 | 8.728 | |
| After | 20.5 | 61.6 | 4.2 | 2.462 | 5.023 | .510 | 47.746 | 2.619 | 8.728 | |
| Total | 438.3 | 1,314.8 | 90.7 | 52.593 | 107.289 | 10.887 | 47.746 | 2.619 | 8.728 | |
| Cum | .0 | .0 | .0 | | | | | | | |
| Ult | 438.3 | 1,314.8 | 90.7 | | | | | | | |
| (11) | (12) | (13) | (14) | (15) | (16) | (17) | (18) | (19) | (20) | |
| | Oil | Gas | NGL | Hedge | Other | Total | Production | Ad Valorem | | |
| End | Revenue | Revenue | Revenue | Revenue | Revenue | Revenue | Taxes | Taxes | $/BOE6 | |
| Mo-Year | M$ | M$ | M$ | M$ | M$ | M$ | M$ | M$ | | |
| 12-2018 | .000 | .000 | .000 | 0.000 | 0.000 | .000 | .000 | .000 | .000 | |
| 12-2019 | .000 | .000 | .000 | 0.000 | 0.000 | .000 | .000 | .000 | .000 | |
| 12-2020 | 524.759 | 58.717 | 19.856 | 0.000 | 0.000 | 603.332 | 30.137 | 15.083 | 4.066 | |
| 12-2021 | 406.611 | 45.497 | 15.385 | 0.000 | 0.000 | 467.493 | 23.352 | 11.687 | 5.412 | |
| 12-2022 | 248.724 | 27.831 | 9.411 | 0.000 | 0.000 | 285.966 | 14.284 | 7.149 | 6.965 | |
| 12-2023 | 183.706 | 20.556 | 6.951 | 0.000 | 0.000 | 211.213 | 10.550 | 5.280 | 8.381 | |
| 12-2024 | 147.673 | 16.524 | 5.588 | 0.000 | 0.000 | 169.785 | 8.481 | 4.245 | 9.702 | |
| 12-2025 | 123.718 | 13.843 | 4.681 | 0.000 | 0.000 | 142.242 | 7.105 | 3.556 | 11.006 | |
| 12-2026 | 107.156 | 11.990 | 4.055 | 0.000 | 0.000 | 123.201 | 6.154 | 3.080 | 12.249 | |
| 12-2027 | 94.805 | 10.608 | 3.587 | 0.000 | 0.000 | 109.000 | 5.445 | 2.725 | 13.458 | |
| 12-2028 | 85.431 | 9.559 | 3.233 | 0.000 | 0.000 | 98.223 | 4.906 | 2.456 | 14.609 | |
| 12-2029 | 77.502 | 8.672 | 2.932 | 0.000 | 0.000 | 89.106 | 4.451 | 2.228 | 15.801 | |
| 12-2030 | 71.140 | 7.960 | 2.692 | 0.000 | 0.000 | 81.792 | 4.086 | 2.045 | 16.949 | |
| 12-2031 | 65.452 | 7.324 | 2.477 | 0.000 | 0.000 | 75.252 | 3.759 | 1.881 | 18.164 | |
| 12-2032 | 60.377 | 6.756 | 2.285 | 0.000 | 0.000 | 69.418 | 3.467 | 1.735 | 19.441 | |
| 12-2033 | 55.392 | 6.198 | 2.096 | 0.000 | 0.000 | 63.686 | 3.181 | 1.592 | 20.924 | |
| 12-2034 | 50.964 | 5.703 | 1.928 | 0.000 | 0.000 | 58.595 | 2.927 | 1.465 | 22.484 | |
| 12-2035 | 46.889 | 5.247 | 1.774 | 0.000 | 0.000 | 53.910 | 2.693 | 1.348 | 24.180 | |
| 12-2036 | 43.254 | 4.840 | 1.637 | 0.000 | 0.000 | 49.730 | 2.484 | 1.243 | 25.963 | |
| S Tot | 2,393.552 | 267.824 | 90.567 | 0.000 | 0.000 | 2,751.943 | 137.462 | 68.799 | 9.856 | |
| After | 117.559 | 13.154 | 4.448 | 0.000 | 0.000 | 135.161 | 6.751 | 3.379 | 30.387 | |
| Total | 2,511.110 | 280.978 | 95.015 | 0.000 | 0.000 | 2,887.104 | 144.213 | 72.178 | 10.818 | |
| (21) | (22) | (23) | (24) | (25) | (26) | (27) | (28) | (29) | (30) | (31) | |
| | Operating | Wells | Workover | 3rd Party | Other | | Future Net | Cumulative | Cum.Cash Flow | |
| End | Expense | Gross | Net | Expense | COPAS | Deductions | Investment | Cash Flow | Cash Flow | Disc.@ 10. % | |
| Mo-Year | M$ | Count | M$ | M$ | M$ | M$ | M$ | M$ | M$ | |
| 12-2018 | .000 | 0 | 0.0 | 0.000 | 0.000 | 0.000 | .000 | .000 | .000 | .000 | |
| 12-2019 | .000 | 0 | 0.0 | 0.000 | 0.000 | 0.000 | .000 | .000 | .000 | .000 | |
| 12-2020 | 17.835 | 1 | 0.2 | 0.000 | 0.000 | 48.066 | 1,280.000 | -787.788 | -787.788 | -650.673 | |
| 12-2021 | 30.720 | 1 | 0.2 | 0.000 | 0.000 | 37.244 | .000 | 364.491 | -423.298 | -388.055 | |
| 12-2022 | 30.720 | 1 | 0.2 | 0.000 | 0.000 | 22.782 | .000 | 211.030 | -212.267 | -250.137 | |
| 12-2023 | 30.720 | 1 | 0.2 | 0.000 | 0.000 | 16.827 | .000 | 147.835 | -64.432 | -162.374 | |
| 12-2024 | 30.720 | 1 | 0.2 | 0.000 | 0.000 | 13.526 | .000 | 112.813 | 48.381 | -101.522 | |
| 12-2025 | 30.720 | 1 | 0.2 | 0.000 | 0.000 | 11.332 | .000 | 89.529 | 137.910 | -57.636 | |
| 12-2026 | 30.720 | 1 | 0.2 | 0.000 | 0.000 | 9.815 | .000 | 73.432 | 211.342 | -24.917 | |
| 12-2027 | 30.720 | 1 | 0.2 | 0.000 | 0.000 | 8.684 | .000 | 61.427 | 272.769 | -.038 | |
| 12-2028 | 30.720 | 1 | 0.2 | 0.000 | 0.000 | 7.825 | .000 | 52.316 | 325.085 | 19.222 | |
| 12-2029 | 30.720 | 1 | 0.2 | 0.000 | 0.000 | 7.099 | .000 | 44.609 | 369.694 | 34.149 | |
| 12-2030 | 30.720 | 1 | 0.2 | 0.000 | 0.000 | 6.516 | .000 | 38.425 | 408.119 | 45.839 | |
| 12-2031 | 30.720 | 1 | 0.2 | 0.000 | 0.000 | 5.995 | .000 | 32.897 | 441.016 | 54.938 | |
| 12-2032 | 30.720 | 1 | 0.2 | 0.000 | 0.000 | 5.530 | .000 | 27.965 | 468.980 | 61.970 | |
| 12-2033 | 30.720 | 1 | 0.2 | 0.000 | 0.000 | 5.074 | .000 | 23.119 | 492.099 | 67.255 | |
| 12-2034 | 30.720 | 1 | 0.2 | 0.000 | 0.000 | 4.668 | .000 | 18.815 | 510.914 | 71.166 | |
| 12-2035 | 30.720 | 1 | 0.2 | 0.000 | 0.000 | 4.295 | .000 | 14.855 | 525.769 | 73.973 | |
| 12-2036 | 30.720 | 1 | 0.2 | 0.000 | 0.000 | 3.962 | .000 | 11.321 | 537.090 | 75.920 | |
| S Tot | 509.355 | | | 0.000 | 0.000 | 219.238 | 1,280.000 | 537.090 | 537.090 | 75.920 | |
| After | 99.554 | | | 0.000 | 0.000 | 10.768 | .000 | 14.709 | 551.798 | 78.095 | |
| Total | 608.909 | | | 0.000 | 0.000 | 230.006 | 1,280.000 | 551.798 | 551.798 | 78.095 | |
| Evaluation Parameters (Gross) | | Expenses (Gross) | | Percent Interests | | Percent | Cum. Disc. | |
| | Initial | Final | Units | | Dei | n | Def | | Initial | Final | Units | | | | Final | | 5.00 | 252.484 | |
| Oil Rate | 22,812. | 459. | bbls/mo | | 96.3% | 1.20 | 0.0% | | 15,462. | 15,243. | $/w/mo | | Expense | 16.0000 | 16.0000 | | 8.00 | 137.306 | |
| Gas Rate | 68,437. | 1,378. | Mcf/mo | | 0.0% | 0.00 | 0.0% | | | | | | Revenue | | | | 10.00 | 78.095 | |
| GOR | 3,000. | 3,000. | scf/bbl | | | | | | | | | | Oil | 12.0000 | 12.0000 | | 12.00 | 29.608 | |
| NGL Rate | 4,003. | 91. | bbls/mo | | | | | | | | | | Gas | 12.0000 | 12.0000 | | 15.00 | -27.504 | |
| NGL Yield | 58.5 | 66.4 | bbl/MMcf | | | | | | | | | | | | | | 20.00 | -92.916 | |
| Gas Shrinkage | 41.5 | 31.7 | % | | | | | | | | | | | | | | | | |
| Oil Severance | 4.6 | 4.6 | % | | | | | | | | | | | | | | | | |
| Gas Severance | 7.5 | 7.5 | % | | | | | | | | | | | | | | | | |
| NGL Severance | 7.5 | 7.5 | % | | | | | | | | | | | | | | | | |
| Ad Valorem | 7.3 | | % | | | | | | | | | | | | | | | | |
Start Date: 06/2020 7 Months in year ‘20 19.825 Year Life (03/2040)
THESE DATA ARE PART OF A CG&A REPORT AND ARE SUBJECT TO THE CONDITIONS IN THE TEXT OF THE REPORT.
TEXAS REGISTERED ENGINEERING FIRM F-693. | ASN 495 | DEFAULT 1/10/2018 10:34:19
OIL PUD
Table 18 |
Cawley, Gillespie & Associates, Inc.

Table 19
Reserve Estimates and Economic Forecasts as of December 31, 2017
Lilis Energy, Inc. Interests
Proved Undeveloped Reserves
LILIS ENERGY, INC. -- WILD HOG 2H
PHANTOM (WOLFCAMP B) FIELD -- LEA COUNTY, NEW MEXICO
| (1) | (2) | (3) | (4) | (5) | (6) | (7) | (8) | (9) | (10) | |
| | Gross Oil | Gross Gas | Gross NGL | Net Oil | Net Gas | Net NGL | Avg Oil | Avg Gas | Avg NGL | |
| End | Production | Production | Production | Production | Sales | Production | Price | Price | Price | |
| Mo-Year | MBBLS | MMCF | MBBLS | MBBLS | MMCF | MBBLS | $/BBL | $/MCF | $/BBL | |
| 12-2018 | 92.4 | 277.2 | 19.1 | 46.207 | 94.263 | 9.565 | 47.746 | 2.619 | 8.728 | |
| 12-2019 | 70.6 | 211.7 | 14.6 | 35.285 | 71.982 | 7.304 | 47.746 | 2.619 | 8.728 | |
| 12-2020 | 43.4 | 130.1 | 9.0 | 21.690 | 44.248 | 4.490 | 47.746 | 2.619 | 8.728 | |
| 12-2021 | 32.0 | 95.9 | 6.6 | 15.987 | 32.614 | 3.309 | 47.746 | 2.619 | 8.728 | |
| 12-2022 | 25.7 | 77.0 | 5.3 | 12.828 | 26.169 | 2.655 | 47.746 | 2.619 | 8.728 | |
| 12-2023 | 21.6 | 64.7 | 4.5 | 10.783 | 21.996 | 2.232 | 47.746 | 2.619 | 8.728 | |
| 12-2024 | 18.7 | 56.2 | 3.9 | 9.365 | 19.105 | 1.939 | 47.746 | 2.619 | 8.728 | |
| 12-2025 | 16.5 | 49.6 | 3.4 | 8.263 | 16.857 | 1.710 | 47.746 | 2.619 | 8.728 | |
| 12-2026 | 14.9 | 44.6 | 3.1 | 7.428 | 15.153 | 1.538 | 47.746 | 2.619 | 8.728 | |
| 12-2027 | 13.5 | 40.6 | 2.8 | 6.758 | 13.787 | 1.399 | 47.746 | 2.619 | 8.728 | |
| 12-2028 | 12.4 | 37.3 | 2.6 | 6.220 | 12.689 | 1.288 | 47.746 | 2.619 | 8.728 | |
| 12-2029 | 11.4 | 34.2 | 2.4 | 5.707 | 11.641 | 1.181 | 47.746 | 2.619 | 8.728 | |
| 12-2030 | 10.5 | 31.5 | 2.2 | 5.250 | 10.711 | 1.087 | 47.746 | 2.619 | 8.728 | |
| 12-2031 | 9.7 | 29.0 | 2.0 | 4.831 | 9.854 | 1.000 | 47.746 | 2.619 | 8.728 | |
| 12-2032 | 8.9 | 26.7 | 1.8 | 4.456 | 9.090 | .922 | 47.746 | 2.619 | 8.728 | |
| 12-2033 | 8.2 | 24.5 | 1.7 | 4.088 | 8.340 | .846 | 47.746 | 2.619 | 8.728 | |
| 12-2034 | 7.5 | 22.6 | 1.6 | 3.761 | 7.673 | .779 | 47.746 | 2.619 | 8.728 | |
| 12-2035 | 6.9 | 20.8 | 1.4 | 3.461 | 7.060 | .716 | 47.746 | 2.619 | 8.728 | |
| 12-2036 | 6.4 | 19.2 | 1.3 | 3.192 | 6.512 | .661 | 47.746 | 2.619 | 8.728 | |
| S Tot | 431.1 | 1,293.4 | 89.2 | 215.561 | 439.744 | 44.621 | 47.746 | 2.619 | 8.728 | |
| After | 8.0 | 24.1 | 1.7 | 4.019 | 8.198 | .832 | 47.746 | 2.619 | 8.728 | |
| Total | 439.2 | 1,317.5 | 90.9 | 219.579 | 447.942 | 45.453 | 47.746 | 2.619 | 8.728 | |
| Cum | .0 | .0 | .0 | | | | | | | |
| Ult | 439.2 | 1,317.5 | 90.9 | | | | | | | |
| (11) | (12) | (13) | (14) | (15) | (16) | (17) | (18) | (19) | (20) | |
| | Oil | Gas | NGL | Hedge | Other | Total | Production | Ad Valorem | | |
| End | Revenue | Revenue | Revenue | Revenue | Revenue | Revenue | Taxes | Taxes | $/BOE6 | |
| Mo-Year | M$ | M$ | M$ | M$ | M$ | M$ | M$ | M$ | | |
| 12-2018 | 2,206.227 | 246.864 | 83.479 | 0.000 | 0.000 | 2,536.569 | 182.651 | 126.828 | 3.817 | |
| 12-2019 | 1,684.748 | 188.513 | 63.747 | 0.000 | 0.000 | 1,937.009 | 139.478 | 96.850 | 5.087 | |
| 12-2020 | 1,035.613 | 115.879 | 39.185 | 0.000 | 0.000 | 1,190.677 | 85.737 | 59.534 | 6.533 | |
| 12-2021 | 763.323 | 85.411 | 28.883 | 0.000 | 0.000 | 877.617 | 63.195 | 43.881 | 7.871 | |
| 12-2022 | 612.476 | 68.532 | 23.175 | 0.000 | 0.000 | 704.183 | 50.706 | 35.209 | 9.125 | |
| 12-2023 | 514.827 | 57.606 | 19.480 | 0.000 | 0.000 | 591.914 | 42.622 | 29.596 | 10.328 | |
| 12-2024 | 447.146 | 50.033 | 16.919 | 0.000 | 0.000 | 514.098 | 37.019 | 25.705 | 11.470 | |
| 12-2025 | 394.528 | 44.145 | 14.928 | 0.000 | 0.000 | 453.601 | 32.662 | 22.680 | 12.629 | |
| 12-2026 | 354.648 | 39.683 | 13.419 | 0.000 | 0.000 | 407.750 | 29.361 | 20.388 | 13.737 | |
| 12-2027 | 322.686 | 36.107 | 12.210 | 0.000 | 0.000 | 371.003 | 26.715 | 18.550 | 14.822 | |
| 12-2028 | 296.990 | 33.231 | 11.238 | 0.000 | 0.000 | 341.459 | 24.587 | 17.073 | 15.864 | |
| 12-2029 | 272.467 | 30.487 | 10.310 | 0.000 | 0.000 | 313.264 | 22.557 | 15.663 | 17.041 | |
| 12-2030 | 250.684 | 28.050 | 9.485 | 0.000 | 0.000 | 288.219 | 20.754 | 14.411 | 18.281 | |
| 12-2031 | 230.642 | 25.808 | 8.727 | 0.000 | 0.000 | 265.177 | 19.095 | 13.259 | 19.627 | |
| 12-2032 | 212.761 | 23.807 | 8.050 | 0.000 | 0.000 | 244.618 | 17.614 | 12.231 | 21.043 | |
| 12-2033 | 195.193 | 21.841 | 7.386 | 0.000 | 0.000 | 224.420 | 16.160 | 11.221 | 22.687 | |
| 12-2034 | 179.588 | 20.095 | 6.795 | 0.000 | 0.000 | 206.478 | 14.868 | 10.324 | 24.417 | |
| 12-2035 | 165.231 | 18.488 | 6.252 | 0.000 | 0.000 | 189.971 | 13.679 | 9.499 | 26.297 | |
| 12-2036 | 152.420 | 17.055 | 5.767 | 0.000 | 0.000 | 175.242 | 12.619 | 8.762 | 28.273 | |
| S Tot | 10,292.199 | 1,151.636 | 389.436 | 0.000 | 0.000 | 11,833.270 | 852.078 | 591.664 | 9.798 | |
| After | 191.877 | 21.470 | 7.260 | 0.000 | 0.000 | 220.607 | 15.885 | 11.030 | 30.928 | |
| Total | 10,484.075 | 1,173.106 | 396.696 | 0.000 | 0.000 | 12,053.877 | 867.963 | 602.694 | 10.185 | |
| (21) | (22) | (23) | (24) | (25) | (26) | (27) | (28) | (29) | (30) | (31) | |
| | Operating | Wells | Workover | 3rd Party | Other | | Future Net | Cumulative | Cum.Cash Flow | |
| End | Expense | Gross | Net | Expense | COPAS | Deductions | Investment | Cash Flow | Cash Flow | Disc.@ 10. % | |
| Mo-Year | M$ | Count | M$ | M$ | M$ | M$ | M$ | M$ | M$ | |
| 12-2018 | 70.645 | 1 | 0.6 | 0.000 | 0.000 | 189.450 | 5,000.000 | -3,033.005 | -3,033.005 | -3,037.101 | |
| 12-2019 | 120.000 | 1 | 0.6 | 0.000 | 0.000 | 144.671 | .000 | 1,436.010 | -1,596.995 | -1,785.057 | |
| 12-2020 | 120.000 | 1 | 0.6 | 0.000 | 0.000 | 88.929 | .000 | 836.478 | -760.518 | -1,123.573 | |
| 12-2021 | 120.000 | 1 | 0.6 | 0.000 | 0.000 | 65.547 | .000 | 584.995 | -175.523 | -703.421 | |
| 12-2022 | 120.000 | 1 | 0.6 | 0.000 | 0.000 | 52.594 | .000 | 445.674 | 270.151 | -412.547 | |
| 12-2023 | 120.000 | 1 | 0.6 | 0.000 | 0.000 | 44.209 | .000 | 355.487 | 625.638 | -201.674 | |
| 12-2024 | 120.000 | 1 | 0.6 | 0.000 | 0.000 | 38.397 | .000 | 292.978 | 918.616 | -43.717 | |
| 12-2025 | 120.000 | 1 | 0.6 | 0.000 | 0.000 | 33.878 | .000 | 244.380 | 1,162.996 | 76.032 | |
| 12-2026 | 120.000 | 1 | 0.6 | 0.000 | 0.000 | 30.454 | .000 | 207.548 | 1,370.544 | 168.482 | |
| 12-2027 | 120.000 | 1 | 0.6 | 0.000 | 0.000 | 27.709 | .000 | 178.028 | 1,548.573 | 240.573 | |
| 12-2028 | 120.000 | 1 | 0.6 | 0.000 | 0.000 | 25.503 | .000 | 154.296 | 1,702.869 | 297.373 | |
| 12-2029 | 120.000 | 1 | 0.6 | 0.000 | 0.000 | 23.397 | .000 | 131.647 | 1,834.515 | 341.425 | |
| 12-2030 | 120.000 | 1 | 0.6 | 0.000 | 0.000 | 21.526 | .000 | 111.528 | 1,946.044 | 375.358 | |
| 12-2031 | 120.000 | 1 | 0.6 | 0.000 | 0.000 | 19.805 | .000 | 93.018 | 2,039.062 | 401.090 | |
| 12-2032 | 120.000 | 1 | 0.6 | 0.000 | 0.000 | 18.270 | .000 | 76.503 | 2,115.564 | 420.333 | |
| 12-2033 | 120.000 | 1 | 0.6 | 0.000 | 0.000 | 16.761 | .000 | 60.278 | 2,175.842 | 434.117 | |
| 12-2034 | 120.000 | 1 | 0.6 | 0.000 | 0.000 | 15.421 | .000 | 45.865 | 2,221.707 | 443.654 | |
| 12-2035 | 120.000 | 1 | 0.6 | 0.000 | 0.000 | 14.188 | .000 | 32.605 | 2,254.312 | 449.821 | |
| 12-2036 | 120.000 | 1 | 0.6 | 0.000 | 0.000 | 13.088 | .000 | 20.773 | 2,275.085 | 453.399 | |
| S Tot | 2,230.645 | | | 0.000 | 0.000 | 883.798 | 5,000.000 | 2,275.085 | 2,275.085 | 453.399 | |
| After | 166.797 | | | 0.000 | 0.000 | 16.477 | .000 | 10.417 | 2,285.502 | 455.020 | |
| Total | 2,397.443 | | | 0.000 | 0.000 | 900.275 | 5,000.000 | 2,285.502 | 2,285.502 | 455.020 | |
| Evaluation Parameters (Gross) | | Expenses (Gross) | | Percent Interests | | Percent | Cum. Disc. | |
| | Initial | Final | Units | | Dei | n | Def | | Initial | Final | Units | | | | Final | | 5.00 | 1,190.352 | |
| Oil Rate | 22,812. | 453. | bbls/mo | | 96.3% | 1.20 | 0.0% | | 1,032. | 15,769. | $/w/mo | | Expense | 62.5000 | 62.5000 | | 8.00 | 717.524 | |
| Gas Rate | 68,437. | 1,359. | Mcf/mo | | 0.0% | 0.00 | 0.0% | | | | | | Revenue | | | | 10.00 | 455.020 | |
| GOR | 3,000. | 3,000. | scf/bbl | | | | | | | | | | Oil | 50.0000 | 50.0000 | | 12.00 | 225.767 | |
| NGL Rate | 307. | 93. | bbls/mo | | | | | | | | | | Gas | 50.0000 | 50.0000 | | 15.00 | -68.034 | |
| NGL Yield | 4.5 | 68.6 | bbl/MMcf | | | | | | | | | | | | | | 20.00 | -457.430 | |
| Gas Shrinkage | 95.7 | 31.6 | % | | | | | | | | | | | | | | | | |
| Oil Severance | 7.1 | 7.1 | % | | | | | | | | | | | | | | | | |
| Gas Severance | 7.9 | 7.9 | % | | | | | | | | | | | | | | | | |
| NGL Severance | 7.9 | 7.9 | % | | | | | | | | | | | | | | | | |
| Ad Valorem | 61.9 | | % | | | | | | | | | | | | | | | | |
Start Date: 05/2018 8 Months in year ‘18 20.061 Year Life (05/2038)
THESE DATA ARE PART OF A CG&A REPORT AND ARE SUBJECT TO THE CONDITIONS IN THE TEXT OF THE REPORT.
TEXAS REGISTERED ENGINEERING FIRM F-693. | ASN 481 | DEFAULT 1/10/2018 10:34:19
OIL PUD
Table 19 |
Cawley, Gillespie & Associates, Inc.
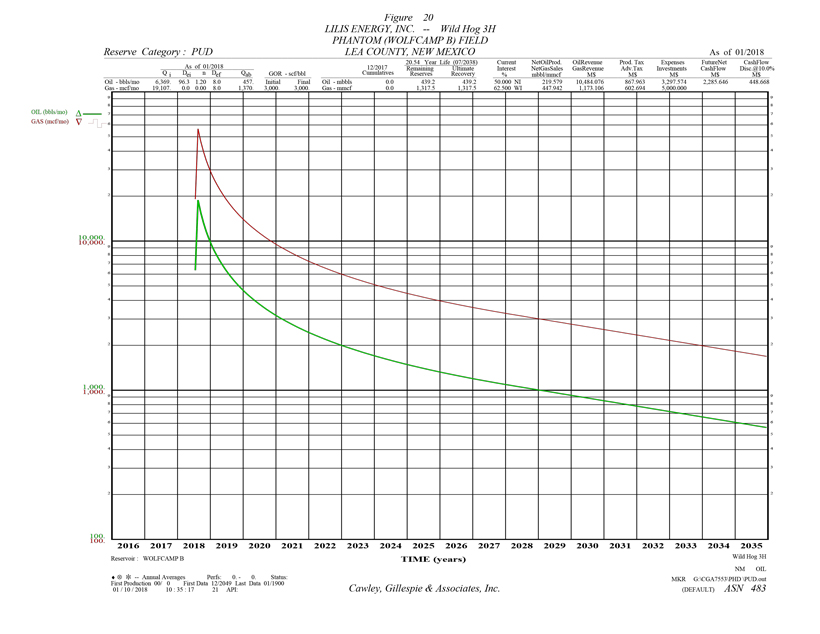
Table 20
Reserve Estimates and Economic Forecasts as of December 31, 2017
Lilis Energy, Inc. Interests
Proved Undeveloped Reserves
LILIS ENERGY, INC. -- WILD HOG 3H
PHANTOM (WOLFCAMP B) FIELD -- LEA COUNTY, NEW MEXICO
| (1) | (2) | (3) | (4) | (5) | (6) | (7) | (8) | (9) | (10) | |
| | Gross Oil | Gross Gas | Gross NGL | Net Oil | Net Gas | Net NGL | Avg Oil | Avg Gas | Avg NGL | |
| End | Production | Production | Production | Production | Sales | Production | Price | Price | Price | |
| Mo-Year | MBBLS | MMCF | MBBLS | MBBLS | MMCF | MBBLS | $/BBL | $/MCF | $/BBL | |
| 12-2018 | 76.4 | 229.2 | 15.8 | 38.192 | 77.912 | 7.906 | 47.746 | 2.619 | 8.728 | |
| 12-2019 | 78.6 | 235.8 | 16.3 | 39.301 | 80.173 | 8.135 | 47.746 | 2.619 | 8.728 | |
| 12-2020 | 45.9 | 137.6 | 9.5 | 22.938 | 46.795 | 4.748 | 47.746 | 2.619 | 8.728 | |
| 12-2021 | 33.2 | 99.7 | 6.9 | 16.610 | 33.884 | 3.438 | 47.746 | 2.619 | 8.728 | |
| 12-2022 | 26.4 | 79.2 | 5.5 | 13.206 | 26.941 | 2.734 | 47.746 | 2.619 | 8.728 | |
| 12-2023 | 22.1 | 66.2 | 4.6 | 11.039 | 22.520 | 2.285 | 47.746 | 2.619 | 8.728 | |
| 12-2024 | 19.1 | 57.3 | 4.0 | 9.552 | 19.485 | 1.977 | 47.746 | 2.619 | 8.728 | |
| 12-2025 | 16.8 | 50.4 | 3.5 | 8.405 | 17.145 | 1.740 | 47.746 | 2.619 | 8.728 | |
| 12-2026 | 15.1 | 45.2 | 3.1 | 7.540 | 15.381 | 1.561 | 47.746 | 2.619 | 8.728 | |
| 12-2027 | 13.7 | 41.1 | 2.8 | 6.849 | 13.972 | 1.418 | 47.746 | 2.619 | 8.728 | |
| 12-2028 | 12.6 | 37.8 | 2.6 | 6.298 | 12.847 | 1.304 | 47.746 | 2.619 | 8.728 | |
| 12-2029 | 11.6 | 34.7 | 2.4 | 5.777 | 11.786 | 1.196 | 47.746 | 2.619 | 8.728 | |
| 12-2030 | 10.6 | 31.9 | 2.2 | 5.315 | 10.844 | 1.100 | 47.746 | 2.619 | 8.728 | |
| 12-2031 | 9.8 | 29.3 | 2.0 | 4.891 | 9.977 | 1.012 | 47.746 | 2.619 | 8.728 | |
| 12-2032 | 9.0 | 27.1 | 1.9 | 4.511 | 9.203 | .934 | 47.746 | 2.619 | 8.728 | |
| 12-2033 | 8.3 | 24.8 | 1.7 | 4.139 | 8.443 | .857 | 47.746 | 2.619 | 8.728 | |
| 12-2034 | 7.6 | 22.8 | 1.6 | 3.808 | 7.768 | .788 | 47.746 | 2.619 | 8.728 | |
| 12-2035 | 7.0 | 21.0 | 1.5 | 3.504 | 7.147 | .725 | 47.746 | 2.619 | 8.728 | |
| 12-2036 | 6.5 | 19.4 | 1.3 | 3.232 | 6.593 | .669 | 47.746 | 2.619 | 8.728 | |
| S Tot | 430.2 | 1,290.6 | 89.1 | 215.106 | 438.817 | 44.527 | 47.746 | 2.619 | 8.728 | |
| After | 8.9 | 26.8 | 1.9 | 4.473 | 9.125 | .926 | 47.746 | 2.619 | 8.728 | |
| Total | 439.2 | 1,317.5 | 90.9 | 219.579 | 447.942 | 45.453 | 47.746 | 2.619 | 8.728 | |
| Cum | .0 | .0 | .0 | | | | | | | |
| Ult | 439.2 | 1,317.5 | 90.9 | | | | | | | |
| (11) | (12) | (13) | (14) | (15) | (16) | (17) | (18) | (19) | (20) | |
| | Oil | Gas | NGL | Hedge | Other | Total | Production | Ad Valorem | | |
| End | Revenue | Revenue | Revenue | Revenue | Revenue | Revenue | Taxes | Taxes | $/BOE6 | |
| Mo-Year | M$ | M$ | M$ | M$ | M$ | M$ | M$ | M$ | | |
| 12-2018 | 1,823.540 | 204.043 | 68.999 | 0.000 | 0.000 | 2,096.582 | 150.969 | 104.829 | 3.720 | |
| 12-2019 | 1,876.460 | 209.965 | 71.001 | 0.000 | 0.000 | 2,157.426 | 155.350 | 107.871 | 4.851 | |
| 12-2020 | 1,095.226 | 122.549 | 41.441 | 0.000 | 0.000 | 1,259.216 | 90.672 | 62.961 | 6.328 | |
| 12-2021 | 793.060 | 88.739 | 30.008 | 0.000 | 0.000 | 911.806 | 65.656 | 45.590 | 7.680 | |
| 12-2022 | 630.558 | 70.556 | 23.859 | 0.000 | 0.000 | 724.973 | 52.203 | 36.249 | 8.943 | |
| 12-2023 | 527.074 | 58.976 | 19.943 | 0.000 | 0.000 | 605.994 | 43.636 | 30.300 | 10.153 | |
| 12-2024 | 456.054 | 51.030 | 17.256 | 0.000 | 0.000 | 524.340 | 37.756 | 26.217 | 11.301 | |
| 12-2025 | 401.290 | 44.902 | 15.184 | 0.000 | 0.000 | 461.376 | 33.222 | 23.069 | 12.463 | |
| 12-2026 | 359.983 | 40.280 | 13.621 | 0.000 | 0.000 | 413.884 | 29.803 | 20.694 | 13.574 | |
| 12-2027 | 327.011 | 36.591 | 12.373 | 0.000 | 0.000 | 375.975 | 27.073 | 18.799 | 14.663 | |
| 12-2028 | 300.684 | 33.645 | 11.377 | 0.000 | 0.000 | 345.706 | 24.893 | 17.285 | 15.703 | |
| 12-2029 | 275.847 | 30.866 | 10.437 | 0.000 | 0.000 | 317.150 | 22.837 | 15.857 | 16.867 | |
| 12-2030 | 253.793 | 28.398 | 9.603 | 0.000 | 0.000 | 291.794 | 21.011 | 14.590 | 18.091 | |
| 12-2031 | 233.503 | 26.128 | 8.835 | 0.000 | 0.000 | 268.466 | 19.331 | 13.423 | 19.421 | |
| 12-2032 | 215.400 | 24.102 | 8.150 | 0.000 | 0.000 | 247.652 | 17.833 | 12.383 | 20.820 | |
| 12-2033 | 197.615 | 22.112 | 7.477 | 0.000 | 0.000 | 227.204 | 16.360 | 11.360 | 22.443 | |
| 12-2034 | 181.816 | 20.344 | 6.880 | 0.000 | 0.000 | 209.039 | 15.052 | 10.452 | 24.152 | |
| 12-2035 | 167.280 | 18.718 | 6.330 | 0.000 | 0.000 | 192.327 | 13.849 | 9.616 | 26.009 | |
| 12-2036 | 154.311 | 17.266 | 5.839 | 0.000 | 0.000 | 177.416 | 12.775 | 8.871 | 27.961 | |
| S Tot | 10,270.504 | 1,149.208 | 388.615 | 0.000 | 0.000 | 11,808.327 | 850.282 | 590.416 | 9.757 | |
| After | 213.572 | 23.897 | 8.081 | 0.000 | 0.000 | 245.550 | 17.681 | 12.278 | 30.737 | |
| Total | 10,484.076 | 1,173.106 | 396.696 | 0.000 | 0.000 | 12,053.877 | 867.963 | 602.694 | 10.185 | |
| (21) | (22) | (23) | (24) | (25) | (26) | (27) | (28) | (29) | (30) | (31) | |
| | Operating | Wells | Workover | 3rd Party | Other | | Future Net | Cumulative | Cum.Cash Flow | |
| End | Expense | Gross | Net | Expense | COPAS | Deductions | Investment | Cash Flow | Cash Flow | Disc.@ 10. % | |
| Mo-Year | M$ | Count | M$ | M$ | M$ | M$ | M$ | M$ | M$ | |
| 12-2018 | 52.903 | 1 | 0.6 | 0.000 | 0.000 | 156.589 | 5,000.000 | -3,368.708 | -3,368.708 | -3,297.690 | |
| 12-2019 | 120.000 | 1 | 0.6 | 0.000 | 0.000 | 161.133 | .000 | 1,613.072 | -1,755.636 | -1,890.289 | |
| 12-2020 | 120.000 | 1 | 0.6 | 0.000 | 0.000 | 94.048 | .000 | 891.535 | -864.100 | -1,185.126 | |
| 12-2021 | 120.000 | 1 | 0.6 | 0.000 | 0.000 | 68.101 | .000 | 612.459 | -251.642 | -745.207 | |
| 12-2022 | 120.000 | 1 | 0.6 | 0.000 | 0.000 | 54.146 | .000 | 462.375 | 210.733 | -443.416 | |
| 12-2023 | 120.000 | 1 | 0.6 | 0.000 | 0.000 | 45.260 | .000 | 366.798 | 577.532 | -225.826 | |
| 12-2024 | 120.000 | 1 | 0.6 | 0.000 | 0.000 | 39.162 | .000 | 301.205 | 878.737 | -63.429 | |
| 12-2025 | 120.000 | 1 | 0.6 | 0.000 | 0.000 | 34.459 | .000 | 250.626 | 1,129.362 | 59.382 | |
| 12-2026 | 120.000 | 1 | 0.6 | 0.000 | 0.000 | 30.912 | .000 | 212.475 | 1,341.837 | 154.029 | |
| 12-2027 | 120.000 | 1 | 0.6 | 0.000 | 0.000 | 28.081 | .000 | 182.023 | 1,523.860 | 227.738 | |
| 12-2028 | 120.000 | 1 | 0.6 | 0.000 | 0.000 | 25.820 | .000 | 157.708 | 1,681.568 | 285.793 | |
| 12-2029 | 120.000 | 1 | 0.6 | 0.000 | 0.000 | 23.687 | .000 | 134.768 | 1,816.336 | 330.890 | |
| 12-2030 | 120.000 | 1 | 0.6 | 0.000 | 0.000 | 21.793 | .000 | 114.400 | 1,930.736 | 365.696 | |
| 12-2031 | 120.000 | 1 | 0.6 | 0.000 | 0.000 | 20.051 | .000 | 95.660 | 2,026.396 | 392.158 | |
| 12-2032 | 120.000 | 1 | 0.6 | 0.000 | 0.000 | 18.497 | .000 | 78.940 | 2,105.336 | 412.014 | |
| 12-2033 | 120.000 | 1 | 0.6 | 0.000 | 0.000 | 16.969 | .000 | 62.514 | 2,167.850 | 426.309 | |
| 12-2034 | 120.000 | 1 | 0.6 | 0.000 | 0.000 | 15.613 | .000 | 47.923 | 2,215.773 | 436.274 | |
| 12-2035 | 120.000 | 1 | 0.6 | 0.000 | 0.000 | 14.364 | .000 | 34.498 | 2,250.271 | 442.798 | |
| 12-2036 | 120.000 | 1 | 0.6 | 0.000 | 0.000 | 13.251 | .000 | 22.519 | 2,272.790 | 446.675 | |
| S Tot | 2,212.903 | | | 0.000 | 0.000 | 881.935 | 5,000.000 | 2,272.790 | 2,272.790 | 446.675 | |
| After | 184.396 | | | 0.000 | 0.000 | 18.340 | .000 | 12.856 | 2,285.646 | 448.668 | |
| Total | 2,397.299 | | | 0.000 | 0.000 | 900.275 | 5,000.000 | 2,285.646 | 2,285.646 | 448.668 | |
| Evaluation Parameters (Gross) | | Expenses (Gross) | | Percent Interests | | Percent | Cum. Disc. | |
| | Initial | Final | Units | | Dei | n | Def | | Initial | Final | Units | | | | Final | | 5.00 | 1,181.848 | |
| Oil Rate | 22,812. | 453. | bbls/mo | | 96.3% | 1.20 | 0.0% | | 4,644. | 15,769. | $/w/mo | | Expense | 62.5000 | 62.5000 | | 8.00 | 709.432 | |
| Gas Rate | 68,437. | 1,359. | Mcf/mo | | 0.0% | 0.00 | 0.0% | | | | | | Revenue | | | | 10.00 | 448.668 | |
| GOR | 3,000. | 3,000. | scf/bbl | | | | | | | | | | Oil | 50.0000 | 50.0000 | | 12.00 | 222.022 | |
| NGL Rate | 1,342. | 93. | bbls/mo | | | | | | | | | | Gas | 50.0000 | 50.0000 | | 15.00 | -66.645 | |
| NGL Yield | 19.6 | 68.5 | bbl/MMcf | | | | | | | | | | | | | | 20.00 | -445.275 | |
| Gas Shrinkage | 81.0 | 31.6 | % | | | | | | | | | | | | | | | | |
| Oil Severance | 7.1 | 7.1 | % | | | | | | | | | | | | | | | | |
| Gas Severance | 7.9 | 7.9 | % | | | | | | | | | | | | | | | | |
| NGL Severance | 7.9 | 7.9 | % | | | | | | | | | | | | | | | | |
| Ad Valorem | 61.8 | | % | | | | | | | | | | | | | | | | |
| | Start Date: 07/2018 | 6 Months in year ‘18 | 20.042 Year Life (07/2038) |
THESE DATA ARE PART OF A CG&A REPORT AND ARE SUBJECT TO THE CONDITIONS IN THE TEXT OF THE REPORT.
TEXAS REGISTERED ENGINEERING FIRM F-693. | ASN 483 | DEFAULT 1/10/2018 10:34:19
OIL PUD
Table 20 |
Cawley, Gillespie & Associates, Inc.
APPENDIX
Explanatory Comments for Summary Tables
HEADINGS
Table I
Description of Table Information
Identity of Interest Evaluated
Property Description – Location
Reserve Classification and Development Status
Effective Date of Evaluation
| FORECAST | |
| (Columns) | |
| (1) (11) (21) | Calendar or Fiscal years/months commencing on effective date. |
| (2) (3) (4) | Gross Production (8/8th) for the years/months which are economical. These are expressed as thousands of barrels (Mbbl) and millions of cubic feet (MMcf) of gas at standard conditions. Total future production, cumulative production to effective date and ultimate recovery at the effective date are shown following the annual/monthly forecasts. |
| (5) (6) (7) | Net Production accruable to evaluated interest is calculated by multiplying the revenue interest times the gross production. These values take into account changes in interest and gas shrinkage. |
| (8) | Average (volume weighted) gross liquid price per barrel before deducting production-severance taxes. |
| (9) | Average (volume weighted) gross gas price per Mcf before deducting production-severance taxes. |
| (10) | Average (volume weighted) gross NGL price per barrel before deducting production-severance taxes. |
| (12) | Revenue derived from oil sales -- column (5) times column (8). |
| (13) | Revenue derived from gas sales -- column (6) times column (9). |
| (14) | Revenue derived from NGL sales -- column (7) times column (10). |
| (15) | Revenue derived from hedge positions. |
| (16) | Revenue derived from other sources not included in column (12) through column (15); may include revenue from electrical sales, pipeline gas transportation, 3rdparty saltwater disposal, etc. |
| (17) | Total Revenue – sum of column (12) through column (16). |
| (18) | Production-Severance taxes deducted from gross oil, gas and NGL revenue. |
| (19) | Ad Valorem taxes. |
| (20) | $/BOE6 – is the total of column (22), column (25), column (26), and column (27) divided by Barrels of Oil Equivalent (“BOE”). BOE is net oil production column (5) plus net gas production column (6) converted to oil at six Mcf gas per one bbl oil plus net NGL production column (7) converted to oil at one bbl NGL per 0.65 bbls of oil. |
| (22) | Operating Expenses are direct operating expenses to the evaluated working interest and may include combined fixed rate administrative overhead charges for operated oil and gas producers known as COPAS. |
| (23) | Average gross wells. |
| (24) | Average net wells are gross wells times working interest. |
| (25) | Workover Expenses are non-direct operating expenses and may include maintenance, well service, compressor, tubing, and pump repair. |
| (26) | 3rdParty COPAS are combined fixed rate administrative overhead charges for non-operated oil and gas producers. |
| (27) | Other Deductions may include compression-gathering expenses, transportation costs and water disposal costs. |
| (28) | Investments, if any, include re-completions, future drilling costs, pumping units, etc. and may include either tangible or intangible or both, and the costs for plugging and the salvage value of equipment at abandonment may be shown as negative investments at end of life. |
| (29) (30) | Future Net Cash Flow is column (17) less the total of column (18), column (19), column (22), column (25), column (26), column (27) and column (28). The data in column (29) are accumulated in column (30). Federal income taxes have not been considered. |
| (31) | Cumulative Discounted Cash Flowis calculated by discounting monthly cash flows at the specified annual rates. |
MISCELLANEOUS
| DCF Profile | • | The cumulative cash flow discounted at six different interest rates are shown at the bottom of columns (30-31). Interest has been compounded monthly. The DCF’s for the “Without Hedge” case may be shown to the left of the main DCF profile. |
| Life | • | The economic life of the appraised property is noted in the lower right-hand corner of the table. |
| Footnotes | • | Comments regarding the evaluation may be shown in the lower left-hand footnotes. |
| Price Deck | • | A table of oil and gas prices, price caps and escalation rates may be shown in the lower middle footnotes. |
| Differentials | • | Total annual price adjustments may be shown in gray font to the left of column (8), column (9) and column (10). |
Appendix
| | Cawley, Gillespie & Associates, Inc. | Page 1 |
APPENDIX
Methods Employed in the Estimation of Reserves
The four methods customarily employed in the estimation of reserves are (1)production performance, (2)material balance, (3)volumetricand (4)analogy. Most estimates, although based primarily on one method, utilize other methods depending on the nature and extent of the data available and the characteristics of the reservoirs.
Basic information includes production, pressure, geological and laboratory data. However, a large variation exists in the quality, quantity and types of information available on individual properties. Operators are generally required by regulatory authorities to file monthly production reports andmaybe required to measure and report periodically such data as well pressures, gas-oil ratios, well tests, etc. As a general rule, an operator has complete discretion in obtaining and/or making available geological and engineering data. The resulting lack of uniformity in data renders impossible the application of identical methods to all properties, and may result in significant differences in the accuracy and reliability of estimates.
A brief discussion of each method, its basis, data requirements, applicability and generalization as to its relative degree of accuracy follows:
Production performance. This method employs graphical analyses of production data on the premise that all factors which have controlled the performance to date will continue to control and that historical trends can be extrapolated to predict future performance. The only information required is production history. Capacity production can usually be analyzed from graphs of rates versus time or cumulative production. This procedure is referred to as "decline curve" analysis. Both capacity and restricted production can, in some cases, be analyzed from graphs of producing rate relationships of the various production components. Reserve estimates obtained by this method are generally considered to have a relatively high degree of accuracy with the degree of accuracy increasing as production history accumulates.
Material balance. This method employs the analysis of the relationship of production and pressure performance on the premise that the reservoir volume and its initial hydrocarbon content are fixed and that this initial hydrocarbon volume and recoveries therefrom can be estimated by analyzing changes in pressure with respect to production relationships. This method requires reliable pressure and temperature data, production data, fluid analyses and knowledge of the nature of the reservoir. The material balance method is applicable to all reservoirs, but the time and expense required for its use is dependent on the nature of the reservoir and its fluids. Reserves for depletion type reservoirs can be estimated from graphs of pressures corrected for compressibility versus cumulative production, requiring only data that are usually available. Estimates for other reservoir types require extensive data and involve complex calculations most suited to computer models which makes this method generally applicable only to reservoirs where there is economic justification for its use. Reserve estimates obtained by this method are generally considered to have a degree of accuracy that is directly related to the complexity of the reservoir and the quality and quantity of data available.
Volumetric. This method employs analyses of physical measurements of rock and fluid properties to calculate the volume of hydrocarbons in-place. The data required are well information sufficient to determine reservoir subsurface datum, thickness, storage volume, fluid content and location. The volumetric method is most applicable to reservoirs which are not susceptible to analysis by production performance or material balance methods. These are most commonly newly developed and/or no-pressure depleting reservoirs. The amount of hydrocarbons in-place that can be recovered is not an integral part of the volumetric calculations but is an estimate inferred by other methods and a knowledge of the nature of the reservoir. Reserve estimates obtained by this method are generally considered to have a low degree of accuracy; but the degree of accuracy can be relatively high where rock quality and subsurface control is good and the nature of the reservoir is uncomplicated.
Analogy. This method which employs experience and judgment to estimate reserves, is based on observations of similar situations and includes consideration of theoretical performance. The analogy method is a common approach used for “resource plays,” where an abundance of wells with similar production profiles facilitates the reliable estimation of future reserves with a relatively high degree of accuracy. The analogy method may also be applicable where the data are insufficient or so inconclusive that reliable reserve estimates cannot be made by other methods. Reserve estimates obtained in this manner are generally considered to have a relatively low degree of accuracy.
Much of the information used in the estimation of reserves is itself arrived at by the use of estimates. These estimates are subject to continuing change as additional information becomes available. Reserve estimates which presently appear to be correct may be found to contain substantial errors as time passes and new information is obtained about well and reservoir performance.
Appendix
| | Cawley, Gillespie & Associates, Inc. | Page 2 |
APPENDIX
Reserve Definitions and Classifications
The Securities and Exchange Commission, in SX Reg. 210.4-10 dated November 18, 1981, as amended on September 19, 1989 and January 1, 2010, requires adherence to the following definitions of oil and gas reserves:
"(22) Proved oil and gas reserves. Proved oil and gas reserves are those quantities of oil and gas, which, by analysis of geoscience and engineering data, can be estimated with reasonable certainty to be economically producible—from a given date forward, from known reservoirs, and under existing economic conditions, operating methods, and government regulations— prior to the time at which contracts providing the right to operate expire, unless evidence indicates that renewal is reasonably certain, regardless of whether deterministic or probabilistic methods are used for the estimation. The project to extract the hydrocarbons must have commenced or the operator must be reasonably certain that it will commence the project within a reasonable time.
"(i) The area of a reservoir considered as proved includes: (A) The area identified by drilling and limited by fluid contacts, if any, and (B) Adjacent undrilled portions of the reservoir that can, with reasonable certainty, be judged to be continuous with it and to contain economically producible oil or gas on the basis of available geoscience and engineering data.
"(ii) In the absence of data on fluid contacts, proved quantities in a reservoir are limited by the lowest known hydrocarbons (LKH) as seen in a well penetration unless geoscience, engineering, or performance data and reliable technology establishes a lower contact with reasonable certainty.
"(iii) Where direct observation from well penetrations has defined a highest known oil (HKO) elevation and the potential exists for an associated gas cap, proved oil reserves may be assigned in the structurally higher portions of the reservoir only if geoscience, engineering, or performance data and reliable technology establish the higher contact with reasonable certainty.
"(iv) Reserves which can be produced economically through application of improved recovery techniques (including, but not limited to, fluid injection) are included in the proved classification when: (A) Successful testing by a pilot project in an area of the reservoir with properties no more favorable than in the reservoir as a whole, the operation of an installed program in the reservoir or an analogous reservoir, or other evidence using reliable technology establishes the reasonable certainty of the engineering analysis on which the project or program was based; and (B) The project has been approved for development by all necessary parties and entities, including governmental entities.
"(v) Existing economic conditions include prices and costs at which economic producibility from a reservoir is to be determined. The price shall be the average price during the 12-month period prior to the ending date of the period covered by the report, determined as an unweighted arithmetic average of the first-day-of-the-month price for each month within such period, unless prices are defined by contractual arrangements, excluding escalations based upon future conditions.
"(6) Developed oil and gas reserves.Developed oil and gas reserves are reserves of any category that can be expected to be recovered:
“(i) Through existing wells with existing equipment and operating methods or in which the cost of the required equipment is relatively minor compared to the cost of a new well; and
“(ii) Through installed extraction equipment and infrastructure operational at the time of the reserves estimate if the extraction is by means not involving a well.
"(31) Undeveloped oil and gas reserves.Undeveloped oil and gas reserves are reserves of any category that are expected to be recovered from new wells on undrilled acreage, or from existing wells where a relatively major expenditure is required for recompletion.
“(i) Reserves on undrilled acreage shall be limited to those directly offsetting development spacing areas that are reasonably certain of production when drilled, unless evidence using reliable technology exists that establishes reasonable certainty of economic producibility at greater distances.
“(ii) Undrilled locations can be classified as having undeveloped reserves only if a development plan has been adopted indicating that they are scheduled to be drilled within five years, unless the specific circumstances, justify a longer time.
“(iii) Under no circumstances shall estimates for undeveloped reserves be attributable to any acreage for which an application of fluid injection or other improved recovery technique is contemplated, unless such techniques have been proved effective by actual projects in the same reservoir or an analogous reservoir, as defined in paragraph (a)(2) of this section, or by other evidence using reliable technology establishing reasonable certainty.
Appendix
| | Cawley, Gillespie & Associates, Inc. | Page 3 |
"(18) Probable reserves.Probable reserves are those additional reserves that are less certain to be recovered than proved reserves but which, together with proved reserves, are as likely as not to be recovered.
“(i) When deterministic methods are used, it is as likely as not that actual remaining quantities recovered will exceed the sum of estimated proved plus probable reserves. When probabilistic methods are used, there should be at least a 50% probability that the actual quantities recovered will equal or exceed the proved plus probable reserves estimates.
“(ii) Probable reserves may be assigned to areas of a reservoir adjacent to proved reserves where data control or interpretations of available data are less certain, even if the interpreted reservoir continuity of structure or productivity does not meet the reasonable certainty criterion. Probable reserves may be assigned to areas that are structurally higher than the proved area if these areas are in communication with the proved reservoir.
“(iii) Probable reserves estimates also include potential incremental quantities associated with a greater percentage recovery of the hydrocarbons in place than assumed for proved reserves.
“(iv) See also guidelines in paragraphs (17)(iv) and (17)(vi) of this section (below).
"(17) Possible reserves.Possible reserves are those additional reserves that are less certain to be recovered than probable reserves.
“(i) When deterministic methods are used, the total quantities ultimately recovered from a project have a low probability of exceeding proved plus probable plus possible reserves. When probabilistic methods are used, there should be at least a 10% probability that the total quantities ultimately recovered will equal or exceed the proved plus probable plus possible reserves estimates.
“(ii) Possible reserves may be assigned to areas of a reservoir adjacent to probable reserves where data control and interpretations of available data are progressively less certain. Frequently, this will be in areas where geoscience and engineering data are unable to define clearly the area and vertical limits of commercial production from the reservoir by a defined project.
“(iii) Possible reserves also include incremental quantities associated with a greater percentage recovery of the hydrocarbons in place than the recovery quantities assumed for probable reserves.
“(iv) The proved plus probable and proved plus probable plus possible reserves estimates must be based on reasonable alternative technical and commercial interpretations within the reservoir or subject project that are clearly documented, including comparisons to results in successful similar projects.
“(v) Possible reserves may be assigned where geoscience and engineering data identify directly adjacent portions of a reservoir within the same accumulation that may be separated from proved areas by faults with displacement less than formation thickness or other geological discontinuities and that have not been penetrated by a wellbore, and the registrant believes that such adjacent portions are in communication with the known (proved) reservoir. Possible reserves may be assigned to areas that are structurally higher or lower than the proved area if these areas are in communication with the proved reservoir.
“(vi) Pursuant to paragraph (22)(iii) of this section (above), where direct observation has defined a highest known oil (HKO) elevation and the potential exists for an associated gas cap, proved oil reserves should be assigned in the structurally higher portions of the reservoir above the HKO only if the higher contact can be established with reasonable certainty through reliable technology. Portions of the reservoir that do not meet this reasonable certainty criterion may be assigned as probable and possible oil or gas based on reservoir fluid properties and pressure gradient interpretations.”
Instruction 4 of Item 2(b) of Securities and Exchange Commission Regulation S-K was revised January 1, 2010 to state that "a registrant engaged in oil and gas producing activities shall provide the information required by Subpart 1200 of Regulation S–K." This is relevant in that Instruction 2 to paragraph (a)(2) states: “The registrant ispermitted, but not required, to disclose probable or possible reserves pursuant to paragraphs (a)(2)(iv) through (a)(2)(vii) of this Item.”
"(26) Reserves.Reserves are estimated remaining quantities of oil and gas and related substances anticipated to be economically producible, as of a given date, by application of development projects to known accumulations. In addition, there must exist, or there must be a reasonable expectation that there will exist, the legal right to produce or a revenue interest in the production, installed means of delivering oil and gas or related substances to market, and all permits and financing required to implement the project.
“Note to paragraph (26): Reserves should not be assigned to adjacent reservoirs isolated by major, potentially sealing, faults until those reservoirs are penetrated and evaluated as economically producible. Reserves should not be assigned to areas that are clearly separated from a known accumulation by a non-productive reservoir (i.e., absence of reservoir, structurally low reservoir, or negative test results). Such areas may contain prospective resources (i.e., potentially recoverable resources from undiscovered accumulations).”
Appendix
| | Cawley, Gillespie & Associates, Inc. | Page 4 |
CAWLEY, GILLESPIE& ASSOCIATES, INC.
PETROLEUM CONSULTANTS
13640 BRIARWICK DRIVE, SUITE 100 AUSTIN, TEXAS 78729-1107 | 306 WEST SEVENTH STREET, SUITE 302
FORT WORTH, TEXAS 76102-4987 | 1000 LOUISIANA STREET, SUITE 1900 HOUSTON, TEXAS 77002-5008 |
| 512-249-7000 | 817- 336-2461 | 713-651-9944 |
| | www.cgaus.com | |
Professional Qualifications of Primary Technical Person
The evaluation summarized by this report was conducted by a proficient team of geologists and reservoir engineers who integrate geological, geophysical, engineering and economic data to produce high quality reserve estimates and economic forecasts. This report was supervised by Todd Brooker, President of Cawley, Gillespie & Associates (CG&A).
Prior to joining CG&A, Mr. Brooker worked in Gulf of Mexico drilling and production engineering at Chevron. Mr. Brooker has been an employee of CG&A since 1992. His responsibilities include reserve and economic evaluations, fair market valuations, field studies, pipeline resource studies and acquisition/divestiture analysis. His reserve reports are routinely used for public company SEC disclosures. His experience includes significant projects in both conventional and unconventional resources in every major U.S. producing basin and abroad, including oil and gas shale plays, coalbed methane fields, waterfloods and complex, faulted structures.
Mr. Brooker graduated with honors from the University of Texas at Austin in 1989 with a Bachelor of Science degree in Petroleum Engineering, and is a registered Professional Engineer in the State of Texas. He is also a member of the Society of Petroleum Engineers.
Based on his educational background, professional training and more than 20 years of experience, Mr. Brooker and CG&A continue to deliver professional, ethical and reliable engineering and geological services to the petroleum industry.
| | CAWLEY, GILLESPIE & ASSOCIATES, INC. |
| | TEXASREGISTEREDENGINEERINGFIRMF-693 |