
1st Quarter 2019 Earnings Presentation NYSE American | LLEX Joseph Daches, President and CFO
Disclaimer – Forward-Looking Statements This presentation contains forward-looking statements. The use of words such as “believes”, “expects”, “anticipates”, “intends”, “plans”, “estimates”, “should”, “likely” or similar expressions, indicates a forward-looking statement. These statements and all the projections in this presentation are subject to risks and uncertainties and are based on the beliefs and assumptions of management, and information currently available to management. The actual results could differ materially from a conclusion, forecast or projection in the forward-looking information. The identification in this presentation of factors that may affect Lilis’ future performance and the accuracy of forward-looking statements is meant to be illustrative and by no means exhaustive. These forward-looking statements are given only as of the date of this presentation. Except as required by law, we do not intend, and undertake no obligations, to update any forward-looking statements. All forward-looking statements should be evaluated with the understanding of their inherent uncertainty. These forward-looking statements include, among other things, statements about Lilis’ expectations, beliefs, intentions or business strategies for the future, statements concerning Lilis’ outlook with regard to the timing and amount of future production of oil, natural gas liquids and natural gas, price realizations, the nature and timing of capital expenditures for exploration and development, plans for funding operations and drilling program capital expenditures, the timing and success of specific projects, operating costs and other expenses, proved oil and natural gas reserves, liquidity and capital resources, outcomes and effects of litigation, claims and disputes and derivative activities. Factors that could cause Lilis’ actual results to differ materially from those expressed or implied by forward-looking statements include, but are not limited to: the success of Lilis’ exploration and development efforts; the price of oil, gas and other produced gases and liquids; the worldwide economic situation; changes in interest rates or inflation; the ability of Lilis to transport gas, oil and other products; the ability of Lilis to raise additional capital, as it may be affected by current conditions in the stock market and competition in the oil and gas industry for risk capital; Lilis’ capital costs, which may be affected by delays or cost overruns; cost of production; environmental and other regulations, as the same presently exist or may later be amended; Lilis’ ability to identify, finance and integrate any future acquisitions; and the volatility of Lilis’ stock price. See the risks discussed in Lilis’ Annual Report on Form 10-K and Quarterly Reports on Form 10-Q. RECONCILIATION OF NET INCOME (LOSS) TO ADJUSTED EBITDAX (UNAUDITED) Adjusted EBITDAX (as defined below) is presented herein and reconciled from the GAAP measure of Net Income because of its wide acceptance by the investment community as a financial indicator. The Company defines Adjusted EBITDAX as net income, plus (1) exploration and abandonments expense, (2) depreciation, depletion and amortization expense, (3) accretion of discount on asset retirement obligations expense, (4) non-cash stock-based compensation expense, (5) unrealized (gain) loss on derivatives, (6) gain on disposition of assets, net, (7) interest expense, (8) loss on extinguishment of debt, (9) gain on equity method investment distribution and (10) federal and state income tax expense. Adjusted EBITDAX is not a measure of net income or cash flows as determined by GAAP. The Company’s Adjusted EBITDAX measure provides additional information which may be used to better understand the Company’s operations. Adjusted EBITDAX is one of several metrics that the Company uses as a supplemental financial measurement in the evaluation of its business and should not be considered as an alternative to, or more meaningful than, net income as an indicator of operating performance. Certain items excluded from Adjusted EBITDAX are significant components in understanding and assessing a company’s financial performance, such as a company’s cost of capital and tax structure, as well as the historic cost of depreciable and depletable assets. Adjusted EBITDAX, as used by the Company, may not be comparable to similarly titled measures reported by other companies. The Company believes that Adjusted EBITDAX is a widely followed measure of operating performance and is one of many metrics used by the Company’s management team and by other users of the Company’s consolidated financial statements. For example, Adjusted EBITDAX can be used to assess the Company’s operating performance and return on capital in comparison to other independent exploration and production companies without regard to financial or capital structure, and to assess the financial performance of the Company’s assets and the Company without regard to capital structure or historical cost basis. 2

LLEX First Quarter 2019 Highlights & Achievements • 1Q’19 oil production of 3.5 MBbls/d (+52% YoY), total production of 6.1 MBOE/d (+75% YoY) LLEX Continues • 1Q’19 oil, natural gas, and NGL sales revenue increased 23% YoY to $17.7MM to Demonstrate • Sales volumes were 72% Liquids, including 58% crude oil, for the quarter ended March 31, 2019 Improving Financial • Reduced recurring LOE from $10.08/BOE in 1Q’18 to $7.26/BOE in 1Q’19 Metrics & • 1Q’19 Adj. EBITDAX of $6.5MM, up 45% YoY Growth • Significantly decreased indebtedness during the first quarter of 2019 through the exchange and conversion of the Second Lien Term Loans • Reduced crude transportation costs from $5.15/Bbl in December 2018, to $0.75/Bbl in March 2019 Enhanced • Reduced salt water disposal costs per BOE from $4.43/BOE in 1Q’18 to $2.98/BOE in 1Q’19 Economics • Realized crude oil pricing of 84% of WTI for the quarter included 93% of WTI realized during March 2019, which resulted in a ~$16.50 per barrel improvement compared to January 2019 • Strong, consistent Bone Spring production results from the Tiger 3H and AG Hill 2H, establishing highly economic Bone Spring type curve Technical Value • Successfully executed Wolfcamp A spacing test with Haley 1H and 2H, realizing cost efficiencies and Drivers delivering strong initial results • Monitoring operated and offset operator data, developing choke management and flowback strategy to maximize NPV and IRRs 3
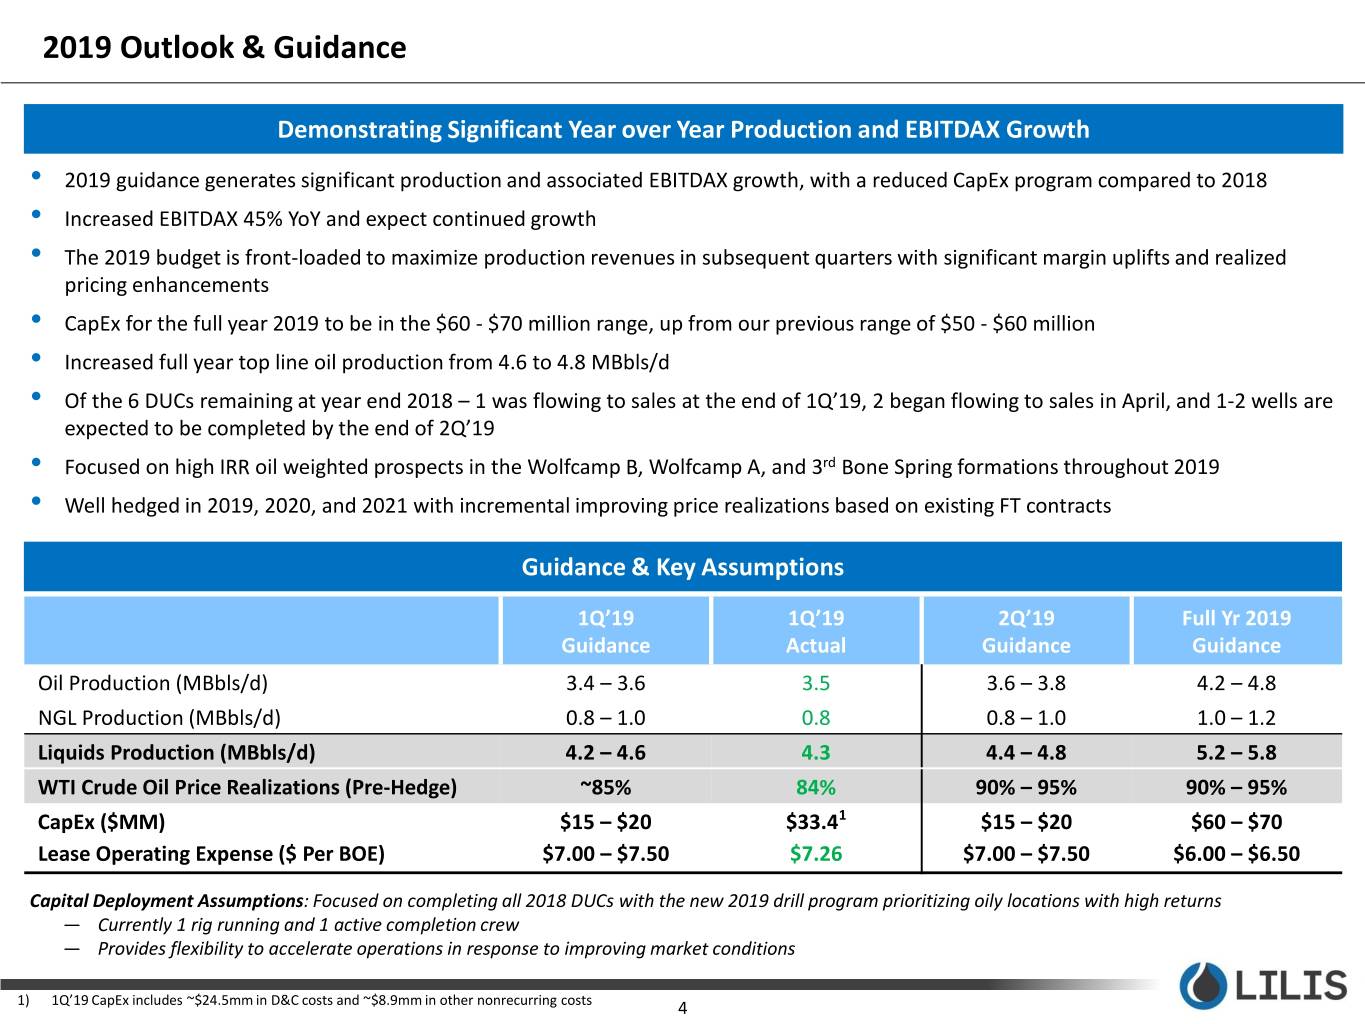
2019 Outlook & Guidance Demonstrating Significant Year over Year Production and EBITDAX Growth • 2019 guidance generates significant production and associated EBITDAX growth, with a reduced CapEx program compared to 2018 • Increased EBITDAX 45% YoY and expect continued growth • The 2019 budget is front-loaded to maximize production revenues in subsequent quarters with significant margin uplifts and realized pricing enhancements • CapEx for the full year 2019 to be in the $60 - $70 million range, up from our previous range of $50 - $60 million • Increased full year top line oil production from 4.6 to 4.8 MBbls/d • Of the 6 DUCs remaining at year end 2018 – 1 was flowing to sales at the end of 1Q’19, 2 began flowing to sales in April, and 1-2 wells are expected to be completed by the end of 2Q’19 • Focused on high IRR oil weighted prospects in the Wolfcamp B, Wolfcamp A, and 3rd Bone Spring formations throughout 2019 • Well hedged in 2019, 2020, and 2021 with incremental improving price realizations based on existing FT contracts Guidance & Key Assumptions 1Q’19 1Q’19 2Q’19 Full Yr 2019 Guidance Actual Guidance Guidance Oil Production (MBbls/d) 3.4 – 3.6 3.5 3.6 – 3.8 4.2 – 4.8 NGL Production (MBbls/d) 0.8 – 1.0 0.8 0.8 – 1.0 1.0 – 1.2 Liquids Production (MBbls/d) 4.2 – 4.6 4.3 4.4 – 4.8 5.2 – 5.8 WTI Crude Oil Price Realizations (Pre-Hedge) ~85% 84% 90% – 95% 90% – 95% CapEx ($MM) $15 – $20 $33.41 $15 – $20 $60 – $70 Lease Operating Expense ($ Per BOE) $7.00 – $7.50 $7.26 $7.00 – $7.50 $6.00 – $6.50 Capital Deployment Assumptions: Focused on completing all 2018 DUCs with the new 2019 drill program prioritizing oily locations with high returns — Currently 1 rig running and 1 active completion crew — Provides flexibility to accelerate operations in response to improving market conditions 1) 1Q’19 CapEx includes ~$24.5mm in D&C costs and ~$8.9mm in other nonrecurring costs 4
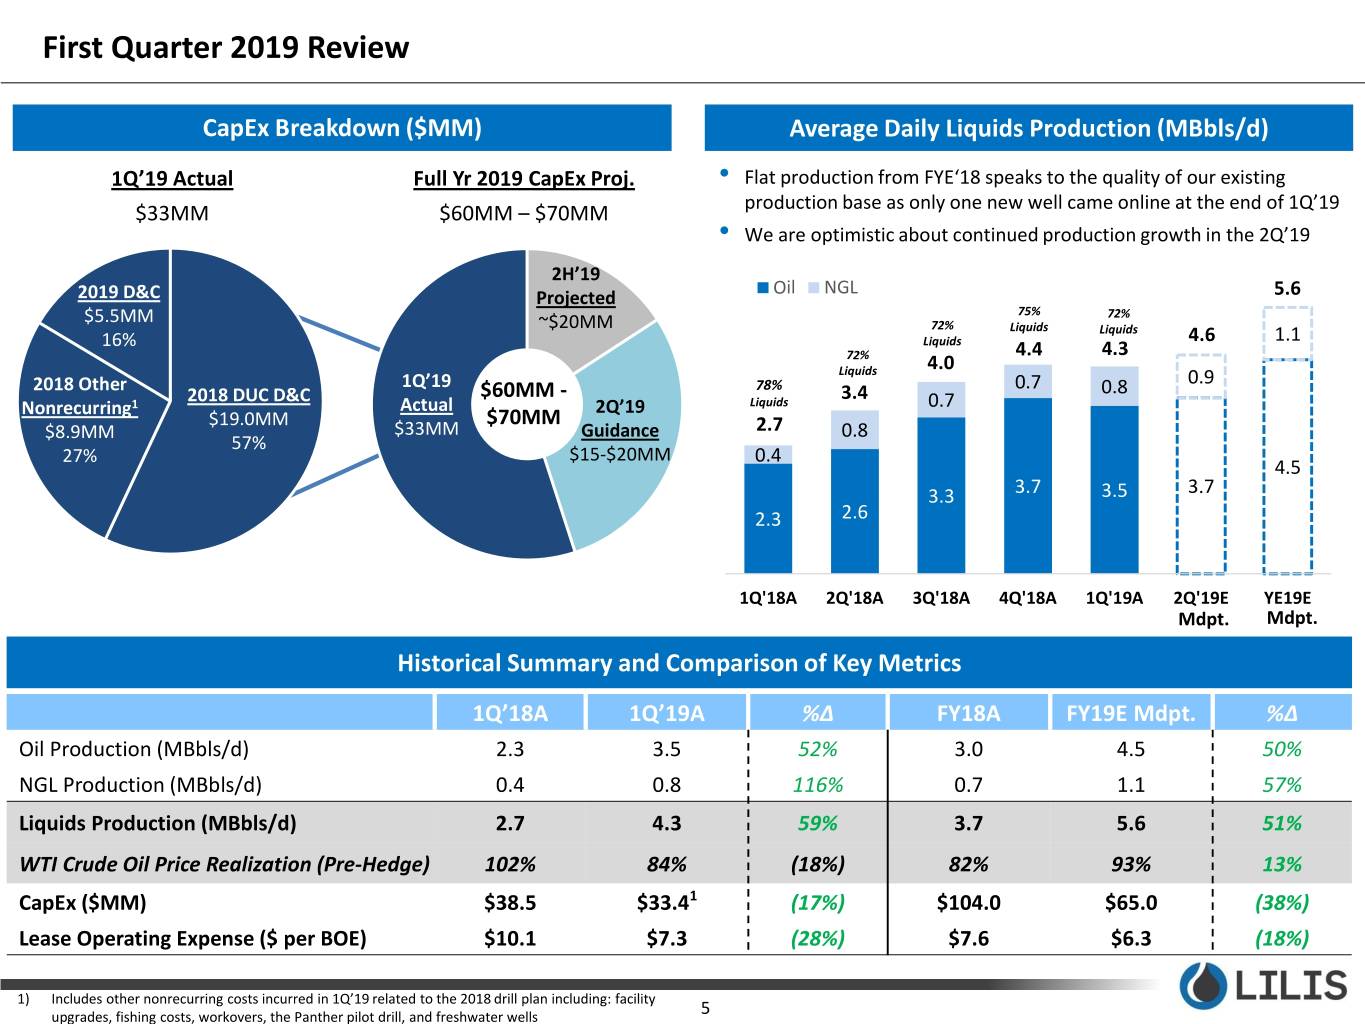
First Quarter 2019 Review CapEx Breakdown ($MM) Average Daily Liquids Production (MBbls/d) 1Q’19 Actual Full Yr 2019 CapEx Proj. • Flat production from FYE‘18 speaks to the quality of our existing $33MM $60MM – $70MM production base as only one new well came online at the end of 1Q’19 • We are optimistic about continued production growth in the 2Q’19 2H’19 Oil NGL 2019 D&C Projected 5.6 $5.5MM 75% 72% ~$20MM 72% Liquids Liquids 16% Liquids 4.6 1.1 72% 4.4 4.3 Liquids 4.0 2018 Other 1Q’19 78% 0.7 0.9 2018 DUC D&C $60MM - 3.4 0.8 Nonrecurring1 Actual 2Q’19 Liquids 0.7 $19.0MM $70MM $8.9MM $33MM Guidance 2.7 0.8 57% 27% $15-$20MM 0.4 4.5 3.3 3.7 3.5 3.7 2.3 2.6 1Q'18A 2Q'18A 3Q'18A 4Q'18A 1Q'19A 2Q'19E YE19E Mdpt. Mdpt. Historical Summary and Comparison of Key Metrics 1Q’18A 1Q’19A %Δ FY18A FY19E Mdpt. %Δ Oil Production (MBbls/d) 2.3 3.5 52% 3.0 4.5 50% NGL Production (MBbls/d) 0.4 0.8 116% 0.7 1.1 57% Liquids Production (MBbls/d) 2.7 4.3 59% 3.7 5.6 51% WTI Crude Oil Price Realization (Pre-Hedge) 102% 84% (18%) 82% 93% 13% CapEx ($MM) $38.5 $33.41 (17%) $104.0 $65.0 (38%) Lease Operating Expense ($ per BOE) $10.1 $7.3 (28%) $7.6 $6.3 (18%) 1) Includes other nonrecurring costs incurred in 1Q’19 related to the 2018 drill plan including: facility upgrades, fishing costs, workovers, the Panther pilot drill, and freshwater wells 5
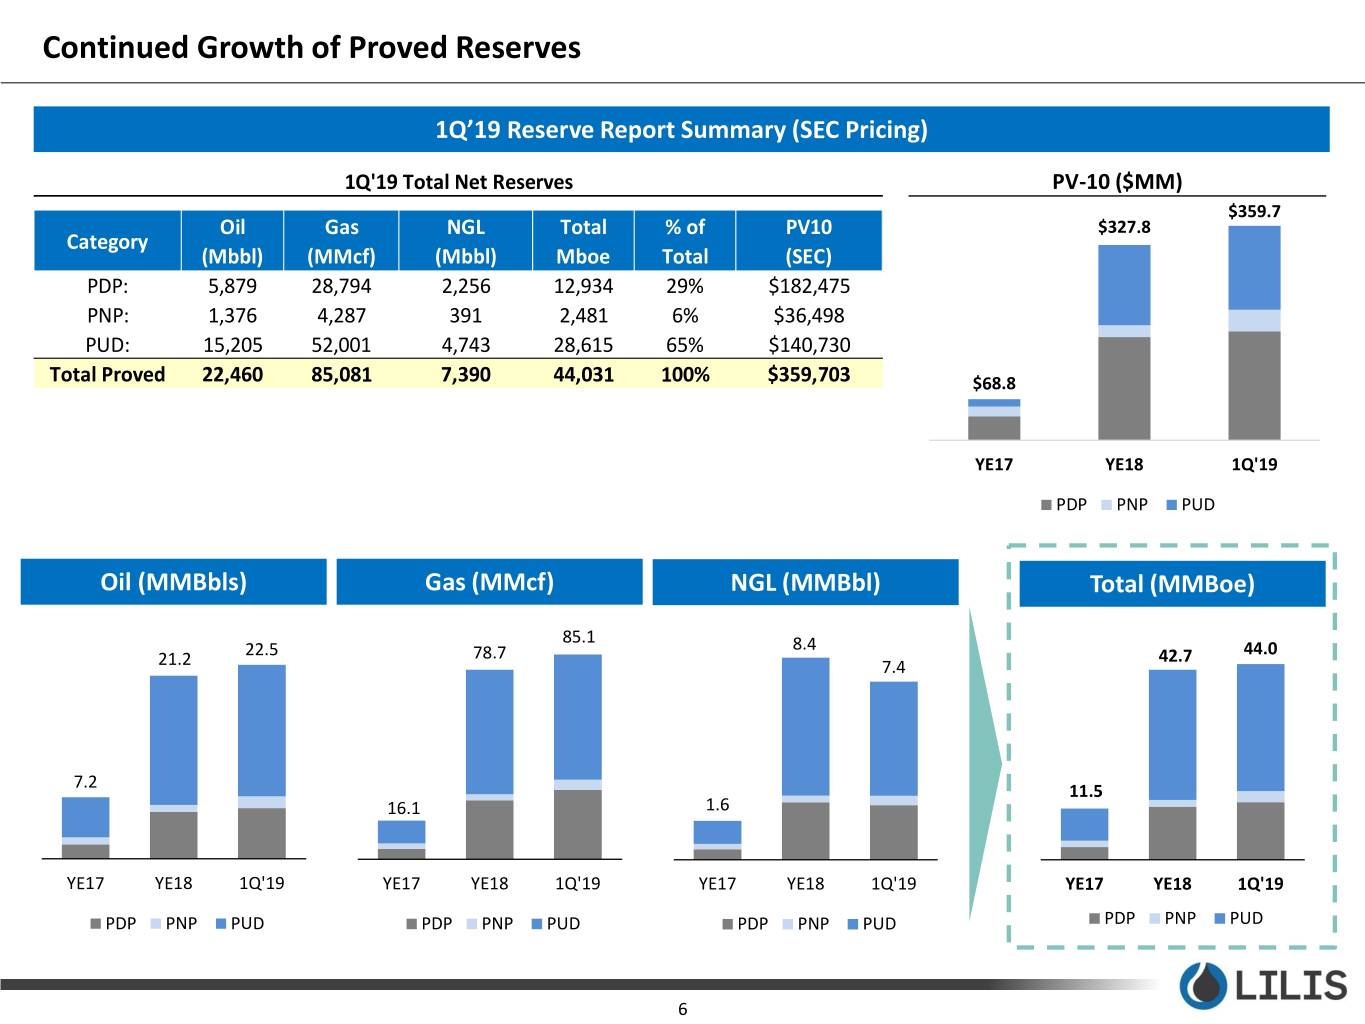
Continued Growth of Proved Reserves 1Q’19 Reserve Report Summary (SEC Pricing) 1Q'19 Total Net Reserves PV-10 ($MM) $359.7 Oil Gas NGL Total % of PV10 $327.8 Category (Mbbl) (MMcf) (Mbbl) Mboe Total (SEC) PDP: 5,879 28,794 2,256 12,934 29% $182,475 PNP: 1,376 4,287 391 2,481 6% $36,498 PUD: 15,205 52,001 4,743 28,615 65% $140,730 Total Proved 22,460 85,081 7,390 44,031 100% $359,703 $68.8 YE17 YE18 1Q'19 PDP PNP PUD Oil (MMBbls) Gas (MMcf) NGL (MMBbl) Total (MMBoe) 85.1 8.4 22.5 78.7 42.7 44.0 21.2 7.4 7.2 11.5 16.1 1.6 YE17 YE18 1Q'19 YE17 YE18 1Q'19 YE17 YE18 1Q'19 YE17 YE18 1Q'19 PDP PNP PUD PDP PNP PUD PDP PNP PUD PDP PNP PUD 6
Operations / Technical Update 7
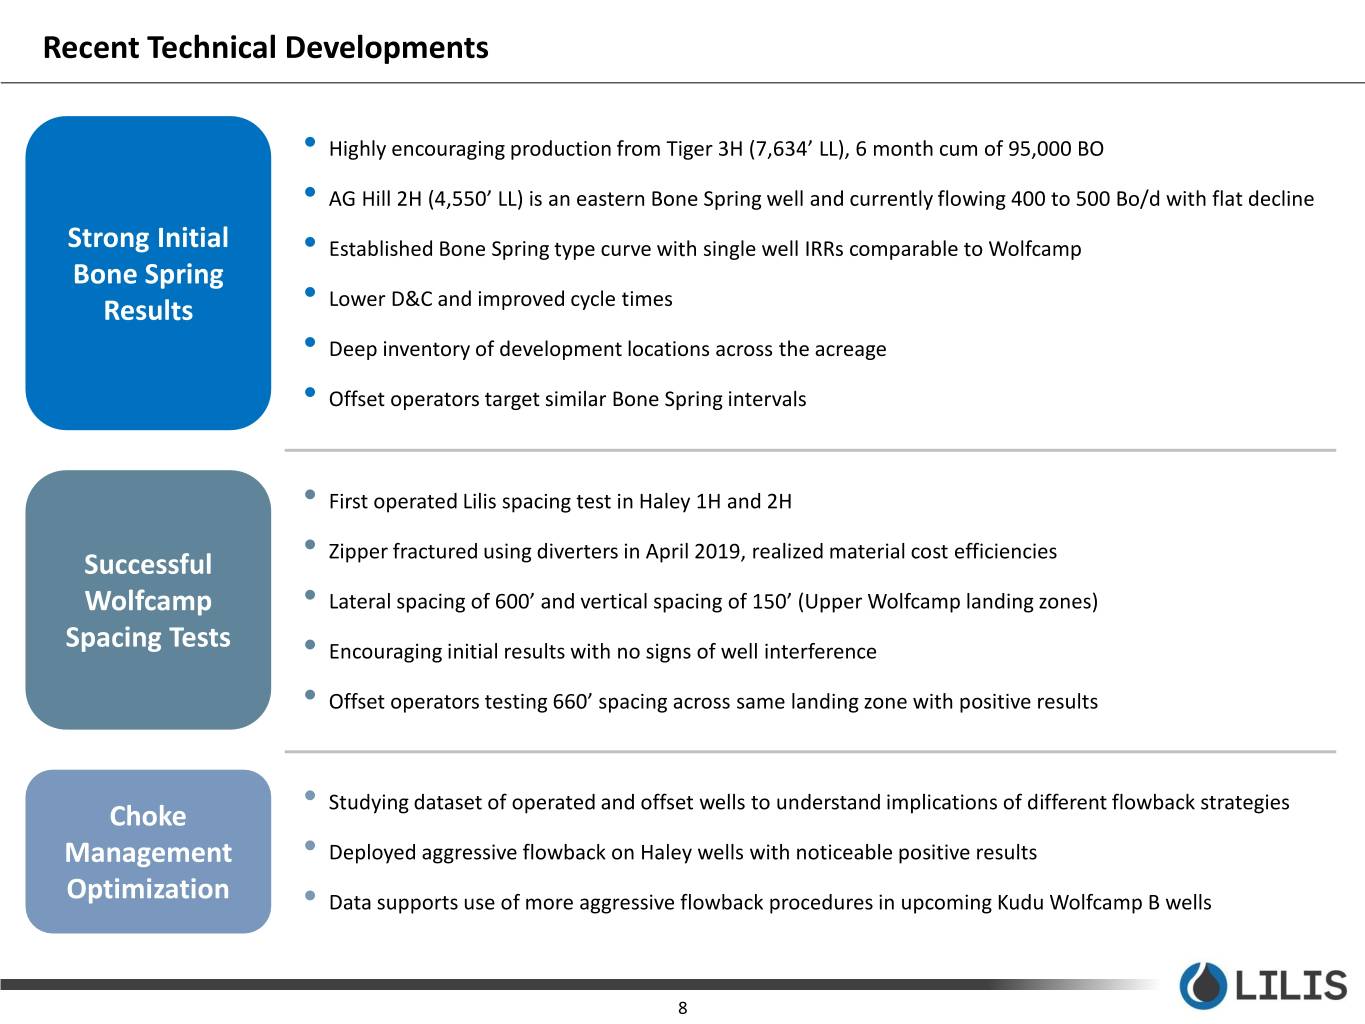
Recent Technical Developments • Highly encouraging production from Tiger 3H (7,634’ LL), 6 month cum of 95,000 BO • AG Hill 2H (4,550’ LL) is an eastern Bone Spring well and currently flowing 400 to 500 Bo/d with flat decline Strong Initial • Established Bone Spring type curve with single well IRRs comparable to Wolfcamp Bone Spring Results • Lower D&C and improved cycle times • Deep inventory of development locations across the acreage • Offset operators target similar Bone Spring intervals • First operated Lilis spacing test in Haley 1H and 2H Successful • Zipper fractured using diverters in April 2019, realized material cost efficiencies Wolfcamp • Lateral spacing of 600’ and vertical spacing of 150’ (Upper Wolfcamp landing zones) Spacing Tests • Encouraging initial results with no signs of well interference • Offset operators testing 660’ spacing across same landing zone with positive results Studying dataset of operated and offset wells to understand implications of different flowback strategies Choke • Management • Deployed aggressive flowback on Haley wells with noticeable positive results Optimization • Data supports use of more aggressive flowback procedures in upcoming Kudu Wolfcamp B wells 8

Technical – Highly Encouraging Bone Spring Results 1.5 mile Lateral, Cumulative Oil Production (Mbo) Bone Spring Type Log GR RT_MH 0 200 0.2 2000 BYCN 200 1.5 Mile BSPG T/C 180 Oil Max IP (Bbl/d) 850 7600 ) ) 160 Oil Di (%) 76 7800 140 B factor 1.2 Mbo GOR (SCF/Bbl) 6,500 8000 120 EUR Oil (MBbl) 527 BYCN_L2 100 EUR Gas (MMcf) 3,428 8200 BYCN_L3 80 EUR (MBOE 6:1) 1,099 8400 AVALONAvalon 60 8600 40 1ST_BNSPst 8800 1 Bone Cumulative Oil ( Cumulative Tiger 3H 20 BSPG 1.5 Mile TC FLOWBACK Spring 9000 0 0 50 100 150 200 250 300 350 400 9200 Days 9400 9600 2ND_BNSP Commentary 9800 2nd Bone 10000 Spring • Strong, sustained results from Tiger 3H (7,634’ LL) 3rd Bone Spring Shale well ― 6 month cum ~95 MBO, including 40 days of flowback ramp 10200 rd ― Offset operators have targeted similar 3 Bone Spring landing zones in Loving 2ND_BNSP_LWR 10400 and Winkler ― Current 1.5 mile BSPG type curve with EUR of ~530 MBO and ~3.5 BCF 10600 • AG Hill 2H (4,550’) targeted a shallower interval in the 2nd Bone Spring 10800 3rd Bone Spring 11000 ― Shut in for 3 months after initial flowback, pending facilities 3RD_BNSP_SD ― Currently flowing around 400 - 500 bopd with relatively flat decline 11200 ― Outperforms Tiger 3H on normalized 1.5 mile basis Current targets 11400 • Deep inventory of locations with 2+ landing zones in 2nd and 3rd Bone Spring 11600 TOP_WFMP Upside targets • Lower D&C and improved cycle time compared to deeper Wolfcamp wells 9
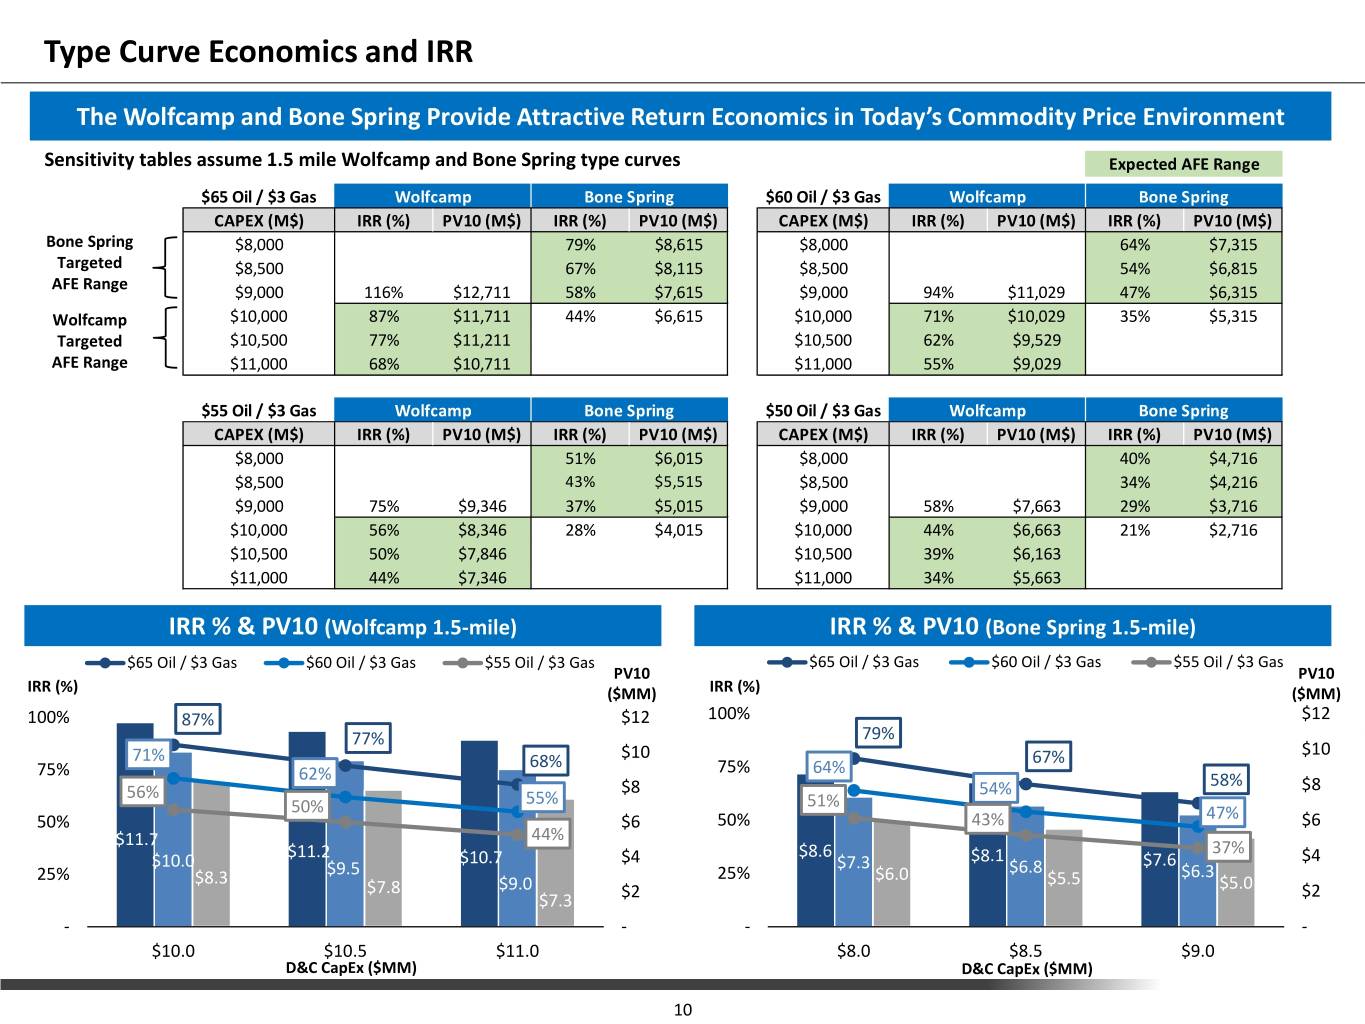
Type Curve Economics and IRR The Wolfcamp and Bone Spring Provide Attractive Return Economics in Today’s Commodity Price Environment Sensitivity tables assume 1.5 mile Wolfcamp and Bone Spring type curves Expected AFE Range $65 Oil / $3 Gas Wolfcamp Bone Spring $60 Oil / $3 Gas Wolfcamp Bone Spring CAPEX (M$) IRR (%) PV10 (M$) IRR (%) PV10 (M$) CAPEX (M$) IRR (%) PV10 (M$) IRR (%) PV10 (M$) Bone Spring $8,000 79% $8,615 $8,000 64% $7,315 Targeted $8,500 67% $8,115 $8,500 54% $6,815 AFE Range $9,000 116% $12,711 58% $7,615 $9,000 94% $11,029 47% $6,315 Wolfcamp $10,000 87% $11,711 44% $6,615 $10,000 71% $10,029 35% $5,315 Targeted $10,500 77% $11,211 $10,500 62% $9,529 AFE Range $11,000 68% $10,711 $11,000 55% $9,029 $55 Oil / $3 Gas Wolfcamp Bone Spring $50 Oil / $3 Gas Wolfcamp Bone Spring CAPEX (M$) IRR (%) PV10 (M$) IRR (%) PV10 (M$) CAPEX (M$) IRR (%) PV10 (M$) IRR (%) PV10 (M$) $8,000 51% $6,015 $8,000 40% $4,716 $8,500 43% $5,515 $8,500 34% $4,216 $9,000 75% $9,346 37% $5,015 $9,000 58% $7,663 29% $3,716 $10,000 56% $8,346 28% $4,015 $10,000 44% $6,663 21% $2,716 $10,500 50% $7,846 $10,500 39% $6,163 $11,000 44% $7,346 $11,000 34% $5,663 IRR % & PV10 (Wolfcamp 1.5-mile) IRR % & PV10 (Bone Spring 1.5-mile) $65 Oil / $3 Gas $60 Oil / $3 Gas $55 Oil / $3 Gas $65 Oil / $3 Gas $60 Oil / $3 Gas $55 Oil / $3 Gas PV10 PV10 IRR (%) ($MM) IRR (%) ($MM) 100% 87% $12 100% $12 77% 79% 71% $10 67% $10 75% 68% 75% 64% 62% 58% 56% $8 54% $8 50% 55% 51% 50% $6 50% 43% 47% $6 44% $11.7 37% $11.2 $10.7 $4 $8.6 $8.1 $4 $10.0 $9.5 $7.3 $6.8 $7.6 25% $8.3 25% $6.0 $5.5 $6.3 $7.8 $9.0 $5.0 $2 $7.3 $2 - - - - $10.0 $10.5 $11.0 $8.0 $8.5 $9.0 D&C CapEx ($MM) D&C CapEx ($MM) 10
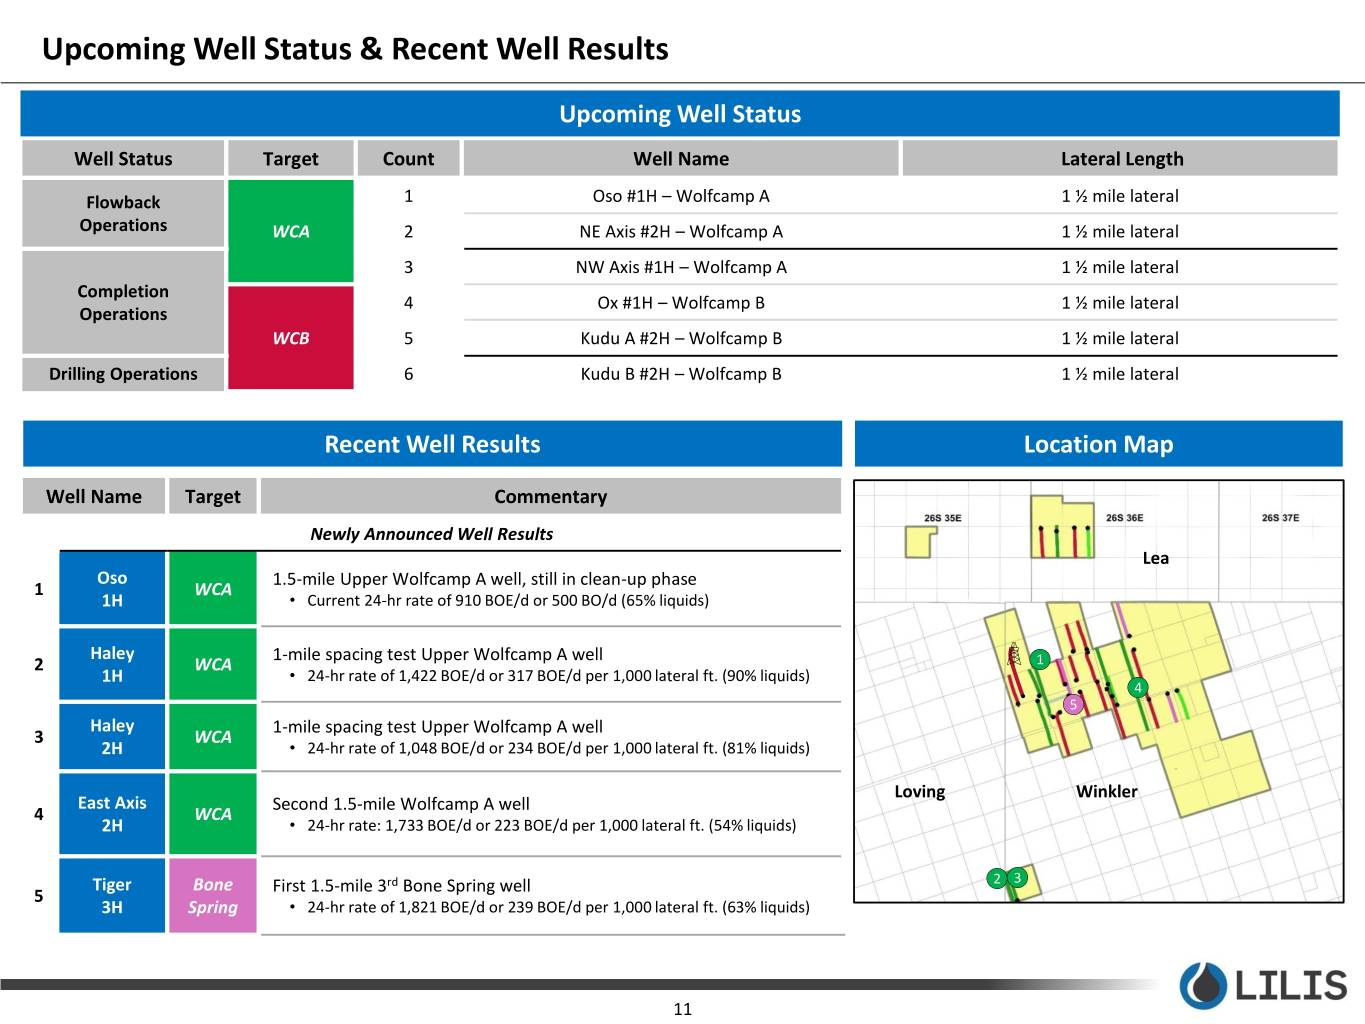
Upcoming Well Status & Recent Well Results Upcoming Well Status Well Status Target Count Well Name Lateral Length Flowback 1 Oso #1H – Wolfcamp A 1 ½ mile lateral Operations WCA 2 NE Axis #2H – Wolfcamp A 1 ½ mile lateral 3 NW Axis #1H – Wolfcamp A 1 ½ mile lateral Completion 4 Ox #1H – Wolfcamp B 1 ½ mile lateral Operations WCB 5 Kudu A #2H – Wolfcamp B 1 ½ mile lateral Drilling Operations 6 Kudu B #2H – Wolfcamp B 1 ½ mile lateral Recent Well Results Location Map Well Name Target Commentary Newly Announced Well Results Lea Oso 1.5-mile Upper Wolfcamp A well, still in clean-up phase 1 WCA 1H • Current 24-hr rate of 910 BOE/d or 500 BO/d (65% liquids) Haley 1-mile spacing test Upper Wolfcamp A well 2 WCA 1 1H • 24-hr rate of 1,422 BOE/d or 317 BOE/d per 1,000 lateral ft. (90% liquids) 4 5 Haley 1-mile spacing test Upper Wolfcamp A well 3 WCA 2H • 24-hr rate of 1,048 BOE/d or 234 BOE/d per 1,000 lateral ft. (81% liquids) Loving Winkler East Axis Second 1.5-mile Wolfcamp A well 4 WCA 2H • 24-hr rate: 1,733 BOE/d or 223 BOE/d per 1,000 lateral ft. (54% liquids) Tiger Bone First 1.5-mile 3rd Bone Spring well 2 3 5 3H Spring • 24-hr rate of 1,821 BOE/d or 239 BOE/d per 1,000 lateral ft. (63% liquids) 11

Midstream – Crude Infrastructure and Marketing Technical Update Crude Oil Infrastructure Highlights Gas & NGL Infrastructure Highlights Gathering System Gathering System • Imminent commissioning of initial system infrastructure connecting • Pipeline infrastructure in place connecting all dedicated producing wells to producing wells in Texas to gathering system for delivery to storage gathering system for transport to treating, processing and sale at Lucid’s terminal and long-haul interconnections in Wink, Texas Red Hills Plant in Lea County, New Mexico (Haley wells via Enterprise) • Initial system comprised of 8 receipt points with 11 additional receipt • Two high pressure receipt points, three low pressure receipt points and points in various stages of construction and planning one dual high/low pressure receipt points • Each receipt point contains a LACT unit and pump capable of handling • 29.5 miles of 8” and 10” buried steel pipeline 5,000 Bbls/d • Five 3516 NACE field compressors representing 6,900 horsepower and • 7 miles of 6” and 4” buried steel pipeline 35,000Mcfd capacity (current LP produced volume is ~28,000 Mcfd) Transportation Line and Wink Storage Terminal Processing Plant • 15 mile, 16” line from Lilis leasehold to Wink Storage Terminal in place and • Three cryogenic processing plants with capacity to process over ready for commissioning 500,000 Mcfd Interconnecting Long-Haul Pipelines • Interconnection in place and commissioned with Andeavor • Firm Transportation commitment on to-be-built EPIC Crude Pipeline estimated to be commissioned in 4Q’19 Crude Oil Marketing Gas & NGL Marketing Crude Sales at Inlet of SCM Gathering – Purchased by ARM Residue Gas – Sold by Lucid • Lilis has pre-sold crude to ARM at NYMEX WTI plus (i) NYMEX roll, plus (ii) • SoCal Index – 54% trade month differential of MEH less set differential basis through June • Waha Index – 43% 2025 (approximating 90-95% of WTI based on current strip) • EL Paso Permian (“EPP”) Index – 3% • Volumes range from 4,000 Bbld to 7,500 Bbld Natural Gas Liquids (NGLs) – Sold by Lucid Excess Crude Sales at Wink Terminal – Marketed by Lilis • Access with FT to multiple NGL markets provides optionality on liquids • Lilis has retained flexibility for volumes produced in excess of pre-sold separation sales (Enterprise, OneOK, DCP and Lonestar) crude described above • Ability determine optimal market to achieve maximum netback per Bbl 12
Appendix 13

Current Hedging Schedule Jan - Jun 2019 Jul - Dec 2019 2020 2021 WTI Oil Hedges Current Swap Volume (Bbl) - - 278,446 - Average Daily Swap Volume (Bbl/d) - - 761 - Average Price - - $56.21 - Current Collar Volume Long Put (Bbl) 437,000 368,000 149,890 270,838 Average Daily Collar Volume (Bbl/d) 2,417 2,000 410 742 Average Price $53.10 $53.75 50.00 50.00 Current Collar Volume Short Call (Bbl) 437,000 368,000 149,890 270,838 Average Daily Collar Volume (Bbl/d) 2,417 2,000 410 742 Average Price $67.28 $67.35 64.96 59.70 Current Collar Volume Short Put (Bbl) 181,000 276,000 - - Average Daily Collar Volume (Bbl/d) 1,000 1,500 - - Average Price $45.00 $45.00 - - Average Crude Ceiling $67.34 $67.35 $59.22 $59.69 Average Crude Floor $53.13 $53.75 $54.05 $50.00 NYMEX Natural Gas Hedges Current Swap Volume (Mmbtu) 712,806 832,881 1,489,738 376,602 Average Daily Swap Volume (Mmbtu/d) 7,833 6,770 5,418 4,184 Average Price $2.750 $2.750 $2.580 $2.77 Current Collar Volume Long Put (Mmbtu) 831,241 422,176 586,129 - Average Daily Collar Volume (Mmbtu/d) 9,235 6,923 6,441 - Average Price $3.250 $2.800 $2.80 - Current Collar Volume Short Call (Mmbtu) 831,241 422,176 586,129 - Average Daily Collar Volume (Mmbtu/d) 9,235 6,923 6,441 - Average Price $4.000 $3.060 $3.06 - Average Gas Ceiling $3.38 $2.85 $2.71 - Average Gas Floor $3.00 $2.77 $2.64 - Total Volume Hedged (Boe) 694,341 577,176 774,314 333,605 ~80% ,70%, & 60% of PDP crude Average Daily Volume (Boe/d) 3,839 3,137 2,116 917 oil volumes hedged in 2019, Average Daily Oil Volume (Bbl/d) 2,417 2,000 1,171 742 2020, & 2021 respectively Average Daily Gas Volume (Mmbtu/d) 8,534 6,821 5,674 1,046 14

Consolidated Statements of Operations For Three Months Ended March 31, 2019 2018 ($ in thousands, except share and per share data) Oil and gas revenue $ 17,697 $ 14,395 Operating expenses: Production costs 4,764 3,263 Gathering, processing and transportation 1,178 462 Production taxes 906 850 General and administrative 9,679 10,464 Depreciation, depletion, amortization and accretion 8,153 4,641 Total operating expenses 24,680 19,680 Operating income (loss) (6,983) (5,285) Other income (expense): Other income (expense) 31 1 Loss from commodity derivative (10,577) (1,769) Fair value change in derivative instruments (335) 28,388 Interest expense (4,828) (9,089) Total other income (expense) (15,709) 17,531 Net loss before income tax (22,692) 12,246 Paid-in-kind dividends on preferred stock (4,825) (1,652)) Net income (loss) $ (27,517) $ 10,594 Net loss per common share: Basic $ (0.35) $ 0.14 Diluted $ (0.35) $ (0.17) Weighted average common shares outstanding: Basic 77,916,448 54,702,617 Diluted 77,916,448 78,502,197 15
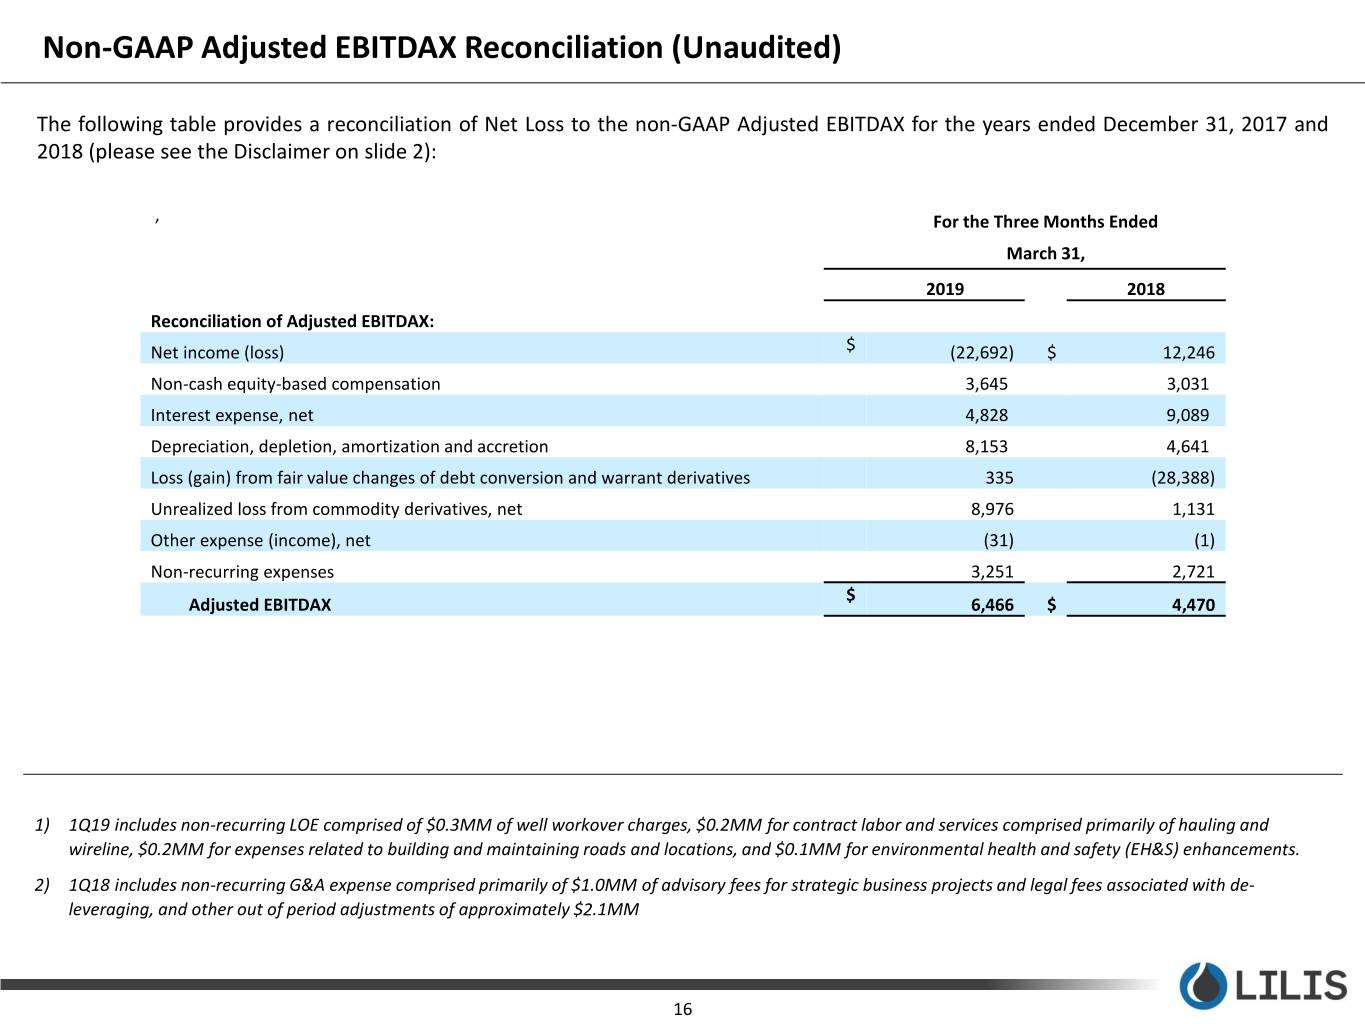
Non-GAAP Adjusted EBITDAX Reconciliation (Unaudited) The following table provides a reconciliation of Net Loss to the non-GAAP Adjusted EBITDAX for the years ended December 31, 2017 and 2018 (please see the Disclaimer on slide 2): ’ For the Three Months Ended March 31, 2019 2018 Reconciliation of Adjusted EBITDAX: Net income (loss) $ (22,692) $ 12,246 Non-cash equity-based compensation 3,645) 3,031) Interest expense, net 4,828) 9,089) Depreciation, depletion, amortization and accretion 8,153) 4,641) Loss (gain) from fair value changes of debt conversion and warrant derivatives 335 (28,388) Unrealized loss from commodity derivatives, net 8,976 1,131 Other expense (income), net (31) (1) Non-recurring expenses 3,251 2,721 $ Adjusted EBITDAX 6,466 $ 4,470 1) 1Q19 includes non-recurring LOE comprised of $0.3MM of well workover charges, $0.2MM for contract labor and services comprised primarily of hauling and wireline, $0.2MM for expenses related to building and maintaining roads and locations, and $0.1MM for environmental health and safety (EH&S) enhancements. 2) 1Q18 includes non-recurring G&A expense comprised primarily of $1.0MM of advisory fees for strategic business projects and legal fees associated with de- leveraging, and other out of period adjustments of approximately $2.1MM 16

Wobbe Ploegsma VP of Capital Markets & Investor Relations ir@lilisenergy.com 210.999.5400 NYSE American | LLEX


