 Investor Presentation February 2013 Exhibit 99.1 |
 2 Forward Looking Statements | Disclaimer Bright Horizons Presentation Certain information contained in this presentation constitutes forward-looking statements within the meaning of the safe harbor provisions of the U.S. Private Securities Litigation Reform Act of 1995. Information regarding future economic performance, financial condition, prospects, growth, strategies, and expectations and objectives of management are all likely to include forward-looking statements. Forward-looking statements can be identified by the fact that they do not relate strictly to historical or current facts and generally contain words such as "believes," "expects," "may," "will," "should," "seeks," “projects,” "approximately," "intends," "plans," "estimates" or "anticipates" or similar expressions. Our forward-looking statements are subject to risks and uncertainties, which may cause actual results to differ materially from those projected or implied by the forward-looking statement. Forward-looking statements are based on current expectations and assumptions and currently available data and are neither predictions nor guarantees of future events or performance. You should not place undue reliance on forward-looking statements, which speak only as of the date hereof. We do not undertake to update or revise any forward- looking statements after they are made, whether as a result of new information, future events, or otherwise, except as required by applicable law. |
 3 Bright Horizons at a Glance Educational Advisory Services (2% of Sales) Back-Up Care (12% of Sales) Full-Service Centers (86% of Sales) Bright Horizons Presentation $1,046m in sales $171m in Adjusted EBITDA 16% Adjusted EBITDA Margin 776 centers with capacity for 87,700 children 10+ years of sales growth and margin expansion Long-term contracts with blue chip corporate clients who co-fund capital investment 97% employer-sponsored center client retention 5x more employer-sponsored centers in the U.S. than next competitor Growing international presence Key Figures (Q3 2012 LTM) Highlights Note: See appendix for reconciliation of Adjusted EBITDA |
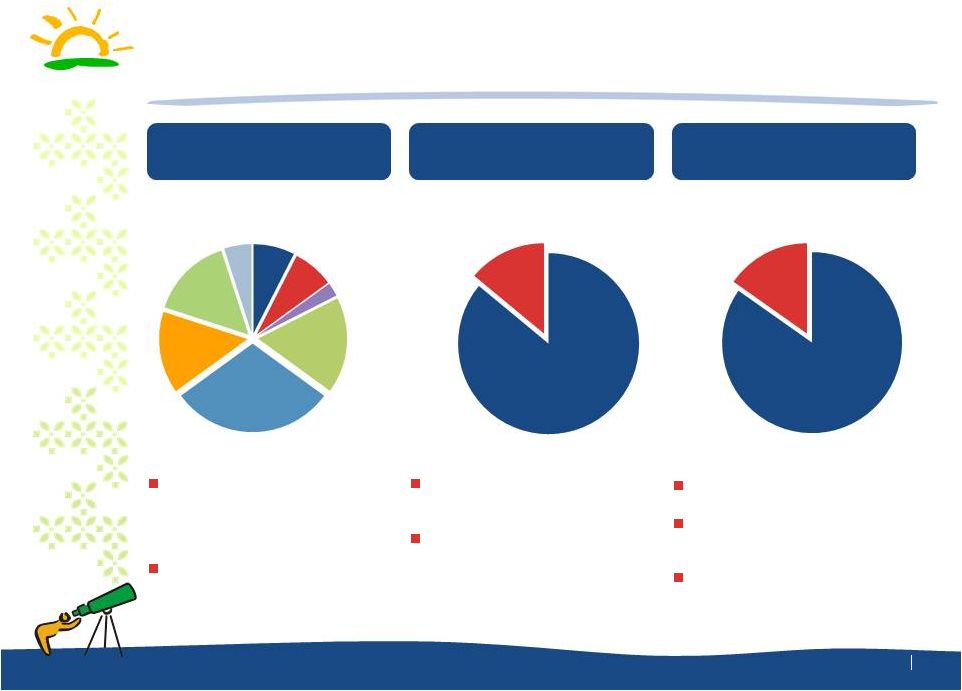 4 Diversified Portfolio of Opportunity Bright Horizons Presentation International Expansion (LTM 9/30/12 Revenue) Fast Growing New Services (LTM 9/30/12 Revenue) Diversified End Market (Q3 2012 U.S. Centers) Europe 15% North America 85% Back-Up Care, College Coach, EdAssist 14% Center Based Full- Service Child Care 86% Financial Services 15% Technology 5% Professional Services and Other 7.5% Consumer 7.5% Industrial / Manufacturing 2.5% Healthcare and Pharmaceuticals 17.5% Lease / Consortium 30% Gov’t and Education 15% The Company’s largest client contributes <3% of total revenues, and the top 10 clients represent <13% of total revenues Bright Horizons is well diversified across a broad array of client industries Launched network based back-up care (BUCA) in 2007 Acquired College Coach in 2006 and launched EdAssist in 2010 776 child care centers Expanded to UK and Ireland in 2000 Expanded to Netherlands and India in 2011 Total: $1,046m Total: $1,046m Total: 776 Centers 4 |
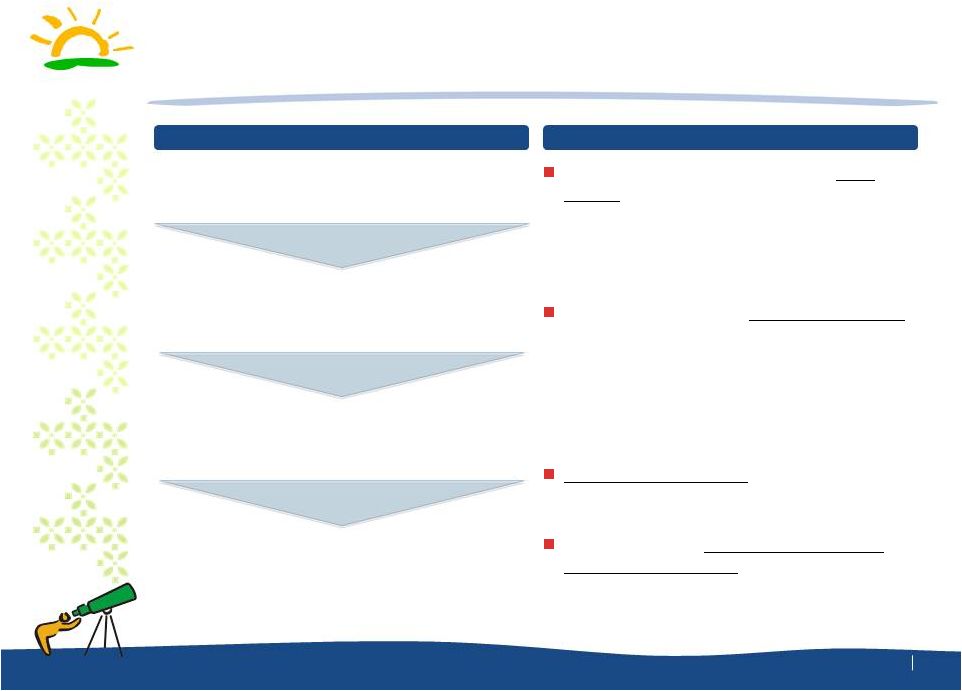 5 Employer-Sponsored Childcare and Services is a Large Market Supported by Secular Growth Trends Bright Horizons Presentation Increasing Workforce Participation by Women and Two Working Parent Families Greater Demand for High-Quality Center- Based Care and Early Education Recognized Return on Investment to Employer Sponsors Growing Global Demand for Child Care and Early Education Services Families in the United States spent ~$43 billion on licensed group child care in 2007 Center-based market is highly fragmented – top 10 providers comprise <10% of the market Strong secular trends driving increasing prevalence of center-based providers Bright Horizons is a pioneer in employer sponsored child care - one of the first to market a shared economic model Key Driver s Our Market Drives And Resulting in — 64% of mothers with children under 6 participate in workforce — 90% of center-based providers operate <10 centers |
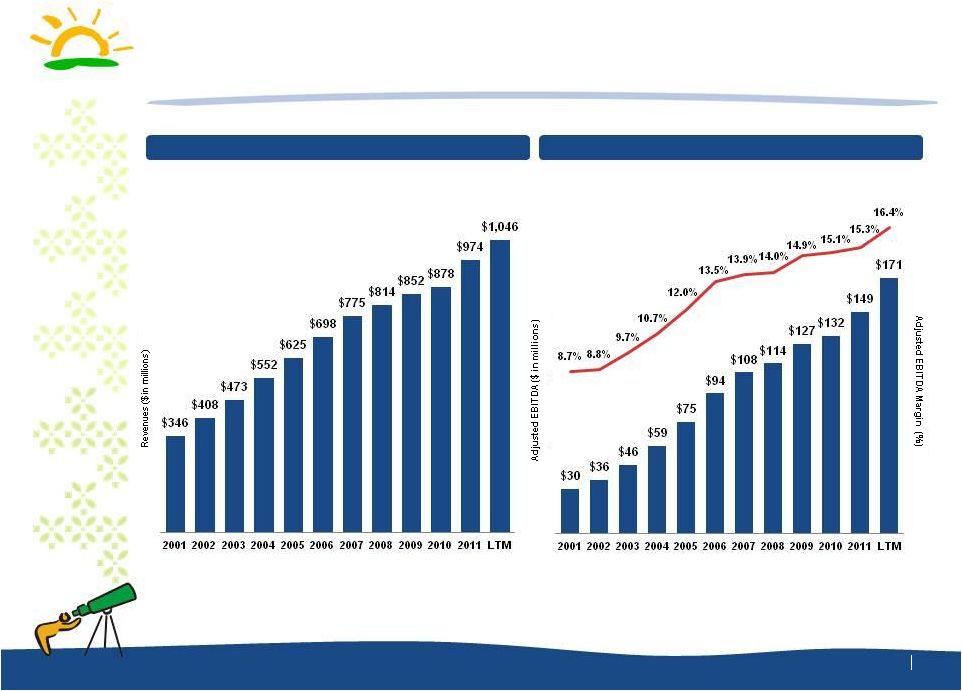 6 Bright Horizons Has Delivered 10+ Years of Uninterrupted Sales Growth and Margin Expansion Bright Horizons Presentation Revenue Growth Adjusted EBITDA Growth Note: See appendix for reconciliation of Adjusted EBITDA 1 y/y% growth rates for the LTM period calculated as year-over-year growth from LTM-9/30/2011 to LTM-9/30/2012; LTM-9/30/2011 Sales and Adjusted EBITDA of $947.6m and $144.6m, respectively. y/y % 25% 20% 28% 28% 27% 25% 15% 6% 11% 4% 13% 18%¹ y/y% 19% 18% 16% 17% 13% 12% 11% 5% 5% 3% 11% 10%¹ |
 7 Note: See appendix for reconciliation of Adjusted EBITDA Significant Growth and Investment in Recent Years Bright Horizons Presentation Sustained growth through challenging economic conditions Expanded international footprint: a market leader in the UK with established presence in Netherlands and India Rapidly grew back-up dependent care and launched new educational advisory services in the U.S. Expanded salesforce with specific focus on cross-selling opportunities to employer clients Invested in new technologies to better support service offerings Expanded marketing efforts with focus on maximizing occupancy Select Investment Initiatives Revenue ($ in millions) Adjusted EBITDA ($ in millions) |
 8 Key Performance Drivers Bright Horizons Presentation Client Funding for New Centers Drives Attractive ROI Model for Bright Horizons Stable and Growing Core Business With High Degree of Visibility on Near Term Growth Multiple and Diversified Drivers Expected to Continue to Deliver Strong Revenue Growth and Financial Performance Pricing Power and Operating Leverage Drive Margin Growth 2 3 4 5 Market Leading Provider with Significant Scale in Employer-Sponsored Child Care 1 |
 9 Bright Horizons Has Significant Scale and Capabilities Leading Position With Consistent Quality Built Over 25 Years Market Leading Provider with Significant Scale in Employer-Sponsored Child Care Partner of Choice Provider of Choice Employer of Choice More than 850 client relationships Includes more than 130 Fortune 500 companies 776 centers with capacity for 87,700 children Multi-year contracts with employer-sponsors Steady, long-term client relationships with 97% client retention rate for employer-sponsored centers #1 provider of for-profit employer-sponsored child care in North America Meet or exceed applicable accreditation standards in all key markets 70% of eligible centers NAEYC accredited 95+% parent and employer satisfaction rating 1 Named one of Fortune Magazine’s “100 Best Places to Work in America” Bright Horizons University provides nationally recognized credentials Low attrition rate 1 1 2 3 1 Satisfaction rating represents respondents to our employer and parent satisfaction survey over each of the past 5 years. |
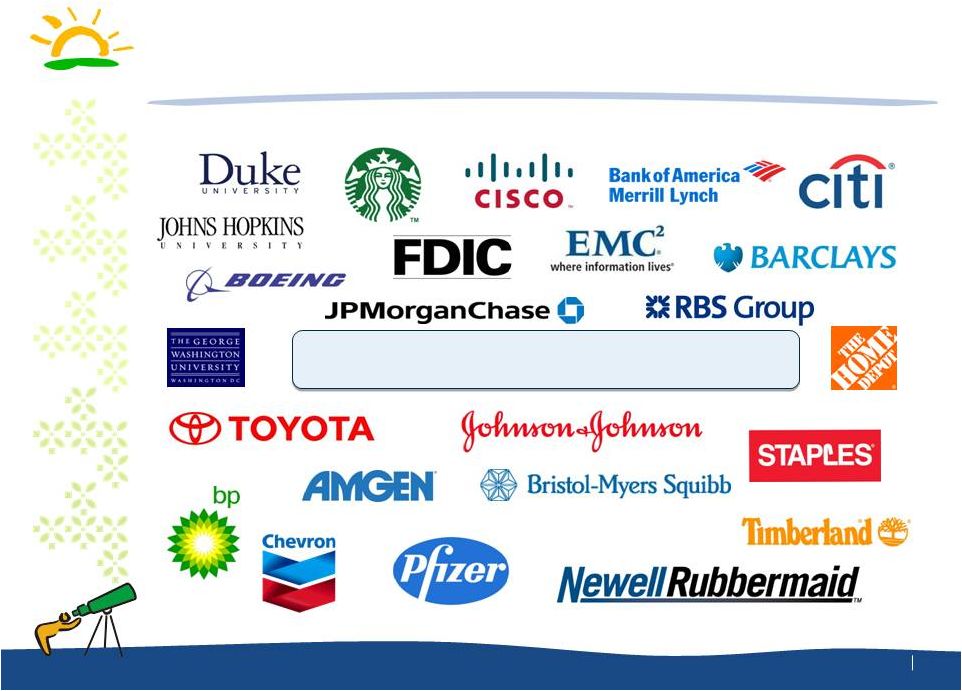 10 >850 client relationships, 97% client retention rate for employer-sponsored centers Partner of Choice for Many Blue Chip Clients #1 Provider of For-Profit Employer Sponsored Child Care in North America Market Leading Provider with Significant Scale in Employer-Sponsored Child Care 1 |
 11 Key Performance Drivers Bright Horizons Presentation Market Leading Provider with Significant Scale in Employer-Sponsored Child Care Client Funding for New Centers Drives Attractive ROI Model for Bright Horizons Stable and Growing Core Business With High Degree of Visibility on Near Term Growth Multiple and Diversified Drivers Expected to Continue to Deliver Strong Revenue Growth and Financial Performance Pricing Power and Operating Leverage Drive Margin Growth 1 2 3 4 5 |
 12 Characteristics of the Employer Sponsorship Model Client Funding for New Centers Drives Attractive ROI Model for Bright Horizons Work-site locations / built-in enrollment partner Industry leading teacher compensation and benefits More intensive ratios Higher quality facilities NAEYC accreditation Parent and family partnership High Quality Strong, Stable Model Employer / Developer Sponsorship and Capital Investment Sponsor ROI driven through retention, recruitment, productivity, and employee engagement levels Long-term contracts Stable and recurring revenue stream Predictable earnings model Limited capital investment (employer funding) Strong and predictable cash generation 2 |
 Client Funding Drives High Return on Investment Operating Models Offer Attractive Returns on Investment 2 Employer Client Co-funds Capital Expenditures for New Centers and Sponsors Employees’ Use of Bright Horizons’ Services ($ in ‘000s) Cost Plus Single Sponsor Consortium Lease % of Total Centers 30% 30% 40% Revenue / Center (U.S.) $1,600 $1,300 $1,400 Revenue / Center (Europe) $750 $650 $1,000 Gross Margin 15-20% 17-25% 20-25% Average ROI to Company 100%+ 75%+ 25%+ Contract Term 3-5y 3-10y 10-15y Client Funding for New Centers Drives Attractive ROI Model for Bright Horizons |
 14 Key Performance Drivers Bright Horizons Presentation Market Leading Provider with Significant Scale in Employer-Sponsored Child Care Client Funding for New Centers Drives Attractive ROI Model for Bright Horizons Stable and Growing Core Business With High Degree of Visibility on Near Term Growth Multiple and Diversified Drivers Expected to Continue to Deliver Strong Revenue Growth and Financial Performance Pricing Power and Operating Leverage Drive Consistent Margin Growth 1 2 3 4 5 |
 15 “Sticky” Relationships Create Stable Base Business Growing Established Base of Core Centers Stable and Growing Core Business With High Degree of Visibility on Near Term Growth Visibility in Full-Service Business Employer Sponsorship Established Competitive Advantages Cost-Plus contracts with defined management fee income not directly driven by enrollment Long-Term contracts for P+L centers Annual price increases typically specified in contracts Predictable tenure of children in centers as they “age up” Development Pipeline of 12 – 36 months Employer funding or co-funding center development costs and maintenance Employer agrees to market service to employees and subsidizes their use Childcare is a “sticky” benefit that is difficult to take away even in a downturn Strong cash flow generation Long-term established track-record of quality care makes BH the natural choice 97% client retention rate for employer-sponsored centers Difficult for smaller scale competitors to replicate consistent service quality No other competitor with matching suite of services 3 |
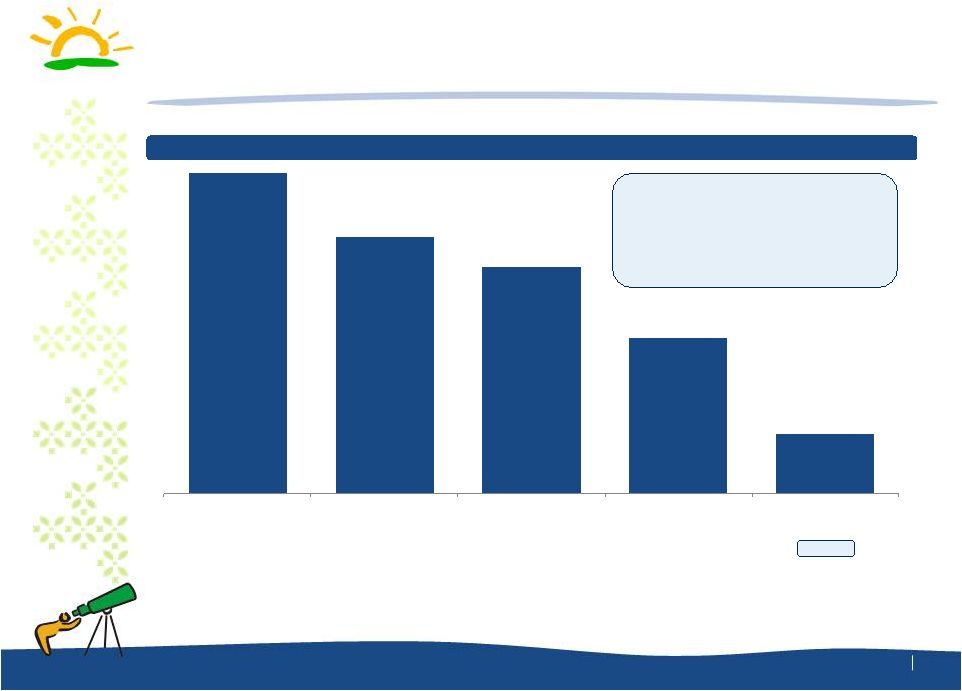
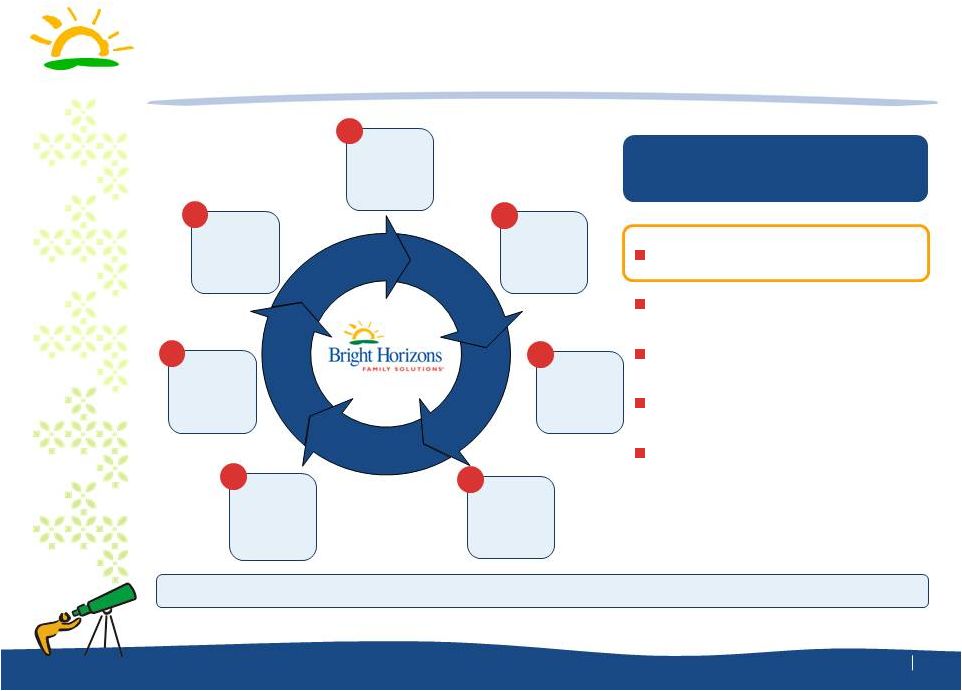 16 Virtuous Circle Sustains Market Leading Position Building and Maintaining Strong Client Relationships with Employers Stable and Growing Core Business With High Degree of Visibility on Near Term Growth 3 Reinforce #1 leadership position 6 Reinvestment in new center growth 5 Ability to drive pricing and unit economics 4 Sticky benefit with high switching costs 3 Clients co-fund capex and enter long-term contracts 2 Provider of choice to diverse corporate client base 1 Very few direct alternatives 7 Bright Horizons 1 – 585 Knowledge Learning – 107 (CCLC) Children’s Choice – 47 Hildebrandt Learning Centers – 41 EduKids – 12 Top 5 U.S. Employer-Sponsor Providers (By Total # of Centers) Bright Horizons has 5x more employer-sponsored centers in the U.S. than next competitor Source: Child Care Exchange, 2012 For Profit Child Care Status Report 1 585 Bright Horizons centers represents total employer-sponsored centers for comparability, Bright Horizons’ currently operates 776 total centers. |
 Key Performance Drivers Bright Horizons Presentation Market Leading Provider with Significant Scale in Employer-Sponsored Child Care Client Funding for New Centers Drives Attractive ROI Model for Bright Horizons Stable and Growing Core Business With High Degree of Visibility on Near Term Growth Multiple and Diversified Drivers Expected to Continue to Deliver Strong Revenue Growth and Financial Performance Pricing Power and Operating Leverage Drive Margin Growth |
 18 Business Model Operating Leverage Has Delivered Consistent Adjusted EBITDA and Margin Growth Pricing Power and Operating Leverage Drive Margin Growth 4 Adjusted EBITDA CAGR: 17% 766 bps Adjusted EBITDA Margin Expansion Total Net Sales CAGR: 11% Increase in Bright Horizons Revenue, Adjusted EBITDA and Annual Adjusted EBITDA Margin Note: See appendix for reconciliation of Adjusted EBITDA Various Drivers of Operating Leverage Tuition rate increases Efficient labor and other cost management Enrollment growth in ramping and mature P+L centers Contributions from higher margin services Acquisitions / transitions / mix of new centers Scale and expand European operations Overhead Leverage 8.7 % 8.8 % 9.7 % 10.7 % 12.0 % 13.5 % 13.9 % 14.0 % 14.9 % 15.1 % 15.3 % 16.4 % 2001 2002 2003 2004 2005 2006 2007 2008 2009 2010 2011 LTM - 9/30 |
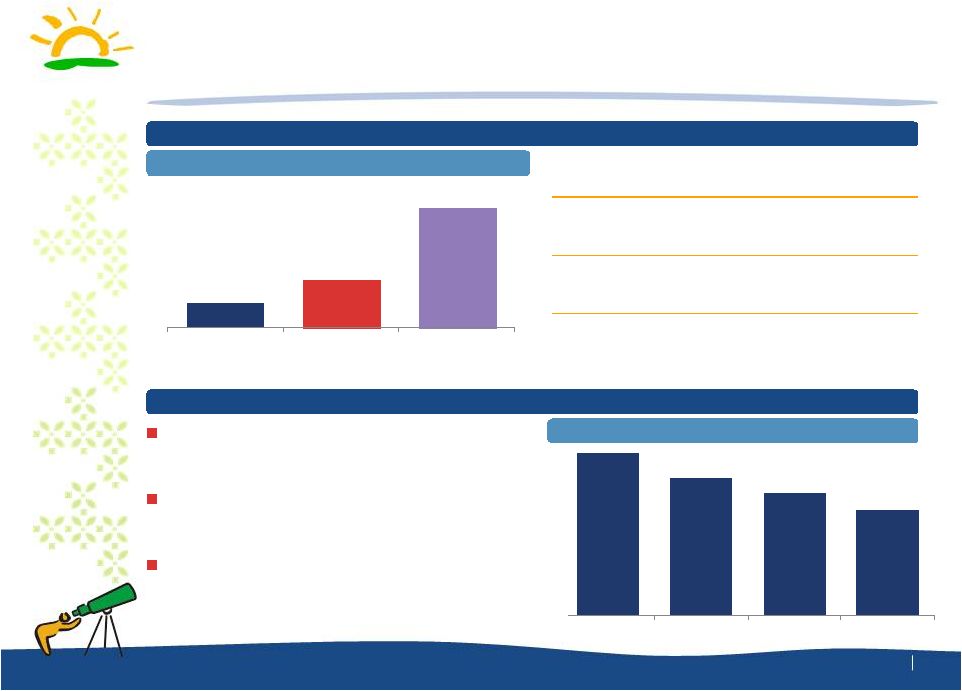 19 Sources of Operating Leverage Drivers of Margin Expansion Pricing Power and Operating Leverage Drive Margin Growth 4 Gross Margin Profile Full-Service Center-Based Care 15 - 25% Back-Up Dependent Care 30 - 40% Educational Advisory Services 35 - 45% Illustrative Tuition by Age Group Ability to Increase Price in Excess of Wage Inflation To the individual parent, the cost per child declines each year as their child gets older Price increases are consistently applied for each age bracket Typically, core center tuition increases average approximately 3-4% annually Growth in Higher Margin Services 2009 – LTM 9/30/2012 Sales CAGR 100% 85% 75% 65% Infants Toddler / Twos Pre School Kindergarten 6.8% 13.0% 32.9% Full-Service Center- Based Care Back-Up Dependent Care Educational Advisory Services |
 20 Key Performance Drivers Bright Horizons Presentation Market Leading Provider with Significant Scale in Employer-Sponsored Child Care Client Funding for New Centers Drives Attractive ROI Model for Bright Horizons Stable and Growing Core Business With High Degree of Visibility on Near Term Growth Pricing Power and Operating Leverage Drive Margin Growth 1 2 3 4 Multiple and Diversified Drivers Expected to Continue to Deliver Strong Revenue Growth and Financial Performance |
 21 Multiple Drivers of Organic Growth Multiple and Diversified Drivers Expected to Continue to Deliver Strong Revenue Growth and Financial Performance New Client Relationships Cross-Selling / Existing Clients Select New Consortium / Lease Locations Opportunity exists within every industry sector Target Group: Addressable market of ~15,000 employers with >1,000 employees in the U.S. and U.K. Dedicated sales force supported by Horizons Workforce Consulting Selling both direct and through channel partners 850 existing clients; 130 Fortune 500 / Leading Hospitals / Universities Today, only 15% of existing clients buy >1 service We operate >200 centers for 50 multi-site center clients with additional capacity Track record of 6-12 new locations per year Focus on urban or surrounding markets Identified 100+ suitable locations across U.S., U.K. and the Netherlands 5 Significant opportunity to add additional centers with these existing clients Note: As of 9/30/2012 Higher demand and more supportive income demographics |
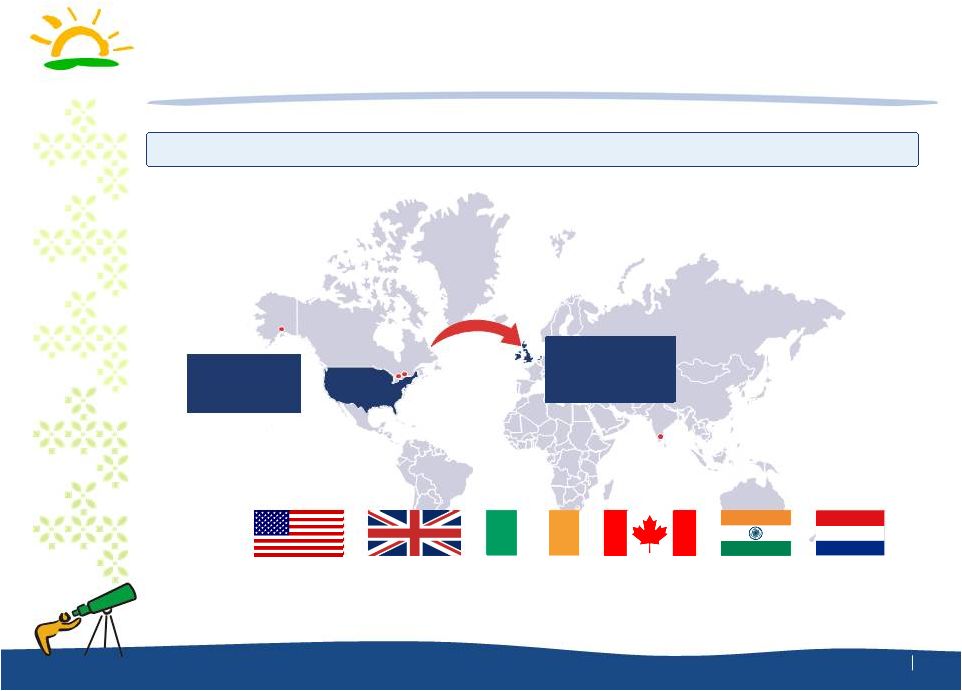 22 Significant Whitespace for International Expansion 5 Significant International Opportunity for Bright Horizons Note: As of 30-September-2012 Europe / India Centers: 177 Capacity: 12,200 Entered market in: 2011 2000 2000 2011 1986 2001 North America Centers: 599 Capacity: 75,500 Multiple and Diversified Drivers Expected to Continue to Deliver Strong Revenue Growth and Financial Performance |
 23 Center Growth from New Developments and M&A 5 Since 2001, 55% of Annual New Center Openings Have Been Organic Track Record of Executing and Integrating Acquisitions – Average of 24 Centers Acquired Annually Since 2001 2001 1 single-site and 1 multi-site 2002 2 multi-sites and 2 single-sites 2003 3 single-sites and 2 multi-sites 2004 2 multi-sites, 2 U.S. single-sites 2005 1 multi-site 1 single-site Children First, Inc. 2006 College Coach 7 U.S., 1 UK single-site and 2 multi-sites 2007 1 U.S. single site and 3 UK single sites 2008 Work Options Group 3 U.S. single sites 2009 Teddies (UK 32 sites) 2 U.S. single sites 2010 2 U.S. single sites, 1 UK single site 2011 1 multi; 2 single sites Stake in Kindergarden NL (20 sites) 2012 27 Casterbridge Nurseries (UK) 56 87 60 60 72 49 39 38 57 31 64 48 2001 2002 2003 2004 2005 2006 2007 2008 2009 2010 2011 9/30/2012 Multiple and Diversified Drivers Expected to Continue to Deliver Strong Revenue Growth and Financial Performance |
 24 Strong Financial Performance through 9/30/12 Bright Horizons Presentation Q1 – Q3 2011 Q1 – Q3 2012 % Change Full-Service Center-Based Care $ 630.6 $ 689.7 9.4% Back-Up Dependent Care Services 83.7 94.8 13.2% Other Educational Advisory Service 10.5 13.1 24.6% Total Revenue $ 724.8 $ 797.5 +10.0% Gross Profit $ 153.8 $ 182.7 +18.8% % Margin 21.2% 22.9% - Adj. EBITDA $ 109.7 $ 132.4 +20.7% % Margin 15.1% 16.6% - Note: See appendix for reconciliation of Adjusted EBITDA |
 25 Rapid Deleveraging Since Buyout in 2008 Bright Horizons Presentation Significant Reduction in Total Debt / Adj. EBITDA Driven by Adj. EBITDA Growth $127 $132 $149 $171 $833 $828 $825 $790 Adj. EBITDA Total Debt $69 $102 $154 $147 Unlevered Free Cash Flow Completed refinancing Jan 2013: New $790mm Term Loan B Interest Rate: L + 300bps with 1% floor 6.6 x 6.3 x 5.6 x 4.6 x 2008 2009 2010 2011 LTM 9/30 Note: Unlevered Free Cash Flow is defined as Adjusted EBITDA - Cash Taxes - Purchases of Fixed Assets +/- change in Net Working Capital. See appendix for reconciliation of Adjusted EBITDA |
 26 LTM - 9/2012 Actual From Refinancing LTM - 9/2012 Pro Forma Income from operations $ 90.3 Net interest expense and other (80.7) 45.3 (35.4) (Loss) income before income taxes $ 9.6 $ 45.3 $ 54.9 Income tax expense (1.4) (18.1) (19.5) Effective Tax Rate 15% 36% Net income $ 8.2 $ 27.2 $ 35.4 Adjustments 27.9 27.9 Adjusted Net Income $ 36.1 $ 27.2 $ 63.3 Illustrative Effects of Refinancing on LTM Net Income Bright Horizons Presentation Note: Reflects $100mm undrawn revolver; $790mm New Term Loan B at L+300, 1% floor, issued at 99 OID. 1 Adjustments to Net Income net of 40% illustrative tax rate. See Appendix for detail. $ 90.3 1 |
 27 Appendix A: Supplemental Materials Bright Horizons Presentation |
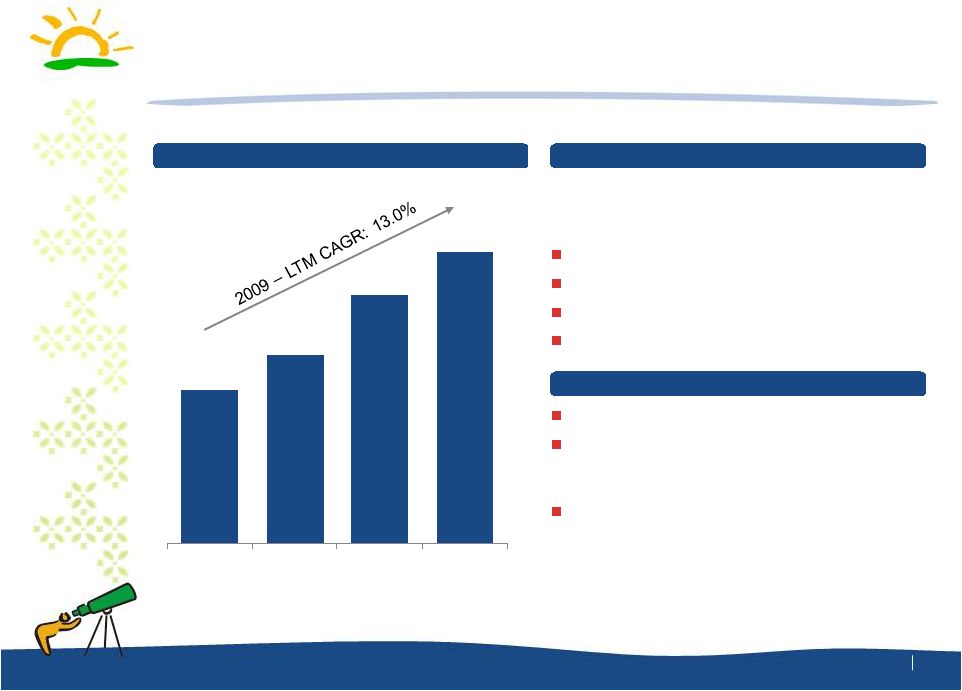
 28 Full-Service Center-Based Care Supplemental Materials Cost Plus (30% centers) Employer-funded capex No margin risk for Bright Horizons Enrollment not a direct revenue driver Profit and Loss (70% centers) Client-funded start-up for single sponsors (30% centers) Higher margins reflecting enrollment risk Quick ramp from development to maturity Revenue Operating Models $ 755 $ 769 $ 845 $ 904 2009 2010 2011 - LTM 9/30 |
 Back-Up Dependent Care Supplemental Materials Revenue Center-Based Back-Up Care Bright Horizons is the leading provider of dedicated back-up care centers and pioneered the industry Increases workforce productivity Enhances employee retention rates Reduces absenteeism 99% satisfaction rate by users Employer purchases uses for its employees 24/7 contact center / web service allowing employees to reserve in advance or at the last minute Access to a contracted network of in-home care agencies and ~2,500 center-based providers in locations where we do not otherwise have centers with available capacity Back-Up Care Advantage $ 90 $ 99 $ 115 $ 126 2009 2010 2011 LTM - 9/30 29 |
 30 Educational Advisory Services Supplemental Materials Revenue EdAssist Employers spend $17 billion annually on tuition assistance Largely an unmanaged spend Educational Advising eliminates wasteful tuition spending Also expedites degree completion, saving time and money Managed School Network offers higher value and lower costs Robust data analytics, consulting, and support College Coach $ 8 $ 10 $ 15 $ 17 2009 2010 2011 LTM - 9/30 Adding breadth and depth to work / life services Saving for College (newborns – 8 th graders) Paying for College: Financial Aid (9 th –12 graders) Paying for College: Scholarships & Loans (9 th –12 graders) Homework & Study Skills (2 nd – 6 th graders) Middle School Matters (5 th – 8 graders) The High School Plan (9 th – 10 th graders)` Selecting the Right College (11 th graders) Preparing College Applications (12 th graders) th th th |
 31 Consolidated Historical Financial Performance Supplemental Materials Fiscal Year Ended December 31, 2009 2010 2011 LTM – 9/2012 ($m) Revenue: Full-Service Center-Based Care $ 754.8 $ 769.2 $ 844.6 $ 903.6 Back-up Dependent Care 89.7 99.1 114.5 125.6 Other Educational Advisory 7.9 9.8 14.6 17.2 Total Revenue $ 852.3 $ 878.2 $ 973.7 $ 1,046.4 y/y% Growth - 3.0% 10.9% 10.4% Gross Profit $ 179.5 $ 179.9 $ 207.2 $ 236.1 Margin 21.1% 20.5% 21.3% 22.6% Selling, Gen. and Admin. Expenses $ 82.8 $ 83.6 $ 92.9 $ 118.7 % of Revenue 9.7% 9.5% 9.5% 11.3% Amortization $ 30.0 $ 27.6 $ 27.4 $ 27.0 Income from Operations $ 66.8 $ 68.7 $ 86.8 $ 90.3 % of Revenue 7.8% 7.8% 8.9% 8.6% Adjusted EBITDA $ 127.0 $ 132.2 $ 148.5 $ 171.2 Margin 14.9% 15.1% 15.3% 16.4% 1 y/y% growth rates for the LTM period calculated as year-over-year growth from LTM-9/30/2011 to LTM-9/30/2012; LTM-9/30/2011 Sales and Adjusted EBITDA of $947.6m and $144.6m, respectively. |
 32 Summary of Adjustments to EBITDA and Net Income Supplemental Materials Note: Adjustments to Net Income net of 40% illustrative tax rate Fiscal Year Ended December 31, 2009 2010 2011 LTM – 9/2012 Adjustments to EBITDA ($m) EBITDA $ 120.1 $ 122.0 $ 143.1 $ 150.0 Straight Line Rent Expense 2.0 5.4 1.7 1.7 Stock Compensation Expense 2.3 2.4 1.2 17.0 Sponsor Management Fee 2.5 2.5 2.5 2.5 Total Adjustments $ 6.8 $ 10.3 $ 5.4 $ 21.2 Adjusted EBITDA $ 127.0 $ 132.2 $ 148.5 $ 171.2 Adjustments to Net Income ($m) Net Income $(9.5) $(10.0) $ 4.8 $ 8.2 Stock Compensation Expense 2.3 2.4 1.2 17.0 Sponsor Management Fee 2.5 2.5 2.5 2.5 Amortization 30.0 27.6 27.4 27.0 Tax Effect (13.9) (13.0) (12.4) (18.6) Adjusted Net Income $ 11.3 $ 9.5 $ 23.4 $ 36.1 |
 33 Estimated Pro Forma Capitalization of Bright Horizons Supplemental Materials As of September 30, 2012 Current Pro Forma Maturity Call Date Call Price Cash & Equivalents $ 45 $ 65 - - - Tranche B Term Loans 346 - May-2015 - - Series C New Term Loans 85 - May-2017 - 101.00 Senior Subordinated Notes 300 - May-2018 May-2013 105.75 Senior Notes 192 - Nov-2018 May-2012 106.50 New Term Loan B - $ 790 Jan-2020 - - Total Senior Debt (net of OID) $ 914 $782 - - - Net Debt 868 717 - - - Adjusted EBITDA $ 171 $ 171 - - - Net Debt / Adj. EBITDA 5.1 x 4.2 x Note: Capitalization adjusted for (1) receipt of $233mm IPO proceeds, net of total fees and expenses of $22mm (2) application of net proceeds to retire $192mm Senior Notes plus accrued and unpaid interest through the redemption date, and to pay the $7.5mm sponsor termination fee and (3) $790mm New Term Loan B, net of total fees of $20mm, used to retire extant Tranche B Term Loans, Series C New Term Loans, and Senior Subordinated Notes; for illustrative purposes, pro forma capitalization assumes 9/30 balance sheet. Note: Adj. EBITDA calculated as earnings before interest, taxes, depreciation, amortization, straight line rent expense, stock compensation expense, and sponsor management fee. |
 34 Bright Horizons Presentation A Family of Solutions at Work |