UNITED STATES
SECURITIES AND EXCHANGE COMMISSION
Washington, D.C. 20549
FORM N-CSR
CERTIFIED SHAREHOLDER REPORT OF REGISTERED
MANAGEMENT INVESTMENT COMPANIES
Investment Company Act file number: 811-22211
IVA FIDUCIARY TRUST
| |
| (Exact name of registrant as specified in charter) |
| | 717 Fifth Avenue, 10th Floor, New York, NY 10022 |
| | |
| (Address of principal executive offices) (zip code) |
Michael W. Malafronte
International Value Advisers, LLC
717 Fifth Avenue
10th Floor
New York, NY 10022
(Name and address of agent for service)
Copy to:
Michael S. Caccese, Esq.
K&L Gates LLP
State Street Financial Center
One Lincoln Street
Boston, Massachusetts 02111-2950
Brian F. Link, Esq.
State Street Bank and Trust Company
Mail Code: SUM0703
100 Summer Street, 7th Floor
Boston, MA 02111
Registrant’s telephone number, including area code: (212) 584-3570
Date of fiscal year end: September 30
Date of reporting period: March 31, 2017
Item 1. Report to Shareholders.
| | | |
| | | |
 | | |
| | | |
| | | |
| | | |
| | | |
| |
| | | |
| | | |
| | | |
| | |
IVA Worldwide Fund |
| | | IVA International Fund |
| | | |
| | | |
| | | |
| | | Semi-Annual Report |
| | | March 31, 2017 |
| | | |
| | | |
| | | |
| | | |
| | | |
| | | |
| | | |
| | | |
Advised by International Value Advisers, LLC
| | An investment in the Funds is not a bank deposit and is not insured or guaranteed by the Federal Deposit Insurance Corporation or any other government agency. |

| | 2 | | An Owner’s Manual |
| | 3 | | Letter from the President |
| | 4 | | Letter from the Portfolio Managers |
| | 6 | | Management’s Discussion of Fund
Performance |
| | | | IVA Worldwide Fund |
| | 8 | | Performance |
| | 9 | | Portfolio Composition |
| | 10 | | Schedule of Investments |
| | | | IVA International Fund |
| | 20 | | Performance |
| | 21 | | Portfolio Composition |
| | 22 | | Schedule of Investments |
| | 31 | | Statements of Assets and Liabilities |
| | 32 | | Statements of Operations |
| | 33 | | Statements of Changes in Net Assets |
| | 34 | | Financial Highlights |
| | 40 | | Notes to Financial Statements |
| | 48 | | Additional Information |
| | 49 | | Fund Expenses |
| An Owner’s Manual | | IVA Funds |
| | | An Atypical Investment Strategy |
| | | |
| | | We manage both the IVA Worldwide and IVA International Funds with a dual attempt that is unusual in the mutual fund world: in the short-term (12-18 months), our attempt is to try to preserve capital, while in the longer-term (5-10 years, i.e., over a full economic cycle), we seek to perform better than the MSCI All Country World Index, in the case of your IVA Worldwide Fund, and the MSCI All Country World (ex-U.S.) Index, in the case of your IVA International Fund. |
| | | |
| | | The Worldwide Fund is typically used by investors who are looking for an “all weather fund” where we are given the latitude to decide how much we should have in the U.S. versus outside the U.S. The International Fund is typically used by investors who practice asset allocation and want to decide for themselves how much should be allocated to a domestic manager and how much should be allocated to a pure “international” (i.e., non-U.S.) manager, yet at the same time are looking for a lower risk – and lower volatility – exposure to international markets than may be obtained from a more traditional international fund. |
| | | |
| | | We believe our investment approach is very different from the traditional approach of most mutual funds. We are trying to deliver returns that are as absolute as possible, i.e., returns that try to be as resilient as possible in down markets, while many of our competitors try to deliver good relative performance, i.e., try to beat an index, and thus would be fine with being down 15% if their benchmark is down 20%. |
| | | |
| | | Why do we have such an unusual strategy (which, incidentally, is not easy to carry out)? Because we believe this strategy makes sense for many investors. We are fond of the quote by Mark Twain: “There are two times in a man’s life when he should not speculate: the first time is when he cannot afford to; the second time is when he can.” We realize that many investors cannot tolerate high volatility and appreciate that “life’s bills do not always come at market tops.” This strategy also appeals to us at International Value Advisers since we “eat our own cooking” for a significant part of our savings (invested in IVA products) and we have an extreme aversion to losing money. |
| | | |
| | | An Eclectic Investment Approach |
| | | |
| | | Here is how we try to implement our strategy: |
| | | |
| | | | | We don’t hug benchmarks. In practical terms, this means we are willing to make big “negative bets,” i.e., having nothing or little in what has become big in the benchmark. Conversely, we will generally seek to avoid overly large positive bets. |
| | | | | |
| | | | | We prefer having diversified portfolios (100 to 150 names). Because we invest on a global basis, we believe that diversification helps protect against weak corporate governance or insufficient disclosure, or simply against “unknown unknowns.” We like the flexibility to invest in small, medium and large companies, depending on where we see value. |
| | | | | |
| | | | | We attempt to capture equity-type returns through fixed income securities but predominantly when credit markets (or sub-sets of them) are depressed and offer this potential. |
| | | | | |
| | | | | We hold some gold, either in bullion form or via gold mining securities, as we believe gold provides a good hedge in either an inflationary or deflationary period, and it can help mitigate currency debasement over time. |
| | | | | |
| | | | | We are willing to hold cash when we cannot find enough cheap securities that we like or when we find some, yet the broader market (Mr. Market) seems fully priced. We will seek to use that cash as ammunition for future bargains. |
| | | | | |
| | | | | At the individual security level, we ask a lot of questions about “what can go wrong?” and will establish not only a “base case intrinsic value” but also a “worst case scenario” (What could prove us wrong? If we were wrong, are we likely to lose 25%, 30%, or even more of the money invested?). As a result, we will miss some opportunities, yet hopefully, we will also avoid instances where we experience a permanent impairment of value. |
| Letter from the President | IVA Funds |
 | | Dear Shareholder:
This report covers the six month period ended March 31, 2017. The IVA Worldwide Fund and IVA International Fund (the “Funds”) are now in their ninth year and the Funds’ investment adviser, International Value Advisers, LLC, remains pleased with the Funds’ performance since their inception on October 1, 2008.
The investing environment and the factors influencing our investment decisions have not changed significantly over the last six months. Nor has our investment approach, which emphasizes capital preservation over the short-term while still providing the capacity to outperform equity indices over the long-term. Since inception, we have been, and will continue to be, absolute return oriented investors. We are willing to have a high “active share” and deviate significantly from our benchmarks. We believe that our investment approach represents one of the best ways to invest one’s money, in fact, almost everyone employed by IVA is a shareholder.
Looking back over letters I have written in the past, I wanted to emphasize some points after what has been a relatively quiet six month period: |
| | 1. | | Our investment strategy does not give us any room for excuses. The Funds are fortunate to be managed by Charles de Vaulx and Chuck de Lardemelle. |
| | | | |
| | 2. | | We do not pay attention to benchmark performance over a month, a quarter or a year and we are willing to endure short-term underperformance and let cash build when we cannot find enough attractive investment opportunities. |
| | | | |
| | 3. | | The responsibility we have to our clients spans many different departments at IVA. The investment team and the marketing and client service group are the most visible to our shareholders. IVA is also supported by excellent people in operations and accounting. It is extremely rewarding for me to observe the continued development, commitment, and strong work ethic of all my colleagues. |
| | | | |
| | 4. | | We manage our firm and our clients’ assets with a simple philosophy that establishes an order of priority for everything that we do. Our work begins with the client, proceeds to the firm, then to our colleagues, and finally, to the partners. This is and always will be the progression. If our clients are taken care of, the rest falls into place. At IVA, every working component is structured to benefit the client. |
| | | | I want to offer my thanks to all my colleagues and to our shareholders for their continued support. |
| | | | |
| | | |  |
| | | | |
| | | | Michael W. Malafronte, President |
| | | | |
| | | | Effective February 22, 2011, the IVA Worldwide Fund and IVA International Fund are closed to new investors. |
| Letter from the Portfolio Managers | IVA Funds |
 | | May 1, 2017
Dear Fellow Shareholders,
During the period under review, October 1, 2016 to March 31, 2017, markets continued their upward journey. While equities owned by both Funds outperformed their indices of reference, the large cash position detracted from performance. The absolute performance over the period was satisfactory, in our opinion.
We believe that the sizeable cash position in both Funds is warranted given elevated valuations in all asset classes in the United States, substantial and unsustainable credit growth in China, political risks in relation to the eurozone, and rising short-term interest rates in the United States. These issues would be surmountable as investors if valuations were commensurate with these risks. We do not believe this is the case today.
We are however stock pickers at heart, and with the help of our analysts, we’ve been able to unearth a number of attractive investments over the period, in particular in Europe during the last quarter of 2016, and in Korea and emerging markets in the first quarter of 2017.
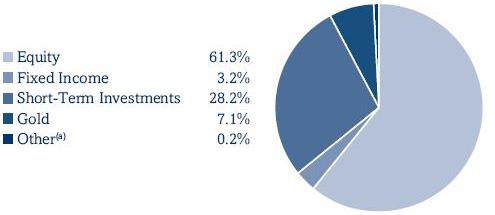
For the International Fund in particular, we were able to put a sizeable chunk of cash to work over the period, with cash moving from 34.1% to 28.1% over the period while the International Fund equity allocation moved from 53.9% to 61.3%. This is not a function of some macro views on economies outside the United States; rather this is the result of finding what we believe are a few undervalued businesses around the world, which led to sizeable investments in Airbus, Bureau Veritas, Kangwon Land and Korea Tobacco & Ginseng for both Funds, as well as a few South American names in Mexico, Chile, and Brazil for the International Fund.
The rally in European equities in the first quarter of 2017 cut our European buying spree short. The names available in emerging markets tend to be small, constraining the size of the positions we establish there. Valuations in emerging markets are at substantial discounts to the United States; likewise, European markets have underperformed the U.S. market massively over the last few years, albeit for a good reason: European markets are heavily weighted towards financials, with the underlying issue of the sustainability of the euro, and therefore suspicious balance sheets; while U.S. indices are loaded with expensive, yet fast growing internet related names, such as Facebook or Amazon. Striking how absent these types of investments are from European or Japanese indices. |
| | For the Worldwide Fund, sizeable European investments over the period were offset by sales in the U.S. of substantially all of our mortgage real estate investment trust (REIT) preferred shares as well as selling out of a few U.S. equity names. |
| | |
| | We continue to carry a sizeable gold bullion position in both Funds. We view gold bullion as a currency that central bankers cannot debase, and as a useful hedge in both portfolios against extreme outcomes. While gold bullion historically has gone up in price during most bear markets in the United States, obviously past performance is no guarantee of future performance... In particular, if the next bear market in the U.S. is triggered by higher real interest rates, rather than by a recession, it is possible that gold may not perform as we anticipate. It is interesting to note however that in both Venezuela, where hyperinflation wiped out investors, as well as in Greece, where deflation led to financial ruin for most, gold protected wealth well. |
| Letter from the Portfolio Managers | IVA Funds |
| | We remain concerned by the large and growing amounts of worldwide debt outstanding as a percentage of global GDP, by the derelict global monetary system, as well as the furious credit growth in China and the volatile political situation in Europe, which eventually could result in a breakup of the eurozone (We believe Italy might be the weakest link there). Rising short-term interest rates in the U.S., in the context of one of the longest bull markets in history, coupled with an advanced economic cycle in the U.S. and very high valuations by historical standards, warrant a conservative and prudent capital allocation in our opinion, and explain why an allocation to gold bullion is warranted in your Funds, and why the cash (invested in commercial paper of our choosing) remains at high levels. | |
| | | |
| | We continue to work hard to find suitable investments, to avoid speculations, and to compound your hard-earned savings at a reasonable rate, while doing our utmost to preserve capital. We appreciate your continued confidence and thank you for your support. | |
| | | |
| |  | |
| | Charles de Vaulx, Chief Investment Officer and Portfolio Manager | |
| |  | |
| | Chuck de Lardemelle, Portfolio Manager | |
| Management’s Discussion of Fund Performance (unaudited) | IVA Funds |
| | The election of Donald Trump as President of the United States stunned the world and was by far the defining event of the period under review. The news, for the most part, was calmly digested by markets. Immediately following the election, bonds were struck with the reality that inflation and higher interest rates may become a byproduct of any fiscal stimulus package initiated by President Trump and a Republican-controlled Congress. Equities fared better, especially in the U.S., as markets embraced an optimistic view of a “pro-business” Trump administration that would cut taxes, engage in deficit spending and roll back regulations. The global equity markets continued their “Trump-Trade” driven rally into the New Year and through most of the first quarter of 2017. There was an interruption in this rally following President Trump’s setback in healthcare reform at the end of March, as investors began to question his ability to accomplish his other goals such as corporate tax cuts, infrastructure spending and deregulation. However, these doubts seem to have been fleeting, as the market rebounded after only a few days of volatility. Helping to buoy markets at the end of the period, the U.S. Federal Reserve signaled in March that although they intend to gradually increase rates, they still want to proceed cautiously. | |
| | | |
| | Over the period, our equity exposure decreased from 52.1% to 50.8% in the Worldwide Fund and increased from 53.9% to 61.3% in the International Fund. Cash increased from 37.3% to 40.7% in the Worldwide Fund and decreased from 34.1% to 28.2% in the International Fund. We found new equity opportunities over the period. In both Funds, we initiated a new position in BMW AG (Germany, consumer discretionary), Airbus Group SE (Netherlands, industrials) and KT&G Corp. (South Korea, consumer staples). We also added to our position in Bureau Veritas SA (France, industrials), which is now a top 10 name in both Funds. In the International Fund only, we added multiple new names, including TOTVS SA (Brazil, technology), Doshisha Co., Ltd. (Japan, consumer discretionary) and DONGKOOK Pharmaceutical Co., Ltd. (South Korea, health care). In the Worldwide Fund only, we added Ralph Lauren Corp. (U.S., consumer discretionary). | |
| | | |
| | While we were able to find new names, some of our existing names approached our intrinsic value estimates and in those cases we trimmed and even eliminated positions entirely. Yokogawa Electric Corp. (Japan, technology) was sold by both Funds. In the Worldwide Fund only, names that we eliminated included Raymond James Financial Inc. (U.S., financials) and Hewlett Packard Enterprise Co. (U.S., technology). | |
| | | |
| | Fixed income exposure decreased in both Funds as we trimmed corporate bond positions and reduced our exposure to short-dated bonds denominated in Singapore dollars over the period. In the Worldwide Fund, fixed income decreased from 3.3% to 2.5% and in the International Fund, it decreased from 4.1% to 3.2%. | |
| | | |
| | Our gold exposure through gold bullion decreased from 6.4% to 5.8% in the Worldwide Fund and from 7.6% to 7.1% in the International Fund. | |
| | | |
| | IVA Worldwide Fund | |
| | | |
| | The IVA Worldwide Fund Class A, at net asset value, returned 5.26% over the six-month period ended March 31, 2017 compared to the MSCI All Country World Index (Net) (the “Index”) return of 8.18% over the same period. | |
| | | |
| | The IVA Worldwide Fund lagged the Index for the period, mostly due to the dilutive effect of our elevated cash position. Our equities outperformed, up 11.1%, compared to those in the Index* which were up 8.3%. Our U.S. names contributed 3.1%, led by a rally in financials and strong performance by some of our top 10 names, including DeVry Education Group Inc. (consumer discretionary) and Berkshire Hathaway Inc., Class ‘A’ and ‘B’ (holding company). Continental Europe contributed 0.9% and the United Kingdom added 0.7%, led by Antofagasta Plc (materials), which benefited from a rise in copper prices over the period. With markets robust around the globe, the only countries that detracted from return this period were Japan (taking away -0.3%) and Thailand (taking away -0.01%). In Japan, performance was hurt by Astellas Pharma Inc. (health care). | |
| Management’s Discussion of Fund Performance (unaudited) | IVA Funds |
| | The top five individual contributors to return this period were: DeVry Education Group Inc. (U.S., consumer discretionary), Berkshire Hathaway Inc. Class ‘A’ and ‘B’ (U.S., holding company), Bank of America Corp. (U.S., financials), Samsung Electronics Co., Ltd. (South Korea, technology), Antofagasta Plc (U.K., materials). The top five individual detractors were: Astellas Pharma Inc. (Japan, health care), Hyundai Mobis Co., Ltd (South Korea, consumer discretionary), News Corp. Class ‘A’ and ‘B’ (U.S., consumer discretionary), CVS Health Corp. (U.S., consumer staples), Nestlé S.A. (Switzerland, consumer staples). | |
| | | |
| | Collectively, fixed income contributed 0.3%. Gold was down -5.3% and detracted -0.4%. | |
| | | |
| | In an effort to neutralize part of our foreign exchange risk, we were partially hedged against several currencies over the period – the euro, Japanese yen, South Korean won and Australian dollar. Our currency hedges added 0.3%, helped the most by our hedge on the Japanese yen as it depreciated against the U.S. dollar over the period. At the end of the period, our currency hedges were: 39% Australian dollar, 9% euro, 25% Japanese yen, and 30% South Korean won. | |
| | | |
| | IVA International Fund | |
| | | |
| | The IVA International Fund Class A, at net asset value, returned 4.25% over the six-month period ended March 31, 2017 compared to the MSCI All Country World Index (ex-U.S.)(Net)(the “Index”) return of 6.51% over the same period. | |
| | | |
| | The IVA International Fund lagged the Index for the period, mostly due to the dilutive effect of our elevated cash position. Our equities outperformed, up 7.4%, compared to those in the Index* which were up 6.6%. Our names in Continental Europe contributed the most to return, adding 1.5%. The United Kingdom added 1.0%, led by Antofagasta Plc (materials), which benefited from a rise in copper prices over the period. South Korea added 0.9%, led by Samsung Electronics Co., Ltd (technology). News Corp. Class ‘A’ and ‘B’ (U.S., consumer discretionary) detracted -0.2%. We hold News Corp. in our International portfolio due to its meaningful Australian exposure. With markets robust around the globe this period, the only countries that detracted from return were Hong Kong and Thailand, taking away a total of -0.03%. | |
| | | |
| | The top five individual equity contributors to return this period were: Samsung Electronics Co., Ltd. (South Korea, technology), Antofagasta Plc (U.K., materials), Jardine Strategic Holdings Ltd. (Bermuda, holding company), Clear Media Ltd. (China, consumer discretionary), Hongkong & Shanghai Hotels Ltd. (Hong Kong, consumer discretionary). The top five individual detractors were: Astellas Pharma Inc. (Japan, health care), News Corp. Class ‘A’ and ‘B’ (U.S., consumer discretionary), Hyundai Mobis Co., Ltd (South Korea, consumer discretionary), APT Satellite Holdings Ltd. (Hong Kong, telecommunications services), Toho Co., Ltd. (Japan, consumer discretionary). | |
| | | |
| | Collectively, fixed income contributed 0.2%. Gold was down -5.3% and detracted -0.5%. | |
| | | |
| | In an effort to neutralize part of our foreign exchange risk, we were partially hedged against several currencies over the period – the euro, Japanese yen, South Korean won and Australian dollar. Our currency hedges added 0.7%, helped the most by our hedge on the Japanese yen as it depreciated against the U.S. dollar over the period. At the end of the period, our currency hedges were: 39% Australian dollar, 9% euro, 36% Japanese yen, and 30% South Korean won. | |
| | | |
| | Investment Risks: There are risks associated with investing in securities of foreign countries, such as erratic market conditions, economic and political instability and fluctuations in currency exchange rates. Value-based investments are subject to the risk that the broad market may not recognize their intrinsic value. | |
| | | |
| | *The Index equity return excludes gold mining stocks. | |
| IVA Worldwide Fund | | IVA Funds |
| Performance (unaudited) | | As of March 31, 2017 |
| Average Annual Total Returns as of March 31, 2017 | | | Six Months(a) | | One Year | | Five Year | | Since Inception(b) |
| | | | | | | | | | |
| Class A | | | 5.26 | % | | 10.17 | % | | 5.63 | % | | 8.65 | % |
| Class A (with a 5% maximum initial sales charge) | | | -0.01 | % | | 4.65 | % | | 4.55 | % | | 8.00 | % |
| Class C | | | 4.91 | % | | 9.40 | % | | 4.83 | % | | 7.84 | % |
| Class I | | | 5.43 | % | | 10.48 | % | | 5.88 | % | | 8.91 | % |
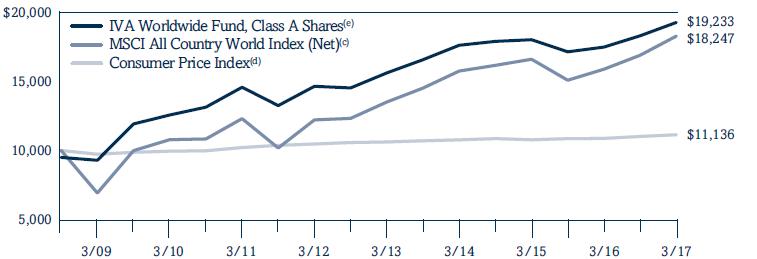
| MSCI All Country World Index (Net)(c) | | | 8.18 | % | | 15.04 | % | | 8.37 | % | | 7.33 | % |
| Consumer Price Index(d) | | | 1.14 | % | | 2.45 | % | | 1.28 | % | | 1.27 | % |
| Growth of a $10,000 Initial Investment | |
| | |
| |
| (a) | | Total returns for periods of less than one year are not annualized. |
| (b) | | The Fund commenced investment operations on October 1, 2008. |
| (c) | | The MSCI All Country World Index (Net) is an unmanaged, free float-adjusted market capitalization weighted index composed of stocks of companies located in countries throughout the world. It is designed to measure equity market performance in global developed and emerging markets. The index includes reinvestment of dividends, net of foreign withholding taxes. Please note that an investor cannot invest directly in an index. |
| (d) | | The Consumer Price Index examines the weighted average of prices of a basket of consumer goods and services, such as transportation, food and medical care. Please note that an investor cannot invest directly in an index. |
| (e) | | Hypothetical illustration of $10,000 invested in Class A shares on October 1, 2008, assuming the deduction of the maximum initial sales charge of 5% at the time of investment for Class A shares and the reinvestment of all distributions, including returns of capital, if any, at net asset value through March 31, 2017. The performance of the Fund’s other classes may be greater or less than the Class A shares’ performance indicated on this chart depending on whether greater or lesser sales charges and fees were incurred by shareholders investing in the other classes. |
Past performance is no guarantee of future results. The performance data quoted represents past performance and current returns may be lower or higher. The investment return and principal value will fluctuate so that an investor’s shares, when redeemed, may be worth more or less than the original cost. The returns do not reflect the deduction of taxes that a shareholder would pay on Fund distributions or the redemption of Fund shares. To obtain performance information current to the most recent month-end, please call 866-941-4482.
The maximum sales charge for Class A shares is 5.00%. Class C shares may include a 1.00% contingent deferred sales charge for the first year only. The expense ratios for the Fund are as follows: 1.25% (Class A shares); 2.00% (Class C shares); and 1.00% (Class I shares). These expense ratios are as stated in the most recent Prospectus dated January 31, 2017. More recent expense ratios can be found in the Financial Highlights section of this Semi-Annual Report.
| IVA Worldwide Fund | | IVA Funds |
| Portfolio Composition (unaudited) | | As of March 31, 2017 |
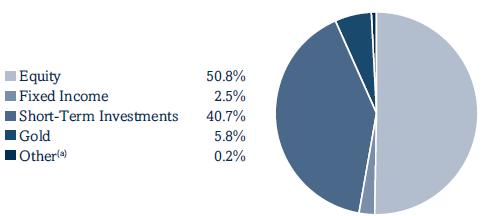
| Asset Allocation (As a Percent of Total Net Assets) | |
| | |
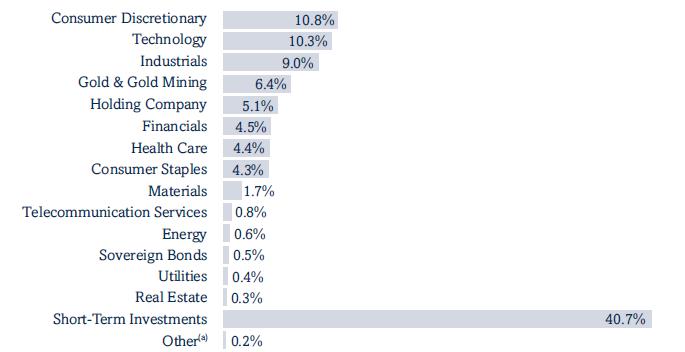
| Sector Allocation (As a Percent of Total Net Assets) | |
| | |
| Top 10 Positions (As a Percent of Total Net Assets)(b) | |
| | |
| Gold Bullion | | 5.8 | % |
| |
| Berkshire Hathaway Inc., Class ‘A’, Class ‘B’ | | 4.2 | % |
| |
| Astellas Pharma Inc. | | 3.7 | % |
| |
| Nestlé SA | | 2.2 | % |
| |
| Bureau Veritas SA | | 2.1 | % |
| |
| Oracle Corp. | | 1.8 | % |
| |
| Samsung Electronics Co., Ltd. | | 1.5 | % |
| |
| Mastercard Inc., Class ‘A’ | | 1.4 | % |
| |
| Antofagasta Plc | | 1.3 | % |
| |
| CVS Health Corp. | | 1.3 | % |
| |
| Top 10 positions represent 25.3% of total net assets. |
| (a) | | Other represents unrealized gains and losses on forward foreign currency contracts and other assets and liabilities. | | |
| (b) | | Short-Term Investments are not included. | | |
| IVA Worldwide Fund | IVA Funds |
| Schedule of Investments (unaudited) |
| March 31, 2017 |
| |
| | | | SHARES | | DESCRIPTION | | | FAIR VALUE |
| | | | | | | | | |
| | COMMON STOCKS – 50.7% | | | | | | | |
| | |
| | Bermuda | 0.8% | | | | | | | |
| | | | 1,505,700 | | Jardine Strategic Holdings Ltd. | | $ | 63,239,400 |
| | |
| | | | | | | | | |
| | |
| | China | 0.6% | | | | | | | |
| | | | 129,324 | | Baidu Inc., ADR (a) | | | 22,310,977 |
| | |
| | | | 15,637,640 | | Clear Media Ltd. | | | 18,109,600 |
| | |
| | | | 68,320,000 | | Springland International Holdings Ltd. | | | 12,219,623 |
| | |
| | | | | | | | | 52,640,200 |
| | | | | | | | |
| | | | | | | | | |
| | |
| | France | 6.8% | | | | | | | |
| | | | 903,607 | | Alten SA | | | 69,290,003 |
| | |
| | | | 3,705,607 | | Altran Technologies SA | | | 62,380,562 |
| | |
| | | | 24,549,756 | | Bolloré SA | | | 95,173,279 |
| | |
| | | | 177,361 | | Bolloré SA NV (a) | | | 673,583 |
| | |
| | | | 8,037,087 | | Bureau Veritas SA | | | 169,550,115 |
| | |
| | | | 2,258,966 | | Engie SA | | | 32,003,000 |
| | |
| | | | 37,482 | | Financière de l’Odet SA | | | 31,388,845 |
| | |
| | | | 94,455 | | Robertet SA | | | 35,267,601 |
| | |
| | | | 57,677 | | Séché Environnement SA | | | 1,699,454 |
| | |
| | | | 279,481 | | Sodexo SA | | | 32,871,068 |
| | |
| | | | 200,614 | | Thales SA | | | 19,402,598 |
| | |
| | | | 41,887 | | Wendel SA | | | 5,308,583 |
| | |
| | | | | | | | | 555,008,691 |
| | | | | | | | |
| | | | | | | | | |
| | |
| | Germany | 0.9% | | | | | | | |
| | | | 284,050 | | Bayerische Motoren Werke AG | | | 25,911,623 |
| | |
| | | | 332,556 | | Siemens AG | | | 45,552,555 |
| | |
| | | | | | | | | 71,464,178 |
| | | | | | | | |
| | | | | | | | | |
| | |
| | Hong Kong | 0.8% | | | | | | | |
| | | | 3,507,587 | | Henderson Land Development Co. Ltd. | | | 21,732,010 |
| | |
| | | | 37,372,159 | | Hongkong & Shanghai Hotels Ltd. | | | 43,953,102 |
| | |
| | | | | | | | | 65,685,112 |
| | | | | | | | |
| | | | | | | | | |
| | |
| | Japan | 7.7% | | | | | | | |
| | | | 23,041,200 | | Astellas Pharma Inc. | | | 303,407,879 |
| | |
| | | | 1,198,300 | | Azbil Corp. | | | 40,255,475 |
| | |
| | | | 537,500 | | Benesse Holdings Inc. | | | 16,801,401 |
| | |
| | | | 1,418,200 | | Cosel Co., Ltd. | | | 19,273,660 |
| | |
| | | | 588,100 | | F@N Communications, Inc. | | | 4,389,752 |
| | |
| | | | 289,700 | | FANUC Corp. | | | 59,381,604 |
| | |
| | | | 755,700 | | Icom Inc. (b) | | | 17,370,307 |
| | |
| | | | 211,200 | | Medikit Co., Ltd. | | | 8,840,313 |
| | |
| | | | 509,000 | | Miraca Holdings Inc. | | | 23,408,605 |
| | |
| 10 | See Notes to Financial Statements. |
| IVA Worldwide Fund | IVA Funds |
| Schedule of Investments (unaudited) |
| March 31, 2017 |
| |
| | | | SHARES | | DESCRIPTION | | | FAIR VALUE |
| | | | | | | | | |
| | |
| | Japan | 7.7% (continued) | | | | | | | |
| | |
| | | | 178,500 | | Nitto Kohki Co., Ltd. | | $ | 4,086,917 |
| | |
| | | | 328,700 | | Okinawa Cellular Telephone Co. | | | 10,643,703 |
| | |
| | | | 1,064,000 | | Rohto Pharmaceutical Co., Ltd. | | | 19,936,262 |
| | |
| | | | 390,200 | | Seven & i Holdings Co., Ltd. | | | 15,288,354 |
| | |
| | | | 259,400 | | Techno Medica Co., Ltd. | | | 4,939,621 |
| | |
| | | | 932,900 | | Toho Co., Ltd. | | | 24,728,177 |
| | |
| | | | 11,298,800 | | Yahoo Japan Corp. | | | 52,165,483 |
| | |
| | | | | | | | | 624,917,513 |
| | | | | | | | |
| | | | | | | | | |
| | |
| | Malaysia | 0.8% | | | | | | | |
| | | | 52,837,200 | | Genting Malaysia Berhad | | | 65,068,973 |
| | |
| | | | | | | | | |
| | |
| | Netherlands | 1.1% | | | | | | | |
| | | | 1,177,040 | | Airbus Group SE | | | 89,566,659 |
| | |
| | | | | | | | | |
| | |
| | Norway | 0.0% | | | | | | | |
| | | | 77,511 | | Golden Close Maritime Corp. Ltd. (a)(c) | | | — |
| | |
| | | | | | | | | |
| | |
| | South Africa | 0.4% | | | | | | | |
| | | | 2,535,416 | | Net 1 U.E.P.S. Technologies Inc. (a) | | | 31,008,138 |
| | |
| | | | | | | | | |
| | |
| | South Korea | 4.8% | | | | | | | |
| | | | 398,539 | | Hyundai Mobis Co., Ltd. | | | 85,709,228 |
| | |
| | | | 474,241 | | Hyundai Motor Co. | | | 66,791,521 |
| | |
| | | | 1,994,452 | | Kangwon Land, Inc. | | | 68,128,468 |
| | |
| | | | 523,248 | | KT&G Corp. | | | 45,619,851 |
| | |
| | | | 68,381 | | Samsung Electronics Co., Ltd. | | | 125,963,391 |
| | |
| | | | | | | | | 392,212,459 |
| | | | | | | | |
| | | | | | | | | |
| | |
| | Switzerland | 3.4% | | | | | | | |
| | | | 473,828 | | Compagnie Financière Richemont SA | | | 37,465,360 |
| | |
| | | | 2,351,279 | | Nestlé SA | | | 180,398,134 |
| | |
| | | | 3,742,100 | | UBS Group AG | | | 59,887,049 |
| | |
| | | | | | | | | 277,750,543 |
| | | | | | | | |
| | | | | | | | | |
| | |
| | Thailand | 0.2% | | | | | | | |
| | |
| | | | 33,397,500 | | Thaicom PCL | | | 19,243,958 |
| | | | | | | | | |
| | |
| | United Kingdom | 2.4% | | | | | | | |
| | | | 10,128,763 | | Antofagasta Plc | | | 105,900,820 |
| | |
| | | | 4,773,700 | | HSBC Holdings Plc | | | 38,930,140 |
| | |
| | | | 8,984,991 | | Millennium & Copthorne Hotels Plc | | | 49,644,690 |
| | |
| | | | | | | | | 194,475,650 |
| | | | | | | | |
| See Notes to Financial Statements. | 11 |
| IVA Worldwide Fund | IVA Funds |
| Schedule of Investments (unaudited) |
| March 31, 2017 |
| |
| | | | SHARES | | | DESCRIPTION | | | FAIR VALUE |
| | | | | | | | | | |
| | |
| | United States | 20.0% | | | | | | | | |
| | | | 14,434 | | | Alphabet Inc., Class ‘A’ (a) | | $ | 12,237,145 |
| | |
| | | | 45,665 | | | Alphabet Inc., Class ‘C’ (a) | | | 37,881,857 |
| | |
| | | | 940,901 | | | Amdocs Ltd. | | | 57,385,552 |
| | |
| | | | 741,612 | | | American Express Co. | | | 58,668,925 |
| | |
| | | | 349,766 | | | Aon Plc | | | 41,513,727 |
| | |
| | | | 4,294,892 | | | Bank of America Corp. | | | 101,316,502 |
| | |
| | | | 1,190 | | | Berkshire Hathaway Inc., Class ‘A’ (a) | | | 297,321,500 |
| | |
| | | | 285,555 | | | Berkshire Hathaway Inc., Class ‘B’ (a) | | | 47,596,307 |
| | |
| | | | 149,135 | | | Cimarex Energy Co. | | | 17,820,141 |
| | |
| | | | 1,384,235 | | | CVS Health Corp. | | | 108,662,448 |
| | |
| | | | 2,447,875 | | | DeVry Education Group Inc. | | | 86,777,169 |
| | |
| | | | 557,158 | | | Emerson Electric Co. | | | 33,351,478 |
| | |
| | | | 1,018,852 | | | Expeditors International of Washington, Inc. | | | 57,554,950 |
| | |
| | | | 468,024 | | | Flowserve Corp. | | | 22,661,722 |
| | |
| | | | 66,596 | | | Goldman Sachs Group, Inc. | | | 15,298,433 |
| | |
| | | | | | | Liberty Interactive Corp. QVC Group, | | | |
| | |
| | | | 2,524,713 | | | Series ‘A’ (a) | | | 50,544,754 |
| | |
| | | | 454,930 | | | Marsh & McLennan Cos., Inc. | | | 33,614,778 |
| | |
| | | | 1,006,921 | | | Mastercard Inc., Class ‘A’ | | | 113,248,405 |
| | |
| | | | 6,370,534 | | | News Corp., Class ‘A’ | | | 82,816,942 |
| | |
| | | | 1,285,193 | | | News Corp., Class ‘B’ | | | 17,350,106 |
| | |
| | | | 3,234,502 | | | Oracle Corp. | | | 144,291,134 |
| | |
| | | | 617,728 | | | Ralph Lauren Corp. | | | 50,418,959 |
| | |
| | | | 1,587,550 | | | Teradata Corp. (a) | | | 49,404,556 |
| | |
| | | | 428,963 | | | Tiffany & Co. | | | 40,880,174 |
| | |
| | | | 444,019 | | | United Technologies Corp. | | | 49,823,372 |
| | |
| | | | | | | | | | 1,628,441,036 |
| | | | | | | | | |
| | | | | | | TOTAL COMMON STOCKS | | | |
| | | | | | | (Cost — $2,906,449,224) | | | 4,130,722,510 |
| | |
| | PREFERRED STOCKS – 0.1% | | | | | | | | |
| | | | | | | | | | |
| | |
| | United States | 0.1% | | | | | | | | |
| | | | | | | CYS Investments Inc., Series ‘B’, | | | |
| | | | 297,755 | | | 7.5% due 4/30/2018 (d) | | | 6,997,243 |
| | |
| | | | | | | TOTAL PREFERRED STOCKS | | | |
| | | | | | | (Cost — $6,125,729) | | | 6,997,243 |
| | |
| | | | PRINCIPAL | | | | | | |
| | | | AMOUNT | | | | | | |
| | CORPORATE NOTES & BONDS – 2.0% | | | | | | | | |
| | | | | | | | | | |
| | |
| | Norway | 0.0% | | | | | | | | |
| | | | | | | Golden Close Maritime Corp. Ltd., | | | |
| | | | 154,101 | USD | | 8% due 3/29/2022 (c)(e)(f) | | | 154,101 |
| | |
| 12 | See Notes to Financial Statements. |
| IVA Worldwide Fund | IVA Funds |
| Schedule of Investments (unaudited) |
| March 31, 2017 |
| |
| | | | PRINCIPAL | | | | | | |
| | | | AMOUNT | | | DESCRIPTION | | | FAIR VALUE |
| | | | | | | | | | |
| | |
| | South Africa | 0.6% | | | | | | | | |
| | | | | | | Gold Fields Orogen Holding (BVI) Ltd., | | | |
| | | | 46,980,000 | USD | | 4.875% due 10/7/2020 (e) | | $ | 47,449,800 |
| | |
| | | | | | | | | | |
| | |
| | Switzerland | 0.1% | | | | | | | | |
| | | | 8,900,000 | EUR | | UBS AG, 7.152% due 12/21/2017 (g) | | | 9,962,266 |
| | |
| | | | | | | | | | |
| | |
| | United States | 1.3% | | | | | | | | |
| | | | | | | Brandywine Operating Partnership, LP, | | | |
| | | | 6,070,000 | USD | | 5.7% due 5/1/2017 | | | 6,088,356 |
| | |
| | | | 9,684,000 | USD | | Era Group Inc., 7.75% due 12/15/2022 | | | 9,272,430 |
| | |
| | | | | | | Intelsat Jackson Holdings Ltd.: | | | |
| | | | 8,702,000 | USD | | 7.5% due 4/1/2021 | | | 7,886,187 |
| | |
| | | | 29,476,000 | USD | | 5.5% due 8/1/2023 | | | 24,354,545 |
| | |
| | | | 34,108,000 | USD | | Joy Global Inc., 5.125% due 10/15/2021 | | | 36,640,314 |
| | |
| | | | | | | Rowan Cos., Inc.: | | | |
| | | | 17,524,000 | USD | | 4.875% due 6/1/2022 | | | 16,823,040 |
| | |
| | | | 3,786,000 | USD | | 4.75% due 1/15/2024 | | | 3,416,865 |
| | |
| | | | | | | | | | 104,481,737 |
| | | | | | | | | |
| | | | | | | TOTAL CORPORATE NOTES & BONDS | | | |
| | | | | | | (Cost — $138,309,743) | | | 162,047,904 |
| | |
| | | | | | | | | | |
| | CONVERTIBLE BONDS – 0.0% | | | | | | | | |
| | | | | | | | | | |
| | |
| | Norway | 0.0% | | | | | | | | |
| | | | | | | Golden Close Maritime Corp. Ltd., | | | |
| | | | 523,946 | USD | | 0% due 3/29/2022 (a)(c) | | | 104,789 |
| | |
| | | | | | | TOTAL CONVERTIBLE BONDS | | | |
| | | | | | | (Cost — $274,257) | | | 104,789 |
| | |
| | | | | | | | | | |
| | SOVEREIGN BONDS – 0.5% | | | | | | | | |
| | | | | | | | | | |
| | |
| | Singapore | 0.5% | | | | | | | | |
| | | | | | | Government of Singapore, | | | |
| | | | 48,812,000 | SGD | | 2.5% due 6/1/2019 | | | 35,791,512 |
| | |
| | | | | | | TOTAL SOVEREIGN BONDS | | | |
| | | | | | | (Cost — $36,924,723) | | | 35,791,512 |
| | |
| | | | OUNCES | | | | | | |
| | COMMODITIES – 5.8% | | | | | | | | |
| | | | 380,678 | | | Gold Bullion (a) | | | 474,887,580 |
| | |
| | | | | | | TOTAL COMMODITIES | | | |
| | | | | | | (Cost — $532,545,604) | | | 474,887,580 |
| | |
| See Notes to Financial Statements. | | 13 |
| IVA Worldwide Fund | IVA Funds |
| Schedule of Investments (unaudited) |
| March 31, 2017 |
| |
| | | | PRINCIPAL | | | | | | |
| | | | AMOUNT | | | DESCRIPTION | | | FAIR VALUE |
| | SHORT-TERM INVESTMENTS – 40.7% | | | |
| | | | | | | | | | |
| | |
| | Commercial Paper | 40.6% | | | | |
| | | | | | | Apple Inc.: | | | |
| | | | 40,000,000 | USD | | 0.69% due 4/6/2017 (e) | | $ | 39,995,427 |
| | |
| | | | 25,000,000 | USD | | 0.72% due 4/13/2017 (e) | | | 24,993,744 |
| | |
| | | | 30,000,000 | USD | | 0.71% due 4/19/2017 (e) | | | 29,988,932 |
| | |
| | | | 30,000,000 | USD | | 0.75% due 5/4/2017 (e) | | | 29,979,770 |
| | |
| | | | 22,000,000 | USD | | 0.85% due 5/11/2017 (e) | | | 21,981,935 |
| | |
| | | | 33,000,000 | USD | | 0.72% due 5/12/2017 (e) | | | 32,972,203 |
| | |
| | | | 25,000,000 | USD | | 0.83% due 5/25/2017 (e) | | | 24,971,927 |
| | |
| | | | 32,000,000 | USD | | BASF SE, 0.85% due 4/24/2017 (e) | | | 31,981,291 |
| | |
| | | | | | | Cisco Systems Inc.: | | | |
| | | | 16,000,000 | USD | | 0.66% due 4/5/2017 (e) | | | 15,998,209 |
| | |
| | | | 80,000,000 | USD | | 0.7% due 4/12/2017 (e) | | | 79,978,107 |
| | |
| | | | 50,400,000 | USD | | 0.8% due 5/3/2017 (e) | | | 50,360,037 |
| | |
| | | | | | | Clorox Co.: | | | |
| | | | 15,000,000 | USD | | 1.13% due 5/8/2017 (e) | | | 14,980,161 |
| | |
| | | | 15,000,000 | USD | | 1.18% due 5/9/2017 (e) | | | 14,979,606 |
| | |
| | | | | | | Coca-Cola Co.: | | | |
| | | | 66,000,000 | USD | | 0.79% due 4/19/2017 (e) | | | 65,972,586 |
| | |
| | | | 50,000,000 | USD | | 0.85% due 5/22/2017 (e) | | | 49,938,828 |
| | |
| | | | 15,000,000 | USD | | 0.85% due 5/23/2017 (e) | | | 14,981,273 |
| | |
| | | | 30,000,000 | USD | | 0.85% due 5/25/2017 (e) | | | 29,960,950 |
| | |
| | | | | | | Colgate-Palmolive Co.: | | | |
| | | | 24,000,000 | USD | | 0.76% due 4/12/2017 (e) | | | 23,993,792 |
| | |
| | | | 30,000,000 | USD | | 0.8% due 4/20/2017 (e) | | | 29,986,867 |
| | |
| | | | | | | Danaher Corp.: | | | |
| | | | 35,000,000 | USD | | 0.75% due 4/7/2017 (e) | | | 34,994,283 |
| | |
| | | | 40,000,000 | USD | | 0.75% due 4/10/2017 (e) | | | 39,990,600 |
| | |
| | | | 48,100,000 | USD | | 0.85% due 4/13/2017 (e) | | | 48,085,184 |
| | |
| | | | 40,000,000 | USD | | 0.75% due 4/17/2017 (e) | | | 39,983,737 |
| | |
| | | | 66,900,000 | USD | | 0.9% due 4/18/2017 (e) | | | 66,871,133 |
| | |
| | | | 14,000,000 | USD | | Dover Corp., 1.15% due 4/6/2017 (e) | | | 13,998,045 |
| | |
| | | | | | | Dow Chemical Co.: | | | |
| | | | 15,000,000 | USD | | 1.03% due 4/4/2017 | | | 14,998,157 |
| | |
| | | | 9,000,000 | USD | | 1.0% due 4/18/2017 | | | 8,994,744 |
| | |
| | | | | | | Engie SA: | | | |
| | | | 35,000,000 | USD | | 0.9% due 4/25/2017 (e) | | | 34,978,635 |
| | |
| | | | 26,000,000 | USD | | 0.74% due 5/11/2017 (e) | | | 25,973,113 |
| | |
| | | | 25,000,000 | USD | | 0.9% due 5/17/2017 (e) | | | 24,970,037 |
| | |
| 14 | | See Notes to Financial Statements. |
| IVA Worldwide Fund | IVA Funds |
| Schedule of Investments (unaudited) |
| March 31, 2017 |
| |
| | | | PRINCIPAL | | | | | | |
| | | | AMOUNT | | | DESCRIPTION | | | FAIR VALUE |
| | | | | | | | | | |
| | |
| | Commercial Paper | 40.6% (continued) | | | | |
| | |
| | | | | | | Essilor International: | | | |
| | | | 25,000,000 | USD | | 0.95% due 5/24/2017 (e) | | $ | 24,965,125 |
| | |
| | | | 25,000,000 | USD | | 0.95% due 5/25/2017 (e) | | | 24,964,403 |
| | |
| | | | | | | Estée Lauder Companies Inc., | | | |
| | | | 21,400,000 | USD | | 0.73% due 4/7/2017 (e) | | | 21,396,505 |
| | |
| | | | | | | Florida Power & Light Co.: | | | |
| | | | 24,000,000 | USD | | 1.0% due 4/6/2017 | | | 23,995,648 |
| | |
| | | | 40,000,000 | USD | | 0.87% due 4/7/2017 | | | 39,991,522 |
| | |
| | | | 25,000,000 | USD | | 0.92% due 4/17/2017 | | | 24,986,884 |
| | |
| | | | 25,000,000 | USD | | 0.91% due 4/19/2017 | | | 24,985,275 |
| | |
| | | | 15,000,000 | USD | | 1.07% due 5/12/2017 | | | 14,979,700 |
| | |
| | | | 10,000,000 | USD | | 1.12% due 5/12/2017 | | | 9,986,467 |
| | |
| | | | 10,000,000 | USD | | 1.12% due 5/15/2017 | | | 9,985,437 |
| | |
| | | | 31,100,000 | USD | | 1.15% due 5/18/2017 | | | 31,051,484 |
| | |
| | | | | | | Henkel Corp.: | | | |
| | | | 63,000,000 | USD | | 0.74% due 4/3/2017 (e) | | | 62,995,637 |
| | |
| | | | 44,500,000 | USD | | 0.74% due 4/5/2017 (e) | | | 44,494,833 |
| | |
| | | | 23,900,000 | USD | | 0.75% due 4/10/2017 (e) | | | 23,894,383 |
| | |
| | | | 25,000,000 | USD | | 0.98% due 6/1/2017 (e) | | | 24,959,312 |
| | |
| | | | | | | Johnson & Johnson: | | | |
| | | | 45,900,000 | USD | | 0.73% due 4/6/2017 (e) | | | 45,894,117 |
| | |
| | | | 7,000,000 | USD | | 0.77% due 4/18/2017 (e) | | | 6,997,253 |
| | |
| | | | 18,000,000 | USD | | 0.77% due 4/20/2017 (e) | | | 17,992,120 |
| | |
| | | | 20,200,000 | USD | | 0.77% due 4/28/2017 (e) | | | 20,187,337 |
| | |
| | | | 39,000,000 | USD | | 0.8% due 5/5/2017 (e) | | | 38,968,984 |
| | |
| | | | 50,500,000 | USD | | 0.8% due 5/9/2017 (e) | | | 50,454,866 |
| | |
| | | | | | | Kraft Heinz Foods Co., | | | |
| | | | 20,000,000 | USD | | 1.1% due 4/17/2017 (e) | | | 19,986,674 |
| | |
| | | | | | | L’Oréal USA Inc.: | | | |
| | | | 10,000,000 | USD | | 0.83% due 4/18/2017 (e) | | | 9,995,835 |
| | |
| | | | 46,000,000 | USD | | 0.79% due 4/21/2017 (e) | | | 45,977,460 |
| | |
| | | | 30,000,000 | USD | | 0.83% due 4/27/2017 (e) | | | 29,980,807 |
| | |
| | | | | | | Merck & Co. Inc.: | | | |
| | | | 32,700,000 | USD | | 0.81% due 4/28/2017 (e) | | | 32,679,501 |
| | |
| | | | 19,000,000 | USD | | 0.83% due 5/1/2017 (e) | | | 18,986,715 |
| | |
| | | | 13,000,000 | USD | | 0.84% due 5/10/2017 (e) | | | 12,988,054 |
| | |
| | | | | | | Microsoft Corp.: | | | |
| | | | 30,000,000 | USD | | 0.64% due 4/12/2017 (e) | | | 29,991,940 |
| | |
| | | | 30,000,000 | USD | | 0.75% due 5/10/2017 (e) | | | 29,971,433 |
| | |
| | | | 20,000,000 | USD | | 0.77% due 5/16/2017 (e) | | | 19,977,843 |
| | |
| | | | 26,000,000 | USD | | 0.82% due 5/18/2017 (e) | | | 25,969,840 |
| | |
| | | | 25,000,000 | USD | | 0.85% due 5/23/2017 (e) | | | 24,967,685 |
| | |
| See Notes to Financial Statements. | | 15 |
| IVA Worldwide Fund | IVA Funds |
| Schedule of Investments (unaudited) |
| March 31, 2017 |
| |
| | | | PRINCIPAL | | | | | | |
| | | | AMOUNT | | | DESCRIPTION | | | FAIR VALUE |
| | | | | | | | | | |
| | |
| | Commercial Paper | 40.6% (continued) | | | | |
| | | | | | | Nestlé Capital Corp., 0.7% | | | |
| | | | 35,000,000 | USD | | due 5/10/2017 (e) | | $ | 34,967,800 |
| | |
| | | | | | | Nestlé Finance International Ltd., | | | |
| | | | 30,000,000 | USD | | 0.77% due 5/8/2017 (e) | | | 29,973,970 |
| | |
| | | | | | | Novartis Finance Corp.: | | | |
| | | | 25,000,000 | USD | | 0.83% due 4/7/2017 (e) | | | 24,996,062 |
| | |
| | | | 30,000,000 | USD | | 0.72% due 4/10/2017 (e) | | | 29,993,200 |
| | |
| | | | 15,000,000 | USD | | 0.72% due 4/13/2017 (e) | | | 14,995,542 |
| | |
| | | | 25,000,000 | USD | | 0.73% due 4/18/2017 (e) | | | 24,989,587 |
| | |
| | | | 50,000,000 | USD | | 0.73% due 4/21/2017 (e) | | | 49,975,500 |
| | |
| | | | 22,000,000 | USD | | 0.85% due 4/26/2017 (e) | | | 21,986,479 |
| | |
| | | | 20,000,000 | USD | | 0.85% due 5/1/2017 (e) | | | 19,985,154 |
| | |
| | | | 38,900,000 | USD | | 0.85% due 5/4/2017 (e) | | | 38,868,148 |
| | |
| | | | 20,000,000 | USD | | 0.85% due 5/9/2017 (e) | | | 19,981,042 |
| | |
| | | | 1,400,000 | USD | | 0.87% due 5/22/2017 (e) | | | 1,398,186 |
| | |
| | | | | | | Procter & Gamble Co.: | | | |
| | | | 55,200,000 | USD | | 0.69% due 4/4/2017 (e) | | | 55,195,302 |
| | |
| | | | 25,000,000 | USD | | 0.7% due 4/5/2017 (e) | | | 24,997,337 |
| | |
| | | | 35,000,000 | USD | | 0.8% due 4/17/2017 (e) | | | 34,987,059 |
| | |
| | | | 22,000,000 | USD | | 0.8% due 4/24/2017 (e) | | | 21,988,311 |
| | |
| | | | 35,000,000 | USD | | 0.82% due 4/25/2017 (e) | | | 34,980,580 |
| | |
| | | | 20,000,000 | USD | | 0.81% due 4/27/2017 (e) | | | 19,987,955 |
| | |
| | | | | | | Roche Holdings, Inc.: | | | |
| | | | 17,000,000 | USD | | 0.66% due 4/4/2017 (e) | | | 16,998,481 |
| | |
| | | | 38,900,000 | USD | | 0.66% due 4/10/2017 (e) | | | 38,891,183 |
| | |
| | | | 15,000,000 | USD | | 0.62% due 4/11/2017 (e) | | | 14,996,246 |
| | |
| | | | 30,000,000 | USD | | 0.66% due 4/12/2017 (e) | | | 29,991,790 |
| | |
| | | | 20,000,000 | USD | | 0.62% due 4/13/2017 (e) | | | 19,994,056 |
| | |
| | | | 20,000,000 | USD | | 0.66% due 4/17/2017 (e) | | | 19,992,152 |
| | |
| | | | 10,000,000 | USD | | 0.67% due 4/19/2017 (e) | | | 9,995,588 |
| | |
| | | | 20,000,000 | USD | | 0.68% due 4/24/2017 (e) | | | 19,988,707 |
| | |
| | | | 42,400,000 | USD | | 0.67% due 4/25/2017 (e) | | | 42,375,002 |
| | |
| | | | 50,000,000 | USD | | 0.8% due 4/26/2017 (e) | | | 49,969,269 |
| | |
| | | | | | | Schlumberger Holdings Corp., | | | |
| | | | 19,000,000 | USD | | 0.95% due 4/3/2017 (e) | | | 18,998,288 |
| | |
| | | | | | | Siemens Capital Co., LLC, | | | |
| | | | 11,000,000 | USD | | 0.88% due 5/1/2017 (e) | | | 10,991,835 |
| | |
| | | | | | | Unilever Capital Corp.: | | | |
| | | | 20,000,000 | USD | | 0.75% due 4/3/2017 (e) | | | 19,998,675 |
| | |
| | | | 25,000,000 | USD | | 0.72% due 4/11/2017 (e) | | | 24,993,851 |
| | |
| | | | 17,200,000 | USD | | 0.84% due 5/1/2017 (e) | | | 17,187,529 |
| | |
| | | | 25,000,000 | USD | | 0.85% due 5/8/2017 (e) | | | 24,977,490 |
| | |
| 16 | | See Notes to Financial Statements. |
| IVA Worldwide Fund | IVA Funds |
| Schedule of Investments (unaudited) |
| March 31, 2017 |
| |
| | | | PRINCIPAL | | | | | | |
| | | | AMOUNT | | | DESCRIPTION | | | FAIR VALUE |
| | | | | | | | | | |
| | |
| | Commercial Paper | 40.6% (continued) | | | | |
| | | | | | | United Healthcare Co.: | | | |
| | | | 25,000,000 | USD | | 1.1% due 4/20/2017 (e) | | $ | 24,984,472 |
| | |
| | | | 44,500,000 | USD | | 1.2% due 5/26/2017 (e) | | | 44,418,110 |
| | |
| | | | 30,000,000 | USD | | 1.2% due 6/5/2017 (e) | | | 29,933,780 |
| | | | | | | United Parcel Service, Inc.: | | | |
| | | | 30,000,000 | USD | | 0.78% due 4/20/2017 (e) | | | 29,986,367 |
| | |
| | | | 23,000,000 | USD | | 0.76% due 4/24/2017 (e) | | | 22,987,319 |
| | |
| | | | 35,000,000 | USD | | 0.8% due 4/24/2017 (e) | | | 34,980,703 |
| | |
| | | | 25,000,000 | USD | | 0.8% due 4/27/2017 (e) | | | 24,984,381 |
| | |
| | | | 25,000,000 | USD | | 0.82% due 5/15/2017 (e) | | | 24,972,969 |
| | |
| | | | 25,000,000 | USD | | 0.82% due 5/17/2017 (e) | | | 24,971,669 |
| | |
| | | | 38,000,000 | USD | | 0.82% due 5/26/2017 (e) | | | 37,947,805 |
| | |
| | | | | | | United Technologies Corp., | | | |
| | | | 5,000,000 | USD | | 1.22% due 4/27/2017 (e) | | | 4,995,425 |
| | |
| | | | | | | Wal-Mart Stores, Inc.: | | | |
| | | | 40,000,000 | USD | | 0.79% due 4/3/2017 (e) | | | 39,997,450 |
| | |
| | | | 35,000,000 | USD | | 0.66% due 4/4/2017 (e) | | | 34,997,021 |
| | |
| | | | 11,000,000 | USD | | 0.68% due 4/4/2017 (e) | | | 10,999,064 |
| | |
| | | | 25,000,000 | USD | | 0.78% due 4/5/2017 (e) | | | 24,997,337 |
| | |
| | | | 20,000,000 | USD | | 0.75% due 4/10/2017 (e) | | | 19,995,700 |
| | |
| | | | 40,000,000 | USD | | 0.66% due 4/11/2017 (e) | | | 39,990,528 |
| | |
| | | | 40,100,000 | USD | | 0.8% due 4/11/2017 (e) | | | 40,090,504 |
| | |
| | | | | | | Walt Disney Co., | | | |
| | | | 40,000,000 | USD | | 0.84% due 5/19/2017 (e) | | | 39,952,524 |
| | |
| | | | | | | | | | 3,312,204,876 |
| | | | | | | | | |
| | |
| | Treasury Bills | 0.1% | | | | | | | | |
| | | | 5,000,000 | USD | | U.S. Treasury Bill, due 6/8/2017 (h) | | | 4,993,535 |
| | |
| | | | | | | TOTAL SHORT-TERM INVESTMENTS | | | |
| | | | | | | (Cost — $3,317,356,284) | | | 3,317,198,411 |
| | |
| | | | | | | TOTAL INVESTMENTS — 99.8% | | | |
| | | | | | | (Cost — $6,937,985,564) | | | 8,127,749,949 |
| | |
| | | | | | | Other Assets In Excess of | | | |
| | | | | | | Liabilities — 0.2% | | | 17,917,440 |
| | |
| | | | | | | TOTAL NET ASSETS — 100.0% | | $ | 8,145,667,389 |
| | | | | | | | | |
| See Notes to Financial Statements. | | 17 |
| IVA Worldwide Fund | IVA Funds |
| Schedule of Investments (unaudited) |
| March 31, 2017 |
| |
| | The IVA Worldwide Fund had the following open forward foreign currency contracts at March 31, 2017: |
| | | | | | | | | | | | | | USD | | NET |
| | | | | | | SETTLEMENT | | LOCAL | | | | | VALUE AT | | UNREALIZED |
| FOREIGN | | | | | | DATES | | CURRENCY | | | USD | | MARCH 31, | | APPRECIATION/ |
| CURRENCY | | | COUNTERPARTY | | | THROUGH | | AMOUNT | | | EQUIVALENT | | 2017 | | (DEPRECIATION) |
| |
| Contracts to Sell: |
| | | | State Street | | | | | | | | | | | | | | | | |
| Australian | | | Bank & | | | | | | | | | | | | | | | | |
dollar | | | Trust Co. | | | 06/07/2017 | | AUD 50,786,000 | | $ | 38,797,013 | | $ | 38,755,831 | | | $ | 41,182 | |
| |
| | | | State Street | | | | | | | | | | | | | | | | |
| | | | Bank & | | | | | | | | | | | | | | | | |
| euro | | | Trust Co. | | | 06/07/2017 | | EUR 63,705,000 | | | 67,396,705 | | | 68,160,717 | | | | (764,012 | ) |
| |
| | | | State Street | | | | | | | | | | | | | | | | |
| Japanese | | | Bank & | | | | | | | | | | | | | | | | |
yen | | | Trust Co. | | | 06/07/2017 | | JPY 17,686,200,000 | | | 155,618,837 | | | 159,237,781 | | | | (3,618,944 | ) |
| |
| South | | | State Street | | | | | | | | | | | | | | | | |
Korean | | | Bank & | | | | | | | | | | | | | | | | |
won | | | Trust Co. | | | 05/08/2017 | | KRW 131,760,000,000 | | | 116,639,940 | | | 117,942,979 | | | | (1,303,039 | ) |
| |
| Net Unrealized Depreciation on Open Forward Foreign Currency Contracts | | | | | | | $ | (5,644,813 | ) |
| |
| Abbreviations used in this schedule: |
| | | |
| ADR | — | American Depositary Receipt |
| AUD | — | Australian dollar |
| EUR | — | euro |
| JPY | — | Japanese yen |
| KRW | — | South Korean won |
| NV | — | Non-voting |
| SGD | — | Singapore dollar |
| USD | — | United States dollar |
| 18 | | See Notes to Financial Statements. |
| IVA Worldwide Fund | IVA Funds |
| Schedule of Investments (unaudited) |
| March 31, 2017 |
| |
| | (a) | | Non-income producing investment. |
| | (b) | | Issuer of the security is an affiliate of the IVA Worldwide Fund as defined by the Investment Company Act of 1940. An affiliate is deemed as a company in which the IVA Worldwide Fund indirectly or directly has ownership of at least 5% of the company’s outstanding voting securities. See Schedule of Affiliates below for additional information. |
| | | | | | | | | | | | | | | | | | | | | | | | | | | | | |
| | |
| | Schedule of Affiliates | | | | | | | | | | | | | | | | | | | | | | | | | |
| | | | SHARES | | | | | | | | | | SHARES | | | | | | | | | | | |
| | | | HELD AT | | | | | | | | | | HELD AT | | FAIR VALUE AT | | | | | | | |
| | | | SEPTEMBER 30, | | SHARE | | SHARE | | MARCH 31, | | MARCH 31, | | REALIZED | | DIVIDEND |
| | SECURITY | | 2016 | | ADDITIONS | | REDUCTIONS | | 2017 | | 2017 | | GAIN/(LOSS) | | INCOME* |
| | |
| | DeVry | | | | | | | | | | | | | | | | | | | | | | | | | | | |
| | Education | | | | | | | | | | | | | | | | | | | | | | | | | | | |
| | Group | | | | | | | | | | | | | | | | | | | | | | | | | | | |
| | Inc.** | | | 6,567,795 | | | | — | | | | 4,119,920 | | | | 2,447,875 | | | | — | | | $ | (16,481,162 | ) | | $ | 803,819 |
| | |
| | Icom Inc. | | | 758,200 | | | | — | | | | 2,500 | | | | 755,700 | | | $ | 17,370,307 | | | | (88 | ) | | | 68,060 |
| | |
| | Net 1 U.E.P.S. | | | | | | | | | | | | | | | | | | | | | | | | | | | |
| | Technologies | | | | | | | | | | | | | | | | | | | | | | | | | | | |
| | Inc.** | | | 2,835,280 | | | | — | | | | 299,864 | | | | 2,535,416 | | | | — | | | | 552,279 | | | | — |
| | |
| | Total | | | | | | | | | | | | | | | | | | $ | 17,370,307 | | | $ | (15,928,971 | ) | | $ | 871,879 |
| | |
| | * | | Dividend income is gross of withholding taxes. |
| | ** | | Non-affiliated at March 31, 2017. |
| | | | |
| | (c) | | Security is deemed illiquid. As of March 31, 2017, the value of these illiquid securities amounted to 0.0% of total net assets. |
| | (d) | | Cumulative redeemable preferred stock. The date shown represents the first optional call date. |
| | (e) | | Security is exempt from registration under Rule 144A or Section 4(2) of the Securities Act of 1933 (the “1933 Act”). Any resale of these securities must generally be effected through a sale that is registered under the 1933 Act or otherwise exempted from such registration requirements. |
| | (f) | | Payment-in-kind security for which the issuer may pay interest with additional debt securities or cash. |
| | (g) | | Fixed-to-float perpetual bond. The security has no maturity date. The date shown represents the next call date. |
| | (h) | | This security is held at the custodian as collateral for forward foreign currency contracts sold. As of March 31, 2017, portfolio securities valued at $4,993,535 were segregated to cover collateral requirements. |
| IVA International Fund | IVA Funds |
| Performance (unaudited) | As of March 31, 2017 |
| Average Annual Total Returns as of March 31, 2017 | | Six Months(a) | | One Year | | Five Year | | Since Inception(b) |
| | | | | | | | | |
| Class A | | | 4.25 | % | | | 8.31 | % | | | 6.01 | % | | | 8.39 | % |
| Class A (with a 5% maximum initial sales charge) | | | -0.98 | % | | | 2.93 | % | | | 4.92 | % | | | 7.74 | % |
| Class C | | | 3.86 | % | | | 7.55 | % | | | 5.23 | % | | | 7.58 | % |
| Class I | | | 4.38 | % | | | 8.57 | % | | | 6.28 | % | | | 8.66 | % |
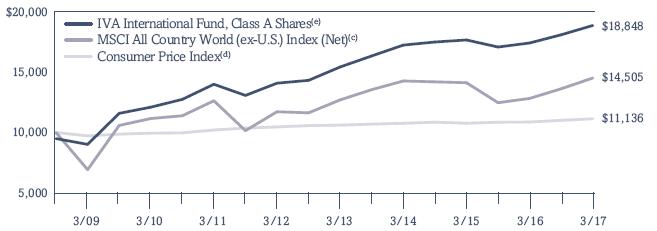
| MSCI All Country World (ex-U.S.) Index (Net)(c) | | | 6.51 | % | | | 13.13 | % | | | 4.36 | % | | | 4.47 | % |
| Consumer Price Index(d) | | | 1.14 | % | | | 2.45 | % | | | 1.28 | % | | | 1.27 | % |
| Growth of a $10,000 Initial Investment | |
| | |
| |
| (a) | | Total returns for periods of less than one year are not annualized. |
| (b) | | The Fund commenced investment operations on October 1, 2008. |
| (c) | | The MSCI All Country World (ex-U.S.) Index (Net) is an unmanaged, free float-adjusted, market capitalization weighted index composed of stocks of companies located in countries throughout the world, excluding the United States. It is designed to measure equity market performance in global developed and emerging markets outside the United States. The index includes reinvestment of dividends, net of foreign withholding taxes. Please note that an investor cannot invest directly in an index. |
| (d) | | The Consumer Price Index examines the weighted average of prices of a basket of consumer goods and services, such as transportation, food and medical care. Please note that an investor cannot invest directly in an index. |
| (e) | | Hypothetical illustration of $10,000 invested in Class A shares on October 1, 2008, assuming the deduction of the maximum initial sales charge of 5% at the time of investment for Class A shares and the reinvestment of all distributions, including returns of capital, if any, at net asset value through March 31, 2017. The performance of the Fund’s other classes may be greater or less than the Class A shares’ performance indicated on this chart depending on whether greater or lesser sales charges and fees were incurred by shareholders investing in the other classes. |
Past performance is no guarantee of future results. The performance data quoted represents past performance and current returns may be lower or higher. The investment return and principal value will fluctuate so that an investor’s shares, when redeemed, may be worth more or less than the original cost. The returns do not reflect the deduction of taxes that a shareholder would pay on Fund distributions or the redemption of Fund shares. To obtain performance information current to the most recent month-end, please call 866-941-4482.
The maximum sales charge for Class A shares is 5.00%. Class C shares may include a 1.00% contingent deferred sales charge for the first year only. The expense ratios for the Fund are as follows: 1.24% (Class A shares); 1.99% (Class C shares); and 0.99% (Class I shares). These expense ratios are as stated in the most recent Prospectus dated January 31, 2017. More recent expense ratios can be found in the Financial Highlights section of this Semi-Annual Report.
| IVA International Fund | IVA Funds |
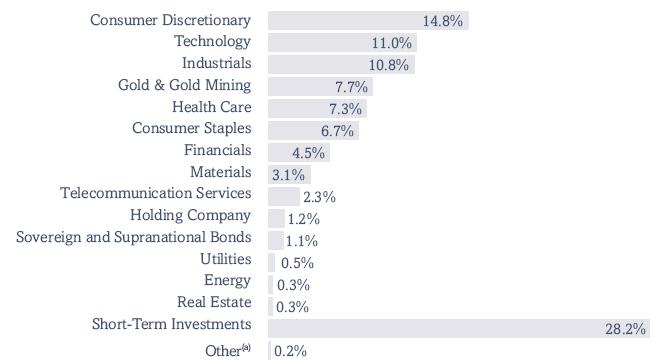
| Portfolio Composition (unaudited) | As of March 31, 2017 |
| Asset Allocation (As a Percent of Total Net Assets) | |
| | |
| Sector Allocation (As a Percent of Total Net Assets) | |
| | |
| Top 10 Positions (As a Percent of Total Net Assets)(b) | |
| | |
| Gold Bullion | | 7.1 | % |
| |
| Astellas Pharma Inc. | | 4.0 | % |
| |
| Bureau Veritas SA | | 3.1 | % |
| |
| Nestlé SA | | 2.5 | % |
| |
| Alten SA | | 2.3 | % |
| |
| Samsung Electronics Co., Ltd. | | 2.3 | % |
| |
| Antofagasta Plc | | 1.8 | % |
| |
| Airbus Group SE | | 1.6 | % |
| |
| First Resources Ltd. | | 1.5 | % |
| |
| Hyundai Mobis Co., Ltd. | | 1.5 | % |
| |
| Top 10 positions represent 27.7% of total net assets. |
| (a) | | Other represents unrealized gains and losses on forward foreign currency contracts and other assets and liabilities. |
| (b) | | Short-Term Investments are not included. |
| IVA International Fund | | IVA Funds |
| Schedule of Investments (unaudited) |
| March 31, 2017 |
| |
| | | | SHARES | | DESCRIPTION | | | FAIR VALUE |
| | COMMON STOCKS – 61.3% | | | | | | | |
| | |
| | Argentina | 0.0% | | | | | | | |
| | | | 876 | | Nortel Inversora SA, Series ‘B’, ADR | | $ | 22,776 |
| | |
| | | | | | | | | |
| | |
| | Australia | 0.0% | | | | | | | |
| | | | 1,351,864 | | Programmed Maintenance Services Ltd. | | | 1,936,544 |
| | |
| | | | | | | | | |
| | |
| | Bermuda | 1.1% | | | | | | | |
| | | | 976,326 | | Jardine Strategic Holdings Ltd. | | | 41,005,692 |
| | |
| | | | | | | | | |
| | |
| | Brazil | 0.3% | | | | | | | |
| | | | 1,515,600 | | TOTVS SA | | | 13,434,453 |
| | |
| | | | | | | | | |
| | |
| | Canada | 0.3% | | | | | | | |
| | | | 3,307,348 | | Uranium Participation Corp. (a) | | | 10,097,254 |
| | |
| | | | | | | | | |
| | |
| | Chile | 0.4% | | | | | | | |
| | | | 551,948 | | Compañía Cervecerías Unidas SA, ADR | | | 13,947,726 |
| | |
| | | | | | | | | |
| | |
| | China | 2.7% | | | | | | | |
| | | | 96,761 | | Baidu Inc., ADR (a) | | | 16,693,208 |
| | |
| | | | 40,065,030 | | Clear Media Ltd. (b) | | | 46,398,414 |
| | |
| | | | 3,441,970 | | Phoenix New Media Ltd., ADR (a) | | | 12,012,475 |
| | |
| | | | 59,788,000 | | Phoenix Satellite Television Holdings Ltd. | | | 11,155,195 |
| | |
| | | | 108,509,000 | | Springland International Holdings Ltd. | | | 19,407,773 |
| | |
| | | | | | | | | 105,667,065 |
| | | | | | | | |
| | | | | | | | | |
| | |
| | France | 11.6% | | | | | | | |
| | | | 1,186,888 | | Alten SA | | | 91,012,435 |
| | |
| | | | 2,076,828 | | Altran Technologies SA | | | 34,961,532 |
| | |
| | | | 12,736,006 | | Bolloré SA | | | 49,374,317 |
| | |
| | | | 84,610 | | Bolloré SA NV (a) | | | 321,333 |
| | |
| | | | 5,779,454 | | Bureau Veritas SA | | | 121,923,166 |
| | |
| | | | 188,235 | | DOM Security SA (b) | | | 11,446,117 |
| | |
| | | | 1,463,806 | | Engie SA | | | 20,737,888 |
| | |
| | | | 184,201 | | Euler Hermes Group | | | 16,926,992 |
| | |
| | | | 30,023 | | Financière de l’Odet SA | | | 25,142,396 |
| | |
| | | | 79,189 | | Robertet SA | | | 29,567,583 |
| | |
| | | | 5,900 | | Robertet SA-CI (c) | | | 1,724,589 |
| | |
| | | | 300,428 | | Séché Environnement SA | | | 8,852,114 |
| | |
| | | | 167,314 | | Sodexo SA | | | 19,678,582 |
| | |
| | | | 155,834 | | Thales SA | | | 15,071,652 |
| | |
| | | | 29,983 | | Wendel SA | | | 3,799,920 |
| | |
| | | | | | | | | 450,540,616 |
| | | | | | | | |
| | | | | | | | | |
| | |
| | Germany | 1.3% | | | | | | | |
| | | | 228,887 | | Bayerische Motoren Werke AG | | | 20,879,542 |
| | |
| | | | 225,710 | | Siemens AG | | | 30,917,100 |
| | |
| | | | | | | | | 51,796,642 |
| | | | | | | | |
| 22 | | See Notes to Financial Statements. |
| IVA International Fund | | IVA Funds |
| Schedule of Investments (unaudited) |
| March 31, 2017 |
| |
| | | | SHARES | | DESCRIPTION | | | FAIR VALUE |
| | | | | | | | | |
| | |
| | Hong Kong | 2.7% | | | | | | | |
| | | | 40,491,000 | | APT Satellite Holdings Ltd. | | $ | 21,622,293 |
| | |
| | | | | | Asia Satellite Telecommunications | | | |
| | |
| | | | 15,821,000 | | Holdings Ltd. (a) | | | 19,543,409 |
| | |
| | | | 1,900,386 | | Henderson Land Development Co. Ltd. | | | 11,774,250 |
| | |
| | | | 44,448,917 | | Hongkong & Shanghai Hotels Ltd. | | | 52,276,021 |
| | |
| | | | | | | | | 105,215,973 |
| | | | | | | | |
| | | | | | | | | |
| | |
| | India | 0.8% | | | | | | | |
| | | | 425,750 | | Bajaj Holdings and Investment Ltd. | | | 14,227,728 |
| | |
| | | | 47,141,230 | | South Indian Bank Ltd. | | | 15,535,879 |
| | |
| | | | | | | | | 29,763,607 |
| | | | | | | | |
| | | | | | | | | |
| | |
| | Indonesia | 0.3% | | | | | | | |
| | | | 288,943,800 | | PT Bank Bukopin Tbk | | | 13,552,203 |
| | |
| | | | | | | | | |
| | |
| | Japan | 14.4% | | | | | | | |
| | | | 1,325,570 | | Arcland Sakamoto Co., Ltd. | | | 15,931,130 |
| | |
| | | | 285,100 | | As One Corp. | | | 12,343,322 |
| | |
| | | | 11,760,600 | | Astellas Pharma Inc. | | | 154,864,274 |
| | |
| | | | 1,135,200 | | Azbil Corp. | | | 38,135,705 |
| | |
| | | | 73,800 | | The Bank of Okinawa Ltd. | | | 2,823,929 |
| | |
| | | | 379,200 | | Benesse Holdings Inc. | | | 11,853,193 |
| | |
| | | | 1,010,100 | | Cosel Co., Ltd. | | | 13,727,488 |
| | |
| | | | 371,100 | | Daiseki Co., Ltd. | | | 7,566,667 |
| | |
| | | | 605,800 | | Doshisha Co., Ltd. | | | 11,214,891 |
| | |
| | | | 214,500 | | Earth Chemical Co., Ltd. | | | 11,502,425 |
| | |
| | | | 4,096,300 | | F@N Communications, Inc. (b) | | | 30,575,993 |
| | |
| | | | 175,400 | | FANUC Corp. | | | 35,952,825 |
| | |
| | | | 819,800 | | Hi-Lex Corp. | | | 21,744,987 |
| | |
| | | | 662,700 | | Icom Inc. | | | 15,232,635 |
| | |
| | | | 105,900 | | Medikit Co., Ltd. | | | 4,432,713 |
| | |
| | | | 413,600 | | Miraca Holdings Inc. | | | 19,021,216 |
| | |
| | | | 780,000 | | Nitto Kohki Co., Ltd. | | | 17,858,798 |
| | |
| | | | 268,900 | | Okinawa Cellular Telephone Co. | | | 8,707,307 |
| | |
| | | | 1,011,000 | | Rohto Pharmaceutical Co., Ltd. | | | 18,943,196 |
| | |
| | | | 171,300 | | San-A Co., Ltd. | | | 7,785,664 |
| | |
| | | | 290,400 | | Sankyo Co., Ltd. | | | 9,703,476 |
| | |
| | | | 10,600 | | Secom Joshinetsu Co., Ltd. | | | 326,579 |
| | |
| | | | 276,000 | | Seven & i Holdings Co., Ltd. | | | 10,813,905 |
| | |
| | | | 495,575 | | Shingakukai Co., Ltd. | | | 2,599,621 |
| | |
| | | | 300,650 | | Shofu Inc. | | | 3,572,801 |
| | |
| | | | 4,500 | | SK Kaken Co., Ltd. | | | 440,582 |
| | |
| | | | 556,900 | | Techno Medica Co., Ltd. (b) | | | 10,604,761 |
| | |
| | | | 637,600 | | Toho Co., Ltd. | | | 16,900,724 |
| | |
| | | | 255,200 | | Transcosmos Inc. | | | 5,996,615 |
| | |
| | | | 8,366,000 | | Yahoo Japan Corp. | | | 38,625,025 |
| | |
| | | | | | | | | 559,802,447 |
| | | | | | | | |
| See Notes to Financial Statements. | 23 |
| IVA International Fund | | IVA Funds |
| Schedule of Investments (unaudited) |
| March 31, 2017 |
| |
| | | | SHARES | | DESCRIPTION | | | FAIR VALUE |
| | | | | | | | | |
| | |
| | Malaysia | 1.3% | | | | | | | |
| | | | 40,205,300 | | Genting Malaysia Berhad | | $ | 49,512,797 |
| | |
| | | | | | | | | |
| | |
| | Mexico | 0.9% | | | | | | | |
| | | | 1,133,839 | | Corporativo Fragua, SAB de CV | | | 12,778,683 |
| | |
| | | | 11,084,097 | | Grupo Comercial Chedraui SAB de CV | | | 23,888,331 |
| | | | | | | | | 36,667,014 |
| | | | | | | | |
| | | | | | | | | |
| | |
| | Netherlands | 1.6% | | | | | | | |
| | | | 834,110 | | Airbus Group SE | | | 63,471,459 |
| | |
| | | | | | | | | |
| | |
| | Norway | 0.0% | | | | | | | |
| | | | 37,272 | | Golden Close Maritime Corp. Ltd. (a)(c) | | | — |
| | |
| | | | | | | | | |
| | |
| | Singapore | 2.8% | | | | | | | |
| | | | 42,447,700 | | First Resources Ltd. | | | 58,868,741 |
| | |
| | | | 7,043,020 | | Haw Par Corp. Ltd. | | | 50,449,341 |
| | |
| | | | | | | | | 109,318,082 |
| | | | | | | | |
| | | | | | | | | |
| | |
| | South Africa | 0.8% | | | | | | | |
| | | | 2,444,574 | | Net 1 U.E.P.S. Technologies Inc. (a) | | | 29,897,140 |
| | |
| | | | | | | | | |
| | |
| | South Korea | 7.3% | | | | | | | |
| | | | 75,334 | | DONGKOOK Pharmaceutical Co., Ltd. | | | 4,338,290 |
| | |
| | | | 80,618 | | Fursys Inc. | | | 2,296,059 |
| | |
| | | | 268,785 | | Hyundai Mobis Co., Ltd. | | | 57,804,518 |
| | |
| | | | 252,562 | | Hyundai Motor Co. | | | 35,570,522 |
| | |
| | | | 1,536,843 | | Kangwon Land, Inc. | | | 52,497,007 |
| | |
| | | | 408,731 | | KT&G Corp. | | | 35,635,583 |
| | |
| | | | 48,803 | | Samsung Electronics Co., Ltd. | | | 89,899,115 |
| | |
| | | | 298,218 | | WHANIN Pharmaceutical Co., Ltd. | | | 4,200,066 |
| | |
| | | | | | | | | 282,241,160 |
| | | | | | | | |
| | | | | | | | | |
| | |
| | Switzerland | 4.4% | | | | | | | |
| | | | 347,236 | | Compagnie Financière Richemont SA | | | 27,455,789 |
| | |
| | | | 1,271,232 | | Nestlé SA | | | 97,533,249 |
| | |
| | | | 2,755,821 | | UBS Group AG | | | 44,103,041 |
| | |
| | | | | | | | | 169,092,079 |
| | | | | | | | |
| | | | | | | | | |
| | |
| | Thailand | 0.5% | | | | | | | |
| | | | 30,705,300 | | Thaicom PCL | | | 17,692,687 |
| | |
| | | | | | | | | |
| | |
| | United Kingdom | 4.3% | | | | | | | |
| | | | 6,545,486 | | Antofagasta Plc | | | 68,436,030 |
| | |
| | | | 3,999,945 | | HSBC Holdings Plc | | | 32,620,068 |
| | |
| | | | 1,208,449 | | Jardine Lloyd Thompson Group Plc | | | 17,139,230 |
| | |
| | | | 6,594,416 | | Millennium & Copthorne Hotels Plc | | | 36,436,068 |
| | |
| | | | 5,019,571 | | Mitie Group Plc | | | 13,955,342 |
| | |
| | | | | | | | | 168,586,738 |
| | | | | | | | |
| 24 | See Notes to Financial Statements. |
| IVA International Fund | | IVA Funds |
| Schedule of Investments (unaudited) |
| March 31, 2017 |
| |
| | | | SHARES | | | DESCRIPTION | | | FAIR VALUE |
| | | | | | | | | | |
| | |
| | United States | 1.5% | | | | | | | | |
| | | | 3,096,223 | | | News Corp., Class ‘A’ | | $ | 40,250,899 |
| | |
| | | | 1,216,344 | | | News Corp., Class ‘B’ | | | 16,420,644 |
| | |
| | | | | | | | | | 56,671,543 |
| | | | | | | | | |
| | | | | | | TOTAL COMMON STOCKS | | | |
| | |
| | | | | | | (Cost — $2,014,512,650) | | | 2,379,933,697 |
| | | | PRINCIPAL | | | | | | |
| | | | AMOUNT | | | | | | |
| | CORPORATE NOTES & BONDS – 2.1% | | | |
| | | | | | | | | | |
| | |
| | Norway | 0.3% | | | | | | | | |
| | | | | | | Golden Close Maritime Corp. Ltd., | | | |
| | | | 74,103 | USD | | 8% due 3/29/2022 (c)(d)(e) | | | 74,103 |
| | |
| | | | | | | Stolt-Nielsen Ltd., | | | |
| | | | 77,500,000 | NOK | | 5.69% due 3/19/2018 (c)(f) | | | 9,271,189 |
| | |
| | | | | | | | | | 9,345,292 |
| | | | | | | | | |
| | | | | | | | | | |
| | |
| | Singapore | 0.3% | | | | | | | | |
| | | | | | | DBS Capital Funding II Corp., | | | |
| | | | 7,750,000 | SGD | | 5.75% due 6/15/2018 (g) | | | 5,773,344 |
| | |
| | | | | | | United Overseas Bank Ltd., | | | |
| | | | 8,250,000 | SGD | | 4.9% due 7/23/2018 (g) | | | 6,081,061 |
| | |
| | | | | | | | | | 11,854,405 |
| | | | | | | | | |
| | | | | | | | | | |
| | |
| | South Africa | 0.6% | | | | | | | | |
| | | | | | | Gold Fields Orogen Holding (BVI) Ltd., | | | |
| | | | 23,118,000 | USD | | 4.875% due 10/7/2020 (d) | | | 23,349,180 |
| | |
| | Switzerland | 0.1% | | | | | | | | |
| | | | 4,500,000 | EUR | | UBS AG, 7.152% due 12/21/2017 (g) | | | 5,037,101 |
| | |
| | United Kingdom | 0.2% | | | | | | | | |
| | | | | | | Avanti Communications Group Plc: | | | |
| | | | 5,188,226 | USD | | 10% due 10/1/2021 (c)(d)(e) | | | 4,747,227 |
| | |
| | | | 8,523,925 | USD | | 12% due 10/1/2023 (c)(d)(e) | | | 3,494,809 |
| | |
| | | | | | | | | | 8,242,036 |
| | | | | | | | | |
| | | | | | | | | | |
| | |
| | United States | 0.6% | | | | | | | | |
| | | | | | | Intelsat Jackson Holdings Ltd.: | | | |
| | | | 4,096,000 | USD | | 7.5% due 4/1/2021 | | | 3,712,000 |
| | |
| | | | 13,873,000 | USD | | 5.5% due 8/1/2023 | | | 11,462,566 |
| | |
| | | | | | | Rowan Cos., Inc.: | | | |
| | | | 8,168,000 | USD | | 4.875% due 6/1/2022 | | | 7,841,280 |
| | |
| | | | 1,586,000 | USD | | 4.75% due 1/15/2024 | | | 1,431,365 |
| | |
| | | | | | | | | | 24,447,211 |
| | | | | | | | | |
| | | | | | | TOTAL CORPORATE NOTES & BONDS | | | |
| | | | | | | (Cost — $86,345,045) | | | 82,275,225 |
| | |
| See Notes to Financial Statements. | 25 |
| IVA International Fund | | IVA Funds |
| Schedule of Investments (unaudited) |
| March 31, 2017 |
| |
| | | | PRINCIPAL | | | | | | |
| | | | AMOUNT | | | DESCRIPTION | | | FAIR VALUE |
| | | | | | | | | | |
| | CONVERTIBLE BONDS – 0.0% | | | |
| | | | | | | | | | |
| | |
| | Norway | 0.0% | | | | | | | | |
| | | | | | | Golden Close Maritime Corp. Ltd., | | | |
| | | | 251,952 | USD | | 0% due 3/29/2022 (c)(d) | | $ | 50,390 |
| | |
| | | | | | | TOTAL CONVERTIBLE BONDS | | | |
| | | | | | | (Cost — $131,883) | | | 50,390 |
| | |
| | SOVEREIGN AND SUPRANATIONAL BONDS – 1.1% | | | |
| | | | | | | | | | |
| | |
| | Luxembourg | 0.1% | | | | | | | | |
| | | | | | | European Investment Bank, | | | |
| | | | 37,500,000 | NOK | | 1.125% due 5/15/2020 | | | 4,385,869 |
| | |
| | | | | | | | | | |
| | |
| | Singapore | 1.0% | | | | | | | | |
| | | | | | | Government of Singapore: | | | |
| | | | 6,786,000 | SGD | | 2.375% due 4/1/2017 | | | 4,852,098 |
| | |
| | | | 21,142,000 | SGD | | 0.5% due 4/1/2018 | | | 15,032,229 |
| | |
| | | | 26,781,000 | SGD | | 2.5% due 6/1/2019 | | | 19,637,230 |
| | |
| | | | | | | | | | 39,521,557 |
| | | | | | | | | |
| | | | | | | TOTAL SOVEREIGN AND SUPRANATIONAL BONDS | | | |
| | | | | | | (Cost — $45,830,816) | | | 43,907,426 |
| | |
| | | | OUNCES | | | | | | |
| | COMMODITIES – 7.1% | | | |
| | | | 220,108 | | | Gold Bullion (a) | | | 274,580,005 |
| | |
| | | | | | | TOTAL COMMODITIES | | | |
| | | | | | | (Cost — $308,169,069) | | | 274,580,005 |
| | |
| | | | PRINCIPAL | | | | | | |
| | | | AMOUNT | | | | | | |
| | SHORT-TERM INVESTMENTS – 28.2% | | | |
| | | | | | | | | | |
| | |
| | Commercial Paper | 28.1% | | | | | | | | |
| | | | | | | Apple Inc.: | | | |
| | | | 23,000,000 | USD | | 0.69% due 4/6/2017 (d) | | | 22,997,370 |
| | |
| | | | 13,000,000 | USD | | 0.72% due 4/13/2017 (d) | | | 12,996,747 |
| | |
| | | | 12,900,000 | USD | | 0.85% due 5/11/2017 (d) | | | 12,889,407 |
| | |
| | | | 9,000,000 | USD | | 0.72% due 5/12/2017 (d) | | | 8,992,419 |
| | |
| | | | 10,000,000 | USD | | BASF SE, 0.85% due 4/24/2017 (d) | | | 9,994,153 |
| | |
| | | | | | | Cisco Systems Inc.: | | | |
| | | | 5,000,000 | USD | | 0.66% due 4/5/2017 (d) | | | 4,999,440 |
| | |
| | | | 20,000,000 | USD | | 0.7% due 4/12/2017 (d) | | | 19,994,527 |
| | |
| | | | 15,100,000 | USD | | 0.8% due 5/3/2017 (d) | | | 15,088,027 |
| | |
| | | | 5,000,000 | USD | | Clorox Co., 1.13% due 5/8/2017 (d) | | | 4,993,387 |
| | |
| | | | | | | Coca-Cola Co.: | | | |
| | | | 28,000,000 | USD | | 0.79% due 4/19/2017 (d) | | | 27,988,370 |
| | |
| | | | 10,000,000 | USD | | 0.85% due 5/22/2017 (d) | | | 9,987,766 |
| | |
| | | | 6,000,000 | USD | | 0.85% due 5/23/2017 (d) | | | 5,992,509 |
| | |
| | | | 9,000,000 | USD | | 0.85% due 5/25/2017 (d) | | | 8,988,285 |
| | |
| | | | | | | Colgate-Palmolive Co.: | | | |
| | | | 4,000,000 | USD | | 0.76% due 4/12/2017 (d) | | | 3,998,965 |
| | |
| | | | 5,000,000 | USD | | 0.8% due 4/20/2017 (d) | | | 4,997,811 |
| | |
| 26 | See Notes to Financial Statements. |
| IVA International Fund | | IVA Funds |
| Schedule of Investments (unaudited) |
| March 31, 2017 |
| |
| | | | PRINCIPAL
AMOUNT | | | DESCRIPTION | | | FAIR VALUE |
| | | | | | | | | | |
| | |
| | Commercial Paper | 28.1% (continued) | | | | |
| | | | | | | Danaher Corp.: | | | |
| | | | 10,100,000 | USD | | 0.85% due 4/13/2017 (d) | | $ | 10,096,889 |
| | |
| | | | 36,200,000 | USD | | 0.9% due 4/18/2017 (d) | | | 36,184,380 |
| | |
| | | | 7,000,000 | USD | | Dover Corp., 1.15% due 4/6/2017 (d) | | | 6,999,022 |
| | |
| | | | | | | Dow Chemical Co.: | | | |
| | | | 15,000,000 | USD | | 1.03% due 4/4/2017 | | | 14,998,157 |
| | |
| | | | 8,000,000 | USD | | 1.0% due 4/17/2017 | | | 7,995,599 |
| | |
| | | | | | | Engie SA: | | | |
| | | | 15,000,000 | USD | | 0.9% due 4/25/2017 (d) | | | 14,990,844 |
| | |
| | | | 12,000,000 | USD | | 0.74% due 5/11/2017 (d) | | | 11,987,591 |
| | |
| | | | | | | Estée Lauder Companies Inc., | | | |
| | | | 10,900,000 | USD | | 0.73% due 4/7/2017 (d) | | | 10,898,220 |
| | |
| | | | | | | Florida Power & Light Co.: | | | |
| | | | 10,000,000 | USD | | 0.87% due 4/7/2017 | | | 9,997,881 |
| | |
| | | | 8,000,000 | USD | | 0.91% due 4/19/2017 | | | 7,995,288 |
| | |
| | | | 7,000,000 | USD | | 1.12% due 5/12/2017 | | | 6,990,527 |
| | |
| | | | 7,000,000 | USD | | 1.12% due 5/15/2017 | | | 6,989,806 |
| | |
| | | | 4,000,000 | USD | | 1.15% due 5/18/2017 | | | 3,993,760 |
| | |
| | | | | | | Henkel Corp.: | | | |
| | | | 5,000,000 | USD | | 0.74% due 4/5/2017 (d) | | | 4,999,419 |
| | |
| | | | 20,000,000 | USD | | 0.75% due 4/10/2017 (d) | | | 19,995,300 |
| | |
| | | | 6,000,000 | USD | | 0.74% due 4/12/2017 (d) | | | 5,998,298 |
| | |
| | | | 25,000,000 | USD | | 0.75% due 4/18/2017 (d) | | | 24,989,213 |
| | |
| | | | | | | Johnson & Johnson: | | | |
| | | | 7,900,000 | USD | | 0.77% due 4/18/2017 (d) | | | 7,896,899 |
| | |
| | | | 8,000,000 | USD | | 0.77% due 4/20/2017 (d) | | | 7,996,498 |
| | |
| | | | 20,000,000 | USD | | 0.77% due 4/28/2017 (d) | | | 19,987,462 |
| | |
| | | | 4,000,000 | USD | | 0.8% due 5/5/2017 (d) | | | 3,996,819 |
| | |
| | | | 19,000,000 | USD | | 0.8% due 5/9/2017 (d) | | | 18,983,019 |
| | |
| | | | | | | L’Oréal USA Inc.: | | | |
| | | | 15,000,000 | USD | | 0.79% due 4/21/2017 (d) | | | 14,992,650 |
| | |
| | | | 9,000,000 | USD | | 0.83% due 4/27/2017 (d) | | | 8,994,242 |
| | |
| | | | | | | Merck & Co. Inc.: | | | |
| | | | 15,000,000 | USD | | 0.81% due 4/28/2017 (d) | | | 14,990,597 |
| | |
| | | | 12,000,000 | USD | | 0.83% due 5/1/2017 (d) | | | 11,991,609 |
| | |
| | | | 10,200,000 | USD | | 0.84% due 5/10/2017 (d) | | | 10,190,627 |
| | |
| | | | | | | Microsoft Corp.: | | | |
| | | | 8,500,000 | USD | | 0.64% due 4/12/2017 (d) | | | 8,497,716 |
| | |
| | | | 11,800,000 | USD | | 0.75% due 5/10/2017 (d) | | | 11,788,764 |
| | |
| | | | 15,000,000 | USD | | 0.82% due 5/18/2017 (d) | | | 14,982,600 |
| | |
| | | | | | | Nestlé Capital Corp., | | | |
| | | | 15,000,000 | USD | | 0.7% due 5/10/2017 (d) | | | 14,986,200 |
| | |
| | | | | | | Nestlé Finance International Ltd., | | | |
| | | | 11,500,000 | USD | | 0.77% due 5/8/2017 (d) | | | 11,490,022 |
| | |
| | | | | | | Novartis Finance Corp.: | | | |
| | | | 16,000,000 | USD | | 0.83% due 4/7/2017 (d) | | | 15,997,480 |
| | |
| | | | 5,000,000 | USD | | 0.72% due 4/13/2017 (d) | | | 4,998,514 |
| | |
| | | | 19,000,000 | USD | | 0.85% due 4/26/2017 (d) | | | 18,988,322 |
| | |
| See Notes to Financial Statements. | 27 |
| IVA International Fund | | IVA Funds |
| Schedule of Investments (unaudited) |
| March 31, 2017 |
| |
| | | | PRINCIPAL | | | | | | |
| | | | AMOUNT | | | DESCRIPTION | | | FAIR VALUE |
| | | | | | | | | | |
| | |
| | Commercial Paper | 28.1% (continued) | | | |
| | | | | | | Novartis Finance Corp.: (continued) | | | |
| | | | 14,000,000 | USD | | 0.85% due 5/1/2017 (d) | | $ | 13,989,608 |
| | |
| | | | 31,000,000 | USD | | 0.85% due 5/4/2017 (d) | | | 30,974,616 |
| | |
| | | | 14,000,000 | USD | | 0.85% due 5/9/2017 (d) | | | 13,986,729 |
| | |
| | | | 1,000,000 | USD | | 0.87% due 5/22/2017 (d) | | | 998,704 |
| | |
| | | | | | | Procter & Gamble Co.: | | | |
| | | | 60,800,000 | USD | | 0.69% due 4/4/2017 (d) | | | 60,794,825 |
| | |
| | | | 10,000,000 | USD | | 0.7% due 4/5/2017 (d) | | | 9,998,935 |
| | |
| | | | 10,000,000 | USD | | 0.8% due 4/17/2017 (d) | | | 9,996,303 |
| | |
| | | | 9,000,000 | USD | | 0.82% due 4/25/2017 (d) | | | 8,995,006 |
| | |
| | | | 6,000,000 | USD | | 0.81% due 4/27/2017 (d) | | | 5,996,387 |
| | |
| | | | | | | Roche Holdings, Inc.: | | | |
| | | | 1,900,000 | USD | | 0.66% due 4/10/2017 (d) | | | 1,899,569 |
| | |
| | | | 15,000,000 | USD | | 0.66% due 4/12/2017 (d) | | | 14,995,895 |
| | |
| | | | 25,000,000 | USD | | 0.67% due 4/19/2017 (d) | | | 24,988,970 |
| | |
| | | | 25,000,000 | USD | | 0.82% due 5/5/2017 (d) | | | 24,978,903 |
| | |
| | | | 32,000,000 | USD | | 0.86% due 5/16/2017 (d) | | | 31,963,732 |
| | |
| | | | | | | Siemens Capital Co., LLC, | | | |
| | | | 2,000,000 | USD | | 0.88% due 5/1/2017 (d) | | | 1,998,515 |
| | |
| | | | | | | Unilever Capital Corp., | | | |
| | | | 5,000,000 | USD | | 0.72% due 4/11/2017 (d) | | | 4,998,770 |
| | |
| | | | | | | United Healthcare Co.: | | | |
| | | | 10,000,000 | USD | | 1.1% due 4/20/2017 (d) | | | 9,993,789 |
| | |
| | | | 10,000,000 | USD | | 1.2% due 5/26/2017 (d) | | | 9,981,598 |
| | |
| | | | 6,000,000 | USD | | 1.2% due 6/5/2017 (d) | | | 5,986,756 |
| | |
| | | | | | | United Parcel Service, Inc.: | | | |
| | | | 14,100,000 | USD | | 0.78% due 4/20/2017 (d) | | | 14,093,592 |
| | |
| | | | 8,000,000 | USD | | 0.76% due 4/24/2017 (d) | | | 7,995,589 |
| | |
| | | | 15,000,000 | USD | | 0.8% due 4/24/2017 (d) | | | 14,991,730 |
| | |
| | | | 13,000,000 | USD | | 0.8% due 4/27/2017 (d) | | | 12,991,878 |
| | |
| | | | 20,000,000 | USD | | 0.82% due 5/15/2017 (d) | | | 19,978,375 |
| | |
| | | | | | | United Technologies Corp., | | | |
| | | | 3,000,000 | USD | | 1.22% due 4/27/2017 (d) | | | 2,997,255 |
| | |
| | | | | | | Wal-Mart Stores, Inc.: | | | |
| | | | 20,000,000 | USD | | 0.79% due 4/3/2017 (d) | | | 19,998,725 |
| | |
| | | | 15,000,000 | USD | | 0.66% due 4/4/2017 (d) | | | 14,998,723 |
| | |
| | | | 14,000,000 | USD | | 0.68% due 4/4/2017 (d) | | | 13,998,808 |
| | |
| | | | 15,000,000 | USD | | 0.78% due 4/5/2017 (d) | | | 14,998,402 |
| | |
| | | | 10,000,000 | USD | | 0.75% due 4/10/2017 (d) | | | 9,997,850 |
| | |
| | | | 35,000,000 | USD | | 0.8% due 4/11/2017 (d) | | | 34,991,712 |
| | |
| | | | | | | Walt Disney Co., | | | |
| | | | 15,600,000 | USD | | 0.84% due 5/19/2017 (d) | | | 15,581,485 |
| | |
| | | | | | | | | | 1,087,881,151 |
| | | | | | | | | |
| 28 | See Notes to Financial Statements. |
| IVA International Fund | | IVA Funds |
| Schedule of Investments (unaudited) |
| March 31, 2017 |
| |
| | | | PRINCIPAL | | | | | | |
| | | | AMOUNT | | | DESCRIPTION | | | FAIR VALUE |
| | | | | | | | | | |
| | |
| | Treasury Bills | 0.1% | | | | | | | | |
| | | | 5,000,000 | USD | | U.S. Treasury Bill, due 6/8/2017 (h) | | $ | 4,993,535 |
| | |
| | | | | | | TOTAL SHORT-TERM INVESTMENTS | | | |
| | | | | | | (Cost — $1,092,924,955) | | | 1,092,874,686 |
| | |
| | | | | | | TOTAL INVESTMENTS — 99.8% | | | |
| | | | | | | (Cost — $3,547,914,418) | | | 3,873,621,429 |
| | |
| | | | | | | Other Assets In Excess of | | | |
| | | | | | | Liabilities — 0.2% | | | 8,196,411 |
| | |
| | | | | | | TOTAL NET ASSETS — 100.0% | | $ | 3,881,817,840 |
| | | | | | | | | |
| | The IVA International Fund had the following open forward foreign currency contracts at March 31, 2017: |
| | | | | | | | | | | | | USD | | NET |
| | | | | | SETTLEMENT | | LOCAL | | | | | VALUE AT | | UNREALIZED |
| FOREIGN | | | | | DATES | | CURRENCY | | | USD | | MARCH 31, | | APPRECIATION/ |
| CURRENCY | | COUNTERPARTY | | | THROUGH | | AMOUNT | | | EQUIVALENT | | 2017 | | (DEPRECIATION) |
| |
| Contracts to Sell: | | | | | | | | | | | | | | | | |
| | | State Street | | | | | | | | | | | | | | | | |
| Australian | | Bank & | | | | | | | | | | | | | | | | |
dollar | | Trust Co. | | | 06/07/2017 | | AUD 29,710,000 | | $ | 22,695,827 | | $ | 22,672,307 | | | $ | 23,520 | |
| |
| | | State Street | | | | | | | | | | | | | | | | |
| | | Bank & | | | | | | | | | | | | | | | | |
| euro | | Trust Co. | | | 06/07/2017 | | EUR 49,423,000 | | | 52,287,063 | | | 52,879,791 | | | | (592,728 | ) |
| |
| | | State Street | | | | | | | | | | | | | | | | |
| Japanese | | Bank & | | | | | | | | | | | | | | | | |
yen | | Trust Co. | | | 06/07/2017 | | JPY 22,172,700,000 | | | 195,032,969 | | | 199,632,004 | | | | (4,599,035 | ) |
| |
| South | | State Street | | | | | | | | | | | | | | | | |
Korean | | Bank & | | | | | | | | | | | | | | | | |
Won | | Trust Co. | | | 05/08/2017 | | KRW 94,577,000,000 | | | 83,622,728 | | | 84,659,177 | | | | (1,036,449 | ) |
| |
| Net Unrealized Depreciation on Open Forward Foreign Currency Contracts | | | | | | | $ | (6,204,692 | ) |
| |
| Abbreviations used in this schedule: |
| ADR | — | American Depositary Receipt |
| AUD | — | Australian dollar |
| CI | — | Investment certificates (non-voting) |
| EUR | — | euro |
| JPY | — | Japanese yen |
| KRW | — | South Korean won |
| NOK | — | Norwegian krone |
| NV | — | Non-voting |
| SGD | — | Singapore dollar |
| USD | — | United States dollar |
| See Notes to Financial Statements. | 29 |
| IVA International Fund | | IVA Funds |
| Schedule of Investments (unaudited) |
| March 31, 2017 |
| |
| | (a) | | Non-income producing investment. |
| | (b) | | Issuer of the security is an affiliate of the IVA International Fund as defined by the Investment Company Act of 1940. An affiliate is deemed as a company in which the IVA International Fund indirectly or directly has ownership of at least 5% of the company’s outstanding voting securities. See Schedule of Affiliates below for additional information. |
| |
| Schedule of Affiliates | | | | | | | | | | | | | | | | | | | | | |
| | | SHARES | | | | | | | | | | SHARES | | | | | | | | | | | |
| | | HELD AT | | | | | | | | | | HELD AT | | FAIR VALUE AT | | | | | | | |
| | | SEPTEMBER 30, | | SHARE | | SHARE | | MARCH 31, | | MARCH 31, | | REALIZED | | DIVIDEND |
| SECURITY | | 2016 | | ADDITIONS | | REDUCTIONS | | 2017 | | 2017 | | LOSS | | INCOME* |
| |
| Clear Media | | | | | | | | | | | | | | | | | | | | | | | | | | | |
Ltd. | | | 40,065,030 | | | | — | | | | — | | | | 40,065,030 | | | $ | 46,398,414 | | | | — | | | | — |
| |
| DOM | | | | | | | | | | | | | | | | | | | | | | | | | | | |
Security SA | | | 291,806 | | | | — | | | | 103,571 | | | | 188,235 | | | | 11,446,117 | | | $ | (241,529 | ) | | | — |
| |
| F@N | | | | | | | | | | | | | | | | | | | | | | | | | | | |
Communications, | | | | | | | | | | | | | | | | | | | | | | | | | | | |
Inc. | | | 4,078,800 | | | | 17,500 | | | | — | | | | 4,096,300 | | | | 30,575,993 | | | | — | | | $ | 629,151 |
| |
| Techno | | | | | | | | | | | | | | | | | | | | | | | | | | | |
Medica Co., | | | | | | | | | | | | | | | | | | | | | | | | | | | |
Ltd. | | | 554,500 | | | | 2,400 | | | | — | | | | 556,900 | | | | 10,604,761 | | | | — | | | | 215,668 |
| |
| Total | | | | | | | | | | | | | | | | | | $ | 99,025,285 | | | $ | (241,529 | ) | | $ | 844,819 |
| |
| | * | | Dividend income is gross of withholding taxes. |
| | | | |
| | (c) | | Security is deemed illiquid. As of March 31, 2017, the value of these illiquid securities amounted to 0.5% of total net assets. |
| | (d) | | Security is exempt from registration under Rule 144A or Section 4(2) of the Securities Act of 1933 (the “1933 Act”). Any resale of these securities must generally be effected through a sale that is registered under the 1933 Act or otherwise exempted from such registration requirements. |
| | (e) | | Payment-in-kind security for which the issuer may pay interest with additional debt securities or cash. |
| | (f) | | Variable rate security. The interest rate shown reflects the rate currently in effect. |
| | (g) | | Fixed-to-float perpetual bond. The security has no maturity date. The date shown represents the next call date. |
| | (h) | | This security is held at the custodian as collateral for forward foreign currency contracts sold. As of March 31, 2017, portfolio securities valued at $4,993,535 were segregated to cover collateral requirements. |
| Statements of Assets and Liabilities (unaudited) | | IVA Funds |
| | | | IVA | | IVA |
| | | | Worldwide | | International |
| | | | Fund | | Fund |
| | | | |
| | Assets: | | | | | | | | |
| | Long-term investments, at cost: | | | | | | | | |
| | Non-affiliated securities | | $ | 3,070,634,865 | | | $ | 2,086,941,435 | |
| | | | | |
| | Affiliated securities | | | 17,448,811 | | | | 59,878,959 | |
| | | | | |
| | Commodities | | | 532,545,604 | | | | 308,169,069 | |
| | | | | |
| | Short-term investments, at cost | | | 3,312,360,954 | | | | 1,087,929,625 | |
| | | | | |
| | Foreign currency, at cost | | | — | | | | 42,037 | |
| | | | | |
| | Collateral for open foreign forward currency contracts, at cost | | | 4,995,330 | | | | 4,995,330 | |
| | | | | |
| | Long-term investments, at fair value: | | | | | | | | |
| | Non-affiliated securities | | $ | 4,318,293,651 | | | $ | 2,407,141,453 | |
| | | | | |
| | Affiliated securities | | | 17,370,307 | | | | 99,025,285 | |
| | | | | |
| | Commodities | | | 474,887,580 | | | | 274,580,005 | |
| | | | | |
| | Short-term investments, at fair value | | | 3,312,204,876 | | | | 1,087,881,151 | |
| | | | | |
| | Foreign currency, at fair value | | | — | | | | 41,998 | |
| | | | | |
| | Collateral for open foreign forward currency contracts, at fair value | | | 4,993,535 | | | | 4,993,535 | |
| | | | | |
| | Cash | | | 409,548 | | | | 327,945 | |
| | | | | |
| | Dividends and interest receivable | | | 22,778,324 | | | | 13,292,409 | |
| | | | | |
| | Receivable for fund shares sold | | | 9,579,065 | | | | 3,095,093 | |
| | | | | |
| | Receivable for investments sold | | | 5,985,691 | | | | 4,002,884 | |
| | | | | |
| | Prepaid expenses and other assets | | | 116,145 | | | | 50,837 | |
| | | | | |
| | Total assets | | $ | 8,166,618,722 | | | $ | 3,894,432,595 | |
| | Liabilities: | | | | | | | | |
| | Payable for fund shares repurchased | | $ | 6,582,445 | | | $ | 982,344 | |
| | | | | |
| | Unrealized depreciation on open forward foreign currency contracts | | | 5,644,813 | | | | 6,204,692 | |
| | | | | |
| | Payable for investments purchased | | | — | | | | 1,542,092 | |
| | | | | |
| | Accrued investment advisory fees | | | 6,200,193 | | | | 2,932,788 | |
| | | | | |
| | Accrued distribution and service fees | | | 1,130,034 | | | | 109,060 | |
| | | | | |
| | Accrued expenses and other liabilities | | | 1,393,848 | | | | 843,779 | |
| | | | | |
| | Total liabilities | | | 20,951,333 | | | | 12,614,755 | |
| | | | | |
| | Net Assets | | $ | 8,145,667,389 | | | $ | 3,881,817,840 | |
| | | | | |
| | Net Assets Consist of: | | | | | | | | |
| | Par value ($0.001 per share) | | $ | 453,453 | | | $ | 231,436 | |
| | | | | |
| | Additional paid-in-capital | | | 6,826,469,500 | | | | 3,541,650,345 | |
| | | | | |
| | Distributions in excess of net investment income | | | (21,190,901 | ) | | | (19,226,309 | ) |
| | | | | |
| | Accumulated net realized gain on investments and foreign
currency transactions | | | 155,573,863 | | | | 39,608,807 | |
| | | | | |
| | Unrealized appreciation from investments and foreign
currency translation | | | 1,184,361,474 | | | | 319,553,561 | |
| | | | | |
| | Net Assets | | $ | 8,145,667,389 | | | $ | 3,881,817,840 | |
| | | | | |
| | Net Asset Value Per Share: | | | | | | | | |
| | Class A | | | | | | | | |
| | Net assets | | $ | 1,528,298,932 | | | $ | 271,264,932 | |
| | | | | |
| | Shares outstanding | | | 85,094,083 | | | | 16,188,505 | |
| | | | | |
| | Net asset value per share | | $ | 17.96 | | | $ | 16.76 | |
| | | | | |
| | Maximum offering price per share (with a maximum initial
sales charge of 5.00%) | | $ | 18.91 | | | $ | 17.64 | |
| | | | | |
| | Class C | | | | | | | | |
| | Net assets | | $ | 938,251,737 | | | $ | 61,362,177 | |
| | | | | |
| | Shares outstanding | | | 53,073,629 | | | | 3,726,534 | |
| | | | | |
| | Net asset value per share | | $ | 17.68 | | | $ | 16.47 | |
| | | | | |
| | Class I | | | | | | | | |
| | Net assets | | $ | 5,679,116,720 | | | $ | 3,549,190,731 | |
| | | | | |
| | Shares outstanding | | | 315,285,727 | | | | 211,521,094 | |
| | | | | |
| | Net asset value per share | | $ | 18.01 | | | $ | 16.78 | |
| | | | | |
| See Notes to Financial Statements. | 31 |
| Statements of Operations (unaudited) | | IVA Funds |
| For the Six Months Ended March 31, 2017 |
| | |
| | | | IVA | | IVA |
| | | | Worldwide | | International |
| | | | Fund | | Fund |
| | | | |
| | Investment Income: | | | | | | | | |
| | Interest | | $ | 20,501,318 | | | $ | 9,189,430 | |
| | | | | |
| | Dividends: | | | | | | | | |
| | Non-affiliated securities | | | 31,119,019 | | | | 15,196,405 | |
| | | | | |
| | Affiliated securities | | | 871,879 | | | | 844,819 | |
| | | | | |
| | Other income | | | — | | | | 40,446 | |
| | | | | |
| | Less: Foreign taxes withheld | | | (2,223,563 | ) | | | (1,565,424 | ) |
| | | | | |
| | Total income | | | 50,268,653 | | | | 23,705,676 | |
| | | | | |
| | Expenses: | | | | | | | | |
| | Investment advisory fees | | | 36,183,871 | | | | 17,247,798 | |
| | | | | |
| | Distribution and service fees: | | | | | | | | |
| | Class A | | | 1,926,961 | | | | 338,196 | |
| | | | | |
| | Class C | | | 4,887,331 | | | | 316,116 | |
| | | | | |
| | Trustee fees | | | 145,679 | | | | 67,197 | |
| | | | | |
| | Other expenses | | | 3,966,628 | | | | 1,797,799 | |
| | | | | |
| | Total expenses | | | 47,110,470 | | | | 19,767,106 | |
| | | | | |
| | Net investment income | | | 3,158,183 | | | | 3,938,570 | |
| | | | | |
| | Net Realized and Change in Unrealized Gain (Loss)
on Investments and Foreign Currency: | | | | | | | | |
| | Net realized gain (loss) on: | | | | | | | | |
| | Investments: | | | | | | | | |
| | Non-affiliated securities | | | 168,454,601 | | | | 20,494,587 | |
| | | | | |
| | Affiliated securities | | | (15,928,971 | ) | | | (241,529 | ) |
| | | | | |
| | Commodities | | | (4,993,916 | ) | | | (2,563,272 | ) |
| | | | | |
| | Foreign currency transactions | | | 23,701,352 | | | | 24,980,022 | |
| | | | | |
| | Net realized gain | | | 171,233,066 | | | | 42,669,808 | |
| | | | | |
| | Net change in unrealized appreciation
(depreciation) from: | | | | | | | | |
| | Investments (net of change in foreign capital gains
tax of $0 and ($157,344), respectively) | | | 238,112,902 | | | | 111,481,115 | |
| | | | | |
| | Foreign currency translation | | | 2,932,278 | | | | 948,594 | |
| | | | | |
| | Net change in unrealized appreciation (depreciation) | | | 241,045,180 | | | | 112,429,709 | |
| | | | | |
| | Net realized and change in unrealized gain on
investments and foreign currency | | | 412,278,246 | | | | 155,099,517 | |
| | | | | |
| | Increase in net assets resulting from operations | | $ | 415,436,429 | | | $ | 159,038,087 | |
| | | | | |
| 32 | See Notes to Financial Statements. |
| Statements of Changes in Net Assets (unaudited) | | IVA Funds |
| | | | IVA Worldwide Fund | | IVA International Fund |
| | | | | | |
| | | | Six Months Ended
March 31,
2017 | | Year Ended
September 30,
2016 | | Six Months Ended
March 31,
2017 | | Year Ended
September 30,
2016 |
| | | | | | |
| | Operations: | | | | | | | | | | | | | | | | |
| | Net investment income | | $ | 3,158,183 | | | $ | 51,415,594 | | | $ | 3,938,570 | | | $ | 30,075,660 | |
| | | | | | | | |
| | Net realized gain | | | 171,233,066 | | | | 33,672,793 | | | | 42,669,808 | | | | 34,573,214 | |
| | | | | | | | |
| | Net change in unrealized
appreciation (depreciation) | | | 241,045,180 | | | | 478,196,280 | | | | 112,429,709 | | | | 168,419,969 | |
| | | | | | | | |
| | Increase in net assets
resulting from operations | | | 415,436,429 | | | | 563,284,667 | | | | 159,038,087 | | | | 233,068,843 | |
| | | | | | | | |
| | Distributions to Shareholders: | | | | | | | | | | | | | | | | |
| | Net investment income: | | | | | | | | | | | | | | | | |
| | Class A | | | — | | | | (23,785,645 | ) | | | (525,799 | ) | | | (12,832,520 | ) |
| | | | | | | | |
| | Class C | | | — | | | | (6,838,484 | ) | | | — | | | | (1,268,242 | ) |
| | | | | | | | |
| | Class I | | | — | | | | (94,717,370 | ) | | | (15,088,423 | ) | | | (85,785,911 | ) |
| | | | | | | | |
| | Net realized gain on investments: | | | | | | | | | | | | | | | | |
| | Class A | | | (17,728,642 | ) | | | (50,487,666 | ) | | | (2,849,058 | ) | | | (19,900,852 | ) |
| | | | | | | | |
| | Class C | | | (11,449,984 | ) | | | (33,961,203 | ) | | | (687,112 | ) | | | (2,859,914 | ) |
| | | | | | | | |
| | Class I | | | (63,473,207 | ) | | | (168,845,490 | ) | | | (36,195,143 | ) | | | (120,495,089 | ) |
| | | | | | | | |
| | Decrease in net assets resulting
from distributions | | | (92,651,833 | ) | | | (378,635,858 | ) | | | (55,345,535 | ) | | | (243,142,528 | ) |
| | | | | | | | |
| | Capital Share Transactions: | | | | | | | | | | | | | | | | |
| | Proceeds from shares sold | | | 591,258,094 | | | | 1,184,744,394 | | | | 251,534,211 | | | | 963,815,303 | |
| | | | | | | | |
| | Reinvestment of distributions | | | 77,811,419 | | | | 310,491,726 | | | | 48,144,225 | | | | 210,560,590 | |
| | | | | | | | |
| | Cost of shares repurchased | | | (1,123,125,514 | ) | | | (2,488,988,191 | ) | | | (512,096,153 | ) | | | (877,967,281 | ) |
| | | | | | | | |
| | Increase (decrease) in net assets
from capital share transactions | | | (454,056,001 | ) | | | (993,752,071 | ) | | | (212,417,717 | ) | | | 296,408,612 | |
| | | | | | | | |
| | Increase (decrease) in net assets | | | (131,271,405 | ) | | | (809,103,262 | ) | | | (108,725,165 | ) | | | 286,334,927 | |
| | | | | | | | |
| | Net Assets: | | | | | | | | | | | | | | | | |
| | Beginning of period | | $ | 8,276,938,794 | | | $ | 9,086,042,056 | | | $ | 3,990,543,005 | | | $ | 3,704,208,078 | |
| | | | | | | | |
| | End of period | | $ | 8,145,667,389 | | | $ | 8,276,938,794 | | | $ | 3,881,817,840 | | | $ | 3,990,543,005 | |
| | | | | | | | |
| | Distributions in excess of net
investment income | | $ | (21,190,901 | ) | | $ | (24,349,084 | ) | | $ | (19,226,309 | ) | | $ | (7,550,657 | ) |
| | | | | | | | |
| See Notes to Financial Statements. | 33 |
| Financial Highlights (unaudited) | | IVA Funds |
IVA Worldwide Fund — Class A
For a share of each class of beneficial interest outstanding:
| | | Six Months Ended | | Year Ended September 30, |
| | | | | | | |
| | | March 31, 2017 | | 2016 | | 2015 | | 2014 | | 2013 | | 2012 |
| | | |
| Net asset value, | | | | | | | | | | | | | | | | | | | | | | | | |
beginning of period | | $ | 17.26 | | | $ | 16.87 | | | $ | 18.54 | | | $ | 17.91 | | | $ | 16.18 | | | $ | 15.71 | |
| | | | |
| Increase (decrease) from | | | | | | | | | | | | | | | | | | | | | | | | |
investment operations:(a) | | | | | | | | | | | | | | | | | | | | | | | | |
Net investment income | | | | | | | | | | | | | | | | | | | | | | | | |
(loss)(b) | | | (0.00 | )(c) | | | 0.09 | | | | 0.02 | | | | 0.03 | | | | 0.12 | | | | 0.18 | |
Net realized and unrealized | | | | | | | | | | | | | | | | | | | | | | | | |
gain (loss) | | | 0.90 | | | | 1.01 | | | | (0.77 | ) | | | 1.35 | | | | 2.08 | | | | 1.26 | |
| | | | |
| Increase (decrease) from | | | | | | | | | | | | | | | | | | | | | | | | |
investment operations | | | 0.90 | | | | 1.10 | | | | (0.75 | ) | | | 1.38 | | | | 2.20 | | | | 1.44 | |
| | | | |
| Decrease from distributions: | | | | | | | | | | | | | | | | | | | | | | | | |
Net investment income | | | — | | | | (0.23 | ) | | | (0.21 | ) | | | (0.20 | ) | | | (0.30 | ) | | | (0.12 | ) |
Net realized gain on | | | | | | | | | | | | | | | | | | | | | | | | |
investments | | | (0.20 | ) | | | (0.48 | ) | | | (0.71 | ) | | | (0.55 | ) | | | (0.17 | ) | | | (0.85 | ) |
| | | | |
| Decrease from distributions | | | (0.20 | ) | | | (0.71 | ) | | | (0.92 | ) | | | (0.75 | ) | | | (0.47 | ) | | | (0.97 | ) |
| | | | |
| Net asset value, end | | | | | | | | | | | | | | | | | | | | | | | | |
of period | | $ | 17.96 | | | $ | 17.26 | | | $ | 16.87 | | | $ | 18.54 | | | $ | 17.91 | | | $ | 16.18 | |
| | | | |
| Total return(d) | | | 5.26 | % | | | 6.75 | % | | | (4.21 | )% | | | 8.00 | % | | | 14.02 | % | | | 9.62 | % |
| Ratios to average net assets: | | | | | | | | | | | | | | | | | | | | | | | | |
Operating expenses | | | 1.25 | %(e) | | | 1.25 | % | | | 1.25 | % | | | 1.26 | % | | | 1.27 | % | | | 1.28 | % |
Net investment income (loss) | | | (0.01 | )%(e) | | | 0.52 | % | | | 0.09 | % | | | 0.14 | % | | | 0.72 | % | | | 1.16 | % |
| Supplemental data: | | | | | | | | | | | | | | | | | | | | | | | | |
Portfolio turnover rate | | | 9.8 | % | | | 29.7 | % | | | 30.3 | % | | | 22.5 | % | | | 26.3 | % | | | 27.9 | % |
Net assets, end of | | | | | | | | | | | | | | | | | | | | | | | | |
period (000’s) | | $ | 1,528,299 | | | $ | 1,587,209 | | | $ | 1,815,439 | | | $ | 2,083,683 | | | $ | 2,378,045 | | | $ | 2,408,396 | |
| |
| (a) | | The amounts shown for a share outstanding may not correlate with the Statements of Operations for the period due to the timing of sales and repurchases of fund shares in relation to income earned and/or gains (losses) both realized and unrealized during the period. |
| (b) | | Calculated using average daily shares outstanding. |
| (c) | | Amount represents less than ($0.005) per share. |
| (d) | | Total return assumes reinvestment of all distributions and does not reflect an initial sales charge. Total returns for periods of less than one year are not annualized. |
| (e) | | Annualized. |
| 34 | See Notes to Financial Statements. |
| Financial Highlights (unaudited) | | IVA Funds |
IVA Worldwide Fund — Class C
For a share of each class of beneficial interest outstanding:
| | | Six Months Ended | | Year Ended September 30, |
| | | | | | | |
| | | March 31, 2017 | | 2016 | | 2015 | | 2014 | | 2013 | | 2012 |
| | | |
| Net asset value, | | | | | | | | | | | | | | | | | | | | | | | | |
beginning of period | | $ | 17.05 | | | $ | 16.67 | | | $ | 18.33 | | | $ | 17.71 | | | $ | 16.01 | | | $ | 15.54 | |
| | | | |
| Increase (decrease) from | | | | | | | | | | | | | | | | | | | | | | | | |
investment operations:(a) | | | | | | | | | | | | | | | | | | | | | | | | |
Net investment income | | | | | | | | | | | | | | | | | | | | | | | | |
(loss)(b) | | | (0.07 | ) | | | (0.04 | ) | | | (0.12 | ) | | | (0.11 | ) | | | (0.01 | ) | | | 0.06 | |
Net realized and unrealized | | | | | | | | | | | | | | | | | | | | | | | | |
gain (loss) | | | 0.90 | | | | 1.00 | | | | (0.76 | ) | | | 1.35 | | | | 2.07 | | | | 1.26 | |
| | | | |
| Increase (decrease) from | | | | | | | | | | | | | | | | | | | | | | | | |
investment operations | | | 0.83 | | | | 0.96 | | | | (0.88 | ) | | | 1.24 | | | | 2.06 | | | | 1.32 | |
| | | | |
| Decrease from distributions: | | | | | | | | | | | | | | | | | | | | | | | | |
Net investment income | | | — | | | | (0.10 | ) | | | (0.07 | ) | | | (0.07 | ) | | | (0.19 | ) | | | — | |
Net realized gain on | | | | | | | | | | | | | | | | | | | | | | | | |
investments | | | (0.20 | ) | | | (0.48 | ) | | | (0.71 | ) | | | (0.55 | ) | | | (0.17 | ) | | | (0.85 | ) |
| | | | |
| Decrease from distributions | | | (0.20 | ) | | | (0.58 | ) | | | (0.78 | ) | | | (0.62 | ) | | | (0.36 | ) | | | (0.85 | ) |
| | | | |
| Net asset value, end | | | | | | | | | | | | | | | | | | | | | | | | |
of period | | $ | 17.68 | | | $ | 17.05 | | | $ | 16.67 | | | $ | 18.33 | | | $ | 17.71 | | | $ | 16.01 | |
| | | | |
| Total return(c) | | | 4.91 | % | | | 5.93 | % | | | (4.96 | )% | | | 7.23 | % | | | 13.13 | % | | | 8.87 | % |
| Ratios to average net assets: | | | | | | | | | | | | | | | | | | | | | | | | |
Operating expenses | | | 2.00 | %(d) | | | 2.00 | % | | | 2.00 | % | | | 2.01 | % | | | 2.02 | % | | | 2.03 | % |
Net investment income (loss) | | | (0.76 | )%(d) | | | (0.23 | )% | | | (0.67 | )% | | | (0.61 | )% | | | (0.03 | )% | | | 0.41 | % |
| Supplemental data: | | | | | | | | | | | | | | | | | | | | | | | | |
Portfolio turnover rate | | | 9.8 | % | | | 29.7 | % | | | 30.3 | % | | | 22.5 | % | | | 26.3 | % | | | 27.9 | % |
Net assets, end of | | | | | | | | | | | | | | | | | | | | | | | | |
period (000’s) | | $ | 938,252 | | | $ | 1,037,758 | | | $ | 1,201,687 | | | $ | 1,431,328 | | | $ | 1,380,608 | | | $ | 1,469,720 | |
| |
| (a) | | The amounts shown for a share outstanding may not correlate with the Statements of Operations for the period due to the timing of sales and repurchases of fund shares in relation to income earned and/or gains (losses) both realized and unrealized during the period. |
| (b) | | Calculated using average daily shares outstanding. |
| (c) | | Total return assumes reinvestment of all distributions and does not reflect a contingent deferred sales charge. Total returns for periods of less than one year are not annualized. |
| (d) | | Annualized. |
| See Notes to Financial Statements. | 35 |
| Financial Highlights (unaudited) | | IVA Funds |
IVA Worldwide Fund — Class I
For a share of each class of beneficial interest outstanding:
| | | Six Months Ended | | Year Ended September 30, |
| | | | | | | |
| | | March 31, 2017 | | 2016 | | 2015 | | 2014 | | 2013 | | 2012 |
| | | |
| Net asset value, | | | | | | | | | | | | | | | | | | | | | | | | |
beginning of period | | $ | 17.28 | | | $ | 16.90 | | | $ | 18.57 | | | $ | 17.94 | | | $ | 16.21 | | | $ | 15.73 | |
| | | | |
| Increase (decrease) from | | | | | | | | | | | | | | | | | | | | | | | | |
investment operations:(a) | | | | | | | | | | | | | | | | | | | | | | | | |
Net investment income(b) | | | 0.02 | | | | 0.13 | | | | 0.06 | | | | 0.07 | | | | 0.16 | | | | 0.23 | |
Net realized and unrealized | | | | | | | | | | | | | | | | | | | | | | | | |
gain (loss) | | | 0.91 | | | | 1.00 | | | | (0.77 | ) | | | 1.36 | | | | 2.08 | | | | 1.26 | |
| | | | |
| Increase (decrease) from | | | | | | | | | | | | | | | | | | | | | | | | |
investment operations | | | 0.93 | | | | 1.13 | | | | (0.71 | ) | | | 1.43 | | | | 2.24 | | | | 1.49 | |
| | | | |
| Decrease from distributions: | | | | | | | | | | | | | | | | | | | | | | | | |
Net investment income | | | — | | | | (0.27 | ) | | | (0.25 | ) | | | (0.25 | ) | | | (0.34 | ) | | | (0.16 | ) |
Net realized gain on | | | | | | | | | | | | | | | | | | | | | | | | |
investments | | | (0.20 | ) | | | (0.48 | ) | | | (0.71 | ) | | | (0.55 | ) | | | (0.17 | ) | | | (0.85 | ) |
| | | | |
| Decrease from distributions | | | (0.20 | ) | | | (0.75 | ) | | | (0.96 | ) | | | (0.80 | ) | | | (0.51 | ) | | | (1.01 | ) |
| | | | |
| Net asset value, end | | | | | | | | | | | | | | | | | | | | | | | | |
of period | | $ | 18.01 | | | $ | 17.28 | | | $ | 16.90 | | | $ | 18.57 | | | $ | 17.94 | | | $ | 16.21 | |
| | | | |
| Total return(c) | | | 5.43 | % | | | 6.96 | % | | | (3.95 | )% | | | 8.25 | % | | | 14.28 | % | | | 9.97 | % |
| Ratios to average net assets: | | | | | | | | | | | | | | | | | | | | | | | | |
Operating expenses | | | 1.00 | %(d) | | | 1.00 | % | | | 1.00 | % | | | 1.01 | % | | | 1.02 | % | | | 1.03 | % |
Net investment income | | | 0.25 | %(d) | | | 0.77 | % | | | 0.34 | % | | | 0.39 | % | | | 0.97 | % | | | 1.43 | % |
| Supplemental data: | | | | | | | | | | | | | | | | | | | | | | | | |
Portfolio turnover rate | | | 9.8 | % | | | 29.7 | % | | | 30.3 | % | | | 22.5 | % | | | 26.3 | % | | | 27.9 | % |
Net assets, end of | | | | | | | | | | | | | | | | | | | | | | | | |
period (000’s) | | $ | 5,679,117 | | | $ | 5,651,971 | | | $ | 6,068,916 | | | $ | 6,845,786 | | | $ | 5,443,865 | | | $ | 5,003,855 | |
| |
| (a) | | The amounts shown for a share outstanding may not correlate with the Statements of Operations for the period due to the timing of sales and repurchases of fund shares in relation to income earned and/or gains (losses) both realized and unrealized during the period. |
| (b) | | Calculated using average daily shares outstanding. |
| (c) | | Total return assumes reinvestment of all distributions. Total returns for periods of less than one year are not annualized. |
| (d) | | Annualized. |
| 36 | See Notes to Financial Statements. |
| Financial Highlights (unaudited) | | IVA Funds |
IVA International Fund — Class A
For a share of each class of beneficial interest outstanding:
| | | Six Months Ended | | Year Ended September 30, |
| | | | | | | |
| | | March 31, 2017 | | 2016 | | 2015 | | 2014 | | 2013 | | 2012 |
| | | |
| Net asset value, | | | | | | | | | | | | | | | | | | | | | | | | |
beginning of period | | $ | 16.28 | | | $ | 16.39 | | | $ | 17.84 | | | $ | 17.39 | | | $ | 15.95 | | | $ | 15.56 | |
| | | | |
| Increase (decrease) from | | | | | | | | | | | | | | | | | | | | | | | | |
investment operations:(a) | | | | | | | | | | | | | | | | | | | | | | | | |
Net investment | | | | | | | | | | | | | | | | | | | | | | | | |
income (loss)(b) | | | (0.00 | )(c) | | | 0.07 | | | | 0.12 | | | | 0.08 | | | | 0.16 | | | | 0.23 | |
| | | | |
Net realized and unrealized | | | | | | | | | | | | | | | | | | | | | | | | |
gain (loss) | | | 0.68 | | | | 0.86 | | | | (0.55 | ) | | | 1.10 | | | | 2.00 | | | | 1.16 | |
| | | | |
| Increase (decrease) from | | | | | | | | | | | | | | | | | | | | | | | | |
investment operations | | | 0.68 | | | | 0.93 | | | | (0.43 | ) | | | 1.18 | | | | 2.16 | | | | 1.39 | |
| | | | |
| Decrease from distributions: | | | | | | | | | | | | | | | | | | | | | | | | |
Net investment income | | | (0.03 | ) | | | (0.41 | ) | | | (0.47 | ) | | | (0.41 | ) | | | (0.44 | ) | | | (0.23 | ) |
Net realized gain on | | | | | | | | | | | | | | | | | | | | | | | | |
investments | | | (0.17 | ) | | | (0.63 | ) | | | (0.55 | ) | | | (0.32 | ) | | | (0.28 | ) | | | (0.77 | ) |
| | | | |
| Decrease from distributions | | | (0.20 | ) | | | (1.04 | ) | | | (1.02 | ) | | | (0.73 | ) | | | (0.72 | ) | | | (1.00 | ) |
| | | | |
| Net asset value, end | | | | | | | | | | | | | | | | | | | | | | | | |
of period | | $ | 16.76 | | | $ | 16.28 | | | $ | 16.39 | | | $ | 17.84 | | | $ | 17.39 | | | $ | 15.95 | |
| | | | |
| Total return(d) | | | 4.25 | % | | | 5.93 | % | | | (2.37 | )% | | | 7.05 | % | | | 14.09 | % | | | 9.53 | % |
| Ratios to average net assets: | | | | | | | | | | | | | | | | | | | | | | | | |
Net operating expenses | | | 1.25 | %(e) | | | 1.24 | % | | | 1.25 | % | | | 1.26 | % | | | 1.26 | % | | | 1.27 | % |
Net investment income (loss) | | | (0.01 | )%(e) | | | 0.41 | % | | | 0.70 | % | | | 0.45 | % | | | 0.97 | % | | | 1.52 | % |
| Supplemental data: | | | | | | | | | | | | | | | | | | | | | | | | |
Portfolio turnover rate | | | 14.7 | % | | | 34.9 | % | | | 27.6 | % | | | 23.4 | % | | | 40.1 | % | | | 29.9 | % |
Net assets, end of | | | | | | | | | | | | | | | | | | | | | | | | |
period (000’s) | | $ | 271,265 | | | $ | 282,567 | | | $ | 466,336 | | | $ | 391,494 | | | $ | 377,043 | | | $ | 409,163 | |
| |
| (a) | | The amounts shown for a share outstanding may not correlate with the Statements of Operations for the period due to the timing of sales and repurchases of fund shares in relation to income earned and/or gains (losses) both realized and unrealized during the period. |
| (b) | | Calculated using average daily shares outstanding. |
| (c) | | Amount represents less than ($0.005) per share. |
| (d) | | Total return assumes reinvestment of all distributions and does not reflect an initial sales charge. Total returns for periods of less than one year are not annualized. |
| (e) | | Annualized. |
| See Notes to Financial Statements. | 37 |
| Financial Highlights (unaudited) | | IVA Funds |
IVA International Fund — Class C
For a share of each class of beneficial interest outstanding:
| | | Six Months Ended | | Year Ended September 30, |
| | | | | | | |
| | | March 31, 2017 | | 2016 | | 2015 | | 2014 | | 2013 | | 2012 |
| | | |
| Net asset value, | | | | | | | | | | | | | | | | | | | | | | | | |
beginning of period | | $ | 16.03 | | | $ | 16.14 | | | $ | 17.58 | | | $ | 17.14 | | | $ | 15.74 | | | $ | 15.35 | |
| | | | |
| Increase (decrease) from | | | | | | | | | | | | | | | | | | | | | | | | |
investment operations:(a) | | | | | | | | | | | | | | | | | | | | | | | | |
Net investment | | | | | | | | | | | | | | | | | | | | | | | | |
income (loss)(b) | | | (0.06 | ) | | | (0.03 | ) | | | (0.02 | ) | | | (0.06 | ) | | | 0.04 | | | | 0.11 | |
Net realized and unrealized | | | | | | | | | | | | | | | | | | | | | | | | |
gain (loss) | | | 0.67 | | | | 0.83 | | | | (0.53 | ) | | | 1.11 | | | | 1.96 | | | | 1.15 | |
| | | | |
| Increase (decrease) from | | | | | | | | | | | | | | | | | | | | | | | | |
investment operations | | | 0.61 | | | | 0.80 | | | | (0.55 | ) | | | 1.05 | | | | 2.00 | | | | 1.26 | |
| | | | |
| Decrease from distributions: | | | | | | | | | | | | | | | | | | | | | | | | |
Net investment income | | | — | | | | (0.28 | ) | | | (0.34 | ) | | | (0.29 | ) | | | (0.32 | ) | | | (0.10 | ) |
Net realized gain on | | | | | | | | | | | | | | | | | | | | | | | | |
investments | | | (0.17 | ) | | | (0.63 | ) | | | (0.55 | ) | | | (0.32 | ) | | | (0.28 | ) | | | (0.77 | ) |
| | | | |
| Decrease from distributions | | | (0.17 | ) | | | (0.91 | ) | | | (0.89 | ) | | | (0.61 | ) | | | (0.60 | ) | | | (0.87 | ) |
| | | | |
| Net asset value, end | | | | | | | | | | | | | | | | | | | | | | | | |
of period | | $ | 16.47 | | | $ | 16.03 | | | $ | 16.14 | | | $ | 17.58 | | | $ | 17.14 | | | $ | 15.74 | |
| | | | |
| Total return(c) | | | 3.86 | % | | | 5.17 | % | | | (3.14 | )% | | | 6.29 | % | | | 13.18 | % | | | 8.76 | % |
| Ratios to average net assets: | | | | | | | | | | | | | | | | | | | | | | | | |
Net operating expenses | | | 2.00 | %(d) | | | 1.99 | % | | | 2.00 | % | | | 2.01 | % | | | 2.01 | % | | | 2.02 | % |
Net investment income (loss) | | | (0.78 | )%(d) | | | (0.19 | )% | | | (0.11 | )% | | | (0.32 | )% | | | 0.26 | % | | | 0.74 | % |
| Supplemental data: | | | | | | | | | | | | | | | | | | | | | | | | |
Portfolio turnover rate | | | 14.7 | % | | | 34.9 | % | | | 27.6 | % | | | 23.4 | % | | | 40.1 | % | | | 29.9 | % |
Net assets, end of | | | | | | | | | | | | | | | | | | | | | | | | |
period (000’s) | | $ | 61,362 | | | $ | 68,878 | | | $ | 73,818 | | | $ | 82,359 | | | $ | 81,804 | | | $ | 77,882 | |
| |
| (a) | | The amounts shown for a share outstanding may not correlate with the Statements of Operations for the period due to the timing of sales and repurchases of fund shares in relation to income earned and/or gains (losses) both realized and unrealized during the period. |
| (b) | | Calculated using average daily shares outstanding. |
| (c) | | Total return assumes reinvestment of all distributions and does not reflect a contingent deferred sales charge. Total returns for periods of less than one year are not annualized. |
| (d) | | Annualized. |
| 38 | See Notes to Financial Statements. |
| Financial Highlights (unaudited) | | IVA Funds |
IVA International Fund — Class I
For a share of each class of beneficial interest outstanding:
| | | Six Months Ended | | Year Ended September 30, |
| | | | | | | |
| | | March 31, 2017 | | 2016 | | 2015 | | 2014 | | 2013 | | 2012 |
| | | |
| Net asset value, | | | | | | | | | | | | | | | | | | | | | | | | |
beginning of period | | $ | 16.32 | | | $ | 16.43 | | | $ | 17.89 | | | $ | 17.43 | | | $ | 15.99 | | | $ | 15.60 | |
| | | | |
| Increase (decrease) from | | | | | | | | | | | | | | | | | | | | | | | | |
investment operations:(a) | | | | | | | | | | | | | | | | | | | | | | | | |
Net investment income(b) | | | 0.02 | | | | 0.13 | | | | 0.16 | | | | 0.12 | | | | 0.21 | | | | 0.27 | |
Net realized and unrealized | | | | | | | | | | | | | | | | | | | | | | | | |
gain (loss) | | | 0.68 | | | | 0.84 | | | | (0.55 | ) | | | 1.12 | | | | 1.99 | | | | 1.16 | |
| | | | |
| Increase (decrease) from | | | | | | | | | | | | | | | | | | | | | | | | |
investment operations | | | 0.70 | | | | 0.97 | | | | (0.39 | ) | | | 1.24 | | | | 2.20 | | | | 1.43 | |
| | | | |
| Decrease from distributions: | | | | | | | | | | | | | | | | | | | | | | | | |
Net investment income | | | (0.07 | ) | | | (0.45 | ) | | | (0.52 | ) | | | (0.46 | ) | | | (0.48 | ) | | | (0.27 | ) |
Net realized gain on | | | | | | | | | | | | | | | | | | | | | | | | |
investments | | | (0.17 | ) | | | (0.63 | ) | | | (0.55 | ) | | | (0.32 | ) | | | (0.28 | ) | | | (0.77 | ) |
| | | | |
| Decrease from distributions | | | (0.24 | ) | | | (1.08 | ) | | | (1.07 | ) | | | (0.78 | ) | | | (0.76 | ) | | | (1.04 | ) |
| | | | |
| Net asset value, end | | | | | | | | | | | | | | | | | | | | | | | | |
of period | | $ | 16.78 | | | $ | 16.32 | | | $ | 16.43 | | | $ | 17.89 | | | $ | 17.43 | | | $ | 15.99 | |
| | | | |
| Total return(c) | | | 4.38 | % | | | 6.20 | % | | | (2.16 | )% | | | 7.36 | % | | | 14.34 | % | | | 9.81 | % |
| Ratios to average net assets: | | | | | | | | | | | | | | | | | | | | | | | | |
Net operating expenses | | | 1.00 | %(d) | | | 0.99 | % | | | 1.00 | % | | | 1.01 | % | | | 1.01 | % | | | 1.02 | % |
Net investment income | | | 0.24 | %(d) | | | 0.85 | % | | | 0.92 | % | | | 0.69 | % | | | 1.31 | % | | | 1.79 | % |
| Supplemental data: | | | | | | | | | | | | | | | | | | | | | | | | |
Portfolio turnover rate | | | 14.7 | % | | | 34.9 | % | | | 27.6 | % | | | 23.4 | % | | | 40.1 | % | | | 29.9 | % |
Net assets, end of | | | | | | | | | | | | | | | | | | | | | | | | |
period (000’s) | | $ | 3,549,191 | | | $ | 3,639,098 | | | $ | 3,164,053 | | | $ | 3,136,324 | | | $ | 2,847,380 | | | $ | 2,280,940 | |
| |
| (a) | | The amounts shown for a share outstanding may not correlate with the Statements of Operations for the period due to the timing of sales and repurchases of fund shares in relation to income earned and/or gains (losses) both realized and unrealized during the period. |
| (b) | | Calculated using average daily shares outstanding. |
| (c) | | Total return assumes reinvestment of all distributions. Total returns for periods of less than one year are not annualized. |
| (d) | | Annualized. |
| See Notes to Financial Statements. | 39 |
| Notes to Financial Statements (unaudited) | | IVA Funds |
Note 1 – Organization and Significant Accounting Policies
IVA Fiduciary Trust (the “Trust”) consists of the IVA Worldwide Fund (the “Worldwide Fund”) and IVA International Fund (the “International Fund”) (each, a “Fund” and, together, the “Funds”). The Worldwide Fund and the International Fund are each a diversified investment portfolio of the Trust, an open-end series management investment company registered under the Investment Company Act of 1940, as amended (the “1940 Act”), and organized as a Massachusetts business trust. The Funds commenced investment operations on October 1, 2008. The Worldwide Fund seeks long-term growth of capital by investing in a range of securities and asset classes from markets around the world, including U.S. markets. The International Fund seeks long-term growth of capital by investing in a range of securities and asset classes from markets around the world.
The following are significant accounting policies followed by the Funds in the preparation of their financial statements in conformity with accounting principles generally accepted in the United States of America (“U.S. GAAP”). In accordance with U.S. GAAP, each Fund has been defined as an investment company and as such complies with investment company and reporting guidance of the Financial Accounting Standards Board. As of result, there are no changes to measurement or disclosure required in the Funds’ financial statements.
Use of Estimates. Preparation of these financial statements in conformity with U.S. GAAP requires the Funds’ management to make estimates and assumptions that may affect the amounts reported in the financial statements and related notes. Actual results could differ from these estimates.
Valuation of the Funds. The net asset value per share (“NAV”) of a Fund’s shares of a particular class is calculated each day that the New York Stock Exchange (“NYSE”) is open.
Listed equity securities are generally valued at the last sale price on the exchange that is the primary market for such securities. Equity securities listed on the NASDAQ Stock Exchange (“NASDAQ”) are generally valued using the NASDAQ Official Closing Price (“NOCP”). If no sales or NOCPs are reported during the day, equity securities are generally valued at the mean of the last available bid and asked quotations on the exchange or market on which the security is primarily traded, or using other market information obtained from a quotation reporting system, established market makers, or pricing services. If there is only a bid or only an asked price on such date, valuation will be at such bid or asked price for long and short positions, respectively. Over-the-counter (“OTC”) equity securities not listed on NASDAQ are generally valued at the mean of the last available bid and asked quotations on the market on which the security is primarily traded, or using other market information obtained from a quotation reporting system, established market makers or pricing services. If there is only a bid or only an asked price on such date, valuation will be at such bid or asked price for long or short positions, respectively.
Precious metals, including gold bullion, are valued at the spot price at the time trading on the NYSE closes (normally 4:00 p.m. E.S.T.).
Debt securities, other than commercial paper, for which market quotations are readily available are generally valued at the evaluated mean primarily based on the last bid and asked prices received from an independent pricing service. When no asked price is available, debt securities are valued at the evaluated bid price alone. Commercial paper is generally valued at the evaluated bid price provided by an independent pricing service. An evaluated price may include a variety of factors including the issue’s coupon rate, maturity, credit rating, yield, trade data, quoted prices of similar debt securities, and any other relevant market or security specific information.
Forward foreign currency contracts are valued at the current cost of offsetting such contracts.
The value of any investment that is listed or traded on more than one exchange or market is based on the exchange or market determined by International Value Advisers, LLC (the “Adviser”) to be the primary trading venue for that investment. A quotation from the exchange or market deemed by the Adviser to be the secondary trading venue for a particular investment may be relied upon in instances where a quotation is not available on the primary exchange or market.
The Board of Trustees of the Trust (the “Board”) has established a Pricing and Fair Valuation Committee (the “Committee”) comprised of officers of the Adviser to which it has delegated the responsibility for overseeing the implementation of the Funds’ valuation procedures and fair value determinations made on behalf of the Board. The Committee may determine that market quotations are not readily available due to events relating to a single issuer (e.g., corporate actions or announcements) or events relating to multiple issuers (e.g., governmental actions or natural disasters). The Committee may determine that there has been a significant decrease in the volume and level of activity for an asset or liability whereby transactions or quoted prices may not be determinative of fair value. The Committee may determine the fair value of investments based on information provided by pricing
| Notes to Financial Statements (unaudited) | | IVA Funds |
services and other third parties, including broker-dealers and other market intermediaries, which may recommend fair value prices or adjustments with reference to other securities, indices or assets. For securities that do not trade during NYSE hours or securities for which there is a foreign market holiday when the NYSE is open, fair valuation determinations are based on analyses of market movements after the close of those securities’ primary markets, and include reviews of developments in foreign markets, the performance of U.S. securities markets, and the performance of instruments trading in U.S. markets that represent foreign securities or baskets of foreign securities. Fair value pricing may require subjective determinations about the value of an asset or liability. Fair values used to determine the Funds’ NAVs may differ from quoted or published prices, or from prices that are used by others, for the same investments. The use of fair value pricing may not always result in adjustments to the prices of securities or other assets or liabilities held by the Funds.
Fair Value Measurement. The Funds adhere to U.S. GAAP fair value accounting standards that establish a single definition of fair value, create a three-tier hierarchy as a framework for measuring fair value based on inputs used to value the Funds’ assets and liabilities, and require additional disclosure about fair value. The hierarchy of inputs is summarized below:
| | • | | Level 1 – | last traded/quoted prices in active markets for identical unrestricted investments |
| | | | | |
| | • | | Level 2 – | other significant observable inputs (including quoted prices for similar or identical investments, amortized cost, interest rates, prepayment speeds, credit risk, other observable market data, etc.) |
| | | | | |
| | • | | Level 3 – | significant unobservable inputs (including the Funds’ own assumptions in determining the fair value of investments) |
The following is a summary of the inputs used in valuing the Worldwide Fund’s assets and liabilities at fair value:
| | | Last Traded/Quoted | | | | | | | | | | |
| | | Prices in Active | | Other Significant | | Significant | | | | |
| | | Markets for | | Observable | | Unobservable | | | | |
| | | Identical Unrestricted | | Inputs | | Inputs | | | | |
| ASSETS | | Investments (Level 1) | | (Level 2) | | (Level 3) | | Total |
| |
| Common stocks: | | | | | | | | | | | | |
Foreign | | $2,502,281,474 | | | — | | | — | | $ | 2,502,281,474 | |
United States | | 1,628,441,036 | | | — | | | — | | | 1,628,441,036 | |
| Preferred stocks | | 6,997,243 | | | — | | | — | | | 6,997,243 | |
| Corporate notes & bonds | | — | | $ | 161,893,803 | | $ | 154,101 | | | 162,047,904 | |
| Convertible bonds | | — | | | — | | | 104,789 | | | 104,789 | |
| Sovereign bonds | | — | | | 35,791,512 | | | — | | | 35,791,512 | |
| Commodities | | 474,887,580 | | | — | | | — | | | 474,887,580 | |
| Short-term investments | | — | | | 3,317,198,411 | | | — | | | 3,317,198,411 | |
| |
| Total assets | | $4,612,607,333 | | $ | 3,514,883,726 | | $ | 258,890 | | $ | 8,127,749,949 | |
| |
| LIABILITIES | | | | | | | | | | | | |
| |
| Unrealized depreciation on | | | | | | | | | | | | |
open forward foreign | | | | | | | | | | | | |
currency contracts | | — | | $ | (5,644,813 | ) | | — | | $ | (5,644,813 | ) |
| |
The Fund’s policy is to recognize transfers between levels as of the end of the reporting period. At March 31, 2017, the Worldwide Fund had no transfers between any levels.
| Notes to Financial Statements (unaudited) | | IVA Funds |
The following is a summary of the inputs used in valuing the International Fund’s assets and liabilities at fair value:
| | | Last Traded/Quoted | | | | | | | | | | |
| | | Prices in Active | | Other Significant | | Significant | | | | |
| | | Markets for | | Observable | | Unobservable | | | | |
| | | Identical Unrestricted | | Inputs | | Inputs | | | | |
| ASSETS | | Investments (Level 1) | | (Level 2) | | (Level 3) | | Total |
| |
| Common stocks: | | | | | | | | | | | | |
Foreign | | $2,310,483,471 | | $ | 12,778,683 | | | — | | $ | 2,323,262,154 | |
United States | | 56,671,543 | | | — | | | — | | | 56,671,543 | |
| Corporate notes & bonds | | — | | | 82,201,122 | | $ | 74,103 | | | 82,275,225 | |
| Convertible bonds | | — | | | — | | | 50,390 | | | 50,390 | |
| Sovereign and supranational bonds | | — | | | 43,907,426 | | | — | | | 43,907,426 | |
| Commodities | | 274,580,005 | | | — | | | — | | | 274,580,005 | |
| Short-term investments | | — | | | 1,092,874,686 | | | — | | | 1,092,874,686 | |
| |
| Total assets | | $2,641,735,019 | | $ | 1,231,761,917 | | $ | 124,493 | | $ | 3,873,621,429 | |
| |
| LIABILITIES | | | | | | | | | | | | |
| |
| Unrealized depreciation on | | | | | | | | | | | | |
open forward foreign | | | | | | | | | | | | |
currency contracts | | — | | $ | (6,204,692 | ) | | — | | $ | (6,204,692 | ) |
| |
The Fund’s policy is to recognize transfers between levels as of the end of the reporting period. At March 31, 2017, the International Fund had transfers of $21,708,580 from Level 2 to Level 1 as a result of the Fund using last traded prices. At March 31, 2017, the International Fund had transfers of $12,778,683 from Level 1 to Level 2 as result of the use of quoted prices in absence of last traded prices.
Foreign Currency Translation. Portfolio securities and other assets and liabilities initially valued in currencies other than the U.S. dollar are translated to U.S. dollars using exchange rates obtained from pricing services.
The Funds do not isolate that portion of the results of operations resulting from changes in foreign exchange rates on investments from the fluctuations arising from changes in market prices of investments held. Such fluctuations are included with the net realized and change in unrealized gain or loss on investments.
Net realized gains or losses on foreign currency transactions arise from sales of foreign currencies, including gains and losses on forward foreign currency contracts, currency gains or losses realized between the trade and settlement dates on securities transactions, and the difference between the amounts of dividends, interest, and foreign withholding taxes recorded on each Fund’s books and the U.S. dollar equivalent of the amounts actually received or paid. Net change in unrealized gains and losses from foreign currency translation arise from changes in the fair values of assets and liabilities, other than investments, at the date of valuation, resulting from changes in exchange rates.
Portfolio Transactions and Investment Income. Portfolio transactions are recorded on a trade date basis. Interest income, adjusted for amortization of premium and accretion of discount, is recorded on the accrual basis. Dividend income is recorded on the ex-dividend date. Realized gains and losses on investment transactions are determined by the specific identification method.
Class Allocation. Investment income, realized and unrealized gains and losses, and Fund expenses are allocated daily to the various classes of each Fund pro rata on the basis of relative net assets. Each class bears certain expenses unique to that class. Differences in class-level expenses may result in payment of different per share dividends by each share class.
Distributions to Shareholders. Distributions are recorded on the ex-dividend date and are determined in accordance with federal income tax regulations, which may differ from U.S. GAAP. Accordingly, the nature of distributions and composition of net assets for tax purposes differ from those reflected in the accompanying financial statements.
| Notes to Financial Statements (unaudited) | | IVA Funds |
Federal and Other Taxes. It is each Fund’s policy to comply with the federal income and excise tax requirements of the Internal Revenue Code of 1986, as amended, applicable to regulated investment companies. Accordingly, each Fund intends to distribute substantially all of its taxable income and net realized gains, if any, to shareholders each year. Therefore, no federal income tax provision is required in the Funds’ financial statements.
The Funds follow the Financial Accounting Standards Board accounting standard for accounting for uncertainty in income taxes. This standard defines the threshold for recognizing tax positions in the financial statements as “more-likely-than-not” to be sustained by the applicable taxing authority and requires measurement of a tax position meeting the “more-likely-than-not” criterion, based on the largest benefit that is more than fifty percent realized. Management has analyzed each Fund’s tax positions taken on federal and state tax returns for all open tax years (generally the current and the prior three tax years) and determined that no provision for income tax would be required in the Funds’ financial statements. Tax-related interest or penalties, if applicable, are to be disclosed in the Statements of Operations. For the six months ended March 31, 2017, the Funds did not incur any tax-related interest or penalties.
Under the applicable foreign tax laws, a withholding tax may be imposed on interest, dividends and capital gains at various rates. Dividend and interest withholding taxes and capital gains taxes incurred, for the six months ended March 31, 2017, can be found in the Statements of Operations.
Forward Foreign Currency Contracts. Each Fund engages in buying and selling forward foreign currency contracts to seek to manage the exposure of investments denominated in non-U.S. currencies against fluctuations in relative value. A forward foreign currency contract involves a privately negotiated obligation to purchase or sell (with delivery generally required) a specific currency at a future date, at a price set at the time of the contract.
Transactions with Affiliates. The Funds are permitted to purchase and sell securities (“cross-trade”) from and to other entities managed by the Adviser pursuant to procedures approved by the Board in compliance with Rule 17a-7 under the 1940 Act. In compliance with these provisions of Rule 17a-7, each cross-trade is executed at the current market price with no remuneration paid in connection with the transaction.
Foreign Investment Risk. Each Fund invests in foreign investments. Foreign investments can involve additional risks relating to political, economic or regulatory conditions in foreign countries. These risks include fluctuations in foreign currencies; withholding or other taxes; trading, settlement, custodial, and other operational risks; and the less stringent investor protection and disclosure standards of some foreign markets. Since foreign exchanges may be open on days when a Fund does not price its shares, the value of the investments in such Fund’s portfolio may change on days when shareholders will not be able to purchase or sell the Fund’s shares.
Custodian Risk. Cash is held at the Funds’ custodian, State Street Bank and Trust Company (the “Custodian”). The Funds are subject to credit risk on any cash balance that exceeds the amount insured by the Federal Deposit Insurance Corporation to the extent that the Custodian may be unable to return cash held.
Indemnification. Under the Trust’s organizational documents, its officers and trustees are indemnified against certain liability arising out of the performance of their duties to the Funds. The Funds have a variety of indemnification obligations under contracts with their service providers. The Funds’ maximum exposure under these arrangements is unknown. However, the Funds have not had prior claims or losses pursuant to these contracts and expect the risk of loss to be remote.
Note 2 – Investment Advisory Agreement and Distribution Agreement
International Value Advisers, LLC is the investment adviser of the Funds. The Adviser’s primary business is to provide investment management services to a variety of investment vehicles, including the Funds. The Adviser is responsible for all business activities and oversight of the investment decisions made for the Funds.
In return for providing investment advisory services to the Funds, each Fund pays the Adviser an investment advisory fee, calculated daily and paid monthly, at an annual rate of 0.90% of each Fund’s average daily net assets. Investment advisory fees paid for the six months ended March 31, 2017 are disclosed in the Statements of Operations.
The Funds have adopted Distribution and Services Plans (“12b-1 Plans”), pursuant to Rule 12b-1 under the 1940 Act. Under those 12b-1 Plans, the Funds pay a distribution fee with respect to Class A and C shares calculated at the annual rate of 0.25% and 0.75%, respectively, of the average daily net assets of each respective class. The Funds also pay a service fee with respect to Class C
| Notes to Financial Statements (unaudited) | | IVA Funds |
shares calculated at the annual rate of 0.25% of the average daily net assets. Class I shares do not participate in 12b-1 Plans. Fees paid under the 12b-1 Plans for the six months ended March 31, 2017 are disclosed in the Statements of Operations.
IVA Funds Distributors, LLC serves as the Funds’ sole and exclusive distributor.
There is a maximum initial sales charge of 5.00% for Class A shares. Class A shares may be subject to a contingent deferred sales charge (“CDSC”) of 0.75% if $1,000,000 or more of Class A shares were initially purchased, a “finder’s fee” was paid to the dealer of record, and the Class A shares were subsequently redeemed within 18 months.
Class C shares may be subject to a CDSC of 1.00% if shares are redeemed within the first 12 months after purchase.
Note 3 – Investments
For the six months ended March 31, 2017, the aggregate cost of purchases and proceeds from sales of investments (excluding short-term investments) were as follows:
| | | Worldwide | | International |
| | | Fund | | Fund |
| |
| Purchases | | $ | 474,307,737 | | | $ | 414,969,400 | |
| |
| Sales | | $ | 1,164,038,878 | | | $ | 384,143,292 | |
| |
| | | | | | | | | |
| The cost basis of investments for federal income tax purposes is substantially similar to the cost basis under U.S. GAAP. The following information is as of March 31, 2017. |
| | | | | | | | | |
| | | | | | | | | |
| | | | | | | | | |
| | | | Worldwide | | | | International | |
| | | | Fund | | | | Fund | |
| |
| Cost basis of investments | | $ | 6,937,985,564 | | | $ | 3,547,914,418 | |
| |
| Gross unrealized appreciation | | $ | 1,379,007,684 | | | $ | 542,808,081 | |
| |
| Gross unrealized depreciation | | $ | (189,243,299 | ) | | $ | (217,101,070 | ) |
| |
| Net unrealized appreciation | | $ | 1,189,764,385 | | | $ | 325,707,011 | |
| |
Note 4 – Derivative Instruments and Hedging Activities
The Funds enter into transactions involving derivative financial instruments in connection with their investing activities. During the six months ended March 31, 2017, these instruments included forward foreign currency contracts. These instruments are subject to various risks similar to non-derivative instruments including market, credit and liquidity risks.
The use of derivative instruments may involve risks different from, or potentially greater than, the risks associated with investing directly in investments. Specifically, derivative instruments expose a Fund to the risk that the counterparty to an OTC derivatives contract will be unable or unwilling to make timely settlement payments or otherwise to honor its obligations. OTC derivatives transactions typically can only be closed out with the other party to the transaction. If the counterparty defaults, a Fund will have contractual remedies, but there is no assurance that the counterparty will meet its contractual obligations or that, in the event of default, a Fund will succeed in enforcing them. During the six months ended March 31, 2017, the Funds had exposure to OTC derivatives in the form of forward foreign currency contracts.
Forward foreign currency contracts involve elements of market risk in excess of the amounts reflected in the Statements of Assets and Liabilities. The Funds bear the risk of an unfavorable change in the foreign exchange rate underlying the forward foreign currency contract, movements in foreign investment security values and changes in interest rates. Credit risks may also arise upon entering into these contracts from the potential inability of counterparties to meet the terms of their contracts.
The following summary of derivative instruments and hedging activity for each Fund is grouped by risk-type and provides information about the fair value and location of derivatives within the Statements of Assets and Liabilities at March 31, 2017.
| Notes to Financial Statements (unaudited) | | IVA Funds |
| Worldwide Fund |
| | | Statements of Assets | | | |
| Risk-Type Category | | and Liabilities Location | | Fair Value | |
| |
| Foreign exchange | | Unrealized depreciation on open forward foreign currency contracts | | $(5,644,813) | |
| |
| | | | | | |
| International Fund |
| | | Statements of Assets | | | |
| Risk-Type Category | | and Liabilities Location | | Fair Value | |
| |
| Foreign exchange | | Unrealized depreciation on open forward foreign currency contracts | | $(6,204,692) | |
| |
| | | | | | |
| The following is a summary for each Fund grouped by risk-type that provides information about the effect of derivatives and hedging activities on the Funds’ Statements of Operations for the six months ended March 31, 2017. |
| Worldwide Fund |
| | | | | | | Change in |
| | | | | | | Unrealized |
| | | | | | | Appreciation/ |
| Risk-Type Category | | Derivative Instrument | | Realized Gain | | (Depreciation) |
| |
| Foreign exchange | | Forward foreign currency contracts | | $25,451,994 | | $2,562,046 |
| |
| | | | | | | |
| International Fund | | | | | | |
| | | | | | | Change in |
| | | | | | | Unrealized |
| | | | | | | Appreciation/ |
| Risk-Type Category | | Derivative Instrument | | Realized Gain | | (Depreciation) |
| |
| Foreign exchange | | Forward foreign currency contracts | | $25,888,377 | | $535,569 |
| |
During the six months ended March 31, 2017, the Worldwide Fund had average notional values of $447,578,496 on forward foreign currency contracts to sell.
During the six months ended March 31, 2017, the International Fund had average notional values of $376,439,597 on forward foreign currency contracts to sell.
The following tables present, by counterparty, gross amounts of derivatives eligible for offsetting, gross amounts offset in the Statements of Assets and Liabilities and related collateral received and/or pledged, if any, that the Funds have elected to offset under their legally enforceable ISDA Master Netting Agreement with such counterparty. An ISDA Master Netting Agreement is an agreement between the Fund and the counterparty that governs the terms of certain transactions and reduces the counterparty risk associated with relevant transactions by specifying offsetting mechanisms and collateral arrangements, if any. Offsetting mechanisms allow the Funds to pay or receive the net amount of all forward foreign currency contracts outstanding on a given settlement date. At March 31, 2017, the Funds elected to offset forward foreign currency contracts on the Statements of Assets and Liabilities.
| Worldwide Fund |
| | | | | Gross Amount | | | | Net Exposure |
| | | Gross Amount of | | Offset in the | | | | Presented in the |
| | | Recognized | | Statements of | | Collateral | | Statements of Assets |
| Counterparty | | Liabilities | | Assets and Liabilities | | Pledged | | and Liabilities |
| |
| Forward foreign currency contracts | | | | | | | | |
State Street Bank & Trust Co. | | $(5,685,995) | | $41,182 | | $4,993,535 | | $(651,278) |
| |
| | | | | | | | | |
| International Fund | | | | | | | | |
| | | | | Gross Amount | | | | Net Exposure |
| | | Gross Amount of | | Offset in the | | | | Presented in the |
| | | Recognized | | Statements of | | Collateral | | Statements of Assets |
| Counterparty | | Liabilities | | Assets and Liabilities | | Pledged | | and Liabilities |
| |
| Forward foreign currency contracts | | | | | | | | |
State Street Bank & Trust Co. | | $(6,228,212) | | $23,520 | | $4,993,535 | | $(1,211,157) |
| |
| Notes to Financial Statements (unaudited) | | IVA Funds |
Note 5 – Shares of Beneficial Interest
At March 31, 2017, the Trust had an unlimited number of shares of beneficial interest authorized with a par value of $0.001 per share. The Funds have the ability to issue multiple classes of shares. Each share of a class represents an identical interest and has the same rights, except that each class bears certain direct expenses specifically related to the distribution of its shares.
Transactions in shares of each class of the Worldwide Fund were as follows:
| Worldwide Fund |
| | | Six Months Ended | | Year Ended |
| | | March 31, 2017 | | September 30, 2016 |
| |
| | | Shares | | Amount | | Shares | | Amount |
| |
| Class A | | | | | | | | | | | | | | | | |
Shares sold | | | 4,170,089 | | | $ | 72,446,101 | | | | 8,653,272 | | | $ | 143,643,764 | |
Shares reinvested | | | 906,939 | | | | 15,626,560 | | | | 3,963,837 | | | | 65,086,198 | |
Shares repurchased | | | (11,961,536 | ) | | | (208,004,085 | ) | | | (28,240,021 | ) | | | (472,721,421 | ) |
| |
| Net Decrease | | | (6,884,508 | ) | | $ | (119,931,424 | ) | | | (15,622,912 | ) | | $ | (263,991,459 | ) |
| |
| Class C | | | | | | | | | | | | | | | | |
Shares sold | | | 1,053,568 | | | $ | 18,065,444 | | | | 3,256,132 | | | $ | 53,547,661 | |
Shares reinvested | | | 504,096 | | | | 8,564,597 | | | | 1,842,160 | | | | 30,082,467 | |
Shares repurchased | | | (9,342,525 | ) | | | (160,328,526 | ) | | | (16,314,163 | ) | | | (269,246,845 | ) |
| |
| Net Decrease | | | (7,784,861 | ) | | $ | (133,698,485 | ) | | | (11,215,871 | ) | | $ | (185,616,717 | ) |
| |
| Class I | | | | | | | | | | | | | | | | |
Shares sold | | | 28,656,335 | | | $ | 500,746,549 | | | | 59,390,839 | | | $ | 987,552,969 | |
Shares reinvested | | | 3,104,821 | | | | 53,620,262 | | | | 13,113,463 | | | | 215,323,061 | |
Shares repurchased | | | (43,466,635 | ) | | | (754,792,903 | ) | | | (104,607,457 | ) | | | (1,747,019,925 | ) |
| |
| Net Decrease | | | (11,705,479 | ) | | $ | (200,426,092 | ) | | | (32,103,155 | ) | | $ | (544,143,895 | ) |
| |
| | | | | | | | | | | | | | | | | |
| Transactions in shares of each class of the International Fund were as follows: |
| | | | | | | | | | | | | | | | | |
| International Fund |
| | | Six Months Ended | | Year Ended |
| | | March 31, 2017 | | September 30, 2016 |
| |
| | | Shares | | Amount | | Shares | | Amount |
| |
| Class A | | | | | | | | | | | | | | | | |
Shares sold | | | 764,986 | | | $ | 12,344,102 | | | | 6,932,316 | | | $ | 113,732,117 | |
Shares reinvested | | | 184,673 | | | | 2,923,376 | | | | 1,906,896 | | | | 29,690,378 | |
Shares repurchased | | | (2,118,353 | ) | | | (34,153,095 | ) | | | (19,940,351 | ) | | | (310,588,962 | ) |
| |
| Net Decrease | | | (1,168,694 | ) | | $ | (18,885,617 | ) | | | (11,101,139 | ) | | $ | (167,166,467 | ) |
| |
| Class C | | | | | | | | | | | | | | | | |
Shares sold | | | 104,247 | | | $ | 1,655,350 | | | | 478,931 | | | $ | 7,447,454 | |
Shares reinvested | | | 35,327 | | | | 550,744 | | | | 218,714 | | | | 3,370,382 | |
Shares repurchased | | | (710,239 | ) | | | (11,252,445 | ) | | | (974,718 | ) | | | (15,223,470 | ) |
| |
| Net Decrease | | | (570,665 | ) | | $ | (9,046,351 | ) | | | (277,073 | ) | | $ | (4,405,634 | ) |
| |
| Class I | | | | | | | | | | | | | | | | |
Shares sold | | | 14,719,084 | | | $ | 237,534,759 | | | | 53,759,331 | | | $ | 842,635,732 | |
Shares reinvested | | | 2,820,082 | | | | 44,670,105 | | | | 11,400,118 | | | | 177,499,830 | |
Shares repurchased | | | (28,984,505 | ) | | | (466,690,613 | ) | | | (34,817,884 | ) | | | (552,154,849 | ) |
| |
| Net Increase (Decrease) | | | (11,445,339 | ) | | $ | (184,485,749 | ) | | | 30,341,565 | | | $ | 467,980,713 | |
| |
| Notes to Financial Statements (unaudited) | | IVA Funds |
Redemption Fees. The Funds impose a redemption fee of 2% of the total redemption amount on the Funds’ shares redeemed within 30 days of buying them or acquiring them by exchange. The redemption fee is credited to the applicable Fund. The purpose of the redemption fee is to deter excessive, short-term trading and other abusive trading practices, and to help offset the costs associated with the sale of portfolio securities to satisfy redemption and exchange requests made by “market timers” and other short-term shareholders, thereby insulating longer-term shareholders from such costs.
| Additional Information (unaudited) | | IVA Funds |
Proxy Voting. Information on how the Funds voted proxies relating to portfolio securities during the prior 12-month period ended June 30th of each year and a description of the policies and procedures that the Funds use to determine how to vote proxies relating to portfolio transactions are available (1)without charge, upon request, by calling 866-941-4482, and (2) on the Securities and Exchange Commission (“SEC”) website at www.sec.gov by accessing the Funds’ Form N-PX and Statement of Additional Information in the Funds’ registration statement on Form N-1A.
Schedules of Portfolio Holdings. The Funds file their complete schedules of portfolio holdings with the SEC for the first and third quarters of each fiscal year on Form N-Q. The Funds’ Form N-Q is available on the SEC’s website at www.sec.gov. The Funds’ Form N-Q may be reviewed and copied at the SEC’s Public Reference Room in Washington, D.C., and information on the operation of the Public Reference Room may be obtained by calling 800-SEC-0330. To obtain the Funds’ Form N-Q, shareholders can call 866-941-4482.
Trustees and Officers of the Funds. Additional information about Trustees and officers of the Funds is included in the Statement of Additional Information which is available, without charge, upon request, by calling 866-941-4482.
| Fund Expenses (unaudited) | | IVA Funds |
As a shareholder of the Funds, you may incur two types of costs: (1) transaction costs, including initial sales charges and/or redemption fees; and (2) ongoing costs, including investment advisory fees, distribution and/or service (12b-1) fees and other operating fund expenses. The information on this page is intended to help you understand your ongoing costs of investing in the Funds and to compare these costs with the ongoing costs of investing in other mutual funds.
This example is based on an investment of $1,000 invested on October 1, 2016 and held for the six months ended March 31, 2017.
ACTUAL EXPENSES
The table below titled “Based on Actual Total Return” provides information about actual account values and actual expenses. You may use the information provided in this table, together with the amount you invested, to estimate the expenses that you paid over the period. To estimate the expenses you paid on your account, divide your ending account value by $1,000 (for example, an $8,600 ending account value divided by $1,000 = 8.6), then multiply the result by the number under the heading titled “Expenses Paid During the Period.”
| BASED ON ACTUAL TOTAL RETURN FOR THE SIX MONTHS ENDED MARCH 31, 2017(a) |
| | | Actual
Total
Return | | Beginning
Account Value | | Ending
Account Value | | Annualized
Expense
Ratio | | Expenses
Paid During
the Period(b) |
| Worldwide Fund |
| Class A | | 5.26 | % | | $ | 1,000.00 | | $ | 1,052.60 | | 1.25 | % | | $ | 6.40 | |
| Class C | | 4.91 | % | | | 1,000.00 | | | 1,049.10 | | 2.00 | % | | | 10.22 | |
| Class I | | 5.43 | % | | | 1,000.00 | | | 1,054.30 | | 1.00 | % | | | 5.12 | |
| International Fund |
| Class A | | 4.25 | % | | $ | 1,000.00 | | $ | 1,042.50 | | 1.25 | % | | $ | 6.37 | |
| Class C | | 3.86 | % | | | 1,000.00 | | | 1,038.60 | | 2.00 | % | | | 10.17 | |
| Class I | | 4.38 | % | | | 1,000.00 | | | 1,043.80 | | 1.00 | % | | | 5.10 | |
HYPOTHETICAL EXAMPLE FOR COMPARISON PURPOSES
The table below titled “Based on Hypothetical Total Return” provides information about hypothetical account values and hypothetical expenses based on the actual expense ratio and an assumed rate of return of 5% per year before expenses, which are not the Funds’ actual returns. The hypothetical account values and expenses may not be used to estimate the actual ending account values and expenses you paid for the period. You may use the information provided in this table to compare the ongoing costs of investing in the Funds and other funds. To do so, compare the 5% hypothetical example relating to the Funds with the 5% hypothetical examples that appear in the shareholder reports of other funds.
Please note that expenses shown in the table below are meant to highlight your ongoing costs and do not reflect any transactional costs, such as initial sales charges (loads) or redemption fees, if any. Therefore, the table is useful in comparing ongoing costs only and will not help you determine your relative total costs of owning different funds. In addition, if these transactional costs were included, your costs would have been higher.
| BASED ON HYPOTHETICAL TOTAL RETURN FOR THE SIX MONTHS ENDED MARCH 31, 2017 |
| | | Hypothetical
Annualized
Total Return | | Beginning
Account Value | | Ending
Account Value | | Annualized
Expense
Ratio | | Expenses
Paid During
the Period(b) |
| Worldwide Fund |
| Class A | | 5.00 | % | | $ | 1,000.00 | | $ | 1,018.70 | | 1.25 | % | | $ | 6.29 | |
| Class C | | 5.00 | % | | | 1,000.00 | | | 1,014.96 | | 2.00 | % | | | 10.05 | |
| Class I | | 5.00 | % | | | 1,000.00 | | | 1,019.95 | | 1.00 | % | | | 5.04 | |
| International Fund |
| Class A | | 5.00 | % | | $ | 1,000.00 | | $ | 1,018.70 | | 1.25 | % | | $ | 6.29 | |
| Class C | | 5.00 | % | | | 1,000.00 | | | 1,014.96 | | 2.00 | % | | | 10.05 | |
| Class I | | 5.00 | % | | | 1,000.00 | | | 1,019.95 | | 1.00 | % | | | 5.04 | |
| | | | | |
| | |
| (a) | | Assumes reinvestment of all dividends and capital gain distributions, if any. |
| (b) | | Expenses are equal to the Funds’ respective annualized expense ratio multiplied by the average account value over the period, multiplied by 182 days in the most recent fiscal half-year, then divided by 365. |
| www.ivafunds.com |
| | Investment Adviser |
| International Value Advisers, LLC |
| 717 Fifth Avenue |
| New York, NY 10022 |
| | Distributor |
| IVA Funds Distributors, LLC |
| 3 Canal Plaza, Suite 100 |
| Portland, ME 04101 |
| | Custodian |
| State Street Bank and Trust Company |
| One Heritage Drive |
| Quincy, MA 02171-2105 |
| | Transfer Agent |
| Boston Financial Data Services, Inc. |
| 2000 Crown Colony Drive |
| Quincy, MA 02169 |
| | Counsel |
| K&L Gates LLP |
| State Street Financial Center |
| One Lincoln Street |
| Boston, MA 02111-2950 |
| | Independent Registered Public Accounting Firm |
| Ernst & Young LLP |
| 200 Clarendon Street |
| Boston MA, 02116-5072 |
| | This report is submitted for the general information of the Funds’ shareholders. The report is not authorized for distribution to prospective investors in the Funds unless it is accompanied or preceded by the Funds’ current prospectus, which includes information regarding the Fund’s risks, objectives, fees and expenses, experience of its management, and other information. |
| | The commentary within An Owner’s Manual, the Letter from the President, the Letter from the Portfolio Managers, and the Management’s Discussion of Fund Performance reflects their current views and opinions as of the date of this report. Any such views are subject to change at any time based upon market or other conditions and IVA Funds disclaims any responsibility to update such views. These views may not be relied on as investment advice and, because investment decisions are based on numerous factors, may not be relied on as an indication of trading intent. References to specific securities should not be construed as recommendations or investment advice. |
| Item 2. Code of Ethics. |
| | Not applicable. |
| | Item 3. Audit Committee Financial Expert. |
| | Not applicable. |
| | Item 4. Principal Accountant Fees and Services. |
| | Not applicable. |
| | Item 5. Audit Committee of Listed Registrants. |
| | Not applicable to the registrant. |
| | Item 6. Schedule of Investments. |
| | (a) The schedules of investments are included in the report to shareholders filed under Item 1 of this Form N-CSR. |
| | (b) Not applicable. |
| Item 7. Disclosure of Proxy Voting Policies and Procedures for Closed-End Management Investment Companies. |
| | Not applicable to the registrant. |
| | Item 8. Portfolio Managers of Closed-End Management Investment Companies. |
| | Not applicable to the registrant. |
| | Item 9. Purchases of Equity Securities by Closed-End Management Investment Company and Affiliated Purchasers. |
| | Not applicable to the registrant. |
| | Item 10. Submission of Matters to a Vote of Security Holders. |
| | The registrant does not have procedures by which shareholders may recommend nominees to the registrant’s Board of Trustees. The Nominating and Governance Committee may, in its sole discretion, consider nominees recommended by each Fund’s shareholders. |
| Item 11. Controls and Procedures. |
| | (a) Within 90 days of the filing date of this Form N-CSR, Michael W. Malafronte, the registrant’s President and Chief Executive Officer, and Stefanie J. Hempstead, the registrant’s Treasurer and Chief Financial Officer, reviewed the registrant’s Disclosure Controls and Procedures and Internal Control over Financial Reporting (the “Procedures”) (as defined in Rule 30a-3(c) under the Investment Company Act of 1940, as amended (the “1940 Act”)) and evaluated their effectiveness. Based on their review, Mr. Malafronte and Ms. Hempstead determined that the Procedures are reasonably designed to ensure that information required to be disclosed by the registrant on Form N-CSR is accumulated and communicated to the registrant’s management to allow timely decisions regarding required disclosure. |
| | (b) There were no changes in the registrant’s Procedures (as defined in Rule 30a-3(d) under the 1940 Act) that occurred during the second fiscal quarter of the period covered by this report that has materially affected, or is reasonably likely to materially affect, the registrant’s Procedures. |
| | Item 12. Exhibits. |
| | (a)(1) Not applicable. |
| | (a)(2) The certifications required by Rule 30a-2(a) of the 1940 Act and Section 302 of the Sarbanes-Oxley Act of 2002 (“Sarbanes-Oxley Act”) are filed herewith. |
| | (a)(3) Not applicable. |
| | (b) The certifications required by Rule 30a-2(b) of the 1940 Act and Section 906 of the Sarbanes-Oxley Act are filed herewith. |
| The certifications provided pursuant to Rule 30a-2(b) of the 1940 Act and Section 906 of the Sarbanes-Oxley Act are not deemed “filed” for purposes of Section 18 of the Securities Exchange Act of 1934, as amended (the “Exchange Act”), or otherwise subject to the liability of that section. Such certifications will not be deemed to be incorporated by reference into any filing under the Securities Act of 1933 or the Exchange Act, except to the extent that the registrant specifically incorporates them by reference. |
SIGNATURES
Pursuant to the requirements of the Securities Exchange Act of 1934 and the Investment Company Act of 1940, the registrant has duly caused this report to be signed on its behalf by the undersigned, thereunto duly authorized.
IVA FIDUCIARY TRUST
| By: | | |
| | | |
| | | Michael W. Malafronte |
| | | President and Chief Executive Officer |
Date: May 30, 2017
Pursuant to the requirements of the Securities Exchange Act of 1934 and the Investment Company Act of 1940, this report has been signed below by the following persons on behalf of the registrant and in the capacities and on the dates indicated.
| By: | | |
| | | |
| | | Michael W. Malafronte |
| | | President and Chief Executive Officer |
| | | |
| Date: | | May 30, 2017 |
| | | |
| By: | | |
| | | |
| | | Stefanie J. Hempstead |
| | | Treasurer and Chief Financial Officer |
| | | |
| Date: | | May 30, 2017 |
