SECURITIES AND EXCHANGE COMMISSION
Washington, D.C. 20549
FORM 20-F
(Mark One)
| ¨ | REGISTRATION STATEMENT PURSUANT TO SECTION 12(b) OR (g) OF THE SECURITIES EXCHANGE ACT OF 1934 |
OR
| x | ANNUAL REPORT PURSUANT TO SECTION 13 OR 15(d) OF THE SECURITIES EXCHANGE ACT OF 1934 |
For the fiscal year ended December 31, 2011
OR
| ¨ | TRANSITION REPORT PURSUANT TO SECTION 13 OR 15(d) OF THE SECURITIES EXCHANGE ACT OF 1934 |
for the transition period from to
| ¨ | SHELL COMPANY REPORT PURSUANT TO SECTION 13 OR 15(d) OF THE SECURITIES EXCHANGE ACT OF 1934 |
Date of event requiring this shell company report
Commission file number 333-154474
GRIFOLS, S.A.
(Exact name of Registrant as specified in its charter)
Kingdom of Spain
(Jurisdiction of incorporation)
Avinguda de la Generalitat, 152-158
Parc de Negocis Can Sant Joan
Sant Cugat del Vallès 08174
Barcelona, Spain
(address of principal executive offices)
David Ian Bell
General Counsel
Grifols Inc.
2410 Lillyvale Ave
Los Angeles, CA 90032-3514
(Name, Telephone, E-mail and/or Facsimile number and Address of Company Contact Person)
Securities registered or to be registered, pursuant to Section 12(b) of the Act.
| | |
Title of each class | | Name of each exchange
on which registered |
American Depositary Shares evidenced by American Depositary Receipts, each American Depositary Share representing one-half of one Class B non-voting share of Grifols, S.A. | | The NASDAQ Stock Market LLC |
Securities registered or to be registered pursuant to Section 12(g) of the Act.
(Title of Class)
None.
Securities for which there is a reporting obligation pursuant to Section 15(d) of the Act.
(Title of Class)
None.
Indicate by check mark if the registrant is a well-known seasoned issuer, as defined in Rule 405 of the Securities Act. Yes ¨ No x
If this report is an annual or transition report, indicate by check mark if the registrant is not required to file reports pursuant to Section 13 or 15(d) of the Securities Exchange Act of 1934. Yes ¨ No x
Indicate by check mark whether the registrant (1) has filed all reports required to be filed by Section 13 or 15(d) of the Securities Exchange Act of 1934 during the preceding 12 months (or for such shorter period that the registrant was required to file such reports), and (2) has been subject to such filing requirements for the past 90 days. Yes x No ¨
Indicate by check mark whether the registrant has submitted electronically and posted on its corporate Web site, if any, every Interactive Data File required to be submitted and posted pursuant to Rule 405 of Regulation S-T during the preceding 12 months (or for such shorter period that the registrant was required to submit and post such files). Yes ¨ No ¨
Indicate by check mark whether the registrant is a large accelerated filer, an accelerated filer, or a non-accelerated filer. See definition of “accelerated filer and large accelerated filer” in Rule 12b-2 of the Exchange Act. (Check one):
| | | | |
| Large accelerated filer ¨ | | Accelerated filer ¨ | | Non-accelerated filer x |
Indicate by check mark which basis of accounting the registrant has used to prepare the financial statements included in this filing:
| | | | |
| US GAAP ¨ | | International Financial Reporting Standards as issued by the International Accounting Standards Board x | | Other ¨ |
If “Other” has been checked in response to the previous question indicate by check mark which financial statement item the registrant has elected to follow. Item 17 ¨ Item 18 x
If this is an annual report, indicate by check mark whether the registrant is a shell company (as defined in Rule 12b-2 of the Exchange Act). Yes ¨ No x
Indicate the number of outstanding shares of each of the issuer’s classes of capital stock or common stock as of the close of business covered by the annual report.
213,064,899 Class A Shares
113,499,346 Class B Shares
GRIFOLS, S.A.
TABLE OF CONTENTS
ii
iii
GENERAL INFORMATION
As used in this annual report on Form 20-F, unless the context otherwise requires or as is otherwise indicated:
| | • | | all references in this document to “Grifols,” the “Company,” “we,” “us” and “our” refer to Grifols, S.A., a company (sociedad anónima) organized under the laws of Spain, and our consolidated subsidiaries, and for all periods following the closing of the acquisition of Talecris Biotherapeutics Holdings Corp., on June 1, 2011, these terms include Talecris Biotherapeutics Holdings Corp.; |
| | • | | all references to the “Group” or the “Grifols Group” are to Grifols, S.A. and the group of companies owned or controlled by Grifols, S.A.; |
| | • | | all references to “Talecris” refer to Talecris Biotherapeutics Holdings Corp., a Delaware corporation, and its consolidated subsidiaries, as existing prior to the closing of the acquisition; and |
| | • | | all references to the “acquisition” refer to our acquisition of Talecris, consummated on June 1, 2011. |
PRESENTATION OF FINANCIAL AND OTHER INFORMATION
The basis of presentation of financial information of Grifols in this document is in conformity with the International Financial Reporting Standards, or IFRS, as issued by the International Accounting Standards Board, or IASB, and other legislative provisions containing the applicable legislation governing our financial information, unless indicated otherwise.
Talecris has been included in our consolidated financial statements from June 2, 2011, the day following the consummation of the offering.
All references in this annual report on Form 20-F to (i) “euro,” “€” or “EUR” are to the common currency of the European Union and (ii) “U.S. dollar,” “$” or “USD” are to the currency of the United States, or U.S.
All tabular disclosures are presented in thousands of euro except share and per share amounts, percentages and as otherwise indicated. Certain monetary amounts and other figures included in this annual report on Form 20-F have been subject to rounding adjustments. Accordingly, any discrepancies in any tables between the totals and the sums of amounts listed are due to rounding.
PRESENTATION OF MARKET INFORMATION
Market information (including market share, market position and industry data for our operating activities and those of our subsidiaries or of companies acquired by us) or other statements presented in this annual report on Form 20-F regarding our position (or that of companies acquired by us) relative to our competitors largely reflect the best estimates of our management. These estimates are based upon information obtained from customers, trade or business organizations and associations, other contacts within the industries in which we operate and, in some cases, upon published statistical data or information from independent third parties. Except as otherwise stated, our market share data, as well as our management’s assessment of our comparative competitive position, has been derived by comparing our sales figures for the relevant period to our management’s estimates of our competitors’ sales figures for such period, as well as upon published statistical data and information from independent third parties, and, in particular, the reports published and the information made available by, among others, the Marketing Research Bureau, or MRB. You should not rely on the market share and other market information presented herein as precise measures of market share or of other actual conditions.
CAUTIONARY STATEMENT REGARDING FORWARD-LOOKING STATEMENTS
This annual report contains statements that constitute “forward-looking statements” within the meaning of the U.S. Private Securities Litigation Reform Act of 1995. Forward-looking statements are typically identified by words such as “may,” “anticipate,” “believe,” “estimate,” “predict,” “expect,” “intend,” “forecast,” “will,” “would,” “should” or the negative of such terms or other variations on such terms or comparable or similar words or expressions.
These forward-looking statements reflect, as applicable, our management’s current beliefs, assumptions and expectations and are subject to a number of factors that may cause actual results to differ materially. These factors include, but are not limited to:
| | • | | our significant indebtedness; |
| | • | | our ability to service our indebtedness, which in turn depends on our ability to generate cash; |
| | • | | the restrictive covenants governing our debt; |
| | • | | risks related to compliance with reporting obligations under U.S. securities laws and our internal control over financial reporting; |
| | • | | limitations on the enforcement of civil liabilities under U.S. securities laws; |
| | • | | the risks associated with the potential damage or contamination of plasma, our main raw material; |
| | • | | side effects associated with our products; |
| | • | | our adherence to current good manufacturing practice, or cGMP; |
| | • | | our ability to procure adequate quantities of plasma and other materials that are acceptable for use in our manufacturing processes; |
| | • | | fluctuations in the balance between supply and demand with respect to the market for plasma-derived products; |
| | • | | product concentration risk; |
| | • | | increased competition in our industry; |
| | • | | the impact of competitive products and the pricing and actions of competitors; |
| | • | | potential product liability claims or product recalls involving our products; |
| | • | | the impact of our substantial capital expenditures; |
| | • | | market risks, such as interest rate risk and foreign exchange rate risk; |
| | • | | the unprecedented volatility in the global economy and fluctuations in the financial markets; |
| | • | | unexpected shut-downs of our manufacturing and storage facilities or delays in opening new facilities; |
| | • | | disruptions in our distribution channels; |
| | • | | our ability to protect our intellectual property rights and defend against allegations of infringement by others; |
| | • | | our ability to resume or replace sales to countries affected by the ongoing Foreign Corrupt Practices Act, or FCPA, investigation; |
| | • | | potential sanctions, if any, that the Department of Justice, or DOJ, or other federal agencies, may impose on us as a result of the ongoing FCPA investigation; |
| | • | | our ability to commercialize products in development; |
| | • | | implementation of healthcare reform law in the U.S.; |
| | • | | potential decreases or limitations on reimbursement for purchasers of our products; |
| | • | | regulatory actions or lawsuits brought under federal or state laws; |
| | • | | extensive environmental, health and safety laws and regulations; |
| | • | | our ability to maintain compliance with government regulations and licenses, including those related to plasma collection, production, and marketing; and |
| | • | | other factors that are set forth below under Item 3 of this Part I, “Key Information — D. Risk Factors.” |
We include forward-looking statements in Item 4, Item 5 and Item 11 of this Part I, “Information on the Company,” “Operating and Financial Review and Prospects” and “Quantitative and Qualitative Disclosures About Market Risk,” respectively. Forward-looking statements are not guarantees of future performance and involve risks and uncertainties, including those listed above, and actual results may differ materially from those in the forward-looking statements.
The forward-looking statements contained in this annual report speak only as of the date of this annual report. Except as required by law, we do not undertake to update any forward-looking statement to reflect events or circumstances after that date or to reflect the occurrence of unanticipated events.
2
PART I
| Item 1. | IDENTITY OF DIRECTORS, SENIOR MANAGEMENT AND ADVISERS |
| | A. | Directors and Senior Management |
Not applicable.
Not applicable.
Not applicable.
| Item 2. | OFFER STATISTICS AND EXPECTED TIMETABLE |
Not applicable.
| | B. | Method and Expected Timetable |
Not applicable.
| | A. | Selected Financial Data |
Selected Consolidated Financial Information
The following is a summary of our historical consolidated financial data for the periods ended and at the dates indicated below. You are encouraged to read this information together with Item 5 of this Part I, “Operating and Financial Review and Prospects,” and our audited consolidated financial statements starting on page F-1 of this annual report on Form 20-F.
3
The following table presents our consolidated financial data for the periods and as of the dates indicated. Our consolidated balance sheet data as of December 31, 2011 and 2010 and our consolidated statement of operations data for the years ended December 31, 2011, 2010 and 2009 is derived from our audited consolidated financial statements for those years, which are included in this annual report on Form 20-F. Our consolidated balance sheet data as of December 31, 2009, 2008 and 2007 and our consolidated statement of operations data for the year ended December 31, 2008 and 2007 is derived from our consolidated financial statements for those years, which are not included in this Form 20-F.
| | | | | | | | | | | | | | | | | | | | |
| | | As of December 31, | |
Consolidated Balance Sheet Data | | 2011 | | | 2010 | | | 2009 | | | 2008 | | | 2007 | |
ASSETS | | | | | | | | | | | | | | | | | | | | |
Non-current assets | | | | | | | | | | | | | | | | | | | | |
Intangible assets | | | | | | | | | | | | | | | | | | | | |
Goodwill | | | 1,895,101 | | | | 189,448 | | | | 174,000 | | | | 158,567 | | | | 150,243 | |
Other intangible assets | | | 1,008,307 | | | | 78,299 | | | | 69,385 | | | | 57,756 | | | | 57,223 | |
| | | | | | | | | | | | | | | | | | | | |
Total intangible assets | | | 2,903,408 | | | | 267,747 | | | | 243,385 | | | | 216,323 | | | | 207,466 | |
Property, plant and equipment | | | 775,869 | | | | 434,131 | | | | 371,705 | | | | 301,009 | | | | 201,332 | |
Investments in equity accounted investees | | | 1,001 | | | | 598 | | | | 383 | | | | 374 | | | | 243 | |
Non-current financial assets | | | 12,401 | | | | 7,535 | | | | 3,731 | | | | 1,636 | | | | 891 | |
Deferred tax assets | | | 185,824 | | | | 34,889 | | | | 33,395 | | | | 34,297 | | | | 34,110 | |
| | | | | | | | | | | | | | | | | | | | |
Total non-current assets | | | 3,878,503 | | | | 744,900 | | | | 652,599 | | | | 553,639 | | | | 444,042 | |
| | | | | | | | | | | | | | | | | | | | |
Current assets | | | | | | | | | | | | | | | | | | | | |
Inventories | | | 1,030,341 | | | | 527,865 | | | | 484,462 | | | | 373,098 | | | | 270,659 | |
Trade and other receivables | | | | | | | | | | | | | | | | | | | | |
Trade receivables | | | 408,263 | | | | 224,355 | | | | 207,840 | | | | 186,324 | | | | 174,351 | |
Other receivables | | | 108,616 | | | | 44,032 | | | | 39,540 | | | | 43,443 | | | | 28,624 | |
Current income tax assets | | | 15,110 | | | | 14,607 | | | | 7,802 | | | | 5,428 | | | | 2,402 | |
| | | | | | | | | | | | | | | | | | | | |
Trade and other receivables | | | 531,989 | | | | 282,994 | | | | 255,182 | | | | 235,195 | | | | 205,377 | |
Other current financial assets | | | 16,904 | | | | 12,946 | | | | 8,217 | | | | 6,680 | | | | 7,600 | |
Other current assets | | | 9,395 | | | | 80,628 | | | | 7,345 | | | | 5,259 | | | | 6,201 | |
Cash and cash equivalents | | | 340,586 | | | | 239,649 | | | | 249,372 | | | | 6,368 | | | | 5,690 | |
| | | | | | | | | | | | | | | | | | | | |
Total current assets | | | 1,929,215 | | | | 1,144,082 | | | | 1,004,578 | | | | 626,600 | | | | 495,527 | |
| | | | | | | | | | | | | | | | | | | | |
Total Assets | | | 5,807,718 | | | | 1,888,982 | | | | 1,657,177 | | | | 1,180,239 | | | | 939,569 | |
| | | | | | | | | | | | | | | | | | | | |
EQUITY AND LIABILITIES | | | | | | | | | | | | | | | | | | | | |
Equity | | | | | | | | | | | | | | | | | | | | |
Share capital | | | 117,882 | | | | 106,532 | | | | 106,532 | | | | 106,532 | | | | 106,532 | |
Share Premium | | | 890,355 | | | | 121,802 | | | | 121,802 | | | | 121,802 | | | | 131,832 | |
Reserves | | | 568,274 | | | | 403,604 | | | | 314,903 | | | | 247,669 | | | | 184,608 | |
Own shares | | | (1,927 | ) | | | (1,927 | ) | | | (677 | ) | | | (33,087 | ) | | | (28,893 | ) |
Interim dividend | | | — | | | | — | | | | (31,960 | ) | | | — | | | | — | |
Profit for the year attributable to the Parent | | | 50,307 | | | | 115,513 | | | | 147,972 | | | | 121,728 | | | | 87,774 | |
| | | | | | | | | | | | | | | | | | | | |
Total equity | | | 1,624,891 | | | | 745,524 | | | | 658,572 | | | | 564,644 | | | | 481,853 | |
Available-for-sale financial assets | | | — | | | | — | | | | — | | | | (158 | ) | | | (152 | ) |
Cash flow hedges | | | (21,184 | ) | | | (1,751 | ) | | | (1,948 | ) | | | — | | | | — | |
Translation differences | | | 58,800 | | | | (50,733 | ) | | | (90,253 | ) | | | (84,457 | ) | | | (98,516 | ) |
| | | | | | | | | | | | | | | | | | | | |
Other comprehensive income | | | 37,616 | | | | (52,484 | ) | | | (92,201 | ) | | | (84,615 | ) | | | (98,668 | ) |
| | | | | | | | | | | | | | | | | | | | |
Equity attributable to the Parent | | | 1,662,507 | | | | 693,040 | | | | 566,371 | | | | 480,029 | | | | 383,185 | |
| | | | | | | | | | | | | | | | | | | | |
Minority interest | | | 2,487 | | | | 14,350 | | | | 12,157 | | | | 1,250 | | | | 981 | |
| | | | | | | | | | | | | | | | | | | | |
Total Equity (Net Assets) | | | 1,664,994 | | | | 707,390 | | | | 578,528 | | | | 481,279 | | | | 384,166 | |
| | | | | | | | | | | | | | | | | | | | |
Non-current liabilities | | | | | | | | | | | | | | | | | | | | |
Grants | | | 1,366 | | | | 2,088 | | | | 2,311 | | | | 2,353 | | | | 4,545 | |
Provisions | | | 11,502 | | | | 1,378 | | | | 1,232 | | | | 3,045 | | | | 999 | |
Non-current financial liabilities | | | | | | | | | | | | | | | | | | | | |
Loans and borrowings, bonds and other marketable securities | | | 2,809,225 | | | | 665,385 | | | | 703,186 | | | | 311,513 | | | | 178,425 | |
Other financial liabilities | | | 136,563 | | | | 10,474 | | | | 12,552 | | | | 12,542 | | | | 11,064 | |
| | | | | | | | | | | | | | | | | | | | |
Total non-current financial liabilities | | | 2,945,788 | | | | 675,859 | | | | 715,738 | | | | 324,055 | | | | 189,489 | |
Deferred tax liabilities | | | 538,441 | | | | 79,141 | | | | 60,325 | | | | 51,969 | | | | 43,794 | |
| | | | | | | | | | | | | | | | | | | | |
Total non-current liabilities | | | 3,496,647 | | | | 758,466 | | | | 779,606 | | | | 381,422 | | | | 238,827 | |
| | | | | | | | | | | | | | | | | | | | |
4
| | | | | | | | | | | | | | | | | | | | |
| | | | | |
Current liabilities | | | | | | | | | | | | | | | | | | | | |
Provisions | | | 81,112 | | | | 4,365 | | | | 4,702 | | | | 3,830 | | | | 3,957 | |
Current financial liabilities | | | | | | | | | | | | | | | | | | | | |
Loans and borrowings, bonds and other marketable securities | | | 147,789 | | | | 191,635 | | | | 113,991 | | | | 147,547 | | | | 177,540 | |
Other financial liabilities | | | 14,507 | | | | 18,236 | | | | 12,230 | | | | 9,685 | | | | 9,555 | |
| | | | | | | | | | | | | | | | | | | | |
Total current financial liabilities | | | 162,296 | | | | 209,871 | | | | 126,221 | | | | 157,232 | | | | 187,095 | |
Debts with associates | | | 2,435 | | | | 1,162 | | | | — | | | | — | | | | — | |
Trade and other payables | | | | | | | | | | | | | | | | | | | | |
Suppliers | | | 280,722 | | | | 160,678 | | | | 120,909 | | | | 107,613 | | | | 90,790 | |
Other payables | | | 27,335 | | | | 11,928 | | | | 17,832 | | | | 9,068 | | | | 11,396 | |
Current income tax liabilities | | | 4,691 | | | | 4,172 | | | | 3,258 | | | | 16,362 | | | | 3,770 | |
| | | | | | | | | | | | | | | | | | | | |
Total trade and other payables | | | 312,748 | | | | 176,778 | | | | 141,999 | | | | 133,043 | | | | 105,956 | |
Other current liabilities | | | 87,486 | | | | 30,950 | | | | 26,121 | | | | 23,433 | | | | 19,568 | |
| | | | | | | | | | | | | | | | | | | | |
Total current liabilities | | | 646,077 | | | | 423,126 | | | | 299,043 | | | | 317,538 | | | | 316,576 | |
| | | | | | | | | | | | | | | | | | | | |
Total Liabilities | | | 4,142,724 | | | | 1,181,592 | | | | 1,078,649 | | | | 698,960 | | | | 555,403 | |
| | | | | | | | | | | | | | | | | | | | |
Total Equity and Liabilities | | | 5,807,718 | | | | 1,888,982 | | | | 1,657,177 | | | | 1,180,239 | | | | 939,569 | |
| | | | | | | | | | | | | | | | | | | | |
| | | | | | | | | | | | | | | | | | | | |
| | | For the Year Ended December 31, | |
Consolidated Statement of Operations Data | | 2011 | | | 2010 | | | 2009 | | | 2008 | | | 2007 | |
Revenues | | | 1,795,613 | | | | 990,730 | | | | 913,186 | | | | 814,311 | | | | 703,291 | |
Changes in inventories of finished goods and work in progress | | | (35,150 | ) | | | 45,749 | | | | 73,093 | | | | 31,058 | | | | 16,882 | |
Self-constructed non-current assets | | | 34,548 | | | | 33,513 | | | | 41,142 | | | | 25,794 | | | | 19,860 | |
Supplies | | | (431,552 | ) | | | (304,818 | ) | | | (286,274 | ) | | | (206,738 | ) | | | (196,308 | ) |
Other operating income | | | 2,193 | | | | 1,196 | | | | 1,443 | | | | 1,289 | | | | 2,322 | |
Personnel expenses | | | (488,641 | ) | | | (289,008 | ) | | | (273,168 | ) | | | (238,159 | ) | | | (209,049 | ) |
Other operating expenses | | | (428,510 | ) | | | (205,260 | ) | | | (203,381 | ) | | | (192,288 | ) | | | (158,273 | ) |
Amortization and depreciation | | | (90,639 | ) | | | (45,776 | ) | | | (39,554 | ) | | | (33,256 | ) | | | (31,528 | ) |
Transaction costs of Talecris business combination | | | (44,352 | ) | | | (16,999 | ) | | | — | | | | — | | | | — | |
Non-financial and other capital grants | | | 1,304 | | | | 728 | | | | 1,188 | | | | 2,941 | | | | 282 | |
Impairment and gains/(losses) on disposal of fixed assets | | | (35,953 | ) | | | (372 | ) | | | (1,147 | ) | | | (1,991 | ) | | | (1,125 | ) |
| | | | | | | | | | | | | | | | | | | | |
Results from operating activities | | | 278,861 | | | | 209,683 | | | | 226,528 | | | | 202,961 | | | | 146,354 | |
| | | | | | | | | | | | | | | | | | | | |
Finance income | | | 5,761 | | | | 4,526 | | | | 7,067 | | | | 2,682 | | | | 4,526 | |
Finance expenses | | | (200,562 | ) | | | (49,660 | ) | | | (27,087 | ) | | | (29,305 | ) | | | (23,523 | ) |
Change in fair value of financial instruments | | | 1,279 | | | | (7,593 | ) | | | (587 | ) | | | (1,268 | ) | | | 829 | |
Impairment of gains/(losses) on disposal of financial instruments | | | (805 | ) | | | 91 | | | | (245 | ) | | | — | | | | — | |
Exchange losses | | | (3,477 | ) | | | 1,616 | | | | (1,733 | ) | | | (2,825 | ) | | | (4,618 | ) |
| | | | | | | | | | | | | | | | | | | | |
Finance income and expense | | | (197,774 | ) | | | (51,020 | ) | | | (22,585 | ) | | | (30,716 | ) | | | (22,786 | ) |
| | | | | | | | | | | | | | | | | | | | |
Share of profit of equity accounted investees | | | (1,064 | ) | | | (879 | ) | | | 51 | | | | 24 | | | | 19 | |
| | | | | | | | | | | | | | | | | | | | |
Profit before income tax from continuing operations | | | 80,023 | | | | 157,784 | | | | 203,994 | | | | 172,269 | | | | 123,587 | |
| | | | | | | | | | | | | | | | | | | | |
Income tax expense | | | (29,795 | ) | | | (42,517 | ) | | | (56,424 | ) | | | (50,153 | | | | (35,239 | ) |
| | | | | | | | | | | | | | | | | | | | |
Profit after income tax from continuing operations | | | 50,228 | | | | 115,267 | | | | 147,570 | | | | 122,116 | | | | 88,348 | |
| | | | | | | | | | | | | | | | | | | | |
Profit attributable to equity holders of the Parent | | | 50,037 | | | | 115,513 | | | | 147,972 | | | | 121,728 | | | | 87,774 | |
Profit attributable to minority interest | | | (79 | ) | | | (246 | ) | | | (402 | ) | | | 388 | | | | 574 | |
| | | | | | | | | | | | | | | | | | | | |
Consolidated profit for the year | | | 50,228 | | | | 115,267 | | | | 147,570 | | | | 122,116 | | | | 88,348 | |
| | | | | | | | | | | | | | | | | | | | |
Basic earnings per ordinary share | | | 0.19 | | | | 0.54 | | | | 0.71 | | | | 0.58 | | | | 0.41 | |
Average number of shares | | | | | | | | | | | | | | | | | | | | |
Basic earnings per ordinary share from continuing operations | | | | | | | | | | | | | | | | | | | | |
Diluted earnings per ordinary share | | | 0.19 | | | | 0.54 | | | | 0.71 | | | | 0.58 | | | | 0.41 | |
Diluted earnings per ordinary share from continuing operations | | | | | | | | | | | | | | | | | | | | |
Cash dividend per ordinary share | | | — | | | | 0.13 | | | | 0.38 | | | | 0.17 | | | | 0.06 | |
5
Exchange Rates
The following tables show, for the periods indicated, the exchange rate between the U.S. dollar and the euro. This information is provided solely for your information and we do not represent that euro could be converted into U.S. dollars at these rates or at any other rate, during the periods indicated or at any other time. These rates are not the rates used by us in the preparation of our audited consolidated financial statements included in this annual report on Form 20-F.
As used in this annual report on Form 20-F, the term “Noon Buying Rate” refers to the rate of exchange for euro, expressed in U.S. dollars per euro, in the City of New York for cable transfers payable in foreign currencies as certified by the Federal Reserve Bank of New York for customs purposes. The Noon Buying Rate for the euro on March 23, 2012 was $1.3263 = €1.00. The following tables describe, for the periods and dates indicated, information concerning the Noon Buying Rate for the euro. Amounts are expressed in U.S. dollars per €1.00.
| | | | | | | | | | | | | | | | |
Annual Data (Year Ended December 31,) | | Period
End ($) | | | Average
Rate ($) (1) | | | High ($) | | | Low ($) | |
2007 | | | 1.4603 | | | | 1.3797 | | | | 1.4862 | | | | 1.2904 | |
2008 | | | 1.3919 | | | | 1.4695 | | | | 1.6010 | | | | 1.2446 | |
2009 | | | 1.4332 | | | | 1.3955 | | | | 1.5100 | | | | 1.2547 | |
2010 | | | 1.3269 | | | | 1.3216 | | | | 1.4536 | | | | 1.1959 | |
2011 | | | 1.2926 | | | | 1.4002 | | | | 1.4875 | | | | 1.2926 | |
Source: Federal Reserve Bank of New York
| | (1) | The average of the Noon Buying Rates for the euro on the last day reported of each month during the relevant period. |
| | | | | | | | |
Recent Monthly Data | | High ($) | | | Low ($) | |
September 2011 | | | 1.4283 | | | | 1.3446 | |
October 2011 | | | 1.4172 | | | | 1.3281 | |
November 2011 | | | 1.3803 | | | | 1.3244 | |
December 2011 | | | 1.3487 | | | | 1.2926 | |
January 2012 | | | 1.3192 | | | | 1.2682 | |
February 2012 | | | 1.3463 | | | | 1.3087 | |
March 2012 (through March 23) | | | 1.3320 | | | | 1.3025 | |
| | B. | Capitalization and Indebtedness |
Not Applicable.
| | C. | Reasons for the Offer and Use of Proceeds |
Not Applicable.
Risk Relating to Our Structure, Shares and American Depositary Shares
Our substantial level of indebtedness could adversely affect our financial condition, restrict our ability to react to changes to our business, and prevent us from fulfilling our obligations under our debt.
We incurred substantial indebtedness in connection with the acquisition of Talecris. In order to finance the acquisition, (i) we entered into a credit and guaranty agreement dated as of November 23, 2010 (as amended by the first and second amendments thereto, the “Original Senior Credit Agreement”) to provide for (a) senior term loans aggregating $2.5 billion and €440 million (the “Original Senior Term Loans”) and (b) revolving commitments in the amounts of $50 million, €36.7 million ($50 million equivalent) and the $200 million equivalent in multicurrencies (the “Original Revolving Credit Facilities”) and (ii) we issued $1.1 billion aggregate principal amount of 8.25% senior notes due 2018 (“Notes”). As of December 31, 2011, our outstanding debt consisted primarily of $2.5 billion and €438.9 million outstanding under the Original Senior Term Loans and $1.1 billion aggregate principal amount of our Notes. In addition, as of December 31, 2011, we had €94.9 million of indebtedness under other bank loans and €31.7 in capital lease obligations.
On February 29, 2012, we entered into an amendment and restatement of the Original Credit Agreement (the “Amended and Restated Senior Credit Agreement”), which provided for the repricing of all of the Original Senior Term Loans and the Original
6
Revolving Facilities. The Amended and Restated Senior Credit Agreement provides for (i) senior term loans aggregating $2.3 billion and €420 million (the “Amended Senior Term Loans”), and (ii) revolving commitments in the amounts of $140 million, €22 million and the $35 million equivalent in multicurrencies (the “Amended Revolving Credit Facilities”). As of the date of this annual report of Form 20-F, the Amended Senior Term Loans were fully funded and no amounts have been drawn on the Amended Revolving Credit Facilities.
Our substantial level of indebtedness increases the risk that we may be unable to generate sufficient cash to pay amounts due in respect to our indebtedness. See Item 5 of this Part I, “Operating and Financial Review and Prospects — B. Liquidity and Capital Resources — Sources of Credit,” for the terms of the Amended and Restated Senior Credit Agreement and Notes and for more detailed information regarding our indebtedness.
Our high level of indebtedness could have significant adverse effects on our business, including the following:
| | • | | our high level of indebtedness makes it more difficult for us to satisfy our obligations with respect to our outstanding debt; |
| | • | | our high level of indebtedness makes us more vulnerable to economic downturns and adverse developments in our business; |
| | • | | our ability to obtain additional financing for working capital, capital expenditures, acquisitions or general corporate purposes may be impaired; |
| | • | | we must use a substantial portion of our cash flow from operations to pay interest on our indebtedness, which will reduce the funds available to us for operations and other purposes; |
| | • | | all of the indebtedness outstanding under our purchase money indebtedness, equipment financing and real estate mortgages will have a prior ranking claim on the underlying assets; |
| | • | | our ability to fund a change of control offer may be limited; |
| | • | | our high level of indebtedness could place us at a competitive disadvantage compared to our competitors that may have proportionately less debt; |
| | • | | our flexibility in planning for, or reacting to, changes in our business and the industry in which we operate may be limited; and |
| | • | | we may be restricted from making strategic acquisitions or exploiting other business opportunities. |
We expect to use cash flow from operations to pay our expenses and amounts due under our outstanding indebtedness. Our ability to make these payments depends on our future performance, which will be affected by financial, business, economic and other factors, many of which we cannot control. Our business may not generate sufficient cash flow from operations in the future and our anticipated growth in revenue and cash flow may not be realized, either or both of which could result in our being unable to repay indebtedness or to fund other liquidity needs. If we do not have enough money, we may be required to refinance all or part of our then-existing debt, sell assets or borrow more money. We may not be able to accomplish any of these alternatives on terms acceptable to us or at all. In addition, the terms of existing or future debt agreements may restrict us from adopting any of these alternatives. The failure to generate sufficient cash flow to service our indebtedness or to achieve any of these alternatives could materially and adversely affect our business, results of operations and financial condition.
Despite our substantial indebtedness, we may still incur significantly more debt. This could exacerbate the risks associated with our substantial leverage.
We may be able to incur significant additional indebtedness in the future. Although the Amended and Restated Senior Credit Agreement and the indenture that governs our Notes contain restrictions on the incurrence of additional indebtedness, these restrictions are subject to a number of qualifications and exceptions and the additional indebtedness incurred in compliance with these exceptions could be substantial. As of the date of this annual report on Form 20-F, there is $140 million, €22 million and the $35 million equivalent in multicurrencies of undrawn availability under the Amended Revolving Credit Facilities. In addition, the Amended and Restated Senior Credit Agreement also provides for incremental facilities that include an increase to the existing Revolving Credit Facilities and the establishment of one or more new term loan commitments, by an amount not to exceed $600 million in the aggregate. If we incur additional indebtedness, the risks related to our business associated with our high level of debt could intensify. For more information regarding our indebtedness, see Item 5 of this Part I, “Operating and Financial Review and Prospects — B. Liquidity and Capital Resources — Sources of Credit.”
7
To service our indebtedness and other obligations, we will require a significant amount of cash. Our ability to generate cash depends on many factors beyond our control.
Our ability to make payments on or to refinance our indebtedness and to fund working capital needs and planned capital expenditures will depend on our ability to generate cash in the future. A significant reduction in our operating cash flows resulting from changes in economic conditions, increased competition or other events beyond our control could increase the need for additional or alternative sources of liquidity and could have a material adverse effect on our business, financial condition, results of operations and prospects and our ability to service our debt and other obligations. If we are unable to service our indebtedness, we will be forced to adopt an alternative strategy that may include actions such as reducing capital expenditures, selling assets, restructuring or refinancing our indebtedness or seeking additional equity capital. We cannot assure you that any of these alternative strategies could be effected on satisfactory terms, if at all, or that they would yield sufficient funds to make required payments on our indebtedness.
We cannot assure you that our business will generate sufficient cash flows from operations or that future borrowings will be available to us under the Senior Credit Facilities or otherwise in an amount sufficient to enable us to pay our indebtedness or to fund our other liquidity needs. We may need to refinance all or a portion of our indebtedness on or before the maturity of the debt. We cannot assure you that we will be able to refinance any of our indebtedness, including our Amended and Restated Senior Credit Agreement or our Notes, on commercially reasonable terms or at all.
Covenants in our debt agreements will restrict our business in many ways.
The agreements governing our indebtedness and other financial obligations applicable to us contain various covenants that limit our ability to, among other things:
| | • | | incur or assume liens or additional debt or provide guarantees in respect of obligations of other persons; |
| | • | | issue redeemable stock and preferred equity; |
| | • | | pay dividends or distributions or redeem or repurchase capital stock; |
| | • | | prepay, redeem or repurchase debt; |
| | • | | make loans, investments and capital expenditures; |
| | • | | enter into agreements that restrict distributions from our subsidiaries; |
| | • | | sell assets and capital stock of our subsidiaries; |
| | • | | enter into certain transactions with affiliates; and |
| | • | | consolidate or merge with or into, or sell substantially all of our assets to, another person. |
A breach of any of these covenants could result in a default. Upon the occurrence of an event of default under the Amended and Restated Senior Credit Agreement, the lenders could elect to declare all amounts outstanding under Amended and Restated Senior Credit Agreement to be immediately due and payable and terminate all commitments to extend further credit. If we were unable to repay those amounts, the lenders could proceed against the collateral granted to them to secure that indebtedness. We have pledged a significant portion of our assets as collateral under Amended and Restated Senior Credit Agreement. If the lenders under the Amended and Restated Senior Credit Agreement accelerate the repayment of borrowings, we may not have sufficient assets to repay the Amended and Restated Senior Credit Agreement and our other indebtedness, including our Notes. Our borrowings under the Amended and Restated Senior Credit Agreement are at variable rates of interest and expose us to interest rate risk. If interest rates increase, our debt service obligations on the variable rate indebtedness would increase even though the amount borrowed remained the same, and our net income would decrease. See Item 11 of this Part I, “Quantitative and Qualitative Disclosures About Market Risk — Interest Rate Risk.”
Our ability to meet our financial obligations depends on our ability to receive dividends and other distributions from our subsidiaries.
Our principal assets are the equity interests that we hold in our operating subsidiaries. As a result, we are dependent on dividends and other distributions from our subsidiaries to generate the funds necessary to meet our financial obligations, including the payment of principal and interest on our outstanding debt. Our subsidiaries may not generate sufficient cash from operations to enable us to make principal and interest payments on our indebtedness. In addition, any payment of dividends, distributions, loans or advances to us by our subsidiaries could be subject to restrictions on dividends or, in the case of foreign subsidiaries, restrictions on repatriation of earnings under applicable local law and monetary transfer restrictions in the jurisdictions in which our subsidiaries operate. In addition, payments to us by our subsidiaries will be contingent upon our subsidiaries’ earnings. Our subsidiaries are
8
permitted under the terms of our indebtedness to incur additional indebtedness that may restrict payments from those subsidiaries to us. We cannot assure you that agreements governing current and future indebtedness of our subsidiaries will permit those subsidiaries to provide us with sufficient cash to fund payments on our indebtedness when due.
Our subsidiaries are legally distinct from us and, except for existing and future subsidiaries that will be guarantors of certain indebtedness, have no obligation, contingent or otherwise, to pay amounts due on our debt or to make funds available to us for such payment.
We are a foreign private issuer under the rules and regulations of the Securities and Exchange Commission and, thus, are exempt from a number of rules under the Securities Exchange Act of 1934 and are permitted to file less information with the Securities and Exchange Commission than a company incorporated in the U.S.
As a foreign private issuer under the Securities Exchange Act of 1934, or Exchange Act, we are exempt from certain rules under the Exchange Act, including the proxy rules, which impose certain disclosure and procedural requirements for proxy solicitations. Moreover, we are not required to file periodic reports and financial statements with the Securities and Exchange Commission, or SEC, as frequently or as promptly as U.S. companies with securities registered under the Exchange Act; we are not required to file financial statements prepared in accordance with United States generally accepted accounting principles; and we are not required to comply with SEC Regulation FD, which imposes certain restrictions on the selective disclosure of material information. In addition, our officers, directors and principal shareholders are not subject to the reporting or short-swing profit recovery provisions of Section 16 of the Exchange Act or the rules under the Exchange Act with respect to their purchases and sales of our Class A shares or Class B shares. Accordingly, you may receive less information about us than you would receive about a company incorporated in the U.S. and may be afforded less protection under the U.S. federal securities laws than you would be afforded with respect to a company incorporated in the U.S. If we lose our status as a foreign private issuer at some future time, we will no longer be exempt from such rules and, among other things, will be required to file periodic reports and financial statements as if we were a company incorporated in the U.S. The costs incurred in fulfilling these additional regulatory requirements could be substantial.
Additionally, pursuant to The NASDAQ Stock Market LLC, or NASDAQ, Listing Rules, as a foreign private issuer, we may elect to follow our home country practice in lieu of the corporate governance requirements of the NASDAQ Listing Rule 5600 Series, with the exception of those rules which are required to be followed pursuant to the provisions of NASDAQ Listing Rule 5615(a)(3). We have elected to follow Spanish practices in lieu of the requirements of the NASDAQ Listing Rule 5600 Series to the extent permitted under NASDAQ Listing Rule 5615(a)(3). See Item 16.G. of Part II, “Corporate Governance.”
If we discover significant deficiencies in our internal control over financial reporting, it may adversely affect our ability to provide timely and reliable financial information and satisfy our reporting obligations under U.S. federal securities laws, which also could affect the market price of our American Depositary Shares or our ability to remain listed on NASDAQ.
Effective internal and disclosure controls are necessary for us to provide reliable financial reports and effectively prevent fraud and to operate successfully as a public company. If we cannot provide reliable financial reports or prevent fraud, our reputation and operating results would be harmed. A “significant deficiency” is a deficiency, or combination of deficiencies, in internal control over financial reporting that is less severe than a material weakness, yet important enough to merit attention of those responsible for oversight of our financial reporting.
To the extent that any material weakness or significant deficiency exists in our or our consolidated subsidiaries’ internal control over financial reporting, such material weakness or significant deficiency may adversely affect our ability to provide timely and reliable financial information necessary for the conduct of our business and satisfaction of our reporting obligations under U.S. federal securities laws, which could affect our ability to remain listed on NASDAQ. Ineffective internal and disclosure controls could cause investors to lose confidence in our reported financial information, which could have a negative effect on the trading price of our American Depositary Shares, or ADSs, or the rating of our debt.
The Grifols family may continue to exercise significant influence over the conduct of our business.
The Grifols family and Scranton Enterprises B.V. own, directly and indirectly, 35.3% of our Class A shares. The Class A shares exercise 100% of voting control of our company. As a result, the Grifols family and Scranton Enterprises B.V. may exercise significant influence over matters requiring shareholders’ approval including, among other things, the election of our board of directors, or Board, dividend policy and certain fundamental corporate action, such as the issuance of bonds, a merger or a dissolution. Conflicts may arise between the interests of the principal shareholders and those of the other shareholders, and the principal shareholders may choose to resolve the conflict in a way that does not coincide with the interests of the other shareholders.
9
The market price of our Class B ADSs on NASDAQ may be volatile.
The market price of our Class B ADSs may be volatile as a result of various factors, many of which are beyond our control. These factors include, but are not limited to, the following:
| | • | | market expectations for our financial performance; |
| | • | | actual or anticipated fluctuations in our results of operations and financial condition; |
| | • | | changes in the estimates of our results of operations by securities analysts; |
| | • | | potential or actual sales of blocks of our Class B ADSs in the market by any shareholder or short selling of our Class B ADSs. Any such transaction could occur at any time or from time to time, with our without notice; |
| | • | | the entrance of new competitors or new products in the markets in which we operate; |
| | • | | volatility in the market as a whole; and |
| | • | | the risk factors mentioned in this section. |
The market price of our Class B ADSs may be adversely affected by any of the preceding or other factors regardless of operations and financial condition.
Fluctuations in the exchange rate between the U.S. dollar and the euro may increase the risk of holding our ADSs or shares.
The Spanish securities market for equity securities consists of four stock exchanges located in Madrid, Barcelona, Bilbao and Valencia, or, collectively, the Spanish Stock Exchanges. The majority of the transactions conducted on the Spanish Stock Exchanges are done through the Automated Quotation System (Sistema Interbancario Bursátil Español, orS.I.B.E.).
Our Class A shares and Class B shares are listed on the Spanish Stock Exchanges and quoted on the Automated Quotation System in euro. In addition, our Class B shares are traded in the U.S. on the NASDAQ Global Select Market in the form of ADSs, evidenced by American Depositary Receipts, or ADRs, in U.S. dollars. Fluctuations in the exchange rate between the U.S. dollar and the euro may result in temporary differences between the value of our ADSs and the value of our shares, which may result in heavy trading by investors seeking to exploit such differences. This may increase the volatility of, and have an adverse effect on, the price of our shares or ADSs.
In addition, as a result of fluctuations in the exchange rate between the U.S. dollar and the euro, the U.S. dollar equivalent of the proceeds that a holder of our ADSs would receive upon the sale in Spain of any shares withdrawn from the ADR depositary and the U.S. dollar equivalent of any cash dividends paid in euro on our shares represented by the ADSs could also decline.
Subscription (or preemptive) rights may be unavailable to U.S. holders of our shares or ADSs.
In the case of a future increase of our registered share capital, existing shareholders will generally be entitled to subscription (or preemptive) rights pursuant to Spanish law, unless waived by a resolution of the shareholders or, if such power has been delegated to the Board pursuant to a shareholders’ resolution, by a resolution of the Board and except in certain situations, such as capital increases made for an in-kind contribution, in which subscription (or preemptive) rights are not applicable by law. Holders of the Class B shares will generally not have a right to vote on any resolution on a capital increase or on the waiver of subscription (or preemptive) rights, unless such resolution does not treat the Class B shares in the same way as the Class A shares, except in the limited circumstances set out in the Articles of Association of Grifols, S.A., or Articles of Association.
Even if preemptive rights are granted, holders of our ADSs or U.S. resident shareholders may not be able to exercise subscription (or preemptive) rights, in which case holders of our ADSs could be substantially diluted, unless a registration statement under the Securities Act of 1933, or Securities Act, is effective with respect to such rights and the shares for which they give such right or an exemption from the registration requirements of the Securities Act is available.
We intend to evaluate at the time of any rights offering the costs and potential liabilities associated with any such registration requirements, as well as the benefits of enabling the exercise of subscription (or preemptive) rights for the shares. In doing so, we will also evaluate any other factors that we may consider appropriate at the time. There can be no assurance that we will decide to comply with such registration requirements. If no such registration requirements are satisfied, the depositary will sell the subscription (or preemptive) rights relating to the ADSs on deposit and will distribute the proceeds of such sale, if any, to the holders of the ADSs. If the depositary is unable to sell rights that are not exercised or not distributed or if the sale is not lawful or reasonably practicable, it will allow the rights to lapse, in which case no value will be given for these rights.
10
ADS holders may be subject to limitations on the transfer of their ADSs.
ADSs are transferable on the books of the depositary. However, the depositary may refuse to deliver, transfer or register transfers of ADSs generally when the books of the depositary are closed or if such action is deemed necessary or advisable by the depositary or by us because of any requirement of law or of any government or governmental body or commission or under any provision of the deposit agreement. Moreover, the surrender of ADSs and withdrawal of our shares may be suspended subject to the payment of fees, taxes and similar charges or if we direct the depositary at any time to cease new issuances and withdrawals of our shares during periods specified by us in connection with shareholders’ meetings, the payment of dividends or as otherwise reasonably necessary for compliance with any applicable laws or government regulations.
Your ability to enforce civil liabilities under U.S. securities laws may be limited.
We are a company organized under the laws of Spain, and most of our subsidiaries are also incorporated outside of the U.S. A substantial portion of our assets and the assets of our subsidiaries are located outside of the U.S. In addition, nearly all of our directors and officers and certain of our subsidiaries’ officers are nationals or residents of countries other than the U.S., and all or a substantial portion of such persons’ assets are located outside the U.S. As a result, it may be difficult for investors to effect service of process within the U.S. upon us or certain subsidiaries or their directors or officers with respect to matters arising under the Securities Act or to enforce against them judgments of courts of the U.S. predicated upon civil liability under the Securities Act. It may also be difficult to recover fully in the U.S. on any judgment rendered against such persons or against us or certain of our subsidiaries.
In addition, there is doubt as to the enforceability in Spain of original actions, or of actions for enforcement of judgments of U.S. courts of liabilities, predicated solely upon the securities laws of the U.S. If a judgment was obtained outside Spain and efforts were made to enforce the judgment in Spain, there is some doubt that Spanish courts would agree to recognize and enforce a foreign judgment. Accordingly, even if you obtain a favorable judgment in a U.S. court, you may be required to re-litigate your claim in Spain.
Risks Relating to Our Business
Our manufacturing processes are complex and involve biological intermediates that are susceptible to contamination and variations in yield.
Plasma is a raw material that is susceptible to damage and contamination and may contain human pathogens, any of which would render the plasma unsuitable as raw material for further manufacturing. For instance, improper storage of plasma by us or third-party suppliers, if any, may require us to destroy some of our raw material. If unsuitable plasma is not identified and discarded prior to the release of the plasma to our manufacturing processes, it may be necessary to discard intermediate or finished product made from that plasma or to recall any finished product released to the market, resulting in a charge to cost of goods sold.
The manufacture of our plasma products is an extremely complex process of fractionation (separating the plasma into component proteins), purification, filling and finishing. Our products can become non-releasable or otherwise fail to meet our specifications through a failure of one or more of our product testing, manufacturing, process controls and quality assurance processes. We may detect instances in which an unreleased product was produced without adherence to our manufacturing procedures, or plasma used in our production process was not collected or stored in a compliant manner consistent with cGMP regulations or other regulations. Such an event of noncompliance would likely result in our determination that the impacted products should not be released and therefore should be destroyed. For example, a malfunction of the Gamunex® intravenous immunoglobulin, or IVIG, chromatography system just prior to Talecris’ formation transaction in 2005 resulted in the processing of IVIG products containing elevated levels of antibodies for over one month. Talecris’ total cost related to this incident, including the costs of product loss, investigation, testing, disposal, and other remedial actions, was approximately $41.6 million. Talecris subsequently recovered from Bayer HealthCare LLC, or Bayer, $10.7 million through its 2005 working capital adjustment and $9.0 million in the first quarter of 2007 through a settlement.
Once we have manufactured our plasma-derived products, they must be handled carefully and kept at appropriate temperatures. Our failure, or the failure of third parties that supply, ship or distribute our products, to properly care for our plasma-derived products may require that such products be destroyed.
While we expect to write off small amounts of work-in-process inventories in the ordinary course of business due to the complex nature of plasma, our processes and our products, unanticipated events may lead to write-offs and other costs materially in excess of our expectations. We have in the past had issues with product quality and purity that have caused us to write off the value of our product. Such write-offs and other costs could cause material fluctuations in our profitability. Furthermore, contamination of our products could cause investors, consumers or other third parties with whom we conduct business to lose confidence in the reliability
11
of our manufacturing procedures, which could adversely affect sales and profits. In addition, faulty or contaminated products that are unknowingly distributed could result in patient harm, threaten the reputation of our products and expose us to product liability damages and claims.
Additionally, due to the nature of plasma, there will be variations in the biologic properties of the plasma we collect or purchase for fractionation that may result in fluctuations in the obtainable yield of desired fractions, even if cGMP is followed. Lower yields may limit production of our plasma-derived products due to capacity constraints. If these batches of plasma with lower yields impact production for extended periods, it may reduce the total capacity of product that we could market and increase our cost of goods sold, thus reducing our profitability.
Once our products are approved and marketed, we must continually monitor them for signs that their use may elicit serious and unexpected side effects, which could jeopardize our ability to continue marketing our products. We may also be required to conduct post-approval clinical trials as a condition to licensing a product.
As for all pharmaceutical products, the use of our products sometimes produces undesirable side effects or adverse reactions or events, or, collectively, “adverse events.” For the most part, these adverse events are known, are expected to occur at some frequency and are described in the products’ labeling. Known adverse events of a number of our products include allergic or anaphylactic reactions including shock and the transmission of infective agents. Further, the use of certain products sometimes produces additional adverse events, which are detailed below.
| | • | | The use of albumin sometimes produces the following adverse events: hypervolaemia, circulatory overload, pulmonary edema, hyperhydration and allergic manifestations including urticaria, chills, fever and changes in respiration, pulse and blood pressure. |
| | • | | The use of blood clotting factor ix, or Factor IX, sometimes produces the following adverse events: the induction of neutralizing antibodies; thromboembolism, including myocardial infarction; disseminated intravascular coagulation; venous thrombosis and pulmonary embolism; and, in the case of treatment for immune tolerance induction, nephrotic syndrome. |
| | • | | The use of the anti-hemophilic blood clotting factor, or Factor VIII, sometimes produces the following adverse events: the induction of neutralizing antibodies, thromboembolic events and hemolytic anemia or hemolysis. |
| | • | | The use of IVIG sometimes produces the following adverse events: nausea, vomiting, asthenia, pyrexia, rigors, injection site reaction, allergic or anaphylactic reaction, aseptic meningitis, arthralgia, back pain, dizziness, headache, rash, pruritus, urticaria, hemolysis or hemolytic anemia, hyperproteinemia, increased serum viscosity and hyponatremia, thromboembolic reactions such as myocardial infarction, stroke, pulmonary embolism and deep vein thromboses, transfusion-related acute lung injury and renal dysfunction and acute renal failure. |
| | • | | The use of anti-hepatitis B IVIG sometimes produces the following adverse events: thromboembolic reactions such as myocardial infarction, stroke, pulmonary embolism and deep vein thromboses, aseptic meningitis, hemolytic anemia or hemolysis and acute renal failure. |
| | • | | The use of Plasbumin® 5%, 20% or 25% sometimes produces the following adverse events: allergic manifestations including urticaria, chills, fever and changes in respiration, pulse and blood pressure. |
| | • | | The use of Plasmanate® sometimes produces the following adverse events: hypotension, flushing, urticaria, back pain, nausea and headache. |
| | • | | The use of Koate®-DVI, which we license exclusively in the U.S. to Kedrion S.p.A, a corporation organized under the laws of Italy, or Kedrion, sometimes produces the following adverse events: allergic type reactions; tingling in the arm, ear and face; blurred vision; headache; nausea; stomach ache; and jittery feeling. |
| | • | | The use of Prolastin® or its successor in the U.S. and Canada, Prolastin®-C, alpha-1 proteinase inhibitor, or A1PI, sometimes produces the following adverse events: dyspnea, tachycardia, rash, chest pain, chills, influenza-like symptoms, hypersensitivity, hypotension and hypertension. |
In addition, the use of our products may be associated with serious and unexpected adverse events, or with less serious reactions at a greater than expected frequency. This may be especially true when our products are used in critically ill patient populations. When these unexpected events are reported to us, we must make a thorough investigation to determine causality and implications for product safety. These events must also be specifically reported to the applicable regulatory authorities. If our evaluation concludes, or regulatory authorities perceive, that there is an unreasonable risk associated with the product, we would be obligated to withdraw the impacted lot(s) of that product. Furthermore, an unexpected adverse event caused by a new product could be recognized only after extensive use of the product, which could expose us to product liability risks, enforcement action by regulatory authorities and damage to our reputation and public image.
12
Once we produce a product, we rely on physicians to prescribe and administer it as we have directed and for the indications described on the labeling. It is not, however, unusual for physicians to prescribe our products for unapproved, or off-label, uses or in a manner that is inconsistent with our directions. To the extent such off-label uses and departures from our administration directions become pervasive and produce results such as reduced efficacy or other adverse effects, the reputation of our products in the marketplace may suffer.
When a new product is approved, the Food and Drug Administration, or FDA, or other regulatory authorities may require post-approval clinical trials, sometimes called Phase IV clinical trials. If the results of such trials are unfavorable, this could result in the loss of the license to market the product, with a resulting loss of sales.
Our ability to continue manufacturing and distributing our products depends on our and our suppliers’ continued adherence to cGMP regulations.
The manufacturing processes for our products are governed by detailed written procedures and federal regulations that set forth cGMP requirements for blood and blood products. Our quality operations unit monitors compliance with these procedures and regulations, and the conformance of materials, manufacturing intermediates and final products to their specifications. Failure to adhere to established procedures or regulations, or to meet a specification, could require that a product or material be rejected and destroyed. There are relatively few opportunities for us to rework, reprocess or salvage nonconforming materials or products.
Our adherence to cGMP regulations and the effectiveness of our quality systems are periodically assessed through inspections of our facilities by the FDA and analogous regulatory authorities of other countries. We cannot assure you that we will not be cited for deficiencies in the future. If deficiencies are noted during an inspection, we must take action to correct those deficiencies and to demonstrate to the regulatory authorities that our corrections have been effective. If serious deficiencies are noted or if we are unable to prevent recurrences, we may have to recall product or suspend operations until appropriate measures can be implemented. We are required to report some deviations from procedures to the FDA. Even if we determine that the deviations were not material, the FDA could require us to take similar measures. Since cGMP reflects ever-evolving standards, we regularly need to update our manufacturing processes and procedures to comply with cGMP. These changes may cause us to incur costs without improving our profitability or the safety of our products. For example, more sensitive testing assays (if and when they become available) may be required or existing procedures or processes may require revalidation, all of which may be costly and time-consuming and could delay or prevent the manufacturing of a product or launch of a new product.
Changes in manufacturing processes, including a change in the location where the product is manufactured or a change of a third-party manufacturer, may require prior FDA review and approval or revalidation of the manufacturing processes and procedures in accordance with cGMP. There may be comparable foreign requirements.
For example, we have finished the construction of a new plant at our facility located in Los Angeles, California, or our Los Angeles facility, for the production of IVIG and we have begun the validation process with the appropriate regulatory authorities. To validate our manufacturing processes and procedures following completion of upgraded facilities, we must demonstrate that the processes and procedures at the upgraded facilities are comparable to those currently in place at our facilities. To provide such a comparative analysis, both the existing processes and the processes that we expect to be implemented at our upgraded facilities must comply with the regulatory standards prevailing at the time that our expected upgrade is completed. In addition, regulatory requirements, including cGMP regulations, continually evolve. Failure to adjust our operations to conform to new standards as established and interpreted by applicable regulatory authorities would create a compliance risk that could impair our ability to sustain normal operations.
In addition, we have completed the process of transferring the manufacture of our Thrombate III® product from Bayer’s Berkeley, California, biologics manufacturing facility to our Clayton, North Carolina plasma fractionation and manufacturing facility, or Clayton facility, that we are currently validating with regulatory approval expected in 2012. We cannot guarantee that we have a sufficient inventory of intermediates and finished product to meet demand until the new facility is approved and manufacturing can recommence. To validate our manufacturing processes and procedures following completion of the upgraded facilities, we must demonstrate that the processes and procedures at the upgraded facilities are comparable to those currently in place at Bayer’s facilities. In order to provide such a comparative analysis, both the existing processes and the processes that we expect to be implemented at our upgraded facilities must comply with the regulatory standards prevailing at the time that our expected upgrade is completed. If the FDA does not approve the transfer, our ability to market our Thrombate III® product will be seriously impaired or eliminated. In addition, regulatory requirements, including cGMP regulations, continually evolve. Failure to adjust our operations to conform to new standards as established and interpreted by applicable regulatory authorities would create a compliance risk that could impair our ability to sustain normal operations.
A number of inspections by the FDA and foreign control authorities, including the European Medicines Agency, or EMA, have been conducted or are expected at our plasma collection centers in 2012. Some of these inspections are of licensed centers to
13
assess ongoing compliance with cGMP. If the FDA (or other authorities) finds these centers not to be in compliance, our ongoing operations or plans to expand plasma collections would be adversely affected.
We would become supply-constrained and our financial performance would suffer if we could not obtain adequate quantities of FDA-approved source plasma.
In order for plasma to be used in the manufacturing of our products, the individual centers at which the plasma is collected must be licensed by the FDA and approved by the regulatory authorities, such as the EMA, of those countries in which we sell our products. When a new plasma collection center is opened and on an ongoing basis after its licensure, it must be inspected by the FDA and the EMA for compliance with cGMP and other regulatory requirements. An unsatisfactory inspection could prevent a new center from being licensed or risk the suspension or revocation of an existing license.
In order for a plasma collection center to maintain its license, its operations must continue to conform to cGMP and other regulatory requirements. In the event that we determine a plasma collection center did not comply with cGMP in collecting plasma, we may be unable to use and may ultimately destroy plasma collected from that center, which would be recorded as a charge to cost of goods. Additionally, if noncompliance in the plasma collection process is identified after the impacted plasma has been pooled with compliant plasma from other sources, entire plasma pools, in-process intermediate materials and final products could be impacted. Consequently, we could experience significant inventory impairment provisions and write-offs which could adversely affect our business and financial results. During 2008, Talecris experienced such an event at one of their plasma collection centers, which resulted in a charge to cost of goods sold of $23.3 million, for which they subsequently recovered $19.4 million through December 31, 2010. In this particular instance, a portion of the impacted plasma had been released to manufacturing prior to Talecris’ detection of the issue.
We plan to obtain our supplies of plasma for use in our manufacturing processes through collections at our plasma collection centers and through selective acquisitions or remodeling and relocations of existing centers. This strategy is dependent upon our ability to successfully integrate new centers, to obtain FDA and other necessary approvals for the remaining unlicensed centers, to maintain a cGMP compliant environment in all centers, and to expand production and attract donors to our centers.
Our ability to increase and improve the efficiency of production at our plasma collection centers may be affected by changes in the economic environment and population in selected regions where we operate plasma collection centers, by the entry of competitive centers into regions where we operate, by misjudging the demographic potential of individual regions where we expect to increase production and attract new donors, by unexpected facility related challenges, or by unexpected management challenges at selected plasma collection centers.
A significant disruption in our supply of plasma could have a material adverse effect on our business and our growth plans.
The majority of our revenue depends on our access to U.S. source plasma (plasma obtained through plasmapheresis), the principal raw material for our plasma derivative products. Our ability to increase revenues depends substantially on increased access to plasma. We expect that our plasma needs through 2015 will be met through the volumes of collection at our 147 plasma collection centers in the U.S. and supplemented by approximately 800,000 liters of plasma per year to be purchased from third-party suppliers pursuant to multiple plasma purchase agreements. If we are unable to obtain sufficient quantities of source plasma, we may be unable to find an alternative cost-effective source of plasma.
If we are unable to obtain sufficient quantities of source plasma, we would be limited in our ability to maintain current manufacturing levels of plasma derivative products. As a result, we could experience a substantial decrease in net sales or profit margins, a loss of customers, a negative effect on our reputation as a reliable supplier of plasma derivative products or a substantial delay in our production growth plans.
Our current business plan envisages an increase in the production of plasma derivative products, which depends on our ability to increase plasma collections or improve product yield. The ability to increase plasma collections may be limited, our supply of plasma could be disrupted or the cost of plasma could increase substantially, as a result of numerous factors, including:
| | • | | A reduction in the donor pool. Regulators in most of the largest markets for plasma derivative products, including the U.S., restrict the use of plasma collected from specific countries and regions in the manufacture of plasma derivative products. For example, the appearance of the variant Creutzfeldt-Jakob, or mad cow, disease, which resulted in the suspension of the use of plasma collected from U.K. residents and concern over the safety of blood products, which has led to increased domestic and foreign regulatory control over the collection and testing of plasma and the disqualification of certain segments of the population from the donor pool, have significantly reduced the potential donor pool. The appearance of new viral strains could further reduce the potential donor pool. Also, improvements in socioeconomic conditions in the areas |
14
| | where our and our suppliers’ collection centers are located could reduce the attractiveness of financial incentives for donors, resulting in increased donor fees or a reduction in the number of donors. |
| | • | | Regulatory requirements. The collection of plasma is heavily regulated, and our ability to collect plasma (or to increase plasma collection) through our collection centers, or to obtain plasma from other suppliers, may be limited or disrupted by the inability to obtain or maintain necessary regulatory licenses to operate plasma collection centers in a timely manner or at all, or by the temporary or permanent shutdown of our or our suppliers’ plasma collection centers as a result of regulatory violations. |
| | • | | Plasma supply sources. In recent years, there has been vertical integration in the industry as plasma derivatives manufacturers have been acquiring plasma collection centers. Any significant disruption in the supply of plasma or an increased demand for plasma may require plasma from alternative sources, which may not be available on a timely basis. |
A significant portion of our revenue has historically been derived from sales of our immunoglobulin products and we expect that they will continue to comprise a significant portion of our sales. Any adverse market event with respect to these products would have a material adverse effect on us.
We have historically derived a significant portion of our net sales from our immunoglobulin products, including our IVIG products. If either of our IVIG products, Flebogamma® or Gamunex®, or Gamunex®-C immunoglobulin, lost significant sales or was substantially or completely displaced in the market, we would lose a significant and material source of our net revenue. Similarly, if either Flebogamma® or Gamunex®-C/Gamunex® was to become the subject of litigation or an adverse governmental ruling requiring us to cease sales of it, our business could be adversely affected. Although we do not currently anticipate any significant decrease in the sales of any of these products, a significant decrease could result from plasma procurement and manufacturing issues resulting in lower product availability for sales and changing market conditions.
Our products face increased competition.
Our products have experienced increased competition. Each of Baxter and CSL Behring has launched 10% liquid IVIG products in the U.S. Octopharma and Bio Products Laboratory has launched 5% liquid IVIG products. Additionally, Biotest is seeking approval for a 10% liquid IVIG product in the U.S., which, if approved, will further increase competition among liquid IVIG products. As competition has increased, competitors have discounted the price of IVIG products. Furthermore, many customers are increasingly price sensitive with respect to IVIG products. If customers demand lower priced products from our competitors, we may lose sales or be forced to lower our prices.
The FDA recently approved Gamunex®-C for the subcutaneous route of administration for the A1PI indication. In 2010, CSL Behring received FDA approval for and launched Hizentra Immune Globulin Subcutaneous (Human) 20% liquid. Baxter also recently obtained approval for the subcutaneous use of its 10% liquid IVIG, and it has conducted a trial to obtain FDAorphan drug designation for the product in neurology, which was already granted in the European Union in 2011. We also believe that our competitors are developing several new products and technologies, which may include an improved route of administration for indications beyond A1PI.
Until December 2002, Talecris’ A1PI product, Prolastin® A1PI, was the only plasma product licensed and marketed for the therapy of congenital A1PI deficiency-related emphysema in the U.S. Baxter and CSL Behring received licenses for Aralast and Zemaira, respectively, which were launched in the U.S. in 2003. In addition, Kamada Ltd. received approval of its biological license application, or BLA, for its A1PI, Glassia, on July 1, 2010.
While LFB Biomedicaments has a license in France for Alfalastin, we have the only licensed A1PI products with EMA Community marketing authorization. Of our competitors that are currently pursuing licensing trials in Europe, one offers a more concentrated intravenous formulation than the ones we offer in Europe. Should our competitors receive approvals in Europe sooner than expected, it will impact our unit volumes and share of sales. Our current and future competitors may increase their sales, lower their prices or change their distribution model, causing harm to our product sales and financial condition. Also, if the attrition rate of our A1PI patient base accelerates faster than we have forecast, we would have fewer patients and lower sales volume.
Similarly, if a new AIP1 formulation with a significantly improved rate of administration (such as aerosol inhalation) is developed, the market share of our A1PI products could be negatively impacted. Similarly, several companies are attempting to develop products which could be substitutions for A1PI, including retinoic acid, oral synthetic elastase inhibitors and gene therapy. While these products are in the early stages of development, they may eventually be successfully developed and launched.
In addition, our plasma-derived products face competition from non-plasma products and other courses of treatments. For example, two Rho(D) intramuscular (hyperimmune) globulins for intravenous administration, Cangene’s WinRho SDF and CSL
15
Behring’s Rhophylac, have been approved to treat immune thrombocytopenic purpura, or ITP. Additionally, in 2008, GSK and Amgen launched thrombopoietin inhibitors targeting ITP patients, which may reduce the demand for IVIG to treat ITP. New treatments, such as small molecules, monoclonal or recombinant products, may also be developed for indications for which our products are now used. Recombinant Factor VIII and Factor IX products compete with our own plasma-derived product in the treatment of hemophilia A and B and are perceived by many to have lower risks of disease transmission. Additional recombinant products, some with extended half-lives, could compete with our products and reduce the demand for our products. Crucell and Sanofi Pasteur have completed Phase II clinical trials for a monoclonal rabies product to compete with our rabies hyperimmune product. In 2010, Biotest introduced a subcutaneous anti-hepatitis preparation and is registering the product in European countries in which we market our anti-hepatitis B IVIG, which could negatively impact our sales. Also, in February 2009, GTC Biotherapeutics obtained FDA approval of a competitive antithrombin III, or ATIII, a product derived from the milk of transgenic goats for the treatment of hereditary antithrombin deficiency. This product now directly competes with our product, Thrombate® III, which had previously been the only FDA-approved ATIII product.
Since the late 1980s, Talecris (prior to 2005, with Bayer) had been the “supplier of record” for the Canadian blood system. Talecris was awarded five-year contracts with Canadian Blood Services and Héma-Québec, the Canadian blood system operators, in December 2007 that became effective April 2008. We assumed these contracts in connection with the acquisition of Talecris, making us the largest supplier of plasma-derived products to these operators. Under these U.S. dollar-based contracts, we fractionate a majority of Canadian plasma and supply a majority of Canadian requirements for IVIG during the contract term. We transport plasma from Canadian Blood Services and Héma-Québec collection centers to our Clayton facility for manufacture, and we return the finished product, along with commercial product, for sale to Canadian Blood Services and Héma-Québec. Canadian Blood Services has elected to pursue a multi-source strategy, and although we will continue to be the primary supplier, we anticipate annual volume declines because of this strategy. Héma-Québec currently has a sole source strategy for fractionation of its plasma but could switch to a multi-source strategy. Talecris had derived, and we expect to continue to derive, significant revenue and profits under these contracts. A failure to maintain contracts with the Canadian blood system operators or any diminution in the volume or price under future contracts could have a material adverse effect on our financial results.
New products could render our plasma derivative products less competitive.
Our plasma derivative products may face intense competition from alternative products resulting from technological advances. Recombinant Factor IX and Factor IX are currently available and widely used in the U.S. and Europe. In addition, less expensive alternatives have long existed for albumin in its application as a plasma volume expander. If an increased use of alternative products for Factor VIII, Factor IX or albumin makes it uneconomical to produce our plasma-derived products, or if further technological advances improve these products or create other competitive alternatives to our plasma derivative products, our financial condition and results of operations could be materially adversely affected.
We do not currently sell any recombinant products. We are developing recombinant versions of A1PI, Factor VIII, Factor IX and plasmin, but we cannot be certain that any of these products will ever be approved or commercialized. As a result, our product offerings may remain plasma-derived, even if our competitors offer competing recombinant products.
We face competition from companies with greater financial resources.
We operate in highly competitive markets. Our principal competitors include Baxter, Octapharma and CSL Behring. Some of our competitors have significantly greater financial resources than us. As a result, they may be able to devote more funds to research and development and new production technologies, as well as to the promotion of their products and business. These competitors may also be able to sustain for longer periods a deliberate substantial reduction in the price of their products or services. The development by a competitor of a similar or superior product or increased pricing competition may result in a reduction in our net sales or a decrease in our profit margins.
Our products have historically been subject to supply-driven price fluctuations.
Our products, particularly IVIG, have historically been subject to price fluctuations as a result of changes in the production capacity available in the industry, the availability and pricing of plasma, development of competing products and the availability of alternative therapies. Higher prices for plasma-derived products have traditionally spurred increases in plasma production and collection capacity, resulting over time in increased product supply and lower prices. As demand continues to grow, if plasma supply and manufacturing capacity do not commensurately expand, prices tend to increase.
The robust demand for plasma-derived products, particularly for IVIG, over the last few years has resulted in efforts on the part of companies, including us, to increase manufacturing capacity and open new plasma collection centers to increase the
16
availability of source plasma. We, or our competitors, may misjudge demand growth and over-invest in expanding plasma collection or manufacturing capacity, which ultimately may result in lower prices for, or inability to sell, our products.
If we are unable to obtain product licenses, revenue growth will be negatively affected.
Revenue growth depends, among other things, on our ability to have new bioscience and diagnostic products approved for sale in various jurisdictions in a timely manner. The failure to obtain a product license without significant delay, or at all, could materially adversely affect our prospects for revenue growth.
Technological changes in the production of plasma derivative products could render our production process uneconomical.
Technological advances have accelerated changes in many bioscience industries in recent years. Future technological developments could render our production processes for plasma derivative products uneconomical and may require us to invest substantial amounts of capital to upgrade our facilities. Such investments could have a material adverse effect on our financial condition and results of operations. In addition, we may not be able to fund such investment from existing funds or raise sufficient capital to make such investments.
The discovery of new pathogens could slow our growth and adversely affect profit margins.
The possible appearance of new pathogens could trigger the need for changes in our existing inactivation and production methods, including the administration of new detection tests. Such a development could result in delays in production until the new methods are in place, as well as increased costs that may not be readily passed on to our customers.
Product liability claims or product recalls involving our products or products we distribute could have a material adverse effect on our business.
Our business exposes us to the risk of product liability claims that are inherent in the manufacturing, distribution and sale of plasma-derived therapeutic protein products. We face an inherent risk of product liability exposure related to the testing of our product candidates in human clinical trials and an even greater risk when we commercially sell any products. If we cannot successfully defend ourselves against claims that our product candidates or products caused injuries, we could incur substantial liabilities. Regardless of merit or eventual outcome, liability claims may result in:
| | • | | decreased demand for our products and any product candidates that we may develop; |
| | • | | injury to our reputation; |
| | • | | withdrawal of clinical trial participants; |
| | • | | costs to defend the related litigation; |
| | • | | substantial monetary awards to trial participants or patients; |
| | • | | the inability to commercialize any products that we may develop. |
Like many plasma fractionators, we have been, and may in the future be, involved in product liability claims relating to our products, including claims alleging the transmission of disease through the use of such products. Plasma is a biological matter that is capable of transmitting viruses and pathogens, whether known or unknown. Therefore, our plasma and plasma derivative products, if not properly collected, tested, inactivated, processed, stored and transported, could cause serious disease and possibly death to the patient. Further, even when we properly affect such steps, there are viral and other infections of plasma which may escape detection using current testing methods and which are not susceptible to inactivation methods. Any transmission of disease through the use of one of our products or third-party products sold by us could result in claims by persons allegedly infected by such products.
Our potential product liability also extends to our diagnostic and hospital products. In addition, we sell and distribute third-party products, and the laws of the jurisdictions where we sell or distribute such products could also expose us to product liability claims for those products. Furthermore, the presence of a defect in a product could require us to carry out a recall of such product.
A product liability claim or a product recall could result in substantial financial losses, negative reputational repercussions and an inability to retain customers. We have a program of insurance policies designed to protect us and our subsidiaries from product liability claims, and we self-insure a portion of this risk. For information on these policies, see Item 4 of this Part I, “Information on the Company — B. Business Overview — Insurance Coverage.”
17
Claims made against our insurance policies could exceed our limits of coverage. We intend to expand our insurance coverage as our sales grow. However, as product liability insurance is expensive and can be difficult to obtain, a product liability claim could decrease our access to product liability insurance on acceptable terms. In turn, we may not be able to maintain insurance coverage at a reasonable cost and may not be able to obtain insurance coverage that will be adequate to satisfy any liability that may arise.
Our ability to continue to produce safe and effective products depends on the safety of our plasma supply against transmittable diseases.
Despite overlapping safeguards, including the screening of donors and other steps to remove or inactivate viruses and other infectious disease-causing agents, the risk of transmissible disease through plasma-derived products cannot be entirely eliminated. If a new infectious disease was to emerge in the human population, the regulatory and public health authorities could impose precautions to limit the transmission of the disease that would impair our ability to procure plasma, manufacture our products or both. Such precautionary measures could be taken before there is conclusive medical or scientific evidence that a disease poses a risk for plasma-derived products.
In recent years, new testing and viral inactivation methods have been developed that more effectively detect and inactivate infectious viruses in collected plasma. There can be no assurance, however, that such new testing and inactivation methods will adequately screen for, and inactivate, infectious agents in the plasma used in the production of our products.
Plasma and plasma derivative products are fragile, and improper handling of our plasma or plasma derivative products could adversely affect results of operations.
Plasma is a raw material that is susceptible to damage. Almost immediately after its collection from a donor, plasma is stored and transported at temperatures that are at least -20 degrees Celsius (-4 degrees Fahrenheit). Once we manufacture plasma derivative products, they must be handled carefully and kept at appropriate temperatures. Our failure, or the failure of third parties that supply, ship or distribute our plasma and plasma derivative products, to properly care for our plasma or plasma derivative products may require us to destroy some raw materials or products. If the volume of plasma or plasma derivative products damaged by such failures was significant, the loss of that plasma or those plasma derivative products could have a material adverse effect on our financial condition and results of operations.
Our above-average aging of our receivables has in the past negatively affected and may in the future negatively affect our working capital levels and increase financial costs.
Our receivables have an aging average of 83 days, 83 days and 65 days at December 31, 2009, 2010 and 2011, respectively, which is substantially higher than the receivables aging average for the industry in the U.S. Our high receivables aging average is primarily due to significant delays in collection from Spain, Portugal and Italy. The adoption by Spain, effective December 31, 2004, of a European Union directive that requires payment of interest on most receivables from hospitals and clinics that are part of the social security systems in Spain that are more than 60 days overdue has significantly decreased collection delays from these hospitals and clinics. However, we cannot assure that this trend will continue or that the present receivables aging levels for these hospitals and clinics will not increase again, particularly if the funding of these hospitals and clinics is not increased sufficiently by the appropriate governmental health agencies. Failure to receive timely payments for the sale of our products negatively affects our working capital levels and may require us to obtain more short-term financing than would otherwise be needed.
Our future success depends on our ability to retain members of our senior management and to attract, retain and motivate qualified personnel.
We are highly dependent on the principal members of our executive and scientific teams. The loss of the services of any of these persons might impede the achievement of our research, development, operational and commercialization objectives. In particular, we believe the loss of the services of any of Víctor Grifols Roura, Juan Ignacio Twose Roura, Ramón Riera Roca, Alfredo Arroyo Guerra, Carlos Roura Fernández, Vicente Blanquer Torre, Eva Bastida Tubau, Mateo Florencio Borrás Humbert, Antonio Viñes Páres, Montserrat Lloveras Calvo, David Ian Bell, Gregory Gene Rich, Shinji Wada, Alberto Grifols Roura, Francisco Javier Jorba Ribes, Nuria Pascual Lapeña, Mary Kuhn or Joel Abelson would significantly and negatively impact our business. We do not maintain “key person” insurance on any of our executive officers.
Recruiting and retaining qualified operations, finance and accounting, scientific, clinical and sales and marketing personnel will be critical to our success. We may not be able to attract and retain these personnel on acceptable terms, given the competition among numerous pharmaceutical and biotechnology companies for similar personnel. We also experience competition for the hiring
18
of scientific and clinical personnel from universities and research institutions. If we are unable to attract, retain and motivate qualified and experienced personnel, we could lose customers and suffer reduced profitability. Even if we are successful in attracting and retaining such personnel, competition for such employees may significantly increase our compensation costs and adversely affect our financial condition and results of operations.
Federal cGMP regulations also require that the personnel we employ and hold responsible for the collection, processing, testing, storage or distribution of blood or blood components be adequate in number, educational background, training (including professional training as necessary) and experience, or combination thereof, and have capabilities commensurate with their assigned functions, a thorough understanding of the procedures or control operations they perform, the necessary training or experience and adequate information concerning the application of relevant cGMP requirements to their individual responsibilities. Our failure to attract, retain, and motivate qualified personnel may result in a regulatory violation, affect product quality, require the recall or market withdrawal of affected product or result in a suspension or termination of our license to market our products, or any combination thereof.
Our business requires substantial capital to operate and grow and to achieve our strategy of realizing increased operating leverage, including the completion of several large capital projects.
We intend to undertake several large capital projects that will allow us to expand our production capabilities and achieve operating leverage. Capital projects of this magnitude involve technology and project management risks. Technologies that have worked well in a laboratory or in a pilot plant may cost more or not perform as well, or at all, in full-scale operations. Projects may run over budget or be delayed. We cannot be certain that these projects will be completed in a timely manner or that we will maintain our compliance with cGMP, and we may need to spend additional amounts to achieve compliance. Additionally, by the time these multi-year projects are completed, market conditions may differ significantly from our assumptions regarding the number of competitors, customer demand, alternative therapies, reimbursement and public policy, and as a result, capital returns might not be realized.
We plan on spending substantial sums in capital and operating expense over the next five years to obtain the approval of the FDA, and other regulatory agencies, for new indications for existing products, to enhance the facilities in which and processes by which we manufacture existing products, to develop new product delivery mechanisms for existing products, to strengthen our plasma collection system and to develop innovative product additions. We face a number of obstacles to successfully converting these efforts into profitable products, including but not limited to the successful development of an experimental product for use in clinical trials, the design of clinical study protocols acceptable to the FDA and other regulatory agencies, the successful outcome of clinical trials, our ability to scale our manufacturing processes to produce commercial quantities or successfully transition technology, the approval of the FDA and other regulatory agencies of our product or process and our ability to successfully market an approved product with our new process or new indication.
Our planned capital spending is expected to be significant over the next four years. We are undertaking an investment plan that involves cumulative capital expenditures of approximately €560 million to €600 million through 2015. The amount and timing of future capital spending is dependent upon a number of factors, including market conditions, regulatory requirements and the extent and timing of particular projects, among other things. Our ability to grow our business is dependent upon the timely completion of these facilities and obtaining the requisite regulatory approvals.
To finance these various activities, we may need to incur future debt or issue additional equity if our cash flows and capital resources are insufficient, and we may not be able to structure our debt obligations on favorable economic terms. As a result of the acquisition, we have substantial indebtedness, which may adversely affect our ability to structure our debt obligations on favorable economic terms.
We may not be able to develop some of our international operations successfully.
We currently conduct sales in 100 countries. The successful operation of such geographically dispersed resources requires considerable management and financial resources. In particular, we must bridge our business culture to the business culture of each country in which we operate. In addition, international operations and the provision of services in foreign markets are subject to additional risks, such as changing market conditions, currency exchange rate fluctuations, trade barriers, exchange controls, regulatory changes, changes to tax regimes, foreign investment limitations, civil disturbances and war. Furthermore, if an area in which we have significant operations or an area into which we are looking to expand suffers an economic recession or currency devaluation, our net sales and accounts receivable collections in that region will likely decline substantially or we may not be able to successfully expand in that region.
19
We are susceptible to interest rate variations.
We use issuances of debt and bank borrowings as a source of funding and, following the acquisition of Talecris, our level of debt has increased significantly. A majority of our interest-bearing debt at December 31, 2011 bore interest at a floating rate, at a spread over the London Interbank Offered Rate, or LIBOR, for our U.S. dollar-denominated debt and at a spread over the Euro Interbank Offered Rate, or EURIBOR, for our euro-denominated debt. As of December 31, 2011, we had interest-bearing senior debt aggregating $3.6 million (€2.8 billion equivalent) and €438.9 million outstanding (not including $50 million, €36.7 million ($50 million equivalent) and the $200 million equivalent in multicurrencies of undrawn availability under the Original Revolving Credit Facilities), of which an aggregate of $2.5 billion (€1.9 billion equivalent) and €438.9 million bore a floating rate of interest. Pursuant to mandatory hedging requirements under the Original Senior Credit Facilities, as of December 31, 2011, 61% of our U.S. dollar-denominated debt and 23% of our euro-denominated debt thereunder was hedged at a fixed rate. However, there can be no assurance that such instruments will be successful at reducing the risks inherent in exposures to interest rate fluctuations. Any increase in interest rates payable by us, which could be adversely affected by, among other things, our inability to meet certain financial ratios, would increase our interest expense and reduce our cash flow, which could materially adversely affect our financial condition and results of operations. See Item 11 of this Part I, “Quantitative and Qualitative Disclosures About Market Risk — Interest Rate Risk.”
Our results of operations and financial condition may be affected by adverse changes in foreign currency exchange rates, especially a significant shift in the value of the euro as compared to the U.S. dollar.
A significant portion of our business is conducted in currencies other than our reporting currency, the euro. For example, we are exposed to currency fluctuations with respect to other currencies such as the U.S. dollar, the British pound, the Brazilian real, the Canadian dollar, the Malaysian ringgit and the Argentine, Mexican and Chilean pesos. The majority of our sales for the fiscal year ended December 31, 2011 were denominated in U.S. dollars. As a result, currency fluctuations among the euro, the U.S. dollar and the other currencies in which we do business have caused foreign currency translation gains and losses in the past and will likely do so in the future. As a result, we could incur unanticipated gains and losses as a result of changes in foreign currency exchange rates.
We are also exposed to risk based on the payment of U.S. dollar-denominated indebtedness. At December 31, 2011, our long-term U.S. dollar-denominated debt consisted of (i) $2.5 billion under the Senior Term Loans, (ii) $140 million of undrawn availability under the Original Revolving Credit Facilities (not including an additional $200 million equivalent in multicurrencies of undrawn availability which can be drawn in either U.S. dollars or euro) and (iii) $1.1 billion aggregate principal amount of our Notes. Under the Amended and Restated Senior Credit Agreement, our U.S. dollar-denominated debt consists of $2.3 billion under the Amended Senior Term Loans and $140 million of undrawn availability under the Amended Revolving Credit Facilities (not including an additional $35 million equivalent in multicurrencies of undrawn availability which can be drawn in either U.S. dollars or euro).
Developments in the economy may adversely impact our business.
Since the middle of 2007, there has been disruption and turmoil in financial markets around the world. Throughout many of our largest markets, including the U.S. and Spain, there have been dramatic declines in the housing market, high levels of unemployment and underemployment, and reduced earnings, or, in some cases, losses, for businesses across many industries, with reduced investments in growth.
A recessionary economic environment may adversely affect demand for our products. Prolastin®/Prolastin®-C A1PI is sold directly to patients in the U.S. As a result of their job losses, patients may lose medical insurance and be unable to purchase needed medical products or may be unable to pay their share of deductibles or co-payments. IVIG is primarily sold to hospitals and specialty pharmacies. Hospitals adversely affected by the economy may steer patients to less costly therapies, resulting in a reduction in demand, or demand may shift to public health hospitals, which purchase our products at a lower government price. While to date we cannot directly trace any material reduction in demand to the recession, if economic conditions do not improve, the impact may become material.
If the Clayton, Los Angeles, Melville or Parets facilities were to suffer a crippling accident, or if a force majeure event materially affected our ability to operate and produce saleable products, a substantial part of our manufacturing capacity could be shut down for an extended period.
Substantially all of our revenues are derived from plasma fractionation and products manufactured at our Clayton, Los Angeles and Melville facilities and at our manufacturing plant located in Parets del Vallès, near Barcelona, Spain, or Parets facility. In addition, a substantial portion of our plasma supply is stored at facilities in City of Industry, California and Benson, North Carolina, as well as at our Clayton and Parets facilities. If any of these facilities were to be impacted by an accident or a force majeure event such as an earthquake, major fire or explosion, major equipment failure or power failure lasting beyond the capabilities of our backup generators, our revenues would be materially adversely affected. In this situation, our manufacturing capacity could be shut down for
20
an extended period and we could experience a loss of raw materials, work in process or finished goods inventory. Other force majeure events such as terrorist acts, influenza pandemic or similar events could also impede our ability to operate our business. In addition, in any such event, the reconstruction of our Clayton, Los Angeles or Parets facilities or our plasma storage facilities, the regulatory approval of the new facilities, and the replenishment of raw material plasma could be time-consuming. During this period, we would be unable to manufacture our products at other plants due to the need for FDA and foreign regulatory authority inspection and certification of such facilities and processes.
At December 31, 2011, we maintained property damage and business interruption insurance with limits of $500 million for the Los Angeles facility, $1 billion for the Clayton and Melville facilities and €360 million for facilities in the rest of the world per claim. Effective January 1, 2012, we maintain property damage and business interruption insurance of $1 billion per claim for each facility. However, this insurance may still be insufficient to mitigate the losses from any such accident or force majeure event. We may also be unable to recover the value of the lost plasma or work-in-process inventories, as well as the sales opportunities from the products we would be unable to produce.
If we experience equipment difficulties or if the suppliers of our equipment or disposable goods fail to deliver key product components or supplies in a timely manner, our manufacturing ability would be impaired and our product sales could suffer.
We depend on a limited number of companies that supply and maintain our equipment and provide supplies such as chromatography resins, filter media, glass and stoppers used in the manufacture of our products. If our equipment should malfunction, the repair or replacement of the machinery may require substantial time and cost, which could disrupt our production and other operations. Our plasma collection centers rely on disposable goods supplied by third parties and information technology systems hosted by third parties. Our plasma collection centers cannot operate without an uninterrupted supply of these disposable goods and the operation of these systems. We have experienced periodic outages of these systems, but a material outage would affect our ability to operate our collection centers. Alternative sources for key component parts or disposable goods may not be immediately available. Any new equipment or change in supplied materials may require revalidation by us or review and approval by the FDA or foreign regulatory authorities, including the EMA, which may be time-consuming and require additional capital and other resources. We may not be able to find an adequate alternative supplier in a reasonable time period, or on commercially acceptable terms, if at all. As a result, shipments of affected products may be limited or delayed. Our inability to obtain our key source supplies for the manufacture of products may require us to delay shipments of products, harm customer relationships and force us to curtail operations.
If our shipping or distribution channels were to become inaccessible due to a crippling accident, an act of terrorism, a strike or any other force majeure event, our supply, production and distribution processes could be disrupted.
Plasma must be transported at a temperature of -20 degrees Celsius (-4 degrees Fahrenheit) to ensure the preservation of its proteins. Not all shipping or distribution channels are equipped to transport plasma at these temperatures. If any of our shipping or distribution channels becomes inaccessible due to a crippling accident, an act of terrorism, a strike or any other force majeure event, we may experience disruptions in our continued supply of plasma and other raw materials, delays in our production process or a reduction in our ability to distribute our products directly to our customers.
We rely in large part on third parties for the sale, distribution and delivery of our products.
In the U.S., we regularly enter into distribution, supply and fulfillment contracts with group purchasing organizations, or GPOs, home care companies, alternate infusion sites, hospital groups and others. We are highly dependent on these contracts for the successful sale, distribution and delivery of our products. For example, we rely principally on GPOs and on our distributors to sell our IVIG products. If the parties with which we contract breach, terminate, or otherwise fail to perform under the agreements, our ability to effectively distribute our products will be impaired and our business may be materially and adversely affected. In addition, through circumstances outside of our control, such as general economic decline, market saturation or increased competition, we may be unable to successfully renegotiate our contracts or secure terms which are as favorable to us. In addition, we rely in certain countries on distributors for sales of our products. Disagreements or difficulties with our distributors supporting our export business could result in a loss of sales.
We may not be able to commercialize products in development.
Before obtaining regulatory approval for the sale of our product candidates or for the marketing of existing products for new indicated uses, we must conduct, at our own expense, extensive preclinical tests to demonstrate the safety of our product candidates in animals and clinical trials to demonstrate the safety and efficacy of our product candidates in humans. Preclinical and clinical testing is expensive, is difficult to design and implement, can take many years to complete and is uncertain as to outcome. A failure of one or more of our clinical trials can occur at any stage of testing. We may experience numerous unforeseen events during, or as a result of,
21
preclinical testing and the clinical trial process that could delay or prevent our ability to receive regulatory approval or commercialize our product candidates, including:
| | • | | regulators or institutional review boards, or IRBs, may not authorize us to commence a clinical trial or conduct a clinical trial within a country or at a prospective trial site, respectively; |
| | • | | the regulatory requirements for product approval may not be explicit, may evolve over time and may diverge by jurisdiction; |
| | • | | our preclinical tests or clinical trials may produce negative or inconclusive results, and we may decide, or regulators may require us, to conduct additional preclinical testing or clinical trials or to abandon projects that we had expected to be promising; |
| | • | | the number of patients required for our clinical trials may be larger than we anticipate, enrollment in our clinical trials may be slower than we anticipate or participants may withdraw from our clinical trials at higher rates than we anticipate, any of which would result in significant delays; |
| | • | | our third-party contractors may fail to comply with regulatory requirements or meet their contractual obligations to us in a timely manner; |
| | • | | we may be forced to suspend or terminate our clinical trials if the participants are being exposed to unacceptable health risks or if any participant experiences an unexpected serious adverse event; |
| | • | | regulators or IRBs may require that we hold, suspend or terminate clinical research for various reasons, including noncompliance with regulatory requirements; |
| | • | | undetected or concealed fraudulent activity by a clinical researcher, if discovered, could preclude the submission of clinical data prepared by that researcher, lead to the suspension or substantive scientific review of one or more of our marketing applications by regulatory agencies, and result in the recall of any approved product distributed pursuant to data determined to be fraudulent; |
| | • | | the cost of our clinical trials may be greater than we anticipate; |
| | • | | the supply or quality of our product candidates or other materials necessary to conduct our clinical trials may be insufficient or inadequate because we do not currently have any agreements with third-party manufacturers for the long-term commercial supply of any of our product candidates; |
| | • | | an audit of preclinical or clinical studies by the FDA or other regulatory authorities may reveal noncompliance with applicable regulations, which could lead to disqualification of the results and the need to perform additional studies; and |
| | • | | the effects of our product candidates may not achieve the desired clinical benefits or may cause undesirable side effects, or the product candidates may have other unexpected characteristics. |
If we are required to conduct additional clinical trials or other testing of our product candidates beyond those that we currently contemplate, if we are unable to successfully complete our clinical trials or other testing, if the results of these trials or tests are not positive or are only modestly positive or if there are safety concerns, we may:
| | • | | be delayed in obtaining marketing approval for our product candidates; |
| | • | | be unable to obtain marketing approval; |
| | • | | be unable to obtain reimbursement for our products in some countries; |
| | • | | obtain approval for indications that are not as broad as intended; or |
| | • | | have the product removed from the market after obtaining marketing approval. |
Our product development costs will also increase if we experience delays in testing or approvals. We do not know whether any preclinical tests or clinical trials will begin as planned, will need to be restructured or will be completed on schedule, if at all. Significant preclinical or clinical trial delays also could shorten the patent protection period during which we may have the exclusive right to commercialize our product candidates or could allow our competitors to bring products to market before we do, impairing our ability to commercialize our products or product candidates.
Even if preclinical trials are successful, we still may be unable to commercialize a product due to difficulties in obtaining regulatory approval for its engineering process or problems in scaling that process to commercial production. Additionally, if produced, a product may not achieve an adequate level of market acceptance by physicians, patients, healthcare payors and others in
22
the medical community to be profitable. The degree of market acceptance of our product candidates, if approved for commercial sale, will depend on a number of factors, some of which are beyond our control, including:
| | • | | the prevalence and severity of any side effects; |
| | • | | the efficacy and potential advantages over alternative treatments; |
| | • | | the ability to offer our product candidates for sale at competitive prices; |
| | • | | relative convenience and ease of administration; |
| | • | | the willingness of the target patient population to try new therapies and of physicians to prescribe such therapies; |
| | • | | the strength of marketing and distribution support; and |
| | • | | sufficient third-party coverage or reimbursement. |
Therefore, we cannot guarantee that any products we may seek to develop will ever be successfully commercialized, and to the extent they are not successfully commercialized, such products could be a significant expense with no reward.
A breakdown in our information technology systems could result in a significant disruption to our business.
Our operations are highly dependent on our information technology systems. If we were to suffer a breakdown in our systems, storage, distribution or tracing, we could experience significant disruptions affecting our manufacturing, accounting and billing processes.
Our success depends in part on our ability to obtain and maintain protection in the U.S. and other countries of the intellectual property relating to or incorporated into our technology and products.
Our success depends in large part on our ability to obtain and maintain protection in the U.S. and other countries for the intellectual property covering or incorporated into our technology and products, especially intellectual property related to our purification processes. The patent situation in the field of biotechnology and pharmaceuticals generally is highly uncertain and involves complex legal and scientific questions. We may not be able to obtain additional issued patents relating to our technology or products. Even if patents are issued to us or to our licensors, they may be challenged, narrowed, invalidated, held to be unenforceable or circumvented, which could limit our ability to stop competitors from marketing similar products or limit the length of time our products have patent protection. Additionally, most of our patents relate to the processes we use to produce our products, not to the products themselves. In many cases, the plasma-derived products we produce or develop in the future will not, in and of themselves, be patentable. Since our patents relate to processes, if a competitor is able to design and utilize a process that does not rely on our protected intellectual property, that competitor could sell a plasma-derived product similar to one we developed or sell. Changes in either patent laws or in interpretations of patent laws in the U.S. and other countries may diminish the value of our intellectual property or narrow the scope of our patent protection. In addition, we are a party to a number of license agreements which may impose various obligations upon us as a licensee, including the obligation to make milestone and royalty payments. If we fail to comply with these obligations, the licensor may terminate the license, in which event we might not be able to market any product that is covered by the licensed patents.
Our patents also may not afford us protection against competitors with similar technology. Because patent applications in the U.S. and many other jurisdictions are typically not published until 18 months after their filing, if at all, and because publications of discoveries in the scientific literature often lag behind actual discoveries, neither we nor our licensors can be certain that we or they were the first to make the inventions claimed in our or their issued patents or pending patent applications, or that we or they were the first to file for protection of the inventions set forth in such patent applications. If a third party has also filed a U.S. patent application covering our product candidates or a similar invention, we may be required to participate in an adversarial proceeding, known as an “interference proceeding,” declared by the U.S. Patent and Trademark Office to determine priority of invention in the U.S. The costs of these proceedings could be substantial and our efforts in them could be unsuccessful, resulting in a loss of our anticipated U.S. patent position.
Our patents expire at various dates. Our pending and future patent applications may not issue as patents or, if issued, may not issue in a form that will provide us with any competitive advantage. Even if issued, we cannot guarantee that: any of our present or future patents or patent claims or other intellectual property rights will not lapse or be invalidated, circumvented, challenged or abandoned; our intellectual property rights will provide competitive advantages; our ability to assert our intellectual property rights against potential competitors or to settle current or future disputes will not be limited by our agreements with third parties; any of our pending or future patent applications will be issued or have the coverage originally sought; our intellectual property rights will be enforced in jurisdictions where competition may be intense or where legal protection may be weak; or we will not lose the ability to
23
assert our intellectual property rights against, or to license our technology to, others and collect royalties or other payments. In addition, our competitors or others may design around our protected patents or technologies. Effective protection of our intellectual property rights may be unavailable, limited or not applied for in some countries. Changes in patent laws or their interpretation in the U.S. and other countries could also diminish the value of our intellectual property or narrow the scope of our patent protection. In addition, the legal systems of certain countries do not favor the aggressive enforcement of patents, and the laws of foreign countries may not protect our rights to the same extent as the laws of the U.S. As a result, our patent portfolio may not provide us with sufficient rights to exclude others from commercializing products similar or identical to ours. In order to preserve and enforce our patent and other intellectual property rights, we may need to make claims or file lawsuits against third parties. Such lawsuits could entail significant costs to us and divert our management’s attention from developing and commercializing our products.
We, like other companies in the pharmaceutical industry, may become aware of counterfeit versions of our products becoming available domestically and abroad. Counterfeit products may use different and possibly contaminated sources of plasma and other raw materials, and the purification process involved in the manufacture of counterfeit products may raise additional safety concerns, over which we have no control. Any reported adverse events involving counterfeit products that purport to be our products could harm our reputation and the sale of our products in particular and consumer willingness to use plasma-derived therapeutics in general.
In addition to patented technology, we rely on our unpatented proprietary technology, trade secrets, processes and know-how.
We generally seek to protect proprietary information by entering into confidentiality agreements with our employees, consultants, scientific advisors and third parties. These agreements may not effectively prevent disclosure of confidential information, may be limited as to their term and may not provide an adequate remedy in the event of unauthorized disclosure of confidential information. In addition, our trade secrets may otherwise become known or be independently developed by our competitors or other third parties. To the extent that our employees, consultants or contractors use intellectual property owned by others in their work for us, disputes may arise as to the rights in related or resulting know-how and inventions. Costly and time-consuming litigation could be necessary to enforce and determine the scope of our proprietary rights, and failure to obtain or maintain trade secret protection could adversely affect our competitive business position. We also rely on contractual protections with our customers, suppliers, distributors, employees and consultants and implement security measures designed to protect our trade secrets. We cannot assure that these contractual protections and security measures will not be breached, that we will have adequate remedies for any such breach or that our suppliers, employees or consultants will not assert rights to intellectual property arising out of such contracts. Since we rely on trade secrets and nondisclosure agreements, in addition to patents, to protect some of our intellectual property, there is a risk that third parties may obtain and improperly utilize our proprietary information to our competitive disadvantage. We may not be able to detect the unauthorized use of such information or take appropriate and timely steps to enforce our intellectual property rights.
We may infringe or be alleged to infringe intellectual property rights of third parties.
Our products or product candidates may infringe or be accused of infringing one or more claims of an issued patent or may fall within the scope of one or more claims in a published patent application that may be subsequently issued and to which we do not hold a license or other rights. Third parties may own or control these patents or patent applications in the U.S. and abroad. These third parties could bring claims against us or our collaborators that would cause us to incur substantial expenses and, if successful against us, could cause us to pay substantial damages. Further, if a patent infringement suit were brought against us or our collaborators, we or they could be forced to stop or delay research, development, manufacturing or sales of the product or product candidate that is the subject of the suit.
If we are found to be infringing on the patent rights of a third party, or in order to avoid potential claims, we or our collaborators may choose or be required to seek a license from a third party and be required to pay license fees or royalties or both. These licenses may not be available on acceptable terms, or at all. Even if we or our collaborators were able to obtain a license, the rights may be nonexclusive, which could result in our competitors gaining access to the same intellectual property. Ultimately, we could be prevented from commercializing a product, or be forced to cease some aspect of our business operations, if, as a result of actual or threatened patent infringement claims, we or our collaborators are unable to enter into licenses on acceptable terms.
There has been substantial litigation and other proceedings regarding patent and other intellectual property rights in the pharmaceutical and biotechnology industries. In addition to infringement claims against us, we may become a party to other patent litigation and other proceedings, including interference proceedings declared by the U.S. Patent and Trademark Office and opposition proceedings in the European Patent Office, regarding intellectual property rights with respect to our products. The cost to us of any patent litigation or other proceeding, even if resolved in our favor, could be substantial. Some of our competitors may be able to sustain the costs of such litigation or proceedings more effectively than we can because of their substantially greater financial resources. Uncertainties resulting from the initiation and continuation of patent litigation or other proceedings could have a material adverse effect on our ability to compete in the marketplace. Patent litigation and other proceedings may also absorb significant management time.
24
Many of our employees were previously employed at universities or other biotechnology or pharmaceutical companies, including our competitors or potential competitors. We take steps to ensure that our employees do not use the proprietary information or know-how of others in their work for us. We may, however, be subject to claims that we or these employees have inadvertently or otherwise used or disclosed intellectual property, trade secrets or other proprietary information of any such employee’s former employer. Litigation may be necessary to defend against these claims and, even if we are successful in defending ourselves, could result in substantial costs to us or be distracting to our management. If we fail to defend any such claims, in addition to paying monetary damages, we may lose valuable intellectual property rights or personnel.
We have in-licensed certain patent rights.
Our in-license agreements for certain patent rights may impose payment and/or other material obligations on us as a licensee. Although we are currently in compliance with all of our material obligations under these licenses, if we were to breach any such obligations, our counterparty licensors may be entitled to terminate the licenses. Such termination may restrict, delay or eliminate our ability to develop and commercialize our products, which could adversely affect our business. We cannot guarantee that the third-party patents and technology we license will not be licensed to our competitors. In the future, we may need to obtain additional licenses, renew existing license agreements or otherwise replace existing technology. We are unable to predict whether these license agreements can be obtained or renewed or the technology can be replaced on acceptable terms, or at all.
Monitoring the unauthorized use of our intellectual property is difficult and costly.
Unauthorized use of our intellectual property may have occurred or may occur in the future. Although we have taken steps to minimize this risk, any failure to identify unauthorized use and otherwise adequately protect our intellectual property would adversely affect our business. Moreover, if we are required to commence litigation related to unauthorized use, whether as a plaintiff or defendant, such litigation would be time-consuming, force us to incur significant costs and divert our attention and the efforts of our management and other employees, which could, in turn, result in lower revenue and higher expenses.
If we are unable to protect our trademarks from infringement, our business prospects may be harmed.
We own trademarks that identify our products and have registered these trademarks in our key markets. Although we monitor the possible infringement or misuse of our trademarks, it is possible that third parties may infringe upon our intellectual property rights. Any unauthorized use of our trademarks could harm our reputation or commercial interests. In addition, our enforcement against third-party infringers may be unduly expensive or time-consuming, or the outcome may be an inadequate remedy.
We are investigating potential Foreign Corrupt Practices Act violations that occurred at Talecris prior to the acquisition.
We are continuing an internal investigation into potential violations of the FCPA by Talecris relating to events prior to the acquisition. In July 2009, Talecris voluntarily contacted the DOJ to advise it that it was conducting an internal investigation into potential violations of the FCPA. The FCPA investigation is being conducted by outside counsel under the direction of the Board. The investigation into possible improper payments to individuals and entities made after Talecris’ formation initially focused on payments made in connection with sales in certain Eastern European and Middle Eastern countries, primarily Belarus, Russia and Iran, but we are also reviewing sales practices in Brazil, Bulgaria, China, Georgia, Libya, Poland, Turkey, Ukraine and other countries as deemed appropriate.
The DOJ has not indicated what action it may take, if any, against us or any individual, or the extent to which it may conduct its own investigation. Even though Talecris self-disclosed this matter to the DOJ and we continue to cooperate with the DOJ on this matter, the DOJ or other federal agencies may seek to impose sanctions on us that may include, among other things, debarment, injunctive relief, disgorgement, fines, penalties, appointment of a monitor, appointment of new control staff or enhancement of existing compliance and training programs. Other countries in which Talecris conducted business may initiate their own investigations and impose similar penalties. As a result of this investigation, shipments to some of these countries have been suspended while we put additional safeguards in place. In some cases, safeguards involved terminating consultants and suspending relations with or terminating distributors in countries under investigation as circumstances warranted. Talecris resumed sales in countries where it believed that it had appropriate safeguards in place, and we are reallocating products to other countries as necessary. We made an initial presentation of some of the findings of the internal FCPA investigation to the DOJ in July 2011, and we will continue to present our findings from the investigation to the DOJ. Given the preliminary nature of the findings, our continuing investigation and the uncertainties regarding this matter, we are unable to estimate the final outcome. Any sanctions or loss of business could have a material adverse effect on us or our results of operations, financial condition, or cash flows.
25
Risks Relating to the Healthcare Industry
The implementation of the 2010 healthcare reform law in the U.S. may adversely affect our business.
Through the March 2010 adoption of the Patient Protection and Affordable Care Act and the companion Healthcare and Education Reconciliation Act in the U.S., or, collectively, healthcare reform law, substantial changes are being made to the current system for paying for healthcare in the U.S., including programs to extend medical benefits to millions of individuals who currently lack insurance coverage. The changes contemplated by the healthcare reform law are subject to rule-making and implementation timelines that extend for several years, and this uncertainty limits our ability to forecast changes that may occur in the future. A provision in the healthcare reform law, often referred to as the “individual mandate,” which requires individuals without health insurance to pay a penalty, was recently declared unconstitutional by certain federal courts, while certain other federal courts have affirmed its constitutionality. Appeals are pending, and the United States Supreme Court will review this issue during its 2012 term. The implications of this upcoming decision are not clear. Implementation of the healthcare reform law has already begun with respect to certain significant cost-savings measures under the healthcare reform law with respect to, for example, several government healthcare programs that cover the cost of our products, including Medicaid, Medicare Parts B and D and the 340B/Public Health Service, or PHS, program, and these efforts could have a materially adverse impact on our financial performance.
For example, with respect to Medicaid, in order for a drug manufacturer’s products to be reimbursed by federal funding under Medicaid, the manufacturer must enter into a Medicaid drug rebate agreement with the Secretary of the U.S. Department of Health and Human Services, or HHS, and pay certain rebates to the states based on utilization data provided by each state to the manufacturer and to the Centers for Medicare & Medicaid Services, or CMS, and pricing data provided by the manufacturer to the federal government. The states share this savings with the federal government and sometimes implement their own additional supplemental rebate programs. Under the Medicaid drug rebate program, the rebate amount for most branded drugs was previously equal to a minimum of 15.1% of the Average Manufacturer Price (“AMP”), or AMP less Best Price (“AMP less BP”), whichever is greater. Effective January 1, 2010, the healthcare reform law generally increased the size of the Medicaid rebates paid by drug manufacturers for single source and innovator multiple source (brand name) drugs from a minimum of 15.1% to a minimum of 23.1% of the AMP, subject to certain exceptions; for example, for certain clotting factors, the increase was limited to a minimum of 17.1% of the AMP. For non-innovator multiple source (generic) drugs, the rebate percentage was increased from a minimum of 11.0% to a minimum of 13.0% of AMP. In 2010, the healthcare reform law also newly extended this rebate obligation to prescription drugs covered by Medicaid managed care organizations.
In addition, the statutory definition of AMP changed in 2010 as a result of the healthcare reform law. In November 2010, CMS withdrew previously-issued regulations defining AMP and in February 2012 issued proposed regulations which are not yet finalized. We believe we are making reasonable assumptions regarding our reporting obligations with respect to this new definition, but, in the absence of final regulations from CMS, the adequacy of our assumptions is not certain. Once CMS issues final regulations, we may determine that our assumptions require amendment to comply with the regulatory definition of AMP.
The healthcare reform law also created new rebate obligations for our products under Medicare Part D, a partial, voluntary prescription drug benefit created by the U.S. federal government primarily for persons 65 years old and over. The Part D drug program is administered through private insurers that contract with CMS. Beginning in 2011, the healthcare reform law generally required that we provide a 50% discount to patients who fall within the Medicare Part D coverage gap, also referred to as the “donut hole,” which is a gap in Medicare Part D coverage for beneficiaries who have expended certain amounts for drugs.
The availability of federal funds to pay for our products under Medicaid and Medicare Part B programs requires that we extend discounts under the 340B/PHS program, and changes to this program under the healthcare reform law could adversely affect our financial performance. The 340B/PHS program extends discounts to a variety of community health clinics and other entities that receive health services grants from the PHS, as well as hospitals that serve a disproportionate share of certain low income individuals, and the healthcare reform law expanded the number of qualified 340B entities eligible to purchase products for outpatient use, adding certain cancer centers, children’s hospitals, critical access hospitals and rural referral centers. The PHS price, or ceiling price, cannot exceed the AMP (as reported to CMS under the Medicaid drug rebate program) less the Medicaid unit rebate amount. We have entered into a pharmaceutical pricing agreement, or PPA, with the government in which we have agreed to participate in the 340B/PHS program by charging eligible entities no more than the PHS ceiling price for drugs intended for outpatient use. The healthcare reform law imposes a “must sell” obligation on manufacturers that will require manufacturers to offer their products to eligible entities at legally mandated discount prices if such products are “made available to any other purchaser at any other price.” The healthcare reform law imposes this obligation by requiring HHS to add the requirement to the 340B/PHS program agreements that manufacturers must execute with HHS. Rulemaking to implement this obligation is not yet complete, and as a result, the full impact of the changes is not yet certain. For example, certain biological products we sell are subject to shortages on occasion, and we do not believe that this new provision would require us to provide a supply advantage to covered entities. If implementing regulations do not reflect this interpretation of the law, it could adversely affect our financial performance.
26
The healthcare reform law also introduced a biosimilar pathway that permits companies to obtain FDA approval of versions of existing biologics that are highly similar to innovative biologics based upon reduced documentation and data requirements deemed sufficient to demonstrate safety and efficacy than are required for the pioneer biologics. The new law provides that a biosimilar application may be submitted as soon as four years after the reference product is first licensed, and that the FDA may not make approval of an application effective until 12 years after the reference product was first licensed. Although drug manufacturers have begun efforts to develop biosimilar drugs for the U.S. market, none have yet been approved by the FDA. However, an approval pathway for biosimilar versions of our biological products now exists in the United States for the first time, and accordingly we expect in the future to face greater competition from biosimilar products, including a possible increase in patent challenges, all of which could adversely affect our financial performance. The FDA is developing regulations to implement the biosimilar pathway, and, for example, in February 2012 issued three draft guidance documents on biosimilar product development.
Regarding access to our products, the healthcare reform law established and provided significant funding for a Patient-Centered Outcomes Research Institute to coordinate and fund Comparative Effectiveness Research, as those terms are defined in the healthcare reform law. While the stated intent of Comparative Effectiveness Research is to develop information to guide providers to the most efficacious therapies, outcomes of Comparative Effectiveness Research could influence the reimbursement or coverage for therapies that are determined to be less cost-effective than others. Should any of our products be determined to be less cost-effective than alternative therapies, the levels of reimbursement for these products, or the willingness to reimburse at all, could be impacted, which could materially impact our financial results.
We could be adversely affected if other government or private third-party payors decrease or otherwise limit the amount, price, scope or other eligibility requirements for reimbursement for the purchasers of our products.
Prices in many countries, including many in Europe, are subject to local regulation and certain pharmaceutical products, such as plasma derivative products, are subject to price controls in several of our principal markets, including Spain and countries within the European Union. In the U.S., where pricing levels for our products are substantially established by third-party payors, if payors reduce the amount of reimbursement for a product, it may cause groups or individuals dispensing the product to discontinue administration of the product, to administer lower doses, to substitute lower cost products or to seek additional price-related concessions. These actions could have a negative effect on financial results, particularly in cases where our products command a premium price in the marketplace or where changes in reimbursement induce a shift in the site of treatment. The existence of direct and indirect price controls and pressures over our products has affected, and may continue to materially adversely affect, our ability to maintain or increase gross margins.
In the U.S., for example, beginning in 2005, the Medicare drug reimbursement methodology for physician and hospital outpatient payment schedules changed to Average Sales Price, or ASP, + 6%. This payment was based on a volume-weighted average of all brands under a common billing code. Medicare payments to physicians between the fourth quarter of 2004 and the first quarter of 2005 dropped 14% for both the powder and liquid forms of IVIG. Medicare payments to hospitals fell 45% for powder IVIG and 30% for liquid IVIG between the fourth quarter of 2005 and the first quarter of 2006. The Medicare reimbursement changes resulted in the shift of a significant number of Medicare IVIG patients to hospitals from physicians’ offices beginning in 2005, as many physicians could no longer recover their costs of obtaining and administering IVIG in their offices and clinics. After 2006, some hospitals reportedly began to refuse to provide IVIG to Medicare patients due to reimbursement rates that were below their acquisition costs. Subsequent changes have improved some of these Medicare reimbursement issues, although there has been variability in the reimbursement levels for separately payable, non-pass-through drugs and biologicals in the hospital outpatient setting over the past few years, making financial performance predictions difficult. On January 1, 2008, the CMS reduced the reimbursement for these separately covered drugs and biologicals, including IVIG, in the hospital outpatient setting from ASP + 6% to ASP + 5%, using 2006 Medicare claims data as a reference for this reduction. In addition, CMS reduced a hospital add-on payment from $75 to $38 per infusion. Beginning January 1, 2009 CMS further reduced the hospital outpatient reimbursement for separately covered outpatient drugs, including IVIG, to ASP + 4%, and eliminated the add-on payment. For 2010, the rate remained as ASP + 4%, based on a cost-based methodology that also involved reallocating certain overhead costs from packaged drugs to unpackaged drugs. In 2011, relying on the 2010 methodology, CMS increased the rate to ASP + 5%. For 2012, CMS decreased the rate to ASP + 4%.
Also, the intended use of a drug product by a physician can affect pricing. Physicians frequently prescribe legally available therapies for uses that are not described in the product’s labeling and that differ from those tested in clinical studies and approved by the FDA or similar regulatory authorities in other countries. These off-label uses are common across medical specialties, and physicians may believe such off-label uses constitute the preferred treatment or treatment of last resort for many patients in varied circumstances. We believe that a significant portion of our IVIG volume may be used to fill physician prescriptions for indications not approved by the FDA or similar regulatory authorities. If reimbursement for off-label uses of products, including IVIG, is reduced or eliminated by Medicare or other third-party payors, including those in the U.S. or the European Union, we could be adversely affected. For example, CMS could initiate an administrative procedure known as a National Coverage Determination, or NCD, by which the agency determines which uses of a therapeutic product would be reimbursable under Medicare and which uses would not.
27
This determination process can be lengthy, thereby creating a long period during which the future reimbursement for a particular product may be uncertain. High levels of spending on IVIG products, along with increases in IVIG prices, increased IVIG utilization and the high proportion of off-label uses, may increase the risk of regulation of IVIG reimbursement by CMS. On the state level, similar limits could be proposed for therapeutic products covered under Medicaid.
With respect to pricing, for many payors, including private health insurers and self-insured health plans, as well as Medicare Part D plans and some state Medicaid programs, outpatient pharmaceuticals are often reimbursed based upon a discount calculated off of the Average Wholesale Price, or AWP, pricing benchmark. AWP is a list price that has been calculated and published by private third-party publishers, such as First DataBank, Thomson Reuters (Red Book) and Wolters Kluwer (Medi-Span). AWP does not reflect actual transactions in the distribution chain (e.g., the publishers do not base the figure on actual transaction prices, including any prompt pay or other discounts, rebates or price reductions). Often, publishers calculate AWP based upon a standard markup of, for example, 20% over the Wholesale Acquisition Cost, or WAC, another list price that is reported by drug manufacturers to the publishers. WAC is generally understood in the industry to be the list price drug manufacturers have for their drug wholesaler customers and, like AWP, is not calculated based on actual transaction prices, including any prompt pay or other discounts, rebates or price reductions. We do not publish AWPs for any of our products, but we report WACs for our products. We may be at a competitive disadvantage where providers are reimbursed on an AWP basis and competitors’ products are reimbursed based on a higher AWP than the corresponding AWP for our product. The use of AWP and WAC as pricing benchmarks has been subject to legal challenge by both government officials and private citizens, often based on claims that the benchmarks were used in a misleading manner, thus defrauding consumers and third-party payors. It is possible that we, as a reporter of WAC, could be challenged on this basis. Additionally, the settlement of class action litigation against First DataBank and others has resulted in the downward revision of certain reported AWP listings (to a level of 20% over WAC). Issues regarding AWP have contributed to suggestions to eliminate its use as a drug pricing benchmark. With respect to the major private publishers of AWP, First DataBank ceased publishing AWP as of September 28, 2011, while Thomson Reuters (Red Book) and Wolters Kluwer (Medi-Span) have reported that they will continue to publish AWP.
Certain of our business practices are subject to scrutiny by regulatory authorities, as well as to lawsuits brought by private citizens under federal and state laws. Failure to comply with applicable law or an adverse decision in lawsuits may result in adverse consequences to us.
The laws governing our conduct in the U.S. are enforceable by criminal, civil and administrative penalties. Violations of laws such as the Federal Food, Drug and Cosmetic Act (the “FDCA”), the Federal False Claims Act (the “FCA”), the PHS Act or a provision of the U.S. Social Security Act known as the “Anti-Kickback Law,” or any regulations promulgated under their authority, may result in jail sentences, fines or exclusion from federal and state programs, as may be determined by Medicare, Medicaid, the Department of Defense, other regulatory authorities and the courts. There can be no assurance that our activities will not come under the scrutiny of regulators and other government authorities or that our practices will not be found to violate applicable laws, rules and regulations or prompt lawsuits by private citizen “relators” under federal or state false claims laws.
For example, under the Anti-Kickback Law, and similar state laws and regulations, even common business arrangements, such as discounted terms and volume incentives for customers in a position to recommend or choose drugs and devices for patients, such as physicians and hospitals, can result in substantial legal penalties, including, among others, exclusion from Medicare and Medicaid programs, and arrangements with referral sources must be structured with care to comply with applicable requirements. Also, certain business practices, such as payment of consulting fees to healthcare providers, sponsorship of educational or research grants, charitable donations, interactions with healthcare providers that prescribe products for uses not approved by the FDA and financial support for continuing medical education programs, must be conducted within narrowly prescribed and controlled limits to avoid any possibility of wrongfully influencing healthcare providers to prescribe or purchase particular products or as a reward for past prescribing. Significant enforcement activity has been the result of actions brought by relators, who file complaints in the name of the United States (and if applicable, particular states) under federal and state False Claims Act statutes and can be entitled to receive up to 30% of total recoveries. Also, violations of the False Claims Act can result in treble damages, and each false claim submitted can be subject to a penalty of up to $11,000 per claim. The healthcare reform law imposes new reporting and disclosure requirements for pharmaceutical and medical device manufacturers with regard to payments or other transfers of value made to certain U.S. healthcare practitioners, such as physicians and academic medical centers. Data collection obligations under this rule were to commence in January 2012, and reporting requirements are to be implemented in 2013. On December 14, 2011, CMS issued proposed regulations to implement these provisions, sought substantial comments and announced that data collection obligations would not begin until final regulations were issued. A number of states have similar laws in place. Additional and stricter prohibitions could be implemented by federal and state authorities. Where practices have been found to involve improper incentives to use products, government investigations and assessments of penalties against manufacturers have resulted in substantial damages and fines. Many manufacturers have been required to enter into consent decrees or orders that prescribe allowable corporate conduct.
28
Failure to satisfy requirements under the FDCA can also result in penalties, as well as requirements to enter into consent decrees or orders that prescribe allowable corporate conduct. In this regard, our Los Angeles facility was previously managed pursuant to a consent decree that was entered into in February 1998 based on action by the FDA and DOJ addressing FDCA violations committed by the former owner of the center, Alpha Therapeutic Corporation, or Alpha. The consent decree provided for annual inspection of the plant by the FDA. On March 15, 2012, the United States District Court for the Central District of California entered an order vacating the consent decree on the Los Angeles facility.
Adverse consequences can also result from failure to comply with the requirements of the 340B/PHS program under the PHS Act, which extends discounts to a variety of community health clinics and other entities that receive health services grants from the PHS. For example, the healthcare reform law requires the Secretary of HHS to develop and issue regulations for the 340B/PHS program establishing standards for the imposition of sanctions in the form of civil monetary penalties, or CMP, for manufacturers that knowingly and intentionally overcharge a covered entity for a 340B drug. The CMP can be up to $5,000 for each instance of overcharging a covered entity. HHS has never had CMP authority that addresses this area and has not yet issued final regulations to implement this new penalty provision, and accordingly, the impact of this CMP provision is uncertain. In September 2010, HHS’ Health Resources and Services Administration, or HRSA, issued a notice of proposed rulemaking in which it is considering imposing CMPs on manufacturers in certain cases where a covered entity has been unable to find a given product at a 340B price and has instead purchased the drug outside of the 340B Program at a price greater than the ceiling price. Certain of our products are subject to shortages and allocation issues can arise. Accordingly, if HRSA adopts a CMP interpretation of this kind, it could potentially have adverse consequences on our financial performance.
In addition, and prior to the enactment of the healthcare reform law, some government regulators have suggested that allocation issues linked to product shortages could give rise to potential 340B/PHS program violations. In November 2009, the USAO for the Eastern District of Pennsylvania commenced an investigation of Talecris, with respect to its method of allocating its IVIG product, Gamunex®, as available for sale at the PHS price to covered entities. We have cooperated with and responded to information requests from the USAO and believe that we have complied with the terms of the PPA and federal law.
In addition, while regulatory authorities generally do not regulate physicians’ discretion in their choice of treatments for their patients, they do restrict communications by manufacturers on off-label uses of approved drugs or on the potential safety and efficacy of unapproved products in development. Companies in the U.S., Canada and European Union cannot promote approved products for other indications that are not specifically approved by the competent regulatory authorities (e.g., FDA in the U.S.), nor can companies promote unapproved products. In limited circumstances, companies may disseminate to physicians information regarding unapproved uses of approved products or results of studies involving investigational products. If such activities fail to comply with applicable regulations and guidelines of the various regulatory authorities, we may be subject to warnings from, or enforcement action by, these authorities. Furthermore, if such activities are prohibited, it may harm demand for our products.
Promotion of unapproved drugs or devices or unapproved indications for a drug or device is a violation of the FDCA and subjects us to civil and criminal sanctions. Furthermore, sanctions under the FCA have recently been brought against companies accused of promoting off-label uses of drugs, because such promotion induces the use and subsequent claims for reimbursement under Medicare and other federal programs. Similar actions for off-label promotion have been initiated by several states for Medicaid fraud. The healthcare reform law significantly strengthened provisions of the FCA, Medicare and Medicaid Anti-Kickback provisions, and other health care fraud provisions, leading to the possibility of greatly increasedqui tamsuits by relators for perceived violations. Violations or allegations of violations of the foregoing restrictions could materially and adversely affect our business.
We are required to report detailed pricing information, net of included discounts, rebates and other concessions, to CMS for the purpose of calculating national reimbursement levels, certain federal prices and certain federal and state rebate obligations. We have established systems for collecting and reporting this data accurately to CMS and have instituted a compliance program to assure that the information collected is complete in all respects. If we report pricing information that is not accurate to the federal government, we could be subject to fines and other sanctions that could adversely affect their business.
To market and sell our products outside of the U.S., we must obtain and maintain regulatory approvals and comply with regulatory requirements in such jurisdictions. The approval procedures vary among countries in complexity and timing. We may not obtain approvals from regulatory authorities outside the U.S. on a timely basis, if at all, which would preclude us from commercializing products in those markets. In addition, some countries, particularly the countries of the European Union, regulate the pricing of prescription pharmaceuticals. In these countries, pricing discussions with governmental authorities can take considerable time after the receipt of marketing approval for a product. To obtain reimbursement or pricing approval in some countries, we may be required to conduct a clinical trial that compares the cost-effectiveness of their product candidate to other available therapies. Such trials may be time-consuming and expensive and may not show an advantage in efficacy for our products. If reimbursement of our products is unavailable or limited in scope or amount, or if pricing is set at unsatisfactory levels, in either the U.S. or the European
29
Union, we could be adversely affected. Also, under the FCPA, the U.S. has increasingly focused on regulating the conduct by U.S. businesses occurring outside of the U.S., generally prohibiting remuneration to foreign officials for the purpose of obtaining or retaining business.
To enhance compliance with applicable health care laws, and mitigate potential liability in the event of noncompliance, regulatory authorities, such as HHS’s Office of Inspector General, or OIG, have recommended the adoption and implementation of a comprehensive health care compliance program that generally contains the elements of an effective compliance and ethics program described in Section 8B2.1 of the U.S. Sentencing Commission Guidelines Manual. Increasing numbers of U.S.-based pharmaceutical companies have such programs. While we have adopted U.S. healthcare compliance and ethics programs that generally incorporate the HHS OIG’s recommendations, and train our applicable U.S. employees in such compliance, having such a program can be no assurance that we will avoid any compliance issues.
We are subject to extensive environmental, health and safety laws and regulations.
Our business involves the controlled use of hazardous materials, various biological compounds and chemicals. The risk of accidental contamination or injury from these materials cannot be eliminated. If an accident, spill or release of any regulated chemicals or substances occurs, we could be held liable for resulting damages, including for investigation, remediation and monitoring of the contamination, including natural resource damages, the costs of which could be substantial. We are also subject to numerous environmental, health and workplace safety laws and regulations, including those governing laboratory procedures, exposure to blood-borne pathogens and the handling of biohazardous materials and chemicals. Although we maintain workers’ compensation insurance to cover the costs and expenses that may be incurred due to injuries to our employees resulting from the use of these materials, this insurance may not provide adequate coverage against potential liabilities. We do not maintain insurance for environmental liability or toxic tort claims that may be asserted against us for claims arising in the U.S. Additional or more stringent federal, state or local laws and regulations affecting our operations may be adopted in the future. We may incur substantial capital costs and operating expenses to comply with any of these laws or regulations and the terms and conditions of any permits required pursuant to such laws and regulations, including costs to install new or updated pollution control equipment, modify our operations or perform other corrective actions at our respective facilities. In addition, fines and penalties may be imposed for noncompliance with environmental and health and safety laws and regulations or for the failure to have or comply with the terms and conditions of required environmental permits.
Internationally, the Kyoto Protocol to the United Nations Framework Convention on Climate Change, or Kyoto Protocol, became effective in February 2005. Adopted by some of the countries in which we operate, the Kyoto Protocol requires the implementation of national programs to reduce emissions of certain gases, generally referred to as greenhouse gases, which contribute to global warming. Climate change-related legislation has also passed the U.S. House of Representatives, which, if enacted by the full Congress, would limit and reduce greenhouse gas emissions from large emitters of greenhouse gasses through a “cap-and-trade” system of allowances and credits and other provisions. Moreover, the Environmental Protection Agency, or EPA, issued a finding that the current and projected concentrations of certain greenhouse gases in the atmosphere, including carbon dioxide, threaten the public health and welfare of current and future generations. While this finding in itself does not impose any requirements on our industry, it authorizes the EPA to regulate directly greenhouse gas emissions through a rule-making process. Existing legislation and the future passage of climate control legislation or regulations that restrict emissions of greenhouse gases in the areas in which we operate could result in adverse financial and operational impacts on our respective business.
Plasma collection and manufacturing, and the manufacture of drugs, biologicals and devices, are heavily regulated.
Our business is heavily regulated in all jurisdictions where we collect plasma or manufacture or sell our products. In particular, plasma collection activities in the U.S. are regulated by the FDA, which requires a licensing and certification process for each plasma collection center prior to opening and conducts periodic inspections of facilities and processes. Many states also regulate plasma collection, imposing similar obligations and additional inspections and audits. In addition, the marketing and sale of a pharmaceutical product such as plasma derivatives and parenteral solutions (fluid therapies) are subject to the prior registrations, listings, licenses and approvals of such products with the relevant authorities of the jurisdiction where the product is to be marketed and sold, including compliance with promotion, labeling and advertising requirements. Our Clayton, Los Angeles, Melville and Parets facilities, as well as the facility in Las Torres de Cotillas, in Murcia, Spain, or Murcia facility, must also meet strict European Union and FDA rules. Our U.S.-based manufacturing facilities must also comply with applicable state laws. U.S. centers collecting plasma for manufacture into products to be distributed in the European Union must also be approved by the competent European health authority.
Collection centers and manufacturing facilities are subject to periodic inspections by regulatory authorities. Our subsidiary, PlasmaCare, Inc., was issued an FDA Warning Letter in 2007, with respect to a plasma collection facility located in Cincinnati, Ohio. The FDA Warning Letter reported certain compliance deviations from FDA standards at the facility. The conditions were corrected to
30
the satisfaction of the FDA. The consequences of adverse findings following inspections can be more serious, such as the temporary shutdown of such center or facility, the loss of that center’s or facility’s license because of alleged noncompliance with applicable requirements, a voluntary or mandatory recall of finished product released to the market, or the destruction of inventory. These more serious consequences are often highly public and may also prompt private products liability lawsuits, additional regulatory enforcement actions, the imposition of substantial fines or penalties by regulatory authorities, and damage to the reputation and public image of the collection or manufacturing facility.
Prior to the acquisition Talecris had voluntarily recalled plasma products. In addition, plasma unit look backs and retrievals are routinely handled when new information relevant to donor or plasma suitability is received after a donation is collected. Plasma unit retrievals are also triggered if units were distributed that should have been rejected by the plasma collection center. A minority of unit retrievals are required to be reported to the FDA as Biological Product Deviation Reports, and a relatively small number are classified by the FDA as recalls. We have been and also may be in the future involved in voluntary recalls involving certain devices.
In addition, the FDA conducts ongoing monitoring and surveillance of advertising and promotional matter used by manufacturers to sell and promote their products. The FDA assesses these materials for compliance with the FDCA, regulations on misbranding and other requirements, for example, assessing if information about the risks and benefits of regulated products are communicated in a truthful, accurate, science-based, non-misleading and balanced manner. In 2005, we were issued an FDA Warning Letter with respect to our product, Flebogamma® IVIG, indicating that a brochure was misleading for failing to reveal material facts regarding risks associated with the product, and therefore misbranded Flebogamma® IVIG in violation of the FDCA. In addition, Talecris received FDA Untitled Letters on three occasions prior to the acquisition, the letters requesting that Talecris change advertising materials on the basis that they were inconsistent with the package insert for the affected products. All of these matters were addressed to the satisfaction of the FDA.
In particular, the manufacturing processes for our products are governed by detailed and constantly evolving federal and sometimes state regulations that set forth cGMP for drugs and devices manufactured or distributed in the U.S. We monitor compliance with these evolving procedures and regulations to help assure compliance, but failure to adhere to established procedures or regulations, or to meet a specification, could require that a product or material be rejected and destroyed, and could result in adverse regulatory actions against us. As a result of routine inspections by regulatory health authorities, we have been issued observations, for example, Form 483 FDA Inspection Observations, with regard to cGMP compliance. While these issues have been corrected, no assurances can be provided that we will avoid citation for deficiencies in the future. If serious deficiencies are noted or recur, compliance may be costly and difficult to achieve, and consequences may include the need to recall product or suspend operations until appropriate measures can be implemented. Also, certain deviations from procedures must be reported to the FDA, and even if we determine that the deviations were not material, the FDA could require us to take similar measures.
Existing government regulation and its interpretation may change or the requirements of different jurisdictions may become less uniform, thereby making compliance more expensive or reducing profit margins.
Changes in the regulation of our activities, such as increased regulation affecting plasma collection activity or new regulation, such as regulation of compensation paid to plasma donors or the prices charged to customers in the European Union or the U.S. or other jurisdictions in which we operate, could materially adversely affect the business. Currently, we are not subject to limits on compensation paid to plasma donors or product price controls in the U.S. market, but we cannot assure you this will remain the case. In addition, the requirements of different jurisdictions in which we operate may become less uniform, creating a greater administrative burden and generating additional costs. Any such regulatory changes could have a material adverse effect on our business, results of operations and financial condition.
| Item 4. | INFORMATION ON THE COMPANY |
| | A. | History of and Development of the Company |
Introduction
We were founded in 1940 in Barcelona, Spain by Dr. José Antonio Grifols i Roig, a specialist and pioneer in blood transfusions and clinical analysis and the grandfather of our current Chairman of the Board. We have been making and selling plasma derivative products for more than 70 years. Over the last 25 years, we have grown from a predominantly domestic Spanish company into a global company by expanding both organically and through acquisitions throughout Europe, the United States, Latin America and Asia.
We were incorporated in Spain as a limited liability company on June 22, 1987 under the name Grupo Grifols, S.A., and we changed our name to Grifols, S.A. in 2005. We conduct business under the commercial name “Grifols.” Our principal executive office
31
is located at Avinguda de la Generalitat, 152 Parque Empresarial Can Sant Joan, 08174 Sant Cugat del Vallès, Barcelona, Spain and our telephone number is +34 93 571 0500. Our registered office is located at c/Jesús y María, 6, Barcelona, Spain.
We are a vertically integrated global producer of plasma derivatives. Our activities include sourcing raw material, manufacturing various plasma derivative products and selling and distributing final products to healthcare providers. We have 147 FDA-licensed plasma collection centers located across the United States. We have expanded our plasma collection network through a combination of organic growth and acquisitions and the opening of new plasma collection centers. Our acquisitions of SeraCare (now renamed Biomat USA) in 2002; PlasmaCare, Inc. in 2006; eight plasma collection centers from a subsidiary of Baxter in 2006; four plasma collection centers from Bio-Medics, Inc. in 2007; and one plasma collection center from Amerihealth Plasma LLC in 2008 have given us reliable access to United States source plasma. Our acquisition of Talecris in June 2011 expanded our network by an additional 67 centers.
In May 2006, after we completed our initial public offering in Spain, our Class A shares were listed on the Spanish Stock Exchanges and quoted on the Automated Quotation System under the symbol “GRF.” In January 2008, we became part of the IBEX-35 Index, which comprises the top 35 listed Spanish companies by liquidity and market capitalization.
On June 1, 2011, we acquired all of the issued and outstanding shares of Talecris, furthering our position as a diversified, global provider of life-saving and life-enhancing plasma protein therapeutics and making us the world’s third-largest producer of plasma derivative products. For a further discussion of the acquisition, see “— Important Events — The Acquisition and Related Financing” below.
Our Class B shares were issued as part of the consideration for the acquisition of Talecris and were listed on the Spanish Stock Exchanges on June 2, 2011 and quoted on the Automated Quotation System under the ticker symbol “GRF.P.” Our Class B shares are also traded in the U.S. on the NASDAQ Global Select Market in the form of ADSs, evidenced by ADRs, under the symbol “GRFS.” Each ADS represents one-half of one of our Class B shares. Our ADSs are currently traded in U.S. dollars. In November 2011, our ADSs were added to the NASDAQ Biotechnology Index.
Important Events
The Acquisition and Related Financing
On June 1, 2011, pursuant to the Agreement and Plan of Merger, dated as of June 6, 2010, or Merger Agreement, by and among Talecris, Merger Sub, Grifols, S.A. and Grifols Inc., as amended by Amendment No. 1, dated November 4, 2010, we completed our acquisition of Talecris for a total of $3.7 billion. The total value of the transaction, including Talecris’ net debt, was approximately $3.3 billion. The acquisition was effected through (i) the merger of Talecris with and into Stream Merger Sub, Inc., a Virginia corporation and wholly owned subsidiary of Talecris, or Merger Sub, and (ii) the immediately subsequent merger of Grifols Inc., a Delaware corporation and wholly owned subsidiary of Grifols, S.A., with and into Merger Sub, with Merger Sub continuing as the surviving corporation and a wholly owned subsidiary of Grifols, S.A. Merger Sub was subsequently renamed Grifols Inc.
In connection with the consummation of the acquisition, each share of Talecris common stock, par value $0.01 per share, was converted into the right to receive $19 in cash and 0.6485 (or 0.641 for Talecris directors and Talecris Holdings, LLC) of a Class B share of Grifols, S.A. and cash in lieu of fractional Class B shares and any cash representing dividends or other distributions payable in accordance with the Merger Agreement.
On July 20, 2011, the Federal Trade Commission, or FTC, issued a final order, or Consent Order, settling the FTC’s May 31, 2011 charges that Grifols’ acquisition of Talecris was anticompetitive and would have resulted in higher prices for consumers. In accordance with the settlement of the FTC’s charges, Grifols completed the acquisition of Talecris on June 1, 2011. Pursuant to the Consent Order, Grifols divested to Kedrion, on June 2, 2011, certain assets, including Talecris’ Melville, New York manufacturing facility and United States marketing rights to Koate® hemophilic factor, and an agreed quantity of plasma and subsequently transferred to Kedrion two plasma collection centers located in Mobile, Alabama, and Winston Salem, North Carolina. Further, pursuant to the Consent Order, Grifols and Kedrion entered into a contract manufacturing agreement under which Grifols will supply to Kedrion, for a period of seven years, Koate® and private label IVIG and albumin, for sale by Kedrion in the United States, and Grifols extended to Kedrion a five-year option for Kedrion to purchase a non-exclusive license to Koate®-related intellectual property for use in the United States. In accordance with the Consent Order, Grifols will lease the Melville facility from Kedrion for a period of at least three years. The Consent Order provides for a monitor to oversee Grifols’ compliance with the Consent Order and requires Grifols to submit to the FTC annual compliance reports for ten years. Our next compliance report is due in July 2012.
In order to finance the cash portion of the acquisition consideration and repay existing indebtedness, on November 23, 2010, we entered into the Original Senior Credit Agreement, which provided for the Original Senior Term Loans aggregating $2.5 billion
32
and €440 million and the Original Revolving Credit Facilities in the amounts of $50 million, €36.7 million ($50 million equivalent) and the $200 million equivalent in multicurrencies, from a syndicate of lenders led by Deutsche Bank Securities Inc., Nomura International plc, Banco Bilbao Vizcaya Argentaria, S.A., BNP Paribas, HSBC Securities (USA) Inc. and Morgan Stanley Senior Funding, Inc. Upon completion of the acquisition, the lenders funded their commitments under the Original Senior Credit Agreement. We did not draw on the Original Revolving Credit Facilities.
In addition, on January 21, 2011, Giant Funding Corp., an escrow company formed solely for the purpose of issuing our Notes in order to partially fund the acquisition and repay existing indebtedness, completed a private offering of the Notes to the initial purchasers of the Notes. The proceeds of the offering of the Notes were held in an escrow account pending completion of the acquisition and the satisfaction of other conditions. On June 1, 2011, upon completion of the acquisition, Giant Funding Corp. was merged with and into our wholly owned subsidiary, Grifols Inc., and Grifols Inc. assumed all of Giant Funding Corp.’s obligations under the Notes and the indenture governing the Notes. In addition, each of our direct or indirect subsidiaries that provided a guarantee pursuant to the Original Senior Credit Agreement (other than any foreign subsidiary of Grifols Inc.) became a guarantor of the Notes. The proceeds of the offering of the Notes were disbursed from the escrow account and used to pay a portion of the acquisition purchase price. For a summary of the material terms of the Notes, see Item 5 of this Part I, “Operating and Financial Review and Prospects — B. Liquidity and Capital Resources — Sources of Credit — 8.25% Senior Notes due 2018.”
Pursuant to the terms of the Original Senior Credit Agreement and in connection with the consummation of the acquisition, we refinanced substantially all of our and Talecris’ existing debt. On September 21, 2009, Grifols Inc. completed a private placement of $200.0 million aggregate principal amount of notes maturing in 12 years, $245.0 million, £25.0 million and €10 million aggregate principal amount of notes maturing in ten years and $100.0 million aggregate principal amount of notes maturing in seven years (or, together, Grifols Inc. Old Notes). On June 2, 2011, we redeemed all of the Grifols Inc. Old Notes and repaid existing bank loans amounting to €297 million. We paid a €112 million make-whole premium payment in connection with the redemption of the Grifols Inc. Old Notes. On June 13, 2011, we redeemed 10% of the $600 million aggregate principal amount of the outstanding 7.75% senior unsecured notes due 2016 issued by Talecris in October 2009, or Talecris Old Notes. The remaining Talecris Old Notes were redeemed on July 1, 2011. As of the date hereof, there are no Talecris Old Notes outstanding. We paid a €78 million make-whole premium payment in connection with the redemption of the Talecris Old Notes.
Purchase of Remaining Woolloomooloo Shares
In August 2011, we acquired the remaining 51% of the share capital of Woolloomooloo Holdings Pty Ltd., the holding company of Lateral-Medion, an Australian-Swiss group that distributes diagnostic products in Australia and Switzerland and has a manufacturing facility in Switzerland. We had previously held 49% of the share capital and 100% of the voting rights and had exercised control since March 3, 2009. The acquisition of the remaining 51% of the share capital totaled AUS dollars 12.5 million, or €9.5 million. The difference between the amount paid and the non-controlling interest was recorded as a €2.2 million increase in reserves.
Sale-leaseback Transactions
In May 2011, we sold five properties in Spain for an aggregate amount of €80.4 million to Gridpan Invest, S.L., a wholly owned subsidiary of Scranton Enterprises, B.V., one of our major shareholders and a related party. These properties related primarily to non-core assets such as offices and warehouses and a factory. Two of the premises were sold together with their related mortgage loans for a total of €53.5 million. As a result of the sale, we recognized a net loss of €7.4 million, which includes €2 million in brokerage fees paid to Scranton Enterprises, B.V. The prices paid for the properties were established based on appraisals made by independent appraisers. Simultaneous with the sale, we entered into operating lease agreements with Gridpan Invest, S.L. with respect to the aforementioned properties. For a summary of the material terms of the lease agreements, see Item 7 of this Part I, “Major Shareholders and Related Party Transactions — B. Related Party Transactions — Sale-leaseback Transactions — Spain.”
In June 2011, we signed various contracts for the sale and leaseback of a production plant located at the Los Angeles facility, as well as its machinery and other equipment to third-party investors California Biogrif 330, LP and LA 330 Biologicals Financing, LP, respectively. We also signed a 99-year lease for the land on which the production plant is built. An amount of $35.4 million (€24.6 million) was received for the sale of the production plant, while an amount of $23.8 million (€16.5 million) was received for the sale of the machinery and other equipment.
The plant lease has been considered an operating lease and the lease on the machinery and other equipment is considered a finance lease in accordance with the terms of the purchase option. As a result of the sale of the plant, we have incurred a net loss of $2.4 million (€1.3 million), mainly due to the expenses incurred during its operation.
33
The main terms of the plant operating lease contract are as follows:
| | • | | initial term of 20 years; |
| | • | | initial rent established at market prices and subject to an annual 3% increase; |
| | • | | on the first day of the sixth year, the rent due through the 20th year will be paid in advance; |
| | • | | option to extend the lease by a ten-year period at our discretion; and |
| | • | | grant of purchase options in the sixth and 20th years at a market price to be agreed to by our landlord and us, or as determined by an independent appraiser if we can not reach an agreement with our landlord. |
The main terms of the finance lease contract for the machinery and other equipment are: a term of five years and 60 monthly payments of $529 thousand (€369 thousand). The lease contract is non-extendable and anticipates the repurchase of the machinery and other equipment for the amount of $1.00 upon expiration of the lease term.
The rental expense incurred in 2011 for the operating contracts amounted to $1.5 million (€1.1 million), coinciding with the minimum contractually agreed payments.
In December 2011, we entered into a number of contracts for the sale and subsequent leaseback of certain buildings and equipment under construction in Clayton, North Carolina with Scranton Enterprises USA, Inc., a company owned by Scranton Enterprises, B.V., one of our major shareholders and a related party. The sale price was $199 million, of which $115 million was paid as of December 31, 2011. The remaining $84 million is to be paid prior to June 30, 2012. For a summary of the material terms of the lease agreements, see Item 7 of this Part I, “Major Shareholders and Related Party Transactions — B. Related Party Transactions — Sale-leaseback Transactions — Clayton, North Carolina.”
For further details of our principal capital expenditures and divestitures, see Item 5 of this Part I, “Operating and Financial Review and Prospects — B. Liquidity and Capital Resources — Capital Expenditures.”
Amended and Restated Credit and Guaranty Agreement
On February 29, 2012, we entered into the Amended and Restated Senior Credit Agreement, which provided for the repricing of all of the Original Senior Term Loans and the Original Revolving Facilities. The Amended and Restated Senior Credit Agreement provides for the Amended Senior Term Loans aggregating $2.3 billion and €420 million, and the Amended Revolving Credit Facilities in the amounts of $140 million, €22 million and the $35 million equivalent in multicurrencies. In addition to repricing, the Amended and Restated Credit Agreement provides for the reduction of interest rates, the removal of certain financial and negative covenants, the amendment of the leverage ratio restricting the distribution of dividends and voluntary debt repayment through the early amortization of $240 million. For a summary of the material terms of the Amended and Restatement Credit Agreement, see Item 5 of this Part I, “Operating and Financial Review and Prospects — B. Liquidity and Capital Resources — Sources of Credit — Amended and Restated Senior Credit Agreement.”
Investment in Araclon Biotech, S.L.
On March 15, 2012, our subsidiary, Gri-Cel, S.A., acquired 51% of the share capital of Araclon Biotech, S.L., or Araclon. Araclon is primarily involved in the research and development of therapies and methods for the diagnosis of degenerative illnesses, with a particular concentration on Alzheimer’s disease. This acquisition reinforces our commitment to research and development of therapies to fight Alzheimer’s disease.
Alpha Consent Decree
On March 15, 2012, the United States District Court for the Central District of California entered an order vacating the consent decree under which our Los Angeles facility previously operated. See Item 8 of this Part I, “Financial Information — A. Consolidated Statements and Other Financial Information — Legal Proceedings — Alpha Consent Decree.”
General
We are a leading global specialty biopharmaceutical company that develops, manufactures and distributes a broad range of plasma derivative products. Plasma derivatives are proteins found in human plasma, which once isolated and purified, have therapeutic value. These protein-based therapies extend and enhance the lives of individuals who suffer from chronic and acute, often
34
life-threatening, conditions, such as: primary and secondary immunological deficiencies; chronic inflammatory demyelinating polyneuropathy, or CIDP; A1PI deficiency and related emphysema; immune-mediated ITP; Guillain Barré syndrome; Kawasaki disease; allogeneic bone marrow transplants; hemophilia A and B; von Willebrand disease; traumatic or hemorrhagic shock; and severe burns. We also specialize in providing infusion solutions, nutrition products, medical devices, diagnostic instrumentation and reagents for use in hospitals and clinics.
Our products and services are used by healthcare providers in 100 countries to diagnose and treat patients with hemophilia, immune deficiencies, infectious diseases and a range of other medical conditions, and we have a direct presence, through the operation of commercial subsidiaries, in 24 countries.
We organize our business into four divisions: Bioscience, Hospital, Diagnostic and Raw Materials and Others. Subsequent to the acquisition, Talecris’ operations have been incorporated into our existing Bioscience division.
Bioscience. The Bioscience division includes activities relating to the manufacture of plasma derivatives for therapeutic use, including the reception, analysis, quarantine, classification, fractionation and purification of plasma, and the sale and distribution of end products. The main types of plasma products manufactured by us are IVIG, Factor VIII, A1PI and albumin. We also manufacture intramuscular (hyperimmune) immunoglobulins, ATIII, Factor IX and plasma thromboplastin component, or PTC. Subsequent to the acquisition, Talecris’ operations were incorporated into our existing Bioscience division. This diversification of our Bioscience division, coupled with geographical expansion, has enabled us to adapt to the demands of patients and healthcare professionals and add value to our services. The Bioscience division, which accounts for a majority of our total net sales, accounted for €1,531.2 million, or 85.3%, of our total net sales for the year ended December 31, 2011.
Hospital. The Hospital division manufactures and, in certain instances installs, products that are used by and in hospitals, such as parenteral solutions and enteral and parenteral nutritional fluids, which are sold almost exclusively in Spain and Portugal and which accounted for €95.4 million, or 5.3%, of our total net sales for the year ended December 31, 2011.
Diagnostic. The Diagnostic division focuses on researching, developing, manufacturing and marketing in vitro diagnostics products, including analytical instruments and reagents for diagnostics, as well as blood bank products. We concentrate our Diagnostic business in immunohematology and hemostasis. The Diagnostic division’s main customers are blood donation centers, clinical analysis laboratories and hospital immunohematology services. The Diagnostic division accounted for €117.4 million, or 6.5%, of our total net sales for the year ended December 31, 2011.
Raw Materials and Others. The Raw Materials and Others division historically consisted of sales of intermediate pastes and plasma to third parties. In 2011, it primarily consisted of (i) amounts earned under the agreements with Kedrion, which are described further in “— Important Events — The Acquisition and Related Financing” above, (ii) royalty payments from third parties and (iii) revenues from engineering activities by our subsidiary Grifols Engineering, S.A.
Geographic Markets
We believe that following the acquisition we are the third largest producer of plasma products worldwide. We have operations in 100 countries with a direct presence, through the operation of commercial subsidiaries, in 24 countries. The acquisition of Talecris has allowed us to expand our geographic footprint, in particular by strengthening our presence in the U.S. and adding Canada as a significant market, and has shifted the geographic distribution of revenues.
In 2011, 87% of total revenues, or €1.57 billion, were derived from countries outside of Spain. We have established a strong presence in North America and Europe, which are the two largest plasma derivatives sales regions in the world. Revenues in the United States and Canada totaled €948.7 million and accounted for approximately 53% of total revenues for the year ended December 31, 2011. Revenues in Europe increased to €526.6 million and accounted for approximately 30% of total revenues for the year ended December 31, 2011, due to increased market shares in certain countries, including Germany and Portugal.
Certain sales regions are expected to experience significant growth driven by enhanced socioeconomic conditions and more informed patients who are demanding better quality medical care, as well as increasing government healthcare spending on plasma derivative products in some of these markets. In Latin America and the Asia-Pacific region, we are expanding our presence by establishing and strengthening relationships with distributors as well as obtaining additional product licenses. Our presence and experience in Latin America, in countries such as Mexico, Colombia, Argentina, Chile and Brazil, where we have been marketing and selling products for over 20 years, has positioned us to benefit from this potential growth in both the Bioscience and Diagnostic divisions. In addition, our acquisition of product licenses and marketing and distribution structures in Asia has helped accelerate the
35
development of our presence in that region. In the Asia-Pacific region, we have established a presence through our subsidiaries and representative offices in Malaysia, China, Thailand, Singapore and Japan. Additionally, we have a license to market the latest generation IVIG in Australia, which gives us the opportunity to reach a country that has one of the highest levels of IVIG consumption per capita.
The following chart presents our total revenues by geographic market for the past three fiscal years:
| | | | | | | | | | | | | | | | | | | | | | | | |
Summary of Revenue by Region | | Year
ended
December 31,
2011 | | | % of total
revenues | | | Year
ended
December 31,
2010 | | | % of total
revenues | | | Year
ended
December 31,
2009 | | | % of total
revenues | |
European Union | | | 526,625 | | | | 29.3 | | | | 432,191 | | | | 43.6 | | | | 424,590 | | | | 46.5 | |
Spain | | | 230,871 | | | | 12.9 | | | | 227,947 | | | | 23.0 | | | | 225,759 | | | | 24.7 | |
United States and Canada | | | 948,730 | | | | 52.9 | | | | 338,016 | | | | 34.2 | | | | 275,991 | | | | 30.2 | |
Rest of the World | | | 289,732 | | | | 16.1 | | | | 215,708 | | | | 22.2 | | | | 189,943 | | | | 20.8 | |
| | | | | | | | | | | | | | | | | | | | | | | | |
Subtotal | | | 1,765,087 | | | | 98.3 | | | | 985,915 | | | | 99.5 | | | | 890,524 | | | | 97.5 | |
Raw Materials(1) | | | 30,526 | | | | 1.7 | | | | 4,815 | | | | 0.5 | | | | 22,662 | | | | 2.5 | |
| | | | | | | | | | | | | | | | | | | | | | | | |
Total | | | 1,795,613 | | | | 100.0 | | | | 990,730 | | | | 100.0 | | | | 913,186 | | | | 100.0 | |
| | | | | | | | | | | | | | | | | | | | | | | | |
| (1) | We exclude revenues derived from our Raw Materials division from our reported revenues by region, because we believe that such revenues do not represent part of our core recurrent business lines. These revenues consist primarily of revenues earned under the agreements with Kedrion, which are described further in “— Important Events — The Acquisition and Related Financing” above. |
Principal Activities
We organize our business into four divisions: Bioscience, Hospital, Diagnostic and Raw Materials and Others.
The following chart presents our total revenues by operating segment for the past three fiscal years:
| | | | | | | | | | | | | | | | | | | | | | | | |
Summary of Revenue by Division | | Year
ended
December 31,
2011 | | | % of total
revenues | | | Year
ended
December 31,
2010 | | | % of total
revenues | | | Year
ended
December 31,
2009 | | | % of total
revenues | |
Bioscience | | | 1,531,199 | | | | 85.3 | | | | 773,372 | | | | 78.1 | | | | 694,969 | | | | 76.1 | |
Diagnostic | | | 117,358 | | | | 6.5 | | | | 109,088 | | | | 11.0 | | | | 103,091 | | | | 11.3 | |
Hospital | | | 95,365 | | | | 5.3 | | | | 89,552 | | | | 9.0 | | | | 86,328 | | | | 9.4 | |
Raw Materials and Others | | | 51,691 | (1) | | | 2.9 | | | | 18,719 | | | | 1.9 | | | | 28,798 | | | | 3.2 | |
| | | | | | | | | | | | | | | | | | | | | | | | |
Total | | | 1,795,613 | | | | 100.0 | | | | 990,730 | | | | 100.0 | | | | 913,186 | | | | 100.0 | |
| | | | | | | | | | | | | | | | | | | | | | | | |
| (1) | In 2011, Raw Materials and Others primarily consisted of (i) amounts earned under the agreements with Kedrion, which are described further in “— Important Events — The Acquisition and Related Financing” above, (ii) royalty payments from third parties and (iii) revenues from engineering activities by our subsidiary Grifols Engineering, S.A. |
36
The Bioscience Division
The Bioscience division is responsible for the research and development, production and marketing of plasma derivative products. In the year ended December 31, 2011, the Bioscience division accounted for 85.3% of total revenues.
Operational Structure
The following chart illustrates our operational structure:
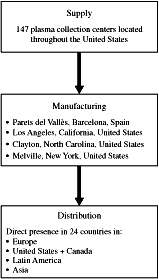
From plasma donation to therapeutic application, there are four major steps in the industry value chain process: (i) plasma collection, (ii) transport and logistics, (iii) manufacturing (fractionation) and (iv) marketing and distribution. We are present at all levels of the value chain, from collection centers to distribution of the final products. This integration enables us to leverage our position at each stage to control the overall process, to benefit from lower prices and to introduce complementary products, such as those offered through the Hospital division and the Diagnostic division, to our customers.
Plasma Collection
Plasma is the key raw material used in the production of plasma-derived products. We obtain our plasma primarily from the United States through our 147 plasma collection centers and, to a much lesser extent, through agreements with third parties. We gathered approximately 5.9 million liters of plasma (including specialty plasma) from our plasma collection centers in the year ended December 31, 2011. We believe that our plasma requirements through 2015 will be met through: (i) plasma collected through our plasma collection centers and (ii) approximately 800,000 liters of plasma per year to be purchased from third-party suppliers pursuant to various plasma purchase agreements. As we source the majority of our plasma internally, we have been able to ensure the availability of plasma for our manufacturing needs, assure the quality of the plasma throughout our manufacturing process, have better control over our plasma costs and improve our margins.
We have implemented mechanisms to ensure that a plasma donor meets the guidelines set forth by applicable regulations regarding, among other things, health, age and frequency of donations. Once the plasma donation is completed, as required by applicable United States and European regulations, we test every donation for pathogens such as HIV, hepatitis A, B and C, parvovirus B19 and syphilis. If we discover a unit of plasma that is contaminated, we notify the donor and remove all plasma previously donated by such donor from our inventory.
37
Transport and Logistics
Once plasma has been collected, it is frozen at the collection center and sent to fractionation centers. One essential aspect of this process is the implementation of safety procedures to guarantee the quality and safety of the donated plasma. To ensure the preservation of the proteins found in plasma, plasma must be kept at a temperature of -20 degrees Celsius (-4 degrees Fahrenheit). In accordance with European and United States requirements, we store our plasma at a temperature of -30 degrees Celsius (-22 degrees Fahrenheit). During transportation, plasma is kept at a temperature of at least -20 degrees Celsius. Our frozen plasma is transported by one of two transport companies, which are the same used industry wide.
Although the law requires only a two-month hold, plasma we collect from our donors is held in inventory in Spain for three months because viruses may not be detectable until they reach a certain minimum mass. Therefore, if plasma collected from a donor is found to be contaminated, we can remove all plasma donated by that donor during the previous three months from our inventory. We maintain a library of samples of every donation of plasma we have collected worldwide since 1987, giving us a valuable database for traceability purposes.
Manufacturing (“Fractionation and Purification”)
Once plasma has been obtained, it may be used immediately for blood transfusions. It may also be frozen (as fresh frozen plasma) and then manufactured into plasma derivatives through the fractionation process. The fractionation process consists of the separation of specific proteins through temperature and pH changes, as well as the use of filtration and centrifugation techniques. This process also includes a phase of administration of various viral inactivation procedures. Fractionation occurs in tanks at near-freezing temperatures to maintain the integrity of the proteins. All known plasma derivative products can be fractionated from the same batch of plasma. As a result, the development of a new or higher yield plasma derivative product would likely generate incremental sales without increasing the requirement for additional plasma.
We currently operate ten manufacturing facilities in the United States, Spain, Mexico, Switzerland and Australia. Our plasma derivative products are manufactured at our Parets and Los Angeles facilities, which have fractionation capacities of 2.1 million liters per year and 2.2 million liters per year, respectively. In addition, our Clayton facility, acquired in the acquisition of Talecris, is one of the world’s largest integrated protein manufacturing sites, including fractionation, purification and aseptic filling and finishing of plasma-derived proteins and has a capacity of 2.6 million liters per year. The Melville facility, which we acquired as a result of the acquisition of Talecris, then sold to Kedrion and currently lease and operate, is an intermediate processing facility and has a capacity of 1.6 million liters per year.
Currently, the Los Angeles and Parets facilities are equipped and licensed to produce certain plasma derivative products for both the United States and European markets. For example, we produce our Flebogamma® IVIG product for all of our markets at the Parets facility. In addition, the FDA and the European Union authorities have authorized the use of cryopaste fractionated at the Parets facility for the production of Factor VIII at the Los Angeles facility, and the use of intermediate pastes obtained at our Los Angeles facility for the production of Flebogamma® IVIG at our Parets facility. This flexibility allows us to increase production efficiency and to address changes in demand between the United States and the European markets. In 2011, we obtained FDA approval for the utilization of the intermediate product Fraction II+III, made at the Los Angeles facility, to be purified at our Clayton facility to make Gamunex®, an IVIG product we acquired in the acquisition of Talecris.
For more information on our manufacturing facilities, see the section “— D. Property, Plant and Equipment” below.
Safety
We have never experienced a recall of any of our finished biological products, although certain of our other products have been subject to non-material recalls. Before being acquired by us, Talecris had experienced four recalls of its finished biological products. Our philosophy is that the health of the plasma donor and the patient are the paramount considerations. We strongly believe that our safety philosophy is consistent with the business objective of generating profit. We also believe that we have a strong reputation for safety in our markets, thus making our products particularly attractive to customers. Our vertically integrated business model allows us to assure the safety and quality of our plasma derivative products through the implementation of our safety standards throughout the value chain.
The plasma collection, fractionation and purification process is long, complex and highly regulated. We have adopted and maintain rigorous safety standards that we believe exceed those required by health authorities in Europe and the United States.
We maintain standards consistent with other industry participants with regard to infectious disease screening and quarantine of units. For example, source plasma inventory is held for not less than 60 days. Some of our additional safety policies include look-back procedures for seroconversion and ongoing testing of donations for a 12-month period after a negative donation. We have also
38
introduced innovative methods such as the PediGri® On Line system, which provides full traceability of plasmatic raw material throughout the plasma supply chain. See “— Distribution Process” below.
We actively invest in the continued improvement of our manufacturing facilities and plasma fractionation process. In 2006, we developed a new sterile filling and purification area for our Los Angeles facility and developed a nanofiltration area for our Parets facility. Additionally, we developed the nanofiltration method of viral elimination of our IVIG and ATIII products.
Fractionation plants must be cleaned and sterilized frequently. Our Parets facility was designed in a way that reduces the clean area required for the plasma fractionation tanks and separates them from the room-temperature work area. This allows us to perform all maintenance work from outside the room-temperature area, thereby decreasing the risk of contamination.
Periodically, we voluntarily shut down all of our manufacturing facilities to perform maintenance work, expansion projects and other capital investments. Our manufacturing facilities have never been shut down because of regulatory noncompliance while under our operation. We believe that our voluntary shutdown procedure lowers the risk of any mandatory shutdown.
After plasma derivatives are processed, we inspect each bottle for irregularities such as imperfect seals, bottle cracks, volume mismeasurements and the presence of foreign objects.
We have also developed and installed in our Parets facility a proprietary process of sterile filling of bottles designed to reduce the risk of contamination. Under the sterile filling process of other fractionators, bottles and stoppers are sterilized independently, leaving the inside of the bottles exposed to potential contaminants in the environment for several minutes. Our process sterilizes both the bottle and stopper. The bottle is reopened in a small sterile room for only two seconds in order to insert the product and then resealed, greatly reducing exposure to the environment and reducing the risk of contamination.
Since January 1999, we have videotaped the filling process to enable us to identify the cause of, and rectify more easily, any related problem. Our policy is to maintain each videotape for six years. We also imprint an identification number on each of our bottles with a laser for easier identification in the event of a recall and to reduce the risk of tampering. This allows us to protect the integrity of our manufacturing process.
Distribution Process
With each batch of plasma derivatives, we deliver electronic information regarding the origin, characteristics and controls of each of the units of plasma that we used in the preparation of the batch to our customers. This feature, called the PediGri® On Line system, allows for full traceability of the human plasma raw material in the event of a problem with a specific product. This tracking process is of utmost importance for containing the transmission of diseases in the event of a potential product recall. We have had this system in place since 1996, and we believe we are the only fractionator that provides this feature to customers.
We have our own sales and distribution networks covering substantially all of our markets, staffed with highly trained personnel. A majority of our sales in 2011 were made through our own distribution network, which is experienced in the proper handling of our products. This network provides for greater safety because it allows us to know at all times where our products are located, thus enabling us to act immediately in the case of a potential product recall. In countries where we do not have our own distribution network, we have carefully selected distributors who follow all of our safety standards. Additionally, outside of the United States, we are in the process of transitioning some of Talecris’ products from their existing distribution channels into our own, reducing the distribution costs of those products.
For further information, see “— Marketing and Distribution” below.
Bioscience Products and Services
Collected plasma, whether source or recovered, is fractionated into different component proteins. We fractionate and purify a broad range of plasma derivative products that improve patient care.
Our principal plasma derivative products are IVIG, A1PI, Factor VIII and albumin, each sold under various brand names, and their respective applications are as follows:
39
| | |
Product Description | | Main Applications |
Flebogamma® 5%.Immune Globulin Intravenous (Human). Flebogamma® 5% and 10% DIF.Immune Globulin Intravenous (Human). Gamunex®/Gamunex®-C.Immune Globulin Injection (Human), 10% Caprylate/Chomatography Purified. | | IVIG assists in the treatment of: primary and secondary immunological deficiencies; immune-mediated ITP; Guillain Barré syndrome; Kawasaki disease; allogeneic bone marrow transplants; CIDP (Gamunex® only); and on an off-label application basis, multiple other pathologies, such as multiple sclerosis and autoimmune skin diseases. IVIG is also currently being investigated for use in the treatment of Alzheimer’s disease and other neurological conditions. |
| |
| Prolastin®/Prolastin®-C. Alpha 1-Proteinase Inhibitor (Human). | | Used to treat congenital A1PI deficiency-related emphysema. |
| |
| Trypsone® A1PI. Alpha 1-Proteinase Inhibitor (Human). | | |
| |
| Fahndi® and Alphanate®. Antihemophilic Factor/von Willebrand Factor Complex (Human). | | Used for the prevention and control of bleeding in Factor VIII deficiency (hemophilia A), and indication in the United States for von Willebrand disease (Alphanate® only). |
| |
| Koate®-DVI.Antihemophilic Factor (Human). | | |
| |
| Human Albumin Grifols®/Albutein®/Plasbumin®. Albumin (Human) 5%, 20% and 25%. | | Used to re-establish and maintain circulation volume in the treatment of hypovolemia (i.e., traumatic or hemorrhagic shock and severe burns) and to treat complications related to cirrhosis. Increasingly attractive to and used by biotechnology companies as a stabilizer, due to its low aluminum content. |
Our acquisition of Talecris expanded our portfolio of IVIG and A1PI products. Gamunex® IVIG, which was launched in North America in 2003 as a premium ready-to-use liquid IVIG product, is one of the leading products in the IVIG segment. We believe Gamunex® IVIG is considered to be the industry benchmark due to a comprehensive set of differentiated product characteristics that have positioned it as the premium product in its category since its launch. We manufacture the only IVIG products approved for CIDP in the United States and Canada and, through mutual recognition procedures, in 16 European countries. The CIDP indication approval makes one of the IVIG products that we manufacture the only IVIG products approved for use in a neurological indication in North America. Further, the FDA granted Gamunex® IVIG orphan drug status, which provides marketing exclusivity for the CIDP indication in the United States through September 2015.
In addition, following the acquisition of Talecris, we are the world’s largest producer of A1PI, which is used for the treatment of A1PI deficiency-related emphysema. Prolastin® A1PI is the leading A1PI product in the United States, and in Europe, it is licensed in 15 countries and competes with another licensed A1PI product only in France. Additionally, Prolastin®-C is the only licensed A1PI product in Canada, and we are conducting clinical trial in Europe as a precursor to Prolastin®-C approval there.
Alphanate® and Fahndi®, our Factor VIII/von Willebrand factor products, are used both for the treatment of hemophilia and von Willebrand disease. In addition, we offer our albumin product with reduced aluminum content, meeting European requirements and making our albumin product more attractive to biotechnology companies and genetic labs, as well as hospitals and physicians.
In addition to the products described above, we also produce intramuscular (hyperimmune) immunoglobulins, which are used for the treatment of tetanus, hepatitis A and B, and Rh factor complications during birth; Anbinex® and Thrombate® III, which are used in the treatment of thrombotic diseases; Alphanine® and Factor IX Grifols®, which are used in the prevention and control of bleeding in patients with hemophilia B; and Niuliva®, used in liver transplants to prevent hepatitis B reinfection of the graft.
To sell plasma derivative products, we must first register the products with the relevant authorities of the jurisdiction where the product is to be marketed and sold.
To comply with the regulatory requirements in a given jurisdiction, we have a core team in Spain and the United States that prepares, files and coordinates the registration process with the technical personnel at the subsidiary assigned to that jurisdiction. We have approximately 654 hemoderivative product licenses registered in 90 countries throughout the European Union, United States, Latin America, Asia and the rest of the world. Our most significant government-issued licenses for plasma derivative products are:
| | • | | Flebogamma®/Flebogamma®DIF/Gamunex®/Gamunex®-C Immunoglobulin. We have 117 licenses for the marketing and sale of one or more of these immunoglobulin products; |
40
| | • | | Fahndi®/Alphanate®/Koate® Factor VIII. We have 99 licenses for the marketing and sale of one or more of these Factor VIII products; |
| | • | | Human Albumin Grifols®/Albutein®/Plasbumin® Albumin. We have 198 licenses for the marketing and sale of one or more of these albumin products in its various concentrations; and |
| | • | | Prolastin®/Trypsone® A1PI. We have 26 licenses for the marketing and sale of one or both of these A1PI products. |
Pursuant to the Consent Order, we have granted Kedrion the exclusive license to sell Koate®-DVI in the United States.
In addition to the sale of the products described above, we have entered into a series of arrangements with certain Spanish transfusion organizations to fractionate recovered plasma (plasma separated from blood obtained from a blood donation) from such organizations and manufacture plasma derivatives under our own brand name for use by hospitals. We charge the transfusion centers for the fractionation and manufacturing service. We have similar, albeit smaller, arrangements with Czech and Slovak organizations. We also provide virus photo-inactivation of transfusion plasma to hospitals and clinics in Spain. The plasma is inactivated at our manufacturing facilities and then sent back to the clinic or hospital at which it was collected, where it is used for transfusions.
Pursuant to contracts with Canadian Blood Services and Héma-Québec, the Canadian blood system operators, which we assumed in connection with the acquisition of Talecris, we fractionate a majority of the plasma collected in Canada and supply a majority of the Canadian requirements for IVIG during the contract term. We transport plasma from the Canadian Blood Services and Héma-Québec collection centers to our Clayton facility for fractionation and manufacture and return finished commercial products to such parties.
The Diagnostic Division
Our Diagnostic division focuses on researching, developing, manufacturing and marketing of in vitro diagnostics products including analytical instruments and reagents for diagnostics, as well as blood bank products. We believe that we have a significant market share of sales of hemostasis automated systems to the medium size laboratory segment and that we are the second largest player in the immunohematology tests market. In 2011, we grouped our immunohaematology and blood bank subdivisions into a category called Transfusion Medicine as part of a management optimization process. The Diagnostic division accounted for 6.5% of total revenues in the year ended December 31, 2011.
We assemble our machines at our Parets facility and we manufacture our blood bags at our Murcia facility, which has an estimated capacity of eight million blood bags per year. See “— D. Property, Plant and Equipment” below.
Our principal diagnostic products are:
| | |
Product Description | | Main Applications |
Transfusion Medicine: | | |
| |
WADiana®/Erytra® analyzers. Automated immunohematology analyzers which use gel agglutination technology to enable automatic processing of Grifols DG Gel® blood determination cards. | | Used to perform routine blood typing, antibody screening, antibody identification and cross-match tests. |
| |
Leucored and Standard Blood bags. Blood bags configured according to all blood bank separation protocols. Leucored blood bags incorporate an in-line filtration system. | | Used for collection and transfusion of blood. |
| |
Hemostasis | | |
| |
Triturus® analyzers. Open and fully automated analyzer for enzyme-linked immunosorbent assay (ELISA) tests offering multi-test/multi-batch capability. | | Allows clinical laboratories to automate the enzyme immunoassay tests in microtiter plate format and to process several batches of samples simultaneously. |
| |
Q-Coagulometer® analyzers. Fully automated hemostasis analyzer which uses reagents to measure coagulation levels. | | Used to diagnose and measure coagulation status of patients with coagulation-related and hemorrhagic disorders. |
| |
Reagents, instrumentation and software. Instruments, reagents and software for coagulation testing. | | Used to establish the coagulation status of patients and to handle the corresponding results. |
The production, marketing and sale of many of our Diagnostic division products are subject to the prior registration of such
41
products with the relevant authorities of the applicable jurisdictions. We have approximately 865 diagnostic product licenses registered in a total of 53 countries in Europe, the United States, Latin America and Asia.
In addition to the products noted above, we offer our customers third-party products that complement our existing product lines. We intend to continue our strategy to offer third-party product sales and expect to boost growth through exclusive distribution agreements for various products.
We currently distribute Diagnostic division products in the European Union, the United States, Asia, the Middle East and Latin America. In 2011, we expanded the sales of our immunohaematology products and distributed our Erytra® analyzers in Europe, Mexico, Brazil, Japan and Australia.
Transfusion Medicine
Our marketing strategy for the transfusion medicine product line focuses mainly on expanding the sales of our WADiana® and Erytra® analyzers and related gel cards in the principal world markets directly or through distribution partners. We have signed a cooperation agreement with Novartis’ diagnostic division for the sale of immunohaematology products in the United States. These products include the BLOODchip® tests manufactured by Progenika Biopharma, which we distribute in several countries.
In 2011, we entered into an agreement with a Brazilian distributor for blood extraction and fractionation blood bags, which may lead to a significant increase in sales to Brazil from 2012 onwards. We also entered into a distribution agreement with the Japanese company Kainos Laboratories, pursuant to which it will distribute our WADiana® and Erytra® analyzers and associated reagents in Japan.
Hemostasis
In 2011 we launched new reagent cards and antibodies that were developed for the United States market, where we are increasing our efforts to develop our Diagnostic division business. We completed the adaptation of a protein S assay kit for our Q-Coagulometer® analyzers and anticipate commencing sales in 2012. We have also developed a chromogenic assay kit for protein C, which we will validate and begin distributing in 2012. In addition, we launched new versions of the software for our Q-Coagulometer® analyzers and continued development work on a new analyzer with greater processing capacity. Progress has also been made with respect to the development of a new automated analyzer for enzyme-linked immunosorbent assay testing to replace the current Triturus® analyzer, which has sold over 1,000 units worldwide.
The Hospital Division
The Hospital division manufactures primarily intravenous solutions and nutrition products for sale in Spain and Portugal. In addition, we offer medical devices and provide hospital logistic products that are manufactured by third parties. Our Hospital division accounted for 5.3% of total revenues in the year ended December 31, 2011. We believe that we are the leader in the Spanish intravenous therapy segment in intravenous solutions, pharmacy preparation tools used to administer intravenous solutions and hospital logistics products.
42
The following table describes our principal hospital products and their respective applications:
| | |
Product Description | | Main Applications |
| Intravenous therapy: | | |
| |
Intravenous fluid and electrolyte solutions. Main product groups include hypotonic solutions, isotonic solutions, hypertonic solutions and plasma volume expander solutions. | | Fluid and electrolyte replacement and conduit for the administration of medicines. |
| |
Intravenous washing solutions. Washing solutions in specially designed containers. | | Cleaning of injury and operation areas and urological irrigation. |
| |
Intravenous mixtures. Ready-to-use intravenous mixtures of potassium, antibiotics, gastroprotective agents, levofloxacine and paracetamol for various purposes. | | Increases safety and efficiency by rendering unnecessary the mixing of solutions at in-hospital pharmacies. |
| |
Oncotools. Gri-fill® System uses sterile filtration to prepare intravenous mixtures at in-hospital pharmacies. We have marketed this product in the U.S. since 2004, and we complement it with Misterium™ and specific software and hardware tools for the preparation of intravenous mixtures, including citotoxic drugs. We also distribute external technologies, such as Health Robotics systems, for the preparation of intravenous mixtures. | | Improves safety of hospital pharmacy preparation procedures by assuring sterility and traceability. |
| |
| Nutrition: | | |
| |
Dietgrif enteral liquid diets. Oral diets with all the requirements for balanced nutrition. Different diets include standard, standard fiber, polypeptidic, hyperproteic and energetic. | | For patients who are unable to eat enough to maintain a nutritious diet, administered through feeding tubes as well as orally. |
| |
Disposables for gastroenterology. | | Offers stents and special disposables for gastroenterology patients. |
| |
Probiotics.Special complementary diets composed of live microorganisms. | | Improves gastroenterology affections due to a lack of intestinal microflora. |
| |
| Medical devices: Disposable sterile therapeutic medical products and radiological diagnosis instruments. | | The products have therapeutics uses in urology, radiology, cardiology, neurology hemodynamics, anesthesia, urodynamics and lithotripsy. |
| |
| Hospital logistics:Products, some manufactured by third parties, like furniture, transport carts and bottling instruments; software programs, including our own BlisPack™; and distribution, including Pyxis® and Kardex® for inventory control. | | Used in the logistical organization of hospital pharmacies and warehouses, in the preparation of unit dosing and in hospital management, admissions and accounting. |
The production, marketing and sale of our various Hospital division products are subject to the prior registration of such products with the relevant authorities of the jurisdiction where the product is to be marketed and sold. We have approximately 277 licenses for our Hospital division products registered in 13 European Union countries and 38 countries in the rest of the world. Our sales representatives sell primarily to pharmacy, nutrition and gastroenterology units in hospitals and other units in hospitals that use our medical devices, using our own distribution network.
Although the majority of our sales in this division are in Spain and Latin America, we have instituted an international expansion strategy in order to diversify our end markets. Although manufacturing for third parties has historically been the driver of the international expansion process in the intravenous therapy product line, we believe that the acquisition of Talecris will allow us to gradually introduce our Hospital products and services, primarily our Oncotools products, into the North American markets.
Intravenous Therapy & Nutrition
We manufacture intravenous solutions and parenteral nutrition products for sale primarily in Spain and Portugal. In addition to the above-mentioned solutions, we manufacture accessories such as feeding tubes for nutrition and nutritional bags made of ethyl vinyl acetate for the preparation of liquid diets. In recent years, we have developed a business strategy called the “Grifols Partnership,” by which we manufacture customized intravenous solutions for third parties based on the specific requirements of each customer.
43
In 2011, developments in this subdivision included the launch of a high-nitrogen amino acid parenteral solution and the development of two new enteral diets, one high-protein and the other diabetic. In addition, approval has been granted for three devices for preparing solutions under sterile conditions. We have continued researching “ready-made” pre-diluted potassium solutions in polypropylene packaging, completed the development of two formulations of a drug for treating bone diseases and submitted the corresponding registration reports to the EMA, FDA and Australian and Canadian authorities.
We have also launched Gri-fill® System projects in North America. Gri-fill® System is a product for the preparation of intravenous mixtures.
In addition, we launched ten new Misterium™ projects, nine in Spain and one in Portugal. Misterium™ is a mini sterile modular room, or cleanroom, which we custom design for each order and install where the customer requests.
Additionally, as part of an existing exclusive agreement to distribute Health Robotics products in Spain, we have automated the pharmacy service at Vall d’Hebron University Hospital in Barcelona with the assembly and start-up of Health Robotics’ i.v.STATION Robot. This project has reinforced our leading position as a provider of automation services, the main advantages of which include minimizing the risk of measurement error and removing the possibility of drug cross-contamination and hospital-acquired infections.
The principal raw materials for our intravenous therapy products are plastic and glass bottles, which we purchase from various European suppliers. We manufacture parenteral solutions in glass bottles at our Parets facility, which has an estimated capacity of 45 million bottles per year. We manufacture parenteral solutions in flexible plastic containers at our Murcia facility, which has an estimated capacity of 25 million flexible plastic containers per year. Construction work began on a new plant at the Murcia facility, which will increase the production capacity of parenteral solutions in flexible plastic containers by an additional 15 million units per year. See “— D. Property, Plant and Equipment” below.
Medical Devices
We also sell medical devices, such as disposable sterile therapeutic medical products for urology, radiology, hemodynamics and anesthesia, as well as urodynamics and lithotripsy and radiological diagnosis instruments. All of these products are manufactured by third parties and complement our portfolio of hospital products.
Hospital Logistics
We sell products related to the logistical organization of the pharmacies and general warehouses of hospitals, including furniture, transport carts, bottling instruments and software programs for hospital management, admissions and accounting departments. Some of these products are manufactured by third parties.
We have an exclusive license through June 2013 for Spain, Portugal, Italy, Latin America and portions of Africa to distribute logistics products manufactured by Care Fusion under the name Pyxis®. We also have a five-year agreement with CareFusion to distribute the BlisPack® system throughout several countries of Europe, Middle East, Africa and Asia. BlisPack® is a system designed and manufactured by us to automate the cutting of prescription pill blister packs and the electronic identification of specific drugs for individual patients to be used by hospitals.
In 2011, we developed StocKey®, a new automated system to optimize hospitals’ healthcare material restocking processes.
Research and Development
Research and development is a significant aspect of our business. Our principal research and development objectives are (i) discovering and developing new products, (ii) researching new applications for existing products and (iii) improving our manufacturing processes to improve yields, safety and efficiency. We spent more than €89.4 million in 2011 on research and development, an increase of 119% over the €40.7 million spent on research and development in 2010. In addition, as of December 31, 2011, we had 689 scientists and support staff dedicated to research and development.
We have over 70 years of successful innovation history. For example, we developed a unique fractionation design that reduces the risk of contamination, reduces maintenance costs and increases the amount of product extracted per liter of plasma. We have also developed the first centrifugation unit for the automated cleaning of blood cells, known as the Coombs test. In addition, we were one of the first fractionators to conduct double viral inactivation processes for Factor VIII and have designed and implemented a new process for the sterile filling of vials that reduces exposure to potential contaminants as compared to other existing processes. Further, we recently developed a nanofiltration method of viral inactivation for our IVIG and ATIII products. As a result of our past
44
and ongoing investment in research and development, we believe that we are well positioned to continue as a leader in the plasma-derived therapies industry.
Bioscience Division Initiatives
The acquisition of Talecris has complemented our substantial Bioscience division research and development project portfolio, which we believe will ensure the outstanding quality of our research activity in the long term. We have a number of patents and research and development projects in our Bioscience division underway, more than ten of which are already past the pre-clinical development phase. Among the most important of these projects are: (i) a clinical trial for the use of plasmin in treating acute peripheral arterial occlusion, (ii) trials for new uses of antithrombin in coronary surgery and severe burns and (iii) research into the use of fibrin glue in vascular, organ and soft-tissue surgery.
We are also continuing work on the medical study commenced in 2011 to find a possible treatment for Alzheimer’s by combining therapeutic plasmapheresis with albumin and IVIG, in collaboration with two hospitals in Spain and two in the United States. Trials are currently being carried out on more than 300 patients in a continuation of the trial previously performed on 42 patients, the preliminary results of which have already been published.
Hospital Division Initiatives
The research and development team in the Hospital division primarily focuses on developing complementary products and on improving the safety and efficiency of existing products. In the fluid therapy market, work continues on the study of stabilities of various ready-to-use mixtures in polypropylene packaging, in order to increase the range of mixtures available for hospital use. In 2009, we also began developing physiological saline and 5% glucose electrolyte solutions packaged in polypropylene bags. These bags are partially filled at different volumes for the purpose of adding medication and will completely replace polyvinyl chloride, or PVC, bags in the Spanish market.
The Hospital division is also developing new applications, such as software and devices, to improve the warehousing control of medication, the administration of medication to the patient and the traceability of the pharmaceutical products inside the hospital.
Diagnostic Division Initiatives
Research and development in the Diagnostic division primarily focuses on the development of reagents and equipment for pretransfusional testing and hemostasis diagnosis. The principal research and development projects that we are currently undertaking in the Diagnostic division are: (i) the continued development of technology associated with the classification of blood types through the use of gel technology; (ii) a new auto analyzer to perform ELISA techniques in microplates, to replace the current Triturus®, which will increase the output and sample and reagents capacity and add new features, such as continuous loading and unloading of samples and an innovative simplified fluidic system, in comparison to Triturus®; and (iii) a new hemostasis analyzer, complementary to the Q-Coagulometer®, that will be able to serve medium to large laboratories and will have about three times the capacity and output of the Q-Coagulometer®.
Other Initiatives
In addition, we are increasing our research and development activities in new fields, such as regenerative medicine. We will conduct these activities through the creation of joint ventures participated in by our subsidiary Gri-Cel, S.A., and through agreements to use patents owned by third parties. We have already entered into one such agreement in the field of gene therapy with the Universitat Autònoma of Barcelona and the Institut Germans Tries i Pujol. This agreement will enable us to develop a new gene therapy method that is both versatile and safe. Our subsidiary Grifols Engineering, S.A. has also completed the design and constructed of labs for, Nanotherapix, an associated company owned 51% by Gri-Cel, S.A., dedicated to the research of genetic therapies based on the use of autologous cells.
In connection with research and development efforts, we collaborate from time to time with governmental authorities on projects and receive grants or interest-free preferential loans from Spanish governmental authorities and not-for-profit organizations for use on such projects. In 2011, we joined ALINNSA, the Spanish Alliance for Health Research and Innovation, which is spearheaded by the Ministry for Science and Innovation through the Instituto de Salud Carlos III. The aim of this alliance is to promote research and development and innovation in Spain by defining a nationwide strategy for biomedical research and innovation.
45
Seasonality
Our businesses are not significantly affected by seasonal trends.
Raw Materials
The Bioscience division includes activities relating to the manufacture of plasma derivatives for therapeutic use. The cost of plasma, the key raw material used in the production of plasma-derived products, increased in 2011. However, we have experienced cost savings since our acquisition of Talecris because we have reorganized our plasma donation centers and introduced a new operating structure, under which all of our U.S. plasma collection centers are integrated.
The Hospital division manufactures primarily intravenous solutions and nutrition products for sale in Spain and Portugal. The principal raw materials for our intravenous therapy products are plastic and glass bottles, which we purchase from various European suppliers.
Marketing and Distribution
We currently sell Bioscience, Hospital and Diagnostic products to hospitals and clinics, GPOs, governments and other distributors in 100 countries.
In the United States, GPOs are entities that act as purchasing intermediaries for their members, which are primarily hospitals, nursing homes and other healthcare providers. GPOs negotiate the price and volume of supplies, equipment and pharmaceutical products, including plasma derivatives, used by their members. Hospitals report that GPOs save them 10% to 15% on their purchases. The GPOs’ large market position and substantial purchasing volume provide them with significant negotiating power, resulting in price pressures for manufacturers including us. A substantial amount of our sales in the United States are made through GPOs.
We market our products to GPOs’ members and their clients through focused sales presentations. Although price and volume are negotiated by the GPO, the actual sales are made to each GPO’s authorized distributor(s) at the contract price, and the distributor then sells the products to that GPO’s members. For safety and post-sale service reasons, the distributor is required to provide us with the specifics of the ultimate delivery to the client.
The sales, marketing and distribution process is different in Europe, where the bulk of sales are generally made directly to hospitals, with private fractionation companies meeting most of European demand. We have developed long-standing relationships with major hospitals in most of our European markets, and we believe that hospitals are loyal customers that recognize the high quality and safety of our products, our reliability as a supplier and the strong product expertise and service provided by our sales representatives. Due to the nature of our customer base and the prevalence of repeat sales in the industry, we market our products through focused sales presentations rather than by advertising campaigns. In addition, we provide plasma fractionation and viral inactivation services to Spanish, Czech and Slovak hospitals and clinics.
Sales to Eastern Europe, the Middle East and Japan are made mostly by third parties outside of our sales network. Our sales in Latin America are made mainly by our sales network.
Sales Representatives
We require our sales representatives to be able to highlight the technical differences between our products and those of our competitors. This skill requires a high degree of training, as the salesperson must be able to interact and discuss product differences with doctors, pharmacists and other medical staff. Sales representatives call on departmental heads, purchasing agents, senior hospital directors and managers. We compensate our sales representatives by means of a fixed salary and a bonus component based on sales. We divide our sales efforts along the lines of our main product categories. Our sales personnel are primarily located in Europe and the United States, but we also have sales personnel in Latin America and Asia.
In 2011, we reorganized our Bioscience sales forces. We now utilize mixed sales units comprised of both marketing and sales personnel and product line-specific sales units for hemostasis, pulmonary and coagulation factors (Factor VIII, Factor IX and anti-thrombin).
46
Advertising
We do not conduct any widespread advertising. Instead, we participate in medical conferences and fairs and occasionally publish advertisements in medical magazines.
Distribution
We believe that having our own distribution network staffed with highly trained personnel is a critical element of a successful sales and marketing effort. Through this network, we are able to provide high-quality pre- and post-sales service, which we believe enhances brand recognition and customer loyalty. Our distribution network is experienced in the proper handling of our products and allows us to know where our products are located, enabling us to act quickly in the event of a suspected problem or product recall.
Our sales, marketing and distribution network included 904 employees as of December 31, 2011, which included 766 sales and distribution personnel and 138 marketing employees. Our distribution network personnel are located in Europe, Latin America, the United States and Asia and handle the distribution of our biopharmaceutical and other medical products as well as goods manufactured by other premier healthcare companies that complement our own products.
During 2011, we distributed the majority of our products through our own distribution network. In some cases, particularly in the field of Diagnostics, we distribute products through marketing partners and third-party distributors. We have a direct presence in 24 countries and we have carefully selected distributors in 100 countries around the world. We have a responsive, effective logistics organization that is able to meet the needs of hospital centers throughout the world punctually.
Each of our commercial subsidiaries is responsible for the requirements of the local market. It is our goal for each commercial subsidiary to be recognizable as one of our companies by its quality of service, ethical standards and knowledge of customer needs. This strong local knowledge enables us to build and maintain long-term relationships with customers in the hospital to earn their trust and confidence.
Patents, Trademarks and Licenses
Patents and Trademarks
As of December 31, 2011, we owned approximately 857 patents and patent applications, of which 247 are in the process of final approval. These patents are granted a 20-year protection period. Only approximately 259 of these patents are set to expire in the next ten years. As of December 31, 2011, we also owned approximately 2,600 trademarks, of which 159 are in the process of final approval.
We maintain a department with personnel in Spain and in the United States to handle the patent and trademark approval and maintenance process and to monitor possible infringements. We are not aware of any infringements of our patents and trademarks and we do not license any of our patents to third parties.
Plasma Derivative Products
As of December 31, 2011, we owned approximately 621 patents and patent applications related to plasma derivatives. We own 258 patents in Europe, 114 patents in the United States and the remainder in the rest of the world. The most important of these patents relate to:
| | • | | Process for the production of virus-inactivated human Gamma Globulin G; |
| | • | | Use of therapeutic human albumin for the preparation of a drug for the treatment of patients suffering from cognitive disorders; and |
| | • | | Process for removing viruses in fibrinogen solutions. |
Hospital and Diagnostic Products
As of December 31, 2011, we owned approximately 229 patents and patent applications related to our Hospital and Diagnostic products throughout the European Union, the United States, Latin America, Asia and in the rest of the world. The most important of these patents include:
| | • | | Process for the sterile filling of flexible material bags (Gri-fill® System). We have 16 patents for this process in 11 countries; |
| | • | | WADiana® machine for clinical analysis. We have 17 patents for this device in 10 countries; |
47
| | • | | Triturus® machine for automated laboratory tests. We have 9 patents for this device in 5 countries; and |
| | • | | Blister handling machine (BlisPack®). We have 23 patents for this device in 16 countries. |
Licenses from Third Parties
We license from Bayer certain intellectual property rights. Under a licensing agreement with Bayer, Talecris was granted a royalty-free, worldwide and perpetual license covering certain intellectual properties not acquired by Talecris in connection with its formation transaction. We assumed this licensing agreement in connection with the acquisition.
Licenses from Government Authorities
Government authorities in the United States, at the federal, state and local level, and in other countries extensively regulate, among other things, the research, development, testing, approval, manufacturing, labeling, post-approval monitoring and reporting, packaging, promotion, storage, advertising, distribution, marketing and export and import of healthcare products such as those we collect, manufacture, sell or are currently developing.
We have product licenses from the FDA for the sale in the United States of IVIG, A1PI, albumin, Factor VIII, Factor IX, ATIII and PTC, as well as licenses for the sale of these and other products in Canada, Europe, Latin America and Asia.
The Parets and Murcia facilities meet all the regulations and standards of the European health authorities. In addition, the Instituto Grifols plant in Parets del Vallès holds an establishment license granted by the FDA in 1995, as well as an ISO 9001 certification for its parenteral solutions and diagnostic manufacturing facilities.
Our Los Angeles facility is subject to regulation by the FDA. The Los Angeles facility had previously operated under a consent decree from the FDA and the DOJ dating to the time the plant was owned and operated by Alpha. On March 15, 2012, the United States District Court for the Central District of California entered an order vacating the consent decree on the Los Angeles facility. See Item 8 of this Part I, “Financial Information — A. Consolidated Statements and Other Financial Information — Legal Proceedings — Alpha Consent Decree.”
We lease most of our plasma collection centers as well as our main laboratory facility located in Austin, Texas. We believe that we maintain licenses with the appropriate regulatory authorities, including the FDA, for all of these locations.
For more information on government licenses and regulation, see “— Principal Activities” above and “— E. Regulatory Matters” below.
Regulatory
For detailed information regarding the regulations applicable to our business, see “— E. Regulatory Matters” below.
Insurance Coverage
General and Product Liability
We have a program of insurance policies designed to protect us and our subsidiaries from product liability claims.
As of December 31, 2011, we had product liability insurance coverage for up to (i) $100 million per claim per year for products manufactured at the Clayton facility and the Melville facility and (ii) €105 million per claim per year (except for HIV, hepatitis B and hepatitis C infections, where the maximum aggregate amount covered was €13.0 million) for products manufactured in the rest of our facilities and for third-party products we sold. Effective January 1, 2012, we have product liability insurance coverage for up to €150 million per claim per year for products manufactured in all of our facilities and for third-party products we sell. This policy expires in May 2013. We have elected to self-insure the first €10 million per claim per year of our product liability policy through the purchase by one of our subsidiaries of such portion of the insurance policy. See “— Self-insurance” below.
Our master liability program also protects us and our affiliates, except for our United States operations, from liability for environmental damages. This risk is covered up to a maximum of €13.0 million.
Biomat USA, PlasmaCare and Talecris Plasma Resources are not covered by our master liability insurance program, and they maintain a separate liability insurance policy with Beazley Insurance Company. The policy covers their plasmapheresis business activities and expires in May 2013. The maximum amount of coverage for liability claims under the policy is $10 million per claim per year.
48
Property Damage and Business Interruption
Our property damage and business interruption master insurance policy covers us and our subsidiaries (including the United States subsidiaries). Our policy expired in January 2012, and we renewed it until January 2013. This master policy covers damages suffered by plants and buildings, equipment and machinery. Under the current terms of this master policy, the insurer will cover damages to our facilities produced by fire, smoke, lightning and explosions, among others, for up to $1 billion per claim. It also covers material damages or losses produced by equipment or machinery breakdown, flooding and robbery or looting, among others, for up to €40 million, €20 million, and €2 million, respectively.
In addition, this policy covers loss of profit for a period of indemnity of 24 months with a deductible equivalent to up to five business days of lost profits for our Spanish, Swiss and United States subsidiaries. Pursuant to the loss of profit benefit, in the event that any or all of our plants stop production due to an event not excluded under the policy, the insurer must cover fixed expenses, in addition to net profits we did not earn during the term of coverage.
We also have a transit and inventory insurance program, which covers damages to raw materials, supplies, semi-finished products and finished products for up to $200 million per claim.
Self-insurance
We are self-insuring part of the risks described above through the purchase of a portion of the relevant insurance policies by Squadron Reinsurance Ltd., one of our wholly owned subsidiaries. We self-insure the first €10.0 million per claim per year of our product liability policy and the first €200,000 per loss for property damage and the first ten days of lost profits. These amounts are in addition to the deductibles for each of the policies that make up our insurance coverage programs.
| | C. | Organizational Structure |
Grifols, S.A. is the parent company of the Grifols Group, which was comprised at December 31, 2011 of 46 companies that were fully consolidated. Subsidiaries in which Grifols, S.A. directly or indirectly owned the majority of equity or voting rights have been fully consolidated. In addition, there was one company that was accounted for by the equity method, because Grifols, S.A. owned between 20% and 50% of its share capital and had no power to govern its financial or operating policies.
See Notes 1(b) and 2(c) to our audited consolidated financial statements starting on page F-1 of this annual report on Form 20-F for details of our consolidated and non-consolidated companies.
49
| | D. | Property, Plant and Equipment |
Our headquarters are located in Barcelona, Spain. As of December 31, 2011, we owned or leased facilities in four countries. We currently own or lease ten manufacturing facilities in six locations, four of which have plasma fractionation capabilities. The table below shows the geographic location, size and business purpose of each facility.
| | | | | | | | |
Location | | Facility | | Size
(square
meters) | | Own/Lease | | Business Purpose |
Parets del Vallès, Spain | | Industrial Facility One Parets | | 58,285 | | Own 45,647 square meters; the rest of the property is leased | | Plasma fractionation Manufacture of plasma derivatives |
| | | | |
| | Industrial Facility Two Parets | | 35,525 | | Own 19,853 square meters; the rest of the property is leased | | Manufacture of Diagnostic products Manufacture of Hospital products |
| | | | |
| | Industrial Facility Three Parets | | 40,113 | | Lease | | Plasma storage |
| | | | |
Los Angeles, California, USA | | Industrial Facility USA | | 93,078 | | Own | | Plasma fractionation Manufacture of plasma derivatives |
| | | | |
Clayton, North Carolina, USA | | Clayton Facility | | 69,203 | | Own 60,771 square meters; the rest of the property is leased | | Plasma fractionation Manufacture of plasma derivatives |
| | | | |
Temple, California, USA | | City of Industry USA | | 5,000 | | Lease | | Plasma storage |
| | | | |
Murcia, Spain | | Industrial Facility One Murcia | | 10,285 | | Lease | | Manufacture of Hospital products |
| | | | |
| | Industrial Facility Two Murcia | | 26,873 | | Lease | | Manufacture of Hospital products |
| | | | |
Fribourg, Switzerland | | Industrial Facility Switzerland | | 12,000 | | Lease | | Manufacture of Diagnostic products |
| | | | |
Melbourne, Australia | | Industrial Facility Australia | | 3,838 | | Own | | Manufacture of Diagnostic products |
| | | | |
Austin, Texas, USA | | Plasma Testing Lab | | 2,235 | | Lease | | Plasma testing |
| | | | |
San Marcos, Texas, USA | | Plasma Testing Lab | | 7,670 | | Own | | Plasma testing |
| | | | |
Raleigh, North Carolina, USA | | Plasma Testing Lab | | 7,061 | | Lease | | Plasma testing |
| | | | |
Melville, New York, USA | | Melville Facility | | 9,562 | | Lease | | Plasma fractionation |
| | | | |
Benson, North Carolina, USA | | Benson Facility | | 3,642 | | Lease | | Plasma storage |
| | | | |
Sant Cugat del Vallès, Spain | | Headquarters | | 32,211 | | Lease | | Headquarters |
Plasma Fractionation Plants
Our plasma derivative products are manufactured at our Clayton, Los Angeles, Melville and Parets facilities, which are state-of-the-art plasma fractionation plants. All of our fractionation facilities, other than the Melville facility, have EMA certification. The Spanish and American facilities currently have an aggregate fractionation capacity of 8.5 million liters of plasma, and this capacity is sufficient to cover our current production needs.
The Parets facility, which has a fractionation capacity of 2.1 million liters per year, has a unique design that separates the maintenance area from the clean areas required for the fractionation and purification procedures. This design, which we developed in-house, minimizes the risk of contamination and reduces maintenance costs. In addition to licenses from the European Union and
50
other authorities for the production of various plasma derivative products, the Parets facility is licensed by the FDA for the production of albumin and IVIG. We believe that we are one of the few European plasma derivatives plants to be licensed by the FDA. In addition to the plasma fractionation facilities, the Parets facility also has energy generation, research and development, packaging and storage facilities for the Bioscience division and the Hospital division. The Parets facility holds an ISO 9001 certification for its parenteral solutions and diagnostic manufacturing facilities.
We acquired our Los Angeles facility in July 2003, in connection with our acquisition of Alpha’s plasma fractionation business. We subsequently made significant capital investments in the facility, including the construction of purification and aseptic filling areas for coagulation factors and albumin, which were completed in 2006 and 2009, respectively, and an increase of the fractionation capacity by 0.7 million liters to 2.2 million liters, which was approved by the FDA during 2009. The Los Angeles facility is subject to regulation by the FDA. From the date of acquisition through March 15, 2012 the Los Angeles facility operated under a consent decree from the FDA and the DOJ dating to the time the plant was owned and operated by Alpha. On March 15, 2012, the United States District Court for the Central District of California entered an order vacating the consent decree on the Los Angeles facility.
As a result of the acquisition of Talecris, we acquired the Clayton facility. Over the last 15 years, the Clayton facility has benefited from roughly $699 million of capital investment, including compliance enhancements, general site infrastructure upgrades, capacity expansions and new facilities, such as its chromatographic purification facilities and its high-capacity sterile filling facility. The Clayton facility is one of the world’s largest fully integrated facilities for plasma-derived therapies, including plasma receiving, fractionation, purification, filling/freeze-drying and packaging capabilities as well as freezer storage, testing laboratories and a cGMP pilot plant for clinical supply manufacture. The Clayton facility has a fractionation capacity of approximately 2.6 million liters per year.
Pursuant to the acquisition we also acquired Talecris’ Melville facility which was subsequently sold to Kedrion in accordance with the terms of the Consent Order. We now lease and operate the Melville facility to produce intermediate pastes which are purified into final products at the Clayton facility. The Melville facility has a fractionation capacity of approximately 1.6 million liters of plasma per year.
We are currently constructing new fractionation facilities in Clayton, North Carolina and Parets del Vallès, Barcelona. Construction of and the receipt of the necessary approvals for the new Clayton facility is expected to be completed in 2015. We expect this new facility to increase our fractionation capacity by six million liters per year. Construction of and the receipt of the necessary approvals for the new Parets del Vallès plant is expected to be completed in 2014. We expect this new facility to initially increase our fractionation capacity by an additional one million liters per year and for its fractionation capacity to be extendible for up to an aggregate additional two million liters per year.
Government Regulation
Government authorities in the United States, at the federal, state and local level, and in other countries extensively regulate, among other things, the research, development, testing, approval, manufacturing, labeling, post-approval monitoring and reporting, packaging, promotion, storage, advertising, distribution, marketing and export and import of healthcare products such as those we collect, manufacture, sell or are currently developing. The process of obtaining regulatory approvals and the subsequent substantial compliance with appropriate federal, state, local and foreign statutes and regulations require the expenditure of substantial time and financial resources. The following is a summary of the overall regulatory landscape for our business.
United States Government Regulation
In the United States, the FDA regulates drugs, biologics and plasma collection under the FDCA and implementing regulations. Failure to comply with the applicable FDA requirements at any time during the product-development process, approval process or after approval may result in administrative or judicial sanctions. These sanctions could include, as applicable, the FDA’s imposition of a clinical hold on trials for drugs, devices or biologics, refusal to approve pending applications, withdrawal of an approval, warning letters, product recalls, product seizures, total or partial suspension of production or distribution, injunctions, fines, civil penalties or criminal prosecution or any combination of these sanctions. Any agency or judicial enforcement action could have a material adverse effect on us.
The BLA Approval Process
Drugs that are also biological products must also satisfy the requirements of the Public Health Service Act and its implementing regulations. In order for a biological drug product to be legally marketed in the United States, the product must have a BLA approved by the FDA.
51
The steps for obtaining FDA approval of a BLA to market a biological product in the United States include:
| | • | | completion of preclinical laboratory tests, animal studies and formulation studies under the FDA’s good laboratory practices regulations; |
| | • | | submission to the FDA of an Investigational New Drug Application, or IND, for human clinical testing, which must become effective before human clinical trials may begin and which must include approval by an independent IRB at each clinical site before the trials may be initiated; |
| | • | | performance of adequate and well controlled clinical trials in accordance with “Good Clinical Practice,” as set forth by the International Conference on Harmonization, to establish the safety and efficacy of the product for each indication; |
| | • | | submission to the FDA of a BLA, which contains detailed information about the chemistry, manufacturing and controls for the product, reports of the outcomes and full data sets of the clinical trials and proposed labeling and packaging for the product; |
| | • | | satisfactory review of the contents of the BLA by the FDA, including the satisfactory resolution of any questions raised during the review; |
| | • | | satisfactory completion of an FDA Advisory Committee review, if applicable; |
| | • | | satisfactory completion of an FDA inspection of the manufacturing facility or facilities at which the product is produced to assess compliance with cGMP to assure that the facilities, methods and controls are adequate to ensure the product’s identity, strength, quality and purity; and |
| | • | | FDA approval of the BLA, including agreement on post-marketing commitments, if applicable. |
Preclinical tests include laboratory evaluations of product chemistry, toxicity and formulation, as well as animal studies. An IND sponsor must submit the results of the preclinical tests, together with manufacturing information and analytical data, to the FDA as part of the IND. Some preclinical testing may continue after the IND is submitted. The IND must become effective before human clinical trials may begin. An IND will automatically become effective 30 days after receipt by the FDA, unless before that time the FDA raises concerns or questions about issues such as the conduct of the trials or supporting preclinical data as outlined in the IND. In that case, the IND sponsor and the FDA must resolve any outstanding FDA concerns or questions before clinical trials can proceed. In other words, submission of an IND may not result in the FDA allowing clinical trials to commence. Further, the healthcare reform law introduced a biosimilar pathway that permits companies to obtain FDA approval of versions of existing biologics that are highly similar to innovative biologics based upon reduced documentation and data requirements deemed sufficient to demonstrate safety and efficacy than are required for the pioneer biologics. The new law provides that a biosimilar application may be submitted as soon as four years after the reference product is first licensed, and that the FDA may not make approval of an application effective until 12 years after the reference product was first licensed. Although drug manufacturers have begun efforts to develop biosimilar drugs for the U.S. market, none have yet been approved by the FDA. The FDA is developing regulations to implement this biosimilar pathway, and, for example, in February 2012 issued three draft guidance documents on biosimilar product development.
Clinical trials involve the administration of the investigational product to human subjects under the supervision of qualified investigators. Clinical trials are conducted under strict requirements to ensure the protection of human subjects participating in the trial and protocols detailing, among other things, the objectives of the study, the parameters to be used in monitoring safety and the effectiveness criteria to be evaluated. A protocol for each clinical trial and any subsequent protocol amendments must be submitted to the FDA as part of the IND. In addition, an IRB (usually, but not necessarily specific to each study site) must approve the protocol, subject consent form and any amendments. All research subjects must be informed, among other things, about the risks and benefits of the investigational product and provide their informed consent in writing. Federal regulations governing the protection of human subjects in clinical trials have remained generally consistent for many years, subject to certain amendments. In July 2011, HHS and the FDA issued an advance notice of proposed rulemaking seeking comments on proposals to substantially change aspects of these regulations, seeking comments, for example, on mandating the use of a single IRB for multi-site trials, imposing specified data security and information regulations on trials, imposing new consent requirements with respect to the use of biospecimens that have been stripped of patient-identifiers, and the requiring the use of standardized consent forms. The outcome of this regulatory review is not yet certain, and accordingly its impact on our operations is not clear.
Clinical trials typically are conducted in three sequential phases, but the phases may overlap or be combined.
Phase I trials usually involve the initial introduction of the investigational drug into a small group of healthy volunteers (e.g., ten to 20 volunteers) to evaluate the product’s safety, dosage tolerance and pharmacokinetics and, if possible, to gain an early indication of its effectiveness.
Phase II trials usually involve controlled trials in a larger but limited patient population (e.g., a few hundred) to:
52
| | • | | evaluate dosage tolerance and appropriate dosage; |
| | • | | identify possible adverse effects and safety risks; and |
| | • | | provide a preliminary evaluation of the efficacy of the drug for specific indications. |
Phase III trials usually further evaluate clinical efficacy and test further for safety in an expanded patient population (e.g., several hundred to several thousand patients). Phase III trials usually involve comparison with placebo, standard treatments or other active comparators. Usually two well controlled large Phase III or pivotal trials demonstrating safety and efficacy are required. These trials are intended to establish the overall risk-benefit profile of the product and provide an adequate basis for physician labeling. Phase III trials are usually larger, more time consuming, more complex and more costly than Phase I and Phase II trials. Since most of our products are aimed at very small populations so that it is not always possible to conduct two large studies, regulators may accept one study on a smaller number of patients than would typically be required for pharmaceutical products in general, provided the data is sufficiently robust.
Phase I, Phase II and Phase III testing may not be completed successfully within any specified period, if at all. Furthermore, we or the FDA may suspend or terminate clinical trials at any time on various grounds, including a finding that the subjects or patients are being exposed to an unacceptable health risk, have experienced a serious and unexpected adverse event, or that continued use in an investigational setting may be unethical. Similarly, an IRB can suspend or terminate approval of research if the research is not being conducted in accordance with the IRB’s requirements or if the research has been associated with unexpected serious harm to patients.
Assuming successful completion of the required clinical testing, the results of the preclinical studies and of the clinical trials, together with other detailed information, including information on the chemistry, manufacture and composition of the product, are submitted to the FDA in the form of a BLA requesting approval to market the product for one or more indications. In most cases, the BLA must be accompanied by a substantial user fee. The FDA will initially review the BLA for completeness before it accepts the BLA for filing. After the BLA submission is accepted for filing, the FDA reviews the BLA to determine, among other things, whether a product is safe and effective for its intended use and whether the product is being manufactured in accordance with cGMP to assure and preserve the product’s identity, strength, quality, purity and potency.
Under the Pediatric Research Equity Act of 2003, BLAs, or supplements to BLAs, must contain data to assess the safety and effectiveness of the drug for the claimed indications in all relevant pediatric subpopulations and to support dosing and administration for each pediatric subpopulation for which the drug is safe and effective. The FDA may grant deferrals for submission of data or full or partial waivers. Unless otherwise required by regulation, the Pediatric Research Equity Act of 2003 does not apply to any drug for an indication for which orphan designation has been granted.
Before approving a BLA, the FDA generally will inspect the facility or the facilities at which the product is manufactured. The FDA will not approve the product if it finds that the facility does not appear to be in cGMP compliance. If the FDA determines the application, manufacturing process or manufacturing facilities are not acceptable, it will either disapprove the application or issue a complete response letter in which it will outline the deficiencies in the BLA and provide the applicant an opportunity to meet with FDA representatives and subsequently to submit additional information or data to address the deficiencies. Notwithstanding the submission of any requested additional information, the FDA ultimately may decide that the application does not satisfy the regulatory criteria for approval.
The testing and approval processes require substantial time, effort and financial resources, and each process may take several years to complete. Data obtained from clinical activities is not always conclusive and may be susceptible to varying interpretations, which could delay, limit or prevent regulatory approval. The FDA may not grant approval on a timely basis, or at all. We may encounter difficulties or unanticipated costs in our efforts to secure necessary governmental approvals, which could delay or preclude us from marketing our products. The FDA may limit the indications for use or place other conditions on any approvals that could restrict the commercial application of the products. After approval, some types of changes to the approved product, such as adding new indications, manufacturing changes and additional labeling claims, are subject to further testing requirements and FDA review and approval.
Post-approval Requirements
After regulatory approval of a product is obtained, we are required to comply with a number of post-approval requirements. For example, as a condition of approval of a BLA, the FDA may require post-marketing testing and surveillance to monitor the product’s safety or efficacy. In addition, holders of an approved BLA are required to keep extensive records, to report certain adverse reactions and production problems to the FDA, to provide updated safety and efficacy information and to comply with requirements concerning advertising and promotional labeling for their products. Also, quality control and manufacturing procedures must continue to conform to cGMP regulations and practices, as well as the manufacturing conditions of approval set forth in the BLA. The FDA
53
periodically inspects manufacturing facilities to assess compliance with cGMP, which imposes certain procedural, substantive and recordkeeping requirements. Accordingly, manufacturers must continue to expend time, money and effort in the area of production and quality control to maintain compliance with cGMP and other aspects of regulatory compliance.
Future FDA inspections may identify compliance issues at our facilities or at the facilities of our third-party suppliers that may disrupt production or distribution, or require substantial resources to correct and prevent recurrence of any deficiencies, and could result in fines or penalties by regulatory authorities. In addition, discovery of problems with a product or the failure to comply with applicable requirements may result in restrictions on a product, manufacturer or holder of an approved BLA, including withdrawal or recall of the product from the market or other voluntary, FDA-initiated or judicial action that could delay or prohibit further marketing. Newly discovered or developed safety or efficacy data may require changes to a product’s approved labeling, including the addition of new warnings and contraindications. The healthcare reform law established and provided significant funding for a Patient-Centered Outcomes Research Institute to coordinate and fund Comparative Effectiveness Research. Also, new government requirements, including those resulting from new legislation, may be established that could delay or prevent regulatory approval our products under development.
Orphan Drug Designation
The FDA may grant orphan drug designation to drugs intended to treat a “rare disease or condition” that affects fewer than 200,000 individuals in the United States, or that affects more than 200,000 individuals in the United States and for which there is no reasonable expectation that the cost of developing and making available in the United States a drug for such a disease or condition will be recovered from sales in the United States for that drug. Orphan drug designation must be requested before submitting an application for marketing approval. Orphan drug designation does not convey any advantage in, or shorten the duration of, the regulatory review and approval process. Orphan drug designation can provide opportunities for grant funding towards clinical trial costs, tax advantages and FDA user fee exemptions. In addition, if a product which has an orphan drug designation subsequently receives the first FDA approval for the indication for which it has such designation, the product is entitled to orphan drug exclusivity, which means the FDA may not approve any other application to market the same drug for the same indication for a period of seven years, except in limited circumstances, such as a showing of clinical superiority to the product with orphan exclusivity or a meaningfully different mode of administration. Competitors may receive approval of different drugs or biologics for the indications for which the orphan product has exclusivity. However, if a company with orphan drug exclusivity is not able to supply the market, the FDA could allow another company with the same drug a license to market for said indication.
Fast Track Designation
The FDA’s fast track programs, one of which is fast track designation, are designed to facilitate the development and review of new drugs that are intended to treat serious or life-threatening conditions and that demonstrate the potential to address unmet medical needs for the conditions. Fast track designation applies to a combination of the product and the specific indication for which it is being studied. Thus, it is the development program for a specific drug for a specific indication that receives fast track designation. The sponsor of a product designated as being in a fast track drug development program may engage in close early communication with the FDA, including through timely meetings and feedback on clinical trials. Products in fast track drug development programs also may receive FDA priority review or accelerated approval; in other words, the review cycle has a six-month review clock instead of ten- or 12-month review clock). Sponsors may also be able to submit completed portions of an application before the entire application is completed; however, the review clock will not officially begin until the entire completed BLA is submitted to and filed by the FDA. The FDA may notify a sponsor that its program is no longer classified as a fast track development program if the fast track designation is no longer supported by emerging data, the designated drug development program is no longer being pursued, or another product that meets the unmet medical need for the same indication is approved first.
Plasma Collection
The FDA requires a licensing and certification process for each plasma collection center prior to opening and conducts periodic inspections of facilities and processes. Many states also regulate plasma collection, imposing similar obligations and additional inspections and audits. Collection centers are subject to periodic inspections by regulatory authorities, which if noncompliance is alleged, may result in fines, citations, the temporary closing of the centers, loss or suspension of licenses or recall of finished products.
Anti-fraud and Abuse Regulation
Since we supply products and services that are reimbursed by U.S. federally funded programs such as Medicare and Medicaid, our activities are also subject to regulation by CMS and enforcement by HHS OIG. The Anti-Kickback Law prohibits providers and others from directly or indirectly soliciting, receiving, offering or paying any remuneration with the intent of generating
54
referrals or orders for services or items covered by a government health care program. Many states have similar laws. Courts have interpreted this law very broadly, including by holding that a violation has occurred if even one purpose of the remuneration is to generate referrals, even if there are other lawful purposes. There are statutory and regulatory exceptions, or safe harbors, that outline arrangements that are deemed lawful. However, the fact that an arrangement does not fall within a safe harbor does not necessarily render the conduct illegal under the Anti-Kickback Law. In sum, even legitimate business arrangements between the companies and referral sources could lead to scrutiny by government enforcement agencies and require extensive company resources to respond to government investigations. Violations of the Anti-Kickback Law may be punished by civil and criminal penalties or exclusion from participation in federal health care programs, including Medicare and Medicaid. The healthcare reform law strengthened provisions of the Anti-Kickback Law.
The FCA is violated by any entity that “presents or causes to be presented” knowingly false claims for payment to the federal government. In addition, the healthcare reform law amended the FCA to create a cause of action against any person who knowingly makes a false statement material to an obligation to pay money to the government or knowingly conceals or improperly decreases an obligation to pay or transmit money or property to the government. For the purposes of these recent amendments, an “obligation” includes an overpayment, which is defined broadly to include “any funds that a person receives or retains under Medicare and Medicaid to which the person, after applicable reconciliation, is not entitled ….”
The FCA is commonly used to sue those who submit allegedly false Medicare or Medicaid claims, as well as those who induce or assist others to submit a false claim. Courts and government officials have found that “false claims” can result not only from noncompliance with the express requirements of applicable governmental reimbursement programs, such as Medicaid or Medicare, but also from noncompliance with other laws, such as provisions of the FDCA that prohibit off-label promotion, or laws that require quality care in service delivery. The qui tam and whistleblower provisions of the FCA allow private individuals to bring actions on behalf of the government alleging that the government was defrauded, with tremendous potential financial gain to private citizens who prevail. When a private party brings a whistleblower action under the FCA, the defendant is not made aware of the lawsuit until the government starts its own investigation or makes a decision on whether it will intervene. Many states have enacted similar laws that also apply to claims submitted to commercial insurance companies. The bringing of any FCA action could require us to devote resources to investigate and defend the action. Violations of the FCA can result in treble damages, and each false claim submitted can be subject to a penalty of up to $11,000 per claim.
The healthcare reform law imposes new reporting and disclosure requirements for pharmaceutical and medical device manufacturers with regard to payments or other transfers of value made to certain United States healthcare practitioners, such as physicians and academic medical centers. Data collection obligations under this rule were to commence in January 2012, and reporting requirements are to be implemented in 2013. On December 14, 2011, CMS issued proposed regulations to implement these provisions, sought substantial comments, and announced that data collection obligations would not begin until final regulations were issued. A number of states have similar laws in place.
Regulation Outside the United States
In addition to regulations in the United States, we are subject to a variety of regulations in other jurisdictions governing clinical trials and commercial sales and distribution of our products. Whether or not we obtain FDA approval for a product, we must obtain approval of a product by the comparable regulatory authorities of countries outside the United States before we can commence marketing that product in those countries. The approval process varies from country to country, and the time may be longer or shorter than that required for FDA approval. The requirements governing the conduct of clinical trials, product licensing, pricing and reimbursement vary greatly from country to country. Also, in addition to approval of final products, U.S. plasma centers collecting plasma for manufacture into products to be distributed in the European Union must also be approved by the competent European health authority.
Medicines can be authorized in the European Union by using either the centralized authorization procedure or national authorization procedures. The EMA is responsible for the centralized authorization procedure.
Centralized Authorization Procedure
The EMA is responsible for the centralized procedure, or Community authorization procedure, for human medicines. This procedure results in Community marketing authorization, the single marketing authorization that is valid across the European Union, as well as in the European Economic Area/European Free Trade Association states Iceland, Liechtenstein and Norway.
The Community authorization procedure is compulsory for:
| | • | | medicinal products developed by using recombinant DNA technology, the controlled expression of genes coded for biologically active proteins in prokaryotes and eukaryotes, including transformed mammalian cells, or hybridoma or monoclonal antibody methods; |
55
| | • | | advanced-therapy medicines, such as gene-therapy, somatic cell-therapy or tissue-engineered medicines; |
| | • | | medicinal products for human use containing a new active substance that did not receive Community marketing authorization when the Community authorization procedure was first implemented, for which the therapeutic indication is the treatment of AIDS, cancer, neurodegenerative disorders, diabetes, autoimmune diseases and other immune dysfunctions or viral diseases; and |
| | • | | officially designated orphan medicines. |
The Community authorization procedure is optional for products:
| | • | | containing new active substances for indications other than the treatment of AIDS, cancer, neurodegenerative disorders, diabetes, autoimmune diseases and other immune dysfunctions or viral diseases; |
| | • | | representing significant therapeutic, scientific or technical innovations; or |
| | • | | for which the granting of a Community marketing authorization would be in the interests of European Union public health. |
Applications through the Community authorization procedure are submitted directly to the EMA. Evaluation by the EMA’s relevant scientific committee takes up to 210 days, at the end of which the committee adopts an opinion on whether the medicine should be marketed. This opinion is then transmitted to the European Commission, which has the ultimate authority for granting marketing authorizations in the European Union.
Once a Community marketing authorization has been granted, the holder of that authorization can begin to make the medicine available to patients and healthcare professionals in all European Union countries.
National Authorization Procedures
Each European Union member state has its own procedures for the authorization, within their own territory, of medicines that fall outside the scope of the Community authorization procedure. There are two possible routes available to companies for the authorization of such medicines in several countries simultaneously.
| | • | | Decentralized procedure. Using the decentralized procedure, companies may apply for simultaneous authorization in more than one European Union country of medicines that have not yet been authorized in any European Union country and that do not fall within the mandatory scope of the centralized procedure. |
| | • | | Mutual-recognition procedure. In the mutual-recognition procedure, a medicine is first authorized in one European Union member state, in accordance with the national procedures of that country. Following such authorization, further marketing authorizations can be sought from other European Union member states in a procedure whereby the countries concerned agree to recognize the validity of the original, national marketing authorization. |
In some cases, disputes arising in these procedures can be referred to the EMA for arbitration as part of a “referral procedure.”
Orphan Drug Designation
Applications for designation of orphan medicines are reviewed by the EMA through the Committee for Orphan Medicinal Products. The criteria for orphan designation are:
| | • | | the medicinal product is intended for the diagnosis, prevention or treatment of a life-threatening or chronically debilitating condition affecting no more than five in 10,000 persons in the European Union at the time of submission of the designation application (prevalence criterion); or |
| | • | | the medicinal product is intended for the diagnosis, prevention or treatment of a life-threatening, seriously debilitating or serious and chronic condition, and without incentives it is unlikely that the revenue after marketing of the medicinal product would cover the investment in its development; and |
| | • | | either no satisfactory method of diagnosis, prevention or treatment of the condition concerned is authorized, or, if such method exists, the medicinal product will be of significant benefit to those affected by the condition. |
Companies with an orphan designation for a medicinal product benefit from incentives such as:
| | • | | protocol assistance (scientific advice for orphan medicines during the product-development phase); |
| | • | | direct access to centralized marketing authorization and 10-year marketing exclusivity; |
56
| | • | | financial incentives (fee reductions or exemptions); and |
| | • | | national incentives detailed in an inventory made available by the European Commission. |
Since December 2011, orphan medicinal products are eligible for the following level of fee reductions:
| | • | | full (100%) reduction for small- and medium-sized enterprises, or SMEs, for protocol assistance and follow-up, full reduction for non-SME sponsors for pediatric-related assistance and 75% reduction for non-SME sponsors for non-pediatric assistance; |
| | • | | To determine which companies are eligible for SME incentives, the EMA applies the definition of micro, small and medium-sized enterprises provided in the Commission of the European Communities’ Commission Recommendation 2003/36/EC. |
| | • | | To qualify for assistance, companies must be established in the European Economic Area, employ less than 250 employees and have an annual turnover of not more than €50 million or an annual balance sheet total of not more than €43 million. |
| | • | | full reduction for pre-authorization inspections; |
| | • | | full reduction for SMEs and 10% reduction for non-SME sponsors for new applications for Community marketing authorization; and |
| | • | | full reduction for post-authorization activities including annual fees only to small and medium sized enterprises in the first year after granting a marketing authorization. |
Canadian Regulatory Process
Authorization to Market. Therapeutic products can be marketed in Canada after they have been subject to a review to assess their safety, efficacy and quality. A New Drug Submission must be submitted to Health Canada for review, and a Notice of Compliance, or NOC, and a Drug Identification Number, or DIN, must be received by the sponsor prior to marketing a product in Canada. Responsibility for review of pharmaceutical drug products resides with Health Canada’s Therapeutic Products Directorate, or TPD, while responsibility for review of biological products is under the Biologics, Radiopharmaceuticals and Genetic Therapies Directorate, or BGTD. An active DIN is required for any product being marketed in Canada.
Changes to Market Authorization. There are four classes of changes to existing market authorizations in Canada. Level 1 changes are considered “significantly different” and have the potential to impact safety, efficacy, quality or effectiveness of the product. These require the filing of a Supplemental New Drug Submission, and an NOC must be issued by Health Canada prior to implementation of the change. Level 2 changes are not considered “significant,” but a “Notifiable Change” submission must be filed to Health Canada for review, and approval is provided via a “No Objection” letter to the sponsor. Level 3 changes have minimal potential to impact safety, quality or effectiveness and can be made without prior approval of Health Canada; a summary of these changes is reported to Health Canada with the sponsor’s Annual Drug Notification. Level 4 changes are implemented without any notification to Health Canada, based on no expectation of risk.
Clinical Trials. A Clinical Trial Application, or CTA, must be submitted to Health Canada prior to conducting any study protocol that proposes the use of a new product, or the use of an existing product, where the indication, target population, route of administration or dosing differs from the current market authorization. The CTA should include summaries of pre-clinical and clinical studies conducted and (if applicable) chemistry, manufacturing and control data, and is submitted to either TPD (for drug products) or BGTD (for biological products) for review. The TPD or BGTD are responsible for assessing protection and safety of the participants as well as quality of the product; they will issue a “No Objection” letter to sponsors for studies deemed acceptable. Research ethics board approval for each trial is also required prior to conduct of the study.
Establishment Licensing. All establishments in Canada which are involved in the fabrication, packaging/labeling, testing, import, distribution or warehousing of drug products, must have a current establishment license (once an establishment license is issued, an annual report must be submitted by April 1 of each year to maintain the effectiveness of that license). As an importer/distributor, part of the licensing requirements include demonstration that any foreign (non-Canadian) facilities involved in fabrication, packaging/labeling or testing of products imported/distributed under the license comply with cGMP.
Post-Approval Requirements. The Health Products and Food Branch Inspectorate of Health Canada periodically inspects licensed establishments in Canada to verify compliance with cGMP. Manufacturers and importers are required to monitor the safety
57
and quality of their products and must report adverse reactions to the Marketed Health Products Directorate in accordance with a prescribed timeline and format.
Pharmaceutical Pricing and Reimbursement
In the United States and other countries, sales of any products for which we receive regulatory approval for commercial sale will depend in part on the availability of reimbursement from third-party payors. Third-party payors include government health programs, managed care providers, private health insurers and other organizations. These third-party payors are increasingly challenging the price and examining the cost-effectiveness of medical products and services. In addition, significant uncertainty exists as to the reimbursement status of newly approved healthcare products. Our products may not be considered cost effective. Adequate third-party reimbursement may not be available to enable us to maintain price levels sufficient to realize an appropriate return on its investment in product development.
In the United States, our products are reimbursed or purchased under several government programs, including Medicaid, Medicare Parts B and D, the 340B/PHS program, and pursuant to our contract with the Department of Veterans Affairs. Medicaid is a joint state and federal government health plan that provides covered outpatient prescription drugs for low-income individuals. Under Medicaid, drug manufacturers pay rebates to the states based on utilization data provided by the states. The rebate amount for branded drugs had been equal to a minimum of 15.1% of the AMP or AMP less BP, whichever is greater. Effective January 1, 2010, the healthcare reform law increased the size of the Medicaid rebates paid by drug manufacturers for most brand drugs to a minimum of 23.1% of the AMP, with limitation of this increase on certain drugs, including, for example, certain clotting factors, to a minimum of 17.1%. In 2010, the healthcare reform law also extended this rebate obligation to prescription drugs covered by Medicaid managed care organizations. In addition, the statutory definition of AMP changed in 2010 as a result of the healthcare reform law. In November 2010, CMS withdrew previously issued regulations defining AMP, and in February 2012, it issued proposed regulations, which are not yet finalized. We believe we are making reasonable assumptions regarding our reporting obligations with respect to this new definition, but in the absence of final regulations from CMS, the adequacy of our assumptions is not certain.
Medicare Part B reimburses providers for drugs provided in the outpatient setting based upon ASP. Recent federal government reforms to Medicare Part B have reduced the reimbursement rates for IVIG. Beginning January 1, 2008, CMS reduced the reimbursement for separately covered outpatient drugs and biologics, including IVIG in the hospital outpatient setting, from ASP + 6% to ASP + 5%, using 2006 Medicare claims data as a reference for this reduction. CMS reduced this reimbursement further in 2009 to ASP + 4%, using aggregate hospital cost report data as a reference for the reduction. For 2010, the rate remained as ASP + 4%, based on a cost-based methodology that also involved reallocating certain overhead costs from packaged drugs to unpackaged drugs. In 2011, relying on the 2010 methodology, CMS increased the rate to ASP + 5%. For 2012, CMS decreased the rate to ASP + 4%.
Medicare Part D is a partial, voluntary prescription drug benefit created by the federal government primarily for persons 65 years old and over. The Part D drug program is administered through private insurers that contract with CMS. Government payment for some of the costs of prescription drugs may increase demand for any products for which we receive marketing approval. However, to obtain payments under this program, we are required to negotiate prices with private insurers operating pursuant to federal program guidance. These prices may be lower than we might otherwise obtain. In addition, beginning in 2011, the healthcare reform law generally required that we provide a 50% discount to patients who have expended certain amounts for drugs and therefore fall within the Medicare Part D coverage gap.
Some payors, including Medicare Part D plans, some state Medicaid programs, and many private health insurers and self-insured health plans reimburse providers for drugs based upon a discount off of the AWP. We do not publish an AWP for any of our products. We may be at a competitive disadvantage where providers are reimbursed on an AWP basis and competitors’ products are reimbursed at higher rates than their corresponding products.
The availability of federal funds to pay for our products under the Medicaid and Medicare Part B programs requires that we extend discounts under the 340B/PHS drug pricing program. The 340B drug pricing program extends discounts to a variety of community health clinics and other specified entities that receive health services grants from the PHS, as well as hospitals that serve a disproportionate share of certain low income individuals. The PHS ceiling price cannot exceed the AMP (as reported to CMS under the Medicaid drug rebate program) less the Medicaid unit rebate amount. We have entered into a PPA with the government in which we agree to participate in the 340B/PHS program by charging eligible entities no more than the PHS ceiling price for drugs intended for outpatient use. The healthcare reform law expands the number of qualified 340B entities eligible to purchase the products for outpatient use. The healthcare reform law also imposes a “must sell” obligation on manufacturers that will require manufacturers to offer their products to eligible entities at legally-mandated discount prices if such products are “made available to any other purchaser at any other price.” The healthcare reform law imposes this obligation by requiring HHS to add the requirement to the 340B/PHS program agreements that manufacturers must execute with HHS. Rulemaking to implement this obligation is not yet complete, and as a result, the full impact of the changes is not yet certain. However, the new provision could be implemented in a manner that requires
58
us to allocate more of our products for sale under the 340B program in order to maintain the availability of federal funds to pay for their products under Medicaid and Medicare Part B coverage. Further regulatory rule making is required to define this new requirement. Additional legislative changes to the 340B program have been proposed, though it is too early to determine which changes will be adopted or what their impact will be.
We make our products available for purchase by authorized government users of the Federal Supply Schedule, or FSS, pursuant to their FSS contracts with the Department of Veterans Affairs. Under the Veterans Health Care Act of 1992, companies are required to offer discounted FSS contract pricing to four federal agencies — the Department of Veterans Affairs, the Department of Defense, the Coast Guard and the PHS (including the Indian Health Service) — for federal funding to be made available for reimbursement of products under the Medicaid program and products eligible to be purchased by those four federal agencies. FSS pricing to those four federal agencies must be equal to or less than the ceiling price, which is, at a minimum, 24% off the non-federal AMP for the prior fiscal year.
The healthcare reform law imposes a fee on manufacturers and importers of branded drugs and biologics based on their sales to United States government health programs. An aggregate fee of $2.8 billion will be imposed on all covered entities for 2012. The aggregate fee will be allocated among applicable manufacturers and importers based on their relative sales to government health programs. The aggregate fee will increase to $4.1 billion for 2018 and is scheduled to be reduced to $2.8 billion for 2019. Beginning in 2013, the healthcare reform law also imposes a new excise tax on many medical devices equal to 2.3% of the sales price, and excludes devices generally purchased by the general public at retail for individual use. In addition, the Prescription Drug User Fee Act, or PDUFA, first enacted in 1992, sets forth user fees that pharmaceutical and biological companies pay to the FDA for: certain applications for approvals of drugs and biologicals; the establishments where the products are made; and the products themselves. The fees under PDUFA cover a substantial portion of the FDA’s operating budget, and the measure also addresses aspects of the regulatory approval process, such as timing and procedures. PDUFA is subject to reauthorization by Congress in 2012. In January 2012, after a lengthy process involving significant industry input, the FDA submitted its final recommendations to Congress for PDUFA reauthorization, which include not only a prescription drug user fee program, but also two new user fee programs for human generic drugs and for more biosimilar biological products.
The marketability of any products for which we receive regulatory approval for commercial sale may suffer if the government and third-party payors fail to provide adequate coverage and reimbursement. Federal, state and local governments in the United States have enacted and continue to consider additional legislation to limit the growth of healthcare costs, including the costs of prescription drugs. Existing and future legislation could limit payments for biologics, such as the drug candidates that we are developing, including possibly permitting the federal government to negotiate prices directly with manufacturers. In addition, an increasing emphasis on managed care in the United States has increased and will continue to increase the pressure on pharmaceutical pricing. For a discussion of certain risks related to reimbursement and pricing, see Item 3 of this Part I, “Key Information — D. Risk Factors — Risks Relating to the Healthcare Industry — The implementation of the 2010 health care reform law in the U.S. may adversely affect our business.”
Other Governmental Regulation
Our operations and many of the products that we manufacture or sell are subject to extensive regulation by numerous other governmental agencies, both within and outside the United States. In the United States, apart from the agencies discussed above, our facilities, operations, employees, products (their manufacture, sale, import and export) and services are regulated by the Drug Enforcement Agency, the Environmental Protection Agency, the Occupational Health & Safety Administration, the Department of Agriculture, the Department of Labor, Customs and Border Protection, the Transportation Security Administration, the Department of Commerce, the Department of Treasury, the DOJ, the U.S. Office of Foreign Assets Control and others. State agencies also regulate our facilities, operations, employees, products and services within their respective states. Government agencies outside the United States also regulate public health, product registration, manufacturing, environmental conditions, labor, exports, imports and other aspects of our global operations. For further discussion of the impact of regulation on our business, see Item 3 of this Part I, “Key Information — D. Risk Factors — Risks Relating to the Healthcare Industry — Certain of our business practices are subject to scrutiny by regulatory authorities, as well as to lawsuits brought by private citizens under federal and state laws. Failure to comply with applicable law or an adverse decision in lawsuits may result in adverse consequences to us.”
| Item 4.A. | UNRESOLVED STAFF COMMENTS |
None.
| Item 5. | OPERATING AND FINANCIAL REVIEW AND PROSPECTS |
The following is a review of our financial condition and results of operations as of December 31, 2011 and 2010, and for the three years ended December 31, 2011, and of the key factors that have affected or are expected to be likely to affect our ongoing
59
and future operations. You should read the following discussion and analysis in conjunction with our audited consolidated financial statements and the accompanying notes included elsewhere in this annual report on Form 20-F.
Some of the information contained in this discussion, including information with respect to our plans and strategies for our business and our expected sources of financing, contain forward-looking statements that involve risk and uncertainties. You should read “Cautionary Statement Regarding Forward-Looking Statements” for a discussion of the risks related to those statements. You should also read Item 3 of this Part I, “Key Information — Risk Factors” for a discussion of certain factors that may affect our business, financial condition and results of operations.
We have prepared our audited consolidated financial statements as of December 31, 2011 and 2010, and for the three years ended December 31, 2011 in accordance with IFRS, as issued by the IASB. The financial information and related discussion and analysis contained in this item are presented in euro except as otherwise specified. Unless otherwise specified the financial information analysis in this annual report on Form 20-F is based on our actual audited consolidated financial statements as of December 31, 2011 and 2010, and for the three years ended December 31, 2011.
See “Presentation of Financial and Other Information” for further information on our presentation of financial information.
Subsequent Events
On February 29, 2012, we entered into the Amended and Restated Senior Credit Agreement, which provided for the repricing of all of the Original Senior Term Loans and the Original Revolving Facilities. The Amended and Restated Senior Credit Agreement provides for the Amended Senior Term Loans aggregating $2.3 billion and €420 million, and the Amended Revolving Credit Facilities in the amounts of $140 million, €22 million and the $35 million equivalent in multicurrencies. In addition to repricing, the Amended and Restated Credit Agreement provides for the reduction of interest rates, the removal of certain financial and negative covenants, the amendment of the leverage ratio restricting the distribution of dividends and voluntary debt repayment through the early amortization of $240 million. For a summary of the material terms of the Amended and Restated Senior Credit Agreement, see “— B. Liquidity and Capital Resources — Sources of Credit — Amended and Restated Senior Credit Agreement” below.
On March 15, 2012, our subsidiary, Gri-Cel, S.A., acquired 51% of the share capital of Araclon Biotech, S.L., or Araclon. Araclon is primarily involved in the research and development of therapies and methods for the diagnosis of degenerative illnesses, with a particular concentration on Alzheimer’s disease. This acquisition reinforces our commitment to research and development of therapies to fight Alzheimer’s disease.
Factors Affecting the Comparability of Our Results of Operations
We believe that the comparability of our financial results between the years presented is significantly impacted by our acquisition of Talecris.
On June 1, 2011, we completed our acquisition of 100% of the share capital of Talecris, for a total of $3.7 billion. The acquisition consideration consisted of a combination of cash consideration of $2.5 billion and non-cash consideration, through the issuance of our new Class B shares, of $1.2 billion.
The information for the year ended December 31, 2011 includes seven months of activity of the former Talecris companies, whereas the information for the year ended December 31, 2010 includes only the activities of the pre-acquisition Grifols Group companies.
The acquisition has been accounted for using the acquisition method pursuant to IFRS 3 (revised), Business Combinations. Under the acquisition method, assets and liabilities are recorded at their fair value on the date of purchase and the total purchase price is allocated to the tangible and intangible assets acquired and liabilities assumed. As of the date of the preparation of our consolidated financial statements we do not have all of the necessary information to determine the definitive fair value of intangible assets, liabilities and contingent liabilities acquired in connection with the business combination. A final determination of these fair values will reflect, among other things, our consideration of a final valuation based on the actual net tangible and intangible assets, such as acquired in-process research and development, customer relationships, developed and core technology, intellectual property, patents and trade names and contingent liabilities, that exist as of the closing date of the acquisition. The fair values determined of December 31, 2011 for the net assets acquired and goodwill are provisional and we may adjust such values.
60
Total costs incurred in connection with the acquisition amounted to €61.3 million. For the years ended December 31, 2010 and 2011 costs incurred in connection with the acquisition amounted to €17.0 million and €44.3 million, respectively.
Additionally, we incurred significant indebtedness in connection with the consummation of the acquisition, including the issuance of our Notes and borrowings under the Original Senior Credit Agreement, and our total indebtedness and related interest expenses is, and will continue to be, significantly higher than in previous periods. Finance expenses increased from €49.7 million in the year ended December 31, 2010 to €200.6 million in the year ended December 31, 2011.
Additional information with respect to the acquisition is set forth in Note 3 to our audited consolidated financial statements for the year ended December 31, 2011, starting on page F-1 of this annual report on Form 20-F.
Factors Affecting Our Financial Condition and Results of Operations
Price Controls
Certain healthcare products, including plasma derivative products, are subject to price controls in many of the markets where they are sold, including Spain and other countries in the European Union. The existence of price controls over these products has adversely affected, and may continue to adversely affect, our ability to maintain or increase our prices and gross margins.
As a result of the acquisition, we have significantly expanded our presence in the United States. The United States is the principal market in the world for plasma derivative products and prices for plasma derivative products are currently not regulated, with the exception of certain government healthcare programs, such as the 340B/PHS program (although prices are subject to price pressures from GPOs and insurance companies).
Plasma Supply Constraints
Plasma is the key raw material used in the production of plasma-derived products. Our ability to continue to increase our revenue depends substantially on increased access to plasma. We obtain our plasma primarily from the United States through our 147 plasma collection centers and, to a much lesser extent, through agreements with third parties.
A continued increase in demand for plasma products could lead to industry supply constraints. In response, we and certain of our competitors and independent suppliers could open a number of new plasma collection centers.
We have 147 FDA-licensed plasma collection centers located across the United States. We have expanded our plasma collection network through a combination of organic growth and acquisitions and the opening of new plasma collection centers. Our acquisitions of SeraCare (now renamed Biomat USA) in 2002; PlasmaCare, Inc. in 2006; eight plasma collection centers from a subsidiary of Baxter in 2006; four plasma collection centers from Bio-Medics, Inc. in 2007; and one plasma collection center from Amerihealth Plasma LLC in 2008 have given us reliable access to United States source plasma. Our acquisition of Talecris in June 2011 expanded our network by an additional 67 centers. In 2011, our plasma collection centers collected approximately 5.9 million liters of plasma (including specialty plasma). Our expanded network of plasma collection centers is capable of increasing the annual plasma collection capacity to 6.5 million liters of plasma per year. The actual volume of plasma that we are able to collect in the future may be less or more than these amounts. See “Cautionary Statement Regarding Forward-Looking Statements.”
We believe that our plasma requirements through 2015 will be met through: (i) plasma collected through our plasma collection centers and (ii) approximately 800,000 liters of plasma per year to be purchased from third-party suppliers pursuant to various plasma purchase agreements.
Past-due Receivables
For sales of our products to hospitals and clinics that are part of the social security systems of Spain, Portugal, Italy and certain other countries, we depend upon government health agencies for payment. We have faced significant delays in the collection of payment for our products in such countries. The adoption by Spain, effective December 31, 2004, of a European Union directive that requires payment of interest on receivables that are more than 60 days overdue has resulted in a significant decrease in collection delays from these hospitals and clinics. However, we cannot assure that this trend will continue or that the present receivables aging levels for these hospitals and clinics will not increase again, particularly if the funding of these hospitals and clinics is not increased sufficiently by the appropriate governmental health agencies.
The geographical redistribution of sales following the acquisition has increased our sales in countries with lower collection periods. In particular sales in Spain deceased to 13% of total sales in 2011, compared to 23% of total sales in 2010. This resulted in a
61
lower receivables aging average of 65 days at December 31, 2011, as opposed to 83 days at each of December 31, 2010 and 2009. Nonetheless, the failure to receive timely payments for the sale of our products negatively affects our working capital levels and may require us to obtain more short-term financing than we would otherwise need.
Interest and Currency Risk
A significant portion of our interest-bearing debt at December 31, 2011 bore interest at a floating rate, at a spread over LIBOR for our U.S. dollar-denominated debt and at a spread over EURIBOR for our euro-denominated debt. As a result, increases in the applicable floating interest rates would increase our interest expense and reduce our net cash flow. See Item 11 of this Part I, “Quantitative and Qualitative Disclosures About Market Risk — Interest Rate Risk.”
Our functional currency is the euro and a majority of our sales for the year ended December 31, 2011 was denominated in U.S. dollars. Accordingly, our principal foreign currency exposure relates to the U.S. dollar. We are also exposed to risk based on the payment of U.S. dollar-denominated indebtedness. At December 31, 2011, approximately $3.6 billion of our indebtedness was denominated in U.S. dollars (excluding undrawn availability under the Original Revolving Credit Facilities as of such date).
We are also exposed to currency fluctuations with respect to other currencies such as the Canadian dollar, British pound, Brazilian real, Malaysian ringgit and the Argentine, Mexican and Chilean pesos, although to a significantly lesser degree than the U.S. dollar. See Item 11 of this Part I, “Quantitative and Qualitative Disclosures About Market Risk — Currency Risk.”
Other Factors
Our financial and operating prospects can also be significantly affected by a number of other internal and external factors, such as unfavorable changes in governmental regulation or interpretation; increased competition; the inability to hire or retain qualified personnel necessary to sustain planned growth; the loss of key senior managers; problems in developing some of the international operations; and lack of sufficient capital, among others.
Critical Accounting Policies
The preparation of consolidated financial statements in accordance with IFRS requires us to make estimates and judgments in certain circumstances that affect the reported amounts of assets, liabilities, revenue, expenses and the related disclosures of contingent assets and liabilities. A detailed description of our significant accounting policies is included in Note 4 to our audited consolidated financial statements.
We believe that certain of our accounting policies are critical because they are the most important to the preparation of our consolidated financial statements. These policies require our most subjective and complex judgments, often requiring the use of estimates about the effects of matters that are inherently uncertain. We apply estimation methodologies consistently from year to year. Other than changes required due to the issuance of new accounting guidance, there have been no significant changes in our application of critical accounting policies during the periods presented. We periodically review our critical accounting policies and estimates with the Audit Committee of our Board. The following is a summary of accounting policies that we consider critical to our consolidated financial statements.
We apply the revised IFRS 3 “Business combinations” in transactions made subsequent to January 1, 2010. We apply the acquisition method for business combinations. The acquisition date is the date on which we obtain control of the acquiree.
The consideration transferred in a business combination is determined at the acquisition date and calculated as the sum of the fair values of the assets transferred, the liabilities incurred or assumed, the equity interests issued and any asset of liability contingent consideration depending on future events or the compliance of certain conditions in exchange for the control of the business acquired.
The consideration transferred excludes any payment that does not form part of the exchange for the acquired business. Acquisition-related costs are accounted for as expenses when incurred. Share increase costs are recognized as equity when the increase takes place and borrowing costs are deducted from the financial liability when it is recognized.
At the acquisition date, we recognize at fair value the assets acquired and the liabilities assumed. Liabilities assumed include contingent liabilities, provided that they represent present obligations arising from past events and their fair value can be measured reliably. We also recognize indemnification assets transferred by the seller, at the same time and following the same measurement
62
criteria as the item that is subject to indemnification from the acquired business, taking into consideration, where applicable, the insolvency risk and any contractual limit on the indemnity amount.
This criterion does not include non-current assets or disposable groups of assets which are classified as held for sale, long-term defined benefit employee benefit liabilities, share-based payment transactions, deferred tax assets and liabilities and intangible assets arising from the acquisition of previously transferred rights.
Assets and liabilities assumed are classified and designated for subsequent measurement in accordance with the contractual terms, economic conditions, operating or accounting policies and other factors that exist at the acquisition date, except for leases and insurance contracts.
The excess between the consideration transferred and the value of net assets acquired and liabilities assumed, less the value assigned to non-controlling interests, is recognized as goodwill. Where applicable, any shortfall, after evaluating the consideration transferred, the value assigned to non-controlling interests and the identification and measurement of net assets acquired, is recognized in profit and loss.
It has been possible to measure the Talecris business combination only provisionally. Therefore, the net identifiable assets have initially been recognized at their provisional value, and any adjustments made during the measurement period have been recorded as if they had been known at that date. Where applicable, comparative figures for the prior year have been restated. Adjustments to the provisional values only reflect information relating to events and circumstances existing at the acquisition date and which, had they been known, would have affected the amounts recognized at that date. Once this period has elapsed, adjustments are made to initial values only when errors must be corrected. Any potential benefits arising from tax losses and other deferred tax assets of the acquiree that were not recorded because they did not qualify for recognition at the acquisition date are accounted for as income tax income, provided the adjustments were not made during the measurement period.
The contingent consideration is classified in accordance with underlying contractual terms as a financial asset or financial liability, equity instrument or provision. Provided that subsequent changes to the fair value of a financial asset or financial liability do not relate to an adjustment during the measurement period, they are recognized in consolidated profit and loss or other comprehensive income. The contingent consideration classified, where applicable, as equity is not subject to subsequent change, with settlement being recognized in equity. The contingent consideration classified, where applicable, as a provision is recognized subsequently in accordance with the relevant measurement standard.
| (b) | Useful lives and amortization rates of property, plant and equipment and intangible assets |
Property, plant and equipment are depreciated by allocating the depreciable amount of an asset on a systematic basis over their useful lives. The depreciable amount is the cost or deemed cost less its residual value. We determine the depreciation charge separately for each component of property, plant and equipment with a cost that is significant in relation to the total cost of the asset.
Depreciation of property, plant and equipment is determined based on the criteria outlined below:
| | | | | | |
| | | Depreciation
Method | | | Rates |
Buildings | | | Straight line | | | 1%-10% |
Technical equipment and machinery | | | Straight line | | | 7%-20% |
Equipment and furniture | | | Straight line | | | 10%-30% |
Other property, plant and equipment | | | Straight line | | | 10%-33% |
We review residual values, useful lives and depreciation methods at each financial year end. Changes to initially established criteria are accounted for as a change in accounting estimates.
We assess whether the useful life of each intangible asset acquired is finite or indefinite. An intangible asset is regarded by us as having an indefinite useful life when there is no foreseeable limit to the period over which the asset will generate net cash inflows.
Intangible assets with indefinite useful lives and goodwill are not amortized but tested for impairment at least annually.
63
Intangible assets with finite useful lives are amortized by allocating the depreciable amount of an asset on a systematic basis over its useful life, by applying the following criteria:
| | | | | | |
| | | Amortization
Method | | | Estimated
Years of
Useful Life |
Development expenses | | | Straight line | | | 3 - 5 |
Concessions, patents, licenses, trademarks and similar | | | Straight line | | | 5 - 15 |
Computer Software | | | Straight line | | | 3 - 6 |
Other intangible assets | | | Straight line | | | 30 |
The depreciable amount is the cost or deemed cost of an asset less its residual value.
We do not consider the residual value of our intangible assets material. We review the residual value, useful life and amortization method for intangible assets at each financial year end. Changes to initially established criteria are accounted for as a change in accounting estimates.
| (c) | Internally generated intangible assets |
Any research and development expenditure incurred during the research phase of projects is recognized as an expense when incurred.
Costs related with development activities are capitalized when:
| | • | | we have technical studies justifying the feasibility of the production process; |
| | • | | we have undertaken a commitment to complete production of the asset whereby it is in condition for sale or internal use; |
| | • | | the asset will generate sufficient future economic benefits; and |
| | • | | we have sufficient financial and technical resources to complete development of the asset and have developed budget and cost accounting control systems that allow budgeted costs, introduced changes and costs actually assigned to different projects to be monitored. |
The cost of internally generated assets is calculated using the same criteria established for determining production costs of inventories. The production cost is capitalized by allocating the costs attributable to the asset to self-constructed assets in the consolidated income statement.
Costs incurred in the course of activities which contribute to increasing the value of the different businesses in which we operate are expensed as they are incurred. Replacements or subsequent costs incurred on intangible assets are generally recognized as an expense, except where they increase the future economic benefits expected to be generated by the assets.
| (d) | Impairment of goodwill and intangible assets with indefinite useful lives |
We evaluate whether there are indications of possible impairment losses on non-financial assets subject to amortization or depreciation to verify whether the carrying amount of these assets exceeds the recoverable amount. Irrespective of any indication of impairment, we test for possible impairment of goodwill, intangible assets with indefinite useful lives and intangible assets with finite useful lives not yet available for use, at least annually.
The recoverable amount is the higher of an asset’s fair value less costs to sell and its value in use. An asset’s value in use is calculated based on an estimate of the future cash flows expected to derive from the use of the asset, expectations about possible variations in the amount or timing of those future cash flows, the time value of money, the price for bearing the uncertainty inherent in the asset and other factors that market participants would reflect in pricing the future cash flows deriving from the asset.
Negative differences arising from comparison of the carrying amounts of the assets with their recoverable amounts are recognized in the consolidated income statement.
Recoverable amount is determined for each individual asset, unless the asset does not generate cash inflows that are largely independent of those from other assets or groups of assets. If this is the case, recoverable amount is determined for the cash-generating unit, or CGU, to which the asset belongs.
64
Impairment losses recognized for cash-generating units are first allocated to reduce, where applicable, the carrying amount of goodwill allocated to the CGU and then to the other assets of the CGU pro rata on the basis of the carrying amount of each asset. The carrying amount of each asset may not be reduced below the highest of its fair value less costs to sell, its value in use and zero.
At the end of each reporting period, we assess whether there is any indication that an impairment loss recognized in prior periods may no longer exist or may have decreased. Impairment losses on goodwill are not reversible. Impairment losses for other assets are only reversed if there has been a change in the estimates used to calculate the recoverable amount of the asset.
A reversal of an impairment loss is recognized in consolidated profit or loss. The increase in the carrying amount of an asset attributable to a reversal of an impairment loss may not exceed the carrying amount that would have been determined, net of depreciation or amortization, had no impairment loss been recognized.
The reversal of an impairment loss for a CGU is allocated to its assets, except for goodwill, pro rata with the carrying amounts of those assets, with the limit per asset of the lower of its recoverable value and the carrying amount which would have been obtained, net of depreciation, had no impairment loss been recognized.
Details of and movement in goodwill for the year ended December 31, 2011 are as follows:
| | | | | | | | | | | | | | | | | | | | |
Net value | | Balances at
December 31,
2010 | | | Business
Combinations | | | Impairment | | | Translation
Differences | | | Balances at
December 31,
2011 | |
Grifols UK, Ltd. | | | 7,982 | | | | 0 | | | | 0 | | | | 243 | | | | 8,225 | |
Grifols Italia, S.p.A. | | | 6,118 | | | | 0 | | | | 0 | | | | 0 | | | | 6,118 | |
Biomat USA, Inc. | | | 113,052 | | | | 0 | | | | 0 | | | | 3,696 | | | | 116,748 | |
PlasmaCare, Inc. | | | 38,464 | | | | 0 | | | | 0 | | | | 1,258 | | | | 39,722 | |
Woolloomooloo Holdings Pty Ltd. (Australia) | | | 23,832 | | | | 0 | | | | (13,000 | ) | | | 38 | | | | 10,870 | |
Talecris Biotherapeutics, Inc.(1) | | | 0 | | | | 1,538,723 | (2) | | | 0 | | | | 174,695 | | | | 1,713,418 | |
| | | | | | | | | | | | | | | | | | | | |
| | | 189,448 | | | | 1,538,723 | | | | (13,000 | ) | | | 179,930 | | | | 1,895,101 | |
| | | | | | | | | | | | | | | | | | | | |
| (1) | The name of Talecris Biotherapeutics, Inc. was changed to Grifols Therapeutics Inc. in August 2011. |
| (2) | For more information, see our audited consolidated financial statements starting on page F-1 of this annual report on Form 20-F and Note 3(a) to such statements. |
Until 2010, goodwill was allocated to each of our CGUs in accordance with their respective business segment and on a geographical basis, those being the lowest levels at which goodwill is controlled for management purposes and lower than operating segments. In 2010, PlasmaCare, Inc. was integrated into the management of Biomat USA, Inc. for the purpose of impairment testing.
Goodwill was allocated to the CGUs as follows:
| | • | | United Kingdom: bioscience segment |
| | • | | Italy: bioscience segment |
| | • | | United States: bioscience segment |
| | • | | Australia: mainly to the diagnostics segment |
As a result of the acquisition of Talecris, and for impairment testing purposes, we combine the CGUs allocated to the Bioscience segment, grouping them together at segment level, because substantial synergies are expected to arise out of the acquisition of Talecris, in light of the vertical integration of the business and the lack of an independent organized market for the products.
Goodwill resulting from the Talecris acquisition is still provisional as the estimation of the fair value of assets, liabilities and contingent liabilities of the business acquired is in progress
The recoverable amount of a CGU is determined based on its value in use. These calculations use cash flow projections based on the financial budgets approved by management. Cash flows as of the year in which stable growth has been reached are extrapolated using the estimated growth rates indicated below.
The key assumptions used in calculating values in use for the year ended December 31, 2011 and for the year ended December 31, 2010 were as follows:
65
| | | | | | | | |
| | | December 31, 2011 | |
| | | Growth rate | | | Pre-tax
discount rate | |
Bioscience | | | 2.0 | % | | | 11.7 | % |
Diagnostic | | | 2.0 | % | | | 11.4 | % |
| |
| | | December 31, 2010 | |
| | | Growth rate | | | Pre-tax
discount rate | |
Bioscience | | | 2.0% - 3.0% | | | | 10.5% - 10.9% | |
Diagnostic | | | 2.0% | | | | 10.4% | |
Management determined budgeted gross margins based on past experience and forecast market development. Average weighted growth rates are consistent with the forecasts included in industry reports. The discount rate used reflects specific risks related to the CGU.
As the recoverable amount of the CGUs is much higher than the carrying amount of the assets, specific information from the impairment test sensitivity analysis is not included.
Based on the results of the impairment test performed on the CGU in Australia, we recognized impairment of €13 million for goodwill in 2011.
At December 31, 2011, our stock market capitalization totaled €3,723 million. This amount is greater than our net equity book value.
Inventories are measured at the lower of cost and net realizable value. The cost of inventories comprises all costs of purchase, costs of conversion and other costs incurred in bringing the inventories to their present location and condition.
The costs of conversion of inventories include costs directly related to the units of production and a systematic allocation of fixed and variable production overheads that are incurred in converting. Fixed production overheads are allocated based on the higher of normal production capacity or actual level of production.
The cost of raw materials and other supplies, the cost of merchandise and costs of conversion are allocated to each inventory unit on a first-in, first-out, or FIFO, basis. We use the same cost model for all inventories of the same nature and with a similar use.
Volume discounts extended by suppliers are recognized as a reduction in the cost of inventories when it is probable that the conditions for discounts to be received will be met. Discounts for prompt payment are recognized as a reduction in the cost of the inventories acquired.
The cost of inventories is adjusted against profit and loss when cost exceeds the net realizable value. Net realizable value is considered as detailed below.
| | • | | Raw materials and other supplies: replacement cost. Nevertheless, raw materials are not written down below cost if the finished goods into which they will be incorporated are expected to be sold at or above cost of production. |
| | • | | Goods for resale and finished goods: estimated selling price, less costs to sell. |
| | • | | Work in progress: the estimated selling price of related finished goods, less the estimated costs of completion and the estimated costs necessary to make the sale. |
The previously recognized reduction in value is reversed against profit and loss when the circumstances that previously caused inventories to be written down no longer exist or when there is clear evidence of an increase in net realizable value because of changed economic circumstances. The reversal of the reduction in value is limited to the lower of the cost and revised net realizable value of the inventories. Write-downs may be reversed with a credit to inventories of finished goods and work in progress and supplies.
Revenue is measured at the fair value of the consideration received or receivable for the sale of goods and services, net of VAT and any other amounts or taxes which are effectively collected on the behalf of third parties. Volume or other types of discounts for prompt payment are recognized as a reduction in revenues if considered probable at the time of revenue recognition.
66
We recognize revenue from the sale of goods when:
| | • | | We have transferred to the buyer the significant risks and rewards of ownership of the goods; |
| | • | | We retain neither continuing managerial involvement to the degree usually associated with ownership nor effective control over the goods sold; |
| | • | | The amount of revenue can be measured reliably; |
| | • | | It is probably that the economic benefits associated with the transaction will flow to us; and |
| | • | | The costs incurred or to be incurred in respect of the transaction can be measured reliably. |
We participate in government-managed Medicaid programs in the United States. We account for Medicaid rebates by recognizing an accrual at the time the sale is recorded in an amount equal to our estimate of the Medicaid rebate claims attributable to such sale. We determine the estimate of the Medicaid rebates accrual primarily based on historical experience regarding Medicaid rebates, legal interpretations of the applicable laws related to the Medicaid program and any new information regarding changes in the Medicaid programs’ regulations and guidelines that would impact the amount of the rebates. We consider outstanding Medicaid claims, Medicaid payments, and levels of inventory in the distribution channel and adjust the accrual periodically to reflect actual experience. While these rebate payments to the states generally occur on a one- to two-quarter lag, any adjustments for actual experience have not been material.
GPOs or other customers in the United States that have entered into contracts with us for purchases of Flebogamma® are eligible for a pricing discount based upon a minimum purchase quantity of Flebogamma® each month. These rebates are recorded as a reduction of sales and accounts receivable in the same month the sales are invoiced based upon a combination of actual customer purchase data and on historical experience when the actual customer purchase data is reported later in time.
Revenues associated with the rendering of service transactions are recognized by reference to the state of completion at the consolidated balance sheet date when the outcome of the transaction can be estimated reliably. The outcome of a transaction can be estimated reliably when revenues, the stage of completion, the costs incurred and the costs to complete the transaction can be estimated reliably and it is probable that the economic benefits derived from the transaction will flow to us.
When the outcome of the transaction involving the rendering of services cannot be estimated reliably, revenue is recognized only to the extent of the expenses recognized that are recoverable.
Revenue from dividends is recognized when our right to receive payment is established.
We recognize interest receivable from the different social security affiliated bodies, to which it provides goods or services, on an accruals basis, and only for those bodies to which historically claims have been made and from which interest has been collected.
| | (i) | Lessee accounting records |
We have the right to use certain assets through lease contracts.
Leases in which we assume substantially all the risks and rewards incidental to ownership are classified as finance leases, and all other leases are classified as operating leases.
We recognize finance leases as assets and liabilities at the commencement of the lease term, at the lower of the fair value of the leased asset and the present value of the minimum lease payments. Initial direct costs are added to the asset’s carrying amount. Minimum lease payments are apportioned between the finance charge and the reduction of the outstanding liability. The finance charge is allocated to each period during the lease term so as to produce a constant periodic rate of interest on the remaining balance of the liability. Contingent rents are recognized as expenses in the years in which they are incurred.
We recognize lease payments under an operating lease, excluding insurance and maintenance, as expenses on a straight-line basis unless another systematic basis is representative of the time pattern of the lessee’s benefit.
67
| | (ii) | Leasehold investments |
We classify non-current investments in properties leased from third parties using the same criteria as we use to classify property, plant and equipment. Investments are amortized over the lesser of their useful lives and the term of the lease contract, where the lease term is consistent with that established for recognition of the lease.
| | (iii) | Sale-leaseback transactions |
Any profit on sale-leaseback transactions that meet the conditions of a finance lease is deferred over the term of the lease.
When the leaseback is classified as an operating lease:
| | • | | if the transaction is at fair value, any profit or loss on the sale is recognized immediately in consolidated profit or loss for the year; or |
| | • | | if the sale price is below fair value: |
| | • | | in general, any profit or loss is recognized immediately, |
| | • | | however, if the loss is compensated for by future below-market lease payments, it is deferred in proportion to the lease payments over the period for which the asset is to be used. |
Changes in Accounting Standards
Refer to Note 2 to our audited consolidated financial statements for information on newly issued accounting standards.
Operating Results
We have included information regarding our results of operations in the following table. The subsequent discussion and analysis provides information that our management believes is relevant to an assessment and understanding of our consolidated results of operations. You are encouraged to read the following discussion and analysis of our financial condition and results of operations together with our audited consolidated financial statements and the related notes starting on page F-1 of this annual report on Form 20-F.
| | | | | | | | | | | | |
| | | Year Ended December 31, | |
| | | 2011 | | | 2010 | | | 2009 | |
Revenues | | | 1,795,613 | | | | 990,730 | | | | 913,186 | |
Changes in inventories of finished goods and work in progress | | | (35,150 | ) | | | 45,749 | | | | 73,093 | |
Self-constructed non-current assets | | | 34,548 | | | | 33,513 | | | | 41,142 | |
Supplies | | | (431,552 | ) | | | (304,818 | ) | | | (286,274 | ) |
Other operating income | | | 2,193 | | | | 1,196 | | | | 1,443 | |
Personnel expenses | | | (488,641 | ) | | | (289,008 | ) | | | (273,168 | ) |
Other operating expenses | | | (428,510 | ) | | | (205,260 | ) | | | (203,381 | ) |
Amortization and depreciation | | | (90,639 | ) | | | (45,776 | ) | | | (39,554 | ) |
Transaction costs of Talecris business combination | | | (44,352 | ) | | | (16,999 | ) | | | — | |
Non-financial and other capital grants | | | 1,304 | | | | 728 | | | | 1,188 | |
Impairment and gains/(losses) on disposal of fixed assets | | | (35,953 | ) | | | (372 | ) | | | (1,147 | ) |
| | | | | | | | | | | | |
Results from operating activities | | | 278,861 | | | | 209,683 | | | | 226,528 | |
| | | | | | | | | | | | |
Finance income | | | 5,761 | | | | 4,526 | | | | 7,067 | |
Finance expenses | | | (200,562 | ) | | | (49,660 | ) | | | (27,087 | ) |
Change in fair value of financial instruments | | | 1,279 | | | | (7,593 | ) | | | (587 | ) |
Impairment of gains/(losses) on disposal of financial instruments | | | (805 | ) | | | 91 | | | | (245 | ) |
Exchange gains/(losses) | | | (3,447 | ) | | | 1,616 | | | | (1,733 | ) |
| | | | | | | | | | | | |
Finance income and expense | | | (197,774 | ) | | | (51,020 | ) | | | (22,585 | ) |
| | | | | | | | | | | | |
Share of (profit)/loss of equity accounted investees | | | (1,064 | ) | | | (879 | ) | | | 51 | |
| | | | | | | | | | | | |
Profit before income tax from continuing operations | | | 80,023 | | | | 157,784 | | | | 203,994 | |
| | | | | | | | | | | | |
Income tax expense | | | (29,795 | ) | | | (42,517 | ) | | | (56,424 | ) |
| | | | | | | | | | | | |
Profit after income tax from continuing operations | | | 50,228 | | | | 115,267 | | | | 147,570 | |
| | | | | | | | | | | | |
Consolidated profit for the year | | | 50,228 | | | | 115,267 | | | | 147,570 | |
| | | | | | | | | | | | |
68
Year Ended December 31, 2011 Compared to Year Ended December 31, 2010
Our results of operations for the year ended December 31, 2011 include the results of the former Talecris companies effective June 2, 2011.
The following discussion and analysis contains information regarding our results of operations for the year ended December 31, 2011 as compared to the year ended December 31, 2010:
| | | | | | | | | | | | | | | | |
| | | Year Ended
December 31, | | | Change | |
| | | 2011 | | | 2010 | | | € | | | % | |
Revenues | | | 1,795,613 | | | | 990,730 | | | | 804,883 | | | | 81.2 | |
Changes in inventories of finished goods and work in progress | | | (35,150 | ) | | | 45,749 | | | | (80,899 | ) | | | (176.8 | ) |
Self-constructed non-current assets | | | 34,548 | | | | 33,513 | | | | 1,035 | | | | 3.1 | |
Supplies | | | (431,552 | ) | | | (304,818 | ) | | | (126,734 | ) | | | 41.6 | |
Other operating income | | | 2,193 | | | | 1,196 | | | | 997 | | | | 83.4 | |
Personnel expenses | | | (488,641 | ) | | | (289,008 | ) | | | (199,633 | ) | | | 69.1 | |
Other operating expenses | | | (428,510 | ) | | | (205,260 | ) | | | (223,250 | ) | | | 108.8 | |
Amortization and depreciation | | | (90,639 | ) | | | (45,776 | ) | | | (44,863 | ) | | | 98.0 | |
Transaction costs of Talecris business combination | | | (44,352 | ) | | | (16,999 | ) | | | (27,353 | ) | | | 160.9 | |
Non-financial and other capital grants | | | 1,304 | | | | 728 | | | | 576 | | | | 79.1 | |
Impairment and gains/(losses) on disposal of fixed assets | | | (35,953 | ) | | | (372 | ) | | | (35,581 | ) | | | 9564.8 | |
| | | | | | | | | | | | | | | | |
Results from operating activities | | | 278,861 | | | | 209,683 | | | | 69,178 | | | | 33.0 | |
| | | | | | | | | | | | | | | | |
Finance income | | | 5,761 | | | | 4,526 | | | | 1,235 | | | | 27.3 | |
Finance expenses | | | (200,562 | ) | | | (49,660 | ) | | | (150,902 | ) | | | 303.9 | |
Change in fair value of financial instruments | | | 1,279 | | | | (7,593 | ) | | | 8,872 | | | | (116.8 | ) |
Impairment of gains/(losses) on disposal of financial instruments | | | (805 | ) | | | 91 | | | | (896 | ) | | | (984.6 | ) |
Exchange gains/(losses) | | | (3,447 | ) | | | 1,616 | | | | (5,063 | ) | | | (313.3 | ) |
| | | | | | | | | | | | | | | | |
Finance income and expense | | | (197,774 | ) | | | (51,020 | ) | | | (146,754 | ) | | | 287.6 | |
| | | | | | | | | | | | | | | | |
Share of (profit)/loss of equity accounted investees | | | (1,064 | ) | | | (879 | ) | | | (185 | ) | | | 21.1 | |
| | | | | | | | | | | | | | | | |
Profit before income tax | | | 80,023 | | | | 157,784 | | | | (77,761 | ) | | | (49.3 | ) |
| | | | | | | | | | | | | | | | |
Income tax expense | | | (29,795 | ) | | | (42,517 | ) | | | 12,722 | | | | (29.9 | ) |
| | | | | | | | | | | | | | | | |
Profit after income tax from continuing operations | | | 50,228 | | | | 115,267 | | | | (65,039 | ) | | | (56.4 | ) |
| | | | | | | | | | | | | | | | |
Consolidated profit for the period | | | 50,228 | | | | 115,267 | | | | (65,039 | ) | | | (56.4 | ) |
| | | | | | | | | | | | | | | | |
Revenues.
Our revenues increased by 81.2% from €990.7 million in the year ended December 31, 2010 to €1,795.6 million in the year ended December 31, 2011. This increase is primarily attributable to the acquisition of Talecris in June 2011 and related expansion of our operations, increase in sales volume and revenues in our Bioscience division.
Our results of operations for the year ended December 31, 2011 reflect changes in the revenue of each of our business divisions as a percentage of our total revenues as a result of the acquisition. Revenues for the Bioscience division grew by 98.0% to €1,531.2 million in the year ended December 31, 2011, representing 85.3% of total revenue. The Diagnostic division increased its revenue by 7.6% to €117.4 million in the year ended December 31, 2011 and the Hospital division increased its revenues by 6.5% to €95.4 million in the year ended December 31, 2011. As a result of the acquisition and the increased size of our Bioscience division, revenues from the Diagnostic and Hospital divisions as a percentage of total revenue decreased from 11.0% and 9.0%, respectively, in the year ended December 31, 2010 to 6.5% and 5.3%, respectively, in the year ended December 31, 2011
The acquisition has also modified the geographic mix of our sales. In the year ended December 31, 2011, 52.9% of our recurrent revenues (which excludes revenues from sales of raw materials), totaling €948.7 million, were generated in the U.S. and Canada, while 29.3% of revenues were generated in the European Union. In 2011, revenues in the U.S. and Canada increased by 180.7% over the same period in 2010 and make North America our largest market. For the year ended December 31, 2011, 87% of our activities were generated outside of Spain, which included increases in market share in countries such as Germany and Portugal. Revenues from Spain as a percentage of total revenues decreased to 13% in the year ended December 31, 2011 as compared to 23.0% in the same period in 2010. Sales also continued to grow in the rest of the world, such as in the Asia-Pacific and Latin American
69
regions, where plasma derivative proteins have been introduced in countries such as Colombia, and represented approximately 16% of sales in 2011. We also expect increased sales in Brazil and China.
The following tables reflect a summary of revenues by each of our divisions and geographical regions for the year ended December 31, 2011 as compared to the year ended December 31, 2010:
| | | | | | | | | | | | | | | | | | | | | | | | |
Summary of Revenue by Division | | Year ended
December 31,
2011 | | | % of total
revenues | | | Year ended
December 31,
2010 | | | % of total
revenues | | | % var | | | % var CC(1) | |
Bioscience | | | 1,531,199 | | | | 85.3 | | | | 773,371 | | | | 78.1 | | | | 98.0 | | | | 107.0 | |
Diagnostic | | | 117,358 | | | | 6.5 | | | | 109,088 | | | | 11.0 | | | | 7.6 | | | | 8.4 | |
Hospital | | | 95,365 | | | | 5.3 | | | | 89,552 | | | | 9.0 | | | | 6.5 | | | | 6.7 | |
Raw Materials and Others | | | 51,691 | (2) | | | 2.9 | | | | 18,719 | | | | 1.9 | | | | 176.2 | | | | 189.6 | |
| | | | | | | | | | | | | | | | | | | | | | | | |
Total | | | 1,795,613 | | | | 100.0 | | | | 990,730 | | | | 100.0 | | | | 81.2 | | | | 88.6 | |
| | | | | | | | | | | | | | | | | �� | | | | | | | |
| (1) | Revenue variance in constant currency is determined by comparing adjusted current period revenue, calculated using prior period monthly average exchange rates, to the prior period revenue. The resulting percentage variance in constant currency is considered to be a non-IFRS financial measure. Revenue variance in constant currency calculates revenue variance without the impact of foreign exchange fluctuations. We believe that constant currency revenue variance is an important measure of our operations because it neutralizes foreign exchange impact and better illustrates the underlying change in revenues from one year to the next. We believe that this presentation provides a more useful period-over-period comparison as changes due solely to changes in exchange rates are eliminated. Revenue variance in constant currency, as defined and presented by us, may not be comparable to similar measures reported by other companies. Revenue variance in constant currency has limitations, particularly because the currency effects that are eliminated constitute a significant element of our revenue and expenses and could impact our performance significantly. We do not evaluate our results and performance without considering revenue variances in constant currency on the one hand and changes in revenue prepared in accordance with IFRS on the other. We caution the readers of this annual report on Form 20-F to follow a similar approach by considering data regarding constant currency period-over-period revenue variance only in addition to, and not as a substitute for or superior to, other measures of financial performance prepared in accordance with IFRS. We present the fluctuation derived from IFRS revenue next to the fluctuation derived from non-IFRS revenue. Because the reconciliation is inherent in the disclosure, we believe that a separate reconciliation would not provide any additional benefit. |
| (2) | In 2011, Raw Materials and Others primarily consisted of (i) amounts earned under the agreements with Kedrion, which are described further in Item 4 of this Part I, “Information on the Company — A. History and Development of the Company — Important Events — The Acquisition and Related Financing,” (ii) royalty payments from third parties and (iii) revenues from engineering activities by our subsidiary Grifols Engineering, S.A. |
| | | | | | | | | | | | | | | | | | | | | | | | |
Summary of Revenue by Region | | Year ended
December 31,
2011 | | | % of total
revenues | | | Year ended
December 31,
2010 | | | % of total
revenues | | | % var | | | % var CC(*) | |
European Union(1) | | | 526,625 | | | | 29.3 | | | | 432,191 | | | | 43.6 | | | | 21.9 | | | | 22.0 | |
Spain | | | 230,871 | | | | 12.9 | | | | 227,947 | | | | 23.0 | | | | 1.3 | | | | 1.3 | |
United States and Canada | | | 948,730 | | | | 52.9 | | | | 338,016 | | | | 34.1 | | | | 180.7 | | | | 199.7 | |
Rest of the World | | | 289,732 | | | | 16.1 | | | | 215,708 | | | | 21.8 | | | | 34.3 | | | | 37.1 | |
| | | | | | | | | | | | | | | | | | | | | | | | |
Subtotal | | | 1,765,087 | | | | 98.3 | | | | 985,915 | | | | 99.5 | | | | 79.0 | | | | 86.2 | |
Raw Materials | | | 30,526 | | | | 1.7 | | | | 4,815 | | | | 0.5 | | | | 533.9 | | | | 575.9 | |
| | | | | | | | | | | | | | | | | | | | | | | | |
Total | | | 1,795,613 | | | | 100.0 | | | | 990,730 | | | | 100.0 | | | | 81.2 | | | | 88.6 | |
| | | | | | | | | | | | | | | | | | | | | | | | |
| (1) | Revenues earned in the European Union include revenues earned in Spain. |
| * | Please see footnote (1) to the table above. |
Bioscience. Revenue for the Bioscience division, which included revenue from the former Talecris entities from June through December 2011, increased by 98.0% from €773.4 million in the year ended December 31, 2010 to €1,531.2 million in the year ended December 31, 2011. Increases in the sales volumes of all of our key plasma derivative products (including newly acquired plasma derivative products) resulting from our acquisition of Talecris was the main driver of the division’s growth, partially offset by a decline in prices, an increase in the cost of plasma, the negative impact of healthcare reforms in Europe and an unfavorable euro-U.S. dollar exchange rate.
Hospital. Revenues from the Hospital division increased by 6.5% from €89.6 million in the year ended December 31, 2010 to €95.4 million in the year ended December 31, 2011. This increase is attributable primarily to an increase in sales volumes in our
70
intravenous therapies, medical devices and hospital logistics subdivisions. This growth in overall sales volume reflects our ongoing product and geographical market diversification strategy, which includes increased contract manufacturing for third parties and the development of new medical devices. Notable achievements driving the growth in this subdivision include the launch of ten new Misterium® Clean Room projects (nine in Spain and one in Portugal), the development of StocKey®, a new automated system to optimize hospitals’ healthcare material restocking processes, and entry into a distribution contract with CareFusion, pursuant to which CareFusion has begun distributing our BlisPack® system in various European, Middle Eastern, African and Asian countries.
Sales in our Hospital division are primarily in Spain and have been affected by the current economic crisis. In particular, the weakened Spanish economy has affected the prices of our products in the intravenous therapy line and has led to decreased capital investments by hospitals.
Diagnostic. Our Diagnostic division increased revenues by 7.6% from €109.1 million in the year ended December 31, 2010 to €117.4 million in the year ended December 31, 2011. The growth in the Diagnostic division was driven primarily by its international expansion and increased sales volume for our WADiana® and Erytra® analyzers, 50 units of which were sold in Europe, Mexico, Brazil, Japan and Australia, and reagent cards, as well as entry into new exclusive distribution agreements for products produced by third parties.
Raw Materials and Others. Revenues from Raw Materials and Others increased from €18.7 million in the year ended December 31, 2010 to €51.7 million in the year ended December 31, 2011. The increase over 2010 figures is the result of (i) revenues from the agreements with Kedrion related to the acquisition of Talecris and (ii) royalty income from third parties.
Changes in inventories of finished goods and work in progress and materials consumed and supplies.
The cost of supplies increased by 41.6%, from €304.8 million in the year ended December 31, 2010 to €431.6 million in the year ended December 31, 2011. The increase in cost of supplies is due to increased manufacturing volumes as a result of the acquisition of Talecris and an increase in the cost of plasma. In addition, there was an €80.9 million variation corresponding to change in inventories of finished goods and work in progress. This decrease was the result of measures implemented by us to control inventory levels.
Self-constructed non-current assets.
Self-constructed non-current assets increased by 3.1%, from €33.5 million in the year ended December 31, 2010 to €34.5 million in the year ended December 31, 2011. Self-constructed non-current assets consists of the capitalization of personnel costs and other expenses relating to internally-generated assets (mainly development and software development).
Personnel expenses.
Personnel expenses increased by 69.1%, from €289.0 million in the year ended December 31, 2010 to €488.6 million in the year ended December 31, 2011. The increase in personnel expenses is due to the substantial increase in headcount as a result of the acquisition of Talecris and related increase in operations. As a result of the acquisition, our average headcount increased from 5,968 as of December 31, 2010 to 11,230 as of December 31, 2011. Related social security costs increased from €46.6 million in the year ended December 31, 2010 to €74.9 million in the year ended December 31, 2011.
Other operating expenses.
Other operating expenses consist of supplies and other materials, advertising, professional services, operating leases, freight, repairs and maintenance, among others. Other operating expenses increased by 108.8%, from €205.3 million in the year ended December 31, 2010 to €428.5 million in the year ended December 31, 2011. Professional fees and other expenses related to the acquisition of Talecris led to the increase. See Note 27 to our audited consolidated financial statements for further details.
Amortization and depreciation.
Depreciation and amortization of fixed assets increased by 98.0%, from €45.8 million in the year ended December 31, 2010 to €90.6 million in the year ended December 31, 2011. This increase was primarily due to the increase in our asset base as a result of the acquisition of Talecris and the amortization of intangible assets we acquired in the acquisition of Talecris.
Finance income and expense.
Net finance expense increased by 287.6% from €(51.0) million in the year ended December 31, 2010 to €(197.8) million in the year ended December 31, 2011. This increase was primarily a result of an increase in finance expense by 303.9%, from
71
€49.7 million in the year ended December 31, 2010 to €200.6 million in the year ended December 31, 2011, due to the entry into the Original Senior Credit Agreement and the issuance of our Notes in order to finance the acquisition. The increase also includes the amortization of capitalized costs relating to our debt.
Income tax expense.
In the year ended December 31, 2011, we had a profit before income tax of €80.0 million and income tax expense of €(29.8) million, which represents an effective tax rate of 37.2%. This amount includes deductions of €13.7 million relating to research and development deductions and €2.0 million for other deductions. Our effective tax rate increased from 26.9% in the year ended December 31, 2010 primarily due to the acquisition of Talecris and as a result of a greater portion of our revenues being taxed at a higher tax rate as a result of the acquisition.
Year Ended December 31, 2010 Compared to Year Ended December 31, 2009
The following table contains information regarding our results of operations for the year ended December 31, 2010 as compared to the year ended December 31, 2009:
| | | | | | | | | | | | | | | | |
| | | Year ended
December 31, | | | Change | |
| | | 2010 | | | 2009 | | | € | | | % | |
Revenues | | | 990,730 | | | | 913,186 | | | | 77,544 | | | | 8.5 | |
Changes in inventories of finished goods and work in progress | | | 45,749 | | | | 73,093 | | | | (27,344 | ) | | | (37.4 | ) |
Self-constructed non-current assets | | | 33,513 | | | | 41,142 | | | | (7,629 | ) | | | (18.5 | ) |
Supplies | | | (304,818 | ) | | | (286,274 | ) | | | (18,544 | ) | | | 6.5 | |
Other operating income | | | 1,196 | | | | 1,443 | | | | (247 | ) | | | (17.1 | ) |
Personnel expenses | | | (289,008 | ) | | | (273,168 | ) | | | (15,840 | ) | | | 5.8 | |
Other operating expenses | | | (205,260 | ) | | | (203,381 | ) | | | (1,879 | ) | | | 0.9 | |
Amortization and depreciation | | | (45,776 | ) | | | (39,554 | ) | | | (6,222 | ) | | | 15.7 | |
Transaction costs of Talecris business combination | | | (16,999 | ) | | | 0 | | | | (16,999 | ) | | | 100 | |
Non-financial and other capital grants | | | 728 | | | | 1,188 | | | | (460 | ) | | | (38.7 | ) |
Impairment and gains/(losses) on disposal of fixed assets | | | (372 | ) | | | (1,147 | ) | | | 775 | | | | (67.6 | ) |
| | | | | | | | | | | | | | | | |
Results from operating activities | | | 209,683 | | | | 226,528 | | | | (16,845 | ) | | | (7.4 | ) |
| | | | | | | | | | | | | | | | |
Finance income | | | 4,526 | | | | 7,067 | | | | (2,541 | ) | | | (36.0 | ) |
Finance expenses | | | (49,660 | ) | | | (27,087 | ) | | | (22,573 | ) | | | 83.3 | |
Change in fair value of financial instruments | | | (7,593 | ) | | | (587 | ) | | | (7,006 | ) | | | 1193.5 | |
Impairment of gains/(losses) on disposal of financial instruments | | | 91 | | | | (245 | ) | | | 336 | | | | 137.1 | |
Exchange gains/(losses) | | | 1,616 | | | | (1,733 | ) | | | 3,349 | | | | 193.2 | |
| | | | | | | | | | | | | | | | |
Finance income and expense | | | (51,020 | ) | | | (22,585 | ) | | | (28,435 | ) | | | 125.9 | |
| | | | | | | | | | | | | | | | |
Share of (profit)/loss of equity accounted investees | | | (879 | ) | | | 51 | | | | (930 | ) | | | (1823.5 | ) |
| | | | | | | | | | | | | | | | |
Profit before income tax from continuing operations | | | 157,784 | | | | 203,994 | | | | (46,210 | ) | | | (22.7 | ) |
| | | | | | | | | | | | | | | | |
Income tax expense | | | (42,517 | ) | | | (56,424 | ) | | | 13,907 | | | | (24.6 | ) |
| | | | | | | | | | | | | | | | |
Profit after income tax from continuing operations | | | 115,267 | | | | 147,570 | | | | (32,303 | ) | | | (21.9 | ) |
| | | | | | | | | | | | | | | | |
Consolidated profit for the year | | | 115,267 | | | | 147,570 | | | | (32,303 | ) | | | (21.9 | ) |
| | | | | | | | | | | | | | | | |
Revenues.
Overall revenues increased by 8.5%, from €913.2 million in 2009 to €990.7 million in 2010, driven mainly by increased revenues from our Bioscience division.
72
The following tables reflect a summary of revenues by each of our divisions and geographical regions for the year ended December 31, 2010 as compared to the year ended December 31, 2009:
| | | | | | | | | | | | | | | | | | | | | | | | |
Summary of Revenue by Division | | Year ended
December 31,
2010 | | | % of total
revenues | | | Year ended
December 31,
2009 | | | % of total
revenues | | | % var | | | % var CC(*) | |
Bioscience | | | 773,371 | | | | 78.1 | | | | 694,969 | | | | 76.1 | | | | 11.3 | | | | 7.7 | |
Diagnostic | | | 109,088 | | | | 11.0 | | | | 103,091 | | | | 11.3 | | | | 5.8 | | | | 3.4 | |
Hospital | | | 89,552 | | | | 9.0 | | | | 86,328 | | | | 9.4 | | | | 3.7 | | | | 2.9 | |
Raw Materials and Others | | | 18,719 | | | | 1.9 | | | | 28,798 | | | | 3.2 | | | | (35.0 | ) | | | (35.8 | ) |
Total | | | 990,730 | | | | 100.0 | | | | 913,186 | | | | 100.0 | | | | 8.5 | | | | 5.4 | |
| | | | | | | | | | | | | | | | | | | | | | | | |
| * | Please see footnote (1) to the table on page 70. |
| | | | | | | | | | | | | | | | | | | | | | | | |
Summary of Revenue by Region | | Year ended
December 31,
2010 | | | % of total
revenues | | | Year ended
December 31,
2009 | | | % of total
revenues | | | % var | | | % var CC(*) | |
European Union(1) | | | 432,191 | | | | 43.6 | | | | 424,590 | | | | 46.5 | | | | 1.8 | | | | 1.1 | |
Spain | | | 227,947 | | | | 23.0 | | | | 225,759 | | | | 24.7 | | | | 1.0 | | | | n/a | |
United States and Canada | | | 338,016 | | | | 34.1 | | | | 275,991 | | | | 30.2 | | | | 22.5 | | | | 17.9 | |
Rest of the World | | | 215,708 | | | | 21.8 | | | | 189,943 | | | | 20.8 | | | | 13.6 | | | | 6.9 | |
| | | | | | | | | | | | | | | | | | | | | | | | |
Subtotal | | | 985,915 | | | | 99.5 | | | | 890,524 | | | | 97.5 | | | | 37.9 | | | | | |
Raw Materials | | | 4,815 | | | | 0.5 | | | | 22,662 | | | | 2.5 | | | | (78.8 | ) | | | (79.8 | ) |
Total | | | 990,730 | | | | 100.0 | | | | 913,186 | | | | 100.0 | | | | 8.5 | | | | 5.4 | |
| | | | | | | | | | | | | | | | | | | | | | | | |
| (1) | Revenues earned in the European Union include revenues earned in Spain. |
| * | Please see footnote (1) to the table on page 70. |
Bioscience. Revenues from our Bioscience division increased by 11.3%, from €695.0 million in 2009 to €773.4 million in 2010. The increase in revenues is primarily due to increases in sales volume for each of our three main product lines. Increases in sales volume were partially offset by decreases in prices across our product lines. Revenues from sales of IVIG, albumin and Factor VIII increased 20.6%, 6.4% and 7.6%, respectively. IVIG sales growth was primarily due to increases in revenues from the United States (a 38.2% increase) and the rest of the world (a 13.8% increase), with revenues from the European Union remaining stable.
Hospital. Revenues from our Hospital division increased by 3.7%, from €86.3 million in 2009 to €89.6 million in 2010. In 2010, we recorded increases in revenues from each of our main product lines: intravenous therapy, medical devices, hospital logistics and nutrition. The key growth drivers in the Hospital division are (i) intravenous therapies, which increased 6.6% and (ii) medical devices, which increased 8.4%. The increase in revenue from intravenous therapies is primarily attributable to a 4% increase in revenues in the European Union, while growth in the medical devices product line is primarily attributable to increased sales in the European Union.
Diagnostic. Revenues from our Diagnostic division increased by 5.8%, from €103.1 million in 2009 to €109.1 million in 2010. The growth in the Diagnostic division was driven primarily by a 17.2% increase in blood bank revenue and an 18.4% increase in hemostasis revenues. The increase in blood bank revenue is primarily attributable to an increase in sales volume in the European Union and the rest of the world, while growth in hemostatis is primarily attributable expanded sales in the European Union. Immunohematology experienced only modest growth of 2.4% in 2010, primarily as a result of stable sales under our custom manufacturing agreement with Ortho Clinical Diagnostics, Inc., and a decline in revenues from Australia by 23.1% to €5.1 million in 2010.
Raw Materials and Others. Revenues decreased by 35.0%, from €28.8 million in 2009 to €18.7 million in 2010, primarily due to the fact that 2009 sales comprised of one-off plasma sales, while in 2010 we experienced only recurrent sales.
Changes in inventories of finished goods and work in progress and supplies.
Supplies increased by 7.2%, from €286.3 million in 2009 to €306.9 million in 2010. From these supplies, €282.5 million corresponds to purchases of raw materials (€325.4 million in 2009) and goods for resale and €24.4 corresponds to change in inventories of raw materials and goods for resale (€(39.1) million in 2009). In addition, €45.7 million corresponds to change in inventories of finished goods and work in progress. This increase was primarily because we intended to build up inventories to secure future growth.
73
Personnel expenses.
Personnel expenses increased by 5.8%, from €273.2 million in 2009 to €289.0 million in 2010, primarily due to increased sales personnel and an increase in variable remuneration paid.
Other operating expenses.
Other operating expenses increased by 0.9%, from €203.4 million in 2009 to €205.3 million in 2010. In addition, we incurred costs in connection with the proposed acquisition of Talecris in the amount of €17.0 million.
Amortization and depreciation.
Amortization and depreciation increased by 15.7%, from €39.6 million in 2009 to €45.8 million in 2010. This increase was primarily due to the continued increase in our fixed asset base, including a new sterile filling and purification area at our Los Angeles facility and our new corporate offices in Sant Cugat del Vallès, Barcelona.
Finance income and expense.
Net finance expense increased by 125.9% from €22.6 million in 2009 to €51 million in 2010. This significant increase was mainly due to a 83.3% increase in finance expenses, from €27.1 million in 2009 to €49.7 million in 2010, as a result of (i) the full-year impact of the interest expense on the Grifols Inc. Old Notes, which amounted to €31.9 million in 2010 as compared to €6.8 million in 2009 and (ii) a non-realized loss of €8.4 million arising from futures contracts with respect to our Class A shares. In addition, finance income decreased by 36.0%, from €7.1 million in 2009 to €4.5 million in 2010 primarily due to a 55.8% decrease in interest from Spanish Social Security, from €6.5 million in 2009 to €2.9 million in 2010.
Income tax expense.
In 2010, we had a consolidated profit before income tax of €157.8 million and income tax expense of €42.5 million, which represents an effective tax rate of 26.9%. This amount includes deductions of €10.8 million relating to research and development and other deductions. The effective tax rate decreased from 27.7% in 2009 primarily due to a lower profit before taxes in 2010 and a reduction in the amount of deductions year over year.
Profit after income tax from continuing operations.
As a result of the above, profit after income tax from continuing operations decreased 21.9%, from €147.6 million in 2009 to €115.3 million in 2010.
Regulation
For detailed information regarding the regulations applicable to our business, see “Item 4. Information on the Company — Business Overview — E. Regulatory Matters.”
Impact of Inflation
We historically have not been affected materially by inflation in our core geographies.
| | B. | Liquidity and Capital Resources |
Our principal liquidity and capital requirements consist of the following:
| | • | | costs and expenses relating to the operation of our business, including working capital for inventory purchases and accounts receivable financing; |
| | • | | capital expenditures for existing and new operations; and |
| | • | | debt service requirements relating to our existing and future debt. |
Historically, we have financed our liquidity and capital requirements through internally generated cash flows mainly attributable to revenues; debt financings; and capital infusions. At December 31, 2011, our cash and cash equivalents totaled $340.6 million. In addition, at December 31, 2011, we had available borrowing capacity of $50 million, €36.7 million ($50 million equivalent) and the $200 million equivalent in multicurrencies under our Original Revolving Credit Facilities. On February 26, 2012, we entered into the Amended and Restated Senior Credit Agreement, which provides for Amended Revolving Credit Facilities in the amounts of $140 million, €22 million and the $35 million equivalent in multicurrencies. As of the date of this annual report on Form
74
20-F, the Amended Revolving Credit Facilities are undrawn. We expect our cash flows from operations combined with our cash balances and availability under our Amended Revolving Credit Facilities and other bank debt to provide sufficient liquidity to fund our current obligations, projected working capital requirements, and capital expenditures for at least the next twelve months.
Historical Cash Flows
Below are our consolidated statements of cash flow for the years ended December 31, 2011, 2010 and 2009.
Statements of Cash Flows
For the Years Ended December 31, 2011, 2010 and 2009
| | | | | | | | | | | | |
| | | Year Ended December 31, | |
| | | 2011 | | | 2010 | | | 2009 | |
Cash flows from/(used in) operating activities | | | | | | | | | | | | |
Profit before tax | | | 80,023 | | | | 157,784 | | | | 203,994 | |
Adjustments for: | | | 313,915 | | | | 92,351 | | | | 61,800 | |
Amortization and depreciation | | | 90,639 | | | | 45,776 | | | | 39,554 | |
Other adjustments: | | | 223,276 | | | | 46,575 | | | | 22,246 | |
(Profit)/losses on equity accounted investments | | | 1,064 | | | | 879 | | | | (51 | ) |
Exchange differences | | | 3,447 | | | | (1,616 | ) | | | 1,733 | |
Impairment of assets and net provision charges | | | 23,806 | | | | 913 | | | | 53 | |
(Profit)/losses on disposal of fixed assets | | | 19,366 | | | | (276 | ) | | | 1,147 | |
Government grants taken to income | | | (1,304 | ) | | | (728 | ) | | | (1,188 | ) |
Finance expense/(income) | | | 180,567 | | | | 47,442 | | | | 17,551 | |
Other adjustments | | | (3,670 | ) | | | (39 | ) | | | 3,001 | |
Changes in operating assets and liabilities | | | (51,279 | ) | | | (78,767 | ) | | | (104,127 | ) |
Change in inventories | | | 6,909 | | | | (18,306 | ) | | | (113,104 | ) |
Change in trade and other receivables | | | (54,142 | ) | | | (23,546 | ) | | | (12,549 | ) |
Change in current financial assets and other current assets | | | 9,321 | | | | (73,022 | ) | | | (1,287 | ) |
Change in current trade and other payables | | | (13,367 | ) | | | 36,107 | | | | 22,813 | |
Other cash flows from operating activities | | | (122,431 | ) | | | (67,116 | ) | | | (73,487 | ) |
Interest paid | | | (139,883 | ) | | | (40,129 | ) | | | (14,719 | ) |
Interest recovered | | | 3,582 | | | | 5,436 | | | | 2,509 | |
Income tax paid/(recovered) | | | 13,870 | | | | (32,423 | ) | | | (61,277 | ) |
Net cash from operating activities | | | 220,228 | | | | 104,252 | | | | 88,180 | |
Cash flows from/(used in) investing activities | | | | | | | | | | | | |
Payments for investments | | | (1,784,464 | ) | | | (108,588 | ) | | | (136,626 | ) |
Group companies and business units | | | (1,624,869 | ) | | | (1,474 | ) | | | (15,385 | ) |
Property, plant and equipment and intangible assets | | | (159,899 | ) | | | (103,402 | ) | | | (118,770 | ) |
Property, plant and equipment | | | (137,200 | ) | | | (86,800 | ) | | | (103,415 | ) |
Intangible assets | | | (22,699 | ) | | | (16,602 | ) | | | (15,355 | ) |
Other financial assets | | | 304 | | | | (3,712 | ) | | | (2,471 | ) |
Proceeds from the sale of investments | | | 165,738 | | | | 4,532 | | | | 673 | |
Property, plant and equipment | | | 160,266 | | | | 3,911 | | | | 673 | |
Associates | | | 5,472 | | | | 621 | | | | — | |
Net cash used in investing activities | | | (1,618,726 | ) | | | (104,056 | ) | | | (135,953 | ) |
Cash flows from/(used in) financing activities | | | | | | | | | | | | |
Proceeds from and payments for equity instruments | | | (2,830 | ) | | | (1,250 | ) | | | 26,655 | |
Issue | | | (2,830 | ) | | | — | | | | (76 | ) |
Payments for treasury shares | | | — | | | | (1,250 | ) | | | (25,186 | ) |
Disposal of treasury shares | | | — | | | | — | | | | 51,917 | |
Proceeds from and payments for financial liability instruments | | | 1,762,550 | | | | (1,066 | ) | | | 344,413 | |
Issue | | | 2,994,741 | | | | 118,238 | | | | 525,078 | |
Redemption and repayment | | | (1,232,191 | ) | | | (119,304 | ) | | | (180,665 | ) |
Dividends and interest on other equity instruments paid | | | — | | | | (27,282 | ) | | | (80,913 | ) |
Other cash flows from financing activities | | | (284,748 | ) | | | 323 | | | | 741 | |
Transaction costs of financial instruments issued in the acquisition of Talecris | | | (285,088 | ) | | | — | | | | — | |
Other amounts received from financing activities | | | 340 | | | | 323 | | | | 741 | |
Net cash (used in)/from financing activities | | | 1,474,972 | | | | (29,275 | ) | | | 290,896 | |
Effect of exchange rate fluctuations on cash | | | 24,463 | | | | 19,356 | | | | (119 | ) |
Net increase in cash and cash equivalents | | | 100,937 | | | | (9,723 | ) | | | 243,004 | |
Cash and cash equivalents at beginning of the year | | | 239,649 | | | | 249,372 | | | | 6,368 | |
Cash and cash equivalents at end of the year | | | 340,586 | | | | 239,649 | | | | 249,372 | |
75
In the fiscal years ended December 31, 2011, 2010 and 2009, we generated net cash flow of €100.9 million, €(9.7) million and €243.0 million, respectively.
Net Cash from/(Used in) Operating Activities
In 2009, we generated net cash from operating activities of €88.2 million. The principal effects on working capital were:
| | • | | a €12.5 million increase in receivables, with the days sales outstanding ratio remaining at 83 days, which was similar to 2008; |
| | • | | a €113.1 million increase in inventories, which represented a significant increase from 2008, with the days sales outstanding ratio at 377 days, due to increased plasma collection activity and slower-than-budgeted sales, which resulted in remaining inventory at the stage of intermediate or finished goods; and |
| | • | | a €22.8 million increase in current liabilities, with a day payable outstanding ratio of 64 days. |
In 2010, we generated net cash from operating activities of €104.3 million. The principal effects on working capital were:
| | • | | a €23.5 million increase in receivables, with the days sales outstanding ratio at 83 days, which was similar to 2009; |
| | • | | a €18.3 million increase in inventories with the stocks turnover ratio at 364 days, which is lower than 2009; |
| | • | | a €73.0 million increase in current financial assets and other current assets due to the costs incurred related to the issue of debt and equity that are expected in connection with the acquisition of Talecris included in other current assets; and |
| | • | | a €36.1 million increase in current trade and other payables, with a day payable outstanding ratio of 76 days. |
In 2011, we generated net cash from operating activities of €220.2 million. The principal effects on working capital were:
| | • | | a €54.1 million increase in receivables, with the days sales outstanding ratio at 65 days, which was significantly lower than 2010 as a result of the acquisition of Talecris and their favorable sales outstanding ratio; |
| | • | | a €6.9 million decrease in inventories with the stocks turnover ratio at 319 days, which is lower than 2010; and |
| | • | | a €13.9 million decrease in current trade and other payable, due to the payment of transaction costs in 2011 which were outstanding as of December 31, 2010. |
Net Cash from/(Used in) Investing Activities
Net cash used in investing activities amounted to €136.0 million in 2009, €104.1 million in 2010 and €1.6 billion in 2011. A significant part of the investments made in 2009 and 2010 were related to capital expenditures, primarily investments for capacity expansion. For 2011, most of the cash used in investing activities related to the acquisition of Talecris. In addition, during 2011, we received €160.2 million as a result of sale-leaseback transactions in the United States and Spain.
Net Cash from/(Used in) Financing Activities
Net cash from financing activities amounted to €290.9 million in 2009, mainly from net disposals of owned shares of €26.7 million and proceeds from the private placement of the Grifols Inc. Old Notes. For a further discussion of the Grifols Inc. Old Notes, see “— Sources of Credit” below.
Net cash used in financing activities amounted to €29.3 million in 2010, mainly due to the payment of dividends.
Net cash from financing activities was €1.5 billion in 2011, primarily due to the issuance of $1.1 billion aggregate principal amount of our Notes and borrowings under the Original Senior Term Loans which amounted to $2.5 billion and €438.9 million (excluding undrawn availability under the Original Revolving Credit Facilities) as of December 31, 2011. We also paid transaction costs in connection with the acquisition of Talecris in the amount of €285 million. For a further discussion of the Notes and the Original Senior Credit Agreement, see “— Sources of Credit” below.
Pursuant to the terms of the Original Senior Credit Agreement and in connection with the consummation of the acquisition we refinanced substantially all of our and Talecris’ existing debt. On June 1, 2011, we redeemed all of the Grifols Inc. Old Notes and repaid existing bank loans amounting to €297 million. We paid a €112 million make-whole premium payment in connection with the redemption of the Grifols Inc. Old Notes. On June 13, 2011, we redeemed 10% of the $600 million aggregate principal amount of Talecris Old Notes. The remaining Talecris Old Notes were redeemed on July 1, 2011. As of December 31, 2011, there were no Talecris Old Notes outstanding. We paid a €78 million make-whole premium payment in connection with the redemption of the Talecris Old Notes.
76
Working Capital
Our working capital, which is driven primarily by our trade receivable turnover and inventory aging, can vary significantly period to period. Our capital requirements will depend on many factors, including our rate of sales growth, acceptance of our products, continued access to adequate manufacturing capacities, maintaining cGMP compliant facilities, the timing and extent of research and development activities, and changes in operating expenses, including costs of production and sourcing of plasma, all of which are subject to uncertainty. We anticipate that our cash needs will be significant and that we may need to increase our borrowings under current or future debt agreements in order to fund our operations and strategic initiatives. We anticipate that our working capital will increase in absolute terms in order to grow our business.
Inventory aging average has increased from 2009 to 2011 primarily because we began to build up inventories in 2009 to secure future growth, and this trend continued through 2010. As of December 31, 2011 the turnover ratio was approximately 300 days. The acquisition of Talecris has resulted in inventory optimization and a decrease of inventory days which we expect will continue as anticipated synergies are achieved.
Trade receivables aging maintained its level of turnover at 83 days in each of 2010 and 2009, but decreased to 65 days for the year ended December 31, 2011 primarily due to the acquisition of Talecris and their lower days sales outstanding ratio. In certain markets, particularly in Southern Europe (e.g., Spain and Italy), it is common practice for government or local authority-backed entities to pay suppliers well after the 30- to 60-day period normally applied, with payments occurring very often after one year. As a result, we require significant investments in working capital to accommodate certain clients’ payment terms. In order to reduce our working capital funding needs, we sell, to the extent necessary, receivables with a maturity beyond 30 days. Certain receivables are sold to financial institutions at the end of each quarter without recourse. During 2011, we sold €157 million of receivables to third parties.
Capital Expenditures
The following table presents our capital expenditures in the years ended December 31, 2011, 2010 and 2009, by division.
| | | | | | | | | | | | |
| | | Year Ended | |
| | | December 31, | |
| | | 2011 | | | 2010 | | | 2009 | |
Bioscience division | | | 127,789 | | | | 65,344 | | | | 70,702 | |
Hospital division | | | 15,097 | | | | 13,132 | | | | 7,524 | |
Diagnostic division | | | 12,218 | | | | 15,897 | | | | 14,067 | |
Shared infrastructure | | | 12,395 | | | | 11,424 | | | | 26,477 | |
Total | | | 167,499 | | | | 105,797 | | | | 118,770 | |
January 2009 through December 2011
Facilities. The most important capital projects relating to the expansion and improvement of our manufacturing facilities were:
| | • | | capital expenditures for the Los Angeles facility in the amount of €29.2 million in 2009; |
| | • | | refurbishment work at our headquarters for €14.2 million in 2009; |
| | • | | investments in a new IVIG plant at our Los Angeles facility of approximately €18.1 million in 2010; |
| | • | | refurbishment costs and information technology-related expenditures at our headquarters of approximately €7.7 million in 2010; |
| | • | | costs related to the expansion of a new fractionation plant at our Parets facility of approximately €9.4 million in 2010; |
| | • | | investments for the new laboratories in San Marcos, Texas of approximately €10.2 million in 2010; |
| | • | | investments for new plants and machinery in our Hospital division of approximately €10.0 million in 2010; |
| | • | | investments related to Clayton facility of approximately €134.2 million in 2011, mainly related to fractionation capacity expansion; |
| | • | | further expenditures at our new plant at the Murcia facility of approximately €8.9 million in 2011; |
| | • | | costs related to the construction of a new plasma fractionation plant at our Parets facility of approximately €1.1 million in 2011; and |
77
| | • | | costs related to the validation process for the production of fibrin glue at our Parets facility of approximately €.04 million in 2011. |
Development Cost.Our important projects included:
| | • | | completion of the development of Erytra® in early 2010, which is a fully automated instrument with a high processing capacity for pre-transfusion compatibility tests using the gel agglutination technique; |
| | • | | improvements to the Triturus® and WADiana® automated analyzers; |
| | • | | pursuit of albumin usage in the treatment of Alzheimer’s disease; |
| | • | | conducting clinical trials for the sale in the European Union of Flebogamma® DIF 10% to treat ITP; and |
| | • | | continuation of clinical trials for the sale of fibrin glue, which is a fibrin clot preparation to control bleeding during surgery, in the United States. |
January 2012 through December 2015
We are undertaking an investment plan that involves cumulative capital expenditures of approximately €560 million to €600 million through 2015. We plan to finance our projected capital expenditures with internally generated cash flow, cash on hand and debt financing.
The goal of our capital expenditure plan through 2015 is to continue progressively expanding our production capacity in Spain and the United States, as well as to effectively manage our ongoing production requirements and meet anticipated market growth. Accordingly, plans are in place to expand both our plasma fractionation facilities and related installations for purifying intermediates used to produce plasma derived proteins. We will also expand and relocate plasma donation centers and enhance our logistics centers.
As a result of these investments, we expect our plasma fractionation capacity to exceed 12 million liters per year by 2016. Furthermore, we expect to almost double our current capacity for the purification of IVIG. The investment plan also contemplates extension of the installations used to purify albumin, FVIII, plasmin and other plasma derived proteins.
The implementation of this new capital expenditure plan will generate savings of more than $280 million by 2015 in comparison to the projected cost of capital expenditures planned by each of Grifols and Talecris prior to the acquisition.
Our principal planned capital expenditures such period are the following:
Facilities. The most important capital projects relating to the expansion and improvement of our manufacturing facilities that we plan to make are:
| | • | | investments related to the Parets facility of approximately €11.9 million in 2012, mainly related to fractionation capacity expansion; |
| | • | | incur further headquarters-related expenses and information technology projects of approximately €22.2 million in 2012; |
| | • | | investments related to Clayton facility of approximately €50.6 million in 2012, mainly related to fractionation capacity expansion; and |
| | • | | further expenditures at our new plant at the Murcia facility of approximately €2.1 million in 2012. |
Development Cost. We are undertaking research and development projects in all of our major product areas.
Sources of Credit
Amended and Restated Senior Credit Agreement
In order to finance the cash portion of the acquisition consideration and repay existing indebtedness, on November 23, 2010, we entered into the Original Senior Credit Agreement, which provided for the Original Senior Term Loans aggregating $2.5 billion and €440 million and the Original Revolving Credit Facilities in the amounts of $50 million, €36.7 million ($50 million equivalent) and the $200 million equivalent in multicurrencies, from a syndicate of lenders led by Deutsche Bank Securities Inc., Nomura International plc, Banco Bilbao Vizcaya Argentaria, S.A., BNP Paribas, HSBC Securities (USA) Inc. and Morgan Stanley Senior Funding, Inc. Upon completion of the acquisition, the lenders funded their commitments under the Original Senior Credit Agreement. As of December 31, 2011, there was $2.5 billion and €438.9 million outstanding under the Original Senior Term Loans and no
78
amounts were drawn against the Original Revolving Credit Facilities. As of December 31, 2011, we were in compliance with the financial covenants under the Original Senior Credit Agreement.
On February 29, 2012, we entered into the Amended and Restated Senior Credit Agreement to provide for Amended Senior Term Loans aggregating $2.3 billion and €420 million, and Amended Revolving Credit Facilities in the amounts of $140 million, €22 million and the $35 million equivalent in multicurrencies, from a syndicate of lenders led by Deutsche Bank Securities Inc., Nomura International plc, Banco Bilbao Vizcaya Argentaria, S.A., BNP Paribas, HSBC Securities (USA) Inc. and Morgan Stanley Senior Funding, Inc.
The Amended Senior Term Loans consist of two tranches, Tranche A and Tranche B. The Tranche A Term Loans, which amount to $600 million and €220 million, mature five years after the date of the closing of the acquisition (June 1, 2016) and have a repayment schedule with quarterly amortization equal to 0%, 10%, 10% and 15% per annum of the original principal amount in years one through four beginning on June 30, 2012 and ending the third quarter of 2015, with the balance due after the fourth anniversary of the closing of the acquisition. The Tranche B Term Loans, which amount to $1.7 billion and €200 million, mature six years after the date of the closing of the acquisition (June 1, 2017) and will have a repayment schedule with quarterly amortization equal to 1% per annum of the original principal amount beginning on March 31, 2012, with the remainder to be paid at maturity. The Amended Senior Term Loans were fully funded on February 29, 2012.
The Amended Revolving Credit Facilities, which amount to $140 million, €22 million and the $35 million equivalent in multicurrencies, are available during the period commencing on the June 1, 2011 and ending on June 1, 2016. As of the date of this annual report on Form 20-F, no amounts were drawn against the Amended Revolving Credit Facilities.
The Amended and Restated Senior Credit Agreement also provides for incremental facilities that include an increase to the Amended Revolving Credit Facilities and the establishment of one or more new term loan commitments, by an amount not to exceed $600 million in the aggregate. The lenders and the administrative agent may decline to provide or arrange the incremental facilities in their sole discretion.
The interest rates on the Amended Senior Term Loans and the Amended Revolving Credit Facilities are based on (a) in the case of U.S. Dollar-denominated debt the base rate (the greatest of (i) the prime rate, (ii) the federal funds rate plus 0.50% and (iii) the applicable LIBOR rate plus 1.00%), plus an applicable margin or (b) the applicable LIBOR rate with a floor of 1.00% (such floor to be applicable only to Tranche B Term Loans), plus an applicable margin. The applicable margin is (a) 3.25% for the foreign currency-denominated Amended Revolving Credit Facilities (b) 3.50% for the foreign Tranche A Term Loan, (c) for the foreign Tranche B Term Loan (ii) if the leverage ratio is greater than or equal to 3.25 to 1.00, 3.50% and (ii) if the leverage ratio is less than 3.25 to 1.00, 3.25%, (d) for the U.S. Dollar-denominated Amended Revolving Credit Facilities, the U.S. Dollar-denominated multicurrency Amended Revolving Credit Facilities and the U.S. Dollar-denominated Tranche A Term Loan, (i) 2.25% for base rate loans and (ii) 3.25% for LIBOR rate loans, and (e) for the U.S. Dollar-denominated Tranche B Term Loan, (i) if the leverage ratio is greater than or equal to 3.25 to 1.00, 2.50% for base rate loans and 3.50% for LIBOR rate loans and (ii) if the leverage ratio is less than 3.25 to 1.00, 2.25% for base rate loans and 3.25% for LIBOR rate loans.
Borrowings under the Amended and Restated Senior Credit Agreement are subject to mandatory prepayment upon the occurrence of certain events, including the incurrence of certain debt and the sale or other disposition of certain assets. In addition, a portion of the borrowings under the Amended and Restated Senior Credit Agreement are subject to mandatory prepayment in the event we have excess cash flow, as defined therein.
Borrowings under the Amended and Restated Senior Credit Agreement are guaranteed by Grifols, S.A. and certain subsidiaries of Grifols, S.A. that together with Grifols, S.A. represent, in the aggregate, at least 85% of the consolidated assets, consolidated EBITDA and consolidated turnover of Grifols, S.A. and its subsidiaries, and are secured by a perfected first priority security interest (subject to permitted liens, as defined in the credit and guaranty agreement) in all of the tangible and intangible assets of the credit parties, as defined therein (subject to certain exclusions and limitations). The Amended and Restated Senior Credit Agreement contain customary affirmative and negative covenants and events of default. Negative covenants include, among other limitations, limitations on additional debt, liens, asset sales and affiliate transactions. Events of defaults include, among other events, violation of covenants, material breaches of representations, cross-default to other material debt, bankruptcy and insolvency and material judgments. Furthermore, we are required to comply with certain ratios and financial maintenance covenants. We are required to provide financial information to the lending banks within the six-month period subsequent to December 31 of each year while the loan is outstanding.
The terms of the Amended and Restated Senior Credit Agreement limits our ability to pay ordinary dividends. If our leverage ratio is 4.50x or less, then we may pay dividends in an amount not to exceed an amount equal to (a) the sum of (i) 40% of the consolidated net income of Grifols, S.A. and its subsidiaries accrued since March 31, 2011 to the end of the most recently ended fiscal
79
quarter of Grifols, S.A. for which financial statements have been delivered to the lenders (or, in case such consolidated net income shall be a deficit, minus 100% of such deficit) and (ii) the net cash proceeds received from the issuance or sale of equity interests in Grifols, S.A. and its subsidiaries after the closing date that are not applied to prepay the loans, less (b) the sum of amounts used to make (i) certain permitted restricted payments and (ii) below par purchases of senior term loans.
8.25% Senior Notes due 2018
On January 21, 2011, Giant Funding Corp., an escrow company formed solely for the purpose of issuing such notes, completed the sale of the Notes to the initial purchasers thereof in an offering not registered under the Securities Act. The initial purchasers subsequently resold the Notes to qualified institutional buyers pursuant to Rule 144A under the Securities Act and to non-U.S. persons outside the United States in reliance on Regulation S under the Securities Act. The proceeds of the offering of the Notes were held in an escrow account pending completion of the acquisition of Talecris and the satisfaction of other conditions. On June 1, 2011, upon completion of the acquisition, Giant Funding Corp. was merged with and into our subsidiary, Grifols Inc., and Grifols Inc. assumed all of Giant Funding Corp.’s obligations under the Notes and the indenture governing the Notes and the proceeds from the issuance of the Notes were released from the escrow account. The proceeds from the Notes together with funds drawn on the Original Senior Term Loans were used to finance the cash portion of the consideration for the acquisition.
The Notes yield 8.25% to maturity and pay interest semi-annually on February 1 and August 1 to holders of record on the immediately preceding January 15 and July 15, respectively. The Notes are guaranteed on a senior unsecured basis by existing and future subsidiaries of Grifols, S.A. that guarantee the Amended and Restated Senior Credit Agreement, other than foreign subsidiaries of Grifols Inc. As of the date of this annual report on Form 20-F, the Notes are guaranteed by Grifols Biologicals Inc., Biomat USA, Inc., Grifols Therapeutics Inc., Talecris Plasma Resources, Inc., Instituto Grifols, S.A., Diagnostic Grifols, S.A., Movaco, S.A., Laboratorios Grifols, S.A., Grifols Italia, S.p.A. and Grifols Deutschland GmbH.
Grifols Inc. may redeem the Notes in whole or in part, at any time on and after February 1, 2014, at the redemption prices (expressed as percentages of principal amount) set forth below plus accrued and unpaid interest and additional interest, if any, on the Notes redeemed, to the applicable redemption date, if redeemed during the twelve-month period beginning on February 1 of the years indicated below:
| | | | |
Fiscal Year | | Percentage | |
2014 | | | 106.188 | % |
2015 | | | 104.125 | % |
2016 | | | 102.063 | % |
2017 and thereafter | | | 100.000 | % |
Grifols Inc. may redeem up to 35% of the outstanding Notes with money raised in one or more equity offerings by Grifols, S.A. at any time (which may be more than once) prior to February 1, 2014, as long as at least 65% of the aggregate principal amount of Notes issued remains outstanding immediately following any such offerings.
Grifols Inc. may redeem some or all of the Notes at any time prior to February 1, 2014 at a price equal to 100% of the principal plus a premium as defined under the indenture (computed using a discount rate equal to the U.S. Treasury rate as of such redemption date plus 0.50%), plus accrued and unpaid interest and additional interest, if any.
Grifols Inc. is not required to make mandatory redemption or sinking fund payments with respect to the Notes.
If we experience a change of control, Grifols Inc. must give holders of the Notes the opportunity to sell Grifols Inc. their Notes at 101% of their face amount, plus accrued and unpaid interest.
Grifols, S.A. and its restricted subsidiaries may incur additional indebtedness if our fixed charge coverage ratio (as defined in the indenture governing the Notes) for our most recently ended four full fiscal quarters immediately preceding the date on which such additional indebtedness is incurred would have been at least 2.00 to 1.00, determined on a pro forma basis.
The indenture governing the Notes contains certain covenants limiting, subject to exceptions, carve-outs and qualifications, Grifols, S.A.’s ability and its restricted subsidiaries’ ability to: (i) pay dividends or make certain other restricted payments or investments; (ii) incur additional indebtedness or provide guarantees of indebtedness and issue disqualified stock; (iii) create liens on assets; (iv) merge, consolidate, or sell all or substantially all of our and our restricted subsidiaries’ assets; (v) enter into certain transactions with affiliates; (vi) create restrictions on dividends or other payments by our restricted subsidiaries; and (vii) create guarantees of indebtedness by restricted subsidiaries. The indenture also contains certain customary events of default.
80
On December 15, 2011, we exchanged all of our then outstanding Notes for similar Notes that were registered under the Securities Act. This exchange did not impact our capitalization.
As of December 31, 2011, we were in compliance with all covenants or other requirements set forth in the indenture governing the Notes.
Other Bank Debt
We are party to a number of other short- and long-term bilateral credit facilities. These facilities are with various lenders and consist of long-term and short-term indebtedness of both us and our subsidiaries. Most of our short-term credit facilities were repaid on June 2, 2011 in connection with the acquisition and related refinancing. At December 31, 2011 we had €51.3 million outstanding under long-term credit facilities which have maturity dates that range from 2012 to 2020, and €65.6 million outstanding under short-term credit facilities. The short-term credit facilities have maturity dates occurring in the next 12 months. We have €196 million of aggregate availability under short-term credit facilities. The majority of the facilities provide that the lenders may terminate such facilities at will or change the terms unilaterally.
Grifols Inc. Old Notes
On September 21, 2009, Grifols Inc. completed a private placement of the Grifols Inc. Old Notes. In connection with the acquisition of Talecris and related refinancing and in accordance with the terms of the Original Senior Credit Agreement, on June 1, 2011, we redeemed 100% of the aggregate principal amount of the Grifols Inc. Old Notes. We paid a make-whole premium in connection with the redemption of the Grifols Inc. Old Notes in the amount of €112 million, which has been capitalized as a deferred expense.
| | C. | Research and Development, Patents and Licenses, etc. |
We have made investments of €89.4 million, €40.7 million and €35.4 million in research and development in 2011, 2010 and 2009, respectively. Our research and development spending increased 119% year over year from 2010 to 2011, and represented 5% of our revenues in the year ended December 31, 2011. For detailed information regarding our research and development activities, see Item 4 of this Part I, “Information on the Company — B. Business Overview — Research and Development.”
Plasma-derived protein therapies are essential to extend and improve the lives of individuals suffering from chronic, acute and life-threatening conditions including infectious diseases, such as hepatitis, immunological diseases, such as multiple sclerosis, hemophilia, von Willebrand disease, liver dialysis and acute conditions such as burns and severe blood loss. For this reason, the administration of these products cannot be interrupted or postponed without putting patients’ lives at risk. This ensures a stable demand for such products. In addition, because of the nature of the diseases treated, the reimbursement rates for plasma derivative products are high. Any changes to such rates would likely elicit a strong lobbying response.
Based on recent MRB reports, analyst reports and internal data, management estimates that sales in the human plasma-derived product industry have grown at a compound annual rate of 8% globally over the last eighteen years and 9% in the U.S. alone over the past seventeen years. We believe that many plasma derivative products are underutilized and will continue to benefit from strong demand. Additionally, new indications are being explored for a number of plasma-derived therapies, such as the treatment of Alzheimer’s disease. We believe that the volume of global sales of plasma derivative products will continue to grow annually at 6% to 8% over the long term, driven primarily by the same factors that have contributed to its historical growth, including:
| | • | | the discovery and approval of new applications and indications for plasma-based products; |
| | • | | an increase in the number of diagnosed patients and diagnosed but previously-untreated patients; |
| | • | | geographic expansion; and |
| | • | | physicians’ greater awareness of conditions and treatments. |
Approximately 30% of our sales were generated in the European Union in 2011. Although we anticipate that the percentage of our sales generated in the European Union will further decrease in 2012, our results could be negatively impacted if the current European economic downturn continues and further austerity measures are implemented in Spain or in other European countries where we do business.
81
There are significant barriers to entry into the plasma derivative products industry, as the industry is highly regulated and requires significant expertise and capital investments. We do not expect these barriers to decrease in the near term.
Regulatory Environment. In order to operate in the plasma derivatives industry, manufacturers and distributors must comply with extensive regulation by the FDA, the EMA and comparable authorities worldwide. As a result, significant investments are required to develop, equip and maintain the necessary storage, fractionation and purification facilities and to develop appropriate sale, marketing and distribution infrastructures. Additionally, only proteins derived from plasma collected at FDA-approved centers can be marketed in the United States, so securing an adequate supply of U.S. source plasma is required to operate in the U.S. We expect these regulatory restrictions to continue.
Product Pipeline.We have an expanded portfolio of key products as a result of the acquisition of Talecris and will continue to invest in research and development with respect to new product and new indications for existing products. Talecris’ product pipeline was highly complementary to ours, with no overlap in the key projects. In addition, we have been able to increase the efficiency of the regulatory approval process through the integration of Talecris’ regulatory approval department with our own. Following the acquisition, we have increased our investments in research and development. Some key research and development projects underway include clinical studies into the use of IVIG and albumin to treat Alzheimer’s disease (which are ongoing through 2014), research into the use of albumin to treat liver cirrhosis, as well as late-stage testing of the use of fibrin sealant as a surgical tissue adhesive to control bleeding during surgery (for which the first license filing is expected in 2013 or 2014).
Capital Expenditures.We plan to invest €560 to €600 million through 2015 under our capital expansion plan. By 2016, we expect to increase our fractionation capacity to 12.3 million liters as a result of the construction of a new fractionation plant at our Parets facility with a capacity of 2.0 million liters per year and the replacement of the existing Clayton facility with a new fractionation facility with a capacity of 6.0 million liters per year.
| | E. | Off-balance Sheet Arrangements |
We do not have any off-balance sheet arrangements.
| | F. | Contractual Obligations |
The following table presents our principal existing contractual obligations as of December 31, 2011 requiring future payments:
| | | | | | | | | | | | | | | | | | | | |
| | | Payments Due by Period | |
| | | Total | | | Less than
one year | | | One to
three
years | | | Three to
five
years | | | More
than five
years | |
Operating leases(1) | | | 306,600 | | | | 53,054 | | | | 86,305 | | | | 94,497 | | | | 72,744 | |
Financial debt obligations(2) | | | 2,957,015 | | | | 147,791 | | | | 254,919 | | | | 666,984 | | | | 1,887,321 | |
Interest — financial debt obligations(3) | | | 1,057,077 | | | | 210,114 | | | | 395,146 | | | | 316,411 | | | | 135,406 | |
Licenses and royalties(4) | | | 14,540 | | | | 5,223 | | | | 4,181 | | | | 3,424 | | | | 1,712 | |
Total | | | 4,335,232 | | | | (416,182 | ) | | | (740,551 | ) | | | 1,081,316 | | | | 2,097,183 | |
| (1) | Operating leases include primarily leases for our plasma collection centers, leases from sale-leaseback transactions and marketing offices worldwide. These amounts reflect only our contractual obligations as of December 31, 2011 and therefore assume that these operating leases will not be renewed or replaced with new operating leases upon expiration. Investors are cautioned that our operating lease expenses will likely be substantially higher than the amounts provided in this table because our operations will require us to either renew or replace our operating leases. |
| (2) | Includes principal amortization for short and long-term debt including, among other things, capitalized lease obligations. Our financial debt obligations primarily consist of $2.5 billion and €438.9 million outstanding under our Senior Term Loans and $1.1 billion aggregate principal amount of our Notes. The remaining financial debt was made up largely of bilateral facilities that bore interest at market rate. |
| (3) | Interest payments on debt and capital lease obligations are calculated for future periods using interest rates in effect at the end of 2011. Certain of these projected interest payments may differ in the future based on changes in floating interest rates, foreign currency fluctuations or other factors or events. The projected interest payments only pertain to obligations and agreements outstanding at December 31, 2011. Refer to Notes 22 and 32 to our audited consolidated financial statements included in this annual report on Form 20-F for further discussion regarding our debt obligations and related interest rate agreements outstanding at December 31, 2011. |
| (4) | License and royalty payment formulas are generally based on volume of sales. The amounts presented in the table are calculated based on the net sales of 2011 without assuming any growth in sales. Additionally, the column “More than five years” includes |
82
| | only one year of payments under the license agreement with Marca Grifols, S.L. which expires in January 2092. See Item 7 of this Part I, “Major Shareholders and Related Party Transactions — B. Related Party Transactions — Patent and Trademark Use.” |
Financial Derivatives
During the fiscal year ended December 31, 2009, we entered into two unquoted futures contracts, the notional underlying of which consists of our shares, with a solvent financial institution. The contracts are settled by differences between the market value of the notional underlying and the exercise price. In December 2011, we extended the remaining future contracts until June 29, 2012 At December 31, 2011, the two contracts had 1.0 million shares and 2.2 million shares underlying with an exercise price of €11.6107 and €11.9864, respectively.
To cover the interest rate risk related to the Grifols Inc. Old Notes issued in 2009, we entered into a swap to hedge the interest rate of the ten-year United States government bonds, with a nominal amount of $200.0 million maturing on September 21, 2009, swapping a variable interest rate for a fixed one. At the date of redemption, the valuation resulted in a financial cost of €3.275 million, which was recognized in equity, net of the tax effect, under “Cash Flow Hedges” and deferred over the term of the ten-year corporate bond. As consequence of redemption of the Grifols Inc. Old Notes in connection with the acquisition, the cash flow hedge has been expensed.
Pursuant to the terms of the Original Senior Credit Agreement we were required to enter into hedging transactions in fiscal year 2011 with respect to at least 50% of our borrowings thereunder. In June and October 2011 we entered into variable to fixed interest-rate swaps for initial nominal amounts of $1,550 million and €100 million, respectively, to hedge interest-rate risk with respect to borrowings under the Original Senior Credit Agreement. We have recognized these financial derivatives as cash flow hedges. In addition, in June 2011, we entered into a floor swap, which has an initial nominal amount of $1,550. In October 2011, we entered into a swap option that has an initial nominal amount of €100 million. Both the swap floor and swap option values at December 31, 2011 are included in non-current financial liabilities. The last maturity date of the swap floor is 2016, and the last maturity date of the swap option is 2014. The Amended and Restated Senior Credit Agreement contains the same hedging requirements.
As the floor included in the Tranche B Senior Term Loan is in the money, embedded derivatives exist in that contract, and those derivatives have been fair valued and separated from the loan.
Additional information regarding our derivative instruments is set forth in Note 32 to our audited consolidated financial statements for year ended December 31, 2011, starting on page F-1 of this annual report on Form 20-F.
| Item 6. | DIRECTORS, SENIOR MANAGEMENT AND EMPLOYEES |
| | A. | Directors and Senior Management |
Directors
Set forth below are the names and current positions of the members of the Board:
| | | | | | | | |
Name | | Title | | Type | | Director Since | | Term Expires |
Víctor Grifols Roura | | Director, Chairman of the Board and Chief Executive Officer | | Executive | | July 1991(1) | | June 2012 |
Juan Ignacio Twose Roura | | Director | | Executive | | April 2000(2) | | June 2012 |
Ramón Riera Roca | | Director | | Executive | | April 2000(3) | | June 2012 |
Tomás Dagá Gelabert | | Director | | Other External | | April 2000 | | June 2015 |
Thorthol Holdings B.V. (represented by Mr. José Antonio Grifols Gras) | | Director | | Proprietary | | January 2000(4) | | June 2012 |
Thomas H. Glanzmann | | Director | | Other External | | April 2006 | | May 2016 |
Edgar Dalzell Jannotta | | Director | | Independent | | December 2006 | | June 2015 |
Anna Veiga Lluch | | Director | | Independent | | December 2008 | | June 2015 |
William Brett Ingersoll | | Director | | Independent | | June 2011 | | January 2016 |
Luís Isasi Fernández de Bobadilla | | Director | | Independent | | May 2011 | | May 2016 |
Steven Francis Mayer | | Director | | Independent | | June 2011 | | January 2016 |
Raimon Grifols Roura | | Secretary non-member | | n/a | | July 2001 | | n/a |
Nuria Martín Barnés | | Vice Secretary non-member | | n/a | | July 2001 | | n/a |
83
| (1) | Between July 8, 1991 and May 30, 2002, Mr. Víctor Grifols Roura was not a director but sat on the Board as representative of our then director Deria, S.A. |
| (2) | Between May 25, 2001 and May 30, 2002, Mr. Juan Ignacio Twose Roura was not a director but sat on the Board as representative of our then director Grifols Engineering, S.A. |
| (3) | Between May 25, 2001 and May 30, 2002, Mr. Ramón Riera Roca was not a director but sat on the Board as representative of our then director Grifols International, S.A. |
| (4) | Thorthol Holdings B.V. is represented on the Board by Mr. José Antonio Grifols Gras. Between January 20, 2000 and June 1, 2002, Thorthol Holdings B.V. was not a director but its current representative on the Board, Mr. José Antonio Grifols Gras, sat on the Board as director. |
Director Biographies
Víctor Grifols Roura
Mr. Grifols Roura, who in 1985 succeeded his father as Chief Executive Officer of our predecessor, headed the 1987 reorganization that created the company that we are today. Mr. Grifols Roura originally joined our predecessor in 1973 as an Export Manager and later served as Sales Manager. Mr. Grifols Roura earned a business administration degree from the University of Barcelona.
Juan Ignacio Twose Roura
Mr. Twose has served as a director of our predecessor, and now Grifols, S.A., since 1973. He also served as our Vice President of Manufacturing from 1988 to September 2011 and is currently the President of our Global Industrial Division. Mr. Twose has been responsible for our industrial division since our creation. Mr. Twose received a degree in Industrial Engineering from the Escuela Técnica Superior of Barcelona.
Ramón Riera Roca
Mr. Riera has served as our director since 2000. He also serves as our Vice President of Marketing and Sales. Mr. Riera joined our predecessor in 1977, became the Vice President of Marketing & Sales in 1988 and Managing Director of Grifols International in 1997. Mr. Riera earned a degree in Chemical Sciences from the Autonomous University of Barcelona.
Tomás Dagá Gelabert
Mr. Dagá has served as our director since April 2000. Mr. Dagá is also a member of the board of directors of Scranton Enterprises B.V., Zambon, S.A., Pharmazam S.A. and StoraEnso Barcelona, S.A. Mr. Dagá is also a trustee of the Joaquim Molins Figueras Foundation in Barcelona. Mr. Dagá is the managing partner of the law firm Osborne Clarke España, S.L.P., or Osborne Clarke. Prior to joining Osborne Clarke, Mr. Dagá worked in the corporate and tax department of Peat Marwick Mitchell & Co. in Barcelona from December 1979 to September 1986. Mr. Dagá earned a law degree from the University of Barcelona.
José Antonio Grifols Gras
Dr. Grifols has served as a director of Grifols, S.A. representing Thorthol Holdings B.V. since June 2002. Dr. Grifols has been a professor of Theoretical Physics at the Autonomous University of Barcelona since September 1990 and the head of the Physics Department of the university since September 2002. Dr. Grifols’ activities involve both teaching undergraduate and graduate courses (that include quantum mechanics, general relativity and cosmology) and doing research in high energy physics, astrophysics and cosmology. Dr. Grifols trained as a physicist in many European and American institutions, including Max-Planck-Institut (Munich, 1971-1974, 1981), Stanford University (1976-1978), CERN (Geneva, 1983, 1984, 1987, 1995), Deutsches Elektronen Synchrotron (Hamburg, 1986, 1987, 1988), Oxford University (1984), University of Florida (Gainesville, 1985), Lawrence Berkeley Laboratory (Berkeley, 1987) and Fermi National Laboratory (Chicago, 1996).
Thomas H. Glanzmann
Mr. Glanzmann has served as our director since April 2006. Following the acquisition, Mr. Glanzmann was appointed Chairman of Grifols Inc. and was hired by Grifols, S.A. to lead the integration of Talecris. In addition, he is currently the Chief Executive Officer and President of Gambro AB. Prior to his current position, Mr. Glanzmann was the CEO and Managing Director of HemaCue. He also was a Senior Advisor to the Executive Chairman and Acting Managing Director at The World Economic Forum.
84
Between 1988 and 2004, he held various positions at Baxter, including: Senior Vice President and Corporate Officer of Baxter Healthcare Corporation; President of Baxter Bioscience; Chief Executive Officer of Immuno International; and President of the European Biotech Group, among other positions. Between 1984 and 1988, he worked at Philip Morris where, among other positions, he was the country manager for Norway, Denmark and Iceland. Mr. Glanzmann holds a M.B.A. from IMD in Switzerland and a B.A. in Political Science from Dartmouth College, USA.
Edgar Dalzell Jannotta
Mr. Jannotta has served as our independent director since December 2006. In March 2001, he was named Chairman of William Blair & Company, L.L.C., an international investment banking firm. Mr. Jannotta joined William Blair & Company in 1959 as an Associate, became a Partner in January 1965 and was Managing Partner from 1977 to 1995. Before being appointed Managing Partner, Mr. Jannotta worked on investment banking and private equity transactions in the corporate finance department. He was Chairman of the Securities Industry Association (1982) and has served as a director of the New York Stock Exchange Inc. He serves as a director on the boards of Aon Corporation, Commonwealth Edison Company, Molex Incorporated and Sloan Valve Company. Mr. Jannotta completed his undergraduate studies at Princeton University and received his M.B.A. from Harvard Business School.
Anna Veiga Lluch
Ms. Veiga has served as our director since 2008. She graduated in Biology (1974-1979) and received her Ph.D. at Universidad Autonoma de Barcelona in 1991. She has been the IVF Laboratory Director at the Reproductive Medicine Service, Institut Universitari Dexeus from 1982 to 2005. She is the Director of the Barcelona Stem Cell Bank at the Centre for Regenerative Medicine in Barcelona, the Scientific Director at the Reproductive Medicine Service, Institut Universitari Dexeus and Associate Professor at the Departament de Ciències Experimentals i de la Vida, Universitat Pompeu Fabra. Her main areas of interest are Clinical Embryology, Reproductive Genetics, Embryonic and Pluripotent Stem Cell research and Bioethics.
W. Brett Ingersoll
Mr. Ingersoll has served as our independent director since June 2011. Prior to such time Mr. Ingersoll served as a member of the board of directors of Talecris Biotherapeutics Holdings Corp. from April 2005. Mr. Ingersoll has served as managing director of Cerberus Capital Management, L.P. and predecessor entities since November 2002 and co-head of private equity of Cerberus globally. From 1993 until 2002, Mr. Ingersoll served as a partner for J.P. Morgan Partners. In addition, Mr. Ingersoll is also a member of the boards of directors of the following companies: Steward Healthcare System, LLC, DynCorp International, EntreCap Financial, LLC, ACE Aviation Holdings, Inc., AerCap Holdings N.V. and EnduraCare Therapy Management, LLC. Mr. Ingersoll received his BA in Economics from Brigham Young University and his MBA from Harvard Business School.
Steven F. Mayer
Mr. Mayer has served as our independent director since June 2011. Prior to such time, Mr. Mayer served as a member of the board of directors of Talecris Biotherapeutics Holdings Corp. from April 2005. Mr. Mayer is the managing director of Cerberus California, LLC and predecessor entities since November 2002 and co-head of private equity of Cerberus globally. Mr. Mayer is also member of the boards of directors of BlueLinx Holdings, Inc., DecisionOne Corporation, LNR Property Holdings, Ltd. and Spyglass Entertainment, LLC. Mr. Mayer received his AB, cum laude, from Princeton University and his JD, magna cum laude, from Harvard Law School.
Luís Isasi Fernández de Bobadilla
Mr. Isasi has served as our independent director since May 2011. He is president and managing director of Morgan Stanley España, country head for Spain, and board member of the Madrid Stock Exchange. He joined Morgan Stanley in London in 1987. Prior to that, he served as executive director at First Chicago Ltd. in London and, previously, worked in New York for the Latin American department of Morgan Guaranty Trust Co. Mr. Isasi started his professional career in Abengoa, in Seville (Spain) in 1977. Mr. Isasi has a Bachelor’s Degree in Business from the University of Seville, and holds a M.B.A. from Columbia Business School in New York, United States, obtained in 1982.
Biographies of the Secretary Non-Members of the Board
Raimon Grifols Roura
Mr. Grifols has served as Secretary non-member of the Board since August 2001. Mr. Grifols is also a member of the board of directors of Squadron Reinsurance Ltd., Marca Grifols, S.L., and Arrahona Optimus, S.A., a patron of the Probitas Fundación Privada and secretary of the board of directors of Instituto Grifols, S.A. and Xantic Spain, S.A. Mr. Grifols is a partner at Osborne Clarke. Mr. Grifols earned his law degree from the University of Barcelona.
85
Nuria Martín Barnés
Ms. Martín has served as Vice Secretary non-member of the Board since 2001. She is also a member of the Board of Directors of Compañía General de Inversiones, S.A., S.I.C.A.V., Gesiuris S.G.I.I.C., S.A., CAT Patrimonis, S.I.C.A.V., S.A., URC Patrimonis, S.I.C.A.V., S.A. and Technetix Spain, S.L. Ms. Martín is the managing partner of the Barcelona office of Osborne Clarke. Prior to joining Osborne Clarke, she worked in the Corporate and Tax Department of KPMG Peat Marwick from 1982 to 1986. Ms. Martín earned her law degree from the University of Barcelona.
Senior Management
Our senior management consists of the following persons:
| | | | |
Name | | Title | | Since |
Víctor Grifols Roura | | President and Chief Executive Officer | | 1985 |
Juan Ignacio Twose Roura | | President of Global Industrial Division | | 1988 |
Ramón Riera Roca | | President of Global Commercial Division | | 1988 |
Alfredo Arroyo Guerra | | Chief Financial Officer | | 2007 |
Montserrat Lloveras Calvo | | Director of Corporate Accounting and Reporting | | 1991 |
Antonio Viñes Páres | | Director of Corporate Planning and Control | | 1994 |
Eva Bastida Tubau | | Director of Scientific Affairs | | 2007 |
Vicente Blanquer Torre | | Technical Director of Biological Industrial Group | | 1993 |
Mateo Florencio Borrás Humbert | | Director of Global Human Resources | | 2008 |
Carlos Roura Fernández | | Co-President of Global Industrial Division | | 1987 |
Francisco Javier Jorba Ribes | | President of Biological Industrial Group | | 1995 |
Gregory Gene Rich | | President and Chief Executive Officer of Grifols Inc. | | 2001 |
David Ian Bell | | Vice President of Grifols Inc. | | 2003 |
Alberto Grifols Roura | | Co-President of Instituto Grifols, S.A. | | 1999 |
Nuria Pascual Lapeña | | Vice President, Director of Finance and Corporate Investor Relations Officer | | 1997 |
Shinji Wada | | President of Plasma Centers of Grifols Inc. | | 2003 |
Mary Kuhn | | Executive Vice President of Grifols Inc. | | 2011 |
Joel Abelson | | President of North America Commercial Division | | 2011 |
Senior Management Biographies
The following are the biographies of our senior management who are not also directors:
Alfredo Arroyo Guerra
Mr. Arroyo has served as Chief Financial Officer of Grifols, S.A. since January 2007. Previously, Mr. Arroyo served as a CFO and in various Senior Finance positions in companies including KPMG, Carrefour, Chupa Chups, Reckitt Benckiser and Winterthur. Mr. Arroyo received a degree in Economics and is a Certified Public Accountant in Spain.
Montserrat Lloveras Calvo
Mrs. Lloveras has served as the Director of Corporate Accounting and Reporting (previously the Administration Director and Controller) since 1991. She joined our predecessor in 1984 as the Costs Analyst of the Financial Department and in 1988 was promoted to the position of Administration Director. Mrs. Lloveras received a degree and an M.B.A. from the Escuela Superior de Administración y Dirección de Empresas in Barcelona.
Antonio Viñes Páres
Mr. Viñes has served as the Director of Corporate Planning and Control (previously the Planning and Control Director) at Grifols, S.A. since 1994. He joined us in 1978, occupying several positions in the Commercial and Marketing Departments. Mr. Viñes received a degree in Biology from the Autonomous University of Barcelona.
Eva Bastida Tubau
Mrs. Bastida joined us in 2004 as the Medical Marketing Director of Grifols International, S.A. and took on the position of Director of Scientific Affairs (previously Executive Scientific Director of Grifols, S.A.) in 2007. Previously, Mrs. Bastida worked as a
86
Clinical Scientist in the Hemostasis Department of the Hospital Clinic in Barcelona, Spain. From 1993 to 1998, she was the Head of Clinical Development at Sanofi in Barcelona, Spain and from 1999 to 2003, she was responsible for Worldwide Clinical Development at Sanofi-Synthelabo in Paris, France. Mrs. Bastida has obtained her Pharmacy & Medical Pharmacology Degree from the University of Barcelona and a PhD in Cell Biology at the American Red Cross in Bethesda, Maryland. She holds a PDD by IESE and she has more than 24 years of experience, six of them with us.
Vicente Blanquer Torre
Mr. Blanquer has served as the Technical Director of the Biological Industrial Group (previously the Pharmaceutical Technical Director) at Grifols, S.A. since 1993, and is responsible for both Bioscience’s quality assurance and quality control. From 1987 until 1993, he was the Deputy Technical Director, responsible for process quality control concerning plasma derivatives manufacturing. Mr. Blanquer received a Degree in Pharmacy from the University of Barcelona.
Mateo Florencio Borrás Humbert
Mr. Borrás has served as the Director of Global Human Resources (previously Human Resources Director) at Grifols, S.A. since 2008. Previously, he served as a HR Director at different companies, including EMAYA, Nissan Motor Ibérica and others. He is a member of AEDIPE and he is an Arbitrator at the Arbitrator Corps of Catalonian Labour Court. Mr. Borrás received a degree in Psychology and a Postgraduate on Labour and Social Security, both at Universidad Central de Barcelona.
Carlos Roura Fernández
Mr. Roura has served as the co-president of the Global Industrial Division (previously the General Manager of Hospital Operations) since 1987. Mr. Roura joined us in 1977 and has held several positions since that time. Beginning in 2002, he has served as President of Farmafluid, a Spanish association of medical parenteral nutritional fluid laboratories. Since 2008, Mr. Roura is deputy Vice President of the Industrial Division. Mr. Roura is an Industrial Engineer.
Francisco Javier Jorba Ribes
Mr. Jorba has served as President of the Biological Industrial Group (previously the General Manager of Bioscience Operations) since 1995. He joined us in 1979 as Director of Plasma Procurement and Director of the A.I.P.H. Program. He was also General Manager of Biomat, S.A. from 1991 until 1995 and Managing Director of Instituto Grifols, S.A. until the consummation of the acquisition. At present, Mr. Jorba is Co-President of the Global Industrial Division. Mr. Jorba received a degree in General Medicine and Surgery in 1975 from the University of Barcelona and completed his Residency in Pediatrics in 1978 at the same University.
Gregory Gene Rich
Mr. Rich has served as the President of U.S. Operations and Chief Executive Officer and Chairman of the Grifols Inc. board of directors since December 2001. Previously, Mr. Rich worked for Grupo Picking Pack, as Chief Operating Officer from December 2000 to December 2001 and from July 1997 to August 2000, as Senior Vice President for Green Cross International, the then parent of Alpha Therapeutic Corporation. Mr. Rich also worked for Alpha Therapeutic Corporation as Vice President and General Manager of International Operations from October 1995 to July 1997. In between his two terms at Alpha Therapeutic Corporation, Mr. Rich worked for us from January 1983 to October 1995 and served as our co-President for the period December 1985 through his departure in 1995. Mr. Rich earned a Bachelors of Science degree from California Polytechnic University, Pomona.
David Ian Bell
Mr. Bell joined us as a Vice President of Grifols Inc. in July 2003 and has since been responsible for Corporate Operations and Development. He also serves as General Counsel and is a member of our Executive Committee in Spain. Mr. Bell is responsible for all legal activities of our U.S. Operations, including litigation, mergers and acquisitions, real estate transactions, intellectual property and contracts. He is also responsible for regulatory, registrations and licensing, governmental and public affairs and human resources. Prior to joining us, Mr. Bell was Vice President and General Counsel for Alpha Therapeutic Corporation. Additionally, he was a partner in the U.S. law firm of Knapp, Petersen & Clarke where he specialized in complex litigation involving healthcare, pharmaceutical and biotechnology regulation and liability. Mr. Bell attended the University of California, Irvine, Southwestern University School of Law and a postgraduate program at Harvard Law School. He is a member of the California State Bar and is admitted to practice before the United States Supreme Court and numerous federal appellate and district courts.
87
Alberto Grifols Roura
Mr. Grifols joined us in September 1985. From 1995 to 1999, he served as the Director of the international subsidiaries, from 1999 to 2008, he served as the Managing Director of Biomat, S.A., and from 2009 to 2011, he served as Managing Director of Laboratorios Grifols, S.A. From January 1, 2011 through the consummation of the acquisition Mr. Grifols was the Managing Director of the Diagnostic Industrial Division. Following the consummation of the acquisition, Mr. Grifols serves as Co-President of Institutio Grifols, S.A. Mr. Grifols is an Industrial Engineer. He received his degree from the Higher Technical School of Engineers of Terrassa (Polytechnic University of Catalonia).
Nuria Pascual Lapeña
Ms. Pascual joined us in 1996. She currently serves as Vice President, Director of Finance and Corporate Investor Relations Officer. Prior to joining us, she served in different positions at Deutsche Bank and Banco Santander de Negocios. She is a member of the board of directors of several companies related to her family’s businesses. Ms. Pascual received a degree in Economics & Business Administration and received a Masters of Sciences in Economics from the London School of Economics and Political Sciences.
Shinji Wada
Mr. Wada started his career in the plasma industry in 1981 working for a Japanese plasma fractionation company, the Green Cross Corporation, parent company of Alpha Therapeutic in Los Angeles. He assumed various positions at Alpha Therapeutic, including M&A, International Sales and Marketing. After our acquisition of Alpha’s plasma fractionation business, he was assigned to manage Biomat USA, Inc., the U.S. plasma collection arm of Grifols, S.A. and he has been CEO of Biomat USA, Inc. since 2005.
Mary Kuhn
Ms. Kuhn joined Grifols as Executive Vice President of Grifols Inc. in June 2011 and is responsible for the North American Manufacturing Division. Prior to joining Grifols Inc., Ms. Kuhn held various positions within Bayer Pharmaceuticals/Biologics and then Talecris, most recently as Executive Vice President of Operations. Ms. Kuhn received a degree in Pharmacy from Purdue University and an EMBA from the University of New Haven.
Joel Abelson
Mr. Abelson joined Grifols Inc. in June 2011 as President of North American Commercial Operations. He also serves as Corporate Vice President of Grifols Inc. Mr. Abelson worked for Talecris from March 2006 to June 2011, serving most recently as Senior Vice President and General Manager, Portfolio Management and International Business. Prior to joining Talecris, Mr. Abelson worked from 1994 to 2005 for Bayer, where he held several senior management positions in Canada and the U.S., including Vice President, Global Strategic Marketing, Biological Products Division. Prior to joining the private sector, Mr. Abelson held various policy and management positions with the Government of Ontario, Canada from 1984 to 1994, including service in the Cabinet Office as a Senior Policy Advisor to the Premier’s Policy and Priorities Board. Mr. Abelson has a Bachelor of Arts (Honours) degree from Carleton University in Ottawa, Canada and a Master’s degree in Public Administration from the University of Toronto.
Family Relationships
Mr. Víctor Grifols Roura, the Chairman of the Board and our Chief Executive Officer, and Mr. Raimon Grifols Roura, the Secretary non-member of the Board, are brothers.
Messrs. Víctor Grifols Roura, Raimon Grifols Roura and José Antonio Grifols Gras are the grandchildren of Mr. José Antonio Grifols i Roig, our founder.
Mr. Juan Ignacio Twose Roura, one of our directors and the President of our Global Industrial Division, is a cousin of Messrs. Víctor Grifols Roura and Raimon Grifols Roura. Mr. Francisco Javier Jorba Ribes is the brother-in-law of Mr. Víctor Grifols Roura.
Arrangements Pursuant to Which Certain Directors or Senior Management Were Selected
The following is a description of all arrangements or understandings with major shareholders, customers, suppliers or others pursuant to which any person named above was appointed.
Pursuant to the terms of the Merger Agreement, we agreed to appoint two individuals designated by Talecris to our Board, upon consummation of the acquisition, each for a five-year term. Messrs. Ingersoll and Mayer were designated by Talecris for such appointments and were appointed as directors in June 2011.
88
Thorthol Holdings B.V., one of our major shareholders and a related party, is represented on the Board by Mr. José Antonio Grifols Gras. The various members of the Grifols Gras family hold their respective shares indirectly through Thorthol Holdings B.V.
Compensation of Members of the Board
Our directors are entitled to receive compensation for serving on the Board. The Articles of Association generally set forth the processes for the determination of the compensation paid to the members of the Board. Article 20 of the Articles of Association provides that the maximum aggregate amount to be paid to our directors is to be established by our shareholders at our general shareholders’ meeting. The Board then determines, pursuant to Article 26 of the Regulations of the Internal Functioning of the Board of Directors of Grifols, S.A. (reglamento de funcionamiento interno del consejo de administración), or Board Regulations, how much of the shareholder-approved aggregate compensation amount will be allocated to each director as compensation, taking into account the recommendations of our appointments and remuneration committee (comisión de nombramientos y retribuciones), or Appointments and Remuneration Committee, and their dedication to our business.
Our director compensation philosophy, as set forth in Article 27 of the Board Regulations, provides that the remuneration of external directors (consejeros externos) shall be established in a manner that provides incentives for our directors to be dedicated and involved while not creating an obstacle to their independence. To that end, Article 27 further establishes that the Board, following the advice of the Appointments and Remuneration Committee, shall take the necessary measures to ensure that external directors’ remuneration adheres to the following guidelines: (a) their remuneration should be relative to their dedication, abilities and functions; and (b) they are excluded from any plans (x) consisting of the delivery of equity awards or options or other instruments linked to the value of our shares, (y) linked to our performance or (z) including retirement benefits. However, external directors may be remunerated with our shares only if they agree to hold them for the duration of the term that they hold their office.
As discussed above, our Appointments and Remuneration Committee is required, pursuant to Article 15 of the Board Regulations, to consist of between three and five members, the majority of which must be external directors. In accordance with Spanish corporate governance requirements and consistent with NASDAQ Listing Rules for foreign private issuers, our Appointments and Remuneration Committee currently consists of Mr. Víctor Grifols Roura, Mr. Edgar Dalzell Jannotta and Ms. Anna Veiga Lluch as directors, with Mr. Jannotta and Ms. Veiga qualifying as independent directors in conformity with Exchange Act requirements and NASDAQ Listing Rules. Messrs. Mayer and Ingersoll are other external directors in conformity with Spanish rules.
In accordance with the compensation policy outlined in the Articles of Association, at the shareholders’ meeting on May 24, 2011, the shareholders set the maximum annual amount available for compensation to the external independent members of the Board at €60,000 per external independent director. On such date, four members of the Board were serving as external independent directors, Thomas H. Glanzmann, Edgar Dalzell Jannotta, Anna Veiga Lluch and Luís Isasi Fernández de Bobadilla. In June 2011, Messrs. Ingersoll and Mayer joined the Board as independent directors in conformity with Exchange Act requirements and NASDAQ Listing Rules and other external directors in conformity with Spanish rules. As of the date of this annual report on Form 20-F, Edgar Dalzell Jannotta, Anna Veiga Lluch, Luís Isasi Fernández de Bobadilla, W. Brett Ingersoll and Steven F. Mayer are our independent directors in conformity with Exchange Act requirements and NASDAQ Listing Rules.
The total compensation paid to directors in 2011, in the aggregate, amounted to approximately €2,421,771. Of the total director compensation amount, (1) executive directors (consejeros ejecutivos) received €1,644,662 in fixed compensation and €597,109 in variable compensation and (2) external independent directors received €180,000. These figures include accruals for contingent or deferred compensation. The external directors nominated by an individual shareholder based on the extent of his or her shareholding, referred to as “proprietary directors” (consejeros dominicales), do not receive any compensation for their service on the Board. None of our directors received attendance fees for meetings of the Board or committees of the Board.
Finally, pursuant to Article 20 of the Articles of Association, our directors are reimbursed for all expenses incurred in connection with their service as a director.
In addition, subsequent to the acquisition of Talecris, one of our directors entered into a consulting services contract for a term of three years pursuant to which he will receive compensation in the amount of $1.0 million per year with an additional $2.0 million payable upon the fulfillment of certain conditions.
Compensation of Senior Management
In 2011, our senior management (excluding those who also served as members of the Board) were paid compensation amounting to €5,718,280 in the aggregate. This figure includes accruals for contingent or deferred compensation. The breakdown of
89
the aggregate amount paid to such senior management for discharging their duties in 2011 is set forth in the table below.
| | | | |
Component | | Amount Paid
in 2011 | |
Salaries | | | 4,345 | |
Variable Compensation | | | 1,410 | |
Stock options or other securities | | | N/A | |
Other — e.g., life and health insurance | | | N/A | |
Other — e.g., pensions/savings | | | N/A | |
Salaries paid in U.S. dollars have been calculated at the exchange rate between the U.S. dollar and the euro as of December 31, 2011 of U.S. $1.295 to €1.00.
Salaries paid in Canadian dollars have been calculated at the exchange rate between the Canadian dollar and the euro as of December 31, 2011 of CAD $1.323 to €1.00.
Equity and Other Incentive Programs
In 2011, no compensation was paid pursuant to a profit-sharing plan or any stock option and no other equity compensation was awarded to any of our directors or executive officers.
Pension and Retirement Compensation Programs
In 2011, neither we nor our subsidiaries set aside or accrued amounts to provide pension, retirement or similar benefits for our directors or executive officers.
Board of Directors
Pursuant to the Articles of Association, we are managed by a Board, which may be composed of not less than three and not more than 15 directors. Our current Board has 11 directors. Directors may be either individuals or legal entities represented by individuals. Under Spanish law, the Board is responsible for our management, administration and representation in all matters concerning the business, subject to the provisions of the Articles of Association and the powers conferred at the general shareholders’ meeting.
Appointment and Dismissal
Pursuant to the Articles of Association, directors are elected by our shareholders to serve for a term of five years and may be reelected to serve for an unlimited number of terms, except in the case of independent directors, who pursuant to the Board Regulations shall not serve as such for more than 12 years. We do not provide for the reelection of directors at staggered intervals or cumulative voting for such directors or otherwise.
A director may be either an individual or an entity represented by an individual. If a director ceases to hold office prior to the expiration of his or her term, the Board may fill the vacancy by appointing, from among our shareholders, a new director to replace the outgoing director. Any director so appointed will hold office until the next general shareholders’ meeting when the appointment may be confirmed or revoked by our shareholders. Any such appointment will be only for the remainder of the term of the outgoing director, without prejudice to such director’s eventual election. A director may resign, or be removed, from office by a resolution of our general shareholders’ meeting at any time. A director who is also our shareholder may vote freely on any of our shareholders’ resolutions relating to the appointment and dismissal of directors (including the appointment or dismissal of that director).
In addition, pursuant to the Board Regulations, a director must tender a resignation to the Board and the Board may accept such resignation, in its discretion, under the following circumstances: (i) when the director ceases to hold the executive position to which such director’s appointment to the Board was related; (ii) when the director becomes unable to hold the office due to a legal cause of ineligibility or incompatibility; (iii) when the director has been formally charged with certain crimes (including, but not limited to, crimes against personal freedom, economic crimes and crimes against the justice administration) or a formal inquiry is opened against him or her by a regulator; (iv) when the director has been severely admonished by our audit committee (comité de auditoría), or Audit Committee, for having breached his or her duties as director; (v) when the director’s participation on the Board may jeopardize our interests or when the reasons for his or her appointment cease to exist; and (vi) in the case of a proprietary
90
director, when the relevant shareholder ceases to hold its stake in us, or reduces its stake below the level that reasonably justified the appointment of such director.
In addition, under Spanish corporate law, a holder of voting shares (or group of shareholders of voting shares acting together) may, subject to availability of seats on the Board, appoint a number of directors proportionate to that shareholder’s (or group of shareholders’) interest in our voting capital. If the voting capital stock represented by the shares held by such shareholder (or group of shareholders) is equal to or greater than the result of dividing our total voting capital stock by the number of directors, such shareholder (or group of shareholders) shall have the right to appoint a proportionate number of directors. For example, a shareholder holding 20 voting shares out of a total of 100 voting shares in a company with five directors will be entitled to appoint one director. Should this power be exercised, shares so pooled shall not participate in the voting for the other members of the Board. However, they may exercise their voting rights with respect to the removal of existing directors. Since such rights apply only to voting shares or Class B shares that have recovered their voting rights, our Class B shares and the Class B ADSs that represent them in the U.S. do not count towards the proportional representation right.
The Board must appoint a Chairman of the Board from among its members. Mr. Víctor Grifols Roura is the current Chairman. The Board shall also designate one or more Vice Chairmen, who shall be numbered consecutively, and who shall replace the Chairman in the event of impossibility to act or absence.
The Board may also appoint a Secretary and a Vice Secretary. Neither the Secretary nor the Vice Secretary is required to be a member of the Board; however, the Secretary or the Vice Secretary will not be entitled to vote on matters before the Board unless he or she is a member of the Board. Mr. Raimon Grifols Roura is the current Secretary non-member of the Board and Ms. Nuria Martín Barnés is the current Vice Secretary non-member of the Board.
Meetings of the Board
Pursuant to the Articles of Association, a meeting of the Board may be called by the Chairman whenever he considers such a meeting necessary or suitable. The Chairman is also required to call a meeting at the request of one-third of the directors. Meetings of the Board are called using any means of notice at least ten days before the date of the meeting, unless exigent circumstances require a shorter term. Such notice of a meeting of the Board must state the place, date and time as well as the issues to be discussed. The Board generally holds a meeting at least every three months and is required to meet at least once a year. The Revised Text of the Spanish Companies Act (Texto Refundido de la Ley de Sociedades de Capital), or Spanish Companies Act, and our Articles of Association provide that a majority of the directors (half plus one of the directors present at a meeting) of the Board (represented in person or by proxy by another director on the Board) constitutes a quorum. Except as otherwise provided by law or specified in the Articles of Association, resolutions of the Board must be passed by an absolute majority of the directors present or represented at a meeting, with the Chairman having the right to cast a deciding vote in the event of a tie.
Delegation of Powers
Pursuant to Spanish law and our Articles of Association, the Board may delegate its powers either to an executive committee (Comision Ejecutiva) or to one or more chief executive officers. Spanish corporate law provides that resolutions appointing an executive committee, any chief executive officer or authorizing the permanent delegation of all, or part of, such board of directors’ powers, requires a two-thirds majority of the members of such board of directors and the registration of such resolution in the Spanish Commercial Registry (Registro Mercantil), or Commercial Registry. The Board may also revoke such powers at any time.
Under Spanish corporate law, a board of directors may also grant general or specific powers of attorney to any person whether or not that person is a director or a shareholder. General powers of attorney must be registered in the Commercial Registry. However, Spanish law provides that the following powers may not be delegated: (i) the formulation and submission for approval of the yearly financial statements at the general shareholders’ meeting; and (ii) those powers granted to the board of directors by a general shareholders’ meeting (unless otherwise provided in the relevant shareholders’ resolution).
Mr. Víctor Grifols Roura is currently our Chairman of the Board and Chief Executive Officer.
Expiration of Current Terms
The periods during which our directors and senior management have served in their offices, as well as the date of expiration of each director’s term, are shown in the tables under “— A. Directors and Senior Management” above.
91
Termination Benefits
Neither we nor any of our subsidiaries has service contracts with our directors providing for benefits upon termination of their employment.
Committees of the Board
The Board has an Audit Committee and an Appointments and Remuneration Committee. The following is a brief description of such committees.
Audit Committee
The Board established an Audit Committee in compliance with Articles 24.bisand 24.ter of the Articles of Association and Article 14 of the Board Regulations.
The regulations applicable to the Audit Committee are set forth in the provisions referred to above, as well as the bylaws of the Audit Committee, which were approved by the Board and the Audit Committee on December 9, 2008. In connection with the acquisition, at a Board meeting held on May 24, 2011, the Articles of Association and Board Regulations were amended to conform to NASDAQ Listing Rules and to facilitate the listing of our Class B ADSs on NASDAQ.
The Audit Committee consists of a minimum of three directors and a maximum of five directors who are appointed by the Board based on such directors’ knowledge, competence and experience in accounting, audit and risk management matters. The majority of the members of the Audit Committee must be external directors, which includes independent directors and proprietary directors. In addition, all members of the Audit Committee, including the chairman, must meet the independence, experience and other requirements set forth in the Exchange Act and NASDAQ Listing Rules.
The responsibilities of the Audit Committee include:
| | • | | reporting to the shareholders at general shareholders meetings regarding matters for which the Audit Committee is responsible; |
| | • | | having sole authority to recommend to the Board the appointment, hiring and replacement of the external auditor regardless of the faculties vested in the general shareholders’ meeting and the Board with regard to the approval of such resolutions under Spanish law; |
| | • | | (i) monitoring the internal audit services and proposing the selection, appointment, reelection and resignation of the manager of our internal audit department; (ii) proposing the budget for our internal audit department; (iii) receiving periodic information on our internal audit department’s activities (including the annual work plan and annual activities reports prepared by the manager); and (iv) ensuring that management takes the conclusions and recommendations of their reports into account; |
| | • | | setting up and supervising procedures for the receipt, retention and treatment of complaints regarding accounting, internal controls or auditing matters, as well as the confidential and anonymous submission by employees of concerns regarding questionable accounting or auditing matters; |
| | • | | knowing the process for gathering financial information and the internal control system; reviewing the annual accounts and the periodic financial statements that should be submitted to the securities regulatory authorities and making sure that the appropriate accounting standards are followed; reporting to the Board on any change in the accounting standards and on balance sheet and off balance sheet risks; |
| | • | | receiving information from the auditors regarding matters that could impair their independence, or any other matters relating to conduct of audits of the financial statements as well as any other communications provided for in the legislation governing audits of financial statements and in technical auditing regulations; |
| | • | | supervising any transactions entered into with significant shareholders as set forth in the Board Regulations; and |
| | • | | (i) ensuring compliance with the Internal Code of Conduct of Grifols, S.A. in Matters Relating to the Stock Market (the “Stock Market Code of Conduct”), the Board Regulations and the Code of Conduct for Grifols’ Employees (the “Employee Code of Conduct”) (each available on our website, which does not form part of this annual report on Form 20-F, atwww.grifols.com) and, in general, any other corporate regulations and (ii) making any necessary proposals to improve such regulations. |
92
The Audit Committee currently consists of Messrs. Luís Isasi Fernández de Bobadilla, Steven F. Mayer and W. Brett Ingersoll. Each of Messrs. Isasi, Mayer and Ingersoll is independent in conformity with Exchange Act requirements and NASDAQ Listing Rules, and each of them is an external director. Mr. Tomás Dagá Gelabert serves as Secretary non-member of the Audit Committee.
Appointments and Remuneration Committee
Pursuant to Article 15 of the Board Regulations, the Appointments and Remuneration Committee is required to consist of between three and five members, the majority of which must be external directors, which includes independent directors and proprietary directors.
The responsibilities of the Appointments and Remuneration Committee include:
| | • | | assisting in the nomination of directors, including evaluating potential nominees in light of the level of knowledge, competence and experience necessary to serve on the Board; |
| | • | | reporting and making proposals to the Board on the appointment of members to the various committees of the Board and on the persons who should hold the office of Secretary and Vice Secretary of the Board; |
| | • | | making proposals for the orderly and planned succession of the Chairman of the Board and the Chief Executive Officer; |
| | • | | reporting on proposals for the appointment and removal of any members of senior management made by the Chief Executive Officer; |
| | • | | making proposals on the remuneration plans for the Board and senior management; |
| | • | | periodically reviewing the remuneration plans of senior management, including considering their suitability and performance; and |
| | • | | reporting on transactions in which directors may have a conflict of interest. |
The Appointments and Remuneration Committee currently consists of Mr. Víctor Grifols Roura, Mr. Edgar Dalzell Jannotta and Ms. Anna Veiga Lluch. Each of Mr. Jannotta and Ms. Veiga are independent directors in conformity with Exchange Act requirements and NASDAQ Listing Rules. Mr. Raimon Grifols Roura serves as Secretary non-member of the Appointments and Remuneration Committee.
The table below indicates the average number of employees by department for the fiscal years ended December 31, 2011, 2010 and 2009:
| | | | | | | | | | | | |
Department | | 2011 | | | 2010 | | | 2009 | |
Manufacturing | | | 8,668 | | | | 4,443 | | | | 4,586 | |
Research & development — technical area | | | 695 | | | | 271 | | | | 264 | |
Administration and others | | | 778 | | | | 472 | | | | 453 | |
General management | | | 139 | | | | 98 | | | | 95 | |
Marketing | | | 142 | | | | 102 | | | | 98 | |
Sales and distribution | | | 808 | | | | 582 | | | | 488 | |
Total | | | 11,230 | | | | 5,968 | | | | 5,984 | |
The table below indicates the average number of employees by geographic region for the fiscal years ended December 31, 2011, 2010 and 2009:
| | | | | | | | | | | | |
Geographic Region | | 2011 | | | 2010 | | | 2009 | |
Spain | | | 2,390 | | | | 2,375 | | | | 2,344 | |
North America | | | 8,342 | | | | 3,184 | | | | 3,323 | |
Rest of the World | | | 498 | | | | 408 | | | | 317 | |
Total | | | 11,230 | | | | 5,968 | | | | 5,984 | |
The substantial increase in the average number of employees by department and geographic region in the fiscal year ended December 31, 2011 as compared to the fiscal year ended December 31, 2010 is primarily attributable to our acquisition of Talecris.
93
We actively train our employees. The Grifols Academy opened in Spain during the second quarter of 2011. It is a meeting point for advanced training on all processes related to the preparation and production of plasma-derived medicines. In addition, the Grifols Academy serves to actively spread and strengthen the “Grifols’ spirit” that guides employee actions and their understanding of the business. It also acts as a center of technical, scientific and management training for the Group’s personnel, fostering a continued exchange among experts and external bodies, such as professional healthcare associations, hospitals, schools and universities.
The Grifols Academy follows the standards set by the Grifols Academy of Plasmapheresis, opened in Phoenix, Arizona in 2009. In 2011, Grifols provided 26,611 training courses to its employees worldwide, at which over 260,791 hours of training were taught.
Our Spanish employees are represented by two labor unions, the Workers’ Commissions (Comisiones Obreras) and the Workers General Union (Unión General de Trabajadores). The employees of some of our subsidiaries in Spain, Germany, Italy, France and Argentina are covered by collective bargaining agreements. The remainder of our employees are not represented by labor unions. We have not experienced any significant work stoppages in the last 15 years, except for a one-day general strike in Spain in June 2002. We generally consider our employee relations to be good.
We subscribe to an insurance policy that covers death or permanent disability of employees caused by work accidents. All of our employees are covered under this policy. We implemented a pension plan in all our Spanish entities beginning on January 1, 2002, which excludes top management and which requires us to make matching payments to these employees. Our contribution to this pension plan was approximately €522,000 in 2011, up from approximately €460,000 for 2010.
For information on the direct, indirect and represented holdings of our current directors and executive officers with respect to our Class A shares as of December 31, 2011, see Item 7 of this Part I, “Major Shareholders and Related Party Transactions — A. Major Shareholders.”
We do not have any agreements, plans or arrangements in effect that provide for the issue or grant of options or shares or securities.
| Item 7. | MAJOR SHAREHOLDERS AND RELATED PARTY TRANSACTIONS |
The following table sets forth certain information, including information regarding beneficial ownership of our Class A (voting) shares as of December 31, 2011, for (i) our major shareholders, including, in accordance with applicable Spanish regulations, each person or entity that is known to us to be the beneficial owner of more than 3% of our Class A shares, (ii) each of our directors and (iii) each member of our senior management. As of that date, there were a total of 213,064,899 Class A shares issued and outstanding.
Since our Class A shares are represented through book entries, their exact ownership structure cannot be known, except through the information that the shareholders provide voluntarily or in compliance with applicable regulations, and information
94
provided by theSociedad de Gestión de los Sistemas de Registro, Compensación y Liquidación de Valores, S.A., or Iberclear, on which the shares are settled and cleared, and its participant entities (entidades participantes).
| | | | | | | | |
Name of Beneficial Owner | | Number of
Class A
Shares | | | Percentage of
Class A
Shares | |
Major Shareholders | | | | | | | | |
Capital Research and Management Company(1) | | | 31,995,474 | | | | 15.017 | |
Deria S.A.(2) | | | 18,706,988 | | | | 8.771 | |
Scranton Enterprises B.V.(3) | | | 16,149,937 | | | | 7.580 | |
Thorthol Holdings B.V.(4) | | | 15,042,766 | | | | 7.060 | |
Víctor Grifols Lucas(5) | | | 13,112,187 | | | | 6.154 | |
American Funds Insurance Series Growth Fund(6) | | | 6,400,370 | | | | 3.004 | |
| | |
Directors | | | | | | | | |
José Antonio Grifols Gras(4) | | | 15,042,766 | | | | 7.060 | |
Víctor Grifols Roura | | | 440,450 | | | | * | |
Edgar Dalzell Jannotta | | | 254,127 | | | | * | |
Ramón Riera Roca(7) | | | 169,085 | | | | * | |
Juan Ignacio Twose Roura | | | 119,274 | | | | * | |
Thomas H. Glanzmann(8) | | | 83,561 | | | | * | |
Tomás Dagá Gelabert | | | 51,898 | | | | * | |
Anna Veiga Lluch | | | 100 | | | | * | |
Luís Isasi Fernández de Bobadilla | | | 100 | | | | * | |
Steven F. Mayer | | | 0 | | | | | |
W. Brett Ingersoll | | | 0 | | | | * | |
| | |
Senior Management | | | | | | | | |
Antonio Viñes Parés | | | 111,115 | | | | * | |
Gregory Gene Rich | | | 71,598 | | | | * | |
Carlos Roura Fernández | | | 48,314 | | | | * | |
Francisco Javier Jorba Ribes | | | 47,364 | | | | * | |
Montserrat Lloveras Calvo | | | 35,309 | | | | * | |
Vicente Blanquer Torre | | | 22,377 | | | | * | |
Alberto Grifols Roura | | | 13,000 | | | | * | |
David Ian Bell | | | 10,000 | | | | * | |
Nuria Pascual Lapeña | | | 9,796 | | | | * | |
Mateo Florencio Borrás Humbert | | | 491 | | | | * | |
Alfredo Arroyo Guerra | | | — | | | | — | |
Eva Bastida Tubau | | | — | | | | — | |
Shinji Wada | | | — | | | | — | |
Mary Kuhn | | | — | | | | — | |
Joel Abelson | | | — | | | | — | |
| (1) | Capital Research and Management Company has indirect voting rights over all 31,995,474 our Class A shares. American Funds Insurance Series Growth Fund has direct voting rights over 8,771,882 of our Class A shares reported by Capital Research and Management Company. |
| (2) | The various members of the Grifols Roura family hold their respective shares indirectly through Deria S.A. |
| (3) | Scranton Enterprises B.V. is a corporation whose shares are owned by certain of our directors and by William Blair & Co. L.L.C. Some Grifols family members who are directors or executive officers hold part of their shares indirectly through Scranton Enterprises B.V. |
| (4) | The various members of the Grifols Gras family hold their respective shares indirectly through Thorthol Holdings B.V., which is represented on the Board by José Antonio Grifols Gras. |
| (5) | 13,112,187 Class A shares are held directly by Rodellar Amsterdam B.V., through which Víctor Grifols Lucas exercises indirect voting rights. |
| (6) | American Funds Insurance Series Growth Fund has direct voting rights over all 6,400,370 of our Class A shares. American Funds Insurance Series Growth Fund has delegated the right to vote its proxies to Capital Research and Management Company, its investment advisor. |
95
| (7) | 8,000 Class A shares are held indirectly. |
| (8) | 65,000 Class A shares are held indirectly through Kolholmen Investments AB. |
To our knowledge, we are not controlled, directly or indirectly, by any other corporation, government or any other natural or legal person. We do not know of any arrangements which would result in a change in our control.
Significant Changes in Ownership
In accordance with Spanish reporting requirements, the following transfers of shares were reported to the Spanish National Securities Market Commission (Spanish Comisión Nacional del Mercado de Valores), or CNMV, as of December 31, 2011: (i) April 9, 2009, FMR LLC disposed of a number of Class A shares that reduced its percentage of ownership of voting share capital below 3%; (ii) on December 4, 2009, Víctor Grifols Lucas acquired a number of Class A shares that increased his percentage of ownership of voting share capital above 5%; (iii) on April 12, 2010, American Funds Insurance Series Growth Fund acquired a number of Class A shares that increased its percentage of ownership of voting share capital above 3%; (iv) on November 12, 2010, The Bank of New York Mellon Corporation disposed of a number of Class A shares that decreased its percentage of ownership of voting share capital below 3%; (v) on May 25, 2011, Fidelity International Limited disposed of a number of Class A shares that decreased its percentage of ownership of voting share capital below 1%; (vi) on June 30, 2011, Capital Research and Management Company acquired a number of Class A shares that increased its percentage of ownership of voting share capital above 15%; and (vii) on August 4, 2011, Blackrock, Inc. disposed of a number of Class A shares that decreased its percentage of ownership of voting share capital below 3%.
Voting Rights
Each of our Class A shares is entitled to one vote, except that the voting rights of Class A shares held in treasury by us or by any of our direct subsidiaries are suspended. Class A shares held by our major shareholders, directors or senior management do not entitle such shareholders to different voting rights.
Our Class B shares generally do not have voting rights, except with respect to certain extraordinary matters which require approval by a majority of outstanding Class B shares, as set forth in Item 10 of this Part I, “Additional Information — B. Memorandum and Articles of Association — Shareholder Rights — Class B Shares — Separate Vote at General Shareholder Meetings on Extraordinary Matters.”
See Item 10 of this Part I, “Additional Information — B. Memorandum and Articles of Association — Shareholder Rights” for further details regarding our Class A shares and Class B shares.
| | B. | Related Party Transactions |
Patent and Trademark Use
Mr. José Antonio Grifols Gras, a member of the Board, is the manager of Marca Grifols, S.L., which owns the trademark “Grifols.” In addition, the Grifols family is the controlling shareholder of Marca Grifols, S.L. We entered into a license agreement with Marca Grifols, S.L. on January 26, 1993 that permits us to use the “Grifols” trademark for 99 years. The license agreement provides that we must pay an annual fee for the license, which is based on inflation and our net sales. In 2011, the fees for this license were €1.7 million.
Certain patents that we use were originally registered in the names of Mr. Víctor Grifols Lucas, our former Chief Executive Officer and Mr. Víctor Grifols Roura. We have previously freely used many of these patents without any formal licensing agreements and without paying any consideration. In June 2004, Mr. Grifols Lucas and Mr. Grifols Roura acknowledged in writing that such patents belong to us and in February 2006, they formally completed the transfer of these patents to us for an immaterial amount.
Sale-leaseback Transactions
Spain
In May 2011, we sold five properties in Spain for an aggregate amount of €80.4 million to Gridpan Invest, S.L., a wholly owned subsidiary of Scranton Enterprises, B.V., one of our major shareholders. These properties related primarily to non-core assets such as offices and warehouses and a factory premise. Two of the premises were sold together with their related mortgage loans for a total of €53.5 million. As a result of the sale, we recognized a net loss of €7.4 million, which included €2 million in brokerage fees paid to Scranton Enterprises, B.V. The prices paid for the properties were established based on appraisals made by independent appraisers.
96
Simultaneous with the sale, we entered into operating lease agreements with Gridpan Invest, S.L. with respect to the aforementioned properties. The key terms of the operating lease agreements are:
| | • | | an initial term of five years; |
| | • | | initial rent established at market prices, to be reviewed annually, based on the percentage variation in the Spanish Consumer Price Index; |
| | • | | automatic extensions for five-year periods that can be terminated by either party with six months advance notice; and |
| | • | | upon us vacating the premises, reimbursement from the lessor for the remaining value of any leasehold improvements. |
In addition, we entered into a purchase option with respect to the shares of Gridpan Invest, S.L. exercisable between May 10, 2016 and May 10, 2017. The exercise price will be at market value at the date of exercise, based on appraisals made by independent appraisers.
The lease expenses incurred in the fiscal year ended December 31, 2011 for these contracts amounted to €4.9 million, which related to the minimum contractual payments.
See Notes 9(h) and 33 to our audited consolidated financial statements included in this annual report on Form 20-F for further details of our sale-leaseback transactions with related parties.
Clayton, North Carolina
In December 2011, we entered into a number of contracts for the sale and subsequent leaseback of certain buildings and equipment under construction in Clayton, North Carolina, with Scranton Enterprises USA, Inc., a company owned by Scranton Enterprises, B.V., one of our major shareholders.
The sale price was $199 million, of which $115 million was paid as of December 31, 2011. The remaining $84 million is to be paid prior to June 30, 2012. This balance is not subject to interest.
As a result of the transaction, we have incurred a net loss of $12.1 million, primarily due to the brokerage fees paid to Scranton Enterprises, B.V., which amounted to $10 million.
The key terms of the building operation lease are as follows:
| | • | | an initial lease period of eight years; |
| | • | | annual rent established at a minimum of $20.5 million, subject to annual increases in line with inflation; |
| | • | | optional five-year renewal term; |
| | • | | automatic renewal for subsequent five-year periods unless one of the parties provides six months’ advance notice; |
| | • | | upon us vacating the premises, compensation by the lessor for any on-site assets in which we have invested, insofar as these have a residual value and are not recoverable by us; and |
| | • | | the requirement that we lodge a cash or bank guarantee of $25 million upon the request of Scranton Enterprises USA Inc. |
We are leasing the land for an initial lease period of 99 years at a minimum annual rent of $1 per year.
We also entered into a purchase option for the shares of Scranton Investments, B.V. This option, which cost $4 million, is exercisable on the date on which a license is granted by the FDA, five and ten years from such date, and on the expiration date of the building operation lease. The purchase price will vary depending on the market value determined on the date the option is exercised.
See Notes 9(h) and 33 to our audited consolidated financial statements included in this annual report on Form 20-F for further details of our sale-leaseback transactions with related parties.
Legal Services
Mr. Tomás Dagá Gelabert, a member of the Board, Mr. Raimon Grifols Roura, Secretary of the Board, and Ms. Nuria Martín Barnés, Vice Secretary of the Board, are partners at the Barcelona office of the Osborne Clarke, S.L.P. Osborne Clarke, S.L.P. is advising us with regard to Spanish law in connection with the preparation of this annual report on Form 20-F and renders various other legal services to us. In the fiscal year ended December 31, 2011, we paid €10.4 million to Osborne Clarke, S.L.P. in connection with acquisition of
97
Talecris and the increase in our share capital. We believe that the fees we pay for these services are comparable to those we would have had to pay to a third-party law firm for similar services.
Charitable Contributions
In 2011, we contributed to two charitable foundations, the Mr. Víctor Grifols i Lucas Foundation and the Probitas Private Foundation, which were formed by us, and certain of our current officers and directors serve as patrons of the Probitas Private Foundation.
The Mr. Víctor Grifols i Lucas Foundation provides grants to further the study of bioethics. It was created in 1998 with the mission of promoting bioethics through dialogue between specialists in a range of areas. The Víctor Grifols i Lucas Foundation seeks to foster ethical attitudes in organizations, companies and individuals active in the field of human health, offering a discussion platform that provides a forum for the exchange of different perspectives. Mr. Víctor Grifols i Lucas is our former Chief Executive Officer and is the father of both Mr. Víctor Grifols Roura, our Chairman of the Board and Chief Executive Officer, and Mr. Raimon Grifols Roura, the Secretary non-member of the Board. In 2011, we contributed €180,000 to the Víctor Grifols i Lucas Foundation.
The Probitas Private Foundation provides medical and sanitary assistance to international communities that lack medical and sanitary resources or that have an urgent and essential need for such services due to catastrophes. The Probitas Private Foundation was founded by us in 2008. Messrs. Raimon Grifols Roura, a Secretary non-member of our Board, and Tomás Dagá Gelabert, one of our directors, are patrons of the Probitas Private Foundation. In 2011, we contributed €472,600 to the Probitas Private Foundation. We contribute to the Probitas Private Foundation an amount equal to 0.7% of our profits before tax each year.
Consultant Agreement
Subsequent to the acquisition of Talecris, one of our directors entered into a consulting services contract for a term of three years, pursuant to which he will receive compensation in the amount of $1.0 million per year with an additional $2.0 million payable upon the fulfillment of certain conditions.
Loans
We have not extended any advances or loans to members of the Board or key management personnel nor have we assumed any guarantee commitments on their behalf. We also have not assumed any pension or life insurance obligations on behalf of former or current members of the Board or key management personnel.
| | C. | Interests of Experts and Counsel |
Not Applicable.
| Item 8. | FINANCIAL INFORMATION |
| | A. | Consolidated Statements and Other Financial Information |
Financial Statements
See our audited consolidated financial statements starting on page F-1 of this annual report on Form 20-F.
Legal Proceedings
We are involved in various legal proceedings in the ordinary course of our business. In the event of adverse outcomes of these proceedings, we believe that resulting liabilities will either be covered by insurance or not have a material adverse effect on our financial condition or results of operations. See Note 31(e) to our audited consolidated financial statements for additional information regarding the legal proceedings in which we are involved.
Alpha Consent Decree
As of December 31, 2011, our Los Angeles facility was operating under a consent decree, which it had been operating under since 1998. The consent decree was agreed to by Alpha, the operator of the plant at that time, the FDA and the DOJ as a result of certain quality deficiencies. We acquired this plant from Alpha in 2003 with the consent decree in place. The consent decree provided for annual inspection of the plant by the FDA. On March 15, 2012, the United States District Court for the Central District of California entered an order vacating the consent decree on the Los Angeles facility.
98
Hemophilia Associations
Since the 1980s, it has been alleged that hemophiliacs became infected with hepatitis C or the HIV virus by using clotting factor concentrates derived from human plasma, like our Factor VIII products. Beginning in 1997, the Spanish Hemophilia Association (Federación Española de Hemofilia) has periodically approached us seeking contributions on behalf of Spanish hemophiliacs who had been infected during the 1980s with hepatitis C or the HIV virus. Neither the Spanish Hemophilia Association nor any of its members has ever commenced formal legal proceedings against us (except for three cases brought by members that were adjudicated in our favor). We have been involved in several legal proceedings relating to such matters.
In February 2005, a claimant brought a claim against the Health Board of Castilla y León claiming €180,000 in damages due to the alleged contraction of hepatitis C, and the health authorities requested that this claim be extended to include us. We contested this claim, and the claim was rejected by the Administrative Court in February 2011. The claimant has filed another appeal before the Supreme Court of Spain, which is pending final resolution.
In 2007, we were notified of a claim for maximum damages of €12,690,000 filed by a group of 100 Catalan hemophiliacs against all plasma fractionation companies. During 2008, this claim was rejected. The ruling was appealed, but the claim was rejected by the Appeals Court of Barcelona in January 2011. The claimant filed another appeal before the Catalan High Court in, and that appeal was rejected in January 2012. The claimant has filed an appeal before the Supreme Court of Spain, which is pending resolution.
Plasma Centers of America, LLC
Talecris had a three-year Amended and Restated Plasma Sale/Purchase Agreement with Plasma Centers of America, LLC, or PCA (the “PCA Agreement”) under which Talecris was required to purchase annual minimum quantities of plasma from plasma collection centers approved by Talecris, including the prepayment of 90% for unlicensed plasma. Talecris was also committed to finance the development of up to eight plasma collection centers, which were to be used to source plasma for Talecris. Under the terms of the PCA Agreement, Talecris had a conditional obligation to purchase such centers under certain conditions for a sum determined by a formula set forth in the PCA Agreement. Talecris provided approximately $4 million (excluding accrued interest) in financing related to the development of such centers and advanced payments for unlicensed plasma. Talecris recorded a provision within selling, general and administrative expenses during 2008 related to loans and advances provided.
In August 2008, Talecris notified PCA that it was in breach of the PCA Agreement. Talecris terminated the PCA Agreement in September 2008. In November 2008, Talecris Plasma Resources filed suit in federal court in Raleigh, North Carolina against the G&M Crandall Limited Family Partnership and its individual partners as guarantors of obligations of PCA. Talecris was served in January 2009 in a parallel state action by PCA, alleging breach of contract by Talecris Plasma Resources. The federal case has been stayed. On December 13, 2010, a jury in the state court case rendered a verdict in the amount of $37 million in favor of PCA against Talecris Plasma Resources in a breach of contract claim. Talecris management filed an appeal to the North Carolina Court of Appeals to review the judgment entered in this case. In the event that the jury’s verdict is confirmed, an interest rate of 8% will run from the date of breach. This interest would amount to approximately $9.8 million at December 31, 2011, of which $1.7 million has been accrued since the consummation of the acquisition. The current provision for the PCA judgment on our consolidated balance sheet amounts to $46.6 million. During the first quarter of 2011, Talecris secured an appeal bond from a surety company in the amount of $25 million with respect to the PCA litigation.
Foreign Corrupt Practices Act Investigation
We are continuing an internal investigation into potential violations of the FCPA by Talecris relating to events prior to the acquisition. In July 2009, Talecris voluntarily contacted the DOJ to advise it that it was conducting an internal investigation into potential violations of the FCPA. The FCPA investigation is being conducted by outside counsel under the direction of the Board. The investigation into possible improper payments to individuals and entities made after Talecris’ formation initially focused on payments made in connection with sales in certain Eastern European and Middle Eastern countries, primarily Belarus, Russia and Iran, but we are also reviewing sales practices in Brazil, Bulgaria, China, Georgia, Libya, Poland, Turkey, Ukraine and other countries as deemed appropriate.
The DOJ has not indicated what action it may take, if any, against us or any individual, or the extent to which it may conduct its own investigation. Even though Talecris self-disclosed this matter to the DOJ and we continue to cooperate with the DOJ on this matter, the DOJ or other federal agencies may seek to impose sanctions on us that may include, among other things, debarment, injunctive relief, disgorgement, fines, penalties, appointment of a monitor, appointment of new control staff or enhancement of existing compliance and training programs. Other countries in which Talecris conducted business may initiate their own investigations and impose similar penalties. As a result of this investigation, shipments to some of these countries have been suspended while we put additional safeguards in place. In some cases, safeguards involved terminating consultants and suspending
99
relations with or terminating distributors in countries under investigation as circumstances warranted. Talecris resumed sales in countries where it believed that it had appropriate safeguards in place, and we are reallocating products to other countries as necessary. We made an initial presentation of some of the findings of the internal FCPA investigation to the DOJ in July 2011, and we will continue to present our findings from the investigation to the DOJ. Given the preliminary nature of the findings, our continuing investigation and the uncertainties regarding this matter, we are unable to estimate the final outcome. Any sanctions or loss of business could have a material adverse effect on us or our results of operations, financial condition, or cash flows.
Compliance with Pharmaceutical Pricing Agreement
In November 2009, Talecris received a letter from the U.S. Attorney’s Office, or USAO, for the Eastern District of Pennsylvania. The USAO requested a meeting to review Talecris’ compliance with the terms of the PPA under the PHS program. Specifically, the USAO asked for information related to the sale of Talecris’ IGIV product, Gamunex®, under that program. In order to have federal financial participation apply to their products under the Medicaid program and to obtain Medicare Part B coverage, manufacturers are required to enter into a PPA. The PPA obligates manufacturers to charge covered entities the PHS price for drugs intended for outpatient use. The PHS price is based on the Medicaid rebate amount. If the USAO determines that Talecris’ practices were inconsistent with the terms of the PPA, the USAO has stated that it may file a civil action against Talecris under the Anti-Fraud Injunction Act and seek a court order directing Talecris to comply with the PPA or, potentially, proceed under some other legal theory. We could also be subject to fines, damages, penalties, appointment of a monitor or enhancement of existing compliance and training programs as a result of government action. We cooperated with and responded to information requests from the USAO. We believe that we have complied with the terms of the PPA and federal law.
Antitrust Approval of Talecris-Grifols Merger
On July 20, 2011, the FTC issued the Consent Order to settle its May 31, 2011 charges that Grifols’ acquisition of Talecris was anticompetitive and would have resulted in higher prices for consumers. In accordance with the settlement of the FTC’s charges, Grifols completed the acquisition of Talecris on June 1, 2011. Pursuant to the Consent Order, Grifols divested to Kedrion, on June 2, 2011, certain assets, including Talecris’ Melville, New York manufacturing facility and United States marketing rights to Koate®-DVI anti-hemophilic factor, and an agreed quantity of plasma and subsequently transferred to Kedrion two plasma collection centers located in Mobile, Alabama, and Winston Salem, North Carolina. Further, pursuant to the Consent Order, Grifols and Kedrion entered into a contract manufacturing agreement under which Grifols will supply to Kedrion, for a period of seven years, Koate®-DVI and private label IVIG and albumin, for sale by Kedrion in the United States, and Grifols extended to Kedrion a five-year option for Kedrion to purchase a non-exclusive license to Koate®-DVI-related intellectual property for use in the United States. In accordance with the Consent Order, Grifols will lease the Melville facility from Kedrion for a period of at least three years. The Consent Order provides for a monitor to oversee Grifols’ compliance with the Consent Order and requires Grifols to submit to the FTC annual compliance reports for ten years. Our next compliance report is due in July 2012.
Dividend Policy
Class A Shares
Our dividend policy has historically been to pay out approximately 40% of our net consolidated profits. However, the terms of the Amended and Restated Senior Credit Agreement contain limitations on our ability to pay ordinary dividends going forward, and we do not expect to be able to declare dividends in cash at historical levels for some period of time. For a further discussion of the terms of the Amended and Restated Senior Credit Agreement, see Item 5 of this Part I, “Operating and Financial Review and Prospects — B. Liquidity and Capital Resources — Sources of Credit — Amended and Restated Senior Credit Agreement.”
In addition, the availability of the reserves for distribution is subject to limitations under Spanish law. The distributable reserves of us and our Spanish subsidiaries are limited by the amount of mandatory reserves, which include, for us and each of our Spanish subsidiaries, the legal reserves and the amount of capitalized research and developments pending to be amortized by us and each of our Spanish subsidiaries. This limitation on distributable reserves due to capitalized research and developments expenditure amounted, on a consolidated basis, to €29.7 million at December 31, 2011.
The Board intends to propose to shareholders at the upcoming annual general meeting of shareholders that profits for the fiscal year ended December 31, 2011 in the amount of €167,000 be transferred to reserves.
Class B Shares
We have not issued a dividend to our Class B shareholders since we issued our Class B shares on June 1, 2011.
100
Each Class B share entitles its holder to receive a minimum annual preferred dividend out of the distributable profits at the end of each fiscal year the share is outstanding equal to €0.01 per Class B share. In any given fiscal year, we will pay a preferred dividend to the holders of the Class B shares before any dividend out of the distributable profits for such fiscal year is paid to the holders of Class A shares. The preferred dividend on all issued Class B shares will be paid by us within the nine months following the end of that fiscal year, in an amount not to exceed the distributable profits obtained during that fiscal year.
On February 29, 2012, we entered into the Amended and Restated Senior Credit Agreement, which provided for the repricing of all of the Original Senior Term Loans and the Original Revolving Facilities. The Amended and Restated Senior Credit Agreement provides for the Amended Senior Term Loans aggregating $2.3 billion and €420 million, and the Amended Revolving Credit Facilities in the amounts of $140 million, €22 million and the $35 million equivalent in multicurrencies. In addition to repricing, the Amended and Restated Credit Agreement provides for the reduction of interest rates, the removal of certain financial and negative covenants, the amendment of the leverage ratio restricting the distribution of dividends and voluntary debt repayment through the early amortization of $240 million. For a summary of the material terms of the Amended and Restatement Credit Agreement, see Item 5 of this Part I, “Operating and Financial Review and Prospects — B. Liquidity and Capital Resources — Sources of Credit — Amended and Restated Senior Credit Agreement.”
| Item 9. | THE OFFER AND LISTING |
| | A. | Offer and Listing Details |
Price History of Class A Shares and Class B Shares
The following table sets forth the high and low market prices, in euro, for our Class A shares for the periods indicated, as reported on the Automated Quotation System:
| | | | | | | | |
| | | Class A Shares | |
| | | High | | | Low | |
Fiscal Year 2007 | | | | | | | | |
Annual | | | 18.70 | | | | 9.90 | |
Fiscal Year 2008 | | | | | | | | |
Annual | | | 21.35 | | | | 11.55 | |
Fiscal Year 2009 | | | | | | | | |
Annual | | | 14.53 | | | | 10.10 | |
Fiscal Year 2010 | | | | | | | | |
First Quarter | | | 12.45 | | | | 10.02 | |
Second Quarter | | | 11.68 | | | | 8.32 | |
Third Quarter | | | 10.94 | | | | 8.11 | |
Fourth Quarter | | | 11.79 | | | | 8.86 | |
Fiscal Year 2011 | | | | | | | | |
First Quarter | | | 12.49 | | | | 9.85 | |
Second Quarter | | | 14.49 | | | | 12.12 | |
Third Quarter | | | 15.80 | | | | 12.70 | |
Fourth Quarter | | | 14.50 | | | | 10.94 | |
Recent Months | | | | | | | | |
September 2011 | | | 14.61 | | | | 13.24 | |
October 2011 | | | 14.50 | | | | 13.31 | |
November 2011 | | | 13.29 | | | | 10.94 | |
December 2011 | | | 13.42 | | | | 11.86 | |
January 2012 | | | 14.33 | | | | 12.73 | |
February 2012 | | | 15.68 | | | | 13.88 | |
March 2012 (through March 23) | | | 16.00 | | | | 15.36 | |
101
The following table sets forth the high and low market prices, in euro, for our Class B shares for the periods indicated, as reported on the Automated Quotation System:
| | | | | | | | |
| | | Class B Shares | |
| | | High | | | Low | |
Fiscal Year 2011 | | | | | | | | |
Second Quarter (from June 2nd) | | | 12.97 | | | | 9.09 | |
Third Quarter | | | 10.64 | | | | 7.27 | |
Fourth Quarter | | | 9.09 | | | | 7.36 | |
Recent Months | | | | | | | | |
September | | | 9.55 | | | | 7.27 | |
October | | | 8.99 | | | | 8.18 | |
November | | | 9.09 | | | | 7.36 | |
December | | | 9.00 | | | | 7.40 | |
January 2012 | | | 9.90 | | | | 8.30 | |
February 2012 | | | 10.74 | | | | 9.60 | |
March 2012 (through March 23) | | | 12.00 | | | | 10.33 | |
Price History of the Class A ADSs and Class B ADSs
Our Class A ADSs are not listed on a national exchange and have traded on the Over the Counter Bulletin Board, an electronic stock listing service provided by NASDAQ, since July 2009.
Our Class B ADSs have been listed and traded on the NASDAQ Global Select Market since June 2, 2011. Each Class B ADS represents one-half of one Class B share and is evidenced by an ADR.
The following table sets forth the high and low market prices, in U.S. dollars, for the Class B ADSs for the periods indicated, as reported by NASDAQ:
| | | | | | | | |
| | | Class B ADSs | |
| | | High | | | Low | |
Fiscal Year 2011 | | | | | | | | |
Second Quarter (from June 2nd) | | | 8.50 | | | | 6.85 | |
Third Quarter | | | 8.16 | | | | 5.30 | |
Fourth Quarter | | | 6.75 | | | | 4.77 | |
Recent Months | | | | | | | | |
August | | | 8.07 | | | | 6.33 | |
September | | | 6.99 | | | | 5.30 | |
October | | | 6.75 | | | | 6.00 | |
November | | | 6.26 | | | | 4.90 | |
December | | | 5.65 | | | | 4.77 | |
January 2012 | | | 6.50 | | | | 5.32 | |
February 2012 | | | 7.16 | | | | 6.33 | |
March 2012 (through March 23) | | | 7.51 | | | | 6.79 | |
Not Applicable
Our Class A shares have been listed on the Spanish Stock Exchanges since May 17, 2006 and are quoted on the Automated Quotation System under the ticker symbol “GRF.” Our Class B shares were issued in connection with the acquisition of Talecris, were listed on the Spanish Stock Exchanges on June 2, 2011 and are quoted on the Automated Quotation System under the ticker symbol “GRF.P.”
Spanish Securities Market
The Spanish Stock Exchanges consist of four stock exchanges located in Madrid, Barcelona, Bilbao and Valencia. The majority of the transactions conducted on them are done through the Automated Quotation System. During the year ended
102
December 31, 2011, the Automated Quotation System accounted for the majority of the total trading volume of equity securities on the Spanish Stock Exchanges.
Automated Quotation System
The Automated Quotation System was introduced in 1989 and links the Spanish Stock Exchanges, providing those securities listed on it with a uniform continuous market that eliminates most of the differences among the Spanish Stock Exchanges. The principal feature of the system is the computerized matching of buy and sell orders at the time of entry of the order. Each order is executed as soon as a matching order is entered, but can be modified or canceled until executed. The activity of the market can be continuously monitored by investors and brokers. The Automated Quotation System is operated and regulated by the Sociedad de Bolsas, a corporation owned by the companies that manage the Spanish Stock Exchanges. All trades on the Automated Quotation System must be placed through a bank, brokerage firm, an official stock broker or a dealer firm member of a local exchange directly.
There is a pre-opening session held from 8:30 a.m. to 9:00 a.m. local time each trading day, during which orders are placed. The computerized trading hours are from 9:00 a.m. to 5:30 p.m. Each session ends with a five-minute auction, between 5:30 and 5:35 p.m., with a random closedown of 30 seconds. The price resulting from each auction is the closing price of the session.
On May 14, 2001, new rules came into effect regarding the maximum price fluctuations in the price of stocks. Under the new rules, each stock in the continuous market is assigned a static and a dynamic range within which the price can fluctuate. The price of a stock may rise or fall by its static range (which is published once a month and is calculated according to the stock’s average historic price volatility) above or below its opening price (which is the closing price of the previous session). When the stock trades outside of this range, the trading of the stock is suspended for five minutes, during which an auction takes place. After this auction, the price of the stock can once again rise or fall by its static range above or below its last auction price (which will be considered as the new static price before triggering another auction). Furthermore, the price of a stock cannot rise or fall by more than its dynamic price range (which is fixed and published once a month and is calculated according to the stock’s average intra-day volatility), from the last price at which it has traded. If the price variation exceeds the stock’s dynamic range, a five-minute auction is triggered.
Moreover, there is a block market (el mercado de bloques) allowing for block trades between buyers and sellers from 9:00 a.m. to 5:30 p.m. during the trading session. Under certain conditions, this market allows cross-transactions of trades at prices different from prevailing market prices. Trading in the block market is subject to certain limits with regard to price deviations and volumes.
Between 5:30 p.m. and 8:00 p.m., trades may occur outside the computerized matching system without prior authorization of the Sociedad de Bolsas, at a price within the range of 5% above the higher of the average price and closing price for the day and 5% below the lower of the average price and closing price for the day, if there are no outstanding bids or offers, as the case may be, on the system matching or bettering the terms of the proposed off-system transaction, and if the trade involves more than €300,000 and more than 20% of the average daily trading volume of the stock during the preceding quarter. At any time before 8:00 p.m., a trade may take place (with the prior authorization of the Sociedad de Bolsas) at any price if:
| | • | | the trade involves more than €1.5 million and more than 40% of average daily trading volume of the stock during the preceding quarter; |
| | • | | the trade relates to a merger or spin-off of a listed company; |
| | • | | the trade relates to the reorganization of a business group; |
| | • | | the trade is executed for the purposes of settling litigation; |
| | • | | the trade involves certain types of contracts or complex transactions; or |
| | • | | the Sociedad de Bolsas finds other justifiable cause. |
Information with respect to computerized trades between 9:00 a.m. and 5:30 p.m. is made public immediately, and information with respect to trades outside the computerized matching system is reported to the Sociedad de Bolsas and published in the Stock Exchange Daily Bulletin (Boletín Diario de Cotización) and in the Automated Quotation System by the next trading day.
Clearance and Settlement System
Until April 1, 2003, transactions carried out on the Spanish Stock Exchanges and the continuous market were cleared and settled through the Servicio de Compensación y Liquidación de Valores, S.A. Since April 1, 2003, the settlement and clearance of all trades on the Spanish Stock Exchanges, the Public Debt Market (Mercado de Deuda Pública), the AIAF Fixed Income Market (Mercado AIAF de Renta Fija) and the Market for Latin-American Stocks in Euros (Mercado de Valores Latinoamericanos en Euros)
103
have been made through Iberclear, which was formed as a result of a merger between the Servicio de Compensación y Liquidación de Valores, S.A andCentral de Anotaciones del Mercado de Deuda Pública, which was managed by the Bank of Spain.
Book-entry System
Ownership of shares listed on any Spanish Stock Exchange is required to be represented by entries in a register maintained by Iberclear, and transfers or changes in ownership are effected by entries in such register. The securities register system is structured in two levels: the central registry managed by Iberclear, which keeps the securities balances of the participants, and a detailed registry managed by the participants where securities are listed by holder’s name.
Securities Market Legislation
The Spanish Securities Market Act (Ley 24/1988, de 28 de Julio, del Mercado de Valores), or Securities Market Act, which came into effect in 1989, among other things:
| | • | | established an independent regulatory authority, the CNMV, to supervise the securities markets; |
| | • | | established a framework for the regulation of trading practices, tender offers and insider trading; |
| | • | | required stock exchange members to be corporate entities; |
| | • | | required companies listed on a Spanish Stock Exchange to file annual audited financial statements and to make public quarterly financial information; |
| | • | | established a framework for integrating quotations on the Spanish Stock Exchanges by computer; |
| | • | | exempted the sale of securities from transfer and value added taxes; |
| | • | | deregulated brokerage commissions as of 1992; and |
| | • | | provided for transfer of shares by book-entry or by delivery of evidence of title. |
The Securities Market Act was amended by, among others, Law 37/1998, which implemented two European Union directives that innovated the Securities Market Act. The first was the recognition that both Spanish and other European Union member state companies authorized to provide investment services have full access to the official secondary securities markets, with full capacity to operate, thereby enabling the direct admission of banking entities into the stock exchange area. The second innovation was that the scope of the Securities Market Act was enlarged to include a list of financial instruments, such as financial exchange contracts, or installment financial contracts, which expanded the categories of securities included.
The Securities Market Act was further amended by Law 44/2002 (November 22, 2002) on reform measures of the financial system, which introduced certain modifications to the laws governing financial markets and corporations generally, including:
| | • | | provisions requiring listed companies to establish an audit committee, redefining the reporting requirements for relevant events, establishing rules relating to the treatment of confidential and insider information and related party transactions, preventing manipulative and fraudulent practices with respect to market prices and otherwise regarding market transparency; |
| | • | | the establishment of Iberclear; and |
| | • | | the authorization of the Ministry of Economy and Finance (Ministerio de Economía y Hacienda) to regulate financial services electronic contracts. |
On July 17, 2003, the Securities Market Act was amended by Law 26/2003 in order to reinforce the transparency of listed companies. It introduced:
| | • | | information and transparency obligations including detailed requirements of the contents of the corporate website of listed companies and the obligation to file with the CNMV an annual corporate governance report; and |
| | • | | the obligation to implement a series of corporate governance rules including, among others, regulations regarding the boards of directors and the general shareholders’ meeting. |
On March 11, 2005, Law 5/2005 was approved, modifying the Securities Market Act in order to implement Directive 2003/71/EC of the European Parliament and of the Council of the European Union, or Council, on the prospectus to be published when securities are offered to the public or admitted to trading. The Directive (i) harmonizes the requirements for the process of approval of prospectuses, which enables a prospectus to be valid throughout the European Union and (ii) incorporates the application of the country-of-origin principle later set forth in Spanish Royal Decree, or Royal Decree, 1362/2007.
104
Royal Decree 1333/2005, of November 11, 2005, developed the Securities Market Act in relation to market abuse.
Law 12/2006, of May 16, 2005, amended the Securities Market Act by (i) introducing a new article relating to notifications to the CNMV of transactions that might constitute insider dealing or market manipulation, (ii) completing the regulation of Bolsas y Mercados Españoles, which operates the Spanish Stock Exchanges and financial markets and (iii) clarifying the regulation of significant participations in the entities that manage the clearing and settlement of securities and the Spanish secondary securities markets.
Law 6/2007, of April 12, 2007, amended the Securities Market Act to modify the rules for takeover bids and for issuer transparency. This Law came into effect on August 13, 2007, and partially integrates into the Spanish legal system Directive 2004/25/EC of the European Parliament and of the Council, of April 21, 2004, on takeover bids and Directive 2004/109/EC of the European Parliament and of the Council, of December 15, 2004, on the harmonization of transparency requirements in relation to information about issuers whose securities are admitted to trading on a regulated market and amending Directive 2001/34/EC. This Law was further developed by Royal Decree 1066/2007, of July 27, 2007, on rules applicable to takeover bids for securities and by Royal Decree 1362/2007, of October 19, 2007, on transparency requirements for issuers of listed securities.
Law 6/2007 (i) introduced several changes to the periodic financial information (annual, biannual and quarterly) to be published by issuers of listed securities and (ii) introduced new developments to the system that establishes the duty to provide notice of significant stakes in an enterprise. These duties include notification requirements such as:
| | • | | anyone with a right to acquire, transfer or exercise voting rights granted by the shares, regardless of the actual ownership of the shares, and anyone owing, acquiring or transferring other securities or financial instruments that grant a right to acquire shares with voting rights must provide notice of the holding of a significant stake in accordance with the regulations; |
| | • | | directors of listed companies, in addition to providing notice of any transaction concerning the shares or other securities or financial instruments of the issuer that are linked to these shares, must inform the CNMV of their stake upon appointment or resignation; |
| | • | | listed companies must provide notice of transactions concerning their treasury shares in certain cases, which will be established in the developing regulations. |
Law 12/2010, of June 30, 2010, amended the Securities Market Act to require listed companies to create electronic shareholders forums on their websites to facilitate communication prior to the holding of general meetings. It also established that shareholders of listed companies may create associations to exercise their rights and coordinate the defense of their common interests. Such associations must enroll in a special CNMV registry. Finally, Law 12/2010 also amended the Securities Market Act to change the regulations regarding the composition and functions of audit committees.
Royal Legislative Decree 1/2010, of July 2, 2010, approved the Spanish Companies Act in order to consolidate and clarify the laws applicable to public limited companies, limited share partnerships and limited liability companies.
Law 2/2011, of March 4, 2011 on Sustainable Economy (Ley de Economía Sostenible) amended the Securities Market Act’s provisions related to the requirements for annual reports on corporate governance and management reports. The Law also made certain corporate governance and shareholder disclosure recommendations in the Spanish Unified Good Governance Code for Listed Companies (Código Unificado de Buen Gobierno de las Sociedades Cotizadas), or CNMV Governance Code, regarding the composition of boards of directors and its committees and the qualification of directors as executive, proprietary or independent mandatory.
Law 25/2011, of August 1, 2011, amended the Securities Market Act to implement Directive 2007/36/CE of the European Parliament and of the Council, regarding the exercise of certain rights of the shareholders of listed companies, to simplify and promote the right to information and shareholder voting rights.
Not Applicable.
Not Applicable.
105
Not Applicable.
| Item 10. | ADDITIONAL INFORMATION |
Not Applicable.
| | B. | Memorandum and Articles of Association |
The following is a summary of the material terms of our Articles of Association and Board Regulations, as amended and currently in effect. This summary is not meant to be complete and is qualified in its entirety by reference to each of the Articles of Association and Board Regulations. Because this is a summary, it does not contain all the information that may be important to you. You should read the Articles of Association and Board Regulations carefully. The current Articles of Association are included as Exhibit 1.1 and Exhibit 1.2 (English translation) to this annual report on Form 20-F. The Articles of Association and the Board Regulations are also available on our website, which does not form part of this annual report on Form 20-F, atwww.grifols.com under the headings “Investor Relations — General information — Articles of association” and “Investor Relations — Corporate governance — Board of directors regulations.”
The Articles of Association were originally approved and incorporated with the Commercial Registry on June 22, 1987. The Board Regulations were initially approved by the Board on April 5, 2006.
At the general shareholder meeting on extraordinary matters held on January 25, 2011, our shareholders agreed to increase share capital by issuing 83,811,688 Class B shares to complete the acquisition of Talecris. The shareholders also agreed to amend the Articles of Association by modifying Article 6 to include the terms and conditions of the Class B shares and adding a new Article 6.bis to include the rights and obligations of the Class B shares.
Following our application to list our Class B ADSs on NASDAQ, we held a general ordinary shareholder meeting on May 24, 2011. To satisfy NASDAQ Listing Rules, our shareholders resolved to (i) modify Article 24.ter of the Articles of Association to reorganize the Audit Committee and (ii) amend the Board Regulations. Our Board approved the amendment to the Board Regulations on the same day.
At the general shareholder meeting on extraordinary matters held on December 2, 2011, our shareholders agreed to increase share capital by issuing 29,687,658 Class B shares, without a share premium and with a charge to voluntary reserves, to remunerate the Class A and Class B shareholders. The issuance took the form of a free allocation of one new Class B share for each ten Class A or Class B shares owned. The shareholders also agreed to delegate to the Board the authority to increase our share capital by up to 50% of the then-current share capital, at any time or from time to time within five years following the date of the meeting, by issuing new shares, with or without a share premium, for cash. Further, the shareholders agreed to make qualitative improvements to the Articles of Association and to otherwise conform them to the requirements of the Spanish Companies Act, as amended.
The full text of the amendments to the Articles of Association detailed above is available on our website, which does not form part of this annual report on Form 20-F, atwww.grifols.com under the heading “Investor Relations — Corporate governance.”
General
As of December 31, 2011, our share capital was €117,882,384 and comprised:
| | • | | Class A shares: 213,064,899 ordinary shares with a par value of €0.50 each. All of the Class A shares belong to the same class and series. |
| | • | | Class B shares: 113,499,346 non-voting preference shares with a par value of €0.10 each. All of the Class B shares belong to the same class and series and have the preferential rights set forth in the Articles of Association. |
All of our shares are fully paid and non-assessable. Both share classes are issued in book-entry form, governed by the Securities Market Act, as amended, and such other provisions as may be applicable. The book-entry registry is maintained by Iberclear and its participant entities.
106
Register
We are a public limited trading company registered with the Commercial Registry of Barcelona. Our fiscal identification number is A-58389123.
Our principal executive office is located at Avinguda de la Generalitat, 152 Parque Empresarial Can Sant Joan, 08174 Sant Cugat del Vallès, Barcelona, Spain. Our registered office is located at c/Jesús y María, 6, Barcelona (08022). We were incorporated on June 22, 1987. Our fiscal year runs from January 1 to December 31, the exception being the year ending on December 31, 1997, which began on August 1, 1997.
Corporate Purpose
Section 2 of the Articles of Association states that our corporate purpose is to provide administration, management and supervision services of companies and businesses as well as investments in movable and real estate assets.
Board of Directors
Under Article 31 of the Board Regulations, a director shall abstain from attending or intervening in deliberations that affect matters in which he finds himself personally involved, directly or indirectly. A director cannot carry out professional or commercial transactions with us, directly or indirectly, unless he previously informs the Board about the conflict of interest, and the Board, following a report from our Appointments and Remuneration Committee, approves the transaction.
Under Article 15 of the Board Regulations, the Appointments and Remuneration Committee will in all cases be composed of a majority of external directors, and the chairperson will be an external director and, to the extent possible, an independent director.
The Board, with the advice of the Appointments and Remuneration Committee, sets director compensation. As set forth in Article 26 of the Board Regulations, remuneration of the Board is fixed according to statutory provisions and will be reasonable and in line with market rates. As set forth in Article 27 of such Board Regulations, external directors should be excluded from receiving remuneration linked to our profits or welfare systems, other than shares in the Company that they must hold until their resignation as directors. Further, the establishment of equity compensation plans in which members of the Board participate must be authorized in the Articles of Association and requires the shareholders’ prior approval at a shareholders’ meeting. Additionally, the amount of external directors’ remuneration should be calculated in order to incentivize dedication but not become an obstacle to independence.
For more information regarding related party transactions, see Item 7 of this Part I, “Major Shareholders and Related Party Transactions — B. Related Party Transactions.”
We do not impose an age limit requirement for the retirement or non-retirement of directors. We also do not impose a shareholding requirement for director qualification. Article 6 of the Board Regulations does provide, however, that a director cannot qualify as an independent external director if he or she has a significant shareholding in us.
For information regarding the provisions of the Articles of Association as applied to the Board, see Item 6 of this Part I, “Directors, Senior Management and Employees — A. Directors and Senior Management — Board of Directors” and “Directors, Senior Management and Employees — C. Board Practices.”
Shareholder Rights
The following summary of material considerations concerning our share capital briefly describes certain material provisions of the Articles of Association and Spanish law relating to our share capital. Because it is a summary, it is not meant to be complete, is qualified by reference to the applicable Spanish laws and our Articles of Association and does not contain all the information that may be important to you.
Neither Spanish law nor our Articles of Association limit the right to own our securities, including the rights of non-resident or foreign shareholders to hold or exercise voting rights on the securities.
Under Spanish law, the rights of shareholders may be changed only by an amendment to the articles of association of a company that complies with the requirements explained below under “— Class A Shares — Shareholders’ Meetings and Voting Rights.” Our Articles of Association do not further specify what actions or quorums are required to change the rights of our shareholders, other than that they classify an amendment thereto as an extraordinary matter, as described below in “— Class B Shares — Separate Vote at General Shareholder Meetings on Extraordinary Matters.”
107
Class A Shares
Shareholders’ Meetings and Voting Rights
Pursuant to Article 13 of our Articles of Association and the Spanish Companies Act, the annual general shareholders’ ordinary meeting shall be held during the first six months of each fiscal year on a date fixed by the Board. Resolutions presented at duly constituted general shareholders meetings are, except as indicated herein, passed by a simple majority vote of the voting capital present or represented at the meeting.
Extraordinary meetings may be called by the Board whenever it deems it appropriate or at the request of one or more shareholders representing at least 5% of our share capital. Under Spanish law and per the Articles of Association, we are required to publish a “calling of the meeting,” which sets forth the matters to be voted on at each general shareholders’ meeting, at least one month prior to the date set for the meeting in at least: (i) the Official Gazette of the Commercial Registry (Boletin Oficial de Registro Mercantil) or one of the local newspapers of wide circulation in the province where we are domiciled (currently Barcelona, Spain); (ii) CNMV’s website; and (iii) our website.
Holders of ordinary and Class B shares duly registered in the book-entry records maintained by Iberclear and its participant entities at least five days prior to the day on which a shareholders’ meeting is scheduled, in the manner provided in the notice for such meeting, may attend such meeting (in person or represented by proxy) and, where so entitled, may vote. Holders of the our Class B shares generally do not have voting rights, except with respect to certain extraordinary matters that require approval by a majority of our outstanding Class B shares, as set forth below in “— Class B Shares — Separate Vote at General Shareholder Meetings on Extraordinary Matters.”
For an ordinary or extraordinary general meeting of shareholders to be duly constituted, the presence in person or by proxy of shareholders representing 25% of our issued voting share capital is required. On second call, there is no quorum requirement.
Under Spanish law, the following shareholder actions require approval by the affirmative vote of the holders of a majority of our Class A shares present in person or represented by proxy at a duly constituted meeting of holders of our Class A shares at which meeting, if (i) on first call, a quorum of at least 50% of the issued voting share capital is present or represented by proxy or (ii) on second call, a quorum of at least 25% of the issued voting share capital is present or represented by proxy (unless on such second call less than 50% of the issued voting share capital is present or represented by proxy, in which case those matters require the affirmative vote of at least two-thirds of the share capital present or represented at such meeting):
| | • | | an increase or reduction of the share capital; |
| | • | | the transformation of Grifols (change in corporate nature); |
| | • | | a merger, de-merger, split, spin-off or other structural change subject to Law 3/2009; |
| | • | | any other amendment of the Articles of Association; and |
For purposes of determining the quorum, those shareholders who vote by mail or through the internet are counted as being present at the meeting, as provided by the Regulations of the General Shareholders’ Meeting of Grifols, S.A (Reglamento de la Junta General de Accionistas). Such Regulations are available on our website, which does not form part of this annual report on Form 20-F, atwww.grifols.com under the heading “Investor Relations — Corporate governance — Regulations of the general shareholders’ meeting.”
In general, resolutions passed at a general shareholders’ meeting are binding upon all shareholders. In very limited circumstances, Spanish law gives dissenting or absent shareholders, including those holding Class B shares, the right to have their Grifols’ shares redeemed by us at prices determined in accordance with established formulas or criteria.
Dividends
Payment of dividends must be proposed by the Board and authorized by our shareholders at a general shareholders’ meeting. Interim dividends may be declared by the Board on account of profits for the then current fiscal year, subject to certain limitations.
Spanish law requires each company to apply at least 10% of its net income each year to a legal reserve until the balance of such reserve is equivalent to at least 20% of such company’s issued share capital. A company’s legal reserve is not available for
108
distribution to its shareholders except upon such company’s liquidation. According to Spanish law, dividends may only be paid out of profits (after deduction of any amounts required to be applied to the legal reserve) or distributable reserves and only if the value of a company’s net worth is not, and as a result of distribution would not be, less than such company’s share capital.
In addition, no profits may be distributed unless the amount of the distributable reserves is at least equal to the amount of research and development expenses recorded as an asset on a company’s consolidated balance sheet.
Spanish law also requires the creation of a non-distributable reserve equal to the amount of goodwill recorded as an asset on a company’s consolidated balance sheet and that an amount at least equal to 5% of such goodwill be transferred from the profit from each financial year to such non-distributable reserve until such time as the non-distributable reserve is of an amount at least equal to the goodwill recorded on such company’s consolidated balance sheet. If, in any given financial year, there are no or insufficient profits to transfer an amount equal to 5% of the goodwill recorded as an asset on a company’s consolidated financial statement, Spanish law requires that the shortfall be transferred from freely distributable reserves to the non-distributable legal reserve.
In the event of a reduction in share capital to offset losses, dividends may not be distributed until the legal reserve reaches 10% of the new share capital.
Distributions of dividends to our Class A shareholders will be made in proportion to the capital that they have paid up. The shareholders at the general shareholders meeting shall decide the amount, time and form of payment of the dividends. If these details are not so determined, the dividend will be payable at our registered office on the day following the date of the resolution.
The right to a dividend lapses and reverts to us if it is not claimed within five years after it becomes payable. Dividends payable by us to non-residents of Spain may be subject to a Spanish withholding tax of 21%, effective January 1, 2012. However, residents of certain countries are entitled to the benefits of the Convention Between the United States of America and the Kingdom of Spain for the Avoidance of Double Taxation and the Prevention of Fiscal Evasion with Respect to Taxes on Income, as described below in “— E. Taxation — Spanish Tax Considerations.”
As set forth below under “— Class B Shares — Preferred Dividend,” since the issuance of the our Class B shares, the dividend rights of our Class A shareholders have been subordinated to the €0.01 per share preferred dividend of our Class B shares.
Liquidation Rights
Upon our winding-up and liquidation, holders of our Class A shares and Class B shares will be entitled to receive a pro rata portion of any assets remaining after the payment of our debts, taxes and the expenses of the liquidation as follows: (i) before any amount is distributed to the holders of Class A shares, the holders of Class B shares will receive the nominal value and share premium paid up for such Class B shares at the time of issuance and (ii) once such liquidation preference is received, the holders of the Class A shares and Class B shares will sharepari passuin the amounts distributed.
Subscription (or Preemptive) Rights and Increases of Share Capital
Pursuant to the Spanish Companies Act, shareholders and holders of convertible bonds have subscription (or preemptive) rights to subscribe for any new shares (or other securities convertible into, or exchangeable for, shares) issued by a company in a capital increase via monetary contributions.
In accordance with the Spanish Companies Act, such subscription (or preemptive) rights may be waived under special circumstances by a resolution passed at a meeting of shareholders or the Board (such as when we listed on the Spanish Stock Exchanges), and the general shareholders’ meeting delegates to the Board the right to increase the share capital or to issue securities convertible into, or exchangeable for, shares and to waive subscription (or preemptive) rights). See Item 3 of this Part I, “Key Information — D. Risk Factors — Risks Relating to our Structure, Shares and American Depositary Shares — Subscription (or preemptive) rights may be unavailable to U.S. holders of our shares or ADSs.”
Further, subscription (or preemptive) rights, in any event, will not be available in the event of certain capital increases, such as those in which we receive an in-kind contribution, those effected to meet the requirements of a convertible bond issue or those for a merger in which shares are issued as consideration. Subscription (or preemptive) rights are transferable, may be traded on the Automated Quotation System and may be of value to existing shareholders because new shares may be offered for subscription at prices lower than prevailing market prices. In the case of a share capital increase against reserves, the same rule applies to the free allotment (derecho de asignación gratuita) rights.
109
Finally, as described below in “— Class B Shares — Subscription Rights,” in connection with an issuance of securities where subscription (or preemptive) rights apply, our Class B shares may only be granted preemptive rights with respect to additional Class B shares if our Class A shares are granted preemptive rights with respect to additional Class A shares. The preemptive rights of each class must be otherwise equal.
Registration and Transfers
Our Class A shares are in book-entry form on Iberclear and are indivisible. Joint holders of one share must designate a single person to exercise their shareholders’ rights, but they are jointly and severally liable to us for all the obligations flowing from their status as shareholders, such as the payment of any pending capital calls.
Iberclear maintains the central registry reflecting the number of shares held by each of its participant entities. Each participant entity, in turn, maintains a registry of the owners of such shares.
Transfers of shares quoted on the Spanish Stock Exchanges are normally made through credit entities or investment companies that are members of the Spanish Stock Exchanges.
Reporting Requirements
Pursuant to Royal Decree 1362/2007, any individual or legal entity that, by whatever means, acquires or transfers shares with voting rights in a company for which Spain is listed as the Country of Origin (Estado Miembro) (as defined therein) and which is listed on an official secondary securities market or other regulated market in the European Union must notify the issuer and the CNMV, if, as a result of such transaction, the proportion of voting rights held by that individual or legal entity reaches, exceeds or thereafter falls below a 3% threshold of that company’s total voting rights. The notification obligations are also triggered at thresholds of 5% and multiples thereof (excluding 55%, 65%, 85%, 95% and 100%). The applicable threshold is 1% (or its successive multiples thereof) for persons or entities located in designated “tax havens” (as defined in Royal Decree 1080/1991) or other jurisdictions lacking adequate supervision.
The individual or legal entity obliged to provide the notification must serve the notification by means of the form approved by the CNMV from time to time for such purpose, within four business days from the date on which the transaction is acknowledged. Royal Decree 1362/2007 deems that a transaction is “acknowledged” within two business days from the date on which such transaction is entered into.
The reporting requirements apply not only to the purchase or transfer of voting shares, but also to those transactions in which, without a purchase or transfer, the proportion of voting rights of an individual or legal entity reaches, exceeds or thereafter falls below the threshold that triggers the obligation to report as a consequence of a change in the total number of voting rights of a company on the basis of the information reported to the CNMV and disclosed by such individual or legal entity.
Regardless of the actual ownership of the voting shares, any individual or legal entity with a right to acquire, transfer or exercise voting rights of the shares, and any individual or legal entity that owns, acquires or transfers, whether directly or indirectly, other securities or financial instruments that grant a right to acquire shares with voting rights, will also have an obligation to notify us and the CNMV of the holding of a significant stake in accordance with the regulations.
Furthermore, all members of the Board must report to both us and the CNMV the percentage and number of voting rights in Grifols held by them at the time of becoming or ceasing to be a member of the Board. All members of the Board must also report any change in the percentage of voting rights they hold, regardless of the amount, as a result of any acquisition or disposition of our shares or voting rights, or financial instruments that carry a right to acquire or dispose of shares that have voting rights attached, including any stock-based compensation that they may receive pursuant to any of our compensation plans.
In addition, pursuant to Royal Decree 1333/2005, of November 11, 2005, (implementing European Directive 2004/72/EC), any member of the Board or our senior management and any parties closely related to any member of the Board or our senior management must similarly report any acquisition or disposal of our shares (in this case, either ordinary or Class B shares), derivatives or other financial instruments relating to our shares regardless of the size, including information on the percentage of voting rights which they hold as a result of the relevant transaction within five business days of such transaction.
Additional disclosure obligations apply in respect of voting agreements. In this respect, the Spanish Companies Act requires parties to disclose certain types of shareholders’ agreements that affect the exercise of voting rights at a general shareholders’ meeting or contain restrictions or conditions on the transferability of shares or bonds that are convertible or exchangeable into shares.
110
Moreover, persons holding a net aggregate short position in our shares must report the short position to the CNMV on a confidential basis whenever it reaches 0.2% and notify the CNMV of any subsequent decrease or increase by 0.1% (and successive multiples thereof) within the day immediately following the relevant trade. The CNMV publishes individual net short positions of 0.5% or more and aggregate information on net short positions between 0.2% and 0.5%.
The Articles of Association do not contain additional provisions governing the ownership threshold above which shareholder ownership must be disclosed.
Class B Shares
Our Class B shares have substantially similar dividend and other economic rights as our Class A shares, summarized above in “— Class A Shares,” but differ from the Class A shares in some important respects that are outlined below.
Voting Rights
Holders of our Class B shares generally do not have voting rights, except with respect to certain extraordinary matters, with respect to which approval by a majority of our outstanding Class B shares is required.
Separate Vote at General Shareholder Meetings on Extraordinary Matters
Notwithstanding the lack of voting rights of our Class B shares generally, resolutions on the matters detailed below (each, an “extraordinary matter”) require the approval of a majority of our outstanding Class B shares.
| | • | | Any resolution (i) authorizing us or any of our subsidiaries to repurchase or acquire any of our Class A shares, except for pro rata repurchases available equally to holders of our Class B shares on the same terms and at the same price as offered to holders of our Class A shares or (ii) approving the redemption of any of our shares and any share capital reductions (through repurchases, cancellation of shares or otherwise), other than (a) those redemptions required by law and (b) those redemptions which affect equally our Class A shares and Class B shares and in which each Class B share is treated the same as a Class A share in such transaction. |
| | • | | Any resolution approving the issuance, granting or sale (or authorizing the Board to issue, grant or sell) (i) any of our shares, (ii) any rights or other securities exercisable for or exchangeable or convertible into our shares or (iii) any options, warrants or other instruments giving the right to the holder thereof to purchase, convert, subscribe or otherwise receive any of our securities, except if (a) each Class B share is treated the same as a Class A share in the relevant issuance, grant or sale and, therefore, has a preferential subscription right (derecho de suscripción preferente) or a free allotment right in the relevant issuance, grant or sale to the same extent, if any, as a Class A share or (b) if the issuance is made in accordance with the subscription rights described in “— Subscription Rights” below. |
| | • | | Any resolution approving unconditionally or not (i) a transaction subject to Law 3/2009 (including, without limitation, a merger, split-off, cross-border reconciliation or global assignment of assets and liabilities), except if in such transaction each Class B share is treated the same as a Class A share or (ii) our dissolution or winding-up, except where such resolution is required by law. |
| | • | | Any resolution for the delisting of any Grifols shares from any stock exchange. |
| | • | | Generally, any resolution and any amendment of the Articles of Association that directly or indirectly adversely affects the rights, preferences or privileges of our Class B shares (including any resolution that adversely affects our Class B shares relative to our Class A shares or that positively affects our Class A shares relative to our Class B shares, or that affects the provisions in the Articles of Association relating to our Class B shares). |
The general shareholders’ meeting has the power to decide on all matters assigned to it by law or by the Articles of Association and, in particular, without limitation to the foregoing, shall be the only corporate body or office entitled to decide on these extraordinary matters.
Preferred Dividend
Each of our Class B shares entitles its holder to receive a minimum annual preferred dividend out of the distributable profits at the end of each fiscal year the share is outstanding equal to €0.01 per Class B share. In any given fiscal year, we will pay a preferred dividend to the holders of our Class B shares before any dividend out of the distributable profits for such fiscal year is paid to the holders of our Class A shares. The preferred dividend on all issued Class B shares will be paid by us within the nine months following the end of that fiscal year, in an amount not to exceed the distributable profits obtained by us during that fiscal year.
111
If, during a fiscal year, we have not obtained sufficient distributable profits to pay in full, out of those profits, the preferred dividend on all the Class B shares outstanding, the preferred dividend amount exceeding the distributable profits obtained by us will not be paid and will not be accumulated as a dividend payable in the future.
Lack of payment, total or partial, of the preferred dividend during a fiscal year due to insufficient distributable profits to pay in full the preferred dividend for that fiscal year will not cause our Class B shares to recover any voting rights.
As set forth above in “— Class A Shares — Dividends,” the dividend rights of our Class A shareholders are subordinated to the preferred dividend described in this section.
Other Dividends
Each Class B share is entitled to receive, in addition to the preferred dividend referred to above, the same dividends and other distributions (in each case, whether in cash, securities of Grifols or any of our subsidiaries, or any other securities, assets or rights) as one Class A share. Each Class B share is treated as one Class A share for the purpose of any dividends or other distributions made on our Class A shares, including as to the timing of the declaration and payment of any such dividend or distribution.
Redemption Rights
Each holder of our Class B shares is entitled to redeem those shares as set forth in this section if a tender offer for all or part of our share capital is made and settled (in whole or in part), except if holders of our Class B shares were entitled to (i) participate in such offer and (ii) have their shares acquired in such offer equally and on the same terms as holders of our Class A shares (including, without limitation, for the same consideration).
Upon the closing and settlement (in whole or in part) of a tender offer for our shares in which holders of our Class B shares were not entitled to (i) participate and (ii) have their shares acquired in such offer equally and on the same terms as holders of our Class A shares (including, without limitation, for the same consideration), the redemption process will follow the process detailed below.
| | • | | We will, within ten days of the date on which the redemption event occurred (i.e., the date on which the triggering tender offer settled), publish in the Commercial Registry Gazette, the Spanish Stock Exchanges’ Gazettes and in at least two of the newspapers with widest circulation in Barcelona an announcement informing the holders of our Class B shares of the redemption event and the process for the exercise of redemption rights in connection with such redemption event. |
| | • | | Each holder of our Class B shares will be entitled to exercise its redemption right for two months from the first date of settlement of the tender offer triggering the redemption right by notifying us of its decision. We will ensure that mechanisms are in place so that the notification of the exercise of the redemption right may be made through Iberclear. |
| | • | | The redemption price to be paid by us for each Class B share for which the redemption right has been exercised will be the sum of (i) the amount in euro of the highest consideration paid in the tender offer triggering the redemption right plus (ii) interest on the amount referred to in (i), from the date such tender offer is first settled until the date of full payment of the redemption price, at a rate equal to the one-year EURIBOR plus 300 basis points. For the purposes of this calculation, the amount in euro corresponding to any non-cash consideration paid in the tender offer will be the market value of such non-cash consideration as of the date the tender offer is first settled. The calculation of such market value shall be supported by at least two independent experts designated by us from auditing firms of international repute. |
| | • | | We will, within 40 days of the date on which the period for notification of the exercise of redemption rights following a tender offer lapses, take all the necessary actions to (i) effectively pay the redemption price for our Class B shares for which the redemption right has been exercised and complete the capital reduction required for the redemption and (ii) reflect the amendment to Article 6 of the Articles of Association (related to share capital) deriving from the redemption. |
The number of our Class B shares redeemed shall not represent a percentage over our total Class B shares issued and outstanding at the time the tender offer is made in excess of the percentage that the sum of our Class A shares (i) to which the tender offer is addressed, (ii) held by the offerors in that offer and (iii) held by persons acting in concert with the offerors or by persons having reached an agreement relating to the offer with the offerors represent over the total Class A shares issued and outstanding at the time the tender offer causing the redemption of our Class B shares is made.
Payment of the redemption price will be subject to us having sufficient distributable reserves but, after a tender offer occurs and until the redemption price for our Class B shares is paid in full, we will not be able to declare or pay any dividends nor any other distributions to our shareholders (in each case, whether in cash, securities of Grifols or any of our subsidiaries, or any other securities, assets or rights).
112
Liquidation Rights
Each Class B share entitles its holder to receive, upon our winding-up and liquidation, an amount equal to the sum of (i) the nominal value of such Class B share and (ii) the share premium paid up for such Class B share when it was subscribed for.
We will pay the liquidation amount to the holders of our Class B shares before any amount on account of liquidation is paid to the holders of our Class A shares.
Each of our Class B shares entitles its holder to receive, in addition to the liquidation preference amount, the same liquidation amount paid for a Class A share.
Subscription Rights
Each Class B share entitles its holder to the same rights (including preferential subscription rights and free allotment rights) as one Class A share in connection with any issuance, granting or sale of (i) any shares in Grifols, (ii) any rights or other securities exercisable for, exchangeable or convertible into shares in Grifols or (iii) any options, warrants or other instruments giving the right to the holder thereof to purchase, convert, subscribe or otherwise receive any securities in Grifols.
As an exception, the preferential subscription rights and the free allotment rights of the Class B shares will only be for new Class B shares or for instruments giving the right to purchase, convert, subscribe for or otherwise receive Class B shares, and the preferential subscription right and the free allotment right of an Class A share will only be for new Class A shares or for instruments giving the right to purchase, convert, subscribe or otherwise receive Class A shares, for each capital increase or issuance that meets the following three requirements: (i) the issuance of Class A shares and Class B shares is in the same proportion of our share capital as they represent at the time the resolution on the capital increase is passed; (ii) grants of preferential subscription rights or free allotment rights, as applicable, to the Class B shares for the Class B shares are under the same terms as the preferential subscription rights or free allotment rights, as applicable, granted to the Class A shares for the Class A shares; and (iii) no other shares or securities are issued.
Registration and Transfers
Class B shares are in book-entry form on Iberclear and are indivisible, as indicated with respect to Class A shares above in “— Class A Shares — Registration and Transfers.”
Change in Control
The Articles of Association do not contain any provisions that would have the effect of delaying, deferring or preventing a change in control of Grifols.
Changes in Share Capital
Changes in share capital are considered extraordinary matters and must be approved by our shareholders in accordance with the procedures explained above in “— Class A Shares — Shareholders’ Meetings and Voting Rights” and “— Class B Shares — Separate Vote at General Shareholder Meetings on Extraordinary Matters.”
A capital increase may be affected by issuing new shares or by increasing the par value of existing shares. A capital reduction may be effected by reducing the par value of existing shares or by redeeming or repurchasing existing shares.
At the general shareholder meeting on extraordinary matters held on January 25, 2011, our shareholders agreed to increase share capital by issuing 83,811,688 Class B shares to complete the acquisition of Talecris. At the general shareholder meeting on extraordinary matters held on December 2, 2011, our shareholders agreed to increase share capital by issuing 29,687,658 Class B shares, without a share premium and with a charge to voluntary reserves, to remunerate the Class A and Class B shareholders. The issuance took the form of a free allocation of one new Class B share for each ten Class A or Class B shares owned. The issuance of the latter shares increased share capital by a nominal amount of €2.97 million.
Sinking Fund
The Articles of Association do not contain any sinking fund provisions.
113
The following contracts have been entered into by us within the two years immediately preceding the date of this annual report on Form 20-F or contain provisions under which we or another member of the Grifols Group has an obligation or entitlement that is material to us:
Amended and Restated Senior Credit Agreement
For a summary of the material terms of the Amended and Restated Senior Credit Agreement, see Item 5 of this Part I, “Operating and Financial Review and Prospects — B. Liquidity and Capital Resources — Sources of Credit — Amended and Restated Senior Credit Agreement.”
8.25% Senior Notes due 2018
For a summary of the material terms of the Notes, see Item 5 of this Part I, “Operating and Financial Review and Prospects — B. Liquidity and Capital Resources — Sources of Credit — 8.25% Senior Notes due 2018.”
Restrictions on Foreign Investment
Under present regulations, foreign investors may transfer invested capital, capital gains and dividends out of Spain without limitation on the amount other than applicable taxes. Law 19/2003, of July 4, 2003, updated Spanish exchange control and money laundering prevention provisions, by recognizing the principle of freedom of the movement of capital between Spanish residents and nonresidents.
The law establishes procedures for the declaration of capital movements for purposes of administrative or statistical information and authorizes the Spanish government to take measures which are justified on grounds of public policy or public security. It also provides the mechanism to take exceptional measures with regard to third countries if such measures have been approved by the European Union or by an international organization to which Spain is a party.
The Spanish Stock Exchanges and securities markets are open to foreign investors. Royal Decree 664/1999, on Foreign Investments, of April 23, 1999, established a new framework for the regulation of foreign investments in Spain that, on a general basis, no longer requires any prior consents or authorizations from authorities in Spain (without prejudice to specific regulations for several specific sectors, such as television, radio, mining, telecommunications, etc.). Royal Decree 664/1999 requires notification of all foreign investments in Spain and liquidations of such investments upon completion of such investments to the Investments Registry of the Ministry of Economy and Finance, strictly for administrative statistical and economical purposes. Where the investment or divestiture is made in shares of a Spanish company listed on any of the Spanish Stock Exchanges, the duty to provide notice of a foreign investment or divestiture lies with the relevant entity with whom the shares (in book-entry form) have been deposited or that has acted as an intermediary in connection with the investment or divestiture.
Only investments from tax haven countries require notice before and after execution of the investment, except that no prior notice is required for: (i) investments in listed or publicly negotiable securities or in participations in collective investment schemes that are registered with the CNMV and (ii) investments that do not increase the foreign ownership of the share capital of a Spanish company to over 50%. In specific instances, the Council of Ministers may agree to suspend all or part of Royal Decree 664/1999 following a proposal of the Ministry of Economy and Finance, or, in some cases, a proposal by the head of the government department with authority for such matters and a report of the Foreign Investment Body. These specific instances include a determination that the investments, due to their nature, form or condition, affect or may potentially affect activities relating to the exercise of public powers, national security or public health. Royal Decree 664/1999 is currently suspended for investments relating to national defense. In those cases in respect of which Royal Decree 664/1999 is suspended, the affected investor must obtain prior administrative authorization in order to carry out the investment.
Exchange Controls
Payments or transfers between non-residents and residents of Spain must be made through an entity, such as a bank or other financial institution, registered with the Bank of Spain or the CNMV (entidade registrada), through bank accounts opened abroad with a foreign bank or a foreign branch of a registered entity, in cash, or by check payable to bearer. All charges, payments or transfers that exceed €6,010, if made in cash or by check payable to bearer, must be notified to the Spanish exchange control authorities.
114
In General
Treatment of Holders of ADSs
This section describes the material United States federal income and Spanish tax consequences of owning shares or ADSs. It applies to you only if you hold your shares or ADSs as capital assets for tax purposes. This section does not apply to you if you are a member of a special class of holders subject to special rules, including:
| | • | | a dealer in securities; |
| | • | | a trader in securities that elects to use a mark-to-market method of accounting for securities holdings; |
| | • | | a tax-exempt organization; |
| | • | | a life insurance company; |
| | • | | a person liable for alternative minimum tax; |
| | • | | a person that actually or constructively owns 10% or more of our voting stock; |
| | • | | a person that holds shares or ADSs as part of a straddle or a hedging or conversion transaction; or |
| | • | | a U.S. Holder (as defined below) whose functional currency is not the U.S. dollar. |
This section is based on the Internal Revenue Code of 1986, as amended, its legislative history, existing and proposed regulations, published rulings and court decisions, in each case as in effect as of the date hereof and all of which are subject to change, possibly on a retroactive basis, as well as the tax laws of Spain and regulations thereunder and the Convention Between the United States of America and the Kingdom of Spain for the Avoidance of Double Taxation and the Prevention of Fiscal Evasion with Respect to Taxes on Income, or the Treaty, in each case as in effect as of the date hereof and subject to change.
You are a “U.S. Holder” if you are a beneficial owner of shares or ADSs and you are:
| | • | | a citizen or resident of the United States; |
| | • | | a domestic corporation; |
| | • | | an estate whose income is subject to United States federal income tax regardless of its source; or |
| | • | | a trust if a United States court can exercise primary supervision over the trust’s administration and one or more United States persons are authorized to control all substantial decisions of the trust. |
An “eligible U.S. Holder” is a U.S. Holder that:
| | • | | is a resident of the United States for purposes of the Treaty; |
| | • | | does not maintain a permanent establishment or fixed base in Spain to which shares or ADSs are attributable and through which the U.S. Holder carries on or has carried on business (or, in the case of an individual, performs or has performed independent personal services); and |
| | • | | is otherwise eligible for benefits under the Treaty with respect to income and gain from the shares or ADSs. |
A “non-U.S. Holder” is a beneficial owner of shares or ADSs that is not a United States person for United States federal income tax purposes.
In addition, if a partnership (including any entity treated as a partnership for United States federal income tax purposes) is a beneficial owner of shares or ADSs, the tax treatment of a partner in the partnership will generally depend upon the status of the partner and the activities of the partnership. A beneficial owner of shares or ADSs that is a partnership, and partners in such partnership, should consult their own tax advisors regarding the tax consequences of owning and disposing of shares or ADSs.
|
You should consult your own tax advisor regarding the United States federal, state and local and the Spanish and other tax consequences of owning and disposing of shares and ADSs in your particular circumstances. In particular, you should confirm your status as an eligible U.S. Holder with your advisor and should discuss any possible consequences of failing to qualify as an eligible U.S. Holder. |
This discussion addresses only United States federal income taxation and Spanish income taxation, gift and inheritance taxation, wealth taxation and transfer taxation.
115
Treatment of Holders of ADRs
In general, and taking into account the earlier assumptions, for United States federal income and Spanish tax purposes, if you hold ADRs evidencing ADSs, you will be treated as the owner of the shares represented by those ADRs. Exchanges of shares for ADRs, and ADRs for shares, generally will not be subject to United States federal income or to Spanish tax.
Spanish Tax Considerations
This discussion of Spanish tax consequences applies only to owners of ADSs or shares who are eligible U.S. Holders. The following is a summary of material Spanish tax matters and is not exhaustive of all the possible tax consequences to individuals or entities of the acquisition, ownership and disposition of ADSs or shares.
Taxation of Dividends
Under Spanish law, dividends paid by a Spanish resident company to a holder of ordinary shares or ADSs not residing in Spain for tax purposes and not operating through a permanent establishment in Spain are subject to Spanish Non-Resident Income Tax of 21%, effective January 1, 2012.
In addition, according to Royal Legislative Decree 5/2004, of March 5, 2004, on the Non-Resident Income Tax Law, individuals who are residents of the European Union or a country, such as the United States, with which Spain has an effective “exchange of information” for tax purposes (as defined in Law 36/2006, of November 30, 2006, related to measures to prevent tax fraud) who do not operate in Spain through a permanent establishment, are exempt from Spanish taxation on dividends up to 1,500 euro, considering all Spanish-source dividends obtainable in the calendar year. However, Spanish withholding tax will nevertheless be deducted from the gross amount of the dividends, and individuals will have to seek a refund of such withholding taxes from the Spanish tax authorities, following the standard refund procedure described below.
We will levy an initial withholding tax on the gross amount of dividends at a 21% tax rate, following the procedures set forth by the Spanish Ministerial Order, or Order, of April 13, 2000. However, under the Treaty and subject to the fulfillment of certain requirements, individuals and entities may be entitled to a reduced rate of 15%.
To benefit from the Treaty’s reduced rate of 15%, an individual or entity must provide the depositary with a certificate from the U.S. Internal Revenue Service, or IRS, stating that, to the knowledge of the IRS, it is a resident of the United States within the meaning of the Treaty. The IRS certificate may be obtained by filing an IRS Form 8802 and is valid for a period of one year.
According to the Order of April 13, 2000, to get a direct application of the Treaty’s reduced rate of 15%, the certificate referred to above must be provided to the depositary before the tenth day following the end of the month in which the dividends were distributable by us. If an individual or entity fails to timely provide the depositary with the required documentation, it may obtain a refund of the 6% in excess withholding that would result from the Spanish tax authorities in accordance with the procedures below.
Spanish Refund Procedure
According to Royal Decree 1776/2004, of July 30, 2004, as amended, which further develops the Royal Legislative Decree 5/2004 on the Non-Resident Income Tax Law, a refund of the amount withheld in excess of the rate provided by the Treaty can be obtained from the relevant Spanish tax authorities. An eligible U.S. Holder may pursue the refund claim by filing all of the following:
| | • | | the certificate from the IRS referred to above in “— Taxation of Dividends”; and |
| | • | | evidence that non-resident income tax was withheld with respect to it. |
The refund claim must be filed within four years of the date on which the withheld tax was collected by the Spanish tax authorities. According to Order EHA/3316, of December 17, 2010, for dividends paid as of January 2011, the 210 Form must be filed as from February 1st of the calendar year following the year in which the dividend was paid.
Individuals and entities are urged to consult their own tax advisers regarding refund procedures and any U.S. tax implications of refund procedures.
Taxation of Capital Gains
Under Spanish law, any capital gains derived from securities issued by persons residing in Spain for tax purposes are considered to be Spanish source income and, therefore, are taxable in Spain. For U.S. residents, income from the sale of ADSs or
116
shares will be treated as capital gains for Spanish tax purposes. Effective January 1, 2012, Spanish Non-Resident Income Tax is levied at a 21% rate on capital gains realized by persons not residing in Spain for tax purposes who are not entitled to the benefit of any applicable treaty for the avoidance of double taxation.
Notwithstanding the above, capital gains derived from the transfer of shares on an official Spanish secondary securities market by any holder who is a resident of a country that has entered into a treaty for the avoidance of double taxation with Spain containing an exchange of information clause will be exempt from taxation in Spain. In addition, under the Treaty, capital gains realized by an individual or entity upon the disposition of ADSs or shares will not be taxed in Spain provided that the individual or entity has not held, directly or indirectly, 25% or more of our stock during the twelve months preceding the disposition of the stock. An individual or entity is required to establish that it is entitled to this exemption by providing to the relevant Spanish tax authorities an IRS certificate of residence in the United States, together with the appropriate Spanish 210 tax form, between January 1st and January 20th of the calendar year following the year in which the transfer of shares took place.
Spanish Wealth Tax
On September 16, 2011, Royal Decree 13/2011 approved the reintroduction of the Spanish wealth tax (originally introduced under Law 19/1991) for 2011 and 2012. As a result, individuals not residing in Spain who hold shares or ADSs located in Spain are subject to the Spanish wealth tax, which imposes a tax on property located in Spain on the last day of any year. The Spanish tax authorities may take the view that all shares of Spanish corporations and all ADSs representing such shares are located in Spain for Spanish tax purposes. If the tax authorities take this view, individuals subject to the Spanish wealth tax will be taxed at marginal rates of 0.2% to 2.5% (as published by the Spanish Ministry of Economy and Public Administrations) of the average market value of their shares or ADSs during the last quarter of the relevant year, subject to a tax-free allowance of €700,000.
An individual is required to file Spanish wealth tax forms if he or she has a positive wealth tax liability or has assets or rights in Spain valued, in the aggregate, at more than €2,000,000.
Spanish Inheritance and Gift Taxes
Under Law 29/1987, transfers of shares or ADSs upon death or by gift are subject to Spanish inheritance and gift taxes if the transferee is a resident of Spain for tax purposes, or if the shares or ADSs are located in Spain at the time of gift or death, or the rights attached thereto could be exercised or have to be fulfilled in the Spanish territory, regardless of the residence of the beneficiary. In this regard, the Spanish tax authorities may determine that all shares of Spanish corporations and all ADSs representing such shares are located in Spain for Spanish tax purposes. The applicable tax rate, after applying all relevant factors, ranges between 0% and 81.6% for individuals.
Effective January 1, 2012, gifts granted to corporations not resident in Spain are subject to Spanish Non-Resident Income Tax of 21% of the fair market value of the shares as a capital gain. If the donee is a United States corporation, the exclusions available under the Treaty described above in “— Taxation of Capital Gains” will be applicable.
Expenses of Transfer
Transfers of ADSs or shares will be exempt from any Spanish transfer tax or value-added tax. Additionally, no Spanish stamp tax will be levied on such transfers.
United States Federal Income Tax Considerations
Taxation of Dividends
U.S. Holders
Under the United States federal income tax laws, and subject to the passive foreign investment company, or PFIC, rules discussed below, if you are a U.S. Holder, the gross amount of any dividend (including any preferred dividends on our Class B shares) we pay out of our current or accumulated earnings and profits (as determined for United States federal income tax purposes) is subject to United States federal income taxation. If you are a noncorporate U.S. Holder, dividends (including any preferred dividends on our Class B shares) paid to you in taxable years beginning before January 1, 2013 that constitute qualified dividend income will be taxable to you at a maximum tax rate of 15% provided that you hold the shares or ADSs for more than 60 days during the 121-day period beginning 60 days before the ex-dividend date and meet other holding period requirements. Dividends we pay (including any preferred dividends on our Class B shares) with respect to the shares or ADSs generally will be qualified dividend income.
With respect to any dividend we pay (including any preferred dividends on our Class B shares) you must include any Spanish tax withheld from the dividend payment in the gross amount of such dividend even though you do not in fact receive it.
117
Dividends are taxable to you when you, in the case of shares, or the Depositary, in the case of ADSs, receive such dividend, actually or constructively. Such dividends will not be eligible for the dividends-received deduction generally allowed to United States corporations in respect of dividends received from other United States corporations. The amount of a dividend distribution that you must include in your income as a U.S. Holder will be the U.S. dollar value of the euro payments made, determined at the spot euro/U.S. dollar rate on the date the dividend distribution is includible in your income, regardless of whether the payment is in fact converted into U.S. dollars. Generally, any gain or loss resulting from currency exchange fluctuations during the period from the date you include a dividend payment in income to the date you convert the payment into U.S. dollars will be treated as ordinary income or loss and will not be eligible for the special tax rate applicable to qualified dividend income. The gain or loss generally will be income or loss from sources within the United States for foreign tax credit limitation purposes. Distributions in excess of current and accumulated earnings and profits, as determined for United States federal income tax purposes, will be treated as a non-taxable return of capital to the extent of your basis in the shares or ADSs and thereafter as capital gain.
Subject to certain limitations, the Spanish tax withheld in accordance with the Treaty and paid over to Spain will be creditable or deductible against your United States federal income tax liability. Special rules apply in determining the foreign tax credit limitation with respect to dividends that are subject to the maximum 15% tax rate. To the extent a refund of the tax withheld is available to you under Spanish law or under the Treaty, the amount of tax withheld that is refundable will not be eligible for credit against your United States federal income tax liability. See “Taxation of Dividends — Spanish Refund Procedure” above for the procedures for obtaining a tax refund.
Dividends will be income from sources outside the United States, and dividends paid will, depending on your circumstances, be “passive” or “general” income which, in either case, is treated separately from other types of income for purposes of computing the foreign tax credit allowable to you.
A U.S. Holder may make an election to treat all foreign taxes paid as deductible expenses in computing taxable income, rather than as a credit against tax, subject to generally applicable limitations. Such an election, once made, applies to all foreign taxes paid for the taxable year subject to the election. The rules governing foreign tax credits are complex and, therefore, U.S. Holders are strongly encouraged to consult their own tax advisors to determine whether they are subject to any special rules that may limit their ability to make effective use of foreign tax credits and whether or not an election would be appropriate based on their particular circumstances.
Non-U.S. Holders
If you are a non-U.S. Holder, dividends (including any preferred dividends on our Class B shares) paid to you in respect of shares or ADSs will not be subject to United States federal income tax unless such dividends are “effectively connected” with your conduct of a trade or business within the United States, and such dividends are attributable to a permanent establishment that you maintain in the United States if that is required by an applicable income tax treaty as a condition for subjecting you to United States taxation on a net income basis. In such cases you generally will be taxed in the same manner as a U.S. Holder. If you are a corporate non-U.S. Holder, “effectively connected” dividends may, under certain circumstances, be subject to an additional “branch profits tax” at a 30% rate or at a lower rate if you are eligible for the benefits of an income tax treaty that provides for a lower rate.
Taxation of Capital Gains
U.S. Holders
Subject to the PFIC rules discussed below, if you are a U.S. Holder and you sell or otherwise dispose of your shares or ADSs, you will recognize capital gain or loss for United States federal income tax purposes equal to the difference between the U.S. dollar value of the amount that you realize and your tax basis, determined in U.S. dollars, in your shares or ADSs. Capital gain of a noncorporate U.S. Holder that is recognized in taxable years beginning before January 1, 2013 is generally taxed at a maximum rate of 15% where the holder has a holding period greater than one year. Such gain or loss will generally be income or loss from sources within the United States for foreign tax credit limitation purposes.
Non-U.S. Holders
If you are a non-U.S. Holder, you will not be subject to United States federal income tax on gain recognized on the sale or other disposition of your shares or ADSs unless:
| | • | | the gain is “effectively connected” with your conduct of a trade or business in the United States, and the gain is attributable to a permanent establishment that you maintain in the United States if that is required by an applicable income tax treaty as a condition for subjecting you to United States taxation on a net income basis; or |
118
| | • | | you are an individual, you are present in the United States for 183 or more days in the taxable year of the sale and certain other conditions exist. |
If you are a corporate non-U.S. Holder, “effectively connected” gains that you recognize may also, under certain circumstances, be subject to an additional “branch profits tax” at a 30% rate or at a lower rate if you are eligible for the benefits of an income tax treaty that provides for a lower rate.
Passive Foreign Investment Company Considerations
We believe that our shares and ADSs should not be treated as stock of a PFIC for United States federal income tax purposes, but this conclusion is a factual determination that is made annually and thus may be subject to change. If we were to be treated as a PFIC, gain realized on the sale or other disposition of your shares or ADSs would in general not be treated as capital gain. Instead, if you are a U.S. Holder, you would be treated as if you had realized such gain and certain “excess distributions” ratably over your holding period for the shares or ADSs and would be taxed at the highest tax rate in effect for each such year to which the gain was allocated, together with an interest charge in respect of the tax attributable to each such year. With certain exceptions, your shares or ADSs will be treated as stock in a PFIC if we were a PFIC at any time during your holding period in your shares or ADSs. Certain elections may be available that would result in alternative treatments (such as mark-to-market or QEF treatment) of the ADSs or shares. Dividends that you receive from us will not be eligible for the special tax rates applicable to qualified dividend income if we are treated as a PFIC with respect to you either in the taxable year of the distribution or the preceding taxable year, but instead will be taxable at rates applicable to ordinary income.
Medicare Contribution Tax on Unearned Income
Legislation enacted in 2010 will require certain U.S. Holders who are individuals, estates or trusts to pay an additional 3.8% tax on, among other things, dividends on and capital gains from the sale, retirement or other taxable disposition of our shares or ADSs for such a U.S. Holder’s taxable years that begin after December 31, 2012. You should consult your own tax advisor concerning the effect, if any, of this legislation on holding your shares or ADSs in your particular circumstances.
Backup Withholding and Information Reporting
If you are a noncorporate U.S. Holder, information reporting requirements, on Internal Revenue Service Form 1099, generally will apply to:
| | • | | dividend payments or other taxable distributions made to you within the United States; and |
| | • | | the payment of proceeds to you from the sale of shares or ADSs effected at a United States office of a broker. |
Additionally, backup withholding may apply to such payments if you are a noncorporate U.S. Holder that:
| | • | | fails to provide an accurate taxpayer identification number; |
| | • | | is notified by the Internal Revenue Service that you have failed to report all interest and dividends required to be shown on your federal income tax returns; or |
| | • | | in certain circumstances, fails to comply with applicable certification requirements. |
If you are a non-U.S. Holder, you are generally exempt from backup withholding and information reporting requirements with respect to:
| | • | | dividend payments made to you outside the United States by us or another non-United States payor; and |
| | • | | other dividend payments and the payment of the proceeds from the sale of shares or ADSs effected at a United States office of a broker, as long as the income associated with such payments is otherwise exempt from United States federal income tax,and |
| | • | | the payor or broker does not have actual knowledge or reason to know that you are a United States person and you have furnished the payor or broker: |
| | • | | an Internal Revenue Service Form W-8BEN or an acceptable substitute form upon which you certify, under penalties of perjury, that you are a non-United States person, or |
| | • | | other documentation upon which it may rely to treat the payments as made to a non-United States person in accordance with U.S. Treasury regulations, or |
| | • | | you otherwise establish an exemption. |
Payment of the proceeds from the sale of shares or ADSs effected at a foreign office of a broker generally will not be subject to information reporting or backup withholding. However, a sale of shares or ADSs that is effected at a foreign office of a broker will be subject to information reporting and backup withholding if:
| | • | | the proceeds are transferred to an account maintained by you in the United States; |
| | • | | the payment of proceeds or the confirmation of the sale is mailed to you at a United States address; or |
119
| | • | | the sale has some other specified connection with the United States as provided in U.S. Treasury regulations, |
unless the broker does not have actual knowledge or reason to know that you are a United States person and the documentation requirements described above are met or you otherwise establish an exemption.
In addition, a sale of shares or ADSs effected at a foreign office of a broker will be subject to information reporting if the broker is:
| | • | | a United States person; |
| | • | | a controlled foreign corporation for United States tax purposes; |
| | • | | a foreign person 50% or more of whose gross income is effectively connected with the conduct of a United States trade or business for a specified three-year period; or |
| | • | | a foreign partnership, if at any time during its tax year: |
| | • | | one or more of its partners are “U.S. persons,” as defined in U.S. Treasury regulations, who in the aggregate hold more than 50% of the income or capital interest in the partnership, or |
| | • | | such foreign partnership is engaged in the conduct of a United States trade or business, |
unless the broker does not have actual knowledge or reason to know that you are a United States person and the documentation requirements described above are met or you otherwise establish an exemption. Backup withholding will apply if the sale is subject to information reporting and the broker has actual knowledge that you are a United States person.
Backup withholding is not an additional tax. You generally may obtain a refund of any amounts withheld under the backup withholding rules that exceed your income tax liability by filing a refund claim with the United States Internal Revenue Service.
Disclosure of Information with Respect to Foreign Financial Assets
Certain U.S. individuals who hold any interest in “specified foreign financial assets,” including our shares or ADSs, during such holder’s taxable year must attach to their U.S. tax return for such year certain information with respect to each such asset if the aggregate value of all of such assets exceeds $50,000 (or a higher dollar amount prescribed by the Internal Revenue Service), unless such shares or ADSs are held in an account maintained by a U.S. payor, such as a U.S. financial institution or the U.S. branch of a foreign bank or insurer. For this purpose, a “specified foreign financial asset” includes any depositary, custodial or other financial account maintained by a foreign financial institution, and certain assets that are not held in an account maintained by a financial institution, including any stock or security issued by a person other than a U.S. person. A taxpayer subject to these rules who fails to furnish the required information may be subject to a penalty of $10,000, and an additional penalty may apply if the failure continues for more than 90 days after the taxpayer is notified of such failure by the Internal Revenue Service, unless the taxpayer demonstrates a reasonable cause for such failure to comply. An accuracy-related penalty of 40% is imposed for an underpayment of tax that is attributable to an “undisclosed foreign financial asset understatement,” which for this purpose is the portion of the understatement of gross income for any taxable year that is attributable to any transaction involving an “undisclosed foreign financial asset,” including any asset that is subject to the information reporting requirements of this legislation, which would include our shares or ADSs if the dollar threshold described above were satisfied.
The applicable statute of limitations for assessment of U.S. federal income taxes is extended to six years if a taxpayer omits from gross income more than $5,000 and such omission is attributable to a foreign financial asset as to which reporting is required under the rules described in the preceding paragraph or would be so required if such rules were applied without regard to the dollar threshold or any other exceptions specified by the Internal Revenue Service. In addition, the statute of limitations will be suspended if a taxpayer fails to provide in a timely manner either information with respect to specified foreign financial assets required to be reported or the annual information reports required for holders of PFIC stock, including PFIC stock for which a QEF election is made.You should consult your own tax advisor concerning any obligation you may have to furnish information to the Internal Revenue Service as a result of holding our shares or ADSs.
| | F. | Dividends and Paying Agents |
Not Applicable.
Not Applicable.
We are subject to the information requirements of the Exchange Act, except that, as a foreign private issuer, we are not subject to the proxy rules or the short-swing profit disclosure rules of the Exchange Act. In accordance with these information requirements, we file or furnish reports and other information with the SEC. Reports and other information filed or furnished by us with the SEC may be inspected and copied at the public reference facilities maintained by the SEC at Room 1024, 100 F Street, N.E., Washington, D.C. 20549, and at the SEC’s regional offices at 233 Broadway, New York, New York 10279 and Northwestern Atrium Center, 500 West Madison Street, Suite 1400, Chicago, Illinois 60661-2511.
Copies of such material may also be inspected at the offices of NASDAQ, 4 Times Square, New York, New York 10036, on which our ADSs are listed. In addition, information filed electronically with the SEC is publicly available on the SEC’s website, which does not form part of this annual report on Form 20-F, athttp://www.sec.gov.
I. Subsidiary Information
Not Applicable.
| Item 11. | QUANTITATIVE AND QUALITATIVE DISCLOSURES ABOUT MARKET RISK |
The risks inherent in our market-sensitive instruments are potential losses that may arise from adverse changes to interest rates, foreign exchange rates and market prices. We are subject to market risk resulting from changes in interest rates because such changes may affect the cost at which we obtain financing. We are subject to exchange rate risk with respect to our debt denominated in foreign currencies. We are subject to market price risk through the valuation of some of our derivatives.
120
Currency Risk
We operate internationally and are exposed to currency risks when operating in foreign currencies, in particular with respect to the U.S. dollar. Currency risk is associated with future commercial transactions, recognized assets and liabilities, and net investments in foreign operations.
We hold several investments in foreign operations, the net assets of which are exposed to currency risk. Currency risk affecting net assets of the Group’s foreign operations in U.S. dollars are mitigated primarily through borrowings in these foreign currencies. Our main exposure to currency risk is to the U.S. dollar, which is used in a significant percentage of our transactions in foreign currencies. Since revenues in U.S. dollars accounted for 93% of purchases and expenses in U.S. dollars since the acquisition (the period from June to December 2011) (96% in the fiscal year 2010), we have a natural hedge against U.S. dollar fluctuations. Accordingly, the risks associated with such exchange-rate fluctuations are minimal.
If the U.S. dollar had strengthened by 10% against the euro at December 31, 2011, equity would have increased by €137.8 million (€35 million at December 31, 2010) and profit would have increased by €922,000 (though it would have decreased by €3.1 million at December 31, 2010). This analysis assumes that all other variables are held constant, especially that interest rates remain constant. A 10% weakening of the U.S. dollar against the euro at December 31, 2011 and 2010 would have had the opposite effect for the amounts shown above, all other variables being held constant.
Interest Rate Risk
Our interest rate risks arise from current and non-current borrowings. Borrowings at variable interest rates expose us to cash flow interest rate risks. The purpose of managing interest rate risk is to balance the debt structure, maintaining part of borrowings at fixed rates and hedging part of variable rate debt. We manage cash flow interest rate risks through variable to fixed interest rate swaps.
A significant part of the financing obtained during 2011 accrues interest at fixed rates. This fixed interest debt, our Notes, amounts to $1.1 billion, which represents approximately 30% of our total U.S. dollar-denominated debt. With respect to the remaining senior U.S. dollar-denominated debt, which totaled $2.5 billion as of December 31, 2011 and is at variable rates, we have contracted a variable-to-fixed interest rate swap. At December 31, 2011, the nominal part of this hedging instrument amounted to $1.5 billion. This nominal part will decrease over the term of the debt, based on the scheduled repayments of the principal. The purpose of the swaps is to convert borrowings at variable interest rates into fixed interest rate debt. Through these swaps, we undertake to exchange the difference between fixed interest and variable interest with other parties periodically. The notional amount of the swap hedged 61% of the variable interest rate senior U.S. dollar-denominated debt at December 31, 2011.
Euro-denominated debt represented approximately 15% of our total debt at December 31, 2011, and 98% of such debt was at variable rates. We manage cash flow interest rate risks through euro-denominated variable-to-fixed interest rate swaps. The nominal part of this hedging instrument amounted to €100 million, representing hedging of 23% of the variable interest rate senior euro-denominated debt, at December 31, 2011.
The fair value of interest rate swaps contracted to reduce the impact of rises in variable interest rates is accounted for on a monthly basis. These derivative financial instruments comply with hedge accounting requirements for financial hedging instruments.
Had the interest rate at December 31, 2011 been 100 basis points higher, the interest expense would have increased by €4.5 million, the finance expense due to changes in the value of derivatives would have been €28 million lower and equity would have increased as a result of changes in derivatives to which hedge accounting is applied. A 100 basis point variation in interest rates at the presentation date of December 31, 2010 would have varied equity and consolidated profit after income tax by €3.8 million.
Market Price Risk
We have signed two unquoted futures contracts, the underlying assets of which are shares in Grifols, S.A. accounted for at fair value through profit or loss. Such instruments are therefore exposed to risk of value fluctuations.
Price risk with respect to raw materials is mitigated by the vertical integration of the hemoderivatives business in a sector which is highly concentrated.
121
| Item 12. | DESCRIPTION OF SECURITIES OTHER THAN EQUITY SECURITIES. |
Not Applicable
Not Applicable
Not Applicable
| | D. | American Depositary Shares |
Deutsche Bank Trust Company Americas serves as the depositary for both our Class A ADSs and our Class B ADSs, and its principal executive office is located at 60 Wall Street, New York, NY 10005, USA. The custodian is Deutsche Bank Sociedad Anónima Española, and its principal office in Spain is located at Ronda General Mitre 72-74, 08017 Barcelona, Spain.
Each Class A ADS represents the right to receive one-half of one Class A ordinary share of Grifols, S.A. Each Class B ADS represents the right to receive one-half of one Class B non-voting preference share of Grifols, S.A.
The following is a summary of the fee provisions of the deposit agreements for each of the Class A ADSs and Class B ADSs. For more complete information, you should read each deposit agreement in its entirety.
| | |
Associated Fee | | Depositary Action |
| $5.00 (or less) per 100 ADSs (or portion of 100 ADSs) | | Issuance of ADSs, including issuance resulting from a distribution of shares or rights or other property. Cancellation of ADSs for the purpose of withdrawal, including if the deposit agreement terminates. |
| |
| $2.00 (or less) per 100 ADSs (or portion of 100 ADSs) | | Distribution of cash proceeds, including cash dividends or sale of rights and other entitlements. |
| |
| $2.00 (or less) per 100 ADSs (or portion of 100 ADSs) per calendar year, provided that this fee, when combined with the fee for distribution of cash proceeds, including cash dividends or sale of rights and other entitlements, shall not exceed $2.00 (or less) per 100 ADSs (or portion of 100 ADSs) in any calendar year | | Depositary operation and maintenance costs. |
| |
| Annual fee of $1.00 per 100 ADSs | | Inspections of the relevant share register. |
| |
| Registration or transfer fees | | Transfer and registration of our shares on its share register to or from the name of the depositary or its agent when you deposit or withdraw our shares. |
| Expenses of the depositary | | Cable, telex and facsimile transmissions (when expressly provided in the deposit agreement). Converting foreign currency to U.S. dollars. |
| |
| Taxes and other governmental charges the depositary or the custodian has to pay on any ADS or share underlying an ADS, including any applicable interest and penalties thereon and any share transfer or other taxes or governmental charges, for example, stock transfer taxes, stamp duty or withholding taxes | | As necessary. |
| |
| Any fees and expenses incurred by the depositary in connection with the conversion of a foreign currency in compliance with the applicable exchange control and other regulations, and the delivery of deposited securities, including any fees of a central depository, and any additional fees, charges, costs, or expenses, that may be incurred by the depositary from time to time | | As necessary. |
| |
| Any additional fees, charges, costs or expenses that may be incurred by the depositary from time to time | | As necessary. |
122
The depositary collects its fees for issuance and cancellation of our ADSs directly from investors depositing shares or surrendering our ADSs for the purpose of withdrawal or from intermediaries acting for them. The depositary collects fees for making distributions to investors by deducting those fees from the amounts distributed or by selling a portion of distributable property to pay the fees. The depositary may collect its annual fee for depositary services by deduction from cash distributions, by directly billing investors or by charging the book-entry system accounts of participants acting for such investors. The depositary may generally refuse to provide fee-attracting services until its fees for those services are paid.
The fees and charges holders of our ADSs may be required to pay may vary over time and may be changed by us and by the depositary. Our ADS holders will receive prior notice of such changes.
Fees Paid by the Depositary to Grifols
Deutsche Bank Trust Company Americas, as depositary, has agreed to reimburse or pay on behalf of Grifols, S.A. certain reasonable expenses related to our ADR programs and incurred by us in connection with the programs, such as investor relations activities and ongoing maintenance expenses and listing fees. It has covered all such expenses incurred by us during 2011 for an amount of $1.06 million. The amounts the depositary reimbursed or paid are not perforce related to the fees it collected from ADS holders.
As part of its service to us, Deutsche Bank Trust Company Americas has also agreed to waive the cost of providing administrative and reporting services, including the cost of accessing its intelligence database for our ADR programs, which totaled $160,000 for the year ended December 31, 2011.
PART II
| Item 13. | DEFAULTS, DIVIDEND ARREARAGES AND DELINQUENCIES |
Not Applicable.
| Item 14. | MATERIAL MODIFICATIONS TO THE RIGHTS OF SECURITY HOLDERS AND USE OF PROCEEDS |
Not Applicable.
| Item 15. | CONTROLS AND PROCEDURES |
| | A. | Evaluation of Disclosure Controls and Procedures |
Our Chief Executive Officer and our Chief Financial Officer, after evaluating the effectiveness of our disclosure controls and procedures (as defined in Rule 13a-15(e) under the Exchange Act) as of the end of the period covered by this annual report on Form 20-F, have concluded that, as of such date, our disclosure controls and procedures were effective.
| | B. | Management’s Report on Internal Control over Financial Reporting |
Our management, under the supervision of our Chief Executive Officer and our Chief Financial Officer, is responsible for establishing and maintaining adequate internal control over financial reporting as defined in Rules 13a-15(f) and 15d-15(f) under the Exchange Act. Our internal control system is designed to provide reasonable assurance as to the reliability of financial reporting and the preparation of the published financial statements under generally accepted accounting principles. For Grifols, S.A., “generally accepted accounting principles” means IFRS as issued by IASB.
Our internal control over the financial reporting system includes those policies and procedures that: (i) pertain to the maintenance of records that, in reasonable detail, accurately and fairly reflect the transactions and dispositions of the assets of our company; (ii) provide reasonable assurance that transactions are recorded as necessary to permit preparation of financial statements in accordance with generally accepted accounting principles, and that receipts and expenditures of our company are being made only in accordance with authorizations of management and directors of our company; and (iii) provide reasonable assurance regarding prevention or timely detection of unauthorized acquisition, use or disposition of our company assets that could have a material effect on the financial statements.
Any internal control system, no matter how well designed, has inherent limitations, including the possibility of human error and the circumvention or overriding of the controls and procedures, which may not prevent or detect misstatements.
123
Our management assessed the effectiveness of our internal control over financial reporting as of December 31, 2011. In making this assessment, they used the criteria set forth by the Committee of Sponsoring Organizations of the Treadway Commission in Internal Control — Integrated Framework. Based on their assessment under these criteria, our management believes that, at December 31, 2011 our internal control over financial reporting is effective.
| | C. | Attestation Report of the Registered Public Accounting Firm |
The effectiveness of internal control of financial reporting as of December 31, 2011 has been audited by KPMG Auditores, S.L., which also acted as our independent auditor. The audit report of KPMG Auditores, S.L. is included with our audited consolidated financial statements.
| | D. | Changes in Internal Control over Financial Reporting |
There was no change in our internal control over financial reporting that occurred during the period covered by this annual report that has materially affected, or is reasonably likely to materially affect, our internal control over financial reporting.
| Item 16.A. | AUDIT COMMITTEE FINANCIAL EXPERT |
The Board has determined that each of Steven F. Mayer and W. Brett Ingersoll is an “audit committee financial expert,” as defined in Item 16A of Form 20-F, and is an independent director under Rule 10A-3 under the Exchange Act.
We have adopted the Employee Code of Conduct, which applies to all of our employees, directors and officers, including our principal executive officer, principal financial officer and principal accounting officer. This Code is intended to meet the definition of “code of ethics” under Item 16B of Form 20-F.
If the Employee Code of Conduct is amended, or if a waiver is granted, we will disclose such amendment or waiver.
| Item 16.C. | PRINCIPAL ACCOUNTANT FEES AND SERVICES |
The table below sets forth the total fees paid to KPMG Auditores, S.L., our principal accountants, and to other member firms of the KPMG international organization, for services performed in the years 2011 and 2010, and breaks down these amounts by category of service:
| | | | | | | | |
| | | 2011 | | | 2010 | |
Audit fees | | | 3,016 | | | | 2,165 | |
Audit-related fees(1) | | | 1,145 | | | | 566 | |
Tax fees | | | — | | | | — | |
All other fees(2) | | | 63 | | | | 187 | |
| | | | | | | | |
| | | 4,224 | | | | 2,918 | |
| (1) | Audit-related fees are fees for assurance services or other work traditionally provided to us by external audit firms in their role as statutory auditors. These services usually result in a certification or specific opinion on an investigation or specific procedures applied, and include the following: opinions/audit reports on information provided by us at the request of a third party (for example, prospectuses, comfort letters). |
| (2) | All other fees primarily relate to audits of businesses acquired or to be sold and training. |
124
The table below sets forth the total fees paid to other auditors for services performed in the years 2011 and 2010, and breaks down these amounts by category of service:
| | | | | | | | |
| | | 2011 | | | 2010 | |
Audit fees | | | 22 | | | | 20 | |
Audit-related fees | | | 2 | | | | 0 | |
Tax fees | | | — | | | | — | |
All other fees | | | 37 | | | | 82 | |
| | | | | | | | |
| | | 61 | | | | 102 | |
Pre-approval Policies and Procedures
Subject to shareholder approval of the independent auditor in accordance with Spanish law, the Audit Committee makes recommendations to the Board regarding the appointment, retainer and replacement of the independent auditor. The Audit Committee is also directly responsible for the compensation and oversight of the work of the independent auditor. We have developed a policy regarding the engagement of professional services by our external auditor, in accordance with the Spanish Audit Law and the Sarbanes-Oxley Act of 2002. This policy generally provides that we will not engage our independent auditors to render audit or non-audit services unless the service is specifically approved in advance by the Audit Committee.
In accordance with the pre-approval policy, all audit and permitted non-audit services performed for us by our principal accountants, or any of its affiliates, were approved by the Audit Committee, which concluded that the provision of such services by the independent accountants was compatible with the maintenance of that firm’s independence in the conduct of its auditing functions.
| Item 16.D. | EXEMPTION FROM THE LISTING STANDARDS FOR AUDIT COMMITTEES |
Not applicable.
| Item 16.E. | PURCHASES OF EQUITY SECURITIES BY THE ISSUER AND AFFILIATED PURCHASERS |
Neither Grifols nor, to Grifols’ knowledge, any “affiliated purchaser” (as defined in Rule 10b-18(a)(3) of the Exchange Act) repurchased any Class B shares or Class B ADSs during fiscal year 2011.
| Item 16.F. | CHANGES IN REGISTRANT’S CERTIFYING ACCOUNTANT |
Not applicable
| Item 16.G. | CORPORATE GOVERNANCE |
Pursuant to NASDAQ Listing Rules, as a foreign private issuer, we may elect to follow our home country practice in lieu of the corporate governance requirements of the NASDAQ Listing Rule 5600 Series, with the exception of those rules that are required to be followed pursuant to the provisions of NASDAQ Listing Rule 5615(a)(3). We have elected to follow Spanish practices in lieu of the requirements of the NASDAQ Listing Rule 5600 Series to the extent permitted under NASDAQ Listing Rule 5615(a)(3). Set forth below is a summary of the significant differences between the corporate governance practices we follow under Spanish law and those followed by NASDAQ-listed U.S. domestic issuers.
Corporate Governance
Under NASDAQ Listing Rules, a U.S. domestic issuer is required to establish a quorum as specified in its bylaws for any meeting of the holders of common stock, provided, however, that such quorum is not permitted to be less than 33 1/3% of the outstanding shares of voting stock. The Articles of Association provide that, on the first call of our general shareholders’ meetings, a duly constituted meeting requires a quorum of at least 25% of our subscribed share capital with voting rights, and, if a quorum is not obtained on the first call, a meeting is validly convened on the second call regardless of the share capital in attendance. However, certain major corporate actions (such as issuing additional ordinary shares, increasing or decreasing our share capital, issuing debt securities, amending the Articles of Association or approving merger transactions) require shareholder approval at a meeting at which at least 50% of our subscribed share capital with voting rights is present or represented on the first call or at least 25% of the our share capital with voting rights present or represented on the second call. However, when the number of shareholders attending a meeting represents less than 50% of our subscribed share capital with voting rights, resolutions on any of these major corporate actions must be adopted by the affirmative vote of at least two-thirds of the share capital present or represented at such meeting.
125
In addition, all actions described in Article 6.bis of the Articles of Association, which are considered to affect the economic rights of our Class B shares, must be approved at a shareholders meeting by the holders of at least a majority of Class B shares.
Under NASDAQ Listing Rules, U.S. domestic issuers are required to solicit proxies, provide proxy statements for all shareholders’ meetings and provide copies of such proxy materials to NASDAQ. As a foreign private issuer, we are generally exempt from the SEC rules governing the solicitation of shareholder proxies. However, under Spanish law and per the Articles of Association, we are required to publish a calling of the meeting at least one month prior to the date set for each general shareholders’ meeting in at least: (i) the Official Gazette of the Commercial Registry or one of the local newspapers of wide circulation in the province where we are domiciled (currently Barcelona, Spain); (ii) CNMV’s website; and (iii) our website. We distribute a copy of the notice of the meeting and a form of proxy to our U.S. shareholders and also make these materials available through our website in advance of such meeting.
Under NASDAQ Listing Rules, shareholders of U.S. domestic issuers must be given the opportunity to vote on equity compensation plans and material revisions thereto, with limited exceptions set forth in NASDAQ Listing Rules, including an exception for foreign private issuers who follow the laws of their home country. Under Spanish law, equity compensation plans involving the issuance of our securities require prior shareholder approval. Additionally, equity compensation plans in which our officers and employees participate can be approved by the Board without shareholder approval. However, the establishment of equity compensation plans in which members of the Board participate must be authorized in the Articles of Association and requires the shareholders’ prior approval at a shareholders’ meeting.
Under NASDAQ Listing Rules, shareholders of U.S. domestic issuers must approve the issuance of securities when such issuance would result in a change in control of such issuer. Under Spanish law, any issuance of our securities, regardless of whether such issuance would result in a change of control, requires prior shareholder approval.
In Spain, companies with securities listed on a Spanish Stock Exchange are:
| | (i) | recommended to follow the provisions of the CNMV Governance Code; |
| | (ii) | required by law to publish an Annual Report on Corporate Governance as well as corporate governance information on their websites; and |
| | (iii) | required by law to comply with the regulations with respect to audit committees set forth in the Securities Market Act, as amended. |
Board Practices
Independence of Directors
Pursuant to NASDAQ Listing Rules, a majority of the directors of a listed U.S. company are required to be “independent,” as such term is defined by NASDAQ Listing Rules. As a foreign private issuer, we are exempt from such requirement, and Spanish law does not contain any such requirements.
Spanish law establishes that the category of directors and the indispensable requirements to determine their independence are regulated by the Ministry of Economy and Finance, or, with its authorization, by the CNMV. The Articles of Association and Board Regulations, following the non-binding recommendations of the CNMV Governance Code, recognize two main categories of directors: (i) executive directors; and (ii) external directors, who can be divided into (a) proprietary directors, (b) independent directors and (c) other directors who cannot be considered proprietary or independent.
The definition of “independent director,” as set forth in the CNMV Governance Code and Article 6 of the Board Regulations, provides that the persons listed below may not be nominated or designated as independent directors.
| | (i) | Employees or executive directors of any Group companies, unless three or five years have elapsed, respectively, since the termination of the relationship. |
| | (ii) | Persons that have received some payment from us or from the Group in addition to their directors’ remuneration, unless the amount involved is not significant. Dividends or pension supplements received by a director for prior employment or professional services are excluded, provided that such payments are non-contingent (i.e., the paying company has no discretionary power to suspend, modify or revoke the payment). |
| | (iii) | Persons that have been, during the last three years, partners of the external auditors or the firm responsible for the audit report, whether with respect to the audit of us or any other company in the Group for those years. |
| | (iv) | Executive directors or senior officers of other companies in which any of our executive directors or senior officers is an external director. |
126
| | (v) | Persons that have or had, during the last year, material business relationships with us or with any other company in the Group, whether in their own name or as a significant shareholder, director or senior officer of a company that has or had such a relationship. For purposes of this paragraph (v), “business relationships” means any relationship with suppliers of goods or services, including financial, advisory and consultancy services. |
| | (vi) | Significant shareholders, executive directors or senior officers of an entity which receives or has received, during the last three years, significant donations from us or the Group. This provision does not apply to those who are merely trustees of a foundation receiving donations. |
| | (vii) | Spouses or related persons maintaining an analogous relationship or close relatives of one of our executive directors or senior officers. |
| | (viii) | Any person not proposed for appointment or renewal by the Appointments and Remuneration Committee. |
| | (ix) | Persons in any of the situations set out in (i), (v), (vi) or (vii) above with regard to a significant shareholder or a shareholder with Board representation. In the case of the family relations set out in (vii) above, the limitation applies not only in connection with the shareholder but also with our proprietary directors. |
The proprietary directors who lose this status as a consequence of the sale of the shareholding by the shareholder they represent, can be reelected as independent directors only when such shareholder has sold the total amount of its shares.
Finally, any member of the Board that owns our shares can be considered independent, as long as the shareholding is not significant and satisfies all the above-mentioned conditions.
We have not determined whether our directors would be considered independent under NASDAQ Listing Rules, except for the three directors who are members of the Audit Committee and as such must meet NASDAQ independence criteria. Two members of the Board are independent directors in accordance with the Board Regulations and the CNMV Governance Code.
Furthermore, we follow the Spanish Companies Act, which does not, unlike NASDAQ Listing Rules, require independent directors to hold meetings where only such independent directors are present.
For a detailed discussion of the composition, responsibilities and terms of our Audit Committee, see Item 6 of Part I, “Directors, Senior Management and Employees — C. Board Practices — Committees of the Board — Audit Committee.”
Audit Committee
Responsibilities and Terms. In accordance with NASDAQ Listing Rules, our Audit Committee is in charge of the appointment, compensation, retention and oversight of the services of any registered public accounting firm engaged for the purpose of preparing and issuing any audit report, or for performing other audit reviews or related services. Notwithstanding the above, Spanish laws provide our shareholders with the authority to appoint and replace the independent auditor at a general shareholders meeting.
Independence of the Audit Committee. All of the members of our Audit Committee meet the independence criteria set out in NASDAQ Listing Rules. In addition, the Securities Market Act requires that (a) the Audit Committee be composed of a majority of non-executive directors (at least one of them being independent and appointed due to his knowledge and experience in accounting or auditing matters) and (b) the chairman of the Audit Committee is an external director. For a further discussion regarding the composition of our Audit Committee, see Item 6 of Part I, “Directors, Senior Management and Employees — C. Board Practices — Committees of the Board — Audit Committee.”
Internal Audit Department. We have an internal audit department responsible for internal audit matters and ensuring the efficiency of the internal audit control process of our different business units. Our internal audit department reports directly to the Audit Committee, supporting the adequate performance of all its functions.
Appointments and Remuneration Committee
Pursuant to NASDAQ Listing Rules, foreign private issuers are exempt from the requirements regarding independent nominating and compensation committees. Foreign private issuers are permitted to follow their home country corporate governance practice in this respect.
Spanish law does not mandate that a company have an appointments and remuneration committee or, if such a committee is formed, that the committee be comprised of independent directors. However, the CNMV Governance Code recommends that Spanish listed companies have an appointments and remuneration committee and that a majority of the members of such committee are independent directors.
127
Our Appointments and Remuneration Committee is comprised of a majority of external directors and is chaired by an external director. However, Mr. Víctor Grifols Roura, our Chief Executive Officer, is also a member of this committee. For a detailed discussion of our Appointments and Remuneration Committee, see Item 6 of Part I, “Directors, Senior Management and Employees — C. Board Practices — Committees of the Board — Appointments and Remuneration Committee.”
Code of Conduct and Business Ethics
Under NASDAQ Listing Rules, we are required to adopt a code of business conduct and ethics applicable to all directors, officers and employees, which must be publicly available. Furthermore, under Spanish law, Grifols’ is required to adopt an internal code of conduct for securities markets, in order to prevent insider trading, misconduct, and to control possible conflicts of interest.
In order to comply with the requirements of Spanish law, in 2006, Grifols adopted the Stock Market Code of Conduct. Additionally, the Board Regulations set out in detail the directors’ main obligations relating to conflicts of interest concerning business opportunities, use of Grifols’ assets, confidentiality and non-competition. Both the Stock Market Code of Conduct and the Board Regulations are publicly available on our website, which does not form part of this annual report on Form 20-F, atwww.grifols.com. Although not mandatory under Spanish laws, the Board of Grifols also approved the Code of Conduct for Grifols Employees, which is publicly available on our website, which does not form part of this annual report on Form 20-F, atwww.grifols.com.
| Item 16.H. | MINE SAFETY DISCLOSURE |
Not applicable.
PART III
| Item 17. | FINANCIAL STATEMENTS |
We have elected to provide financial statements pursuant to Item 18 of this Part III.
| Item 18. | FINANCIAL STATEMENTS |
The audited consolidated financial statements as required under Item 18 of this Part III are attached hereto starting on page F-1 of this annual report on Form 20-F. The audit report of KPMG, our independent registered public accounting firm, is included herein preceding the audited consolidated financial statements.
| | |
Exhibit
Number | | Description |
| |
| 1.1 | | Articles of Association (Estatutos) of Grifols, S.A. (incorporated by reference to Exhibit 3.1.1 of our Registration Statement on Form F-4 (File No. 333-177466) filed on October 24, 2011) |
| |
| 1.2 | | Articles of Association (Estatutos) of Grifols, S.A. (English translation) (incorporated by reference to Exhibit 3.1.2 of our Registration Statement on Form F-4 (File No. 333-177466) filed on October 24, 2011) |
| |
| 2.1 | | Form of Deposit Agreement among Grifols, S.A., Deutsche Bank Trust Company Americas, as depositary, and all Holders from time to time of American Depositary Shares evidenced by American Depositary Receipts issued thereunder (incorporated herein by reference to Exhibit (a) to our Registration Statement on Form F-6 (File No. 333-172688) filed March 9, 2011) |
| |
| 2.2 | | Form of Deposit Agreement among Grifols, S.A., Deutsche Bank Trust Company Americas, as depositary, and all Holders from time to time of American Depositary Shares evidenced by American Depositary Receipts issued thereunder (incorporated herein by reference to Exhibit (a) to our Registration Statement on Form F-6 (File No. 333-159327) filed May 18, 2009) |
| |
| 2.3 | | Senior Notes Indenture, dated as of January 21, 2011, relating to the 8.25% Senior Notes due 2018, among Giant Funding Corp. and The Bank of New York Mellon Trust Company, N.A., as trustee (incorporated by reference to Exhibit 4.1 of our Registration Statement on Form F-4 (File No. 333-177466) filed on October 24, 2011) |
| |
| 2.4 | | Form of 8.25% Senior Note (incorporated by reference to Exhibit 4.2 and Exhibit A to Exhibit 4.1 of our Registration Statement on Form F-4 (File No. 333-177466) filed on October 24, 2011) |
128
| | |
Exhibit
Number | | Description |
| |
| 2.5 | | Supplemental Indenture, dated June 1, 2011, by and among Inc., Grifols, S.A., the subsidiary guarantors party thereto and The Bank of New York Mellon Trust Company, N.A., as trustee (incorporated by reference to Exhibit 4.3 of our Registration Statement on Form F-4 (File No. 333-177466) filed on October 24, 2011) |
| |
| 2.6 | | Second Supplemental Indenture, dated as of October 4, 2011, between Grifols Deutschland GmbH and The Bank of New York Mellon Trust Company, N.A., as trustee (incorporated by reference to Exhibit 4.4 of our Registration Statement on Form F-4 (File No. 333-177466) filed on October 24, 2011) |
| |
| 4.1 | | Credit and Guaranty Agreement, dated as of November 23, 2010, among Grifols Inc., Grifols, S.A., certain subsidiaries of Grifols, S.A., the lenders party thereto, Deutsche Bank Securities, Inc., Nomura International PLC, Banco Bilbao Vizcaya Argentaria, S.A., BNP Paribas, HSBC Securities (USA) Inc. and Morgan Stanley Senior Funding, Inc., as joint lead arrangers and joint bookrunners and Deutsche Bank AG New York branch, as administrative agent and collateral agent (incorporated by reference to Exhibit 10.1 of our Registration Statement on Form F-4 (File No. 333-177466) filed on October 24, 2011) |
| |
| 4.2 | | First Amendment to Credit and Guaranty Agreement, dated as of March 3, 2011, by and among Grifols, Inc., Deutsche Bank AG New York Branch, as administrative agent (incorporated by reference to Exhibit 10.2 of our Registration Statement on Form F-4 (File No. 333-177466) filed on October 24, 2011) |
| |
| 4.3 | | Second Amendment to Credit and Guaranty Agreement, dated as of May 31, 2011, by and among Grifols, Inc. and Deutsche Bank AG New York Branch, as administrative agent (incorporated by reference to Exhibit 10.3 of our Registration Statement on Form F-4 (File No. 333-177466) filed on October 24, 2011) |
| |
| 4.4 | | Third Amendment to Credit and Guaranty Agreement, dated as of February 29, 2012, by and among Grifols, Inc. and Deutsche Bank AG New York Branch, as administrative agent |
| |
| 4.5 | | Counterpart Agreement, dated June 1, 2011, by and among Grifols Inc., Grifols, S.A. and certain of its subsidiaries, the Lenders party thereto and Deutsche Bank AG New York Branch, as administrative agent and collateral agent (incorporated by reference to Exhibit 10.4 of our Registration Statement on Form F-4 (File No. 333-177466) filed on October 24, 2011) |
| |
| 4.6 | | U.S. Pledge and Security Agreement, dated as of June 1, 2011, among the grantors party thereto and Deutsche Bank AG New York Branch, as collateral agent (incorporated by reference to Exhibit 10.5 of our Registration Statement on Form F-4 (File No. 333-177466) filed on October 24, 2011) |
| |
| 4.7 | | Assumption Agreement, dated as of June 1, 2011, by and between Grifols, Inc. and Deutsche Bank AG New York Branch, as administrative agent (incorporated by reference to Exhibit 10.6 of our Registration Statement on Form F-4 (File No. 333-177466) filed on October 24, 2011) |
| |
| 8.1 | | List of subsidiaries (see Notes 1(b) and 2(c) to our audited consolidated financial statements starting on page F-1 of this annual report on Form 20-F) |
| |
| 12.1 | | Principal Executive Officer Certification pursuant to Section 302 of the Sarbanes-Oxley Act of 2002 |
| |
| 12.2 | | Principal Financial Officer Certification pursuant to Section 302 of the Sarbanes-Oxley Act of 2002 |
| |
| 13.1 | | Principal Executive Officer and Principal Financial Officer Certification pursuant to Section 906 of the Sarbanes-Oxley Act of 2002 |
129
SIGNATURES
The registrant hereby certifies that it meets all of the requirements for filing on Form 20-F and that it has duly caused and authorized the undersigned to sign this annual report on its behalf.
| | |
| GRIFOLS, S.A. |
| |
| By: | | /s/ Víctor Grifols Roura |
| | Name: Víctor Grifols Roura |
| | Title: Chairman of the Board of Directors and Chief Executive Officer |
Date: March 29, 2012
130
GRIFOLS, S.A. AND SUBSIDIARIES
INDEX TO THE CONSOLIDATED FINANCIAL STATEMENTS
131
Report of Independent Registered Public Accounting Firm
To the Board of Directors and Stockholders of Grifols, S.A.:
We have audited the accompanying consolidated balance sheets of Grifols, S.A. and subsidiaries (the “Company”) as of December 31, 2011 and 2010, and the related consolidated income statements, consolidated statements of comprehensive income, statements of changes in consolidated equity and consolidated statements of cash flows for each of the years in the three-year period ended December 31, 2011. We also have audited Grifols’ internal control over financial reporting as of December 31, 2011, based on criteria established inInternal Control – Integrated Framework issued by the Committee of Sponsoring Organizations of the Treadway Commission (COSO). Grifols’ management is responsible for these consolidated financial statements, for maintaining effective internal control over financial reporting, and for its assessment of the effectiveness of internal control over financial reporting, included in the accompanying Management´s Report on Internal Control Over Financial Reporting. Our responsibility is to express an opinion on these consolidated financial statements and an opinion on the Company’s internal control over financial reporting based on our audits.
We conducted our audits in accordance with the standards of the Public Company Accounting Oversight Board (United States). Those standards require that we plan and perform the audits to obtain reasonable assurance about whether the financial statements are free of material misstatement and whether effective internal control over financial reporting was maintained in all material respects. Our audit of the consolidated financial statements included examining, on a test basis, evidence supporting the amounts and disclosures in the financial statements, assessing the accounting principles used and significant estimates made by management, and evaluating the overall financial statement presentation. Our audit of internal control over financial reporting included obtaining an understanding of internal control over financial reporting, assessing the risk that a material weakness exists, and testing and evaluating the design and operating effectiveness of internal control based on the assessed risk. Our audit also included performing such other procedures as we considered necessary in the circumstances. We believe that our audits provide a reasonable basis for our opinions.
A company’s internal control over financial reporting is a process designed to provide reasonable assurance regarding the reliability of financial reporting and the preparation of financial statements for external purposes in accordance with generally accepted accounting principles. A company’s internal control over financial reporting includes those policies and procedures that (1) pertain to the maintenance of records that, in reasonable detail, accurately and fairly reflect the transactions and dispositions of the assets of the company; (2) provide reasonable assurance that transactions are recorded as necessary to permit preparation of financial statements in accordance with generally accepted accounting principles, and that receipts and expenditures of the company are being made only in accordance with authorizations of management and directors of the company; and (3) provide reasonable assurance regarding prevention or timely detection of unauthorized acquisition, use, or disposition of the company’s assets that could have a material effect on the financial statements.
Because of its inherent limitations, internal control over financial reporting may not prevent or detect misstatements. Also, projections of any evaluation of effectiveness to future periods are subject to the risk that controls may become inadequate because of changes in conditions, or that the degree of compliance with the policies or procedures may deteriorate.
In our opinion, the consolidated financial statements referred to above present fairly, in all material respects, the financial position of Grifols, S.A. and subsidiaries as of December 31, 2011 and 2010, and the results of their operations and their cash flows for each of the years in the three-year period ended December 31, 2011, in conformity with International Financial Reporting Standards as issued by the International Accounting Standards Board. Also in our opinion, Grifols maintained, in all material respects, effective internal control over financial reporting as of December 31, 2011, based on criteria established inInternal Control – Integrated Framework issued by the Committee of Sponsoring Organizations of the Treadway Commission.
KPMG Auditores, S.L.
Barcelona, Spain
March 29, 2012
F-1
GRIFOLS, S.A. AND SUBSIDIARIES
Consolidated Balance Sheets
at 31 December 2011 and 2010
| | | | | | | | |
| | | 31/12/11 | | | 31/12/10 | |
| | | (Expressed in thousands of Euros) | |
Assets | | | | | | | | |
| | |
Non-current assets | | | | | | | | |
Intangible assets | | | | | | | | |
Goodwill (note 7) | | | 1,895,101 | | | | 189,448 | |
Other intangible assets (note 8) | | | 1,008,307 | | | | 78,299 | |
| | | | | | | | |
Total intangible assets | | | 2,903,408 | | | | 267,747 | |
Property, plant and equipment (note 9) | | | 775,869 | | | | 434,131 | |
Investments in equity accounted investees (note 10) | | | 1,001 | | | | 598 | |
Non-current financial assets (note 11) | | | 12,401 | | | | 7,535 | |
| | |
Deferred tax assets (note 29) | | | 185,824 | | | | 34,889 | |
| | | | | | | | |
| | |
Total non-current assets | | | 3,878,503 | | | | 744,900 | |
| | |
Current assets | | | | | | | | |
Inventories (note 12) | | | 1,030,341 | | | | 527,865 | |
Trade and other receivables | | | | | | | | |
Trade receivables | | | 408,263 | | | | 224,355 | |
Other receivables | | | 108,616 | | | | 44,032 | |
Current income tax assets | | | 15,110 | | | | 14,607 | |
| | | | | | | | |
Trade and other receivables (note 13) | | | 531,989 | | | | 282,994 | |
Other current financial assets (note 14) | | | 16,904 | | | | 12,946 | |
Other current assets (note 15) | | | 9,395 | | | | 80,628 | |
Cash and cash equivalents (note 16) | | | 340,586 | | | | 239,649 | |
| | | | | | | | |
| | |
Total current assets | | | 1,929,215 | | | | 1,144,082 | |
| | | | | | | | |
Total assets | | | 5,807,718 | | | | 1,888,982 | |
| | | | | | | | |
The accompanying notes form an integral part of the consolidated financial statements.
F-2
GRIFOLS, S.A. AND SUBSIDIARIES
Consolidated Balance Sheets
at 31 December 2011 and 2010
| | | | | | | | |
| | | 31/12/11 | | | 31/12/10 | |
| | | (Expressed in thousands of Euros) | |
Equity and liabilities | | | | | | | | |
| | |
Equity | | | | | | | | |
Share capital | | | 117,882 | | | | 106,532 | |
Share premium | | | 890,355 | | | | 121,802 | |
Reserves | | | 568,274 | | | | 403,604 | |
Own shares | | | (1,927 | ) | | | (1,927 | ) |
Profit for the year attributable to the Parent | | | 50,307 | | | | 115,513 | |
| | | | | | | | |
| | | 1,624,891 | | | | 745,524 | |
Cash flow hedges | | | (21,184 | ) | | | (1,751 | ) |
Translation differences | | | 58,800 | | | | (50,733 | ) |
| | | | | | | | |
Accumulated other comprehensive income | | | 37,616 | | | | (52,484 | ) |
Equity attributable to the Parent (note 17) | | | 1,662,507 | | | | 693,040 | |
Non-controlling interests (note 19) | | | 2,487 | | | | 14,350 | |
| | | | | | | | |
Total equity | | | 1,664,994 | | | | 707,390 | |
| | | | | | | | |
| | |
Liabilities | | | | | | | | |
| | |
Non-current liabilities | | | | | | | | |
Grants (note 20) | | | 1,366 | | | | 2,088 | |
Provisions (note 21) | | | 11,052 | | | | 1,378 | |
Non-current financial liabilities | | | | | | | | |
Loans and borrowings, bonds and other marketable securities | | | 2,809,225 | | | | 665,385 | |
Other financial liabilities | | | 136,563 | | | | 10,474 | |
| | | | | | | | |
Total non-current financial liabilities (note 22) | | | 2,945,788 | | | | 675,859 | |
| | |
Deferred tax liabilities (note 29) | | | 538,441 | | | | 79,141 | |
| | | | | | | | |
Total non-current liabilities | | | 3,496,647 | | | | 758,466 | |
| | |
Current liabilities | | | | | | | | |
Provisions (note 21) | | | 81,112 | | | | 4,365 | |
| | |
Current financial liabilities | | | | | | | | |
Loans and borrowings, bonds and other marketable securities | | | 147,789 | | | | 191,635 | |
Other financial liabilities | | | 14,507 | | | | 18,236 | |
| | | | | | | | |
Total current financial liabilities (note 22) | | | 162,296 | | | | 209,871 | |
Debts with associates (note 33) | | | 2,435 | | | | 1,162 | |
Trade and other payables | | | | | | | | |
Suppliers | | | 280,722 | | | | 160,678 | |
Other payables | | | 27,335 | | | | 11,928 | |
Current income tax liabilities | | | 4,691 | | | | 4,172 | |
| | | | | | | | |
Total trade and other payables (note 23) | | | 312,748 | | | | 176,778 | |
Other current liabilities (note 24) | | | 87,486 | | | | 30,950 | |
| | | | | | | | |
Total current liabilities | | | 646,077 | | | | 423,126 | |
| | | | | | | | |
Total liabilities | | | 4,142,724 | | | | 1,181,592 | |
| | | | | | | | |
Total equity and liabilities | | | 5,807,718 | | | | 1,888,982 | |
| | | | | | | | |
The accompanying notes form an integral part of the consolidated financial statements.
F-3
GRIFOLS, S.A. AND SUBSIDIARIES
Consolidated Statements of Comprehensive Income
for the years ended 31 December 2011, 2010 and 2009
| | | | | | | | | | | | |
| | | 31/12/11 | | | 31/12/10 | | | 31/12/09 | |
| | | (Expressed in thousands of Euros) | |
Consolidated profit for the year | | | 50,228 | | | | 115,267 | | | | 147,570 | |
| | | |
Income and expenses generated during the year | | | | | | | | | | | | |
| | | |
Measurement of financial instruments (note 11) | | | 0 | | | | 0 | | | | (14 | ) |
| | | |
Available-for-sale financial assets | | | 0 | | | | 0 | | | | (18 | ) |
Tax effect | | | 0 | | | | 0 | | | | 4 | |
| | | |
Cash flow hedges (note 17 (f)) | | | (21,184 | ) | | | 0 | | | | (1,998 | ) |
Cash flow hedges | | | (33,871 | ) | | | 0 | | | | (3,275 | ) |
Tax effect | | | 12,687 | | | | 0 | | | | 1,277 | |
| | | |
Translation differences | | | 109,607 | | | | 42,225 | | | | (4,145 | ) |
| | | | | | | | | | | | |
Income and expenses generated during the year | | | 88,423 | | | | 42,225 | | | | (6,157 | ) |
| | | | | | | | | | | | |
Income and expense recognised in the income statement: | | | | | | | | | | | | |
| | | |
Measurement of financial instruments (note 11) | | | 0 | | | | 0 | | | | 172 | |
| | | |
Available-for-sale financial assets | | | 0 | | | | 0 | | | | 245 | |
Tax effect | | | 0 | | | | 0 | | | | (73 | ) |
| | | |
Cash flow hedges (note 22 (a.1.2)) | | | 1,751 | | | | 197 | | | | 50 | |
Cash flow hedges | | | 2,870 | | | | 324 | | | | 80 | |
Tax effect | | | (1,119 | ) | | | (127 | ) | | | (30 | ) |
| | | | | | | | | | | | |
Income and expense recognised in the income statement: | | | 1,751 | | | | 197 | | | | 222 | |
| | | | | | | | | | | | |
Total comprehensive income for the year | | | 140,402 | | | | 157,689 | | | | 141,635 | |
| | | | | | | | | | | | |
| | | |
Total comprehensive income attributable to the Parent | | | 140,407 | | | | 155,230 | | | | 140,386 | |
| | | |
Total comprehensive income attributable to non-controlling interests | | | (5 | ) | | | 2,459 | | | | 1,249 | |
| | | | | | | | | | | | |
Total comprehensive income for the year | | | 140,402 | | | | 157,689 | | | | 141,635 | |
| | | | | | | | | | | | |
The accompanying notes form an integral part of the consolidated financial statements.
F-4
GRIFOLS, S.A. AND SUBSIDIARIES
Consolidated Income Statements
for the years ended 31 December 2011, 2010 and 2009
| | | | | | | | | | | | |
| | | 31/12/11 | | | 31/12/10 | | | 31/12/09 | |
| | | (Expressed in thousands of Euros) | |
Revenues (note 25) | | | 1,795,613 | | | | 990,730 | | | | 913,186 | |
Changes in inventories of finished goods and work in progress (note 12) | | | (35,150 | ) | | | 45,749 | | | | 73,093 | |
Self-constructed non-current assets (notes 8 and 9) | | | 34,548 | | | | 33,513 | | | | 41,142 | |
Supplies (note 12) | | | (431,552 | ) | | | (304,818 | ) | | | (286,274 | ) |
Other operating income (note 27) | | | 2,193 | | | | 1,196 | | | | 1,443 | |
Personnel expenses (note 26) | | | (488,641 | ) | | | (289,008 | ) | | | (273,168 | ) |
Other operating expenses (note 27) | | | (428,510 | ) | | | (205,260 | ) | | | (203,381 | ) |
Amortisation and depreciation (notes 8 and 9) | | | (90,639 | ) | | | (45,776 | ) | | | (39,554 | ) |
Transaction costs of Talecris business combination (note 3 (a)) | | | (44,352 | ) | | | (16,999 | ) | | | 0 | |
Non-financial and other capital grants (note 20) | | | 1,304 | | | | 728 | | | | 1,188 | |
Impairment and net losses on disposal of fixed assets (notes 7, 8 and 9) | | | (35,953 | ) | | | (372 | ) | | | (1,147 | ) |
| | | | | | | | | | | | |
Results from operating activities | | | 278,861 | | | | 209,683 | | | | 226,528 | |
| | | | | | | | | | | | |
| | | |
Finance income | | | 5,761 | | | | 4,526 | | | | 7,067 | |
Finance expenses | | | (200,562 | ) | | | (49,660 | ) | | | (27,087 | ) |
Change in fair value of financial instruments (note 32) | | | 1,279 | | | | (7,593 | ) | | | (587 | ) |
Gains/(losses) on disposal of financial instruments | | | (805 | ) | | | 91 | | | | (245 | ) |
Exchange gains/(losses) | | | (3,447 | ) | | | 1,616 | | | | (1,733 | ) |
| | | | | | | | | | | | |
Net finance expense (note 28) | | | (197,774 | ) | | | (51,020 | ) | | | (22,585 | ) |
| | | | | | | | | | | | |
Share of profit / (loss) of equity accounted investees (note 10) | | | (1,064 | ) | | | (879 | ) | | | 51 | |
| | | |
Profit before income tax from continuing operations | | | 80,023 | | | | 157,784 | | | | 203,994 | |
| | | | | | | | | | | | |
Income tax expense (note 29) | | | (29,795 | ) | | | (42,517 | ) | | | (56,424 | ) |
| | | | | | | | | | | | |
Profit after income tax from continuing operations | | | 50,228 | | | | 115,267 | | | | 147,570 | |
| | | | | | | | | | | | |
Consolidated profit for the year | | | 50,228 | | | | 115,267 | | | | 147,570 | |
| | | | | | | | | | | | |
| | | |
Profit attributable to equity holders of the Parent | | | 50,307 | | | | 115,513 | | | | 147,972 | |
Profit / (loss) attributable to non-controlling interests (note 19) | | | (79 | ) | | | (246 | ) | | | (402 | ) |
| | | |
Basic earnings per share (Euros) (note 18) | | | 0.19 | | | | 0.54 | | | | 0.71 | |
| | | |
Diluted earnings per share (Euros) (note 18) | | | 0.19 | | | | 0.54 | | | | 0.71 | |
The accompanying notes form an integral part of the consolidated financial statements.
F-5
GRIFOLS, S.A. AND SUBSIDIARIES
Consolidated Statements of Cash Flows
for the years ended 31 December 2011, 2010 and 2009
| | | | | | | | | | | | |
| | | 31/12/11 | | | 31/12/10 | | | 31/12/09 | |
| | | (Expressed in thousands of Euros) | |
Cash flows from/(used in) operating activities | | | | | | | | | | | | |
Profit before income tax | | | 80,023 | | | | 157,784 | | | | 203,994 | |
Adjustments for: | | | 313,915 | | | | 92,351 | | | | 61,800 | |
Amortisation and depreciation (notes 8 and 9) | | | 90,639 | | | | 45,776 | | | | 39,554 | |
Other adjustments: | | | 223,276 | | | | 46,575 | | | | 22,246 | |
(Profit) /losses on equity accounted investments (note 10) | | | 1,064 | | | | 879 | | | | (51 | ) |
Exchange differences | | | 3,447 | | | | (1,616 | ) | | | 1,733 | |
Impairment of assets and net provision charges | | | 23,806 | | | | 913 | | | | 53 | |
(Profits) / losses on disposal of fixed assets | | | 19,366 | | | | (276 | ) | | | 1,147 | |
Government grants taken to income (note 20) | | | (1,304 | ) | | | (728 | ) | | | (1,188 | ) |
Net finance expense | | | 180,567 | | | | 47,442 | | | | 17,551 | |
Other adjustments | | | (3,670 | ) | | | (39 | ) | | | 3,001 | |
Change in operating assets and liabilities | | | (51,279 | ) | | | (78,767 | ) | | | (104,127 | ) |
Change in inventories | | | 6,909 | | | | (18,306 | ) | | | (113,104 | ) |
Change in trade and other receivables | | | (54,142 | ) | | | (23,546 | ) | | | (12,549 | ) |
Change in current financial assets and other current assets | | | 9,321 | | | | (73,022 | ) | | | (1,287 | ) |
Change in current trade and other payables | | | (13,367 | ) | | | 36,107 | | | | 22,813 | |
Other cash flows used in operating activities | | | (122,431 | ) | | | (67,116 | ) | | | (73,487 | ) |
Interest paid | | | (139,883 | ) | | | (40,129 | ) | | | (14,719 | ) |
Interest received | | | 3,582 | | | | 5,436 | | | | 2,509 | |
Income tax paid | | | 13,870 | | | | (32,423 | ) | | | (61,277 | ) |
| | | | | | | | | | | | |
Net cash from operating activities | | | 220,228 | | | | 104,252 | | | | 88,180 | |
Cash flows from/(used in) investing activities | | | | | | | | | | | | |
Payments for investments | | | (1,784,464 | ) | | | (108,588 | ) | | | (136,626 | ) |
Group companies and business units | | | (1,624,869 | ) | | | (1,474 | ) | | | (15,385 | ) |
Property, plant and equipment and intangible assets | | | (159,899 | ) | | | (103,402 | ) | | | (118,770 | ) |
Property, plant and equipment | | | (137,200 | ) | | | (86,800 | ) | | | (103,415 | ) |
Intangible assets | | | (22,699 | ) | | | (16,602 | ) | | | (15,355 | ) |
Other financial assets | | | 304 | | | | (3,712 | ) | | | (2,471 | ) |
Proceeds from the sale of investments | | | 165,738 | | | | 4,532 | | | | 673 | |
Property, plant and equipment | | | 160,266 | | | | 3,911 | | | | 673 | |
Associates (note 2 ( c)) | | | 5,472 | | | | 621 | | | | 0 | |
| | | | | | | | | | | | |
Net cash used in investing activities | | | (1,618,726 | ) | | | (104,056 | ) | | | (135,953 | ) |
Cash flows from/(used in) financing activities | | | | | | | | | | | | |
Proceeds from and payments for equity instruments | | | (2,830 | ) | | | (1,250 | ) | | | 26,655 | |
Issue | | | (2,830 | ) | | | 0 | | | | (76 | ) |
Acquisition of own shares (note 17 (d)) | | | 0 | | | | (1,250 | ) | | | (25,186 | ) |
Disposal of treasury shares | | | 0 | | | | 0 | | | | 51,917 | |
Proceeds from and payments for financial liability instruments | | | 1,762,550 | | | | (1,066 | ) | | | 344,413 | |
Issue | | | 2,994,741 | | | | 118,238 | | | | 525,078 | |
Redemption and repayment | | | (1,232,191 | ) | | | (119,304 | ) | | | (180,665 | ) |
Dividends and interest on other equity instruments paid | | | 0 | | | | (27,282 | ) | | | (80,913 | ) |
Other cash flows from financing activities | | | (284,748 | ) | | | 323 | | | | 741 | |
Transaction costs of financial instruments issued in the acquisition of Talecris | | | (285,088 | ) | | | 0 | | | | 0 | |
Other amounts received from financing activities | | | 340 | | | | 323 | | | | 741 | |
| | | | | | | | | | | | |
Net cash from/(used in) financing activities | | | 1,474,972 | | | | (29,275 | ) | | | 290,896 | |
Effect of exchange rate fluctuations on cash | | | 24,463 | | | | 19,356 | | | | (119 | ) |
Net increase / (decrease) in cash and cash equivalents | | | 100,937 | | | | (9,723 | ) | | | 243,004 | |
Cash and cash equivalents at beginning of the year | | | 239,649 | | | | 249,372 | | | | 6,368 | |
Cash and cash equivalents at end of year | | | 340,586 | | | | 239,649 | | | | 249,372 | |
The accompanying notes form an integral part of the consolidated financial statements
F-6
GRIFOLS, S.A. AND SUBSIDIARIES
Statement of Changes in Consolidated Equity
for the years ended 31 December 2011, 2010 and 2009
(Expressed in thousands of Euros)
| | | | | | | | | | | | | | | | | | | | | | | | | | | | | | | | | | | | | | | | | | | | | | | | |
| | | Attributable to equity holders of the Parent | |
| | | | | | | | | | | | | | | | | | | | | Accumulated other comprehensive income | | | | | | | | | | |
| | | Share
capital | | | Share
premium | | | Reserves * | | | Profit attributable
to
Parent | | | Interim
dividend | | | Own
Shares | | | Translation
differences | | | Cash flow
hedges | | | Available-for
sale
financial
assets | | | Equity
attributable
to
Parent | | | Non-controlling
interests | | | Equity | |
Balances at 31 December 2008 | | | 106,532 | | | | 121,802 | | | | 247,669 | | | | 121,728 | | | | 0 | | | | (33,087 | ) | | | (84,457 | ) | | | 0 | | | | (158 | ) | | | 480,029 | | | | 1,250 | | | | 481,279 | |
| | | | | | | | | | | | | | | | | | | | | | | | | | | | | | | | | | | | | | | | | | | | | | | | |
Translation differences | | | — | | | | — | | | | — | | | | — | | | | — | | | | — | | | | (5,796 | ) | | | — | | | | — | | | | (5,796 | ) | | | 1,651 | | | | (4,145 | ) |
Cash flow hedges | | | — | | | | — | | | | — | | | | — | | | | — | | | | — | | | | — | | | | (1,948 | ) | | | — | | | | (1,948 | ) | | | — | | | | (1,948 | ) |
Gains/(Losses) on available-for-sale financial assets | | | — | | | | — | | | | — | | | | — | | | | — | | | | — | | | | — | | | | — | | | | 158 | | | | 158 | | | | — | | | | 158 | |
| | | | | | | | | | | | | | | | | | | | | | | | | | | | | | | | | | | | | | | | | | | | | | | | |
Other comprehensive income for the year | | | 0 | | | | 0 | | | | 0 | | | | 0 | | | | 0 | | | | 0 | | | | (5,796 | ) | | | (1,948 | ) | | | 158 | | | | (7,586 | ) | | | 1,651 | | | | (5,935 | ) |
Profit/(loss) for the year | | | — | | | | — | | | | — | | | | 147,972 | | | | 0 | | | | — | | | | — | | | | — | | | | — | | | | 147,972 | | | | (402 | ) | | | 147,570 | |
| | | | | | | | | | | | | | | | | | | | | | | | | | | | | | | | | | | | | | | | | | | | | | | | |
Total comprehensive income for the year | | | 0 | | | | 0 | | | | 0 | | | | 147,972 | | | | 0 | | | | 0 | | | | (5,796 | ) | | | (1,948 | ) | | | 158 | | | | 140,386 | | | | 1,249 | | | | 141,635 | |
| | | | | | | | | | | | | | | | | | | | | | | | | | | | | | | | | | | | | | | | | | | | | | | | |
Net movement in own shares | | | — | | | | — | | | | (5,679 | ) | | | — | | | | | | | | 32,410 | | | | — | | | | — | | | | — | | | | 26,731 | | | | — | | | | 26,731 | |
Other changes | | | — | | | | — | | | | (124 | ) | | | — | | | | | | | | — | | | | — | | | | — | | | | — | | | | (124 | ) | | | 44 | | | | (80 | ) |
Business combinations | | | — | | | | — | | | | — | | | | — | | | | | | | | — | | | | — | | | | — | | | | — | | | | 0 | | | | 9,876 | | | | 9,876 | |
Distribution of 2008 profit | | | | | | | | | | | | | | | | | | | | | | | | | | | | | | | | | | | | | | | | | | | | | | | | |
Reserves | | | — | | | | — | | | | 73,037 | | | | (73,037 | ) | | | — | | | | — | | | | — | | | | — | | | | — | | | | 0 | | | | — | | | | 0 | |
Dividends | | | — | | | | — | | | | — | | | | (48,691 | ) | | | — | | | | — | | | | — | | | | — | | | | — | | | | (48,691 | ) | | | (54 | ) | | | (48,745 | ) |
Interim dividend | | | — | | | | — | | | | — | | | | — | | | | (31,960 | ) | | | — | | | | — | | | | — | | | | — | | | | (31,960 | ) | | | (208 | ) | | | (32,168 | ) |
| | | | | | | | | | | | | | | | | | | | | | | | | | | | | | | | | | | | | | | | | | | | | | | | |
Transaction with owners of the Company | | | 0 | | | | 0 | | | | 67,235 | | | | (121,728 | ) | | | (31,960 | ) | | | 32,410 | | | | 0 | | | | 0 | | | | 0 | | | | (54,044 | ) | | | 9,658 | | | | (44,386 | ) |
| | | | | | | | | | | | | | | | | | | | | | | | | | | | | | | | | | | | | | | | | | | | | | | | |
Balance at 31 December 2009 | | | 106,532 | | | | 121,802 | | | | 314,903 | | | | 147,972 | | | | (31,960 | ) | | | (677 | ) | | | (90,253 | ) | | | (1,948 | ) | | | 0 | | | | 566,371 | | | | 12,157 | | | | 578,528 | |
| | | | | | | | | | | | | | | | | | | | | | | | | | | | | | | | | | | | | | | | | | | | | | | | |
Translation differences | | | 0 | | | | 0 | | | | 0 | | | | 0 | | | | 0 | | | | 0 | | | | 39,520 | | | | 0 | | | | 0 | | | | 39,520 | | | | 2,705 | | | | 42,225 | |
Cash flow hedges | | | 0 | | | | 0 | | | | 0 | | | | 0 | | | | 0 | | | | 0 | | | | 0 | | | | 197 | | | | 0 | | | | 197 | | | | 0 | | | | 197 | |
| | | | | | | | | | | | | | | | | | | | | | | | | | | | | | | | | | | | | | | | | | | | | | | | |
Other comprehensive income for the year | | | 0 | | | | 0 | | | | 0 | | | | 0 | | | | 0 | | | | 0 | | | | 39,520 | | | | 197 | | | | 0 | | | | 39,717 | | | | 2,705 | | | | 42,422 | |
Profit/(loss) for the year | | | 0 | | | | 0 | | | | 0 | | | | 115,513 | | | | 0 | | | | 0 | | | | 0 | | | | 0 | | | | 0 | | | | 115,513 | | | | (246 | ) | | | 115,267 | |
| | | | | | | | | | | | | | | | | | | | | | | | | | | | | | | | | | | | | | | | | | | | | | | | |
Total comprehensive income for the year | | | 0 | | | | 0 | | | | 0 | | | | 115,513 | | | | 0 | | | | 0 | | | | 39,520 | | | | 197 | | | | 0 | | | | 155,230 | | | | 2,459 | | | | 157,689 | |
| | | | | | | | | | | | | | | | | | | | | | | | | | | | | | | | | | | | | | | | | | | | | | | | |
Net movement in own shares | | | — | | | | — | | | | — | | | | — | | | | — | | | | (1,250 | ) | | | — | | | | — | | | | — | | | | (1,250 | ) | | | — | | | | (1,250 | ) |
Other changes | | | — | | | | — | | | | (82 | ) | | | — | | | | — | | | | — | | | | — | | | | — | | | | — | | | | (82 | ) | | | (213 | ) | | | (295 | ) |
Distribution of 2009 profit | | | | | | | | | | | | | | | | | | | | | | | | | | | | | | | | | | | | | | | | | | | | | | | | |
Reserves | | | — | | | | — | | | | 88,783 | | | | (88,783 | ) | | | — | | | | — | | | | — | | | | — | | | | — | | | | 0 | | | | — | | | | 0 | |
Dividends | | | — | | | | — | | | | — | | | | (27,229 | ) | | | — | | | | — | | | | — | | | | — | | | | — | | | | (27,229 | ) | | | (53 | ) | | | (27,282 | ) |
Interim dividend | | | — | | | | — | | | | — | | | | (31,960 | ) | | | 31,960 | | | | — | | | | — | | | | — | | | | — | | | | 0 | | | | — | | | | 0 | |
| | | | | | | | | | | | | | | | | | | | | | | | | | | | | | | | | | | | | | | | | | | | | | | | |
Transaction with owners of the Company | | | 0 | | | | 0 | | | | 88,701 | | | | (147,972 | ) | | | 31,960 | | | | (1,250 | ) | | | 0 | | | | 0 | | | | 0 | | | | (28,561 | ) | | | (266 | ) | | | (28,827 | ) |
| | | | | | | | | | | | | | | | | | | | | | | | | | | | | | | | | | | | | | | | | | | | | | | | |
Balance at 31 December 2010 | | | 106,532 | | | | 121,802 | | | | 403,604 | | | | 115,513 | | | | 0 | | | | (1,927 | ) | | | (50,733 | ) | | | (1,751 | ) | | | 0 | | | | 693,040 | | | | 14,350 | | | | 707,390 | |
| | | | | | | | | | | | | | | | | | | | | | | | | | | | | | | | | | | | | | | | | | | | | | | | |
Translation differences | | | — | | | | — | | | | — | | | | — | | | | — | | | | — | | | | 109,533 | | | | — | | | | — | | | | 109,533 | | | | 74 | | | | 109,607 | |
Cash flow hedges | | | — | | | | — | | | | — | | | | — | | | | — | | | | — | | | | — | | | | (19,433 | ) | | | — | | | | (19,433 | ) | | | — | | | | (19,433 | ) |
| | | | | | | | | | | | | | | | | | | | | | | | | | | | | | | | | | | | | | | | | | | | | | | | |
Other comprehensive income for the year | | | 0 | | | | 0 | | | | 0 | | | | 0 | | | | 0 | | | | 0 | | | | 109,533 | | | | (19,433 | ) | | | 0 | | | | 90,100 | | | | 74 | | | | 90,174 | |
Profit/(loss) for the year | | | — | | | | — | | | | — | | | | 50,307 | | | | — | | | | — | | | | — | | | | — | | | | — | | | | 50,307 | | | | (79 | ) | | | 50,228 | |
| | | | | | | | | | | | | | | | | | | | | | | | | | | | | | | | | | | | | | | | | | | | | | | | |
Total comprehensive income for the year | | | 0 | | | | 0 | | | | 0 | | | | 50,307 | | | | 0 | | | | 0 | | | | 109,533 | | | | (19,433 | ) | | | 0 | | | | 140,407 | | | | (5 | ) | | | 140,402 | |
| | | | | | | | | | | | | | | | | | | | | | | | | | | | | | | | | | | | | | | | | | | | | | | | |
Capital increase June 2011 (note 17 (a)) | | | 8,382 | | | | 768,553 | | | | (2,514 | ) | | | — | | | | — | | | | — | | | | — | | | | — | | | | — | | | | 774,421 | | | | — | | | | 774,421 | |
Capital increase December 2011 (note 17 (a)) | | | 2,968 | | | | | | | | (3,325 | ) | | | — | | | | — | | | | — | | | | — | | | | — | | | | — | | | | (357 | ) | | | — | | | | (357 | ) |
Other movements (note 17) | | | — | | | | — | | | | 52,828 | | | | — | | | | — | | | | — | | | | — | | | | — | | | | — | | | | 52,828 | | | | (213 | ) | | | 52,615 | |
Acquisition of Non-controlling interest (note 3) | | | — | | | | — | | | | 2,168 | | | | — | | | | — | | | | — | | | | — | | | | — | | | | — | | | | 2,168 | | | | (11,645 | ) | | | (9,477 | ) |
Distribution of 2010 profit | | | | | | | | | | | | | | | | | | | | | | | | | | | | | | | | | | | | | | | | | | | | | | | | |
Reserves | | | — | | | | — | | | | 115,513 | | | | (115,513 | ) | | | — | | | | — | | | | — | | | | — | | | | — | | | | 0 | | | | — | | | | 0 | |
| | | | | | | | | | | | | | | | | | | | | | | | | | | | | | | | | | | | | | | | | | | | | | | | |
Transaction with owners of the Company | | | 11,350 | | | | 768,553 | | | | 164,670 | | | | (115,513 | ) | | | 0 | | | | 0 | | | | 0 | | | | 0 | | | | 0 | | | | 829,060 | | | | (11,858 | ) | | | 817,202 | |
| | | | | | | | | | | | | | | | | | | | | | | | | | | | | | | | | | | | | | | | | | | | | | | | |
Balance at 31 December 2011 | | | 117,882 | | | | 890,355 | | | | 568,274 | | | | 50,307 | | | | 0 | | | | (1,927 | ) | | | 58,800 | | | | (21,184 | ) | | | 0 | | | | 1,662,507 | | | | 2,487 | | | | 1,664,994 | |
| | | | | | | | | | | | | | | | | | | | | | | | | | | | | | | | | | | | | | | | | | | | | | | | |
| * | Reserves include accumulated earnings, legal reserves and other reserves |
The accompanying notes form an integral part of the consolidated fnancial statements
F-7
GRIFOLS, S.A. AND SUBSIDIARIES
Notes to Consolidated Financial Statements
| (1) | Nature, Principal Activities and Subsidiaries |
Grifols, S.A. (hereinafter the Company) was incorporated with limited liability under Spanish law on 22 June 1987. Its registered and tax offices are in Barcelona. The Company’s statutory activity consists of providing corporate and business administrative, management and control services, as well as investing in assets and property. The Company’s principal activity consists of rendering administrative, management and control services to its subsidiaries.
On 17 May 2006 the Company completed its flotation on the Spanish stock market which was conducted through the public offering of 71,000,000 ordinary shares of Euros 0.50 par value each and a share premium of Euros 3.90 per share. The total capital increase (including the share premium) amounted to Euros 312.4 million, equivalent to a price of Euros 4.40 per share.
The Company’s shares were floated on the Spanish stock exchange IBEX-35 index on 2 January 2008.
At the extraordinary general shareholders’ meetings held on 25 January 2011 and 2 December 2011, the shareholders of Grifols agreed to increase share capital by issuing 83,811,688 new shares without voting rights (Class B shares) to complete the acquisition of Talecris Biotherapeutics Holdings Corp. (see note 3) and 29,687,658 new shares without voting rights to remunerate the shareholders (see note 17).
All of the Company’s shares are listed on the Barcelona, Madrid, Valencia and Bilbao stock exchanges and on the electronic stock market. On 2 June 2011, Class B shares with no voting rights were listed on the NASDAQ (USA) and on the Spanish Automated Quotation System (SIBE/Continuous Market) (see note 17).
In November 2011 the Company registered its High Yield Senior Unsecured Notes with the Securities Exchange Commission (SEC) on Form F4 (see note 22).
Grifols, S.A. is the parent company of the subsidiaries listed in section 1(b) of this note to the consolidated financial statements.
Grifols, S.A. and subsidiaries (hereinafter the Group) act on an integrated basis and under common management and their principal activity is the procurement, manufacture, preparation and sale of therapeutic products, especially haemoderivatives.
The main factory locations of the Group’s Spanish companies are in Barcelona, Parets del Vallès (Barcelona) and Torres de Cotilla (Murcia), while the US companies are located in Los Angeles, (California, USA), Clayton (North Carolina, USA) and Melville (New York, USA).
The Group companies are grouped into three areas: industrial, commercial and services.
The following companies are included:
Diagnostic Grifols, S.A. which has registered offices in Parets del Vallès (Barcelona), Spain and was incorporated into the Group on 24 March 1987, and is engaged in the development and manufacture of diagnostic equipment, instrumentation and reagents.
Instituto Grifols, S.A. which has registered offices in Parets del Vallès (Barcelona), Spain, and was incorporated into the Group on 21 September 1987, carries out its activities in the area of bioscience and is engaged in plasma fractioning and the manufacture of haemoderivative pharmaceutical products.
Laboratorios Grifols, S.A., with registered offices in Parets del Vallès (Barcelona), Spain, was incorporated into the Group on 18 April 1989 and is engaged in the production of glass- and plastic-packaged parenteral solutions, parenteral and enteral nutrition products and blood extraction equipment and bags. Its production facilities are in Barcelona and Murcia.
F-8
GRIFOLS, S.A. AND SUBSIDIARIES
Notes to Consolidated Financial Statements
Biomat, S.A. with registered offices in Parets del Vallès (Barcelona), Spain, was incorporated into the Group on 30 July 1991. It operates in the field of bioscience and basically engages in analysis and certification of the quality of plasma used by Instituto Grifols, S.A. It also provides transfusion centres with plasma virus inactivation services.
Grifols Engineering, S.A., with registered offices in Parets del Vallès (Barcelona), Spain, was incorporated into the Group on 14 December 2000 and is engaged in the design and development of the Group’s manufacturing installations and part of the equipment and machinery used at these premises. The company also renders engineering services to external companies.
Logister, S.A. was incorporated with limited liability under Spanish law on 22 June 1987 and its registered offices are at Polígono Levante, calle Can Guasch, s/n, 08150 Parets del Vallès, Barcelona. Its activity comprises the manufacture, sale and purchase, marketing and distribution of all types of computer products and materials. 99.985% of this company is solely-owned directly by Movaco, S.A.
Biomat USA, Inc., with registered offices at 2410 Lillyvale Avenue, Los Angeles, California, USA, was incorporated into the Group on 1 March 2002 and carries out its activities in the area of bioscience, procuring human plasma.
Grifols Biologicals, Inc., with registered offices in 5555 Valley Boulevard, Los Ángeles, California USA, was incorporated into the Group on 15 May 2003 and is exclusively engaged in plasma fractioning and the production of haemoderivatives.
PlasmaCare, Inc. with registered offices in Suite 300, 1128 Main Street, Cincinnati, Ohio USA, was incorporated into the Group on 3 February 2006 and carries out its activities in the area of bioscience, procuring human plasma.
Grifols Australia Pty Ltd. (formerly Lateral Grifols Pty Ltd.), with registered offices at Unit 5/80 Fairbank, Clayton South, Victoria 3149 (Australia), was incorporated into the Group on 3 March 2009. Its activity consists of the distribution of pharmaceutical products and the development and manufacture of reagents for diagnostics.
Medion Grifols Diagnostic AG, with registered offices at Bonnstrasse, 9, 3186 Düdingen, Switzerland, was incorporated into the Group on 3 March 2009. The Company’s statutory activity consists of development and production in the biotechnology and diagnostic sectors.
Grifols Therapeutics, Inc. (formerly Talecris Biotherapeutics Inc.)with registered offices at 4101 Research Commons (Principal Address), 79 T.W. Alexander Drive, Research Triangle Park, NC 27709 USA, was incorporated into the Group on 2 June 2011. The Company’s statutory activity consists of plasma fractioning and the production of haemoderivatives.
Talecris Plasma Resources, Inc. with registered offices at 4101 Research Commons (Principal Address), 79 T.W. Alexander Drive, Research Triangle Park, NC 27709 USA, was incorporated into the Group on 2 June 2011. The Company’s statutory activity consists of human plasma collection.
The companies responsible for the marketing and distribution of, mainly, products manufactured by the industrial area companies are all grouped in the commercial area.
Movaco, S.A. was incorporated with limited liability under Spanish law on 21 September 1987 and its registered offices are at Polígono Levante, calle Can Guasch, s/n, 08150 Parets del Vallès, Barcelona. Its principal activity is the distribution and sale of reagents, chemical products and other pharmaceutical specialities, and of medical-surgical materials, equipment and instruments for use in laboratories and healthcare centres.
Grifols International, S.A., with registered offices in Polígono Levante, calle Can Guasch, s/n, 08150 Parets del Vallès, Barcelona, Spain, was incorporated into the Group on 4 June 1997. This company directs and coordinates the marketing, sales and logistics for all the Group’s commercial subsidiaries. Products are marketed through subsidiaries operating in different countries. These subsidiaries, their registered offices and date of incorporation into the Group, are listed below.
F-9
GRIFOLS, S.A. AND SUBSIDIARIES
Notes to Consolidated Financial Statements
Grifols Portugal Productos Farmacéuticos e Hospitalares, Lda.,was incorporated with limited liability under Portuguese law on 10 August 1988. Its registered offices are at Rua de Sao Sebastiao, 2, Zona Industrial Cabra Figa, 2635-448 – Rio de Mouro Portugal, and it imports, exports and markets pharmaceutical and hospital equipment and products particularly Grifols products.
Grifols Chile, S.A. was incorporated under limited liability in Chile on 2 July 1990. Its registered offices are at calle Avda. Americo Vespucio 2242, Comuna de Conchali, Santiago de Chile (Chile). Its statutory activity comprises the development of pharmaceutical businesses, which can involve the import, production, marketing and export of related products.
Grifols Argentina, S.A. was incorporated with limited liability in Argentina on 1 November 1991 and its registered offices are at Bartolomé Mitre 3690/3790, 1605 Munro - Partido de Vicente Lopez, Buenos Aires (Argentina). Its statutory activity consists of clinical and biological research, the preparation of reagents and therapeutic and diet products, the manufacture of other pharmaceutical specialities and the marketing thereof.
Grifols s.r.o. was incorporated with limited liability under Czech Republic law on 15 December 1992. Its registered offices are at Zitná 2, Praga (Czech Republic) and its statutory activity consists of the purchase, sale and distribution of chemical-pharmaceutical products, including human plasma.
Logistica Grifols, S.A. de C.V was incorporated with limited liability under Mexican law on 9 January 1970, with registered offices at calle Eugenio Cuzin nº 909-913, Parque Industrial Belenes Norte, 45150 Zapopán, Jalisco (Mexico). Its statutory activity comprises the manufacture and marketing of pharmaceutical products for human and veterinary use. On 6 May 2008 Grifols Mexico S.A. de C.V. was spun off into two companies and its name was changed to Logística Grifols S.A. de C.V.
Grifols México, S.A. de C.V. was incorporated with limited liability under Mexican law on 6 May 2008, as a result of the spin-off of the former company Grifols Mexico S.A. de C.V. Its registered offices are at calle Eugenio Cuzin nº 909-913, Parque Industrial Belenes Norte, 45150 Zapopán, Jalisco (Mexico). Its statutory activity comprises the production, manufacture, adaptation, conditioning, sale and purchase, commissioning, representation and consignment of all kinds of pharmaceutical products and the acquisition of machinery, equipment, raw materials, tools, assets and property for the aforementioned purposes.
Grifols USA, LLC was incorporated in the State of Florida (USA) on 19 April 1990. Its registered offices are at 2410 Lillyvale Avenue, Los Ángeles, California (USA) and its statutory activity is the distribution and marketing of company products.
Grifols Italia S.p.A. has its registered offices at Via Carducci 62 d, 56010 Ghezzano, Pisa (Italy) and its statutory activity comprises the purchase, sale and distribution of chemical-pharmaceutical products. 66.66% of this company was acquired on 9 June 1997 and the remaining 33.34% on 16 June 2000.
Grifols UK Ltd., the registered offices of which are at Byron House Cambridge Business Park, Cowley Road, Cambridge CB4 0WZ (United Kingdom), is engaged in the distribution and sale of therapeutic and other pharmaceutical products, especially haemoderivatives. 66.66% of this company was acquired on 9 June 1997 and the remaining 33.34% on 16 June 2000.
Grifols Deutschland GmbH (formerly Talecris Biotherapeutics GmbH)with registered offices at Lyoner Strasse 15, 60528 Frankfurt am was incorporated into the Group on 2 June 2011. The Company’s statutory activity consists of obtaining the official permits and necessary approval for the production, marketing and distribution of products deriving from blood plasma. It also engages in the import, export, distribution and sale of reagents and chemical and pharmaceutical products, especially for laboratories and health centres and surgical medical material, apparatus and instruments. On 15 September 2011 this Company acquired Grifols Deutschland GmbH through a merger, with registered offices at Siemensstrasse 32, D-63225 Langen (Germany).
Grifols Brasil, Ltda. was incorporated with limited liability in Brazil on 4 May 1998. Its registered offices are at Rúa Umuarama, 263 - Vila Perneta, Pinhais-Paramá CEP 83325-000, Condominio Portal Da Serra (Brazil). Its statutory activity consists of the import and export, preparation, distribution and sale of pharmaceutical and chemical products for laboratory and hospital use, and medical-surgical equipment and instrumentation.
F-10
GRIFOLS, S.A. AND SUBSIDIARIES
Notes to Consolidated Financial Statements
Grifols France, S.A.R.L. was incorporated with limited liability under French law on 4 November 1999, with registered offices at Arteparc, Bât. D, Route de la Côte d’Azur, 13590 – Meyreuil (France). Its statutory activity is the marketing of chemical and healthcare products.
Alpha Therapeutic Italia, S.p.A. was incorporated on 3 July 2000, with registered offices at Corso Di Porta Vittoria, 9, 20122, Milan (Italy), and engages in the distribution and sale of therapeutic products, especially haemoderivatives.
Grifols Asia Pacific Pte, Ltd was incorporated on 10 September 1986, with registered offices at 501 Orchard Road # nr.20-01, 238880 Wheelock Place, Singapore, and its activity consists of the distribution and sale of medical and pharmaceutical products.
Grifols Malaysia Sdn Bhd is partly owned (30%) by Grifols Asia Pacific Pte, Ltd. The registered offices of this company are in Suite 1107, Menara Amcorp, Amcorp Trade Center, No.18, Jalan Persiaran Barat, 46050-Petaling Jaya, Selangor Darul Ehsan, Selangor (Malaysia) and it engages in the distribution and sale of pharmaceutical products.
Grifols (Thailand) Ltd was incorporated on 1 September 1995 and its registered offices are at 191 Silom Complex Building, 21st Floor, Silom Road, Silom, Bangrak, Bangkok-10500 (Bangkok). Its activity comprises the import, export and distribution of pharmaceutical products. 48% of this company is directly owned by Grifols Asia Pacific Pte., Ltd.
Grifols Polska Sp.z.o.o.was incorporated on 12 December 2003, with registered offices at UL. Nowogrodzka, 68, apt. 02-014, Warsaw, Poland, and engages in the distribution and sale of pharmaceutical, cosmetic and other products.
Australian Corporate Number 073 272 830 Pty Ltd.(formerly Lateral Grifols Diagnostics Pty Ltd.), with registered offices at Unit 5/80 Fairbank, Clayton South, Victoria 3149 (Australia) was incorporated into the Group on 3 March 2009. Its activity comprises the distribution of pharmaceutical products and reagents for diagnostics.
Medion Diagnostics GmbH with registered offices at Lochhamer Schlag 12 D-82166 Gräfelfing (Germany), was incorporated into the Group on 3 March 2009. The Company’s statutory activity consists of the distribution and sale of biotechnological and diagnostic products.
Grifols Nordic, AB (formerly Xepol, AB) with registered offices in Engelbrekts Kyrkogata 7B, SE 114 26 Stockhom, Sweden, was incorporated into the Group on 3 June 2010. Its activity consists of research and development, production and marketing, either directly or through subsidiaries, of pharmaceutical products, medical devices and any other asset deriving from the aforementioned activities.
Grifols Colombia, Ltda, with registered offices at Cra 7 71-52 TBP 9 Cundinamarca, Bogota, Colombia, was incorporated on 3 June 2010. Its activity consists of the sale, commercialisation and distribution of medicines, pharmaceutical (including but not limited to haemoderivatives) and hospital products, medical devices, biomedical equipment, laboratory instruments and reactives for diagnosis and/or sanitary software.
Grifols Canada, Ltd. (formerly Talecris Biotherapeutics, Ltd.)with registered offices at 5800 Explorer Drive, Suite 300, Mississauga, Ontario L4W 5K9, (Canada) was incorporated into the Group on 2 June 2011. The Company’s statutory activity consists of providing various services (marketing) to Grifols Therapeutics Inc.
The following companies are included in this area:
Grifols Inc. (formerly Talecris Biotherapeutics Holdings Corp)with registered offices at 2410 Lillyvale Avenue, Los Ángeles, California. (USA). Talecris Biotherapeutics Holdings Corp. was the holding company of the Talecris Group that was acquired in June 2011 (see note 3). This company acquired Grifols Inc. through a reverse merger and changed its name to the current one. Its principal activity is the acquisition, manufacture and sale of therapeutic products, especially haemoderivatives extracted by plasma fractioning through a network of donation centres owned by the Group in the USA.
F-11
GRIFOLS, S.A. AND SUBSIDIARIES
Notes to Consolidated Financial Statements
Grifols Viajes, S.A., with registered offices in Avenida de la Generalitat 152, Sant Cugat del Vallès, Barcelona (Spain) was incorporated into the Group on 31 March 1995 and operates as a retail travel agency exclusively serving Group companies.
Squadron Reinsurance Ltd., with registered offices in The Third Floor, The Metropolitan Building, James Joyce Street, Dublin (Ireland) was incorporated into the Group on 25 April 2003 and engages in the reinsurance of Group companies’ insurance policies.
Arrahona Optimus, S.L., with registered offices in Avenida de la Generalitat 152, Sant Cugat del Vallès, Barcelona, Spain, was incorporated into the Group on 28 August 2008. The Company’s statutory activity is the development and construction of offices and business premises. During 2011 the Company sold its office complex located in the municipality of Sant Cugat del Vallès.
Gri-Cel, S.A., with registered offices at Avenida de la Generalitat 152, Sant Cugat del Vallès (Barcelona), was incorporated on 9 November 2009. The Company’s statutory activity consists of research and development in the field of regenerative medicine, awarding of research grants, subscription to collaboration agreements with entities and participation in projects in the area of regenerative medicine.
Saturn Australia Pty Ltd. with registered offices at Unit 5/80 Fairbank, Clayton South, Victoria 3169 (Australia), was incorporated to the Group on 3 March 2009. Its activity consists of holding shares and real estate investments.
Saturn Investments AG with registered offices at c/o Dr. Christoph Straub, Hanibuel 8, CH 6300 Zug (Switzerland) was incorporated into the Group on 3 March 2009. Its activity consists of the holding of shares.
Woolloomooloo Holdings Pty Ltd. with registered offices at Unit 5/80 Fairbank, Clayton South, Victoria 3169 (Australia), was incorporated into the Group on 3 March 2009. Its activity consists of holding shares.
Talecris Biotherapeutics Overseas Services, Corp.with registered offices at 4101 Research Commons, 79 T. W. Alexander Drive. Research Triangle Park, NC 27709 was incorporated into the Group on 2 June 2011. The Company’s statutory activity consists of providing support services for the sale of biotherapeutic products outside the USA and participating in any other activity for which the companies may be organised in accordance with the General Corporation Law of Delware.
Quest Internacional, Inc, 35% owned by Diagnostic Grifols, S.A., with registered offices in Miami, Florida (USA), engages in the manufacture and marketing of reagents and clinical analysis instruments. On 9 November 2010 the Group sold the interest it held in this company.
UTE Salas Blancas, 50% owned by Grifols Engineering, S.A. was incorporated in 2009. This joint venture (UTE) is domiciled at calle Mas Casanovas 46, Barcelona. Its statutory activity consists of the drafting of the project, execution of works and equipping of clean rooms and other facilities in the Banc de Sang i Teixits (blood and tissue bank) building.
Nanotherapix, S.L. was incorporated on 25 June 2009 and is 51% owned by Gri-Cel, S.A through a share capital increase carried out on 9 March 2010. This company is domiciled at Avenida Generalitat 152, San Cugat del Valles, Barcelona and its activity consists of the development, validation and production of the technology required to implement the use of genetic and cellular therapy for the treatment of human and animal pathologies.
The accompanying consolidated financial statements have been authorised for issue by the directors of Grifols, S.A. on the basis of the accounting records of Grifols, S.A. and of the Group companies. The accompanying consolidated financial statements for 2011, 2010 and 2009 have been prepared under International Financial Reporting Standards, as issued by the International Accounting Standard Board (IFRS-IASB) to present fairly the consolidated equity and consolidated financial position of Grifols, S.A. and subsidiaries at 31 December 2011 and 2010, as well as the consolidated results from their operations, consolidated comprehensive income, consolidated cash flows and changes in consolidated equity for the three-year period then ended.
F-12
GRIFOLS, S.A. AND SUBSIDIARIES
Notes to Consolidated Financial Statements
The Group adopted EU-IFRS for the first time on 1 January 2004 and has been preparing its consolidated annual accounts under International Financial Reporting Standards, as adopted by the European Union (IFRS-EU) as required by Capital markets regulations governing the presentation of financial statements by companies whose debt or own equity instruments are listed on a regulated market.
The Group’s consolidated financial statements for 2011, 2010 and 2009 have been prepared under International Financial Reporting Standards (IFRS) as issued by the International Accounting Standard Board, and in the case of Grifols, S.A. and subsidiaries do not differ from IFRS as adopted by the European Union taking into account all mandatory accounting policies and rules and measurement bases with material effect, as well as the alternative treatments permitted by the relevant standards in this connection.
| | (a) | Comparison of information |
As explained in note 3, the Grifols Group acquired the Talecris Group, effective on 2 June 2011. The information for the year ended 31 December 2011 therefore includes twelve months’ activity of the Grifols companies and seven months’ activity of the Talecris companies whilst the information for the year ended 31 December 2010 includes twelve months’ activity of the Grifols companies only.
Consequently, for presentation purposes, the Group has disclosed transaction costs relating to the acquisition of Talecris in the consolidated income statement for 2011 and 2010. Of the Euros 16,999 thousand classified as transaction costs for the acquisition of Talecris, at 31 December 2010 Euros 2,041 thousand was recognised under supplies and Euros 14,958 thousand under other operating expenses.
| | (b) | Relevant accounting estimates, assumptions and judgements used when applying accounting principles |
The preparation of consolidated financial statements in conformity with IFRS requires management to make judgments, estimates and assumptions that affect the application of Group accounting policies. A summary of the items requiring a greater degree of judgement or complexity, or where the assumptions and estimates made are significant to the preparation of the consolidated financial statements, are as follows:
| | • | | The assumptions used for calculation of the fair value of financial instruments (see note 4 (k)). |
| | • | | The assumptions used to test non-current assets and goodwill for impairment (see notes 4(i) and 7). |
| | • | | Useful lives of property, plant and equipment and intangible assets (see notes 4(g) and 4(h)). |
| | • | | Evaluation of the capitalisation of development costs (see note 4(h)). |
| | • | | Evaluation of provisions and contingencies (see note 4(r)). |
| | • | | Evaluation of the recoverability of receivables from public entities (see note 5 and 32). |
| | • | | Evaluation of the effectiveness of hedging derivatives (see note 17 (f)). |
| | • | | Evaluation of the nature of leases (operating or finance) (see note 4(j) and note 9). |
| | • | | Assumptions used to determine the fair value of assets, liabilities and contingent liabilities related to the Talecris business combination (see note 3). |
| | • | | Evaluation of the recoverability of tax credits (note 29). |
F-13
GRIFOLS, S.A. AND SUBSIDIARIES
Notes to Consolidated Financial Statements
The percentages of direct or indirect ownership of subsidiaries by the Company at 31 December 2011, 2010 and 2009, as well as the consolidation method used in each case for preparation of the accompanying consolidated financial statements, are detailed below:
| | | | | | | | | | | | | | | | | | | | | | | | |
| | | 31/12/2011 | | | 31/12/2010 | | | 31/12/2009 | |
| | | Percentage | | | Percentage | | | Percentage | |
| | | Direct | | | Indirect | | | Direct | | | Indirect | | | Direct | | | Indirect | |
Parent | | | | | | | | | | | | | | | | | | | | | | | | |
Grifols. S.A. | | | | | | | | | | | | | | | | | | | | | | | | |
Fully-consolidated companies | | | | | | | | | | | | | | | | | | | | | | | | |
Laboratorios Grifols. S.A. | | | 99.998 | | | | 0.002 | | | | 99.998 | | | | 0.002 | | | | 99.998 | | | | 0.002 | |
Instituto Grifols. S.A. | | | 99.998 | | | | 0.002 | | | | 99.998 | | | | 0.002 | | | | 99.998 | | | | 0.002 | |
Movaco. S.A. | | | 99.999 | | | | 0.001 | | | | 99.999 | | | | 0.001 | | | | 99.999 | | | | 0.001 | |
Grifols Portugal Productos Farmacéuticos e Hospitalares. Lda. | | | 0.010 | | | | 99.990 | | | | 0.010 | | | | 99.990 | | | | 0.015 | | | | 99.985 | |
Diagnostic Grifols. S.A. | | | 99.998 | | | | 0.002 | | | | 99.998 | | | | 0.002 | | | | 99.998 | | | | 0.002 | |
Logister.S.A. | | | — | | | | 100.000 | | | | — | | | | 100.000 | | | | — | | | | 100.000 | |
Grifols Chile.S.A. | | | 99.000 | | | | — | | | | 99.000 | | | | — | | | | 99.000 | | | | — | |
Biomat.S.A. | | | 99.900 | | | | 0.100 | | | | 99.900 | | | | 0.100 | | | | 99.900 | | | | 0.100 | |
Grifols Argentina.S.A. | | | 99.260 | | | | 0.740 | | | | 99.260 | | | | 0.740 | | | | 100.000 | | | | — | |
Grifols.s.r.o. | | | 100.000 | | | | — | | | | 100.000 | | | | — | | | | 100.000 | | | | — | |
Logistica Grifols S.A de C.V | | | 99.990 | | | | 0.010 | | | | 99.990 | | | | 0.010 | | | | 100.000 | | | | — | |
Grifols México.S.A. de C.V. | | | 99.990 | | | | 0.010 | | | | 99.990 | | | | 0.010 | | | | 100.000 | | | | — | |
Grifols Viajes.S.A. | | | 99.900 | | | | 0.100 | | | | 99.900 | | | | 0.100 | | | | 99.900 | | | | 0.100 | |
Grifols USA. LLC. | | | — | | | | 100.000 | | | | — | | | | 100.000 | | | | — | | | | 100.000 | |
Grifols International.S.A. | | | 99.900 | | | | 0.100 | | | | 99.900 | | | | 0.100 | | | | 99.900 | | | | 0.100 | |
Grifols Italia.S.p.A. | | | 100.000 | | | | — | | | | 100.000 | | | | — | | | | 100.000 | | | | — | |
Grifols UK.Ltd. | | | 100.000 | | | | — | | | | 100.000 | | | | — | | | | 100.000 | | | | — | |
Grifols Deutschland.GmbH (merged with Talecris Biotherapeutics, GmbH) | | | 100.000 | | | | — | | | | 100.000 | | | | — | | | | 100.000 | | | | — | |
Grifols Brasil.Ltda. | | | 100.000 | | | | — | | | | 100.000 | | | | — | | | | 100.000 | | | | — | |
Grifols France.S.A.R.L. | | | 99.000 | | | | 1.000 | | | | 99.000 | | | | 1.000 | | | | 99.000 | | | | 1.000 | |
Grifols Engineering. S.A. | | | 99.950 | | | | 0.050 | | | | 99.950 | | | | 0.050 | | | | 99.950 | | | | 0.050 | |
Biomat USA. Inc. | | | — | | | | 100.000 | | | | — | | | | 100.000 | | | | — | | | | 100.000 | |
Squadron Reinsurance Ltd. | | | 100.000 | | | | — | | | | 100.000 | | | | — | | | | 100.000 | | | | — | |
Grifols Inc. (merged with Talecris Biotherapeutics Holdings Corp.) | | | 100.000 | | | | — | | | | 100.000 | | | | — | | | | 100.000 | | | | — | |
Grifols Biologicals Inc. | | | — | | | | 100.000 | | | | — | | | | 100.000 | | | | — | | | | 100.000 | |
Alpha Therapeutic Italia. S.p.A. | | | 100.000 | | | | — | | | | 100.000 | | | | — | | | | 100.000 | | | | — | |
Grifols Asia Pacific Pte.. Ltd. | | | 100.000 | | | | — | | | | 100.000 | | | | — | | | | 100.000 | | | | — | |
Grifols Malaysia Sdn Bhd | | | — | | | | 30.000 | | | | — | | | | 30.000 | | | | — | | | | 30.000 | |
Grifols (Thailand) Ltd. | | | — | | | | 48.000 | | | | — | | | | 48.000 | | | | — | | | | 48.000 | |
Grifols Polska Sp.z.o.o. | | | 100.000 | | | | — | | | | 100.000 | | | | — | | | | 100.000 | | | | — | |
Plasmacare. Inc. | | | — | | | | 100.000 | | | | — | | | | 100.000 | | | | — | | | | 100.000 | |
Plasma Collection Centers. Inc. | | | — | | | | — | | | | — | | | | — | | | | — | | | | 100.000 | |
Arrahona Optimus S.L. | | | 99.995 | | | | 0.005 | | | | 99.995 | | | | 0.005 | | | | 100.000 | | | | — | |
F-14
GRIFOLS, S.A. AND SUBSIDIARIES
Notes to Consolidated Financial Statements
| | | | | | | | | | | | | | | | | | | | | | | | |
| | | 31/12/2011 | | | 31/12/2010 | | | 31/12/2009 | |
| | | Percentage | | | Percentage | | | Percentage | |
| | | Direct | | | Indirect | | | Direct | | | Indirect | | | Direct | | | Indirect | |
Woolloomooloo Holdings Pty Ltd. | | | 100.000 | | | | — | | | | 49.000 | | | | — | | | | 49.000 | | | | — | |
Grifols Australia Pty Ltd (formerly Lateral Diagnostics Pty Ltd). | | | — | | | | 100.000 | | | | — | | | | 49.000 | | | | — | | | | 49.000 | |
Australian Corporate Number 073 272 830 Pty Ltd (formerly Lateral Grifols Diagnostics). | | | — | | | | 100.000 | | | | — | | | | 49.000 | | | | — | | | | 49.000 | |
Saturn Australia Pty Ltd. | | | — | | | | 100.000 | | | | — | | | | 49.000 | | | | — | | | | 49.000 | |
Saturn Investments AG | | | — | | | | 100.000 | | | | — | | | | 49.000 | | | | — | | | | 49.000 | |
Medion Grifols Diagnostic AG | | | — | | | | 80.000 | | | | — | | | | 39.200 | | | | — | | | | 39.200 | |
Medion Diagnostics GmbH | | | — | | | | 80.000 | | | | — | | | | 39.200 | | | | — | | | | 39.200 | |
Gri-Cel. S.A. | | | 0.001 | | | | 99.999 | | | | 0.001 | | | | 99.999 | | | | 0.001 | | | | 99.999 | |
Grifols Colombia. Ltda. | | | 99.000 | | | | 1.000 | | | | 99.000 | | | | 1.000 | | | | — | | | | — | |
Grifols Nordic AB (formerly Xepol AB) | | | 100.000 | | | | — | | | | 100.000 | | | | — | | | | — | | | | — | |
Grifols Therapeutics, Inc. | | | — | | | | 100.000 | | | | — | | | | — | | | | — | | | | — | |
Talecris Plasma Resources, Inc. | | | — | | | | 100.000 | | | | — | | | | — | | | | — | | | | — | |
Grifols Canada, Ltd. | | | — | | | | 100.000 | | | | — | | | | — | | | | — | | | | — | |
Talecris Biotherapeutics Overseas Services, Corp. | | | — | | | | 100.000 | | | | — | | | | — | | | | — | | | | — | |
Companies accounted for using the equity method | | | | | | | | | | | | | | | | | | | | | | | | |
Quest International, Inc, | | | — | | | | — | | | | — | | | | — | | | | — | | | | 35.000 | |
Nanotherapix, S,L | | | — | | | | 51.000 | | | | — | | | | 51.000 | | | | — | | | | — | |
Subsidiaries in which the Company directly or indirectly owns the majority of equity or voting rights have been fully consolidated. Associates in which the Company owns between 20% and 50% of share capital and has no power to govern the financial or operating policies of these companies have been accounted for under the equity method.
Although the Group holds 30% of the shares with voting rights of Grifols Malaysia Sdn Bhd, it controls the majority of the profit-sharing and voting rights of Grifols Malaysia Sdn Bhd through a contract with the other shareholder and a pledge on its shares.
Grifols (Thailand) Ltd. has two classes of shares and it grants the majority of voting rights to the class of shares held by the Group.
On 9 March 2010 one of the Group companies acquired 51% of Nanotherapix, S.L., a technologically based company which engages in advisory services, training of researchers, design and development of technologies, services, know-how, molecules and products applied to biotechnology, biomedicine and pharmaceutical fields. The investment has been made through a share capital increase of Euros 1,474 thousand in 2010 and a financial contribution of Euros 1,472 thousand in 2011. Successive contributions will be made up to 2014. Due to the losses incurred by Nanotherapix, S.L., provision for part of the investment was recognised in 2010 and 2011. These contributions are dependent on certain shareholders of Nanotherapix, S.L. performing research advisory and management tasks for this company. The acquisition of Nanotherapix, S.L. has been treated as an equity-accounted joint venture, as the company’s strategic and operational decisions require shareholder approval and Grifols does not avail of the majority of the members of the board of directors.
On 3 June 2010 the Group acquired 100% of Xepol AB (now Grifols Nordic AB) which holds the intellectual property rights for the treatment of the post-polio syndrome which includes patents for the USA, Europe and Japan for a specific method of treatment for this syndrome using intravenous immunoglobulin (haemoderivative). The sum paid for this acquisition amounted to Euros 2,255 thousand. The assets acquired and liabilities settled do not constitute a business pursuant to the definition provided in IFRS 3 and, therefore, the transaction has been recognised as the acquisition of an intangible asset.
On 9 November 2010 the Group sold the 35% interest it held in the US company Quest International Inc. for a sale price of Euros 621 thousand.
On 2 June 2011, the Group acquired 100% of the share capital of the US company Talecris Biotherapeutics Holdings Corp. (hereinafter Talecris), which also specialises in the production of plasma-derived biological medicines, for a total of Euros 2,593 million (US Dollars 3,737 million) (see note 3(a)).
F-15
GRIFOLS, S.A. AND SUBSIDIARIES
Notes to Consolidated Financial Statements
In August 2011, the Group acquired the remaining 51% of the share capital of the holding company of the Australian-Swiss group Lateral-Medion, of which it had acquired 49% of the share capital and 100% of the voting rights on 3 March 2009 (see note 3(b)).
| | (d) | Changes to IFRS in 2011, 2010 and 2009 |
In accordance with IFRSs, the following should be noted in connection with the scope of application of IFRS and the preparation of these consolidated financial statements of the Group.
Effective date in 2009
| | i) | Standards effective as of 1 January 2009 that have required changes to accounting policies and presentation |
| | • | | IAS 1 Presentation of Financial Statements (revised 2007) (annual periods beginning on or after 1 January 2009). This standard modifies the requirements for presentation of the financial statements, introducing the statement of comprehensive income, which comprises income and other comprehensive income. Entities may also present two separate statements, an income statement showing profit or loss for the year and a statement of other comprehensive income presenting profit or loss for the year and other comprehensive income. When an entity changes an accounting policy retrospectively or makes a retrospective reclassification of items in its financial statements, it must also present a statement of financial position (balance sheet) as at the beginning of the earliest comparative period. |
| | • | | IFRS 8 Operating Segments (annual periods beginning on or after 1 January 2009). The impact of this standard mainly relates to the disclosure of financial information by segment (see note 6). |
| | • | | IAS 23 Borrowing Costs (revised 2007) (annual periods beginning on or after 1 January 2009). This is a change in accounting policy. The Group applies this standard to borrowing costs related to qualifying assets capitalised on or subsequent to the date this standard became effective. The standard eliminates the possibility of recognising these borrowing costs as an expense, stipulating that borrowing costs that are directly attributable to the acquisition, construction or production of a qualifying asset form part of the cost of that asset. Since 1 January 2009 the Group has capitalised interest (see note 28). |
| | • | | Amendments to IFRS 7: “Improving Disclosures about Financial Instruments” (applicable for years beginning on or after 1 January 2009). |
| | ii) | Standards effective as of 1 January 2009 that have not affected the Group |
| | • | | IFRIC 13 Customer Loyalty Programmes (annual periods beginning after 31 December 2008). |
| | • | | IFRS 2 Share-Based Payment: Modifications to vesting conditions and cancellations (applied retrospectively to annual periods beginning on or after 1 January 2009). |
| | • | | IAS 32 Financial Instruments: Presentation and IAS 1: Presentation of Financial Statements: Changes to puttable financial instruments and obligations arising on liquidation (effective as of 1 January 2009). |
| | • | | Improvements to IFRSs. This document modifies various standards and is effective for years beginning on or after 1 July 2009. |
| | • | | IFRS 1 First-time Adoption of International Financial Reporting Standards and IAS 27 Consolidated and Separate Financial Statements: These changes relate to the measurement of investments in separate financial statements. This standard is applied prospectively for years started on or after 1 January 2009. |
| | • | | Embedded derivatives: Amendments to IFRIC 9 and IAS 39 (applicable for years started after 31 December 2008). |
| | • | | IFRS 1 First-time Adoption of International Financial Reporting Standards (applicable to annual periods beginning after 31 December 2009). This change does not affect the Group. |
| | • | | IFRIC 15 Agreements for the Construction of Real Estate. |
| | • | | IFRIC 17 Distribution of Non-Cash Assets to Owners (effective date: 1 July 2009). |
F-16
GRIFOLS, S.A. AND SUBSIDIARIES
Notes to Consolidated Financial Statements
| | • | | IFRIC 18 Transfers of Assets from Customers (effective date: 1 July 2009). |
| | • | | IAS 39 Financial Instruments: Recognition and Measurement. Changes to the items that can be classified as hedged. The amendment clarifies the types of risks that can be classified as hedged when applying hedge accounting (effective date: 1 July 2009). |
Effective date in 2010
| | i) | Standards effective as of 1 January 2010 |
| | • | | Amendment to IFRS 2 Group Cash-settled Share Based Payment Transactions (effective date: 1 January 2010). |
| | • | | 2009 improvements to IFRSs (effective date: 1 January 2010). |
| | • | | Amendment to IAS 32 Financial Instruments: Presentation, Classification of Rights Issues (effective date: 1 February 2010). |
| | • | | IFRIC 19 Extinguishing financial liabilities with equity instruments (effective date: 1 July 2010). |
| | • | | Amendment to IFRS 1 Limited Exemption from Comparative IFRS 7 Disclosures for First-time Adopters (effective date: 1 July 2010). |
| | • | | IFRS 3 Amendments resulting from May 2010 Annual Improvements (effective date: 1 July 2010). |
| | • | | IAS 27 Amendments resulting from May 2010 Annual Improvements (effective date: 1 July 2010). |
In accordance with the new IFRS 3 (mandatory application in years starting after 1 July 2009), transaction costs, which differ from costs of issuing debt or equity instruments, are recognised as an expense as incurred. The application of this new standard has an impact on the consolidated financial statements of the Grifols Group (see notes 3(a) and 15).
The application of the other standards has not had a significant impact on the Group’s consolidated financial statements or has not been applicable.
| | ii) | Standards issued but not effective on 2010 |
| | • | | - IAS 24 Revised Related Party Disclosures |
| | • | | - Amendment to IFRIC 14: Prepayment of a minimum funding requirement (effective date: 1 January 2011). |
| | • | | - IFRS 7 Amendments resulting from May 2010 Annual Improvements (effective date: 1 January 2011). |
| | • | | - Amendment to IFRIC 13 Customer Loyalty Programmes (effective date: 1 January 2011). |
| | • | | - IAS 34 Amendments resulting from May 2010 Annual Improvements (effective date: 1 January 2011). |
| | • | | - IAS 1 Amendments resulting from May 2010 Annual Improvements (effective date: 1 January 2011). |
The Group has not applied any of the standards or interpretations issued prior to their deadline. The Company’s directors do not expect that the adoptions of these modifications will have a significant effect on the consolidated financial statements.
Effective date in 2011
| | i) | Standards effective as of 1 January 2011 |
| | • | | Amendment to IAS 32 Classification of Rights Issues. Effective for annual periods beginning on or after 1 February 2010. |
| | • | | IAS 24 Related Party Disclosures. Effective for annual periods beginning on or after 1 January 2011. |
| | • | | IFRIC 14 Prepayments of a Minimum Funding Requirement. Effective for annual periods beginning on or after 1 January 2011. |
| | • | | IFRS 1 Limited Exemption from Comparative IFRS 7 Disclosures for First-time Adopters. Effective for annual periods beginning on or after 1 July 2010. (EU: annual periods beginning on or after 30 June 2010). |
F-17
GRIFOLS, S.A. AND SUBSIDIARIES
Notes to Consolidated Financial Statements
| | • | | Improvements to IFRSs issued in May 2010. |
| | • | | IFRIC 19 Extinguishing Financial Liabilities with Equity Instruments. Effective for annual periods beginning on or after 1 July 2010. |
| | ii) | Standards issued but not effective on 2011 |
| | • | | IAS 19 Employee Benefits. Effective for annual periods beginning on or after 1 January 2013. |
| | • | | Amendments to IAS 1 – Presentation of components of other comprehensive income. Effective for annual periods beginning on or after 1 July 2012. |
| | • | | IFRS 10 Consolidated Financial Statements. Effective for annual periods beginning on or after 1 January 2013. |
| | • | | IFRS 11 Joint Arrangements. Effective for annual periods beginning on or after 1 January 2013. |
| | • | | IFRS 12 Disclosure of Interests in Other Entities. Effective for annual periods beginning on or after 1 January 2013. |
| | • | | IFRS 13 Fair Value Measurement. Effective for annual periods beginning on or after 1 January 2013. |
| | • | | IAS 27 Consolidated and Separate Financial Statements. Effective for annual periods beginning on or after 1 January 2013. |
| | • | | IAS 28 Investments in Associates and Joint Ventures. Effective for annual periods beginning on or after 1 January 2013. |
| | • | | Amendments to IFRS 7 – Disclosures – Offsetting Financial Assets and Financial Liabilities. Effective for annual periods beginning on or after 1 July 2011. |
| | • | | Amendments to IAS 12 – Recovery of Underlying Assets. Effective for annual periods beginning on or after 1 January 2012. |
| | • | | Amendments to IFRS 1 – Severe Hyperinflation and Removal of Fixed Dates for First-time Adopters. Effective for annual periods beginning on or after 1 July 2011. Pending adoption by the EU. |
| | • | | IFRS 9 Financial Instruments. Effective for annual periods beginning on or after 1 January 2015. |
| | • | | IFRIC 20 Stripping Costs in the Production Phase of a Surface Mine. Effective for annual periods beginning on or after 1 January 2013. |
| | • | | IFRS 7 Financial Instruments: Disclosures – Offsetting Financial Assets and Financial Liabilities. Effective for annual periods beginning on or after 1 January 2013. |
| | • | | IAS 32 Financial Instruments: Presentation: Amendments to Offsetting Financial Assets and Financial Liabilities. Effective for annual periods beginning on or after 1 January 2014. |
The Group has not applied any of the standards or interpretations issued prior to their deadline. The Company’s directors do not expect that the adoption of these modifications will have a significant effect on the consolidated financial statements.
| | (a) | Talecris Biotherapeutics Holdings Corp. and subsidiaries |
On 2 June 2011 the Group acquired 100% of the share capital of the US company Talecris Biotherapeutics Holdings Corp. (hereinafter Talecris), which also specialises in the production of plasma-derived biological medicines, for a total of Euros 2,593 million (US Dollars 3,737 million).
The operation was performed through a combined offer of cash and new Grifols shares with no voting rights (hereinafter Class B shares) (see note 17).
The offer was made in relation to all Talecris shares and the price offered per share amounts to US Dollars 19 in cash (total of US Dollars 2,541 million) and 0.641 Class B shares in Grifols for each share in circulation of Talecris LLC. and the directors of Talecris and 0.6485 Grifols shares with no voting rights for each share in circulation of Talecris (total of US Dollars 1,196 million).
F-18
GRIFOLS, S.A. AND SUBSIDIARIES
Notes to Consolidated Financial Statements
On 2 May 2011, the Group signed a Consent Agreement with the staff of the Bureau of Competition of the US Federal Trade Commission (FTC) to establish the terms of the agreement for the merger between the two companies.
In order to fulfil the terms of the Consent Agreement, the Group has signed agreements for the sale of assets and has entered into certain trade agreements for rentals and manufacture with the Italian company Kedrion for periods of up to seven years.
The agreements refer to the following areas:
| | • | | Kedrion and Grifols enter into a manufacturing agreement to fractionate and purify Kedrion’s plasma to deliver IVIG and Albumin under Kedrion’s own brand name and Factor VIII under the trade name Koate, all of them for sale only in the US. |
| | • | | Grifols undertakes to sell its Melville fractionation facility to Kedrion. Grifols will manage the facility during a three-year period under a long-term lease agreement with Kedrion, renewable for an additional year on Grifol’s request. |
| | • | | Grifols transfers the technology and sales agreements for Koate (Factor VIII) in the USA to Kedrion. Grifols will produce this product for Kedrion during a seven-year period. |
| | • | | Grifols undertakes to sell to Kedrion two plasma collection centres; these sales were completed prior to 31 December 2011. In addition, Grifols undertakes to sell to Kedrion 200,000 litres of plasma at a fixed price. |
| | • | | Grifols authorises Kedrion to sell IVIG and Albumin produced by Grifols for Kedrion on the US market. |
As required by the Consent Agreement, Grifols has implemented the terms contained therein within a ten-day period following the acquisition date.
At the date of preparation of these consolidated financial statements, for the reasons mentioned later in this note, the Group does not have all the necessary information to determine the definitive fair value of intangible assets, liabilities and contingent liabilities acquired in the business combination.
Details of the aggregate business combination cost, the provisional fair value of the net assets acquired and provisional goodwill at the acquisition date (or the amount by which the business combination cost exceeds the fair value of the net assets acquired) are provided below. The values shown in the following table should be considered provisional.
| | | | | | | | |
| | | Thousands of Euros | | | Thousands of USD | |
Cost of the business combination (measurement of Class B shares) | | | 829,799 | | | | 1,195,574 | |
Cash paid (US Dollars 19 per share) | | | 1,763,601 | | | | 2,540,997 | |
| | | | | | | | |
Total cost of the business combination | | | 2,593,400 | | | | 3,736,571 | |
Fair value of net assets acquired (provisional) | | | 1,054,677 | | | | 1,519,579 | |
| | | | | | | | |
Goodwill (excess of cost of business combination over fair value of net assets acquired) | | | 1,538,723 | | | | 2,216,992 | |
| | | | | | | | |
| | |
| | | (see note 7) | | �� | | |
Cash paid | | | 1,763,601 | | | | 2,540,996 | |
Cash and cash equivalents of the acquired company | | | (149,693 | ) | | | (215,678 | ) |
| | | | | | | | |
Cash flow for the acquisition | | | 1,613,908 | | | | 2,325,318 | |
| | | | | | | | |
The fair value of Class B shares has been determined by the average price of the first weeks of issue of the shares, as this period is considered to provide a reference for determining the fair value of the shares as they were first listed on 2 June 2011.
Total expenses incurred in the transaction amount to Euros 61.3 million and expenses for the current year amount to Euros 44.3 million (Euros 17 million in 2010).
Goodwill generated in the acquisition is attributed to the synergies, workforce and other expected benefits from the business combination of the assets and activities of the Group.
F-19
GRIFOLS, S.A. AND SUBSIDIARIES
Notes to Consolidated Financial Statements
The acquisition of Talecris will consolidate the Group’s position as the third largest producer of plasma products in the world, significantly increasing its presence in the USA.
Had the acquisition taken place at 1 January 2011, the Group’s revenue would have increased by Euros 507,039 thousand and consolidated profit for the year, excluding non-recurring expenses such as those related to the transaction and stock option cancellation costs derived from the change of control, would have increased by Euros 74,705 thousand. The revenue and profit of Talecris between the acquisition date and 31 December 2011 amounted to Euros 750,484 thousand and Euros 133,075, respectively.
At the date of acquisition the amounts of recognised assets, liabilities and contingent liabilities are as follows:
| | | | | | | | | | | | | | | | |
| | | Fair Value | | | Book Value | |
| | | Thousands of
Euros | | | Thousands of
USD | | | Thousands of
Euros | | | Thousands of
USD | |
Intangible assets (note 8) | | | 846,504 | | | | 1,219,643 | | | | 21,122 | | | | 30,432 | |
Property plant and equipment (note 9) | | | 466,674 | | | | 672,384 | | | | 306,401 | | | | 441,462 | |
Non-current financial assets | | | 1,466 | | | | 2,112 | | | | 1,466 | | | | 2,112 | |
Deferred tax assets | | | 55,985 | | | | 80,663 | | | | 55,985 | | | | 80,663 | |
Non-current assets held for sale | | | 8,200 | | | | 11,814 | | | | 2,254 | | | | 3,247 | |
Inventories (note 12) | | | 452,311 | | | | 651,689 | | | | 490,976 | | | | 707,398 | |
Trade and other receivables | | | 188,067 | | | | 270,969 | | | | 188,068 | | | | 270,968 | |
Other assets | | | 2,364 | | | | 3,406 | | | | 2,364 | | | | 3,406 | |
Cash and cash equivalents | | | 149,693 | | | | 215,678 | | | | 149,693 | | | | 215,678 | |
| | | | | | | | | | | | | | | | |
Total Assets | | | 2,171,264 | | | | 3,128,358 | | | | 1,218,329 | | | | 1,755,366 | |
Non-current provisions (note 21) | | | 9,250 | | | | 13,327 | | | | 9,250 | | | | 13,327 | |
Non-current financial liabilities | | | 6,289 | | | | 9,061 | | | | 6,289 | | | | 9,061 | |
Current financial liabilities | | | 473,085 | | | | 681,621 | | | | 473,085 | | | | 681,621 | |
Current provisions (note 21) | | | 67,965 | | | | 97,924 | | | | 31,180 | | | | 44,924 | |
Trade and other payables | | | 152,844 | | | | 220,218 | | | | 152,844 | | | | 220,218 | |
Other current liabilities | | | 48,533 | | | | 69,927 | | | | 43,510 | | | | 62,689 | |
Deferred tax liabilities | | | 358,621 | | | | 516,701 | | | | 15,125 | | | | 21,792 | |
| | | | | | | | | | | | | | | | |
Total liabilities and contingent liabilities | | | 1,116,587 | | | | 1,608,779 | | | | 731,283 | | | | 1,053,632 | |
Total net assets acquired | | | 1,054,677 | | | | 1,519,579 | | | | 487,046 | | | | 701,734 | |
| | | | | | | | | | | | | | | | |
Fair values have been determined provisionally as follows:
| | • | | Intangible assets (currently marketed products, research and development) have been determined provisionally pending completion of an independent valuation. |
| | • | | The fair value of contingent liabilities has also been determined provisionally. |
Fair values have been determined using the following methods:
| | • | | Intangible assets: the fair value of intangible assets (primarily the acquired product portfolio) has been calculated based on “excess earnings” (income approach), whereby the asset is measured after deducting charges or rentals that must be settled to enable use of the remaining assets required to operate the intangible asset being measured. |
| | • | | Property, plant and equipment: the fair value of property, plant and equipment has been determined using the “cost approach”, whereby the value of an asset is measured at the cost of rebuilding or replacing that asset with other similar assets. |
| | • | | Inventories: the fair value of inventories has been determined using the “market approach”, by analysing similar transactions. |
| | • | | Contingent liabilities: the fair value of contingent liabilities has been determined using the “income approach” based on forecasted payments and a probability scenario. |
F-20
GRIFOLS, S.A. AND SUBSIDIARIES
Notes to Consolidated Financial Statements
| | (b) | Australian-Swiss Group |
On 3 March 2009 the Group acquired 49% of the economic rights and 99% of the voting rights in a holding company of the Australian-Swiss group Woolloomooloo Holdings Pty Ltd, thereby gaining control of this group, for Euros 25 million through a share capital increase fully subscribed by Grifols, S.A.
Details of the aggregate business combination cost, the fair value of the net assets acquired and goodwill at the acquisition date were follows:
| | | | |
| | | Thousands of Euros | |
Cost of the business combination | | | | |
Cash paid | | | 25,000 | |
Fair value of deferred payment | | | 497 | |
| | | | |
Total cost of the business combination | | | 25,497 | |
Fair value of net assets acquired | | | 9,307 | |
| | | | |
Goodwill (excess of cost of business combination over fair value of net assets acquired) | | | 16,190 | |
| | | | |
| |
| | | (see note 7) | |
Cash paid | | | 25,497 | |
Cash and cash equivalents of the acquired company | | | (10,112 | ) |
| | | | |
Cash flow for the acquisition | | | 15,385 | |
| | | | |
Goodwill generated in the acquisition is attributed to the synergies and other expected benefits from the business combination of the assets and activities of the Group.
The Australian-Swiss Group provides the commercial strength required by Grifols to consolidate and increase its presence in the diagnostic markets of Australia and New Zealand, which until this acquisition consisted only of the sale of instruments through distributors.
After obtaining the licence for Flebogamma DIF in Australia (next generation IVIG), Grifols haemoderivatives began to be commercialised in this country.
Grifols’s investment also included the acquisition under the same terms, of Medion, located in Switzerland, which has developed new technology for determining blood groups, supplementary to that used by Grifols.
Had the acquisition taken place at 1 January 2009, the Group’s revenue and consolidated profit for the period would not have varied significantly. Accumulated losses incurred by the Australian-Swiss group attributable to the Group results from the date of acquisition to 31 December 2009 amounted to Euros 652 thousand.
At the date of acquisition the amounts of recognised assets, liabilities and contingent liabilities are as follows:
| | | | | | | | |
| | | Thousands of Euros | |
| | | Fair value | | | Book value | |
Intangible assets (note 8) | | | 6,525 | | | | 476 | |
Property, plant and equipment (note 9) | | | 2,307 | | | | 3,113 | |
Deferred tax assets (note 29) | | | 500 | | | | 258 | |
Inventories (note 12) | | | 3,549 | | | | 3,549 | |
Trade and other receivables | | | 2,096 | | | | 2,096 | |
Other assets | | | 293 | | | | 293 | |
Cash and cash equivalents | | | 10,112 | | | | 10,112 | |
| | | | | | | | |
Total assets | | | 25,382 | | | | 19,897 | |
Trade and other payables | | | 3,165 | | | | 3,165 | |
Other liabilities | | | 1,273 | | | | 1,272 | |
Deferred tax liabilities (note 29) | | | 1,761 | | | | 551 | |
| | | | | | | | |
Total liabilities and contingent liabilities | | | 6,199 | | | | 4,988 | |
Total net assets | | | 19,183 | | | | 14,909 | |
| | | | | | | | |
Non-controlling interests (note 19) | | | (9,876 | ) | | | | |
Total net assets acquired | | | 9,307 | | | | | |
| | | | | | | | |
F-21
GRIFOLS, S.A. AND SUBSIDIARIES
Notes to Consolidated Financial Statements
Intangible assets were measured at fair value. The royalty relief method has been used to measure certain patents acquired by the Group. An 8% royalty was considered, together with a discount rate after tax of 10%. Patents were measured on the basis of projected sales for a fifteen-year period.
In August 2011, the Group acquired the remaining 51% of the share capital of Woolloomooloo Holdings Pty Ltd for an amount of AUS Dollars 12.5 million (Euros 9.5 million). The difference between the amount paid and the non-controlling interest has been recorded as a Euros 2.2 million increase in reserves.
| (4) | Significant Accounting Principles |
Subsidiaries are entities, including special purpose entities (SPE), over which the Group exercises control, either directly or indirectly, through subsidiaries. Control is the power to govern the financial and operating policies of an entity so as to obtain benefits from its activities. In assessing control potential voting rights held by the Group or other entities that are exercisable or convertible at the end of each reporting period are considered.
Information on subsidiaries forming the consolidated Group is included in note 2 (c).
The income, expenses and cash flows of subsidiaries are included in the consolidated financial statements from the date of acquisition, which is when the Group takes control, until the date that control ceases.
Intercompany balances and transactions and unrealised gains or losses are eliminated on consolidation.
The accounting policies of subsidiaries have been adapted to those of the Group for transactions and other events in similar circumstances.
The financial statements of consolidated subsidiaries have been prepared as of the same date and for the same reporting period as the financial statements of the Company.
On the date of transition to EU-IFRS, 1 January 2004, the Group applied the exception permitted under IFRS 1 “First-time adoption of International Financial Reporting Standards”, whereby only those business combinations performed as from 1 January 2004 have been recognised using the acquisition method. Entities acquired prior to that date were recognised in accordance with accounting prevailing at that time, taking into account the necessary corrections and adjustments at the transition date.
The Group applies the revised IFRS 3 “Business combinations” in transactions made subsequent to 1 January 2010.
The Group applies the acquisition method for business combinations.
The acquisition date is the date on which the Group obtains control of the acquiree.
Business combinations made subsequent to 1 January 2010
The consideration transferred in a business combination is determined at acquisition date and calculated as the sum of the fair values of the assets transferred, the liabilities incurred or assumed, the equity interests issued and any asset or liability contingent consideration depending on future events or the compliance of certain conditions in exchange for the control of the business acquired.
The consideration transferred excludes any payment that does not form part of the exchange for the acquired business. Acquisition-related costs are accounted for as expenses when incurred. Share increase costs are recognised as equity when the increase takes place and borrowing costs are deducted from the financial liability when it is recognised.
At the acquisition date the Group recognises at fair value the assets acquired and liabilities assumed. Liabilities assumed include contingent liabilities provided that they represent present obligations that arise from past events and their fair value can be measured reliably. The Group also recognises indemnification assets transferred by the seller at the same time and following the same measurement criteria as the item that is subject to indemnification from the acquired business taking into consideration, where applicable, the insolvency risk and any contractual limit on the indemnity amount.
F-22
GRIFOLS, S.A. AND SUBSIDIARIES
Notes to Consolidated Financial Statements
This criterion does not include non-current assets or disposable groups of assets which are classified as held for sale, long-term defined benefit employee benefit liabilities, share-based payment transactions, deferred tax assets and liabilities and intangible assets arising from the acquisition of previously transferred rights.
Assets and liabilities assumed are classified and designated for subsequent measurement in accordance with the contractual terms, economic conditions, operating or accounting policies and other factors that exist at the acquisition date, except for leases and insurance contracts.
The excess between the consideration transferred and the value of net assets acquired and liabilities assumed, less the value assigned to non-controlling interests, is recognised as goodwill. Where applicable, any shortfall, after evaluating the consideration transferred, the value assigned to non-controlling interests and the identification and measurement of net assets acquired, is recognised in profit and loss.
It has only been possible to measure the Talecris business combination provisionally. Therefore, the net identifiable assets have initially been recognised at their provisional value, and any adjustments made during the measurement period have been recorded as if they had been known as of the acquisition date. Where applicable, comparative figures for the prior year have been restated. Adjustments to the provisional values only reflect information relating to events and circumstances existing at the acquisition date and which, had they been known, would have affected the amounts recognised at that date. Once this period has elapsed, adjustments are only made to initial values when errors must be corrected. Any potential benefits arising from tax losses and other deferred tax assets of the acquiree that have not been recorded as they did not qualify for recognition at the acquisition date, are accounted for as income tax income, provided the adjustments were not made during the measurement period.
The contingent consideration is classified in accordance with underlying contractual terms as a financial asset or financial liability, equity instrument or provision. Provided that subsequent changes to the fair value of a financial asset or financial liability do not relate to an adjustment of the measurement period, they are recognised in consolidated profit and loss or other comprehensive income. The contingent consideration classified, where applicable, as equity is not subject to subsequent change, with settlement being recognised in equity. The contingent consideration classified, where applicable, as a provision is recognised subsequently in accordance with the relevant measurement standard.
Business combinations made prior to 1 January 2010
The cost of the business combination is calculated as the sum of the acquisition-date fair values of the assets transferred, the liabilities incurred or assumed, and equity instruments issued by the Group, in exchange for control of the acquiree, plus any costs directly attributable to the business combination. Any additional consideration contingent on future events or the fulfilment of certain conditions is included in the cost of the combination provided that it is probable that an outflow of resources embodying economic benefits will be required and the amount of the obligation can be reliably estimated. Subsequent recognition of contingent considerations or subsequent variations to contingent considerations are recognised as a prospective adjustment to the cost of the business combination.
Where the cost of the business combination exceeds the Group’s interest in the fair value of the identifiable net assets of the entity acquired, the difference is recognised as goodwill, whilst the shortfall, once the costs of the business combination and the fair values of net assets acquired have been reconsidered, is recognised in profit and loss.
| | (c) | Non-controlling interests |
Non-controlling interests in subsidiaries acquired after 1 January 2004 are recognised at the acquisition date at the proportional part of the fair value of the identifiable net assets. Non-controlling interests in subsidiaries acquired prior to the transition date were recognised at the proportional part of the equity of the subsidiaries at the date of first consolidation.
Non-controlling interests are disclosed in the consolidated balance sheet under equity separately from equity attributable to the Parent. Non-controlling interests’ share in consolidated profit or loss for the year (and in consolidated comprehensive income for the year) is disclosed separately in the consolidated income statement (consolidated statement of comprehensive income).
The consolidated profit or loss for the year (consolidated comprehensive income) and changes in equity of the subsidiaries attributable to the Group and non-controlling interests after consolidation adjustments and eliminations, is determined in accordance with the percentage ownership at year end, without considering the possible exercise or conversion of potential
F-23
GRIFOLS, S.A. AND SUBSIDIARIES
Notes to Consolidated Financial Statements
voting rights. However, whether or not control exists is determined taking into account the possible exercise of potential voting rights and other derivative financial instruments which, in substance, currently allow access to the economic benefits associated with the interests held, such as entitlement to a share in future dividends and changes in the value of subsidiaries.
The excess of losses attributable to non-controlling interests generated before 1 January 2010, which cannot be attributed to the latter as such losses exceed their interest in the equity of the Parent, is recognised as a decrease in the equity of the Parent, except when the non-controlling interests are obliged to assume part or all of the losses and are in a position to make the necessary additional investment. Subsequent profits obtained by the Group are attributed to the Parent until the minority interest’s share in prior years’ losses is recovered.
Nevertheless, as of 1 January 2010, profit and loss and each component of other comprehensive income are assigned to equity attributable to shareholders of the Parent company and to non-controlling interests in proportion to their interest, although this implies a balance receivable from non-controlling interests. Agreements signed between the Group and the non-controlling interests are recognised as a separate transaction.
The increase and reduction of non-controlling interests in a subsidiary in which control is retained is recognised as an equity instrument transaction. Consequently, no new acquisition cost arises in increases nor is a gain recorded on reductions, rather, the difference between the consideration transferred or received and the carrying amount of the non-controlling interests is recognised in the reserves of the investor, without prejudice to reclassifying consolidation reserves and reallocating other comprehensive income between the Group and the non-controlling interests. When a Group’s interest in a subsidiary diminishes, non-controlling interests are recognised at their share of the net consolidated assets, including goodwill.
Joint ventures are those in which there is a contractual agreement to share the control over an economic activity, in such a way that strategic financial and operating decisions relating to the activity require the unanimous consent of the Group and the remaining venturers.
Investments in joint ventures are accounted for using the equity method.
The acquisition cost of investments in joint ventures is determined consistently with that established for investments in associates.
| | (e) | Foreign currency transactions |
| | (i) | Functional currency and presentation currency |
The consolidated financial statements accounts are presented in thousands of Euros, which is the functional and presentation currency of the Parent.
| | (ii) | Transactions, balances and cash flows in foreign currency |
Foreign currency transactions are translated into the functional currency using the previous month’s exchange rate for all transactions performed during the current month. This method does not differ significantly from applying the exchange rate at the date of the transaction.
Monetary assets and liabilities denominated in foreign currencies have been translated into thousands of Euros at the closing rate, while non-monetary assets and liabilities measured at historical cost have been translated at the exchange rate prevailing at the transaction date. Non-monetary assets measured at fair value have been translated into thousands of Euros at the exchange rate at the date that the fair value was determined.
In the consolidated statement of cash flows, cash flows from foreign currency transactions have been translated into thousands of Euros at the exchange rates prevailing at the dates the cash flows occur. The effect of exchange rate fluctuations on cash and cash equivalents denominated in foreign currencies is recognised separately in the statement of cash flows as “Effect of exchange rate fluctuations on cash and cash equivalents”.
Exchange gains and losses arising on the settlement of foreign currency transactions and the translation into thousands of Euros of monetary assets and liabilities denominated in foreign currencies are recognised in profit or loss.
F-24
GRIFOLS, S.A. AND SUBSIDIARIES
Notes to Consolidated Financial Statements
| | (iii) | Translation of foreign operations |
The translation into thousands of Euros of foreign operations for which the functional currency is not the currency of a hyperinflationary economy is based on the following criteria:
| | • | | Assets and liabilities, including goodwill and net asset adjustments derived from the acquisition of the operations, including comparative amounts, are translated at the closing rate at each balance sheet date. |
| | • | | Income and expenses, including comparative amounts, are translated using the previous month’s exchange rate for all transactions performed during the current month. This method does not differ significantly from using the exchange rate at the date of the transaction; |
| | • | | Translation differences resulting from application of the above criteria are recognised in other comprehensive income. |
In accordance with IAS 23 “Borrowing Costs”, since 1 January 2009 the Group recognises interest cost directly attributable to the purchase, construction or production of qualifying assets as an increase in the value of these assets. Qualifying assets are those which require a substantial period of time before they can be used or sold. To the extent that funds are borrowed specifically for the purpose of obtaining a qualifying asset, the amount of borrowing costs eligible for capitalisation is determined as the actual borrowing costs incurred, less any investment income on the temporary investment of those funds. Capitalised interest borrowing costs corresponding to general borrowing are calculated as the weighted average of the qualifying assets without considering specific funds. The amount of borrowing costs capitalised cannot exceed the amount of borrowing costs incurred during that period. The capitalised interest cost includes adjustments to the carrying amount of financial liabilities arising from the effective portion of hedges entered into by the Group.
The Group begins capitalising borrowing costs as part of the cost of a qualifying asset when it incurs expenditures for the asset, interest is accrued, and it undertakes activities that are necessary to prepare the asset for its intended use or sale, and ceases capitalising borrowing costs when all or substantially all the activities necessary to prepare the qualifying asset for its intended use or sale are complete. Nevertheless, capitalisation of borrowing costs is suspended when active development is interrupted for extended periods.
| | (g) | Property, plant and equipment |
Property, plant and equipment are recognised at cost or deemed cost, less accumulated depreciation and any accumulated impairment losses. The cost of self-constructed assets is determined using the same principles as for an acquired asset, while also considering the criteria applicable to production costs of inventories. Capitalised production costs are recognised by allocating the costs attributable to the asset to Self-constructed non-current assets in the consolidated income statement.
At 1 January 2004 the Group opted to apply the exemption regarding fair value and revaluation as deemed cost as permitted by IFRS 1 First time Adoption of International Financial Reporting Standards.
Property, plant and equipment are depreciated by allocating the depreciable amount of an asset on a systematic basis over its useful life. The depreciable amount is the cost or deemed cost less its residual value. The Group determines the depreciation charge separately for each component of property, plant and equipment with a cost that is significant in relation to the total cost of the asset.
Property, plant and equipment are depreciated using the following criteria:
| | | | | | |
| | | Depreciation method | | | Rates |
Buildings | | | Straight line | | | 1% - 10% |
Technical installations and machinery | | | Straight line | | | 7%-20% |
Other installations, equipment and furniture | | | Straight line | | | 10% - 30% |
Other property, plant and equipment | | | Straight line | | | 10% - 33% |
F-25
GRIFOLS, S.A. AND SUBSIDIARIES
Notes to Consolidated Financial Statements
The Group reviews residual values, useful lives and depreciation methods at each financial year end. Changes to initially established criteria are accounted for as a change in accounting estimates.
| | (iii) | Subsequent recognition |
Subsequent to initial recognition of the asset, only those costs incurred which will probably generate future profits and for which the amount may reliably be measured are capitalised. Costs of day-to-day servicing are recognised in profit and loss as incurred.
Replacements of property, plant and equipment which meet the requirements for capitalisation are recognised as a reduction in the carrying amount of the items replaced. Where the cost of the replaced items has not been depreciated independently and it is not possible to determine the respective carrying amount, the replacement cost is used as indicative of the cost of items at the time of acquisition or construction.
The Group tests for impairment and reversals of impairment losses on property, plant and equipment based on the criteria set out in note 4(i) below.
Goodwill generated on the business combinations is calculated using the criteria described in note 7. Goodwill is calculated using the criteria described in the section on business combinations.
Goodwill is not amortised, but tested for impairment annually or more frequently if events indicate a potential impairment loss. Goodwill acquired in business combinations is allocated to the cash-generating units (CGUs) or groups of CGUs which are expected to benefit from the synergies of the business combination and the criteria described in note 7 are applied. After initial recognition, goodwill is measured at cost less any accumulated impairment losses.
| | (ii) | Internally generated intangible assets |
Any research and development expenditure incurred during the research phase of projects is recognised as an expense when incurred.
Costs related with development activities are capitalised when:
| | • | | The Group has technical studies justifying the feasibility of the production process. |
| | • | | The Group has undertaken a commitment to complete production of the asset whereby it is in condition for sale or internal use. |
| | • | | The asset will generate sufficient future economic benefits. |
| | • | | The Group has sufficient financial and technical resources to complete development of the asset and has developed budget and cost accounting control systems which allow budgeted costs, introduced changes and costs actually assigned to different projects to be monitored. |
The cost of internally generated assets is calculated using the same criteria established for determining production costs of inventories. The production cost is capitalised by allocating the costs attributable to the asset to self-constructed non-current assets in the consolidated income statement.
Costs incurred in the course of activities which contribute to increasing the value of the different businesses in which the Group as a whole operates are expensed as they are incurred. Replacements or subsequent costs incurred on intangible assets are generally recognised as an expense, except where they increase the future economic benefits expected to be generated by the assets.
F-26
GRIFOLS, S.A. AND SUBSIDIARIES
Notes to Consolidated Financial Statements
| | (iii) | Other intangible assets |
Other intangible assets are carried at cost, or at fair value if they arise on business combinations, less accumulated amortisation and impairment losses.
| | (iv) | Intangible assets acquired in business combinations |
The cost of identifiable intangible assets acquired in the business combination of Talecris includes the fair value of the currently marketed products sold and which are classified under “Other intangible assets”.
| | (v) | Useful life and amortisation rates |
The Group assesses whether the useful life of each intangible asset acquired is finite or indefinite. An intangible asset is regarded by the Group as having an indefinite useful life when there is no foreseeable limit to the period over which the asset will generate net cash inflows.
Intangible assets with indefinite useful lives are not amortised but tested for impairment at least annually.
Intangible assets with finite useful lives are amortised by allocating the depreciable amount of an asset on a systematic basis over its useful life, by applying the following criteria:
| | | | | | |
| | | Amortisation
method | | | Estimated years of
useful life |
Development expenses | | | Straight line | | | 3-5 |
Concessions, patents, licences, trademarks and similar | | | Straight line | | | 5-15 |
Computer Software | | | Straight line | | | 3-6 |
Other intangible assets | | | Straight line | | | 30 |
The depreciable amount is the cost or deemed cost of an asset less its residual value.
The Group does not consider the residual value of its intangible assets material. The Group reviews the residual value, useful life and amortisation method for intangible assets at each financial year end. Changes to initially established criteria are accounted for as a change in accounting estimates.
| | (i) | Impairment of goodwill, other intangible assets and other non-financial assets subject to depreciation or amortisation |
The Group evaluates whether there are indications of possible impairment losses on non-financial assets subject to amortisation or depreciation to verify whether the carrying amount of these assets exceeds the recoverable amount.
Irrespective of any indication of impairment, the Group tests for possible impairment of goodwill, intangible assets with indefinite useful lives, and intangible assets with finite useful lives not yet available for use, at least annually.
The recoverable amount is the higher of an asset’s fair value less costs to sell and its value in use. An asset’s value in use is calculated based on an estimate of the future cash flows expected to derive from the use of the asset, expectations about possible variations in the amount or timing of those future cash flows, the time value of money, the price for bearing the uncertainty inherent in the asset and other factors that market participants would reflect in pricing the future cash flows deriving from the asset.
Negative differences arising from comparison of the carrying amounts of the assets with their recoverable amounts are recognised in the consolidated income statement.
Recoverable amount is determined for each individual asset, unless the asset does not generate cash inflows that are largely independent of those from other assets or groups of assets. If this is the case, recoverable amount is determined for the cash-generating unit (CGU) to which the asset belongs.
Impairment losses recognised for cash-generating units are first allocated to reduce, where applicable, the carrying amount of goodwill allocated to the CGU and then to the other assets of the CGU pro rata on the basis of the carrying amount of each asset. The carrying amount of each asset may not be reduced below the highest of its fair value less costs to sell, its value in use and zero.
F-27
GRIFOLS, S.A. AND SUBSIDIARIES
Notes to Consolidated Financial Statements
At the end of each reporting period the Group assesses whether there is any indication that an impairment loss recognised in prior periods may no longer exist or may have decreased. Impairment losses on goodwill are not reversible. Impairment losses for other assets are only reversed if there has been a change in the estimates used to calculate the recoverable amount of the asset.
A reversal of an impairment loss is recognised in consolidated profit or loss. The increase in the carrying amount of an asset attributable to a reversal of an impairment loss may not exceed the carrying amount that would have been determined, net of depreciation or amortisation, had no impairment loss been recognised.
The reversal of an impairment loss for a CGU is allocated to its assets, except for goodwill, pro rata with the carrying amounts of those assets, with the limit per asset of the lower of its recoverable value and the carrying amount which would have been obtained, net of depreciation, had no impairment loss been recognised.
| | (i) | Lessee accounting records |
The Group has the right to use certain assets through lease contracts.
Leases in which the Group assumes substantially all the risks and rewards incidental to ownership are classified as finance leases, otherwise they are classified as operating leases.
At the commencement of the lease term, the Group recognises finance leases as assets and liabilities at the lower of the fair value of the leased asset and the present value of the minimum lease payments. Initial direct costs are added to the asset’s carrying amount. Minimum lease payments are apportioned between the finance charge and the reduction of the outstanding liability. The finance charge is allocated to each period during the lease term so as to produce a constant periodic rate of interest on the remaining balance of the liability. Contingent rents are recognised as an expense in the years in which they are incurred.
Lease payments under an operating lease (excluding insurance and maintenance) are recognised as an expense on a straight-line basis unless another systematic basis is representative of the time pattern of the user’s benefit.
| | (ii) | Leasehold investments |
Non-current investments in properties leased from third parties are classified using the same criteria as for property, plant and equipment. Investments are amortised over the lower of their useful lives and the term of the lease contract. The lease term is consistent with that established for recognition of the lease.
| | (iii) | Sale and leaseback transactions |
Any profit on sale and leaseback transactions that meet the conditions of a finance lease is deferred over the term of the lease.
When the leaseback is classed as an operating lease:
| | • | | If the transaction is established at fair value, any profit or loss on the sale is recognised immediately in consolidated profit or loss for the year. |
| | • | | In general, if the sale price is below fair value, any profit or loss is recognised immediately. However, if the loss is compensated for by future lease payments at below market price, it is deferred in proportion to the lease payments over the period for which the asset is to be used. |
| | (i) | Classification of financial instruments |
Financial instruments are classified on initial recognition as a financial asset, a financial liability or an equity instrument in accordance with the substance of the contractual arrangement and the definitions of a financial liability, a financial asset and an equity instrument set out in IAS 32, Financial Instruments - Presentation.
F-28
GRIFOLS, S.A. AND SUBSIDIARIES
Notes to Consolidated Financial Statements
Financial instruments are classified into the following categories: financial assets and financial liabilities at fair value through profit and loss, loans and receivables, held-to-maturity investments, available-for-sale financial assets and financial liabilities. The Group classifies financial instruments into different categories based on the nature of the instruments and management’s intentions on initial recognition.
Regular way purchases and sales of financial assets are recognised at trade date, when the Group undertakes to purchase or sell the asset.
| | a) | Financial assets at fair value through profit or loss |
Financial assets and financial liabilities at fair value through profit or loss are those which are classified as held for trading or which the Group designated as such on initial recognition.
A financial asset or liability is classified as held for trading if:
| | • | | it is acquired or incurred principally for the purpose of selling or repurchasing it in the near term |
| | • | | it forms part of a portfolio of identified financial instruments that are managed together and for which there is evidence of a recent pattern of short-term profit-taking, or |
| | • | | it is a derivative, except for a derivative which has been designated as a hedging instrument and complies with conditions for effectiveness or a derivative that is a financial guarantee contract. |
Financial assets and financial liabilities at fair value through profit or loss are initially recognised at fair value. Transaction costs directly attributable to the acquisition or issue are recognised when incurred.
After initial recognition, they are recognised at fair value through profit or loss.
The Group does not reclassify any financial assets or liabilities from or to this category while they are recognised in the consolidated balance sheet.
Loans and receivables are non-derivative financial assets with fixed or determinable payments that are not quoted in an active market, other than those classified in other financial asset categories. These assets are recognised initially at fair value, including transaction costs, and are subsequently measured at amortised cost using the effective interest method.
| | c) | Available-for-sale financial assets |
Available-for-sale financial assets are non-derivative financial assets that are either designated specifically to this category or do not comply with requirements for classification in the above categories.
Available-for-sale financial assets are initially recognised at fair value, plus any transaction costs directly attributable to the purchase.
After initial recognition, financial assets classified in this category are measured at fair value and any gain or loss, except for impairment losses, is accounted for in other comprehensive income recognised in equity. On disposal of the financial assets amounts recognised in other comprehensive income or the impairment loss are reclassified to profit or loss.
| | d) | Financial assets and liabilities carried at cost |
Investments in equity instruments whose fair value cannot be reliably measured and derivative instruments that are linked to these instruments and that must be settled by delivery of such unquoted equity instruments, are measured at cost. Nonetheless, if the financial assets or liabilities can subsequently be reliably measured on an ongoing basis, they are accounted for at fair value and any gain or loss is recognised in accordance with their classification.
| | (ii) | Offsetting principles |
A financial asset and a financial liability can only be offset when the Group currently has a legally enforceable right to set off the recognised amounts and intends either to settle on a net basis, or to realise the asset and settle the liability simultaneously.
F-29
GRIFOLS, S.A. AND SUBSIDIARIES
Notes to Consolidated Financial Statements
The fair value is the amount for which an asset can be exchanged, or a liability settled, between knowledgeable, willing parties in an arm’s length transaction. The Group generally applies the following systematic hierarchy to determine the fair value of financial assets and financial liabilities:
| | • | | Firstly, the Group applies the quoted prices of the most advantageous active market to which the entity has immediate access, adjusted where appropriate to reflect any differences in counterparty credit risk between instruments traded in that market and the one being valued. The quoted market price for an asset held or liability to be issued is the current bid price and, for an asset to be acquired or liability held, the asking price. If the Group has assets and liabilities with offsetting market risks, it uses mid-market prices as a basis for establishing fair values for the offsetting risk positions and applies the bid or asking price to the net open position as appropriate. |
| | • | | When current bid and asking prices are unavailable, the price of the most recent transactions is used, adjusted to reflect changes in economic circumstances. |
| | • | | Otherwise, the Group applies generally accepted measurement techniques using, insofar as is possible, market data and, to a lesser extent, specific Group data. |
The amortised cost of a financial asset or liability is the amount at which the asset or liability was measured at initial recognition, minus principal repayments, plus or minus the cumulative amortisation using the effective interest method of any difference between that initial amount and maturity amount and minus any reduction for impairment or uncollectibility.
| | (v) | Impairment of financial assets carried at cost |
The amount of the impairment loss on assets carried at cost is measured as the difference between the carrying amount of the financial asset and the present value of estimated future cash flows discounted at the current market rate of return for a similar financial asset. Such impairment losses cannot be reversed and are therefore recognised directly against the value of the asset and not as an allowance account.
| | (vi) | Impairment of financial assets carried at amortised cost |
The amount of the impairment loss of financial assets carried at amortised cost is measured as the difference between the asset’s carrying amount and the present value of estimated future cash flows (excluding future credit losses that have not been incurred) discounted at the financial asset’s original effective interest rate. For variable income financial assets, the effective interest rate corresponding to the measurement date under the contractual conditions is used.
The Group recognises impairment losses and unrecoverable loans and receivables and debt instruments by recognising an allowance account for financial assets. When impairment and uncollectibility are considered irreversible, their carrying amount is eliminated against the allowance account.
The impairment loss is recognised in profit or loss and may be reversed in subsequent periods if the decrease can be objectively related to an event occurring after the impairment has been recognised. The loss can only be reversed to the limit of the amortised cost of the assets had the impairment loss not been recognised. The impairment loss is reversed against the allowance account.
| | (vii) | Impairment of available-for-sale financial assets |
When a decline in the fair value of an available-for-sale financial asset at fair value through profit or loss has been accounted for in other comprehensive income, the accumulative loss is reclassified from equity to profit or loss when there is objective evidence that the asset is impaired, even though the financial asset has not been derecognised. The impairment loss recognised in profit and loss is calculated as the difference between the acquisition cost, net of any reimbursements or repayment of the principal, and the present fair value, less any impairment loss previously recognised in profit and loss for the year.
F-30
GRIFOLS, S.A. AND SUBSIDIARIES
Notes to Consolidated Financial Statements
Impairment losses relating to investments in equity instruments are not reversible and are therefore recognised directly against the value of the asset and not as an allowance account.
If the fair value of debt instruments increases and the increase can be objectively related to an event occurring after the impairment loss was recognised, the increase is recognised in profit and loss up to the amount of the previously recognised impairment loss and any excess is accounted for in other comprehensive income recognised in equity.
| | (viii) | Financial liabilities |
Financial liabilities, including trade and other payables, which are not classified at fair value through profit or loss, are initially recognised at fair value less any transaction costs that are directly attributable to the issue of the financial liability. After initial recognition, liabilities classified under this category are measured at amortised cost using the effective interest method.
| | (ix) | Derecognition of financial assets |
The Group applies the criteria for derecognition of financial assets to part of a financial asset or part of a group of similar financial assets or to a financial asset or group of similar financial assets.
Financial assets are derecognised when the contractual rights to the cash flows from the financial asset expire or have been transferred and the Group has transferred substantially all the risks and rewards of ownership. Where the Group retains the contractual rights to receive cash flows, it only derecognises financial assets when it has assumed a contractual obligation to pay the cash flows to one or more recipients and if the following requirements are met:
| | • | | Payment of the cash flows is conditional on their prior collection. |
| | • | | The Group is unable to sell or pledge the financial asset. |
| | • | | The cash flows collected on behalf of the eventual recipients are remitted without material delay and the Group is not entitled to reinvest the cash flows. This criterion is not applicable to investments in cash or cash equivalents made by the Group during the settlement period from the collection date to the date of required remittance to the eventual recipients, provided that interest earned on such investments is passed on to the eventual recipients. |
If the Group neither transfers nor retains substantially all the risks and rewards of ownership of the financial asset, it determines whether it has retained control of the financial asset. In this case:
| | • | | If the Group has not retained control, it derecognises the financial asset and recognises separately as assets or liabilities any rights and obligations created or retained in the transfer. |
| | • | | If the Group has retained control, it continues to recognise the financial asset to the extent of its continuing involvement in the financial asset and recognises an associated liability. The extent of the Group’s continuing involvement in the transferred asset is the extent to which it is exposed to changes in the value of the transferred asset. The transferred asset and the associated liability are measured on a basis that reflects the rights and obligations that the Group has retained. The associated liability is measured in such a way that the carrying amount of the transferred asset and the associated liability is equal to the amortised cost of the rights and obligations retained by the Group, if the transferred asset is measured at amortised cost, or to the fair value of the rights and obligations retained by the Group, if the transferred asset is measured at fair value. The Group continues to recognise any income arising on the transferred asset to the extent of its continuing involvement and recognises any expense incurred on the associated liability. Recognised changes in the fair value of the transferred asset and the associated liability are accounted for consistently with each other in profit and loss or equity, following the general recognition criteria described previously, and are not offset. |
If the Group retains substantially all the risks and rewards of ownership of a transferred financial asset, the consideration received is recognised in equity. Transaction costs are recognised in profit and loss using the effective interest method.
F-31
GRIFOLS, S.A. AND SUBSIDIARIES
Notes to Consolidated Financial Statements
Hedging financial instruments are initially recognised using the same criteria as those described for financial assets and financial liabilities. Hedging financial instruments that do not meet the hedge accounting requirements are classified and measured as financial assets and financial liabilities at fair value through profit and loss. Derivative financial instruments which qualify for hedge accounting are initially measured at fair value.
At the inception of the hedge the Group formally designates and documents the hedging relationships and the objective and strategy for undertaking the hedges. Hedge accounting is only applicable when the hedge is expected to be highly effective at the inception of the hedge and in subsequent years in achieving offsetting changes in fair value or cash flows attributable to the hedged risk, throughout the period for which the hedge was designated (prospective analysis) and the actual effectiveness, which can be reliably measured, is within a range of 80%-125% (retrospective analysis).
The Group recognises the portion of the gain or loss on the measurement at fair value of a hedging instrument that is determined to be an effective hedge in other comprehensive income. The ineffective portion and the specific component of the gain or loss or cash flows on the hedging instrument, excluding the measurement of the hedge effectiveness, are recognised with a debit or credit to finance expenses or finance income.
If a hedge of a forecast transaction subsequently results in the recognition of a financial asset or a financial liability, the associated gains or losses that were recognised in other comprehensive income are reclassified from equity to profit or loss in the same period or periods during which the asset acquired or liability assumed affects profit or loss and under the same caption of the consolidated income statement (consolidated statement of comprehensive income).
| | (m) | Equity instruments (Parent shares) |
The Group’s acquisition of equity instruments of the Parent is recognised separately at cost of acquisition in the consolidated balance sheet as a reduction in equity, regardless of the motive of the purchase. Any gains or losses on transactions with treasury equity instruments are not recognised in consolidated profit or loss.
The subsequent redemption of Parent shares, where applicable, leads to a reduction in share capital in an amount equivalent to the par value of such shares. Any positive or negative difference between the cost of acquisition and the par value of the shares is debited or credited to accumulated gains.
Transaction costs related with the acquisition of treasury equity instruments of the Parent, including the issue costs related with a business combination, are accounted for as a deduction from equity, net of any tax effect.
Inventories are measured at the lower of cost and net realisable value. The cost of inventories comprises all costs of purchase, costs of conversion and other costs incurred in bringing the inventories to their present location and condition.
The costs of conversion of inventories include costs directly related to the units of production and a systematic allocation of fixed and variable production overheads that are incurred in converting. Fixed production overheads are allocated based on the higher of normal production capacity or actual level of production.
The cost of raw materials and other supplies, the cost of merchandise and costs of conversion are allocated to each inventory unit on a first-in, first-out (FIFO) basis.
The Group uses the same cost model for all inventories of the same nature and with a similar use within the Group.
Volume discounts extended by suppliers are recognised as a reduction in the cost of inventories when it is probable that the conditions for discounts to be received will be met. Discounts for prompt payment are recognised as a reduction in the cost of the inventories acquired.
The cost of inventories is adjusted against profit and loss when cost exceeds the net realisable value. Net realisable value is considered as follows:
| | • | | Raw materials and other supplies: replacement cost. Nevertheless, raw materials are not written down below cost if the finished goods into which they will be incorporated are expected to be sold at or above cost of production. |
F-32
GRIFOLS, S.A. AND SUBSIDIARIES
Notes to Consolidated Financial Statements
| | • | | Goods for resale and finished goods: estimated selling cost, less costs to sell. |
| | • | | Work in progress: the estimated selling price of related finished goods, less the estimated costs of completion and the estimated costs necessary to make the sale. |
The previously recognised reduction in value is reversed against profit and loss when the circumstances that previously caused inventories to be written down no longer exist or when there is clear evidence of an increase in net realisable value because of changed economic circumstances. The reversal of the reduction in value is limited to the lower of the cost and revised net realisable value of the inventories. Write-downs may be reversed with a credit to “changes in inventories of finished goods and work in progress” and “supplies”.
| | (o) | Cash and cash equivalents |
Cash and cash equivalents include cash on hand and demand deposits in financial institutions. They also include other short-term, highly liquid investments that are readily convertible to known amounts of cash and which are subject to an insignificant risk of changes in value. An investment normally qualifies as a cash equivalent when it has a maturity of less than three months from the date of acquisition.
The Group classifies cash flows relating to interest received and paid as operating activities, and dividends received and distributed by the Company are classified under investing and financing activities, respectively.
Government grants are recognised in the balance sheet when there is reasonable assurance that they will be received and that the Group will comply with the conditions attached.
Outright capital grants are initially recognised as deferred income in the consolidated balance sheet. Income from capital grants is recognised as other income in the consolidated income statement in line with the depreciation of the corresponding financed assets.
Operating grants received to offset expenses or losses already incurred, or to provide immediate financial support not related to future disbursements, are recognised as other income in the consolidated income statement.
| | (iii) | Interest rate grants |
Financial liabilities comprising implicit assistance in the form of below market interest rates are initially recognised at fair value. The difference between this value, adjusted where necessary for the emission costs of the financial liability and the amount received, is recognised as an official grant based on the nature of the grant awarded.
| | (i) | Defined contribution plans |
The Group recognises the contributions payable to a defined contribution plan in exchange for a service in the period in which contributions are accrued. Accrued contributions are recognised as an employee benefit expense in the corresponding consolidated income statement in the year that the contribution was made.
Termination benefits payable that do not relate to restructuring processes in progress are recognised when the Group is demonstrably committed to terminating the employment of current employees prior to retirement date. The Group is demonstrably committed to terminating the employment of current employees when a detailed formal plan has been prepared and there is no possibility of withdrawing or changing the decisions made.
F-33
GRIFOLS, S.A. AND SUBSIDIARIES
Notes to Consolidated Financial Statements
| | (iii) | Short-term employee benefits |
The Group recognises the expected cost of short-term employee benefits in the form of accumulating compensated absences when the employees render service that increases their entitlement to future compensated absences. In the case of non-accumulating compensated absences, the expense is recognised when the absences occur.
The Group recognises the expected cost of profit-sharing and bonus payments when it has a present legal or constructive obligation to make such payments as a result of past events and a reliable estimate of the obligation can be made.
Provisions are recognised when the Group has a present obligation (legal or implicit) as a result of a past event; it is probable that an outflow of resources embodying economic benefits will be required to settle the obligation; and a reliable estimate can be made of the amount of the obligation.
The amount recognised as a provision is the best estimate of the expenditure required to settle the present obligation at the end of the reporting period, taking into account all risks and uncertainties surrounding the amount to be recognised as a provision and, where the time value of money is material, the financial effect of discounting provided that the expenditure to be made each period can be reliably estimated. The discount rate is a pre-tax rate that reflects current market assessments of the time value of money and the risks specific to the liability. The discount rate does not reflect risks for which future cash flow estimates have been adjusted.
If it is not probable that an outflow of resources embodying economic benefits will be required to settle the obligation, the provision is reversed against the consolidated income statement item where the corresponding expense was recognised.
Revenue is measured at the fair value of the consideration received or receivable for the sale of goods and services, net of VAT and any other amounts or taxes which are effectively collected on the behalf of third parties. Volume or other types of discounts for prompt payment are recognised as a reduction in revenues if considered probable at the time of revenue recognition.
The Group recognises revenue from the sale of goods when:
| | • | | the Group has transferred to the buyer the significant risks and rewards of ownership of the goods. |
| | • | | the Group retains neither continuing managerial involvement to the degree usually associated with ownership nor effective control over the goods sold; |
| | • | | the amount of revenue can be measured reliably; |
| | • | | it is probable that the economic benefits associated with the transaction will flow to the Group; and |
| | • | | the costs incurred or to be incurred in respect of the transaction can be measured reliably. |
The Group participates in the government-managed Medicaid programmes in the United States, accounting for Medicaid rebates by recognising an accrual at the time a sale is recorded for an amount equal to the estimated claims for Medicaid rebates attributable to the sale. Medicaid rebates are estimated based on historical experience, legal interpretations of the applicable laws relating to the Medicaid programme and any new information regarding changes in the programme regulations and guidelines that would affect rebate amounts. Outstanding Medicaid claims, Medicaid payments and inventory levels are analysed for each distribution channel and the accrual is adjusted periodically to reflect actual experience. While rebate payments are generally made in the following or subsequent quarter, any adjustments for actual experience have not been material.
F-34
GRIFOLS, S.A. AND SUBSIDIARIES
Notes to Consolidated Financial Statements
Group Purchasing Organisations or other customers in the United States that have entered into contracts with the Group for purchases of Flebogamma are eligible for a pricing discount based on a minimum quantity of Flebogamma each month. These rebates are recognised as a reduction in sales and accounts receivable in the same month the sales are invoiced based on a combination of actual customer purchase data and on historical experience when the actual customer purchase data is reported later in time.
| | (ii) | Rendering of services |
Revenues associated with the rendering of service transactions are recognised by reference to the stage of completion at the consolidated balance sheet date when the outcome of the transaction can be estimated reliably. The outcome of a transaction can be estimated reliably when revenues, the stage of completion, the costs incurred and the costs to complete the transaction can be estimated reliably and it is probable that the economic benefits derived from the transaction will flow to the Group.
When the outcome of the transaction involving the rendering of services cannot be estimated reliably, revenue is recognised only to the extent of the expenses recognised that are recoverable.
| | (iii) | Revenue from dividends |
Revenue from dividends is recognised when the Group’s right to receive payment is established.
| | (iv) | Revenue from interest |
The Group recognises interest receivable from the different social security affiliated bodies, to which it provides goods or services, on an accruals basis, and only for those bodies to which historically claims have been made and from which interest has been collected.
The income tax expense and tax income for the year comprises current tax and deferred tax.
Current tax is the amount of income taxes payable or recoverable in respect of the consolidated taxable profit or consolidated tax loss for the year. Current tax assets or liabilities are measured at the amount expected to be paid to or recovered from the taxation authorities, using the tax rates and tax laws that have been enacted or substantially enacted at the balance sheet date.
Deferred tax liabilities are the amounts of income taxes payable in future periods in respect of taxable temporary differences, whereas deferred tax assets are the amounts of income taxes recoverable in future periods in respect of deductible temporary differences, the carryforward of unused tax losses, and the carryforward of unused tax credits. Temporary differences are differences between the carrying amount of an asset or liability in the balance sheet and its tax base.
Current and deferred tax are recognised as income or an expense and included in profit or loss for the year except to the extent that the tax arises from a transaction or event which is recognised, in the same or a different year, directly in equity, or a business combination.
| | (i) | Taxable temporary differences |
Taxable temporary differences are recognised in all cases except where:
| | • | | They arise from the initial recognition of goodwill or an asset or liability in a transaction which is not a business combination and at the time of the transaction, affects neither accounting profit nor taxable income; |
| | • | | They are associated with investments in subsidiaries over which the Group is able to control the timing of the reversal of the temporary difference and it is not probable that the temporary difference will reverse in the foreseeable future. |
F-35
GRIFOLS, S.A. AND SUBSIDIARIES
Notes to Consolidated Financial Statements
| | (ii) | Deductible temporary differences |
Deductible temporary differences are recognised provided that:
| | • | | It is probable that taxable profit will be available against which the deductible temporary difference can be utilised, unless the differences arise from the initial recognition of an asset or liability in a transaction which is not a business combination and at the time of the transaction, affects neither accounting profit nor taxable profit. |
| | • | | The temporary differences are associated with investments in subsidiaries to the extent that the difference will reverse in the foreseeable future and sufficient taxable income is expected to be generated against which the temporary difference can be offset. |
Tax planning opportunities are only considered on evaluation of the recoverability of deferred tax assets and if the Group intends to use these opportunities or it is probable that they will be utilised.
Deferred tax assets and liabilities are measured at the tax rates that are expected to apply to the years when the asset is realised or the liability is settled, based on tax rates and tax laws that have been enacted or substantively enacted. The tax consequences that would follow from the manner in which the Group expects to recover or settle the carrying amount of its assets or liabilities are also reflected in the measurement of deferred tax assets and liabilities.
At year end the Group reviews the fair value of deferred tax assets to write down the balance if it is not probable that sufficient taxable income will be available to apply the tax asset.
Deferred tax assets which do not meet the above conditions are not recognised in the consolidated balance sheet. At year end the Group assesses whether deferred tax assets which were previously not recognised already meet the conditions for recognition.
| | (iv) | Offset and recognition |
The Group only offsets current tax assets and current tax liabilities if it has a legally enforceable right to set off the recognised amounts and intends either to settle on a net basis, or to realise the asset and settle the liability simultaneously.
The Group only offsets deferred tax assets and liabilities where it has a legally enforceable right, where these relate to income taxes levied by the same taxation authority and where the taxation authority permits the entity to settle on a net basis, or to realise the asset and settle the liability simultaneously for each of the future years in which significant amounts of deferred tax assets or liabilities are expected to be settled or recovered.
Deferred tax assets and liabilities are recognised in the consolidated balance sheet under non-current assets or liabilities, irrespective of the expected date of recovery or settlement.
An operating segment is a component of the Group that engages in business activities from which it may earn revenues and incur expenses, whose operating results are regularly reviewed by the Group’s chief operating decision maker to make decisions about resources to be allocated to the segment, assess its performance and, based on which, differentiated financial information is available.
| | (v) | Classification of assets and liabilities as current and non-current |
The Group classifies assets and liabilities in the consolidated balance sheet as current and non-current. Current assets and liabilities are determined as follows:
| | • | | Assets are classified as current when, at closing date, they are expected to be realised, or are intended for sale or consumption in the Group’s normal operating cycle within twelve months after that date and they are held primarily for the purpose of trading. Cash and cash equivalents are also classified as current, except where they may not be exchanged or used to settle a liability, at least within twelve months after the balance sheet date. |
F-36
GRIFOLS, S.A. AND SUBSIDIARIES
Notes to Consolidated Financial Statements
| | • | | Liabilities are classified as current when they are expected to be settled in the Group’s normal operating cycle within 12 months after the balance sheet date and they are held primarily for the purpose of trading, or where the Group does not have an unconditional right to defer settlement of the liability for at least 12 months after the balance sheet date. |
| | • | | Financial liabilities are classified as current when they are due to be settled within twelve months after the reporting period, even if the original term was for a period longer than twelve months, and an agreement to refinance, or to reschedule payments, on a long-term basis is completed after the reporting period and before the consolidated financial statements are authorised for issue. |
| (5) | Financial Risk Management Policy |
The Group is exposed to the following risks associated with the use of financial instruments:
This note provides information on the Group’s exposure to each of these risks, the Group’s objectives and procedures to measure and mitigate this risk, and the Group’s capital management strategy. More exhaustive quantitative information is disclosed in note 32 to the consolidated financial statements.
The Group’s risk management policies are established in order to identify and analyse the risks to which the Group is exposed, establish suitable risk limits and controls, and control risks and compliance with limits. Risk management procedures and policies are regularly reviewed to ensure they take into account changes in market conditions and in the Group’s activities. The Group’s management procedures and rules are designed to create a strict and constructive control environment in which all employees understand their duties and obligations.
The Group’s Audit Committee supervises how management controls compliance with the Group’s risk management procedures and policies and reviews whether the risk management policy is suitable considering the risks to which the Group is exposed. This committee is assisted by Internal Audit which acts as supervisor. Internal Audit performs regular and ad hoc reviews of the risk management controls and procedures and reports its findings to the Audit Committee.
Credit risk
Credit risk is the risk to which the Group is exposed in the event that a customer or a counterparty to a financial instrument fails to discharge a contractual obligation, and mainly results from trade receivables and the Group’s investments in financial assets.
Trade receivables
The Group does not predict any bad debt risk as a result of delayed collections in some European countries due to their current economic situation. The primary risk in these countries is that of delayed payments, which is mitigated through the possibility of claiming interest as foreseen by prevailing legislation. No significant bad debt issues have been detected for sales to private entities.
The Group recognises impairment based on its best estimate of the losses incurred on trade and other receivables. The main impairment losses recognised are due to specific losses relating to individual risks identified as significant. At year end, these impairment losses are immaterial.
Details of exposure to credit risk are disclosed in note 32.
Liquidity risk
Liquidity risk is the risk that the Group cannot meet its financial obligations as they fall due. The Group’s approach to managing liquidity is to ensure where possible, that it always has sufficient liquidity to settle its obligations at the maturity date, both in normal conditions and in times of tension, to avoid incurring unacceptable losses or tarnishing the Group’s reputation.
F-37
GRIFOLS, S.A. AND SUBSIDIARIES
Notes to Consolidated Financial Statements
The Group manages liquidity risk on a prudent basis, using cash and sufficient committed credit facilities, enabling the Group to implement its business plans and carry out operations using stable and secure sources of financing.
During 2011 the Group obtained non-current financing of US Dollars 4,500 million. This financing comprises a non-current revolving credit line totalling US Dollars 300 million (unused at year end), a non-current loan consisting of two tranches amounting to US Dollars 3,100 million and an issue of corporate bonds of US Dollars 1,100 million. The resources generated through this financing have enabled the Group to acquire the Talecris group in the USA. The average maturity period of these loans is 5.3 years.
At 31 December 2011 the Group has total cash and cash equivalents of Euros 340.6 million. The Group also has more than Euros 400 million in unused credit facilities, including US Dollars 300 million on the revolving credit facility.
Market risk
Market risk comprises the risk of changes in market prices, for example, exchange rates, interest rates, or the prices of equity instruments affecting the Group’s revenues or the value of financial instruments it holds. The objective of managing market risk is to manage and control the Group’s exposure to this risk within reasonable parameters at the same time as optimising returns.
The Group operates internationally and is therefore exposed to currency risks when operating with foreign currencies, especially with regard to the US Dollar. Currency risk is associated with future commercial transactions, recognised assets and liabilities, and net investments in foreign operations.
The Group holds several investments in foreign operations, the net assets of which are exposed to currency risk. Currency risk affecting net assets of the Group’s foreign operations in US Dollars are mitigated primarily through borrowings in these foreign currencies.
The Group’s main exposure to currency risk is due to the US Dollar, which is used in a significant percentage of transactions in foreign currencies. Since revenues in US Dollars account for 93% of purchases and expenses in US Dollars since the acquisition of the Talecris Group (June to December 2011) (96% in 2010) the Group has a natural hedge as significant portion of revenues are also denominated in US Dollars and therefore the risks associated with such exchange-rate fluctuations are minimal.
Details of the Group’s exposure to currency risk at 31 December 2011 and 2010 of the most significant financial instruments are shown in note 32.
The Group’s interest rate risks arise from current and non-current borrowings. Borrowings at variable interest rates expose the Group to cash flow interest rate risks.
The purpose of managing interest-rate risk is to balance the debt structure, maintaining part of borrowings at fixed rates and hedging part of variable rate debt.
The Group manages cash flow interest rate risks through variable to fixed interest rate swaps.
A significant part of the financing obtained during 2011 accrues interest at fixed rates. This fixed interest debt (corporate bond) amounts to USD 1,100 million, which represents approximately 30% of the Group’s total debt in US dollars.
For the remaining senior debt in USD, which totals USD 2,493.5 million, the Group has contracted a variable to fixed interest rate swap. At 31 December 2011 the nominal part of this hedging instrument amounts to USD 1,522 million. This nominal part will decrease over the term of the debt, based on the scheduled repayments of the principal. The purpose of these swaps is to convert borrowings at variable interest rates into fixed interest rate debt. Through these swaps the Group undertakes to exchange the difference between fixed interest and variable interest with other parties periodically. The difference is calculated based on the contracted notional amount (see notes 17 (f) and 32). The notional amount of the swap contracted by the Group hedges 61% of the senior variable interest rate debt denominated in USD at 31 December 2011.
F-38
GRIFOLS, S.A. AND SUBSIDIARIES
Notes to Consolidated Financial Statements
Debt in Euros represents approximately 15% of the Group’s total debt at 31 December 2011. 98% of these liabilities are at variable rates. The Group manages cash flow interest rate risks through variable to fixed interest rate swaps. The nominal part of this hedging instrument amounts to Euros 100 million, representing hedging of 23% of the senior variable interest rate debt denominated in Euros at 31 December 2011 (see notes 17 (f) and 32).
The fair value of interest rate swaps contracted to reduce the impact of rises in variable interest rates (Libor and Euribor) is accounted for on a monthly basis. These derivative financial instruments comply with hedge accounting requirements.
The Group is exposed to price risk affecting equity instruments designated as available-for-sale.
The Group has signed two unquoted futures contracts, the underlying asset of which is shares in Grifols, S.A. It is therefore exposed to risk of value fluctuations.
Price risk affecting raw materials is mitigated by the vertical integration of the haemoderivatives business in a sector which is highly concentrated.
The directors’ policy is to maintain a solid capital base in order to ensure investor, creditor and market confidence and sustain future business development. The board of directors defines and proposes the level of dividends paid to shareholders.
The Group has no share-based payment schemes for employees.
At 31 December 2011 the Group holds treasury shares equivalent to 0.05% of its share capital (0.07% at 31 December 2010). The Group does not have a formal plan for repurchasing shares.
In accordance with IFRS 8 “Operating Segments”, financial information for operating segments is reported in the accompanying Appendix I, which forms an integral part of this note to the consolidated financial statements.
Group companies are divided into three areas: companies from the industrial area, companies from the commercial area and companies from the services area. Within each of these areas, activities are organised based on the nature of the products and services manufactured and marketed.
Assets, liabilities, income and expenses for segments include directly and reliably attributable items. Items which are not attributed to segments by the Group are:
| | • | | Balance sheet: cash and cash equivalents, receivables, public entities, deferred tax assets and liabilities, loans and borrowings and certain payables. |
| | • | | Income statement: general administration expenses, other operating income / expenses, finance income / expense and income tax. |
There have been no significant inter-segment sales.
The operating segments defined by the chief operating decision maker (Group’s steering committee) are as follows:
| | • | | Bioscience: including all activities related with products deriving from human plasma for therapeutic use. |
| | • | | Hospital: comprising all non-biological pharmaceutical products and medical supplies manufactured by Group companies earmarked for hospital pharmacy. Products related with this business which the Group does not manufacture but markets as supplementary to its own products are also included. |
| | • | | Diagnostic: including the marketing of diagnostic testing equipment, reagents and other equipment, manufactured by Group or other companies. |
| | • | | Raw materials: including sales of intermediate biological products and the rendering of manufacturing services to third party companies. |
F-39
GRIFOLS, S.A. AND SUBSIDIARIES
Notes to Consolidated Financial Statements
Details of net sales by groups of products for 2011, 2010 and 2009 as a percentage of net sales are as follows:
| | | | | | | | | | | | |
| | | % of sales | |
| | | 2011 | | | 2010 | | | 2009 | |
Bioscience | | | | | | | | | | | | |
Hemoderivatives | | | 85.2 | % | | | 77.9 | % | | | 76.0 | % |
Other hemoderivatives | | | 0.1 | % | | | 0.2 | % | | | 0.2 | % |
Diagnostic | | | | | | | | | | | | |
Transfusional medicine | | | 4.8 | % | | | 7.9 | % | | | 8.2 | % |
In vitro diagnosis | | | 1.7 | % | | | 3.1 | % | | | 3.1 | % |
Hospital | | | | | | | | | | | | |
Fluid therapy and nutrition | | | 2.9 | % | | | 5.0 | % | | | 5.2 | % |
Hospital supplies | | | 2.4 | % | | | 4.1 | % | | | 4.2 | % |
Raw materials | | | 1.7 | % | | | 0.5 | % | | | 2.5 | % |
Other | | | 1.2 | % | | | 1.3 | % | | | 0.6 | % |
| | | | | | | | | | | | |
Total | | | 100 | % | | | 100 | % | | | 100 | % |
| | | | | | | | | | | | |
| | (b) | Geographical information |
Geographical information is grouped into three areas:
| | • | | Rest of the European Union |
| | • | | United States of America |
The financial information reported for geographical areas is based on sales to third parties in these markets as well as the location of assets.
No customer represents 10% or more of the Group’s sales.
Details of and movement in this caption of the consolidated balance sheet at 31 December 2011 are as follows:
| | | | | | | | | | | | | | | | | | | | |
| | | Thousands of Euros | |
| | | Balances at
31/12/2010 | | | Transfers | | | Impairment | | | Translation
differences | | | Balances at
31/12/2011 | |
Net value | | | | | | | | | | | | | | | | | | | | |
Grifols UK.Ltd. (UK) | | | 7,982 | | | | — | | | | — | | | | 243 | | | | 8,225 | |
Grifols Italia.S.p.A. (Italy) | | | 6,118 | | | | — | | | | — | | | | — | | | | 6,118 | |
Biomat USA. Inc.(USA) | | | 113,052 | | | | — | | | | — | | | | 3,696 | | | | 116,748 | |
Plasmacare. Inc.(USA) | | | 38,464 | | | | — | | | | — | | | | 1,258 | | | | 39,722 | |
Woolloomooloo Holdings Pty Ltd. (Australia) | | | 23,832 | | | | — | | | | (13,000 | ) | | | 38 | | | | 10,870 | |
Talecris Biotherapeutics (USA) | | | — | | | | 1,538,723 | | | | — | | | | 174,695 | | | | 1,713,418 | |
| | | | | | | | | | | | | | | | | | | | |
| | | 189,448 | | | | 1,538,723 | | | | (13,000 | ) | | | 179,930 | | | | 1,895,101 | |
| | | | | | | | | | | | | | | | | | | | |
| | | | | | | (note 3 (a)) | | | | | | | | | | | | | |
F-40
GRIFOLS, S.A. AND SUBSIDIARIES
Notes to Consolidated Financial Statements
Impairment testing:
Until 2010 goodwill was allocated to each of the Group’s cash-generating units (CGUs) in accordance with their respective business segments and on a geographical basis, this being the lowest level at which goodwill was controlled by management for management purposes and lower than the operating segments. In 2010 Plasmacare, Inc. was integrated into the management of Biomat USA, Inc. for the purpose of impairment testing.
Goodwill was allocated to the cash generating units as follows:
| | • | | Italy: bioscience segment |
| | • | | USA: bioscience segment |
| | • | | Australia: mainly to the Diagnostics segment. |
As a result of the acquisition of Talecris in 2011, and for impairment testing purposes, the Group combines the CGUs allocated to the bioscience segment, grouping them together at segment level, because substantial synergies are expected to arise on the acquisition of Talecris, and in light of the vertical integration of the business and the lack of an independent organised market for the products.
Goodwill generated on the acquisition of Talecris is still provisional as estimation of the fair value of the acquired Company’s assets, liabilities and contingencies has not yet been completed (see note 3(a)).
The recoverable amount of the CGUs was determined based on their value in use. These calculations use cash flow projections based on the financial budgets approved by management. Cash flows estimated as of the year in which stable growth in the CGU has been reached are extrapolated using the estimated growth rates indicated below.
The key assumptions used in calculating impairment of the CGUs have been as follows:
| | | | | | | | | | | | |
| | | Growth rate | | Discount rate pre tax |
| | | 2011 | | | 2010 | | 2011 | | | 2010 |
Bioscience | | | 2 | % | | 2% - 3% | | | 11.7 | % | | 10.5% - 10.9% |
Diagnostic | | | 2 | % | | 2% | | | 11.4 | % | | 10.40% |
Management determined budgeted gross margins based on past experience and forecast market development. Average weighted growth rates are consistent with the forecasts included in industry reports. The discount rate used reflects specific risks related to the CGU.
As the recoverable amount of the CGUs is much higher than the carrying amount of the assets, specific information from the impairment test sensitivity analysis is not included.
Based on the results of the impairment test performed on the CGU in Australia, the Group recognised impairment of Euros 13 million for goodwill in 2011.
At 31 December 2011 Grifols’ stock market capitalisation totals Euros 3,723 million, being above the net equity book.
| (8) | Other Intangible Assets |
Details of other intangible assets and movement during the years ended 31 December 2011 and 2010 are included in Appendix II, which forms an integral part of these notes to the consolidated financial statements.
At 31 December 2011 other intangible assets include a provisional amount of Euros 909 million (US Dollars 1,177 million) reflecting the carrying amount of the products purchased from Talecris and currently commercialised by the Group. These products were allocated to the business combination at a fair value of US Dollars 1,200 million (see note 3(a)).
The cost of fully-amortised intangible assets in use at 31 December 2011 and 2010 is Euros 63,899 thousand and Euros 57,203 thousand, respectively.
The Group has recognised Euros 11,290 thousand (Euros 9,963 thousand at 31 December 2010 and Euros 11,823 thousand in 2009) as self-constructed assets.
F-41
GRIFOLS, S.A. AND SUBSIDIARIES
Notes to Consolidated Financial Statements
At 31 December 2011 the Group has licenses with indefinite useful lives under intangible assets for a carrying amount of Euros 25,283 thousand (Euros 24,691 thousand at 31 December 2010). The Group has also recorded an amount of Euros 17,372 thousand as costs of development in progress (Euros 11,492 thousand at 31 December 2010).
During 2010 the Group signed a distribution agreement for a new blood genotype test developed by Progenika Biopharma, acquiring a customer portfolio of Euros 1,358 thousand and which is recognised under “other intangible assets”.
At 31 December 2011, the Group has commitments to purchase intangible assets amounting to Euros 452 thousand.
Impairment testing:
Indefinite-lived intangible assets have been allocated to the cash-generating unit (CGU) of the bioscience segment. These assets have been tested for impairment together with goodwill.
| (9) | Property, Plant and Equipment |
Details of property, plant and equipment and movement in the consolidated balance sheet at 31 December 2011 and 2010 are included in Appendix III, which forms an integral part of this note to the consolidated financial statements.
Property, plant and developments under construction at 31 December 2011 and 2010 mainly comprise investments made to extend the companies’ equipments and to increase their productive capacity.
| | a) | Mortgaged property, plant and equipment |
At 31 December 2010 certain land and buildings had been mortgaged for Euros 49,316 thousand to secure payment of certain loans, which were repaid during 2011 (see note 22).
Group policy is to contract sufficient insurance coverage for the risk of damage to property, plant and equipment. At 31 December 2011 and 2010 the Group has a combined insurance policy for all Group companies, which adequately covers the carrying amount of all the Group’s assets.
At 1 January 2004 the Group opted to apply the exemption regarding fair value and revaluation as deemed cost as permitted by IFRS 1 First time Adoption of IFRS. In accordance with this exemption, the Group’s land and buildings were revalued based on independent expert appraisals at 1 January 2004. Appraisals were performed based on market values at that date.
At 31 December 2011 revalued assets total Euros 58,914 thousand.
| | d) | Assets under finance lease |
The Group had contracted the following types of property, plant and equipment under finance leases at 31 December 2010:
| | | | | | | | | | | | |
| | | Thousands of Euros | |
| Asset | | Cost | | | Accumulated
depreciation | | | Net
value | |
Technical installations and other property, plant and equipment | | | 15,264 | | | | (4,782 | ) | | | 10,482 | |
| | | | | | | | | | | | |
The Group has contracted the following types of property, plant and equipment under finance leases at 31 December 2011:
| | | | | | | | | | | | |
| | | Thousands of Euros | |
| Asset | | Cost | | | Accumulated
depreciation | | | Net
value | |
Land and Buildings | | | 3,687 | | | | (1,175 | ) | | | 2,512 | |
Technical installations and other property, plant and equipment | | | 33,398 | | | | (5,744 | ) | | | 27,654 | |
| | | | | | | | | | | | |
| | | 37,085 | | | | (6,919 | ) | | | 30,166 | |
| | | | | | | | | | | | |
Details of minimum lease payments and the present value of finance lease liabilities, disclosed by maturity date, are detailed in note 22 (a.1.3).
F-42
GRIFOLS, S.A. AND SUBSIDIARIES
Notes to Consolidated Financial Statements
During 2011 the Group signed a number of contracts for the sale and leaseback of a production plant and the corresponding machinery and other equipments to third party companies California Biogrif 330, LP and LA 300 Biological Financing, LP, respectively. The Group also entered into a 99-year lease contract with the same lessor for the land on which the plant sold is built. The lease for the plant has been considered as an operating lease while the lease for the machinery and other equipments has been considered a finance lease, taking into account the terms of the related purchase option (see note 9h (ii)).
| | e) | Fully-depreciated assets |
The cost of fully depreciated property, plant and equipment in use at 31 December 2011 and 2010 is Euros 113,567 thousand and Euros 98,978 thousand, respectively.
| | f) | Self – constructed non-current assets |
At 31 December 2011 the Group has recognised Euros 23,258 thousand as work carried out for property, plant and equipment (Euros 23,550 thousand at 31 December 2010 and Euros 29,319 thousand at 31 December 2009).
At 31 December 2011 the Group has property, plant and equipment purchase commitments amounting to Euros 26,950 thousand (Euros 6,148 thousand at 31 December 2010).
| | (i) | Sale and leaseback of Spanish properties |
On 10 May 2011 the Group sold five properties located in Spain to Gridpan Invest, S.L., a wholly owned subsidiary of Scranton Enterprises, B.V., a shareholder of Grifols, S.A., for Euros 80.4 million (see note 33). These properties related to non-strategic assets such as offices, warehouses and factory premises. Two of the properties were sold in conjunction with their related mortgage loans, which amounted to Euros 53.5 million.
As a result of this operation, the Group incurred a net loss of Euros 7.4 million, which includes Euros 2 million in brokerage fees paid to a related company (see note 33). The prices paid for the properties were established based on the appraisals performed by independent appraisers.
At the same time, operating lease agreements for the aforementioned properties were entered into with Gridpan Invest, S.L., the main terms of which were as follows:
| | • | | Compulsory initial term of five years |
| | • | | Initial rent established at market prices and subject to annual review, based on the percentage variation in the Spanish Consumer Price Index (CPI) |
| | • | | Automatic extensions for five-year periods that can be avoided by both parties by giving a six months notice. |
| | • | | Upon vacating the premises, Grifols will be compensated by the lessor for any on-site assets in which it has invested, insofar as these have a residual value and are not recoverable by Grifols. |
Grifols also signed a purchase option on the shares of Gripdan Invest, S.L., which is exercisable between 10 May 2016 and 10 May 2017 and for which no consideration was required. The exercise price will be calculated as the exercise date market value, as determined by independent appraisers.
The lease expense incurred by the Group in 2011 for these contracts amounted to Euros 4,909 thousand, coinciding fully with the minimum contractually-agreed payments.
| | (ii) | Sale and leaseback of properties, machinery and other equipment in the USA |
Los Angeles, CA, USA
On 9 June 2011 the Group signed various contracts for the sale and leaseback of a production plant located in Los Angeles, CA, USA with its machinery and other equipment to institutional investors California Biogrif 330, LP and LA 300 Biological Financing, LP, respectively. The Group also signed a 99 year lease contract with the same lessor for the land on which the sold plant is built. An amount of US Dollars 35.4 million (Euros 24.6 million) was received for the sale of the plant, whilst an amount of US Dollars 23.8 million (Euros 16.5 million) was received for the sale of the machinery and other equipment.
F-43
GRIFOLS, S.A. AND SUBSIDIARIES
Notes to Consolidated Financial Statements
The plant lease has been considered an operating lease whilst the lease on the machinery and other equipment is considered a finance lease in accordance with the terms of the purchase option. As a result of the sale of the plant, the Group has incurred a net loss of US Dollars 2.4 million (Euros 1.3 million), mainly due to the expenses incurred by the Group during the operation.
The main terms of the plant operating lease contract are as follows:
| | • | | Compulsory initial term of 20 years |
| | • | | Initial rent established at market prices and subject to an annual 3% increase. On the first day of the sixth year, the rent remaining up until the 20th year will be paid in advance. |
| | • | | Option to extend the lease by a ten-year period at the discretion of the Grifols Group. |
| | • | | Awarding of purchase options in the sixth and 20th years at a market price to be determined by independent appraisers. |
The main terms of the finance lease contract for the machinery and other equipment are: a compulsory term of five years and sixty (60) monthly payments of US Dollars 529 thousand (Euros 369 thousand). The lease contract is non-extendable and anticipates the repurchase of the machinery and other equipment for the amount of US Dollars 1 on expiry of the lease term.
The rental expense incurred by the Group in 2011 for the operating contracts amounted to US Dollars 1,496 thousand (Euros 1,076 thousand), coinciding fully with the minimum contractually-agreed payments.
North Carolina, NC, USA
On 29 December 2011, the Group signed a number of contracts for the sale and leaseback of certain buildings and equipment under construction (jointly denominated “New Fractionation Facility” or “NFF”), located in Clayton, North Carolina (USA), with the related company Scranton Enterprises USA, Inc, (hereinafter “Scranton”) (see note 33).
The sale price was USD 199 million (Euros 152 million), which has been collected as follows:
| | • | | In December 2011 the Group received USD 115 million (Euros 88 million). |
| | • | | The Group is pending receipt of USD 84 million (Euros 65 million), before 30 June 2012 (see note 13). This balance is not subject to interest. |
As a result of the transaction, the Group has incurred a net loss of US Dollars 12.1 million (Euros 8,9 million), primarily due to the brokerage fees paid to a related company, which amounted to US Dollars 10 million (see note 33).
The main terms of the operating lease contract for the building are as follows:
| | • | | Initial mandatory lease period: eight years. |
| | • | | The annual rent has been established at a minimum of USD 20.5 million, subject to annual increases in line with inflation. |
| | • | | Option enabling Grifols to renew and extend the contract for a further five years. |
| | • | | Automatic renewal for additional five-year periods unless one of the parties gives six months’ notice to the contrary. |
| | • | | Upon vacating the premises, Grifols will be compensated by the lessor for any on-site assets in which it has invested, insofar as these have a residual value and are not recoverable by Grifols. |
| | • | | Upon request from Scranton Enterprises USA Inc., Grifols will have to lodge a cash or bank guarantee of US Dollars 25 million. |
The main terms of the lease contract for the land on which the NFF building is located are as follows:
| | • | | Initial lease period: 99 years |
| | • | | The annual rent has been established at a minimum of USD 1 per year. |
Grifols also contracted a purchase option on the shares of Scranton Investments, B.V., a shareholder of Scranton Enterprises USA, Inc. This option, which has a cost of US Dollars 4 million (see note 32), can be exercised on the date on which the license is granted by the Food and Drug Administration (FDA), at five and ten years from that date, and on the expiry date of the lease contract. The purchase price will vary depending on the market value determined on the date the option is exercised.
F-44
GRIFOLS, S.A. AND SUBSIDIARIES
Notes to Consolidated Financial Statements
| (10) | Equity-Accounted Investments |
Because the Group had significant influence over these companies, the consolidation method used was the equity method.
Details of and movement in this caption in the consolidated balance sheet at 31 December 2009 are as follows:
| | | | | | | | | | | | | | | | |
| | | Thousands of Euros | |
| | | Balances at
31/12/08 | | | Attributable
profit / loss | | | Translation
differences | | | Balances at
31/12/09 | |
Equity accounted investments | | | 374 | | | | 51 | | | | (42 | ) | | | 383 | |
At 31 December 2009 equity accounted investments comprised the investment held by Diagnostic Grifols, S.A. in the company Quest International, Inc. This company is located in Miami, Florida (USA) and its activity consists of the manufacture and commercialisation of reagents and clinical analysis instruments. On 9 November 2010 the Group sold the interest that Diagnostic Grifols, S.A. had in Quest International, Inc. at a sale price of Euros 621 thousand.
Details of and movement in this caption in the consolidated balance sheet at 31 December 2010 are as follows:
| | | | | | | | | | | | | | | | | | | | | | | | |
| | | Thousands of Euros | |
| | | Balances at
31/12/09 | | | Attributable
profit / loss | | | Disposals | | | Acquisitions | | | Translation
differences | | | Balances at
31/12/10 | |
Equity accounted investments | | | 383 | | | | (879 | ) | | | (463 | ) | | | 1,472 | | | | 85 | | | | 598 | |
The balance at 31 December 2010 reflects the investment which Gri-Cel, S.A. holds in Nanotherapix, S.L. (see note 2 (c)), a joint venture accounted for using the equity method.
Details of and movement in this caption of the consolidated balance sheet at 31 December 2011 are as follows:
| | | | | | | | | | | | | | | | |
| | | Thousands of Euros | |
| | | Balances at
31/12/10 | | | Attributable
profit/loss | | | Acquisitions | | | Balances at
31/12/11 | |
Equity accounted investments | | | 598 | | | | (1,064 | ) | | | 1,467 | | | | 1,001 | |
Summarised financial information on the equity accounted investments is as follows:
| | | | | | | | | | | | | | | | | | | | | | | | |
| | | | | | Percentage
ownership | | | Thousands of Euros | |
| | | Country | | | | Assets | | | Liabilities | | | Equity | | | Result | |
31/12/2009 | | | | | | | | | | | | | | | | | | | | | | | | |
Quest International, | | | USA | | | | 35 | % | | | 1,664 | | | | 580 | | | | 1,084 | | | | 145 | |
| | | | | | | | | | | | | | | | | | | | | | | | |
31/12/2010 | | | | | | | | | | | | | | | | | | | | | | | | |
Nanotherapix, S,L, | | | Spain | | | | 51 | % | | | 2,375 | | | | 1,212 | | | | 1,163 | | | | (312 | ) |
| | | | | | | | | | | | | | | | | | | | | | | | |
31/12/2011 | | | | | | | | | | | | | | | | | | | | | | | | |
Nanotherapix, S,L, | | | Spain | | | | 51 | % | | | 3,364 | | | | 1,401 | | | | 1,963 | | | | (672 | ) |
| | | | | | | | | | | | | | | | | | | | | | | | |
| (11) | Non-Current Financial Assets |
Details of this caption of the consolidated balance sheet at 31 December 2011, 2010 and 2009 are as follows:
| | | | | | | | | | | | |
| | | Thousands of Euros | |
| | | 31/12/2011 | | | 31/12/2010 | | | 31/12/2009 | |
Non-current guarantee deposits | | | 3,555 | | | | 1,217 | | | | 1,142 | |
Assets available for sale | | | 0 | | | | 535 | | | | 501 | |
Non-current derivatives (note 32) | | | 3,091 | | | | 0 | | | | 0 | |
Loans to third parties | | | 5,755 | | | | 5,783 | | | | 2,088 | |
| | | | | | | | | | | | |
Non-current financial assets | | | 12,401 | | | | 7,535 | | | | 3,731 | |
| | | | | | | | | | | | |
F-45
GRIFOLS, S.A. AND SUBSIDIARIES
Notes to Consolidated Financial Statements
At 31 December 2010 and 2011 loans to third parties primarily comprise three mortgage loans extended to the owners of several plasma centres. These loans have a term of 20 years, bear interest at fixed rates and have been secured with mortgage collateral and personal guarantees.
At 31 December 2010, available-for-sale assets relate to the following:
| | • | | The interest of less than 1% that the Group holds in Northfield Laboratories, Inc. (USA). At 31 December 2010 and 2009 provision has been made for the full amount of this investment, based on its fair value. |
| | • | | The interest of less than 2% in the share capital of biotechnology company, Cardio 3 Bioscience (with registered offices in Belgium) acquired by Grifols, S.A. in December 2008 for an amount of Euros 500 thousand. The activity of this company involves research into and the development of biological therapies using stem cells for the treatment of cardiovascular diseases. The Group has measured this asset at cost, as its fair value cannot be reliably determined. In 2011 provision has been made for the full amount of this investment. |
Details of inventories at 31 December 2011 and 2010 are as follows:
| | | | | | | | |
| | | Thousands of Euros | |
| | | 2011 | | | 2010 | |
Goods for resale | | | 89,562 | | | | 64,724 | |
Raw materials and other supplies | | | 360,977 | | | | 161,902 | |
Work in progress and semi-finished goods | | | 390,813 | | | | 204,776 | |
Finished goods | | | 224,531 | | | | 101,047 | |
| | | | | | | | |
| | | 1,065,883 | | | | 532,449 | |
| | | | | | | | |
Less, obsolescence provision | | | (35,542 | ) | | | (4,584 | ) |
| | | | | | | | |
| | | 1,030,341 | | | | 527,865 | |
| | | | | | | | |
Changes in inventories of finished goods, work in progress and supplies were as follows:
| | | | | | | | | | | | |
| | | Thousands of Euros | |
| | | 31/12/2011 | | | 31/12/2010 | | | 31/12/2009 | |
| | | * | | | * | | | * | |
Inventories of goods for resale | | | | | | | | | | | | |
Net purchases | | | 240,421 | | | | 56,542 | | | | 50,886 | |
Changes in inventories | | | (37,769 | ) | | | 5,237 | | | | (9,201 | ) |
| | | | | | | | | | | | |
| | | 202,652 | | | | 61,779 | | | | 41,685 | |
Raw materials and supplies | | | | | | | | | | | | |
Net purchases | | | 235,119 | | | | 225,994 | | | | 274,537 | |
Changes in inventories | | | (7,013 | ) | | | 13,864 | | | | (29,948 | ) |
| | | | | | | | | | | | |
| | | 228,106 | | | | 239,858 | | | | 244,589 | |
| | | | | | | | | | | | |
Inventories provision | | | 794 | | | | 3,181 | | | | — | |
| | | | | | | | | | | | |
Supplies | | | 431,552 | | | | 304,818 | | | | 286,274 | |
Changes in inventories of finished goods and work in progress | | | 28,611 | | | | (47,082 | ) | | | (73,093 | ) |
Inventories provision | | | 6,539 | | | | 1,333 | | | | — | |
| | | | | | | | | | | | |
Changes in inventories of finished goods and work in progress | | | 35,150 | | | | (45,749 | ) | | | (73,093 | ) |
Changes in inventories of finished products , work in progress and supplies | | | 466,702 | | | | 259,069 | | | | 213,181 | |
| | | | | | | | | | | | |
F-46
GRIFOLS, S.A. AND SUBSIDIARIES
Notes to Consolidated Financial Statements
Changes in goods for resale during 2011, 2010 and 2009 are as follows:
| | | | | | | | | | | | |
| | | Thousands of Euros | |
| | | 2011 | | | 2010 | | | 2009 | |
Goods for resale at 1 January | | | 64,724 | | | | 65,718 | | | | 54,509 | |
Business combinations | | | — | | | | — | | | | 158 | |
Net cancellations for the year | | | — | | | | — | | | | (568 | ) |
Increase / (decrease) of goods for resale | | | 37,769 | | | | (5,237 | ) | | | 9,201 | |
Translation differences | | | (12,931 | ) | | | 4,243 | | | | 2,418 | |
| | | | | | | | | | | | |
Inventories of goods for resale at 31 December | | | 89,562 | | | | 64,724 | | | | 65,718 | |
| | | | | | | | | | | | |
Changes in inventories of raw materials and supplies during 2011, 2010 and 2009 have been as follows:
| | | | | | | | | | | | |
| | | Thousands of Euros | |
| | | 2011 | | | 2010 | | | 2009 | |
Inventories of raw materials at 1 January | | | 161,902 | | | | 170,987 | | | | 142,209 | |
Business combinations | | | 172,942 | | | | — | | | | 824 | |
Net cancellations for the year | | | (1,564 | ) | | | — | | | | — | |
Increase / (decrease) in raw materials | | | 7,013 | | | | (13,864 | ) | | | 29,948 | |
Transaction costs on the adquisition of Talecris | | | — | | | | (2,041 | ) | | | — | |
Translation differences | | | 20,684 | | | | 6,820 | | | | (1,994 | ) |
| | | | | | | | | | | | |
Inventories of raw material at 31 December | | | 360,977 | | | | 161,902 | | | | 170,987 | |
| | | | | | | | | | | | |
Changes in inventories of finished goods and work in progress during 2011, 2010 and 2009 are as follows:
| | | | | | | | | | | | |
| | | Thousands of Euros | |
| | | 2011 | | | 2010 | | | 2009 | |
Inventories of finished goods and work in progress at 1 January | | | 305,823 | | | | 247,757 | | | | 176,939 | |
Business combinations | | | 317,037 | | | | — | | | | 2,567 | |
Net cancellations for the year | | | (16,038 | ) | | | — | | | | — | |
Increase / (decrease) in inventories of finished goods and work in progress | | | (28,611 | ) | | | 47,082 | | | | 73,093 | |
Translation differences | | | 37,133 | | | | 10,984 | | | | (4,842 | ) |
| | | | | | | | | | | | |
Inventories of finished goods and work in progress at 31 December | | | 615,344 | | | | 305,823 | | | | 247,757 | |
| | | | | | | | | | | | |
Net purchases include purchases made in the following foreign currencies:
| | | | | | | | | | | | |
| | | Thousands of Euros | |
| | | 31/12/2011 | | | 31/12/2010 | | | 31/12/2009 | |
Currency | | | | | | | | | | | | |
US Dollar | | | 320,535 | | | | 145,584 | | | | 196,936 | |
Other currencies | | | 8,273 | | | | 6,569 | | | | 4,498 | |
Movement in the inventory provision was as follows:
| | | | | | | | | | | | |
| | | Thousands of Euros | |
| | | 31/12/2011 | | | 31/12/2010 | | | 31/12/2009 | |
Balance at 1 January | | | 4,584 | | | | — | | | | 559 | |
Net charge for the year | | | 7,333 | | | | 4,514 | | | | — | |
Business combinations | | | 37,668 | | | | — | | | | — | |
Net cancellations for the year | | | (17,315 | ) | | | — | | | | (568 | ) |
Translation differences | | | 3,272 | | | | 70 | | | | 9 | |
| | | | | | | | | | | | |
Balance at 31 December | | | 35,542 | | | | 4,584 | | | | — | |
| | | | | | | | | | | | |
F-47
GRIFOLS, S.A. AND SUBSIDIARIES
Notes to Consolidated Financial Statements
| (13) | Trade and Other Receivables |
Details at 31 December 2011 and 2010 are as follows:
| | | | | | | | |
| | | Thousands of Euros | |
| | | 31/12/2011 | | | 31/12/2010 | |
Trade receivables | | | 408,263 | | | | 224,355 | |
Debtors, sundry | | | 91,976 | | | | 31,012 | |
Associates | | | 17 | | | | 5 | |
Personnel | | | 294 | | | | 366 | |
Advances for fixed assets | | | 228 | | | | 494 | |
Other advances | | | 5,843 | | | | 3,265 | |
Public entities, other receivables | | | 10,258 | | | | 8,890 | |
| | | | | | | | |
Other receivables | | | 108,616 | | | | 44,032 | |
Current income tax assets | | | 15,110 | | | | 14,607 | |
| | | | | | | | |
| | | 531,989 | | | | 282,994 | |
| | | | | | | | |
Trade receivables
Trade receivables, net of the provision for bad debts, include notes receivable discounted at banks and pending maturity at 31 December 2011, which amount to Euros 1,153 thousand (Euros 1,396 thousand at 31 December 2010) (see note 22).
Trade receivables include balances in the following foreign currencies:
| | | | | | | | |
| | | Thousands of Euros | |
| | | 31/12/2011 | | | 31/12/2010 | |
Currency | | | | | | | | |
US Dollar | | | 149,059 | | | | 52,466 | |
Chilean Peso | | | 12,574 | | | | 17,008 | |
Mexican Peso | | | 11,982 | | | | 10,583 | |
Argentinean Peso | | | 4,919 | | | | 4,075 | |
Brazilian Real | | | 3,339 | | | | 4,616 | |
Czech Crown | | | 2,658 | | | | 3,030 | |
Pound Sterling | | | 3,017 | | | | 3,116 | |
Thai Baht | | | 1,514 | | | | 1,842 | |
Polish Zloty | | | 2,668 | | | | 2,379 | |
Australian Dollar | | | 2,648 | | | | 3,769 | |
Other currencies | | | 2,071 | | | | 2,412 | |
Other receivables
Other receivables at 31 December 2011 and 2010 include:
Euros 7,988 thousand (Euros 6,639 thousand at 31 December 2010) reflecting delay interest receivable from social security-affiliated bodies.
USD 84 million (Euros 65 million) receivable from Scranton Enterprises USA, Inc in respect of the sale of the property included in the NFF transaction (see note 9). This amount has been recognised at present value as of 31 December 2011 as it does not accrue interest and consequently the balance receivable totals Euros 63 million.
During 2011, 2010 and 2009 certain Spanish companies of the Grifols Group have sold receivables from several public entities, without recourse, to Deutsche Bank, S.A.E. Under these contracts, the Group receives an initial payment which usually amounts to approximately 90% of the nominal amount of the receivables sold less the associated transaction costs. The deferred collection (equivalent to the rest of the nominal amount) will be made by the Group once Deutsche Bank has collected the nominal amount
F-48
GRIFOLS, S.A. AND SUBSIDIARIES
Notes to Consolidated Financial Statements
of the receivables (or the interest, if the balances are received after more than 36 months, depending on the terms of each particular contract) and this amount is recognised in the balance sheet as a balance receivable from Deutsche Bank. At 31 December 2011 Euros 19,286 thousand is receivable in this respect (Euros 19,504 thousand at 31 December 2010). Deutsche Bank makes the initial payment when the sale is completed and therefore, the bad debt risk associated with this part of the nominal amount of the receivables is transferred. The Group has transferred the credit risk and control of the receivables to Deutsche Bank and has therefore derecognised the asset transferred, as the risks and rewards inherent to ownership have not been substantially retained.
Certain foreign group companies and one Spanish company have also entered into a contract to sell receivables without recourse to various financial institutions.
Total balances receivable without recourse sold to financial institutions through the aforementioned contracts in 2011 amount to Euros 157 million in 2011 (Euros 185.2 million in 2010).
The finance cost of these operations for the Group totals approximately Euros 6,185 thousand which has been recognised under finance costs in the consolidated income statement for 2011 (Euros 5,378 thousand in 2010 and Euros 2,531 thousand in 2009) (see note 28).
Details of balances with related parties are shown in note 33.
Receivables from public entities are as follows:
| | | | | | | | |
| | | Thousands of Euros | |
| | | 31/12/2011 | | | 31/12/2010 | |
Taxation authorities, VAT | | | 9,258 | | | | 8,191 | |
Social Security | | | 82 | | | | 85 | |
Other public entities | | | 918 | | | | 614 | |
| | | | | | | | |
Public entities, other receivables | | | 10,258 | | | | 8,890 | |
| | | | | | | | |
Current tax assets
Current tax assets are as follows:
| | | | | | | | |
| | | Thousands of Euros | |
| | | 31/12/2011 | | | 31/12/2010 | |
Recoverable income tax: | | | | | | | | |
Current year | | | 9,528 | | | | 9,352 | |
Prior years | | | 5,582 | | | | 5,255 | |
| | | | | | | | |
Current tax assets | | | 15,110 | | | | 14,607 | |
| | | | | | | | |
| (14) | Other Current Financial Assets |
Details of this caption of the consolidated balance sheet at 31 December 2011 and 2010 are as follows:
| | | | | | | | |
| | | Thousands of Euros | |
| | | 31/12/2011 | | | 31/12/2010 | |
Current investments | | | 10,608 | | | | 12,387 | |
Guarantee deposits | | | — | | | | 44 | |
Current loans to third parties | | | 2,677 | | | | 515 | |
Financial derivatives (note 32) | | | 3,619 | | | | — | |
| | | | | | | | |
Total other current financial assets | | | 16,904 | | | | 12,946 | |
| | | | | | | | |
“Current financial investments” comprise current guarantee deposits held in financial institutions.
F-49
GRIFOLS, S.A. AND SUBSIDIARIES
Notes to Consolidated Financial Statements
Details of this caption of the consolidated balance sheet at 31 December 2011 and 2010 are as follows:
| | | | | | | | |
| | | Thousands of Euros | |
| | | 31/12/2011 | | | 31/12/2010 | |
Prepaid expenses – professional services | | | 2,188 | | | | 72,983 | |
Prepaid expenses – insurance | | | 1,276 | | | | 3,508 | |
Royalties and rentals | | | 1,759 | | | | 2,589 | |
Other prepaid expenses | | | 4,172 | | | | 1,548 | |
| | | | | | | | |
Total other current assets | | | 9,395 | | | | 80,628 | |
| | | | | | | | |
At 31 December 2010 prepaid expenses for professional services primarily comprised costs relating to the share capital increase, which were taken to equity when the capital increase was performed. Additionally, this item also included costs relating to the issue of senior debt and corporate bonds that were deducted from the financial liability when recognised (2 June 2011) (see note 22).
| (16) | Cash and Cash Equivalents |
Details of this caption of the consolidated balance sheet at 31 December 2011 and 2010 are as follows:
| | | | | | | | |
| | | Thousands of Euros | |
| | | 31/12/2011 | | | 31/12/2010 | |
Current deposits | | | 52,908 | | | | 211,564 | |
Cash at banks | | | 287,678 | | | | 28,085 | |
| | | | | | | | |
Total cash and cash equivalents | | | 340,586 | | | | 239,649 | |
| | | | | | | | |
The Group has performed certain financing and/or investment operations that have not required the use of cash or cash equivalents:
| | • | | The Group sold properties in Spain and the US for an amount of Euros 214 million (excluding the outstanding balance of Euros 63 million). These properties had mortgages of Euros 53.5 million and the net cash inflow for these transactions amounts to Euros 160 million (see note 9). |
| | • | | Part of the payment for the acquisition of Talecris was made through the distribution of Class B shares (see note 3). The issue of Class B shares has had no impact on cash. |
Details of cash and cash equivalents at 31 December 2011 and 2010 by currency are as follows:
| | | | | | | | |
| | | Thousands of Euros | |
| | | 31/12/2011 | | | 31/12/2010 | |
Currency | | | | | | | | |
Euro | | | 105,308 | | | | 4,268 | |
US Dollar | | | 225,053 | | | | 202,942 | |
Other currency | | | 10,225 | | | | 32,439 | |
| | | | | | | | |
| | | 340,586 | | | | 239,649 | |
| | | | | | | | |
Details of consolidated equity and changes are shown in the consolidated statement of changes in equity, which forms an integral part of this note to the consolidated financial statements.
F-50
GRIFOLS, S.A. AND SUBSIDIARIES
Notes to Consolidated Financial Statements
At 31 December 2010 and 2009 the Company’s share capital is represented by 213,064,899 ordinary shares of Euros 0.50 par value each, which are subscribed and fully paid and have the same voting and profit-sharing rights.
At the extraordinary general shareholders’ meeting held on 25 January 2011, the shareholders of Grifols agreed to increase share capital by issuing 83,811,688 new shares without voting (Class B shares) rights to complete the acquisition of Talecris. The Class B non-voting shares were listed on the NASDAQ (USA) and the Spanish Automated Quotation System (SIBE/Continuous Market).
At the extraordinary general shareholders’ meeting held on 2 December 2011, the shareholders of Grifols agreed to increase share capital with a charge to voluntary reserves by issuing 29,687,658 new shares without voting rights to remunerate the shareholders.
On 1 June 2011 the Company announced that the “Nota sobre Acciones” (Securities Note) requested for the flotation of Class B Shares was registered. Grifols requested the flotation of the Class B Shares on the Stock Exchanges of Madrid, Barcelona, Bilbao and Valencia, as well as on the Spanish Automated Quotation System (“mercado continuo”) and, through the American Depositary Shares (ADSs), on the National Association of Securities Dealers Automated Quotation (NASDAQ). The trading of Class B Shares on the Spanish Automated Quotation System and the ADSs on the NASDAQ started on 2 June 2011.
At 31 December 2011, the Company’s share capital amounts to Euros 117,882,384 and comprises:
| | • | | Class A shares: 213,064,899 ordinary shares of Euros 0.50 par value each, subscribed and fully paid and of the same class and series. |
| | • | | Class B shares: 113,499,346 non-voting preference shares of 0.10 Euros par value each, of the same class and series, and with the preferential rights set forth in the Company’s by-laws. |
The fair value of the Class B shares issued in June 2011 has been estimated based on their market value during the first few weeks of listing as they were first listed on 2 June 2011. The positive difference, totalling Euros 52,864 thousand, arises from the difference between their fair value assigned by deed (Euros 776,935 thousand) and their fair value (Euros 829,799 thousand), and has been recognised in reserves.
The main characteristics of the Class B shares are as follows:
| | • | | Each Class B share entitles its holder to receive a minimum annual preferred dividend out of the distributable profits at the end of each year equal to Euros 0.01 per Class B share if the aggregate preferred dividend does not exceed the distributable profits for that year and provided that the distribution of dividends has been approved by the Company’s shareholders. This preferred dividend is not cumulative if no sufficient distributable profits are obtained in the year. |
| | • | | Each Class B share is entitled to receive, in addition to the preferred dividend referred to above, the same dividends and other distributions as one Grifols ordinary share. |
| | • | | Each Class B share entitles the holder to its redemption under certain circumstances, if a tender offer for all or part of the shares in the Company has been made, except if holders of Class B shares have been entitled to participate in such an offer on the same terms as holders of Class A shares. The redemption terms and conditions reflected in the Company’s by-laws limit the amount that may be redeemed, requiring that sufficient distributable reserves be available, and limit the percentage of shares to be redeemed in line with the ordinary shares to which the offer is addressed. |
| | • | | In the event the Company were to be wound up and liquidated, each Class B share entitles the holder to receive, before any amounts are paid to holders of ordinary shares, an amount equal to the sum of (i) the par value of each Class B share, and (ii) the share premium paid for the Class B share when it was subscribed. Each holder is entitled to receive, in addition to the Class B liquidation preference amount, the same liquidation amount that is paid for each ordinary share. |
These shares are freely transferable.
F-51
GRIFOLS, S.A. AND SUBSIDIARIES
Notes to Consolidated Financial Statements
The Company only has information on the identity of its shareholders when this information is provided voluntarily or to comply with prevailing legislation. Based on the information available to the Company, its most significant shareholders with voting shares at 31 December 2011 and 2010 are as follows:
| | | | | | | | |
| | | Percentage ownership | |
| | | 31/12/2011 | | | 31/12/2010 | |
Capital Research and Management Company | | | 15.02 | % | | | 10.02 | % |
Other | | | 84.98 | % | | | 89.98 | % |
| | | | | | | | |
| | | 100.00 | % | | | 100.00 | % |
| | | | | | | | |
Movement in the share premium is described in the consolidated statement of changes in equity, which forms an integral part of this note to the consolidated financial statements.
The drawdown of reserves is subject to legislation applicable to each of the Group companies. At 31 December 2011, Euros 29,705 thousand equivalent to the carrying amount of development costs pending amortisation of certain Spanish companies (Euros 28,876 thousand at 31 December 2010) (see note 8) are, in accordance with applicable legislation, restricted reserves which cannot be distributed until these development costs have been amortised.
Companies in Spain are obliged to transfer 10% of each year’s profits to a legal reserve until this reserve reaches an amount equal to 20% of share capital. This reserve is not distributable to shareholders and may only be used to offset losses if no other reserves are available. Under certain conditions it may be used to increase share capital provided that the balance left on the reserve is at least equal to 10% of the nominal value of the total share capital after the increase.
At 31 December 2011 the legal reserve of the Company has been fully appropriated and amounts to Euros 21,306 thousand (Euros 21,306 thousand at 31 December 2010).
Distribution of the legal reserves of Spanish companies is subject to the same restrictions as those of the Company and at 31 December 2011 and 2010 the balance of the legal reserve of other Spanish companies amounts to Euros 2,106 thousand.
Other foreign Group companies have a legal reserve amounting to Euros 687 thousand (Euros 692 thousand at 31 December 2010).
During the years 2010 and 2011 the Company has carried out the following operations with Class A treasury shares:
| | | | | | | | |
| | | No. of shares | | | Thousands of Euros | |
Balance at 1 January 2010 | | | 53,326 | | | | 677 | |
Acquisitions | | | 105,000 | | | | 1,250 | |
| | | | | | | | |
Balance at 31 December 2010 and 2011 | | | 158,326 | | | | 1,927 | |
| | | | | | | | |
The Parent holds Class A treasury shares equivalent to 0.05% of its capital at 31 December 2011 (0.07% at 31 December 2010).
The Company has received 15,832 Class B shares from the share capital increase approved by the shareholders at the extraordinary general shareholders’ meeting held on 2 December 2011 (see section (a) of this note).
| | (e) | Distribution of profits |
The profits of Grifols, S.A. and subsidiaries will be distributed as agreed by respective shareholders at their general meetings.
F-52
GRIFOLS, S.A. AND SUBSIDIARIES
Notes to Consolidated Financial Statements
The board of directors will propose to the shareholders at their annual general meeting that the profit of Grifols, S.A. for the year ended 31 December 2011, amounting to Euros 167 thousand, be transferred to reserves (accumulated gains).
The distribution of the profit for the year ended 31 December 2010 is presented in the consolidated statement of changes in equity.
The dividend per share distributed in July 2010 is as follows:
| | | | | | | | | | | | |
| | | 31/07/2010 | |
| | | Thousands of Euros | |
| | | % of par
value | | | Euro per
share | | | Amount | |
Ordinary shares | | | 26 | | | | 0.13 | | | | 27,229 | |
| | | | | | | | | | | | |
Total dividends paid in July 2010 | | | 26 | | | | 0.13 | | | | 27,229 | |
| | | | | | | | | | | | |
To cover the interest rate risk related to the planned issuance of corporate bonds by Grifols Inc. (see note 22) a swap was contracted in July 2009 to hedge the interest rate of 10-year US government bonds, with a nominal amount of US Dollars 200 million and maturity on 21 September 2009 (date of issuance of the bonds), swapping a variable interest rate for a fixed rate. The Group recognised this derivative as hedging of cash flows from a highly probable transaction. At the date of redemption, the valuation resulted in a financial cost of Euros 3,275 thousand, which was recognised in equity, net of the tax effect under “Cash flow hedges” and deferred over the term of the ten-year corporate bond until the cancellation of the corporate bond (see note 22 and 32).
In June and October 2011 Grifols contracted variable to fixed interest-rate swaps for initial nominal amounts of US Dollars 1,550 million and Euros 100 million, respectively, to hedge interest-rate risk on its senior debt. The Group has recognised these financial derivatives as cash flow hedges (see notes 5 (a) and 32).
The calculation of basic earnings per share is based on the profit for the year attributable to the shareholders of the Parent divided by the weighted average number of shares in circulation throughout the year, excluding treasury shares.
Details of the calculation of basic earnings per share are as follows:
| | | | | | | | | | | | |
| | | 2011 | | | 2010 | | | 2009 | |
Profit for the year attributable to equity holders of the Company (thousands of Euros) | | | 50,307 | | | | 115,513 | | | | 147,972 | |
Weighted average number of shares in circulation | | | 264,566,898 | | | | 212,909,162 | | | | 209,451,806 | |
| | | | | | | | | | | | |
Basic earnings per share (Euros per share) | | | 0,19 | | | | 0,54 | | | | 0,71 | |
| | | | | | | | | | | | |
The weighted average number of shares issued is determined as follows:
| | | | | | | | | | | | |
| | | Number of shares | |
| | | 2011 | | | 2010 | | | 2009 | |
Issued shares at 1 January | | | 212,906,573 | | | | 213,011,573 | | | | 210,653,277 | |
Effect of shares issued | | | 51,660,325 | | | | — | | | | — | |
Effect of treasury shares | | | — | | | | (102,411 | ) | | | (1,201,471 | ) |
| | | | | | | | | | | | |
Average weighted number of shares issued at 31 December | | | 264,566,898 | | | | 212,909,162 | | | | 209,451,806 | |
| | | | | | | | | | | | |
Diluted earnings per share are calculated by dividing profit for the year attributable to shareholders of the Parent by the weighted average number of ordinary shares in circulation considering the diluting effects of potential ordinary shares. At 31 December 2011, 2010 and 2009 basic and diluted earnings per share are the same as no potential diluting effects exist.
F-53
GRIFOLS, S.A. AND SUBSIDIARIES
Notes to Consolidated Financial Statements
| (19) | Non-controlling Interests |
Details of non-controlling interests and movement at 31 December 2010 are as follows:
| | | | | | | | | | | | | | | | | | | | |
| | | Thousands of Euros | |
| | | Balances at
31/12/2009 | | | Additions | | | Dividends | | | Translation
differences | | | Balances at
31/12/2010 | |
Grifols (Thailand) Pte Ltd | | | 1,203 | | | | 367 | | | | (108 | ) | | | 255 | | | | 1,717 | |
Grifols Malaysia Sdn Bhd | | | 303 | | | | 302 | | | | — | | | | 76 | | | | 681 | |
Woolloomooloo Holdings Pty Ltd, | | | 10,651 | | | | (915 | ) | | | (158 | ) | | | 2,374 | | | | 11,952 | |
| | | | | | | | | | | | | | | | | | | | |
| | | 12,157 | | | | (246 | ) | | | (266 | ) | | | 2,705 | | | | 14,350 | |
| | | | | | | | | | | | | | | | | | | | |
Details of non-controlling interests and movement at 31 December 2011 are as follows:
| | | | | | | | | | | | | | | | | | | | | | | | |
| | | Thousands of Euros | |
| | | Balances at
31/12/2010 | | | Additions | | | Disposals | | | Acquisition of
non-controlling
interests | | | Translation
differences | | | Balances at
31/12/2011 | |
Grifols (Thailand) Pte Ltd | | | 1,717 | | | | 197 | | | | (108 | ) | | | — | | | | (36 | ) | | | 1,770 | |
Grifols Malaysia Sdn Bhd | | | 681 | | | | 38 | | | | — | | | | — | | | | (2 | ) | | | 717 | |
Woolloomooloo Holdings Pty | | | | | | | | | | | | | | | | | | | | | | | | |
Ltd,(note 3) | | | 11,952 | | | | (314 | ) | | | (105 | ) | | | (11,645 | ) | | | 112 | | | | — | |
| | | | | | | | | | | | | | | | | | | | | | | | |
| | | 14,350 | | | | (79 | ) | | | (213 | ) | | | (11,645 | ) | | | 74 | | | | 2,487 | |
| | | | | | | | | | | | | | | | | | | | | | | | |
Details are as follows:
| | | | | | | | |
| | | Thousands of Euros | |
| | | 31/12/2011 | | | 31/12/2010 | |
Capital grants | | | 1,158 | | | | 1,830 | |
Interest-rate grants (preference loans) | | | 208 | | | | 258 | |
| | | | | | | | |
Grants | | | 1,366 | | | | 2,088 | |
| | | | | | | | |
Details of capital grants are as follows:
| | | | | | | | |
| | | Thousands of Euros | |
| | | 31/12/2011 | | | 31/12/2010 | |
Total amount of capital grant: | | | | | | | | |
Prior years | | | 5,797 | | | | 5,474 | |
Current period | | | 347 | | | | 323 | |
| | | | | | | | |
| | | 6,144 | | | | 5,797 | |
Less, revenues recognised: | | | | | | | | |
Prior years | | | (3,752 | ) | | | (3,140 | ) |
Current year | | | (1,029 | ) | | | (612 | ) |
| | | | | | | | |
| | | (4,781 | ) | | | (3,752 | ) |
Translation differences | | | (205 | ) | | | (215 | ) |
| | | | | | | | |
Net value of capital grants | | | 1,158 | | | | 1,830 | |
| | | | | | | | |
At 31 December 2011 interest-rate grants (preference loans) include Euros 208 thousand (Euros 258 thousand at 31 December 2010) of implicit interest on loans extended by the Spanish Ministry of Science and Technology as these are interest free.
F-54
GRIFOLS, S.A. AND SUBSIDIARIES
Notes to Consolidated Financial Statements
Movement for 2009 is as follows:
| | | | | | | | | | | | | | | | |
| | | Thousands of Euros | |
| | | Balances at
31/12/08 | | | Additions | | | Transfers to
profit or loss | | | Balances at
31/12/09 | |
Interest-rate grants (preference loans) | | | 338 | | | | 440 | | | | (492 | ) | | | 286 | |
| | | | | | | | | | | | | | | | |
Movement for 2010 is as follows:
| | | | | | | | | | | | | | | | |
| | | Thousands of Euros | |
| | | Balances at
31/12/09 | | | Additions | | | Transfers to
profit or loss | | | Balances at
31/12/10 | |
Interest-rate grants (preference loans) | | | 286 | | | | 88 | | | | (116 | ) | | | 258 | |
| | | | | | | | | | | | | | | | |
Movement for 2011 is as follows:
| | | | | | | | | | | | | | | | |
| | | Thousands of Euros | |
| | | Balances at
31/12/10 | | | Additions | | | Transfers to
profit or loss | | | Balances at
31/12/11 | |
Interest-rate grants (preference loans) | | | 258 | | | | 225 | | | | (275 | ) | | | 208 | |
| | | | | | | | | | | | | | | | |
Details of provisions at 31 December 2011 and 2010 are as follows:
| | | | | | | | |
| | | Thousands of Euros | |
| Non-current provisions (a) | | 31/12/2011 | | | 31/12/2010 | |
Provisions for pensions and similar obligations | | | 8,554 | | | | 787 | |
Other provisions | | | 2,498 | | | | 591 | |
| | | | | | | | |
Non-current provisions | | | 11,052 | | | | 1,378 | |
| | | | | | | | |
| |
| | | Thousands of Euros | |
| Current provisions (b) | | 31/12/2011 | | | 31/12/2010 | |
Trade provisions | | | 81,112 | | | | 4,365 | |
| | | | | | | | |
Current provisions | | | 81,112 | | | | 4,365 | |
| | | | | | | | |
| | (a) | Non-current provisions |
At 31 December 2011 and 2010 provisions for pensions and similar obligations mainly comprise a provision made by certain foreign subsidiaries in respect of labour commitments with certain employees.
Movement in provisions during 2010 is as follows:
| | | | | | | | | | | | | | | | | | | | |
| | | Thousands of Euros | |
| | | Balances at
31/12/2009 | | | Charge | | | Write-off | | | Translation
differences | | | Balances at
31/12/2010 | |
Non-current provisions | | | 1,232 | | | | 140 | | | | (71 | ) | | | 77 | | | | 1,378 | |
| | | | | | | | | | | | | | | | | | | | |
| | | 1,232 | | | | 140 | | | | (71 | ) | | | 77 | | | | 1,378 | |
| | | | | | | | | | | | | | | | | | | | |
Movement in provisions during 2011 is as follows:
| | | | | | | | | | | | | | | | | | | | | | | | |
| | | Thousands of Euros | |
| | | Balances at
31/12/2010 | | | Business
combination | | | Charge | | | Payments | | | Translation
differences | | | Balances at
31/12/2011 | |
Non-current provisions | | | 1,378 | | | | 9,250 | | | | 1,848 | | | | (2,254 | ) | | | 830 | | | | 11,052 | |
| | | | | | | | | | | | | | | | | | | | | | | | |
Non-current provisions | | | 1,378 | | | | 9,250 | | | | 1,848 | | | | (2,254 | ) | | | 830 | | | | 11,052 | |
| | | | | | | | | | | | | | | | | | | | | | | | |
| | | | | | | (note 3 (a)) | | | | | | | | | | | | | | | | | |
F-55
GRIFOLS, S.A. AND SUBSIDIARIES
Notes to Consolidated Financial Statements
Business combinations primarily comprise provisions for pensions and other similar items.
Movement in trade provisions during 2010 is as follows:
| | | | | | | | | | | | | | | | | | | | |
| | | Thousands of Euros | |
| | | Balances at
31/12/2009 | | | Charge | | | Payments | | | Translation
differences | | | Balances at
31/12/2010 | |
Trade provisions | | | 4,702 | | | | 41 | | | | (414 | ) | | | 36 | | | | 4,365 | |
| | | | | | | | | | | | | | | | | | | | |
| | | 4,702 | | | | 41 | | | | (414 | ) | | | 36 | | | | 4,365 | |
| | | | | | | | | | | | | | | | | | | | |
Movement in trade provisions during 2011 is as follows:
| | | | | | | | | | | | | | | | | | | | | | | | |
| | | Thousands of Euros | |
| | | Balances at
31/12/2010 | | | Business
combination | | | Charge | | | Payments | | | Translation
differences | | | Balances at
31/12/2011 | |
Trade provisions | | | 4,365 | | | | 67,965 | | | | 2,045 | | | | (1,117 | ) | | | 7,854 | | | | 81,112 | |
| | | | | | | | | | | | | | | | | | | | | | | | |
| | | 4,365 | | | | 67,965 | | | | 2,045 | | | | (1,117 | ) | | | 7,854 | | | | 81,112 | |
| | | | | | | | | | | | | | | | | | | | | | | | |
| | | | | | | (note 3 (a)) | | | | | | | | | | | | | | | | | |
Trade provisions primarily reflect the amount estimated to cover the risk relating to certain lawsuits in progress.
| (22) | Financial Liabilities |
This note provides information on the contractual conditions of the loans obtained by the Group, which are measured at amortised cost, except the financial derivatives, which are measured at fair value. For further information on exposure to interest rate risk, currency risk and liquidity risk and the fair values of financial liabilities, please refer to note 32.
(a) Non-current financial liabilities
Details at 31 December 2011 and 2010 are as follows:
| | | | | | | | |
| | | Thousands of Euros | |
Non-current financial liabilities | | 31/12/11 | | | 31/12/10 | |
Issue of Corporate bonds (a) | | | — | | | | 446,918 | |
Issue of Senior Unsecured Notes | | | 850,143 | | | | — �� | |
Transaction costs of bond issue | | | (113,620 | ) | | | (5,715 | ) |
| | | | | | | | |
Non-current bonds (a.1.1) | | | 736,523 | | | | 441,203 | |
Senior Debt - Tranche A (US Dollars) | | | 840,482 | | | | — | |
Senior Debt - Tranche B (US Dollars) | | | 989,644 | | | | — | |
Senior Debt - Tranche A (Euros) | | | 199,375 | | | | — | |
Senior Debt - Tranche B (Euros) | | | 216,700 | | | | — | |
Embedded floor | | | (52,139 | ) | | | — | |
Transaction costs on loan | | | (172,638 | ) | | | (1,365 | ) |
Club Deal | | | — | | | | 100,000 | |
Other loans | | | 26,661 | | | | 120,813 | |
Finance lease liabilities (a.1.3) | | | 24,617 | | | | 4,734 | |
| | | | | | | | |
Debt with financial institutions (a.1.2) | | | 2,072,702 | | | | 224,182 | |
| | | | | | | | |
Loans and borrowings and bonds or other non current marketable securities (a.1) | | | 2,809,225 | | | | 665,385 | |
Financial derivatives (note 32) | | | 127,875 | | | | — | |
Other financial liabilities | | | 8,688 | | | | 10,474 | |
| | | | | | | | |
Other non-current financial liabilities (a.2) | | | 136,563 | | | | 10,474 | |
| | | | | | | | |
| | | 2,945,788 | | | | 675,859 | |
| | | | | | | | |
F-56
GRIFOLS, S.A. AND SUBSIDIARIES
Notes to Consolidated Financial Statements
| | (a.1) | Loans and borrowings, bonds and other marketable securities |
(a.1.1) Corporate bonds and Senior Unsecured Notes
On 21 September 2009 the Group, through Grifols Inc., issued corporate bonds in the USA totalling US Dollars 600 million. The issue was subscribed by twenty two qualified investors, 90% in US Dollars and the remaining 10% in Pounds Sterling and Euros. The issue was structured in three tranches: US Dollars 200 million at 12 years, US Dollars 300 million at 10 years and US Dollars 100 million at 7 years, with spreads over the price of the US bond at 10 years of 370 basis points for 12 year bonds, 350 basis points for those issued at 10 years and 335 basis points for 7 year bonds.
A summary of corporate bonds at 31 December 2010 is as follows:
| | | | | | | | | | | | | | |
| Amount | | | | Duration (years) | | | Fixed interest rate | |
| | 100,000 | | | Thousands of USD | | | | | 7 | | | | 6.42 | % |
| | 245,000 | | | Thousands of USD | | | | | 10 | | | | 6.94 | % |
| | 200,000 | | | Thousands of USD | | | | | 12 | | | | 7.14 | % |
| | 10,000 | | | Thousands of EUR | | | | | 10 | | | | 6.94 | % |
| | 25,000 | | | Thousans of GBP | | | | | 10 | | | | 6.94 | % |
Funds raised enabled the Group to extend the term of the debt from current to non-current, at the same time ensuring the availability of financial resources required to consolidate its plans for the future.
On 13 January 2011, the Group closed its scheduled issue of High Yield Senior Unsecured Notes for an amount of US Dollars 1,100 million, with a seven-year maturity period (2018) and an annual coupon of 8.25%. This issue, in conjunction with the already completed syndicated loan described in paragraphs below enabled the Group to obtain the necessary funds to finance the acquisition of Talecris (see note 3) on 2 June 2011.
On 2 June 2011 and in accordance with the requirements of the new credit agreement, the Group cancelled corporate bonds amounting to US Dollars 600 million and recognised all the transaction-related costs in profit and loss. The costs of cancelling the corporate bonds amount to Euros 112 million. These costs have been included as transaction costs as this was one of the necessary requirements for obtaining additional financing. These costs, in conjunction with other expenses incurred on the debt issue (underwriting fees, ticking fees, closing fees, etc.), amounting to Euros 240 million, have been deferred as transaction costs and will be recognised in profit and loss based on the effective interest rate. The finance expense corresponding to transaction costs taken to profit and loss in 2011 amounted to Euros 36.5 million.
Movement of the bonds during the year 2011 are as follows:
| | | | | | | | | | | | | | | | | | | | |
| | | Outstanding
opening
balance at
01/01/11 | | | Issues | | | Redemptions | | | Exchange rate
adjustments and
others | | | Outstanding
closing
balance at
31/12/11 | |
Corporate bonds issued in 2010 | | | 446,918 | | | | — | | | | (415,270 | ) | | | (31,648 | ) | | | — | |
High Yield Unsecured Notes | | | — | | | | 761,088 | | | | — | | | | 89,055 | | | | 850,143 | |
| | | | | | | | | | | | | | | | | | | | |
Total | | | 446,918 | | | | 761,088 | | | | (415,270 | ) | | | 57,407 | | | | 850,143 | |
| | | | | | | | | | | | | | | | | | | | |
(a.1.2) Debt with financial institutions
On 23 November 2010 the Company signed senior debt contracts of US Dollars 3,400 million for the acquisition of Talecris. Details of this collateralised senior debt are as follows:
| | • | | Non-current senior debt Tranche A: loan repayable in five years and divided into two tranches: US Tranche A and Tranche A in a foreign currency. |
| | • | | Principal totalling US Dollars 1,200 million |
| | • | | Margin of 375 basis points (bp) linked to US Libor |
| | • | | US Libor floor of 1.75% |
F-57
GRIFOLS, S.A. AND SUBSIDIARIES
Notes to Consolidated Financial Statements
| | • | | Tranche A in foreign currency: |
| | • | | Principal totalling Euros 220 million. |
| | • | | Margin of 400 basis points (bp) linked to Euribor |
Details of the Tranche A principal by maturity are as follows:
| | | | | | | | | | | | | | | | | | |
| | | | | Tranche A in US Dollars | | | Tranche A in Euros | |
| | | Currency | | Amortizacion in
thousands of
US Dollars | | | Amortizacion in
thousands
Euros | | | Currency | | | Amortizacion in
thousands
Euros | |
2012 | | US Dollars | | | 112,500 | | | | 86,946 | | | | Euros | | | | 20,625 | |
2013 | | US Dollars | | | 127,500 | | | | 98,539 | | | | Euros | | | | 23,375 | |
2014 | | US Dollars | | | 180,000 | | | | 139,114 | | | | Euros | | | | 33,000 | |
2015 | | US Dollars | | | 585,000 | | | | 452,121 | | | | Euros | | | | 107,250 | |
2016 | | US Dollars | | | 195,000 | | | | 150,708 | | | | Euros | | | | 35,750 | |
| | | | | | | | | | | | | | | | | | |
Total | | US Dollars | | | 1,200,000 | | | | 927,428 | | | | Euros | | | | 220,000 | |
| | | | | | | | | | | | | | | | | | |
| | • | | Non-current senior debt Tranche B: Six-year loan (payment of total principal on maturity) divided into two tranches: US Tranche B and Tranche B in a foreign currency. |
| | • | | Principal of US Dollars 1,300 million |
| | • | | Margin of 425 basis points (bp) linked to US Libor |
| | • | | US Libor floor of 1.75% |
| | • | | Tranche B in foreign currency: |
| | • | | Principal of Euros 220 million. |
| | • | | Margin of 450 basis points (bp) linked to Euribor |
Details of the Tranche B principal by maturity are as follows:
| | | | | | | | | | | | | | | | | | |
| | | | | Tranche B in US Dollars | | | Tranche B in Euros | |
| | | Currency | | Amortizacion in
thousands of
US Dollars | | | Amortizacion
in thousands
Euros | | | Currency | | | Amortizacion in
thousands
Euros | |
2012 | | US Dollars | | | 13,000 | | | | 10,047 | | | | Euros | | | | 2,200 | |
2013 | | US Dollars | | | 13,000 | | | | 10,047 | | | | Euros | | | | 2,200 | |
2014 | | US Dollars | | | 13,000 | | | | 10,047 | | | | Euros | | | | 2,200 | |
2015 | | US Dollars | | | 13,000 | | | | 10,047 | | | | Euros | | | | 2,200 | |
2016 | | US Dollars | | | 9,750 | | | | 7,535 | | | | Euros | | | | 1,650 | |
2017 | | US Dollars | | | 1,231,750 | | | | 951,968 | | | | Euros | | | | 208,450 | |
| | | | | | | | | | | | | | | | | | |
Total | | US Dollars | | | 1,293,500 | | | | 999,691 | | | | Euros | | | | 218,900 | |
| | | | | | | | | | | | | | | | | | |
| | • | | Senior revolving credit facility: Amount of US Dollars 300 million maturing on 1 June 2016. At 31 December 2011 no amount has been drawn down on this facility. This facility has a floor of 1.75% of the reference lending rate. |
| | • | | US revolving credit facility |
| | • | | Amount committed: US Dollars 50 million |
| | • | | Margin of 375 basis points |
F-58
GRIFOLS, S.A. AND SUBSIDIARIES
Notes to Consolidated Financial Statements
| | • | | US multicurrency revolving credit facility: |
| | • | | Amount committed: US Dollars 200 million |
| | • | | Margin of 375 basis points |
| | • | | Foreign currency revolving credit facility: |
| | • | | Amount committed: US Dollars 50 million |
| | • | | Margin of 400 basis points |
The issue of Senior Unsecured Notes and senior debt is subject to compliance with certain financial covenants. At 31 December 2011 the Group complies with these financial covenants.
Grifols will not be able to distribute dividends while the leverage ratio (net financial debt/adjusted EBITDA) is higher than 3.75 and there is a limit of US Dollars 10 million of dividend payments each year (see note 34).
Grifols, S.A., Grifols Inc. and other significant group companies, act as guarantor for the High Yield Senior Unsecured Notes. Significant group companies are those companies that contribute 85% of earnings before interest, tax, depreciation and amortisation (EBITDA), 85% of the Group’s consolidated assets and 85% of total revenues, and those companies that represent more than 3% of the above mentioned indicators.
The Company and Grifols Inc. have pledged their assets as collateral, and the shares of certain group companies have been pledged, to guarantee repayment of the senior debt.
The Club Deal and other loans amounting to Euros 297 million were cancelled on 2 June 2011. All deferred costs associated with this cancelled debt were recognised as finance expenses in conjunction with the hedge derivative related to the issue of corporate bonds in September 2009 (see note 17(f)). Total expenses incurred for these items amount to Euros 9.4 million.
(a.1.3) Finance lease liabilities
Details of minimum payments and the current finance lease liabilities, by maturity date, are as follows:
| | | | | | | | | | | | | | | | |
| | | Thousands of Euros | |
| | | 31/12/2011 | | | 31/12/2010 | |
| | | Current | | | Non-current | | | Current | | | Non-current | |
Minimum payments | | | 9,886 | | | | 29,925 | | | | 3,552 | | | | 5,089 | |
Interest | | | (2,784 | ) | | | (5,308 | ) | | | (272 | ) | | | (355 | ) |
| | | | | | | | | | | | | | | | |
Present value | | | 7,102 | | | | 24,617 | | | | 3,280 | | | | 4,734 | |
| | | | | | | | | | | | | | | | |
| | | | | | | | | | | | | | | | | | | | | | | | |
| | | Thousands of Euros | |
| | | 31/12/2011 | | | 31/12/2010 | |
| | | Minimum
payments | | | Interest | | | Present
value | | | Minimum
payments | | | Interest | | | Present
value | |
Maturity at: | | | | | | | | | | | | | | | | | | | | | | | | |
Less than one year | | | 9,886 | | | | 2,784 | | | | 7,102 | | | | 3,552 | | | | 272 | | | | 3,280 | |
Two years | | | 8,921 | | | | 2,251 | | | | 6,670 | | | | 2,411 | | | | 161 | | | | 2,250 | |
Three years | | | 8,185 | | | | 1,573 | | | | 6,612 | | | | 1,271 | | | | 96 | | | | 1,175 | |
Four years | | | 6,780 | | | | 929 | | | | 5,851 | | | | 763 | | | | 50 | | | | 713 | |
Five years | | | 3,614 | | | | 341 | | | | 3,273 | | | | 314 | | | | 23 | | | | 291 | |
More than five years | | | 2,425 | | | | 214 | | | | 2,211 | | | | 330 | | | | 25 | | | | 305 | |
| | | | | | | | | | | | | | | | | | | | | | | | |
Total | | | 39,811 | | | | 8,092 | | | | 31,719 | | | | 8,641 | | | | 627 | | | | 8,014 | |
| | | | | | | | | | | | | | | | | | | | | | | | |
F-59
GRIFOLS, S.A. AND SUBSIDIARIES
Notes to Consolidated Financial Statements
| | (a.2) | Other non-current financial liabilities |
Details of the interest-free preference loans extended by the Spanish Ministry of Science and Technology, to various group companies are as follows:
| | | | | | | | | | | | | | | | | | | | | | | | |
| | | Thousands of Euros | |
| | | Date
awarded | | | Amount
awarded | | | 31/12/2011 | | | 31/12/2010 | |
| Company | | | | Non-current | | | Current | | | Non-current | | | Current | |
Instituto Grifols S,A | | | 13/02/2002 | | | | 691 | | | | — | | | | — | | | | — | | | | — | |
Instituto Grifols S,A | | | 17/01/2003 | | | | 1,200 | | | | — | | | | 165 | | | | — | | | | 94 | |
Instituto Grifols S,A | | | 13/11/2003 | | | | 2,000 | | | | 266 | | | | 279 | | | | 157 | | | | 165 | |
Instituto Grifols S,A | | | 17/01/2005 | | | | 2,680 | | | | 702 | | | | 375 | | | | 520 | | | | 279 | |
Instituto Grifols S,A | | | 29/12/2005 | | | | 2,100 | | | | 787 | | | | 287 | | | | 1,031 | | | | 375 | |
Instituto Grifols S,A | | | 29/12/2006 | | | | 1,700 | | | | 831 | | | | 234 | | | | 1,025 | | | | 288 | |
Instituto Grifols S,A | | | 27/12/2007 | | | | 1,700 | | | | 994 | | | | 232 | | | | 1,015 | | | | 234 | |
Instituto Grifols S,A | | | 31/12/2008 | | | | 1,419 | | | | 1,026 | | | | 195 | | | | 1,164 | | | | 232 | |
Instituto Grifols S,A | | | 16/01/2009 | | | | 1,540 | | | | 1,217 | | | | 212 | | | | 1,175 | | | | — | |
Instituto Grifols S,A | | | 17/01/2001 | | | | 700 | | | | 529 | | | | — | | | | 1,294 | | | | — | |
Laboratorios Grifols, S,A | | | 29/01/2002 | | | | 210 | | | | — | | | | — | | | | — | | | | — | |
Laboratorios Grifols, S,A | | | 15/01/2003 | | | | 220 | | | | — | | | | 30 | | | | — | | | | 29 | |
Laboratorios Grifols, S,A | | | 26/09/2003 | | | | 300 | | | | 39 | | | | 41 | | | | 29 | | | | 30 | |
Laboratorios Grifols, S,A | | | 22/10/2004 | | | | 200 | | | | 52 | | | | 28 | | | | 76 | | | | 41 | |
Laboratorios Grifols, S,A | | | 20/12/2005 | | | | 180 | | | | 67 | | | | 25 | | | | 77 | | | | 28 | |
Laboratorios Grifols, S,A | | | 29/12/2006 | | | | 400 | | | | 191 | | | | 54 | | | | 88 | | | | 25 | |
Laboratorios Grifols, S,A | | | 27/12/2007 | | | | 360 | | | | 181 | | | | 42 | | | | 233 | | | | 54 | |
Laboratorios Grifols, S,A | | | 31/12/2008 | | | | 600 | | | | 409 | | | | 78 | | | | 212 | | | | 42 | |
Diagnostic Grifols, S,A | | | 27/11/2008 | | | | 857 | | | | 243 | | | | 129 | | | | 497 | | | | — | |
Diagnostic Grifols, S,A | | | 25/05/2010 | | | | 203 | | | | 88 | | | | 31 | | | | 358 | | | | 129 | |
Diagnostic Grifols, S,A | | | 13/06/2011 | | | | 278 | | | | 119 | | | | 42 | | | | 116 | | | | 31 | |
Grifols Engineering, S,A, | | | 21/04/2009 | | | | 524 | | | | 372 | | | | 69 | | | | 427 | | | | 34 | |
Grifols Engineering, S,A, | | | 21/04/2009 | | | | 203 | | | | 144 | | | | 27 | | | | 165 | | | | 13 | |
Grifols Engineering, S,A, | | | 28/01/2010 | | | | 100 | | | | 81 | | | | 7 | | | | 85 | | | | — | |
| | | | | | | | | | | | | | | | | | | | | | | | |
| | | | | | | 20,365 | | | | 8,338 | | | | 2,582 | | | | 9,744 | | | | 2,123 | |
| | | | | | | | | | | | | | | | | | | | | | | | |
During 2011 the implicit borrowing costs taken to profit and loss amount to Euros 517 thousand (Euros 567 thousand in 2010 and Euros 616 thousand in 2009)) (see note 28).
Details of the maturity of other non-current financial liabilities are as follows:
| | | | | | | | |
| | | Thousands of Euros | |
| Maturity at: | | 31/12/2011 | | | 31/12/2010 | |
Two years | | | 2,522 | | | | 2,964 | |
Three years | | | 5,050 | | | | 2,159 | |
Four years | | | 1,398 | | | | 1,989 | |
Five years | | | 36,815 | | | | 1,266 | |
More than five years | | | 90,778 | | | | 2,096 | |
| | | | | | | | |
| | | 136,563 | | | | 10,474 | |
| | | | | | | | |
F-60
GRIFOLS, S.A. AND SUBSIDIARIES
Notes to Consolidated Financial Statements
(b) Current financial liabilities
Details at 31 December 2011 and 2010 are as follows:
| | | | | | | | |
| | | Thousands of Euros | |
Current financial liabilities | | 31/12/11 | | | 31/12/10 | |
Interest accrued on corporate bonds | | | 29,224 | | | | 7,207 | |
Transaction costs of bond issue (a.1.1) | | | (20,496 | ) | | | — | |
Promissory notes issued to bearer | | | 9,795 | | | | 8,235 | |
| | | | | | | | |
Current Bonds | | | 18,523 | | | | 15,442 | |
Senior Debt- Tranche A (US Dollars) | | | 86,946 | | | | — | |
Senior Debt- Tranche B (US Dollars) | | | 10,047 | | | | — | |
Senior Debt- Tranche A (Euros) | | | 20,625 | | | | — | |
Senior Debt- Tranche B (Euros) | | | 2,200 | | | | — | |
Embedded floor | | | (13,807 | ) | | | — | |
Transaction costs on loan | | | (42,314 | ) | | | (708 | ) |
Club Deal | | | — | | | | 66,667 | |
Other loans | | | 58,467 | | | | 106,954 | |
Finance lease liabilities | | | 7,102 | | | | 3,280 | |
| | | | | | | | |
Debt with financial institutions (b.1.2) | | | 129,266 | | | | 176,193 | |
| | | | | | | | |
Loans and borrowings, bonds and other marketable securities (b.1) | | | 147,789 | | | | 191,635 | |
Financial derivatives (note 32) | | | — | | | | 8,560 | |
Other current financial liabilities (b.2) | | | 14,507 | | | | 9,676 | |
| | | | | | | | |
Other current financial liabilities | | | 14,507 | | | | 18,236 | |
| | | | | | | | |
| | | 162,296 | | | | 209,871 | |
| | | | | | | | |
Current loans and borrowings include accrued interest amounting to Euros 424 thousand (Euros 483 thousand at 31 December 2010).
(b.1) Loans and borrowings, bonds and other marketable securities
(b.1.1) Current Bonds
Details of bonds at 31 December 2011 and 2010 are as follows:
| | | | | | | | |
| | | Thousands of Euros | |
| | | 31/12/2011 | | | 31/12/2010 | |
Promissory notes issued to bearer | | | 9,960 | | | | 8,373 | |
Interest pending accrual on promissory notes issued to bearer | | | (165 | ) | | | (138 | ) |
Interest accrued on corporate bonds | | | 29,224 | | | | 7,207 | |
Transaction costs of bonds issued | | | (20,496 | ) | | | 0 | |
| | | | | | | | |
| | | 18,523 | | | | 15,442 | |
| | | | | | | | |
Details of the issue of bearer promissory notes to group employees are as follows:
| | | | | | | | | | | | | | | | | | | | | | | | |
| | | 31/12/2010 | |
| | | Issue date | | | Maturity date | | | Nominal
amount per
note (Euros) | | | Interest rate | | | Promissory
notes
subscribed
(Thousands of
Euros) | | | Interest
pending
accrual
(Thousands of
Euros) | |
Issue of bearer promissory notes | | | 05/05/2010 | | | | 05/05/2011 | | | | 3,000 | | | | 5,00 | % | | | 8,373 | | | | (138 | ) |
| | | | | | | | | | | | | | | | | | | | | | | | | | | | |
| | | 31/12/2011 | |
| | | Issue date | | | Maturity date | | | Nominal
amount
(Thousands of
Euros) | | | Interest
rate | | | Promissory
notes
subscribed
(Thousands of
Euros) | | | Buy back
(Thousands of
Euros) | | | Interest
pending
accrual
(Thousands of
Euros) | |
Issue of bearer promissory notes | | | 05/05/2011 | | | | 04/05/2012 | | | | 3,000 | | | | 5,00 | % | | | 9,990 | | | | (30 | ) | | | (165 | ) |
F-61
GRIFOLS, S.A. AND SUBSIDIARIES
Notes to Consolidated Financial Statements
(b.1.2) Current debt with financial institutions
Details of current loans and borrowings are as follows:
| | | | | | | | | | |
| | | Interest
rate (*) | | Thousands of Euros
Drawn down | |
| | | Min - max | | 31/12/2011 | | | 31/12/2010 | |
Loans in: | | | | | | | | | | |
US Dollars (Tranche A) | | Libor + 3.75% | | | 86,946 | | | | — | |
US Dollars (Tranche B) | | Libor + 4.25% | | | 10,047 | | | | — | |
US Dollars | | 1.21-2.30% | | | 1,100 | | | | 1,384 | |
Euros (Tranche A) | | Euribor +4% | | | 20,625 | | | | — | |
Euros (Tranche B) | | Euribor +4.5% | | | 2,200 | | | | — | |
Euros | | 1.17%-12% | | | 27,248 | | | | 143,990 | |
Other currencies | | TIIE+2%-15.84% | | | 28,543 | | | | 26,368 | |
| | | | | | | | | | |
| | | | | 176,709 | | | | 171,742 | |
Discounted trade notes (notes 13) | | 1.25-5.63% | | | 1,153 | | | | 1,396 | |
Current interest on debt with financial institutions | | | | | 424 | | | | 483 | |
Finance lease payables | | | | | 9,284 | | | | 3,552 | |
| | | | | | | | | | |
| | | | | 187,570 | | | | 177,173 | |
Less, current portion of deferred finance expenses for leasing | | | | | (2,182 | ) | | | (272 | ) |
Less, current portion of loan arrangement expenses | | | | | (42,315 | ) | | | (708 | ) |
Embedded floor | | | | | (13,807 | ) | | | — | |
| | | | | | | | | | |
| | | | | 129,266 | | | | 176,193 | |
| | | | | | | | | | |
| (*) | Loans accrue variable interest rates. |
At 31 December 2011 the Group has a current unused credit lines of Euros 426,426 thousand (Euros 319,016 thousand at 31 December 2010).
| (b.2) | Other current financial liabilities |
At 31 December 2011 and 2010 other current financial liabilities also include approximately Euros 11,146 thousand and Euros 6,503 thousand, respectively, which have been collected directly from social security affiliated bodies and transferred to Deutsche Bank, S.A.E (see note 13).
| (23) | Trade and Other Payables |
Details are as follows:
| | | | | | | | |
| | | Thousands of Euros | |
| | | 31/12/2011 | | | 31/12/2010 | |
Suppliers | | | 280,722 | | | | 160,678 | |
Other payables | | | 27,335 | | | | 11,928 | |
Current income tax liabilities | | | 4,691 | | | | 4,172 | |
| | | | | | | | |
| | | 312,748 | | | | 176,778 | |
| | | | | | | | |
Suppliers
Details of balances with related parties are shown in note 33.
F-62
GRIFOLS, S.A. AND SUBSIDIARIES
Notes to Consolidated Financial Statements
Balances with suppliers include the following payables in foreign currencies:
| | | | | | | | |
| | | Thousands of Euros | |
| | | 31/12/2011 | | | 31/12/2010 | |
Currency | | | | | | | | |
US Dollar | | | 167,519 | | | | 58,932 | |
Chilean Peso | | | 957 | | | | 1,490 | |
Swiss Franc | | | 908 | | | | 897 | |
Czech Crown | | | 815 | | | | 568 | |
Brazilian Real | | | 673 | | | | 428 | |
Pound Sterling | | | 715 | | | | 405 | |
Other currencies | | | 1,961 | | | | 665 | |
The Group’s exposure to currency risk and liquidity risk associated with trade and other payables is described in note 32.
Other payables
Details are as follows:
| | | | | | | | |
| | | Thousands of Euros | |
| | | 31/12/2011 | | | 31/12/2010 | |
Taxation authorities, VAT/Canary Islands Tax | | | 4,981 | | | | 3,472 | |
Taxation authorities, withholdings | | | 3,216 | | | | 3,119 | |
Social Security | | | 3,356 | | | | 3,246 | |
Other public entities | | | 15,782 | | | | 2,091 | |
| | | | | | | | |
Public entities, other payables | | | 27,335 | | | | 11,928 | |
| | | | | | | | |
Current tax liabilities
Details are as follows:
| | | | | | | | |
| | | Thousands of Euros | |
| | | 31/12/2011 | | | 31/12/2010 | |
Taxation authorities, income tax: | | | | | | | | |
Current year | | | 3,521 | | | | 4,161 | |
Prior years | | | 1,170 | | | | 11 | |
| | | | | | | | |
Current tax liabilities | | | 4,691 | | | | 4,172 | |
| | | | | | | | |
| (24) | Other Current Liabilities |
Details are as follows:
| | | | | | | | |
| | | Thousands of Euros | |
| | | 31/12/2011 | | | 31/12/2010 | |
Salaries payable | | | 72,037 | | | | 28,321 | |
Other payables | | | 15,449 | | | | 2,629 | |
| | | | | | | | |
Other current liabilities | | | 87,486 | | | | 30,950 | |
| | | | | | | | |
F-63
GRIFOLS, S.A. AND SUBSIDIARIES
Notes to Consolidated Financial Statements
Revenues are mainly generated by the sale of goods.
The distribution of net consolidated revenues for 2011, 2010 and 2009 by segment is as follows:
| | | | | | | | | | | | |
| | | % | |
| | | 31/12/2011 | | | 31/12/2010 | | | 31/12/2009 | |
Bioscience | | | 85 | % | | | 78 | % | | | 76 | % |
Diagnostics | | | 7 | % | | | 11 | % | | | 10 | % |
Hospital | | | 5 | % | | | 9 | % | | | 10 | % |
Raw materials | | | 2 | % | | | 1 | % | | | 3 | % |
Others | | | 1 | % | | | 1 | % | | | 1 | % |
| | | | | | | | | | | | |
| | | 100 | % | | | 100 | % | | | 100 | % |
| | | | | | | | | | | | |
The geographical distribution of net consolidated revenues is as follows:
| | | | | | | | | | | | |
| | | % | |
| | | 31/12/2011 | | | 31/12/2010 | | | 31/12/2009 | |
Spain | | | 13 | % | | | 23 | % | | | 25 | % |
European Union | | | 17 | % | | | 21 | % | | | 22 | % |
United States | | | 54 | % | | | 34 | % | | | 32 | % |
Rest of the world | | | 16 | % | | | 22 | % | | | 21 | % |
| | | | | | | | | | | | |
| | | 100 | % | | | 100 | % | | | 100 | % |
| | | | | | | | | | | | |
Net consolidated revenues include net sales made in the following foreign currencies:
| | | | | | | | | | | | |
| | | Thousands of Euros | |
| | | 31/12/2011 | | | 31/12/2010 | | | 31/12/2009 | |
Currency | | | | | | | | | | | | |
US Dollar | | | 1,097,667 | | | | 405,439 | | | | 349,064 | |
Pound Sterling | | | 35,653 | | | | 36,199 | | | | 33,668 | |
Chilean Peso | | | 26,328 | | | | 28,760 | | | | 21,083 | |
Mexican Peso | | | 24,992 | | | | 25,652 | | | | 36,472 | |
Brazilian Real | | | 21,241 | | | | 21,949 | | | | 21,262 | |
Australian Dollar | | | 28,654 | | | | 13,950 | | | | 6,387 | |
Czech Crown | | | 13,191 | | | | 13,698 | | | | 12,863 | |
Argentinean Peso | | | 13,981 | | | | 13,122 | | | | 11,323 | |
Polish Zloty | | | 13,099 | | | | 11,668 | | | | 13,525 | |
Other currency | | | 21,273 | | | | 18,989 | | | | 18,013 | |
Details are as follows:
| | | | | | | | | | | | |
| | | Thousands of Euros | |
| | | 31/12/2011 | | | 31/12/2010 | | | 31/12/2009 | |
Wages and salaries | | | 394,714 | | | | 232,174 | | | | 219,803 | |
Contributions to pension plans (note 31) | | | 8,785 | | | | 1,615 | | | | 1,571 | |
Other social charges | �� | | 10,202 | | | | 8,615 | | | | 8,072 | |
Social Security | | | 74,940 | | | | 46,604 | | | | 43,722 | |
| | | | | | | | | | | | |
| | | 488,641 | | | | 289,008 | | | | 273,168 | |
| | | | | | | | | | | | |
F-64
GRIFOLS, S.A. AND SUBSIDIARIES
Notes to Consolidated Financial Statements
| (27) | Other Operating Income and Expenses |
Other operating expenses
Details are as follows:
| | | | | | | | | | | | |
| | | Thousands of Euros | |
| | | 31/12/2011 | | | 31/12/2010 | | | 31/12/2009 | |
Changes in trade provisions (notes 21 (b) and 32) | | | 3,809 | | | | 398 | | | | 1,348 | |
Professional services (note 15) | | | 88,374 | | | | 26,043 | | | | 25,266 | |
Commissions | | | 14,035 | | | | 8,038 | | | | 7,711 | |
Supplies and other materials | | | 70,280 | | | | 30,542 | | | | 28,859 | |
Operating leases (note 30 (a)) | | | 36,095 | | | | 19,272 | | | | 17,364 | |
Freight | | | 35,283 | | | | 20,950 | | | | 20,518 | |
Repairs and maintenance costs | | | 33,128 | | | | 22,480 | | | | 21,365 | |
Advertising | | | 40,236 | | | | 14,636 | | | | 15,580 | |
Insurance | | | 15,424 | | | | 10,807 | | | | 10,803 | |
Royalties | | | 6,163 | | | | 884 | | | | 4,954 | |
Travel expenses | | | 21,598 | | | | 12,390 | | | | 11,935 | |
External services | | | 20,487 | | | | 15,776 | | | | 25,024 | |
Others | | | 43,598 | | | | 23,044 | | | | 12,654 | |
| | | | | | | | | | | | |
Other operating expenses | | | 428,510 | | | | 205,260 | | | | 203,381 | |
| | | | | | | | | | | | |
Research and development expenses incurred by the Group amount to Euros 76.7 million in 2011 (Euros 36.6 million in 2010 and Euros 35.2 million in 2009).
Other operating income
| | | | | | | | | | | | |
| | | Thousands of Euros | |
| | | 31/12/2011 | | | 31/12/2010 | | | 31/12/2009 | |
Income from insurance claims | | | 2,090 | | | | 771 | | | | 807 | |
Grants | | | 2 | | | | 307 | | | | 378 | |
Other income | | | 101 | | | | 118 | | | | 258 | |
| | | | | | | | | | | | |
Other operating income | | | 2,193 | | | | 1,196 | | | | 1,443 | |
| | | | | | | | | | | | |
| (28) | Finance Income and Expense |
Details are as follows:
| | | | | | | | | | | | |
| | | Thousands of Euros | |
| | | 31/12/2011 | | | 31/12/2010 | | | 31/12/2009 | |
Interest from Social Security | | | 4,671 | | | | 2,876 | | | | 6,510 | |
Other finance income | | | 1,090 | | | | 1,650 | | | | 557 | |
| | | | | | | | | | | | |
Finance income | | | 5,761 | | | | 4,526 | | | | 7,067 | |
| | | | | | | | | | | | |
Club Deal | | | (1,473 | ) | | | (4,475 | ) | | | (7,036 | ) |
Finance expenses from sale of receivables (note 13) | | | (6,185 | ) | | | (5,378 | ) | | | (2,531 | ) |
Finance expenses from High Yield Unsecured Notes (note 22) | | | (20,847 | ) | | | (31,923 | ) | | | (6,766 | ) |
Implicit interest on preference loans (note 22 (a2)) | | | (517 | ) | | | (567 | ) | | | (616 | ) |
Finance expenses from unsecured senior corporate bonds (note 22) | | | (48,759 | ) | | | — | | | | — | |
Finance expenses from senior debt-Tranche A (note 22) | | | (50,561 | ) | | | — | | | | — | |
Finance expenses from senior debt-Tranche B (note 22) | | | (57,692 | ) | | | — | | | | — | |
Capitalised interest | | | 7,612 | | | | 2,399 | | | | 1,278 | |
Debt cancellation cost | | | (9,395 | ) | | | — | | | | — | |
Other finance expenses | | | (12,745 | ) | | | (9,716 | ) | | | (11,416 | ) |
| | | | | | | | | | | | |
Finance expenses | | | (200,562 | ) | | | (49,660 | ) | | | (27,087 | ) |
| | | | | | | | | | | | |
Change in fair value of financial derivatives (note 32) | | | 1,279 | | | | (7,593 | ) | | | (587 | ) |
Impairment and profit / (losses) on disposal of financial instruments | | | (805 | ) | | | 91 | | | | (245 | ) |
Exchange differences | | | (3,447 | ) | | | 1,616 | | | | (1,733 | ) |
| | | | | | | | | | | | |
Net finance income and expense | | | (197,774 | ) | | | (51,020 | ) | | | (22,585 | ) |
| | | | | | | | | | | | |
F-65
GRIFOLS, S.A. AND SUBSIDIARIES
Notes to Consolidated Financial Statements
During 2011 the Group has capitalised interest at a rate of between 2.9% and 7.1% based on the financing received (between 2.6% and 7.1% during 2010) (see note 4 (f)).
Grifols, S.A. is authorised to present a consolidated tax return with Diagnostic Grifols, S.A., Movaco, S.A., Laboratorios Grifols, S.A., Instituto Grifols, S.A., Logister, S.A., Biomat, S.A., Grifols Viajes, S.A., Grifols International, S.A., Grifols Engineering, S.A., Arrahona Optimus, S.L. and Gri-Cel, S.A. Grifols, S.A., in its capacity as Parent, is responsible for the presentation and payment of the consolidated tax return. Under prevailing tax law, the Spanish companies pay 30% tax, which may be reduced by certain deductions.
The North American company Grifols Inc. is also authorised to present consolidated tax returns in the USA with Grifols Biologicals Inc., Grifols USA, LLC., Biomat USA, Inc., Plasmacare, Inc, Grifols Therapeutics Inc, Talecris Plasma Resources, Inc. and Talecris Biotherapeutics Overseas Services. The profits of the companies domiciled in the USA, determined in accordance with prevailing tax legislation, are subject to tax of approximately 38% of taxable income, which may be reduced by certain credits.
| | a) | Reconciliation of accounting and taxable income |
Details of the income tax expense are as follows:
| | | | | | | | | | | | |
| | | Thousands of Euros | |
| | | 31/12/2011 | | | 31/12/2010 | | | 31/12/2009 | |
Profit for the year before income tax | | | 80,023 | | | | 157,784 | | | | 203,994 | |
Tax at 30% | | | 24,007 | | | | 47,335 | | | | 61,198 | |
Permanent differences | | | 11,111 | | | | 2,300 | | | | 1,935 | |
Effect of different tax rates | | | 6,027 | | | | 3,346 | | | | 5,159 | |
Deductions for research and development | | | (13,679 | ) | | | (7,281 | ) | | | (8,106 | ) |
Other deductions | | | (2,016 | ) | | | (3,516 | ) | | | (4,548 | ) |
Other income tax expenses/(income) | | | 4,345 | | | | 333 | | | | 786 | |
| | | | | | | | | | | | |
Total income tax expense | | | 29,795 | | | | 42,517 | | | | 56,424 | |
| | | | | | | | | | | | |
Deferred tax expenses | | | (13,509 | ) | | | 15,547 | | | | 8,832 | |
Current income tax | | | 43,304 | | | | 26,970 | | | | 47,592 | |
| | | | | | | | | | | | |
Total | | | 29,795 | | | | 42,517 | | | | 56,424 | |
| | | | | | | | | | | | |
F-66
GRIFOLS, S.A. AND SUBSIDIARIES
Notes to Consolidated Financial Statements
| | b) | Deferred tax assets and liabilities |
Details of deferred tax assets and liabilities are as follows:
| | | | | | | | | | | | |
| | | Thousands of Euros | |
| | | Tax Effect | |
| | | 31/12/2011 | | | 31/12/2010 | | | 31/12/2009 | |
Assets | | | | | | | | | | | | |
Tax credits (deductions) in Spain | | | 11,940 | | | | 4,830 | | | | 5,992 | |
Tax credits (deductions) in USA | | | 22,775 | | | | — | | | | — | |
Tax loss carryforwards | | | 18,797 | | | | 1,233 | | | | 88 | |
Fixed assets, amortisation and depreciation | | | 6,267 | | | | 998 | | | | 728 | |
Unrealised margins on inventories | | | 25,783 | | | | 19,256 | | | | 19,814 | |
Provision for bad debts | | | 1,801 | | | | 395 | | | | 444 | |
Inventories | | | 27,312 | | | | 235 | | | | 225 | |
Cash flow hedges | | | 13,658 | | | | 1,120 | | | | 1,247 | |
Other provisions | | | 20,424 | | | | 4,297 | | | | 2,439 | |
Litigation provisions | | | 14,679 | | | | — | | | | — | |
Interest | | | 15,712 | | | | — | | | | — | |
Others | | | 6,676 | | | | 2,525 | | | | 2,418 | |
| | | | | | | | | | | | |
| | | 185,824 | | | | 34,889 | | | | 33,395 | |
| | | | | | | | | | | | |
Liabilities | | | | | | | | | | | | |
Goodwill | | | 35,611 | | | | 17,948 | | | | 15,186 | |
Revaluations of assets | | | 11,501 | | | | 15,210 | | | | 15,011 | |
Fixed assets, amortisation and depreciation | | | 59,843 | | | | 40,520 | | | | 23,873 | |
Finance leases | | | 2,140 | | | | 3,396 | | | | 3,634 | |
Provision for investments | | | 1,650 | | | | 696 | | | | 873 | |
Fair value of fixed assets | | | 63,860 | | | | — | | | | — | |
Fair value of intangible assets | | | 342,842 | | | | — | | | | — | |
Fair value of provisions | | | (15,442 | ) | | | — | | | | — | |
Fair value of inventories | | | (12,320 | ) | | | — | | | | — | |
Debt cancellation costs | | | 43,538 | | | | — | | | | — | |
Others | | | 5,218 | | | | 1,371 | | | | 1,748 | |
| | | | | | | | | | | | |
| | | 538,441 | | | | 79,141 | | | | 60,325 | |
| | | | | | | | | | | | |
Movement in deferred tax assets and liabilities is as follows:
| | | | | | | | | | | | |
| | | Thousands of Euros | |
| | | 2011 | | | 2010 | | | 2009 | |
Deferred tax assets | | | | | | | | | | | | |
Balance at 1 January | | | 34,889 | | | | 33,395 | | | | 34,297 | |
Movements during the year | | | 69,238 | | | | 990 | | | | (1,478 | ) |
Movements in equity during the year | | | 12,687 | | | | (127 | ) | | | — | |
Business combinations (note 3) | | | 55,985 | | | | — | | | | 500 | |
Adjustments for changes in tax rate through profit and loss | | | — | | | | — | | | | 69 | |
Translation differences | | | 13,025 | | | | 631 | | | | 7 | |
| | | | | | | | | | | | |
Balance at 31 December | | | 185,824 | | | | 34,889 | | | | 33,395 | |
| | | | | | | | | | | | |
| |
| | | Thousands of Euros | |
| | | 2011 | | | 2010 | | | 2009 | |
Deferred tax liabilities | | | | | | | | | | | | |
Balance at 1 January | | | 79,141 | | | | 60,325 | | | | 51,969 | |
Movements during the year | | | 55,729 | | | | 16,537 | | | | 7,423 | |
Business combinations (note 3) | | | 358,621 | | | | — | | | | 1,761 | |
Translation differences | | | 44,950 | | | | 2,279 | | | | (828 | ) |
| | | | | | | | | | | | |
Balance at 31 December | | | 538,441 | | | | 79,141 | | | | 60,325 | |
| | | | | | | | | | | | |
F-67
GRIFOLS, S.A. AND SUBSIDIARIES
Notes to Consolidated Financial Statements
The Spanish companies have opted to apply accelerated depreciation to certain additions to property, plant and equipment, which has resulted in the corresponding deferred tax liability.
Details of deferred tax assets and liabilities on items directly debited and credited to equity during the year are as follows:
| | | | | | | | | | | | |
| | | Thousands of Euros | |
| | | Tax effect | |
| | | 31/12/2011 | | | 31/12/2010 | | | 31/12/2009 | |
Available-for-sale financial assets | | | — | | | | — | | | | (69 | ) |
Cash flow hedges (note 17 (f)) | | | (12,687 | ) | | | 127 | | | | 1,247 | |
| | | | | | | | | | | | |
| | | (12,687 | ) | | | 127 | | | | 1,178 | |
| | | | | | | | | | | | |
The remaining assets and liabilities recognised in 2011, 2010 and 2009 were recognised on the income statement.
The Spanish consolidated companies have deductions pending application at 31 December 2011 mainly in respect of research and development, which are detailed below:
| | | | | | | | | | | | |
Year of origin | | 2011 | | | 2010 | | | Applicable
through | |
2008 | | | — | | | | 101 | | | | 2023 | |
2009 | | | 465 | | | | 500 | | | | 2024 | |
2010 | | | 3,801 | | | | 4,229 | | | | 2025 | |
2011 | | | 7,674 | | | | — | | | | 2026 | |
| | | | | | | | | | | | |
| | | 11,940 | | | | 4,830 | | | | | |
| | | | | | | | | | | | |
Most of the US tax deductions pending application are available for 20 years from their date of origin.
At 31 December 2011 the Group has recognised an amount of Euros 11,940 thousand from Spanish companies and Euros 22,775 thousand from US companies (Euros 4,830 thousand at 31 December 2010) in respect of tax credits derived from deductions pending application, on considering their future recovery to be reasonably certain.
At 31 December 2011 the Group has future tax deductions of Euros 23,261 thousand (Euros 23,685 thousand at 31 December 2010) pending application as a result of goodwill generated on the acquisition of Biomat USA, Inc. This amount will be deducted annually from the taxable profits until 2022. The yearly amount that has been applied in 2011 at the tax rate of 30% has been Euros 424 thousand (Euros 2,121 thousand in 2010). The Group has recognised a deferred tax liability of Euros 15,272 thousand for the deductions applied for this item at 31 December 2011 (Euros 14,848 thousand at 31 December 2010).
At 31 December 2011 the Group has future tax deductions of Euros 9,599 thousand (Euros 9,727 thousand at 31 December 2010) pending application as a result of goodwill generated on the acquisition of Plasmacare, Inc. This amount will be deducted annually from the taxable profits until 2026. The yearly amount applied in 2011 at the tax rate of 30% has been Euros 128 thousand (Euros 641 thousand in 2010). The Group has recognised a deferred tax liability of Euros 3,228 thousand for the deductions applied for this item at 31 December 2011 (Euros 3,100 thousand at 31 December 2010).
At 31 December 2011 the Group has recognised tax loss carryforwards of Euros 18,797 thousand (Euros 1,233 thousand at 31 December 2010 and Euros 88 thousand at 31 December 2009). These tax credits derive from the US companies and are available for 20 years from their date of origin.
The Group has tax loss carryforwards of Euros 2,670 thousand from Grifols Portugal which have not been recognised as deferred tax assets (Euros 1,231 thousand at 31 December 2010 and 1,117 thousand at 31 December 2009). Additionally, the Group has not recognised the tax effect of the tax loss carryforwards of Grifols Brasil, which amount to Euros 464 thousand in 2011. The remaining companies do not have significant tax loss carryforwards that have not been recognised.
| | c) | Years open to inspection |
Under prevailing legislation, taxes cannot be considered to be definitively settled until the returns filed have been inspected by the taxation authorities, or the prescription period has elapsed.
F-68
GRIFOLS, S.A. AND SUBSIDIARIES
Notes to Consolidated Financial Statements
During 2011 the following events had arisen in relation to the tax inspections performed in Group companies:
| | • | | Logística Grifols, S.A. de CV: Tax report on the financial statements for 2005 and 2006. Group management does not expect any significant liability to derive from this inspection. |
| | • | | Grifols Brasil, Lda.: Value-added tax on sales and services for 2006 to 2010. Group management does not expect any significant liability to derive from this inspection. |
| | • | | Grifols Therapeutics, Inc.: Notification of inspection of “North Carolina Income and Franchise Tax” for 2006 to 2008 and “Personal Property Tax (Johnston County)” from 2006 to 2010. The Group does not expect any significant liability to derive from this inspection. |
| | • | | Talecris Plasma Resources, Inc.: Notification of inspection of “North Carolina Income and Franchise Tax” for 2006 to 2008. The Group does not expect any significant liability to derive from this inspection. |
No significant liabilities have arisen as a result of the inspection of income tax for 2006, 2007 and 2008 in Grifols Inc. and subsidiaries, which was concluded in 2011.
During 2010 the following events had arisen in relation to the tax inspections performed in Group companies:
| | • | | On 30 June 2010, in relation to the inspection underway on Grifols, S.A., Instituto Grifols, S.A., Laboratorios Grifols, S.A. and Movaco, S.A., the Group has received assessments for income tax, value added tax (VAT), personal income tax and withholding tax on investment income. The total amount settled was Euros 586 thousand and the income tax expense amounts to Euros 1,257 thousand. |
| | • | | During 2010 the tax inspection on the income tax, VAT and withholdings for 2006 of Grifols Italia, S.p.A. was concluded, implying no significant payment for the Group. |
| | • | | At 30 June 2010 Grifols, Inc. and subsidiaries received notification of income tax inspection for the years closed 31 December 2006, 2007 and 2008. Due to, among other reasons, differences in the interpretation of prevailing tax legislation, the Group’s directors have set up a provision of Euros 1,860 thousand, which is recognised under “income tax” in the income statement and under “public entities, other “ in the balance sheet. |
| | (a) | Operating leases (as lessee) |
At 31 December 2011 and 2010 the Group leases buildings from third parties under operating leases.
In addition to the lease contracts described in note 9 (h) (i), the Group has warehouses and buildings contracted under operating lease. The duration of these lease contracts ranges from between 1 to 30 years. Contracts may be renewed on termination. Lease instalments are adjusted periodically in accordance with the price index established in each contract. One Group company has entered into lease contracts which include contingent rents. These contingent rents have been based on production capacity, surface area used and the real estate market and are expensed on a straight line basis.
Operating lease instalments of Euros 36,095 thousand have been recognised as an expense for the year at 31 December 2011 (Euros 19,272 thousand at 31 December 2010 and Euros 17,364 thousand at 31 December 2009) (see note 27) and comprise minimum lease payments.
Future minimum payments on non-cancellable operating leases at 31 December 2011, 2010 and 2009 are as follows:
| | | | | | | | | | | | |
| | | Thousands of Euros | |
| | | 31/12/2011 | | | 31/12/2010 | | | 31/12/2009 | |
Maturity: | | | | | | | | | | | | |
Up to 1 year | | | 53,054 | | | | 13,769 | | | | 10,098 | |
Between 1 and 5 years | | | 180,802 | | | | 31,003 | | | | 25,943 | |
More than 5 years | | | 72,744 | | | | 7,856 | | | | 8,084 | |
| | | | | | | | | | | | |
Total future minimum payments | | | 306,600 | | | | 52,628 | | | | 44,125 | |
| | | | | | | | | | | | |
F-69
GRIFOLS, S.A. AND SUBSIDIARIES
Notes to Consolidated Financial Statements
| | (b) | Operating leases (as lessor) |
The contract under which the Group leased a building to third parties expired on 31 March 2011, and consequently the Group has no minimum lease payments receivable at 31 December 2011.
Income of Euros 24 thousand has been recognised for 2011 (Euros 96 thousand for 2010 and Euros 85 thousand in 2009).
| | | | | | | | | | | | |
| | | Thousands of Euros | |
| | | 31/12/2011 | | | 31/12/2010 | | | 31/12/2009 | |
Maturity: | | | | | | | | | | | | |
Up to 1 year | | | — | | | | 64 | | | | 91 | |
Between 1 and 5 years | | | — | | | | 21 | | | | 56 | |
More than 5 years | | | — | | | | — | | | | 10 | |
| | | | | | | | | | | | |
Total future minimum payments | | | — | | | | 85 | | | | 157 | |
| | | | | | | | | | | | |
| (31) | Other Commitments with Third Parties and Other Contingent Liabilities |
The Group has not extended any security or bank guarantees to third parties.
| | (b) | Guarantees to third parties |
The Group has no guarantees extended to third parties.
| | (c) | Obligations with personnel |
The Group’s annual contribution to defined contribution pension plans of Spanish group companies for 2011 has amounted to Euros 522 thousand (Euros 460 thousand for 2010).
In successive years this contribution will be defined through labour negotiations.
Savings plan and profit-sharing plan
The Group has a defined contribution plan (savings plan), which qualifies as a deferred salary arrangement under Section 401 (k) of the Internal Revenue Code (IRC). Once eligible, employees may elect to contribute a portion of their salaries to the savings plan, subject to certain limitations. Grifols matches 100% of the first 3% of employee contributions and 50% of the next 2%. Group and employee contributions are fully vested when contributed. The plan assets are held in trust and invested as directed by the plan participants. The total cost of matching contributions to the savings plan was US Dollars 8.1 million for the year ended 31 December 2011 for legacy Grifols and for the seven month period ended 31 December 2011 for newly acquired companies. The recognition of this amount is consistent with each participant’s salary.
As a result of the acquisition, the savings plan now includes a profit sharing portion. Under this plan, the Group may elect to contribute up to 3% of eligible employees’ earnings to their savings plan accounts, as defined. For 2011, Grifols has approved a payout of 1.5% of eligible earnings, as defined. The cost of the profit-sharing portion of the savings plan was US Dollars 2.4 million for the seven-month period ended 31 December 2011. The recognition of this amount is consistent with each participant’s salary. This plan has been terminated at 31 December 2011 and the final payout will take place in March 2012.
Supplemental savings plan
As a result of the acquisition, the Group has a supplemental savings plan, which is an unfunded non-qualified deferred compensation plan in which employees at certain executive levels are eligible to defer pre-tax earnings and make additional contributions subject to certain limitations. The contributions matched by the Group are similar to those made in the savings plan and are fully vested when contributed. The contributions matched for the periods presented are not material to the consolidated financial statements. At 31 December 2011 US Dollars 3.9 million has been recognised under non-current provisions in the consolidated balance sheet. As from 31 December 2011, no further contributions to this plan will be permitted.
F-70
GRIFOLS, S.A. AND SUBSIDIARIES
Notes to Consolidated Financial Statements
Other plans
An unfunded defined benefit pension plan is provided to certain Talecris Biotherapeutics, GmbH employees in Germany as required by statutory law. The pension cost relating to this plan was not material for the periods presented.
Details of the Group’s commitments to purchase plasma at 31 December 2011 are as follows:
| | | | |
Years | | Thousands of US Dollars | |
2012 | | | 101,203 | |
2013 | | | 76,773 | |
2014 | | | 92,140 | |
2015 | | | 94,443 | |
2016 | | | 89,740 | |
| | (e) | Judicial procedures and arbitration |
Details of legal proceedings in which the Company or Group companies are involved are as follows:
Instituto Grifols, S.A.
| | • | | A claim brought against the Health Board of Castilla y León in February 2005. |
The plaintiff (an individual) claimed Euros 180 thousand in damages due to having allegedly contracted Hepatitis C. The health authorities requested that this claim be extended to include the Company.
This claim was rejected by the Spanish High Court on 30 December 2010, but the ruling was subsequently appealed by the claimant. The Group is currently awaiting the final ruling on this litigation.
| | • | | The Company was notified in 2007 of a claim for maximum damages of Euros 12,960 thousand filed by a group of 100 Catalan haemophiliacs against all plasma fractionation companies. During 2008 this claim was rejected, and the ruling appealed. Notification was published on 21 January 2011 that on 18 January 2011 the Barcelona Provincial Court had rejected the haemophiliacs’ claim. The Group is currently awaiting the ruling on the appeal filed by the counterparties with the Catalan High Court. |
Grifols Biologicals Inc.
| | • | | Legal proceedings (consent decree) which were brought against the plasma fractioning centre in Los Angeles. |
The blood plasma fractioning centre in Los Angeles is managed through consent decree which was applied for in January 1998 to the Courts by the Food and Drug Administration (FDA) and US Department of Justice as a result of an infringement of FDA regulations committed by the former owner of the centre (Alpha Therapeutic Corporation, hereinafter A.T.C.). As a result of this consent decree, the Los Angeles centre is subject to strict FDA audits and may only sell products manufactured in the centre subsequent to prior authorisation.
In March 2004 as a result of improvements to the centre made by the Group, the FDA awarded several free sales certificates for the former ATC products manufactured in this centre.
Based on the current level of compliance, there are no commercial activities that are prohibited or limited by the consent decree. The Company cannot guarantee if or when the consent decree will be lifted.
No provision has been made for these legal issues as the Group considers that these will not have a probable adverse impact for the Group.
| | (f) | Plasma Centers of America, LLC and G&M Crandall Limited Family Partnership |
On 13 December 2010, a jury in the state court case rendered a verdict in the amount of US Dollar 37 million in favour of Plasma Centers of America, LLC (PCA) against Talecris Plasma Resources Inc. (TPR) in a breach of contract claim, which was confirmed by the court in post trial motions. The Talecris management filed an appeal to the North Carolina Court of
F-71
GRIFOLS, S.A. AND SUBSIDIARIES
Notes to Consolidated Financial Statements
Appeals to review the judgement entered in this case. In the event that the jury’s verdict is confirmed, a simple interest rate of 8% will be imposed by law from the date of the breach, amounting to approximately US Dollars 9.8 million at 31 December 2011, US Dollars 1.7 million of which have been accrued since the date on which Talecris was acquired.
The current provisions in the consolidated balance sheet related to the PCA judgment amounts to US Dollars 46,6 million (Euros 36 million).
During the first quarter of 2011, the Talecris Group secured an appeal bond from a surety company in the amount of US Dollars 25 million in regard to this litigation.
| | (g) | Foreign Corrupt Practices Act (FCPA) |
The Group is carrying out an internal investigation, which was underway before the acquisition, into potential violations of the Foreign Corrupt Practices Act (FCPA) of which the Talecris Group became aware while conducting an unrelated review. The FCPA investigation is being conducted by outside counsel. The investigation initially focused on sales to certain Eastern European and Middle Eastern countries, primarily Belarus, Russia, and Iran, but the Group is also reviewing sales practices in Brazil, China, Georgia, Turkey and other countries as deemed appropriate.
In July 2009, the Talecris Group voluntarily contacted the U.S. Department of Justice (DOJ) to advise them of the investigation and to offer cooperation in any investigation that the DOJ might want to conduct or that it wants Talecris to conduct. The DOJ has not indicated what action it may take, if any, against the Group or any individual, or the extent to which it may conduct its own investigation. Even though Talecris self-disclosed this matter the DOJ or other federal agencies may seek to impose sanctions that may include, among other things, debarment, injunctive relief, disgorgement, fines, penalties, appointment of a monitor, appointment of new control staff, or enhancement of existing compliance and training programs. Other countries in which Talecris has done business may initiate their own investigations and impose similar penalties. As a result of this investigation, shipments to some of these countries have been suspended until the Group has additional safeguards in place. In some cases, safeguards involved terminating consultants and suspending relations with or terminating distributors in countries under investigation as circumstances warranted. The Group made an initial presentation of some of its findings to the DOJ in July 2011 and will continue to present its findings from the investigation to the DOJ. Given the preliminary nature of the findings, that investigation continues and the uncertainties regarding this matter, the final outcome is still uncertain. The Group’s directors consider that the final ruling on this litigation could have a significant impact on the financial statements of the Group. As this litigation is currently underway, the Group’s legal advisors recommend disclosing no more than the above information in these consolidated financial statements, as disclosing additional information could seriously harm the Group’s interests.
| | (h) | Compliance with the Pharmaceutical Pricing Agreement |
In November 2009, the Talecris Group received a letter from the United States Attorney’s Office for the Eastern District of Pennsylvania (USAO). The USAO requested a meeting to review the compliance with the terms of the Pharmaceutical Pricing Agreement (PPA) under the Public Health Service program. Specifically, the USAO asked for information related to the sale of the IGIV product, Gamunex, under that program. In order to have federal financial participation apply to their products under the Medicaid program and to obtain Medicare Part B coverage, manufacturers are required to enter into a PPA. The PPA obligates manufacturers to charge covered entities the Public Health Service price for drugs intended for outpatient use. The Public Health Service price is based on the Medicaid rebate amount. The Group believes that they have complied with the terms of the PPA and federal law. If the USAO determines that the Talecris practices are inconsistent with the terms of the PPA, the USAO has stated that it may file a civil action against us under the Anti-fraud Injunction Act and seek a court order directing the company to comply with the PPA or, potentially, proceed under some other legal theory.
The Group could also be subject to fines, damages, penalties, appointment of a monitor, or enhancement of existing compliance and training programs as a result of government action. The Group is cooperating with the investigation and intend to respond to information requests from the USAO. Based on the information obtained to date, the Group have not determined that any potential liability that may result is probable or can be reasonably estimated.
F-72
GRIFOLS, S.A. AND SUBSIDIARIES
Notes to Consolidated Financial Statements
| (32) | Financial Instruments |
Classification
Disclosure of financial instruments by nature and category is as follows:
| | | | | | | | | | | | | | | | |
| | | Thousands of Euros | |
| | | 31/12/2010 | |
| | | Available-for-
sale financial
assets | | | Loans and
receivables | | | Financial
assets/
liabilities)
held for
trading | | | Debts and
payables | |
Non-current financial assets | | | 535 | | | | 7,000 | | | | — | | | | — | |
Other current financial assets | | | — | | | | 12,946 | | | | — | | | | — | |
Financial derivatives | | | — | | | | — | | | | (8,560 | ) | | | — | |
Trade and other receivables | | | — | | | | 259,497 | | | | — | | | | — | |
Bank loans | | | — | | | | — | | | | — | | | | (392,361 | ) |
Other financial liabilities | | | — | | | | — | | | | — | | | | (20,150 | ) |
Bonds and other securities | | | — | | | | — | | | | — | | | | (456,645 | ) |
Finance lease liabilities | | | — | | | | — | | | | — | | | | (8,014 | ) |
Trade and other payables | | | — | | | | — | | | | — | | | | (160,678 | ) |
Debts with associates | | | — | | | | — | | | | — | | | | (1,162 | ) |
Other current liabilities | | | — | | | | — | | | | — | | | | (2,629 | ) |
| | | | | | | | | | | | | | | | |
| | | 535 | | | | 279,443 | | | | (8,560 | ) | | | (1,041,639 | ) |
| | | | | | | | | | | | | | | | |
| | | | | | | | | | | | |
| | | Thousands of Euros | |
| | | 31/12/2011 | |
| | | Loans and
receivables | | | Financial
assets/
liabilities)
held for
trading | | | Debts and
payables | |
Non-current financial assets | | | 9,310 | | | | — | | | | — | |
Other current financial assets | | | 13,285 | | | | — | | | | — | |
Financial derivatives | | | — | | | | (121,165 | ) | | | — | |
Trade and other receivables | | | 506,621 | | | | — | | | | — | |
Bank loans | | | — | | | | — | | | | (2,170,249 | ) |
Other financial liabilities | | | — | | | | — | | | | (23,195 | ) |
Bonds and other securities | | | — | | | | — | | | | (755,046 | ) |
Finance lease liabilities | | | — | | | | — | | | | (31,719 | ) |
Trade and other payables | | | — | | | | — | | | | (280,722 | ) |
Debts with associates | | | — | | | | — | | | | (2,435 | ) |
Other current liabilities | | | — | | | | — | | | | (15,449 | ) |
| | | | | | | | | | | | |
| | | 529,216 | | | | (121,165 | ) | | | (3,278,815 | ) |
| | | | | | | | | | | | |
Net losses and gains by financial instrument category
Details are as follows:
Financial assets
| | | | | | | | | | | | |
| | | Thousands of Euros | |
| | | 31/12/2010 | |
| | | Assets at fair
value through
profit or loss | | | Loans and
receivables | | | Total | |
Finance income at amortised cost | | | — | | | | 4,526 | | | | 4,526 | |
Change in fair value | | | 1,601 | | | | — | | | | 1,601 | |
| | | | | | | | | | | | |
Net gains/(losses) in profit and loss | | | 1,601 | | | | 4,526 | | | | 6,127 | |
| | | | | | | | | | | | |
Total | | | 1,601 | | | | 4,526 | | | | 6,127 | |
| | | | | | | | | | | | |
F-73
GRIFOLS, S.A. AND SUBSIDIARIES
Notes to Consolidated Financial Statements
| | | | | | | | | | | | | | | | |
| | | Thousands of Euros | |
| | | 31/12/2011 | |
| | | Assets at fair
value through
profit or loss | | | Loans and
receivables | | | Hedging
derivatives | | | Total | |
Finance income at amortised cost | | | — | | | | 5,761 | | | | — | | | | 5,761 | |
Change in fair value | | | 13,211 | | | | — | | | | — | | | | 13,211 | |
| | | | | | | | | | | | | | | | |
Net gains/(losses) in profit and | | | 13,211 | | | | 5,761 | | | | — | | | | 18,972 | |
| | | | | | | | | | | | | | | | |
Change in fair value | | | — | | | | — | | | | 33,871 | | | | 33,871 | |
| | | | | | | | | | | | | | | | |
Net gains/(losses) in equity | | | — | | | | — �� | | | | 33,871 | | | | 33,871 | |
| | | | | | | | | | | | | | | | |
Total | | | 13,211 | | | | 5,761 | | | | 33,871 | | | | 52,843 | |
| | | | | | | | | | | | | | | | |
Financial liabilities
| | | | | | | | | | | | | | | | |
| | | Thousands of Euros | |
| | | 31/12/2010 | |
| | | Liabilities at
fair value
through profit
or loss | | | Debts and
payables | | | Hedging
derivatives | | | Total | |
Finance expenses at amortised cost | | | — | | | | (49,660 | ) | | | — | | | | (49,660 | ) |
Change in fair value | | | (9,194 | ) | | | — | | | | — | | | | (9,194 | ) |
Reclassification of equity to profit or loss | | | — | | | | — | | | | (324 | ) | | | (324 | ) |
| | | | | | | | | | | | | | | | |
Net losses in profit and loss | | | (9,194 | ) | | | (49,660 | ) | | | (324 | ) | | | (59,178 | ) |
| | | | | | | | | | | | | | | | |
Total | | | (9,194 | ) | | | (49,660 | ) | | | (324 | ) | | | (59,178 | ) |
| | | | | | | | | | | | | | | | |
| | | | | | | | | | | | | | | | |
| | | Thousands of Euros | |
| | | 31/12/2011 | |
| | | Liabilities at
fair value
through profit
or loss | | | Debts and
payables | | | Hedging
derivatives | | | Total | |
Finance expenses at amortised cost | | | — | | | | (200,562 | ) | | | — | | | | (200,562 | ) |
Change in fair value | | | (11,932 | ) | | | — | | | | — | | | | (11,932 | ) |
Reclassification of equity to profit or loss | | | — | | | | — | | | | (2,870 | ) | | | (2,870 | ) |
| | | | | | | | | | | | | | | | |
Net losses in profit and loss | | | (11,932 | ) | | | (200,562 | ) | | | (2,870 | ) | | | (215,364 | ) |
| | | | | | | | | | | | | | | | |
Total | | | (11,932 | ) | | | (200,562 | ) | | | (2,870 | ) | | | (215,364 | ) |
| | | | | | | | | | | | | | | | |
Fair value
The fair value of High-Yield Bonds unsecured notes and tranche A and B senior debt amounts to Euros 3,266 million at 31 December 2011 (Euros 496 million corresponding to the corporate bonds at 31 December 2010). The valuation was based on observable market data.
Financial derivatives have been valued based on observable market data (level 2 of fair value hierarchy).
The fair value of financial assets and the remaining financial liabilities does not differ significantly from their carrying amount.
Financial derivatives
| | a) | Derivative financial instruments at fair value through profit or loss |
Derivative financial instruments that do not meet the hedge accounting requirements are classified and measured as financial assets or financial liabilities at fair value through profit and loss.
F-74
GRIFOLS, S.A. AND SUBSIDIARIES
Notes to Consolidated Financial Statements
At 31 December 2011 and 2010 the Group has recognised the following derivatives:
| | | | | | | | | | | | | | | | | | | | |
| | | | | | | | | Thousands of Euros | |
Derivatives | | Currency | | | Notional amount | | | Value at
31/12/11 | | | Value at
31/12/10 | | | Maturity | |
Interest rate swap | | | EUR | | | | 50,000,000 | | | | — | | | | (1,809 | ) | | | 31/12/2011 | |
Interest rate swap (cash flow hedges) | | | USD | | | | 1,522,685,000 | | | | (34,999 | ) | | | — | | | | 30/06/2016 | |
Interest rate swap (cash flow hedges) | | | EUR | | | | 100,000,000 | | | | (2,762 | ) | | | — | | | | 30/09/2014 | |
Swap option | | | EUR | | | | 100,000,000 | | | | (135 | ) | | | — | | | | 30/09/2014 | |
Swap Floor | | | USD | | | | 1,522,685,000 | | | | (801 | ) | | | — | | | | 30/06/2016 | |
Embedded floor senior debt | | | EUR | | | | 438,900,000 | | | | (13,365 | ) | | | — | | | | 01/06/2017 | |
Embedded floor senior debt | | | USD | | | | 2,493,500,000 | | | | (75,813 | ) | | | — | | | | 01/06/2017 | |
| | | | | | | | | | | | | | | | | | | | |
Total liabilities | | | | | | | | | | | (127,875 | ) | | | (1,809 | ) | | | | |
| | | | | | | | | | | | | | | | | | | | |
| | | | | | | | | | | (nota 22) | | | | (nota 22) | | | | | |
Unquoted future | | | N/A | | | | 1,000,000 | | | | 1,389 | | | | (2,821 | ) | | | 29/06/2012 | |
Unquoted future | | | N/A | | | | 2,200,000 | | | | 2,230 | | | | (3,930 | ) | | | 29/06/2012 | |
Call option (note 9 (i)) | | | N/A | | | | N/A | | | | 3,091 | | | | — | | | | miscellaneous | |
| | | | | | | | | | | | | | | | | | | | |
Total Assets | | | | | | | | | | | 6,710 | | | | (6,751 | ) | | | | |
| | | | | | | | | | | | | | | | | | | | |
| | | | | | | | | | | (nota 11 & 14) | | | | (nota 22) | | | | | |
As the floor related to Tranches A and B of the senior financing is in the money, an embedded derivative exists on these contracts, which has been measured at fair value and recognised separately from the loans.
In June 2011, the Group contracted two derivatives in order to comply with the compulsory hedging requirements stipulated in the credit agreement. These derivatives comprise a step-up interest rate swap and a floor swap, which have an initial nominal amount of US Dollars 1,550 each. The interest rate swap complies with hedge accounting criteria (see note 17 (f)).
In October 2011, the Group contracted a variable to fixed interest-rate swap, which has a nominal of Euros 100 million and expires in September 2014. This interest-rate swap also complies with hedge accounting criteria (see note 17 (f)).
During 2009 the Company contracted two unquoted futures contracts, the notional underlying of which consists of the Company’s shares, with a solvent financial institution. The two contracts have 2 million and 2.2 million underlying with an exercise price of Euros 11.6107 and Euros 11.9864, respectively. The initial expiry of the contracts was 30 December 2010, although the Company had the option of terminating them prior to that date. The contracts are settled by differences between the market value of the notional underlying and the exercise price. In March, June and December 2011 the Group agreed to extend the futures contract to 29 June 2012, through a novation without liquidation under the same terms and conditions.
| | b) | Bond issue hedging derivative financial instruments |
See explanation in note 17 (f).
Credit risk
Exposure to credit risk
The carrying amount of financial assets represents the maximum exposure to credit risk. At 31 December 2011 and 2010 the maximum level of exposure to credit risk is as follows:
| | | | | | | | | | | | |
| | | | | | Thousands of Euros | |
Carrying amount | | Note | | | 31/12/2011 | | | 31/12/2010 | |
Non-current financial assets | | | 11 | | | | 9,310 | | | | 7,535 | |
Non-current financial derivatives | | | 11 | | | | 3,091 | | | | — | |
Other current financial assets | | | 14 | | | | 13,285 | | | | 12,946 | |
Current financial derivatives | | | 14 | | | | 3,619 | | | | — | |
Trade receivables | | | 13 | | | | 408,263 | | | | 224,355 | |
Other receivables | | | 13 | | | | 98,358 | | | | 35,142 | |
Cash and cash equivalents | | | 16 | | | | 340,586 | | | | 239,649 | |
| | | | | | | | | | | | |
| | | | | | | 876,512 | | | | 519,627 | |
| | | | | | | | | | | | |
F-75
GRIFOLS, S.A. AND SUBSIDIARIES
Notes to Consolidated Financial Statements
The maximum level of exposure to risk associated with receivables at 31 December 2011 and 2010, by geographical area, is as follows:
| | | | | | | | |
| | | Thousands of Euros | |
Carrying amount | | 31/12/2011 | | | 31/12/2010 | |
Domestic | | | 129,917 | | | | 70,517 | |
EU countries | | | 53,408 | | | | 50,210 | |
United States of America | | | 122,204 | | | | 43,833 | |
Other European countries | | | 28,270 | | | | 3,162 | |
Other regions | | | 74,464 | | | | 56,633 | |
| | | | | | | | |
| | | 408,263 | | | | 224,355 | |
| | | | | | | | |
Impairment losses
Details of the maturity of trade receivables, net of impairment provisions are as follows:
| | | | | | | | |
| | | Thousands of Euros | |
| | | 31/12/2011 | | | 31/12/2010 | |
Not matured | | | 246,556 | | | | 148,838 | |
Less than 1 month | | | 43,517 | | | | 21,860 | |
1 to 4 months | | | 50,919 | | | | 32,729 | |
4 months to 1 year | | | 51,248 | | | | 14,812 | |
More than a year | | | 16,023 | | | | 6,116 | |
| | | | | | | | |
| | | 408,263 | | | | 224,355 | |
| | | | | | | | |
Unimpaired receivables that are past due mainly relate to public entities.
Movement in the provision for bad debts was as follows:
| | | | | | | | | | | | |
| | | Thousands of Euros | |
| | | 31/12/2011 | | | 31/12/2010 | | | 31/12/2009 | |
Opening balance | | | 3,777 | | | | 4,038 | | | | 3,172 | |
Business combination | | | 2,251 | | | | 0 | | | | 0 | |
Net provisions for the year | | | 2,974 | | | | 357 | | | | 712 | |
Net cancellations for the year | | | (323 | ) | | | (796 | ) | | | (42 | ) |
Translation differences | | | 192 | | | | 178 | | | | 196 | |
| | | | | | | | | | | | |
Closing balance | | | 8,871 | | | | 3,777 | | | | 4,038 | |
| | | | | | | | | | | | |
An analysis of the concentration of credit risk is provided in note 5.
Liquidity risk
Details of the contracted maturity date of financial liabilities, including borrowing costs and excluding the effects of offsetting agreements, are as follows:
| | | | | | | | | | | | | | | | | | | | | | | | | | | | | | | | |
| | | | | | Thousands of Euros | |
Carrying amount | | Note | | | Carrying
amount at
31/12/10 | | | Contractual
flows | | | 6 months
or less | | | 6 - 12
months | | | 1-2 years | | | 2-5 years | | | More
than 5
years | |
financial liabilities | | | | | | | | | | | | | | | | | | | | | | | | | | | | | | | | |
Bank loans | | | 22 | | | | 392,361 | | | | 420,168 | | | | 117,256 | | | | 66,428 | | | | 87,986 | | | | 92,561 | | | | 55,937 | |
Other financial liabilities | | | 22 | | | | 20,150 | | | | 22,361 | | | | 8,150 | | | | 2,134 | | | | 3,467 | | | | 6,283 | | | | 2,327 | |
Bonds and other securities | | | 22 | | | | 456,645 | | | | 728,893 | | | | 23,771 | | | | 15,537 | | | | 31,073 | | | | 93,220 | | | | 565,292 | |
Finance lease liabilities | | | 22 | | | | 8,014 | | | | 8,629 | | | | 2,034 | | | | 1,505 | | | | 2,412 | | | | 2,348 | | | | 330 | |
Debts with associates | | | 33 | | | | 1,162 | | | | 1,162 | | | | 1,162 | | | | — | | | | — | | | | — | | | | — | |
Suppliers | | | 23 | | | | 160,678 | | | | 160,678 | | | | 160,657 | | | | 21 | | | | — | | | | — | | | | — | |
Other current liabilities | | | 24 | | | | 2,629 | | | | 2,629 | | | | 2,629 | | | | — | | | | — | | | | — | | | | — | |
Derivative financial liabilities | | | | | | | | | | | | | | | | | | | | | | | | | | | | | | | | |
Interest rate swap | | | 22 | | | | 1,809 | | | | 1,809 | | | | — | | | | — | | | | — | | | | 1,809 | | | | — | |
Unquoted futures | | | 22 | | | | 6,751 | | | | 6,751 | | | | 6,751 | | | | — | | | | — | | | | — | | | | — | |
| | | | | | | | | | | | | | | | | | | | | | | | | | | | | | | | |
Total | | | | | | | 1,050,199 | | | | 1,353,080 | | | | 322,410 | | | | 85,625 | | | | 124,938 | | | | 196,221 | | | | 623,886 | |
| | | | | | | | | | | | | | | | | | | | | | | | | | | | | | | | |
F-76
GRIFOLS, S.A. AND SUBSIDIARIES
Notes to Consolidated Financial Statements
| | | | | | | | | | | | | | | | | | | | | | | | | | | | | | | | |
| | | | | | Thousands of Euros | |
Carrying amount | | Note | | | Carrying
amount at
31/12/11 | | | Contractual
flows | | | 6 months
or less | | | 6 - 12
months | | | 1-2 years | | | 2- 5 years | | | More than
5 years | |
financial liabilities | | | | | | | | | | | | | | | | | | | | | | | | | | | | | | | | |
Bank loans | | | 22 | | | | 2,170,249 | | | | 2,766,716 | | | | 118,896 | | | | 141,979 | | | | 248,770 | | | | 1,166,336 | | | | 1,090,735 | |
Other financial liabilities | | | 22 | | | | 23,195 | | | | 27,459 | | | | 13,904 | | | | 2,725 | | | | 3,112 | | | | 5,591 | | | | 2,127 | |
Bonds and other securities | | | 22 | | | | 755,046 | | | | 1,211,539 | | | | 64,419 | | | | 24,756 | | | | 49,070 | | | | 143,521 | | | | 929,773 | |
Finance lease liabilities | | | 22 | | | | 31,719 | | | | 35,837 | | | | 3,918 | | | | 3,937 | | | | 8,281 | | | | 17,482 | | | | 2,219 | |
Debts with associates | | | 33 | | | | 2,435 | | | | 2,435 | | | | 2,435 | | | | — | | | | — | | | | — | | | | — | |
Suppliers | | | 23 | | | | 280,722 | | | | 280,722 | | | | 280,712 | | | | 10 | | | | — | | | | — | | | | — | |
Other current liabilities | | | 24 | | | | 15,449 | | | | 15,449 | | | | 5,026 | | | | 10,423 | | | | — | | | | — | | | | — | |
Derivative financial liabilities | | | 22 | | | | 127,875 | | | | 127,875 | | | | 0 | | | | 0 | | | | 2,897 | | | | 35,800 | | | | 89,178 | |
| | | | | | | | | | | | | | | | | | | | | | | | | | | | | | | | |
Total | | | | | | | 3,406,690 | | | | 4,468,032 | | | | 489,310 | | | | 183,830 | | | | 312,130 | | | | 1,368,730 | | | | 2,114,032 | |
| | | | | | | | | | | | | | | | | | | | | | | | | | | | | | | | |
Currency risk
The Group’s exposure to currency risk is as follows (expressed in thousands of Euros):
| | | | | | | | |
| | | Thousands of Euros | |
| | | 31/12/2010 | |
| | | EUR (*) | | | USD (**) | |
Trade receivables | | | 67 | | | | 3,938 | |
Receivables from Group companies | | | 12 | | | | — | |
Loans to Group companies | | | 16,852 | | | | — | |
Cash and cash equivalents | | | 415 | | | | 45 | |
Trade payables | | | (533 | ) | | | (6,200 | ) |
Payables to Group companies | | | (6,828 | ) | | | (21,455 | ) |
Non-current bank loans | | | (5,875 | ) | | | — | |
Current bank loans | | | (979 | ) | | | (262 | ) |
Non-current bonds | | | (9,860 | ) | | | — | |
| | | | | | | | |
Balance sheet exposure | | | (6,729 | ) | | | (23,934 | ) |
| | | | | | | | |
| (*) | balances in Euros in subsidiaries with USD local currency |
| (**) | Balances in USD in subsidiaries with Euro local currency |
| | | | | | | | |
| | | Thousands of Euros | |
| | | 31/12/2011 | |
| | | EUR (*) | | | USD (**) | |
Trade receivables | | | 4,226 | | | | 4,700 | |
Receivables from Group companies | | | 63,449 | | | | 77 | |
Loans to Group companies | | | — | | | | — | |
Cash and cash equivalents | | | 9,544 | | | | 3,069 | |
Trade payables | | | (3,277 | ) | | | (15,653 | ) |
Payables to Group companies | | | (18,564 | ) | | | (8,708 | ) |
Loans to Group companies | | | (29,644 | ) | | | — | |
| | | | | | | | |
Balance sheet exposure | | | 25,734 | | | | (16,515 | ) |
| | | | | | | | |
| (*) | balances in Euros in subsidiaries with USD local currency |
| (**) | Balances in USD in subsidiaries with Euro local currency |
F-77
GRIFOLS, S.A. AND SUBSIDIARIES
Notes to Consolidated Financial Statements
The most significant exchange rates applied during the years ended 31 December 2011 and 2010 are as follows:
| | | | | | | | | | | | | | | | |
| | | Average exchange rate | | | Closing exchange rate | |
| Euro | | 2011 | | | 2010 | | | 31/12/2011 | | | 31/12/2010 | |
USD | | | 1.39 | | | | 1,34 | | | | 1.29 | | | | 1,34 | |
| | | | | | | | | | | | | | | | |
A sensitivity analysis for foreign exchange fluctuations is as follows:
Had the US Dollar strengthened by 10% against the Euro at 31 December 2011, equity would have increased by Euros 137,773 thousand (Euros 34,973 thousand at 31 December 2010) and profit would have increased by Euros 922 thousand (at 31 December 2010 it would have decreased by Euros 3,066 thousand). This analysis assumes that all other variables are held constant, especially that interest rates remain constant. This analysis has been performed using the same criteria as in 2010.
A 10% weakening of the US Dollar against the Euro at 31 December 2011 and 2010 would have had the opposite effect for the amounts shown above, all other variables being held constant.
Interest-rate risk
Interest-rate profile
To date, the profile of interest on interest-bearing financial instruments is as follows:
| | | (2,201,968) | | | | (2,201,968) | |
| | | Thousands of Euros | |
| | | 31/12/2011 | | | 31/12/2010 | |
Fixed-interest financial instruments | | | | | | | | |
Financial assets | | | 19,040 | | | | 19,220 | |
Financial liabilities | | | (755,046 | ) | | | (457,521 | ) |
| | | | | | | | |
| | | (736,006 | ) | | | (438,301 | ) |
Variable-interest financial instruments | | | | | | | | |
Financial liabilities | | | (2,201,968 | ) | | | (399,499 | ) |
| | | | | | | | |
| | | (2,201,968 | ) | | | (399,499 | ) |
| | | | | | | | |
| | | (2,937,974 | ) | | | (837,800 | ) |
| | | | | | | | |
Sensitivity analysis
Had the interest rate at 31 December 2011 been 100 basis points higher, the interest expense would have increased by Euros 4.5 million, the finance expense due to changes in the value of derivatives would have been Euros 28 million lower and equity would have increased as a result of changes in derivatives to which hedge accounting is applied.
A 100 basis point variation in interest rates at the presentation date of 31 December 2010 would have varied equity and consolidated profit after income tax by Euros 3,794 thousand.
| (33) | Balances and Transactions with Related Parties |
Details of balances with related parties are as follows:
| | | (2,201,968) | | | | (2,201,968) | |
| | | Thousands of Euros | |
| | | 31/12/2011 | | | 31/12/2010 | |
Receivables from associates | | | — | | | | 5 | |
Receivables from other related parties | | | 63,305 | | | | — | |
Debts with associates | | | (2,435 | ) | | | (1,162 | ) |
Payables to members of the board of directors | | | (97 | ) | | | (62 | ) |
Payables to other related parties | | | (10,482 | ) | | | (4,641 | ) |
| | | | | | | | |
| | | 50,291 | | | | (5,860 | ) |
| | | | | | | | |
Payables are included in suppliers and trade payables (see note 23).
F-78
GRIFOLS, S.A. AND SUBSIDIARIES
Notes to Consolidated Financial Statements
| | (a) | Group transactions with related parties |
Group transactions with related parties during 2009 were as follows:
| | | | | | | | | | | | | | | | |
| | | Thousands of Euros | |
| | | Associates | | | Key
management
personnel | | | Other
related
parties | | | Board of
directors
of the
Company | |
Net purchases | | | (86 | ) | | | — | | | | — | | | | — | |
Net sales | | | 700 | | | | — | | | | — | | | | — | |
Other service expenses | | | — | | | | — | | | | (7,257 | ) | | | (240 | ) |
Personnel expenses | | | — | | | | (5,849 | ) | | | — | | | | (2,148 | ) |
| | | | | | | | | | | | | | | | |
| | | 614 | | | | (5,849 | ) | | | (7,257 | ) | | | (2,388 | ) |
| | | | | | | | | | | | | | | | |
Group transactions with related parties during 2010 are as follows:
| | | | | | | | | | | | | | | | |
| | | Thousands of Euros | |
| | | Associates | | | Key
management
personnel | | | Other
related
parties | | | Board of
directors
of the
Company | |
Net purchases | | | (505 | ) | | | — | | | | — | | | | — | |
Net sales | | | 14 | | | | — | | | | — | | | | — | |
Other service expenses | | | — | | | | — | | | | (12,506 | ) | | | (180 | ) |
Personnel expenses | | | — | | | | (5,839 | ) | | | — | | | | (2,066 | ) |
| | | | | | | | | | | | | | | | |
| | | (491 | ) | | | (5,839 | ) | | | (12,506 | ) | | | (2,246 | ) |
| | | | | | | | | | | | | | | | |
Dividends received by the Board of directors of the Company amounted to Euros 2,062 thousand in 2010 and Euros 6,152 thousand in 2009. No dividends were received by the Board of directors in 2011.
Group transactions with related parties during 2011 are as follows:
| | | | | | | | | | | | | | | | |
| | | Thousands of Euros | |
| | | Associates | | | Key
management
personnel | | | Other
related
parties | | | Board of
directors
of the
Company | |
Net sales | | | 102 | | | | — | | | | — | | | | — | |
Net purchases | | | (1,690 | ) | | | — | | | | — | | | | — | |
Operating lease expenses (note 9) | | | — | | | | — | | | | (4,909 | ) | | | — | |
Other service expenses | | | — | | | | — | | | | (30,671 | ) | | | (180 | ) |
Sale of fixed assets (note 9) | | | — | | | | — | | | | 233,629 | | | | — | |
Personnel expenses | | | — | | | | (5,718 | ) | | | — | | | | (2,338 | ) |
| | | | | | | | | | | | | | | | |
| | | (1,588 | ) | | | (5,718 | ) | | | 198,049 | | | | (2,518 | ) |
| | | | | | | | | | | | | | | | |
Other service expenses include contributions to non-profit organisations totalling Euros 653 thousand in 2011 (Euros 2,609 thousand in 2010 and Euros 1,857 thousand in 2009).
Other expenses for services also include costs for professional services with related companies amounting to Euros 10,388 thousand. These costs correspond to those incurred in increasing share capital and the issue of debt carried out relating to the acquisition of Talecris (Euros 7,590 thousand in 2010). This item also includes brokerage fees relating to sale and leaseback transactions in Spain and North Carolina amounting to Euros 9,309 thousand.
F-79
GRIFOLS, S.A. AND SUBSIDIARIES
Notes to Consolidated Financial Statements
One of the Company’s directors has signed a three-year consulting services contract. The director will receive annual fees of US Dollars 1 million for these services and an additional bonus of US Dollars 2 million for complying with certain conditions.
The Group contributes 0.7% of profits for each year to a non-profit organisation.
Directors representing shareholders interests have received no remuneration during 2009, 2010 and 2011.
The Group has not extended any advances or loans to the members of the board of directors or key management personnel nor has it assumed any guarantee commitments on their behalf. It has also not assumed any pension or life insurance obligations on behalf of former or current members of the board of directors or key management personnel.
On 14 February 2012 Grifols successfully amended and improved the terms and conditions of the Credit Agreement previously signed to finance the acquisition of Talecris Biotherapeutics Holding Corp. The modifications are as followings:
| | (i) | reduction of interest rates, and retranching; |
| | (ii) | removal of covenants relating to limitations in fixed assets investments and the debt service coverage ratio; |
| | (iii) | amendment to the leverage ratio limiting the distribution of dividends, improving from the old ratio of 3.75 to the new ratio of 4.5 times, as well as the relaxing of certain conditions relative to certain contracts; |
| | (iv) | voluntary debt repayment through early amortization of US Dollars 240 million. |
These changes were made to provide savings in finance expenses as well as to provide the Group increased financial flexibility.
| (35) | Condensed Consolidating Financial Information |
The High Yield Senior Unsecured Notes were issued by Grifols Inc., which is a wholly-owned subsidiary of Grifols, S.A., and are jointly and severally, irrevocably and fully and unconditionally guaranteed by Grifols, S.A. and certain other of its wholly-owned subsidiaries (‘the Guarantors’). Supplemental condensed consolidating financial information is presented in Appendix V comprising the Group’s income statements and cash flow statements, both consolidated, for Fiscal 2011, Fiscal 2010 and Fiscal 2009 and its consolidated balance sheets as at December 31, 2011 and December 31, 2010, showing the amounts attributable to Grifols, S.A., Grifols Inc. and those of its other subsidiaries that were Guarantors as at December 31, 2011 separately from the amounts attributable to those of its subsidiaries that were not Guarantors. The condensed consolidated financial information has been prepared and presented pursuant to SEC Regulation S-X, Rule 3-10, “Financial Statements of Guarantors and Issuers of Guaranteed Securities Registered or Being Registered”, which is included in Appendix V.
The Board of Directors of Grifols, S.A. approved these Consolidated Financial Statements on 22 February 2012.
F-80
APPENDIX I
GRIFOLS, S.A. AND SUBSIDIARIES
OPERATING SEGMENTS
(expressed in thousands of Euros)
| | | | | | | | | | | | | | | | | | | | | | | | | | | | | | | | | | | | | | | | | | | | | | | | | | | | | | | | | | | | | | | | | | | | | | | | |
| | | Bioscience | | | Hospital | | | Diagnostics (*) | | | Raw Materials | | | Others / Unallocated | | | Consolidated | |
| | | 2011 | | | 2010 | | | 2009 | | | 2011 | | | 2010 | | | 2009 | | | 2011 | | | 2010 | | | 2009 | | | 2011 | | | 2010 | | | 2009 | | | 2011 | | | 2010 | | | 2009 | | | 2011 | | | 2010 | | | 2009 | |
Revenues | | | 1,531,199 | | | | 773,372 | | | | 694,969 | | | | 95,365 | | | | 89,552 | | | | 86,328 | | | | 117,358 | | | | 109,088 | | | | 103,091 | | | | 30,526 | | | | 4,815 | | | | 22,665 | | | | 21,165 | | | | 13,903 | | | | 6,133 | | | | 1,795,613 | | | | 990,730 | | | | 913,186 | |
Total revenues | | | 1,531,199 | | | | 773,372 | | | | 694,969 | | | | 95,365 | | | | 89,552 | | | | 86,328 | | | | 117,358 | | | | 109,088 | | | | 103,091 | | | | 30,526 | | | | 4,815 | | | | 22,665 | | | | 21,165 | | | | 13,903 | | | | 6,133 | | | | 1,795,613 | | | | 990,730 | | | | 913,186 | |
| | | | | | | | | | | | | | | | | | | | | | | | | | | | | | | | | | | | | | | | | | | | | | | | | | | | | | | | | | | | | | | | | | | | | | | | |
Profit/(Loss) for the segment | | | 515,214 | | | | 306,091 | | | | 297,584 | | | | 7,610 | | | | 7,401 | | | | 8,374 | | | | (14,551 | ) | | | 6,793 | | | | 12,136 | | | | 6,749 | | | | 2,110 | | | | 3,850 | | | | 17,355 | | | | 7,785 | | | | 6,133 | | | | 532,377 | | | | 330,180 | | | | 328,077 | |
| | | | | | | | | | | | | | | | | | | | | | | | | | | | | | | | | | | | | | | | | | | | | | | | | | | | | | | | | | | | | | | | | | | | | | | | |
Unallocated expense | | | | | | | | | | | | | | | | | | | | | | | | | | | | | | | | | | | | | | | | | | | | | | | | | | | (253,516 | ) | | | (120,497 | ) | | | (101,549 | ) | | | (253,516 | ) | | | (120,497 | ) | | | (101,549 | ) |
| | | | | | | | | | | | | | | | | | | | | | | | | | | | | | | | | | | | | | | | | | | | | | | | | | | | | | | | | | | | | | | | | | | | | | | | |
Operating profit | | | | | | | | | | | | | | | | | | | | | | | | | | | | | | | | | | | | | | | | | | | | | | | | | | | | | | | | | | | | | | | 278,861 | | | | 209,683 | | | | 226,528 | |
| | | | | | | | | | | | | | | | | | | | | | | | | | | | | | | | | | | | | | | | | | | | | | | | | | | | | | | | | | | | | | | | | | | | | | | | |
Finance income/expenses | | | | | | | | | | | | | | | | | | | | | | | | | | | | | | | | | | | | | | | | | | | | | | | | | | | | | | | | | | | | | | | (197,774 | ) | | | (51,020 | ) | | | (22,585 | ) |
| | | | | | | | | | | | | | | | | | | | | | | | | | | | | | | | | | | | | | | | | | | | | | | | | | | | | | | | | | | | | | | | | | | | | | | | |
Share of profit/(loss) of equity accounted investees | | | (1,064 | ) | | | (879 | ) | | | 0 | | | | 0 | | | | 0 | | | | 0 | | | | 0 | | | | 0 | | | | 51 | | | | 0 | | | | 0 | | | | 0 | | | | 0 | | | | 0 | | | | 0 | | | | (1,064 | ) | | | (879 | ) | | | 51 | |
Income tax expense | | | | | | | | | | | | | | | | | | | | | | | | | | | | | | | | | | | | | | | | | | | | | | | | | | | | | | | | | | | | | | | (29,795 | ) | | | (42,517 | ) | | | (56,424 | ) |
| | | | | | | | | | | | | | | | | | | | | | | | | | | | | | | | | | | | | | | | | | | | | | | | | | | | | | | | | | | | | | | | | | | | | | | | |
Profit for the year after tax | | | | | | | | | | | | | | | | | | | | | | | | | | | | | | | | | | | | | | | | | | | | | | | | | | | | | | | | | | | | | | | 50,228 | | | | 115,267 | | | | 147,570 | |
| | | | | | | | | | | | | | | | | | | | | | | | | | | | | | | | | | | | | | | | | | | | | | | | | | | | | | | | | | | | | | | | | | | | | | | | |
Segment assets | | | 4,722,315 | | | | 1,062,464 | | | | 994,245 | | | | 120,458 | | | | 85,992 | | | | 68,214 | | | | 107,689 | | | | 129,824 | | | | 82,202 | | | | 1,305 | | | | 954 | | | | 1,312 | | | | 0 | | | | 0 | | | | 0 | | | | 4,951,767 | | | | 1,279,234 | | | | 1,145,973 | |
Equity accounted investments | | | 1,001 | | | | 516 | | | | 0 | | | | 0 | | | | 0 | | | | 0 | | | | 0 | | | | 0 | | | | 383 | | | | 0 | | | | 0 | | | | 0 | | | | 0 | | | | 0 | | | | 0 | | | | 1,001 | | | | 516 | | | | 383 | |
Unallocated assets | | | | | | | | | | | | | | | | | | | | | | | | | | | | | | | | | | | | | | | | | | | | | | | | | | | 854,950 | | | | 609,232 | | | | 510,821 | | | | 854,950 | | | | 609,232 | | | | 510,821 | |
| | | | | | | | | | | | | | | | | | | | | | | | | | | | | | | | | | | | | | | | | | | | | | | | | | | | | | | | | | | | | | | | | | | | | | | | |
Total assets | | | | | | | | | | | | | | | | | | | | | | | | | | | | | | | | | | | | | | | | | | | | | | | | | | | | | | | | | | | | | | | 5,807,718 | | | | 1,888,982 | | | | 1,657,177 | |
| | | | | | | | | | | | | | | | | | | | | | | | | | | | | | | | | | | | | | | | | | | | | | | | | | | | | | | | | | | | | | | | | | | | | | | | |
Segment liabilities | | | 337,960 | | | | 74,489 | | | | 79,988 | | | | 12,932 | | | | 14,486 | | | | 12,579 | | | | 12,511 | | | | 12,573 | | | | 10,763 | | | | 0 | | | | 0 | | | | 0 | | | | 0 | | | | 0 | | | | 0 | | | | 363,403 | | | | 101,548 | | | | 103,330 | |
Unallocated liabilities | | | | | | | | | | | | | | | | | | | | | | | | | | | | | | | | | | | | | | | | | | | | | | | | | | | 3,779,321 | | | | 1,080,044 | | | | 975,319 | | | | 3,779,321 | | | | 1,080,044 | | | | 975,319 | |
| | | | | | | | | | | | | | | | | | | | | | | | | | | | | | | | | | | | | | | | | | | | | | | | | | | | | | | | | | | | | | | | | | | | | | | | |
Total liabilities | | | | | | | | | | | | | | | | | | | | | | | | | | | | | | | | | | | | | | | | | | | | | | | | | | | | | | | | | | | | | | | 4,142,724 | | | | 1,181,592 | | | | 1,078,649 | |
| | | | | | | | | | | | | | | | | | | | | | | | | | | | | | | | | | | | | | | | | | | | | | | | | | | | | | | | | | | | | | | | | | | | | | | | |
Other information: | | | | | | | | | | | | | | | | | | | | | | | | | | | | | | | | | | | | | | | | | | | | | | | | | | | | | | | | | | | | | | | | | | | | | | | | |
Amortisation and depreciation | | | 62,062 | | | | 21,630 | | | | 21,893 | | | | 5,382 | | | | 4,719 | | | | 3,808 | | | | 10,102 | | | | 8,265 | | | | 5,261 | | | | 0 | | | | 0 | | | | 0 | | | | 13,093 | | | | 11,162 | | | | 8,592 | | | | 90,639 | | | | 45,776 | | | | 39,554 | |
Expenses that do not require cash payments | | | 4,497 | | | | (526 | ) | | | (2,059 | ) | | | (33 | ) | | | (12 | ) | | | (70 | ) | | | 4,826 | | | | 0 | | | | (1 | ) | | | 0 | | | | 0 | | | | 0 | | | | 907 | | | | 0 | | | | (26 | ) | | | 10,197 | | | | (538 | ) | | | (2,156 | ) |
Additions for the year of property, plant & equipment and intangible assets | | | 127,789 | | | | 65,344 | | | | 70,702 | | | | 15,097 | | | | 13,132 | | | | 7,524 | | | | 12,218 | | | | 15,897 | | | | 14,067 | | | | 0 | | | | 0 | | | | 0 | | | | 12,395 | | | | 11,424 | | | | 26,477 | | | | 167,499 | | | | 105,797 | | | | 118,770 | |
(*) Diagnostics result for 2011 includes the goodwill impairment recognized during the year (see note 7)
This Appendix forms an integral part of note 6 to the consolidated financial statements
F-81
APPENDIX I
GRIFOLS, S.A. AND SUBSIDIARIES
GEOGRAPHICAL INFORMATION
(expressed in thousands of Euros)
| | | | | | | | | | | | | | | | | | | | | | | | | | | | | | | | | | | | | | | | | | | | | | | | | | | | | | | | | | | | |
| | | Spain | | | European Union | | | United States | | | Rest of the world | | | Consolidated | |
| | | 2011 | | | 2010 | | | 2009 | | | 2011 | | | 2010 | | | 2009 | | | 2011 | | | 2010 | | | 2009 | | | 2011 | | | 2010 | | | 2009 | | | 2011 | | | 2010 | | | 2009 | |
Revenues | | | 230,871 | | | | 227,947 | | | | 225,759 | | | | 295,822 | | | | 204,244 | | | | 198,832 | | | | 974,390 | | | | 339,018 | | | | 296,659 | | | | 294,530 | | | | 219,521 | | | | 191,936 | | | | 1,795,613 | | | | 990,730 | | | | 913,186 | |
| | | | | | | | | | | | | | | | | | | | | | | | | | | | | | | | | | | | | | | | | | | | | | | | | | | | | | | | | | | | |
Assets by geographic areas | | | 740,275 | | | | 682,473 | | | | 632,537 | | | | 130,658 | | | | 117,706 | | | | 82,245 | | | | 4,801,239 | | | | 936,030 | | | | 821,641 | | | | 135,546 | | | | 152,773 | | | | 120,754 | | | | 5,807,718 | | | | 1,888,982 | | | | 1,657,177 | |
| | | | | | | | | | | | | | | | | | | | | | | | | | | | | | | | | | | | | | | | | | | | | | | | | | | | | | | | | | | | |
Other information: | | | | | | | | | | | | | | | | | | | | | | | | | | | | | | | | | | | | | | | | | | | | | | | | | | | | | | | | | | | | |
Additions for the year of property, plant &equipment and intangible assets | | | 47,622 | | | | 50,319 | | | | 65,046 | | | | 2,759 | | | | 3,972 | | | | 2,341 | | | | 113,041 | | | | 43,847 | | | | 43,726 | | | | 4,077 | | | | 7,659 | | | | 7,657 | | | | 167,499 | | | | 105,797 | | | | 118,770 | |
This Appendix forms an integral part of note 6 to the consolidated financial statements
F-82
APPENDIX II
GRIFOLS, S.A. AND SUBSIDIARIES
Changes in Other Intangible Assets
for the year ended
31 December 2011
(Expressed in thousands of Euros)
| | | | | | | | | | | | | | | | | | | | | | | | | | | | |
| | | Balances at
31/12/2010 | | | Additions | | | Business
Combinations | | | Transfers | | | Disposals | | | Translation
differences | | | Balances at
31/12/2011 | |
Development costs | | | 62,071 | | | | 7,775 | | | | 0 | | | | 0 | | | | (97 | ) | | | 34 | | | | 69,783 | |
Concessions, patents, licenses brands & similar | | | 52,743 | | | | 102 | | | | 0 | | | | (905 | ) | | | 0 | | | | 989 | | | | 52,929 | |
Software | | | 34,702 | | | | 14,374 | | | | 13,633 | | | | 643 | | | | (548 | ) | | | 5,163 | | | | 67,967 | |
Current marketed products | | | 0 | | | | 0 | | | | 832,871 | | | | 0 | | | | 0 | | | | 94,558 | | | | 927,429 | |
Other intangible assets | | | 2,345 | | | | 448 | | | | 0 | | | | 145 | | | | (501 | ) | | | 39 | | | | 2,476 | |
| | | | | | | | | | | | | | | | | | | | | | | | | | | | |
| | | | | | | |
Total cost of intangible assets | | | 151,861 | | | | 22,699 | | | | 846,504 | | | | (117 | ) | | | (1,146 | ) | | | 100,783 | | | | 1,120,584 | |
| | | | | | | |
Accum. amort. of development costs | | | (33,195 | ) | | | (6,785 | ) | | | 0 | | | | 0 | | | | 0 | | | | (98 | ) | | | (40,078 | ) |
Accum. amort of concessions, patents, licenses, brands & similar | | | (18,628 | ) | | | (906 | ) | | | 0 | | | | 844 | | | | 0 | | | | (176 | ) | | | (18,866 | ) |
Accum. amort. of software | | | (21,546 | ) | | | (9,462 | ) | | | 0 | | | | (164 | ) | | | 52 | | | | (3,002 | ) | | | (34,122 | ) |
Accum. amort. of Current marketed products | | | 0 | | | | (16,648 | ) | | | 0 | | | | 0 | | | | 0 | | | | (1,385 | ) | | | (18,033 | ) |
Accum. amort. of other intangible assets | | | (193 | ) | | | (622 | ) | | | 0 | | | | (84 | ) | | | 0 | | | | (15 | ) | | | (914 | ) |
| | | | | | | | | | | | | | | | | | | | | | | | | | | | |
Total accum. amort intangible assets | | | (73,562 | ) | | | (34,423 | ) | | | 0 | | | | 596 | | | | 52 | | | | (4,676 | ) | | | (112,013 | ) |
Impairment of other intangible assets | | | 0 | | | | (264 | ) | | | 0 | | | | 0 | | | | 0 | | | | 0 | | | | (264 | ) |
| | | | | | | | | | | | | | | | | | | | | | | | | | | | |
Carrying amount of intangible assets | | | 78,299 | | | | (11,988 | ) | | | 846,504 | | | | 479 | | | | (1,094 | ) | | | 96,107 | | | | 1,008,307 | |
| | | | | | | | | | | | | | | | | | | | | | | | | | | | |
| | | | | | | | | | | (note 3) | | | | | | | | | | | | | | | | | |
This appendix forms an integral part of note 8 to the consolidated financial statements
F-83
APPENDIX II
GRIFOLS, S.A. AND SUBSIDIARIES
Changes in Other Intangible Assets
for the year ended
31 December 2010
(Expressed in thousands of Euros)
| | | | | | | | | | | | | | | | | | | | | | | | |
| | | Balances at
31/12/2009 | | | Additions | | | Transfers | | | Disposals | | | Translation
differences | | | Balances at
31/12/2010 | |
Development costs | | | 55,414 | | | | 6,614 | | | | 0 | | | | (26 | ) | | | 69 | | | | 62,071 | |
Concessions, patents, licenses brands & similar | | | 46,259 | | | | 2,410 | | | | 847 | | | | 0 | | | | 3,227 | | | | 52,743 | |
Software | | | 28,597 | | | | 5,455 | | | | 318 | | | | (20 | ) | | | 352 | | | | 34,702 | |
Other intangible assets | | | 513 | | | | 2,121 | | | | 0 | | | | (299 | ) | | | 10 | | | | 2,345 | |
| | | | | | | | | | | | | | | | | | | | | | | | |
Total cost of intangible assets | | | 130,783 | | | | 16,600 | | | | 1,165 | | | | (345 | ) | | | 3,658 | | | | 151,861 | |
Accum. amort. of development costs | | | (29,427 | ) | | | (3,699 | ) | | | 0 | | | | 0 | | | | (69 | ) | | | (33,195 | ) |
Accum. amort of concessions, patents, licenses, brands & similar | | | (15,526 | ) | | | (1,603 | ) | | | (845 | ) | | | 0 | | | | (654 | ) | | | (18,628 | ) |
Accum. amort. of software | | | (16,430 | ) | | | (4,965 | ) | | | 1 | | | | 20 | | | | (172 | ) | | | (21,546 | ) |
Accum. amort. of other intangible assets | | | 0 | | | | (189 | ) | | | (4 | ) | | | 0 | | | | 0 | | | | (193 | ) |
| | | | | | | | | | | | | | | | | | | | | | | | |
Total accum. amort intangible assets | | | (61,383 | ) | | | (10,456 | ) | | | (848 | ) | | | 20 | | | | (895 | ) | | | (73,562 | ) |
Impairment of other intangible assets | | | (15 | ) | | | 0 | | | | 0 | | | | 15 | | | | 0 | | | | 0 | |
| | | | | | | | | | | | | | | | | | | | | | | | |
Carrying amount of intangible assets | | | 69,385 | | | | 6,144 | | | | 317 | | | | (310 | ) | | | 2,763 | | | | 78,299 | |
| | | | | | | | | | | | | | | | | | | | | | | | |
This appendix forms an integral part of note 8 to the consolidated financial statements
F-84
APPENDIX III
GRIFOLS, S.A. AND SUBSIDIARIES
Changes in Property, Plant and Equipment
for the year ended
31 December 2011
(Expressed in thousands of Euros)
| | | | | | | | | | | | | | | | | | | | | | | | | | | | |
| | | Balances at
31/12/10 | | | Additions | | | Business
Combination | | | Transfers | | | Disposals | | | Translation
differences | | | Balances at
31/12/11 | |
Cost: | | | | | | | | | | | | | | | | | | | | | | | | | | | | |
Land and buildings | | | 184,742 | | | | 7,452 | | | | 52,342 | | | | 12,932 | | | | (109,028 | ) | | | 8,428 | | | | 156,868 | |
Plant and machinery | | | 405,269 | | | | 42,471 | | | | 280,823 | | | | 30,898 | | | | (24,250 | ) | | | 38,004 | | | | 773,215 | |
Under construction | | | 66,284 | | | | 94,876 | | | | 133,509 | | | | (44,725 | ) | | | (146,707 | ) | | | 17,982 | | | | 121,219 | |
| | | | | | | | | | | | | | | | | | | | | | | | | | | | |
| | | 656,295 | | | | 144,799 | | | | 466,674 | | | | (895 | ) | | | (279,985 | ) | | | 64,414 | | | | 1,051,302 | |
| | | | | | | | | | | | | | | | | | | | | | | | | | | | |
Accumulated depreciation: | | | | | | | | | | | | | | | | | | | | | | | | | | | | |
Buildings | | | (11,547 | ) | | | (6,946 | ) | | | 0 | | | | (48 | ) | | | 5,265 | | | | (2,158 | ) | | | (15,434 | ) |
Plant and machinery | | | (209,968 | ) | | | (49,270 | ) | | | 0 | | | | 464 | | | | 13,897 | | | | (7,910 | ) | | | (252,787 | ) |
| | | | | | | | | | | | | | | | | | | | | | | | | | | | |
| | | (221,515 | ) | | | (56,216 | ) | | | 0 | | | | 416 | | | | 19,162 | | | | (10,068 | ) | | | (268,221 | ) |
| | | | | | | | | | | | | | | | | | | | | | | | | | | | |
Impairment of other property, plant and equipment | | | (649 | ) | | | (6,116 | ) | | | 0 | | | | 0 | | | | 17 | | | | (464 | ) | | | (7,212 | ) |
| | | | | | | | | | | | | | | | | | | | | | | | | | | | |
Carrying amount | | | 434,131 | | | | 82,467 | | | | 466,674 | | | | (479 | ) | | | (260,806 | ) | | | 53,882 | | | | 775,869 | |
| | | | | | | | | | | | | | | | | | | | | | | | | | | | |
| | | | | | | | | | | (note 3 | ) | | | | | | | | | | | | | | | | |
This appendix forms an integral part of note 9 to the consolidated financial statements
F-85
APPENDIX III
GRIFOLS, S.A. AND SUBSIDIARIES
Changes in Property, Plant and Equipment
for the year ended
31 December 2010
(Expressed in thousands of Euros)
| | | | | | | | | | | | | | | | | | | | | | | | |
| | | Balances at
31/12/09 | | | Additions | | | Transfers | | | Disposals | | | Translation
differences | | | Balances at
31/12/10 | |
Cost: | | | | | | | | | | | | | | | | | | | | | | | | |
Land and buildings | | | 142,600 | | | | 10,594 | | | | 28,930 | | | | (1,085 | ) | | | 3,703 | | | | 184,742 | |
Plant and machinery | | | 344,030 | | | | 35,356 | | | | 21,857 | | | | (8,242 | ) | | | 12,268 | | | | 405,269 | |
Under construction | | | 70,781 | | | | 43,247 | | | | (49,694 | ) | | | 0 | | | | 1,950 | | | | 66,284 | |
| | | | | | | | | | | | | | | | | | | | | | | | |
| | | 557,411 | | | | 89,197 | | | | 1,093 | | | | (9,327 | ) | | | 17,921 | | | | 656,295 | |
| | | | | | | | | | | | | | | | | | | | | | | | |
Accumulated depreciation: | | | | | | | | | | | | | | | | | | | | | | | | |
Buildings | | | (9,502 | ) | | | (1,890 | ) | | | (16 | ) | | | 0 | | | | (139 | ) | | | (11,547 | ) |
Plant and machinery | | | (176,204 | ) | | | (33,430 | ) | | | (1,394 | ) | | | 6,016 | | | | (4,956 | ) | | | (209,968 | ) |
| | | | | | | | | | | | | | | | | | | | | | | | |
| | | (185,706 | ) | | | (35,320 | ) | | | (1,410 | ) | | | 6,016 | | | | (5,095 | ) | | | (221,515 | ) |
| | | | | | | | | | | | | | | | | | | | | | | | |
Impairment of other property, plant and equipment | | | 0 | | | | (649 | ) | | | 0 | | | | 0 | | | | 0 | | | | (649 | ) |
| | | | | | | | | | | | | | | | | | | | | | | | |
Carrying amount | | | 371,705 | | | | 53,228 | | | | (317 | ) | | | (3,311 | ) | | | 12,826 | | | | 434,131 | |
| | | | | | | | | | | | | | | | | | | | | | | | |
This appendix forms an integral part of note 9 to the consolidated financial statements
F-86
APPENDIX IV
GRIFOLS, S.A. AND SUBSIDIARIES
Non-current Loans and Borrowings
for the year ended
31 December 2011
(Expressed in thousands of Euros)
| | | | | | | | | | | | | | | | | | | | |
| | | | | | | | | | | | | Thousands of Euros | |
Loan | | Currency | | Interest rate | | Concession date | | | Maturity date | | | Amount awarded | | | Carrying amount | |
Deuda Senior Tramo A | | EUR | | Euribor + 4% | | | 23/11/2010 | | | | 30/6/2016 | | | | 220,000 | | | | 199,375 | |
Deuda Senior Tramo B | | EUR | | Euribor + 4,5% | | | 23/11/2010 | | | | 30/6/2016 | | | | 220,000 | | | | 216,700 | |
Deuda Senior Tramo A | | USD | | Libor + 3,75% | | | 23/11/2010 | | | | 30/6/2016 | | | | 927,428 | | | | 840,482 | |
Deuda Senior Tramo B | | USD | | Libor + 4,25% | | | 23/11/2010 | | | | 30/6/2016 | | | | 1,004,714 | | | | 989,644 | |
| | | | | | | | | | | | | | | | | | | | |
| | | | | | |
Total Deuda Senior | | | | | | | | | | | | | | | 2,372,142 | | | | 2,246,201 | |
| | | | | | |
Revolving Credit | | EUR | | Euribor + 4% | | | 23/11/2010 | | | | 30/6/2016 | | | | 38,643 | | | | 0 | |
Revolving Credit | | USD | | Libor + 3,75% | | | 23/11/2010 | | | | 30/6/2016 | | | | 38,643 | | | | 0 | |
Revolving Credit | | Multimoneda | | Libor + 3,75% | | | 23/11/2010 | | | | 30/6/2016 | | | | 154,571 | | | | 0 | |
| | | | | | | | | | | | | | | | | | | | |
| | | | | | |
Total Revolving Credit | | | | | | | | | | | | | | | 231,857 | | | | 0 | |
| | | | | | |
Banco Santander | | EUR | | ICO + 1,89% | | | 1/6/2009 | | | | 30/6/2016 | | | | 6,000 | | | | 4,200 | |
B. Guipuzcoano | | EUR | | Euribor + 1% | | | 25/3/2010 | | | | 25/3/2020 | | | | 8,500 | | | | 8,500 | |
B.Sabadell | | EUR | | Euribor + 1% | | | 8/6/2011 | | | | 30/6/2013 | | | | 843 | | | | 813 | |
SCH | | EUR | | 1.75% | | | 13/10/2010 | | | | 13/10/2017 | | | | 900 | | | | 732 | |
Caixa Catalunya | | EUR | | ICO + 1,99% | | | 30/7/2009 | | | | 25/8/2016 | | | | 1,440 | | | | 1,081 | |
| | | | | | |
Caixa Galicia | | EUR | | Euribor + 1,5% | | | 11/6/2010 | | | | 25/6/2020 | | | | 1,180 | | | | 885 | |
| | | | | | |
Ibercaja | | EUR | | Euribor + 1,99% | | | 30/7/2009 | | | | 31/7/2016 | | | | 1,800 | | | | 1,324 | |
Banco Popular | | EUR | | ICO + 1,5% | | | 28/11/2011 | | | | 25/12/2018 | | | | 2,000 | | | | 2,000 | |
| | | | | | |
Banco Popular | | EUR | | ICO + 1,5% | | | 28/11/2011 | | | | 25/12/2018 | | | | 6,800 | | | | 6,800 | |
Banca Toscana | | EUR | | Euribor a 6 meses+1% | | | 8/5/2008 | | | | 30/6/2013 | | | | 3,000 | | | | 326 | |
| | | | | | |
Costes de transacción de préstamos | | | | | | | | | | | | | | | | | | | (172,638 | ) |
Floor implícito y Swap Floor | | | | | | | | | | | | | | | | | | | (52,139 | ) |
| | | | | | | | | | | | | | | | | | | | |
| | | | | | | | | | | | | | | 2,636,463 | | | | 2,048,085 | |
| | | | | | | | | | | | | | | | | | | | |
Non-current finance lease creditors (see note 22) | | | | | | | | | | | — | | | | 24,617 | |
| | | | | | | | | | | | | | | | | | | | |
| | | | | | | | | | | | | | | 2,636,463 | | | | 2,072,702 | |
| | | | | | | | | | | | | | | | | | | | |
This appendix forms an integral part of note 22 to the consolidated financial statements.
F-87
APPENDIX IV
GRIFOLS, S.A. AND SUBSIDIARIES
Non-current Loans and Borrowings
for the year ended
31 December 2010
(Expressed in thousands of Euros)
| | | | | | | | | | | | | | | | | | | | | | |
| | | | | | | | | | | | Thousands of Euros | |
Loan | | Currency | | | Interest rate | | Concession date | | Maturity date | | Face amount | | | Initial loan
arrangement
expenses | | | Carrying amount | |
Syndicated loan -Club deal | | | EUR | | | Euribor + 0,8% | | 1/5/2008 | | 26/5/2013 | | | 350,000 | | | | (2,427 | ) | | | 99,408 | |
Instituto de crédito Oficial | | | EUR | | | Euribor + 1% | | 1/6/2006 | | 26/5/2016 | | | 30,000 | | | | (210 | ) | | | 17,955 | |
Caixa Catalunya—Mortgage loan | | | EUR | | | Euribor + 0,9% | | 1/2/2008 | | 1/2/2018 | | | 14,000 | | | | (294 | ) | | | 10,115 | |
Banco Santander | | | EUR | | | ICO + 1,8% | | 1/6/2009 | | 1/6/2016 | | | 6,000 | | | | — | | | | 5,400 | |
Caja de Madrid | | | EUR | | | Euribor + 1% | | 5/6/2009 | | 5/6/2016 | | | 6,000 | | | | — | | | | 5,400 | |
Banco Guipuzcoano | | | EUR | | | Euribor + 1% | | 25/3/2010 | | 25/3/2020 | | | 8,500 | | | | — | | | | 8,500 | |
Banco Sabadell | | | EUR | | | Euribor + 1% | | 11/6/2010 | | 30/6/2012 | | | 1,465 | | | | — | | | | 1,413 | |
SCH | | | EUR | | | 1.75% | | 13/10/2010 | | 13/10/2017 | | | 900 | | | | — | | | | 876 | |
Ibercaja | | | EUR | | | Euribor + 1,99% | | 30/7/2009 | | 31/7/2016 | | | 1,800 | | | | — | | | | 1,664 | |
Caja de Madrid | | | | | | Euribor + 2% | | 9/3/2010 | | 25/3/2020 | | | 10,000 | | | | — | | | | 10,000 | |
SCH | | | | | | Euribor + 1% | | 18/11/2010 | | 31/1/2012 | | | 169 | | | | — | | | | 169 | |
BBVA—Mortgage loan | | | EUR | | | Euribor + 1,2% | | 21/10/2008 | | 31/12/2024 | | | 45,000 | | | | (676 | ) | | | 39,201 | |
Caixa Catalunya | | | EUR | | | ICO + 1,99% | | 30/7/2009 | | 25/8/2016 | | | 1,440 | | | | — | | | | 1,353 | |
Caixa Galicia | | | EUR | | | Euribor + 1% | | 11/6/2010 | | 25/6/2020 | | | 1,180 | | | | — | | | | 1,003 | |
Banca Toscana | | | EUR | | | 6 months Euribor
+ 1% | | 8/5/2008 | | 30/6/2013 | | | 3,000 | | | | — | | | | 939 | |
Cofides | | | EUR | | | 6 months Euribor
+ 0,45% | | 1/8/2008 | | 20/8/2017 | | | 6,854 | | | | — | | | | 5,875 | |
Cofides | | | EUR | | | Euribor + 2% | | 20/9/2011 | | 20/3/2017 | | | 10,745 | | | | — | | | | 10,177 | |
| | | | | | | | | | | | | | | | | | | | | | |
| | | | | | | | | | | | | 497,053 | | | | (3,607 | ) | | | 219,448 | |
| | | | | | | | | | | | | | | | | | | | | | |
Non-current finance lease creditors (see note 22) | | | | | | | — | | | | — | | | | 4,734 | |
| | | | | | | | | | | | | | | | | | | | | | |
| | | | | | | | | | | | | 497,053 | | | | (3,607 | ) | | | 224,182 | |
| | | | | | | | | | | | | | | | | | | | | | |
This appendix forms an integral part of note 22 to the consolidated financial statements.
F-88
APPENDIX V
GRIFOLS, S.A. AND SUBSIDIARIES
Condensed Consolidated Balance Sheets
at 31 December 2010
| | | | | | | | | | | | | | | | | | | | | | | | |
| | | Parent | | | Issuer | | | Guarantor
Subsidiaries | | | Non-Guarantor
Subsidiaries | | | Consolidating
Adjustments | | | Consolidated | |
| | | | | | |
| | | (expressed in thousands of euros) | |
Assets | | | | | | | | | | | | | | | | | | | | | | | | |
Non-current assets | | | | | | | | | | | | | | | | | | | | | | | | |
Intangible assets | | | | | | | | | | | | | | | | | | | | | | | | |
Goodwill | | | 0 | | | | 0 | | | | 29,895 | | | | 15,123 | | | | 144,430 | | | | 189,448 | |
Other intangible assets | | | 5,731 | | | | 3,162 | | | | 49,120 | | | | 4,725 | | | | 15,561 | | | | 78,299 | |
| | | | | | | | | | | | | | | | | | | | | | | | |
Total intangible assets | | | 5,731 | | | | 3,162 | | | | 79,015 | | | | 19,848 | | | | 159,991 | | | | 267,747 | |
Property, plant and equipment | | | 95,452 | | | | 28,150 | | | | 231,728 | | | | 78,801 | | | | 0 | | | | 434,131 | |
Investments in Subsidiaries | | | 345,025 | | | | 222,273 | | | | 2,532 | | | | 938 | | | | (570,768 | ) | | | 0 | |
Advances and notes between parent and subsidiaries | | | 0 | | | | 21,005 | | | | 0 | | | | 0 | | | | (21,005 | ) | | | 0 | |
Investments in equity accounted investees | | | 0 | | | | 0 | | | | 0 | | | | 0 | | | | 598 | | | | 598 | |
Non-current financial assets | | | 709 | | | | 5,804 | | | | 734 | | | | 288 | | | | 0 | | | | 7,535 | |
Deferred tax assets | | | 1,091 | | | | 2,076 | | | | 9,534 | | | | 2,932 | | | | 19,256 | | | | 34,889 | |
| | | | | | | | | | | | | | | | | | | | | | | | |
Total non-current assets | | | 448,008 | | | | 282,470 | | | | 323,543 | | | | 102,807 | | | | (411,928 | ) | | | 744,900 | |
| | | | | | |
Current assets | | | | | | | | | | | | | | | | | | | | | | | | |
Inventories | | | 796 | | | | 0 | | | | 538,311 | | | | 59,401 | | | | (70,643 | ) | | | 527,865 | |
| | | | | | |
Trade and other receivables | | | | | | | | | | | | | | | | | | | | | | | | |
Trade receivables | | | 8,946 | | | | 11,561 | | | | 209,758 | | | | 100,719 | | | | (106,629 | ) | | | 224,355 | |
Other receivables | | | 3,157 | | | | 201 | | | | 27,612 | | | | 11,971 | | | | 1,091 | | | | 44,032 | |
Current income tax assets | | | 6,168 | | | | 6,071 | | | | 297 | | | | 2,071 | | | | 0 | | | | 14,607 | |
| | | | | | | | | | | | | | | | | | | | | | | | |
Trade and other receivables | | | 18,271 | | | | 17,833 | | | | 237,667 | | | | 114,761 | | | | (105,538 | ) | | | 282,994 | |
Advances and notes between parent and subsidiaries | | | 238,262 | | | | (1,311 | ) | | | 14,699 | | | | 22,860 | | | | (274,510 | ) | | | 0 | |
Other current financial assets | | | 267 | | | | 224 | | | | 8 | | | | 12,447 | | | | 0 | | | | 12,946 | |
Other current assets | | | 13,460 | | | | 60,568 | | | | 5,150 | | | | 1,450 | | | | 0 | | | | 80,628 | |
Cash and cash equivalents | | | 25 | | | | 227,456 | | | | 1,444 | | | | 10,724 | | | | 0 | | | | 239,649 | |
| | | | | | | | | | | | | | | | | | | | | | | | |
Total current assets | | | 271,081 | | | | 304,770 | | | | 797,279 | | | | 221,643 | | | | (450,691 | ) | | | 1,144,082 | |
| | | | | | | | | | | | | | | | | | | | | | | | |
Total assets | | | 719,089 | | | | 587,240 | | | | 1,120,822 | | | | 324,450 | | | | (862,619 | ) | | | 1,888,982 | |
| | | | | | | | | | | | | | | | | | | | | | | | |
The accompanying note forms an integral part of the consolidated financial statements
F-89
APPENDIX V
GRIFOLS, S.A. AND SUBSIDIARIES
Condensed Consolidated Balance Sheets
at 31 December 2010
| | | | | | | | | | | | | | | | | | | | | | | | |
| | | Parent | | | Issuer | | | Guarantor
Subsidiaries | | | Non-Guarantor
Subsidiaries | | | Consolidating
Adjustments | | | Consolidated | |
| | | | | | |
| | | (expressed in thousands of euros) | |
Equity and liabilities | | | | | | | | | | | | | | | | | | | | | | | | |
| | | | | | |
Equity | | | | | | | | | | | | | | | | | | | | | | | | |
Share capital | | | 106,532 | | | | 0 | | | | 21,497 | | | | 36,340 | | | | (57,837 | ) | | | 106,532 | |
Share premium | | | 121,802 | | | | 72,932 | | | | 106,854 | | | | 5,703 | | | | (185,489 | ) | | | 121,802 | |
Reserves | | | 73,076 | | | | 190,844 | | | | 175,221 | | | | 59,636 | | | | (95,173 | ) | | | 403,604 | |
Own shares | | | (1,927 | ) | | | 0 | | | | 0 | | | | 0 | | | | 0 | | | | (1,927 | ) |
Interim dividend | | | 0 | | | | 0 | | | | 0 | | | | (152 | ) | | | 152 | | | | 0 | |
Profit for the year attributable to the Parent | | | 63,226 | | | | (10,726 | ) | | | 112,853 | | | | 23,906 | | | | (73,746 | ) | | | 115,513 | |
| | | | | | | | | | | | | | | | | | | | | | | | |
Total equity | | | 362,709 | | | | 253,050 | | | | 416,425 | | | | 125,433 | | | | (412,093 | ) | | | 745,524 | |
Cash flow hedges | | | 0 | | | | (1,751 | ) | | | 0 | | | | 0 | | | | 0 | | | | (1,751 | ) |
Translation differences | | | 0 | | | | 20,449 | | | | (18,344 | ) | | | 11,123 | | | | (63,961 | ) | | | (50,733 | ) |
| | | | | | | | | | | | | | | | | | | | | | | | |
Accumulated other comprehensive income | | | 0 | | | | 18,698 | | | | (18,344 | ) | | | 11,123 | | | | (63,961 | ) | | | (52,484 | ) |
| | | | | | |
Equity attributable to the Parent | | | 362,709 | | | | 271,748 | | | | 398,081 | | | | 136,556 | | | | (476,054 | ) | | | 693,040 | |
Non-controlling interests | | | 0 | | | | 0 | | | | 0 | | | | 0 | | | | 14,350 | | | | 14,350 | |
| | | | | | | | | | | | | | | | | | | | | | | | |
Total equity | | | 362,709 | | | | 271,748 | | | | 398,081 | | | | 136,556 | | | | (461,704 | ) | | | 707,390 | |
| | | | | | | | | | | | | | | | | | | | | | | | |
| | | | | | |
Liabilities | | | | | | | | | | | | | | | | | | | | | | | | |
Non-current liabilities | | | | | | | | | | | | | | | | | | | | | | | | |
Grants | | | 142 | | | | 187 | | | | 1,683 | | | | 76 | | | | 0 | | | | 2,088 | |
| | | | | | |
Provisions | | | 0 | | | | 0 | | | | 1,127 | | | | 251 | | | | 0 | | | | 1,378 | |
| | | | | | |
Non-current financial liabilities | | | | | | | | | | | | | | | | | | | | | | | | |
Loans and borrowings, bonds and other marketable securities | | | 133,982 | | | | 441,203 | | | | 40,350 | | | | 49,695 | | | | 155 | | | | 665,385 | |
Advances and notes between parent and subsidiaries | | | 15,875 | | | | 0 | | | | 0 | | | | 5,130 | | | | (21,005 | ) | | | 0 | |
Other financial liabilities | | | 200 | | | | 0 | | | | 9,596 | | | | 678 | | | | 0 | | | | 10,474 | |
| | | | | | | | | | | | | | | | | | | | | | | | |
Total non-current financial liabilities | | | 150,057 | | | | 441,203 | | | | 49,946 | | | | 55,503 | | | | (20,850 | ) | | | 675,859 | |
Deferred tax liabilities | | | 11,907 | | | | 2,860 | | | | 62,718 | | | | 1,519 | | | | 137 | | | | 79,141 | |
| | | | | | | | | | | | | | | | | | | | | | | | |
Total non-current liabilities | | | 162,106 | | | | 444,250 | | | | 115,474 | | | | 57,349 | | | | (20,713 | ) | | | 758,466 | |
| | | | | | |
Current liabilities | | | | | | | | | | | | | | | | | | | | | | | | |
| | | | | | |
Provisions | | | 257 | | | | 0 | | | | 30 | | | | 4,078 | | | | 0 | | | | 4,365 | |
| | | | | | |
Current financial liabilities | | | | | | | | | | | | | | | | | | | | | | | | |
Loans and borrowings, bonds and other marketable securities | | | 103,131 | | | | 7,364 | | | | 41,433 | | | | 39,862 | | | | (155 | ) | | | 191,635 | |
Advances and notes between parent and subsidiaries | | | 42,863 | | | | (162,772 | ) | | | 385,947 | | | | 9,017 | | | | (275,055 | ) | | | 0 | |
Other financial liabilities | | | 8,830 | | | | 0 | | | | 9,316 | | | | 90 | | | | 0 | | | | 18,236 | |
| | | | | | | | | | | | | | | | | | | | | | | | |
Total current financial liabilities | | | 154,824 | | | | (155,408 | ) | | | 436,696 | | | | 48,969 | | | | (275,210 | ) | | | 209,871 | |
Debts with associates | | | 1,162 | | | | 0 | | | | 0 | | | | 0 | | | | 0 | | | | 1,162 | |
| | | | | | |
Trade and other payables | | | | | | | | | | | | | | | | | | | | | | | | |
Suppliers | | | 33,426 | | | | 24,766 | | | | 146,861 | | | | 60,617 | | | | (104,992 | ) | | | 160,678 | |
Other payables | | | 1,141 | | | | 12 | | | | 5,288 | | | | 3,627 | | | | 1,860 | | | | 11,928 | |
Current income tax liabilities | | | 0 | | | | 0 | | | | 2,369 | | | | 3,663 | | | | (1,860 | ) | | | 4,172 | |
| | | | | | | | | | | | | | | | | | | | | | | | |
Total trade and other payables | | | 34,567 | | | | 24,778 | | | | 154,518 | | | | 67,907 | | | | (104,992 | ) | | | 176,778 | |
Other current liabilities | | | 3,464 | | | | 1,872 | | | | 16,023 | | | | 9,591 | | | | 0 | | | | 30,950 | |
| | | | | | | | | | | | | | | | | | | | | | | | |
Total current liabilities | | | 194,274 | | | | (128,758 | ) | | | 607,267 | | | | 130,545 | | | | (380,202 | ) | | | 423,126 | |
| | | | | | | | | | | | | | | | | | | | | | | | |
Total liabilities | | | 356,380 | | | | 315,492 | | | | 722,741 | | | | 187,894 | | | | (400,915 | ) | | | 1,181,592 | |
| | | | | | | | | | | | | | | | | | | | | | | | |
Total equity and liabilities | | | 719,089 | | | | 587,240 | | | | 1,120,822 | | | | 324,450 | | | | (862,619 | ) | | | 1,888,982 | |
| | | | | | | | | | | | | | | | | �� | | | | | | | |
The accompanying note forms an integral part of the consolidated financial statements
F-90
APPENDIX V
GRIFOLS, S.A. AND SUBSIDIARIES
Condensed Consolidated Balance Sheets
at 31 December 2011
| | | | | | | | | | | | | | | | | | | | | | | | |
| | | | | | | | | Guarantor | | | Non-Guarantor | | | Consolidating | | | | |
| | | Parent | | | Issuer | | | Subsidiaries | | | Subsidiaries | | | Adjustments | | | Consolidated | |
| | | (expressed in thousands of euros) | | | | | | | | | | |
Assets | | | | | | | | | | | | | | | | | | | | | | | | |
Non-current assets | | | | | | | | | | | | | | | | | | | | |
Intangible assets | | | | | | | | | | | | | | | | | | | | | | | | |
Goodwill | | | 0 | | | | 0 | | | | 164,468 | | | | 1,880 | | | | 1,728,753 | | | | 1,895,101 | |
Other intangible assets | | | 3,882 | | | | 7,207 | | | | 72,263 | | | | 6,939 | | | | 918,016 | | | | 1,008,307 | |
| | | | | | | | | | | | | | | | | | | | | | | | |
Total intangible assets | | | 3,882 | | | | 7,207 | | | | 236,731 | | | | 8,819 | | | | 2,646,769 | | | | 2,903,408 | |
Property, plant and equipment | | | 60,925 | | | | 28,352 | | | | 479,532 | | | | 38,066 | | | | 168,994 | | | | 775,869 | |
| | | | | | |
Investments in Subsidiaries | | | 1,142,461 | | | | 3,117,375 | | | | 22,564 | | | | 1,436 | | | | (4,283,836 | ) | | | 0 | |
Advances and notes between parent and subsidiaries | | | 0 | | | | 0 | | | | 105,770 | | | | 0 | | | | (105,770 | ) | | | 0 | |
Investments in equity accounted investees | | | 0 | | | | 0 | | | | 0 | | | | 0 | | | | 1,001 | | | | 1,001 | |
Non-current financial assets | | | 3,846 | | | | 5,786 | | | | 1,948 | | | | 821 | | | | 0 | | | | 12,401 | |
Deferred tax assets | | | 1,636 | | | | 47,904 | | | | 99,363 | | | | 3,900 | | | | 33,021 | | | | 185,824 | |
| | | | | | | | | | | | | | | | | | | | | | | | |
Total non-current assets | | | 1,212,750 | | | | 3,206,624 | | | | 945,908 | | | | 53,042 | | | | (1,539,821 | ) | | | 3,878,503 | |
| | | | | | |
Current assets | | | | | | | | | | | | | | | | | | | | | | | | |
| | | | | | |
Inventories | | | 894 | | | | 0 | | | | 1,083,067 | | | | 64,397 | | | | (118,017 | ) | | | 1,030,341 | |
Trade and other receivables | | | | | | | | | | | | | | | | | | | | | | | | |
Trade receivables | | | 10,564 | | | | 2,845 | | | | 517,939 | | | | 105,822 | | | | (228,907 | ) | | | 408,263 | |
Other receivables | | | 3,603 | | | | 179 | | | | 95,738 | | | | 9,054 | | | | 42 | | | | 108,616 | |
Current income tax assets | | | 8,344 | | | | 1,542 | | | | 2,615 | | | | 2,609 | | | | 0 | | | | 15,110 | |
| | | | | | | | | | | | | | | | | | | | | | | | |
Trade and other receivables | | | 22,511 | | | | 4,566 | | | | 616,292 | | | | 117,485 | | | | (228,865 | ) | | | 531,989 | |
Advances and notes between parent and subsidiaries | | | 340,419 | | | | 288,361 | | | | 9,661 | | | | 21,577 | | | | (660,018 | ) | | | 0 | |
Other current financial assets | | | 3,619 | | | | 2,652 | | | | 10 | | | | 10,623 | | | | 0 | | | | 16,904 | |
Other current assets | | | 1,068 | | | | 152 | | | | 6,762 | | | | 1,413 | | | | 0 | | | | 9,395 | |
Cash and cash equivalents | | | 61,239 | | | | 169,248 | | | | 93,771 | | | | 16,328 | | | | 0 | | | | 340,586 | |
| | | | | | | | | | | | | | | | | | | | | | | | |
Total current assets | | | 429,750 | | | | 464,979 | | | | 1,809,563 | | | | 231,823 | | | | (1,006,900 | ) | | | 1,929,215 | |
| | | | | | | | | | | | | | | | | | | | | | | | |
Total assets | | | 1,642,500 | | | | 3,671,603 | | | | 2,755,471 | | | | 284,865 | | | | (2,546,721 | ) | | | 5,807,718 | |
| | | | | | | | | | | | | | | | | | | | | | | | |
The accompanying note forms an integral part of the consolidated financial statements
F-91
APPENDIX V
GRIFOLS, S.A. AND SUBSIDIARIES
Condensed Consolidated Balance Sheets
at 31 December 2011
| | | | | | | | | | | | | | | | | | | | | | | | |
| | | | | | | | | Guarantor | | | Non- Guarantor | | | Consolidating | | | | |
| | | Parent | | | Issuer | | | Subsidiaries | | | Subsidiaries | | | Adjustments | | | Consolidated | |
| | | (expressed in thousands of euros) | | | | | | | | | | |
Equity and liabilities | | | | | | | | | | | | | | | | | | | | | | | | |
Equity | | | | | | | | | | | | | | | | | | | | | | | | |
| | | | | | |
Share capital | | | 117,882 | | | | 0 | | | | 42,635 | | | | 35,892 | | | | (78,527 | ) | | | 117,882 | |
Share premium | | | 890,355 | | | | 849,867 | | | | 656,443 | | | | 6,119 | | | | (1,512,429 | ) | | | 890,355 | |
Reserves | | | 130,463 | | | | 232,983 | | | | 347,284 | | | | 91,936 | | | | (234,392 | ) | | | 568,274 | |
Own shares | | | (1,927 | ) | | | 0 | | | | 0 | | | | 0 | | | | 0 | | | | (1,927 | ) |
Profit for the year attributable to the Parent | | | (17,865 | ) | | | (90,062 | ) | | | 195,694 | | | | (17,588 | ) | | | (19,872 | ) | | | 50,307 | |
| | | | | | | | | | | | | | | | | | | | | | | | |
Total equity | | | 1,118,908 | | | | 992,788 | | | | 1,242,056 | | | | 116,359 | | | | (1,845,220 | ) | | | 1,624,891 | |
Cash flow hedges | | | (1,233 | ) | | | (19,778 | ) | | | (173 | ) | | | 0 | | | | 0 | | | | (21,184 | ) |
Translation differences | | | 0 | | | | 114,105 | | | | 72,103 | | | | 9,814 | | | | (137,222 | ) | | | 58,800 | |
| | | | | | | | | | | | | | | | | | | | | | | | |
Accumulated other comprehensive income | | | (1,233 | ) | | | 94,327 | | | | 71,930 | | | | 9,814 | | | | (137,222 | ) | | | 37,616 | |
| | | | | | |
Equity attributable to the Parent | | | 1,117,675 | | | | 1,087,115 | | | | 1,313,986 | | | | 126,173 | | | | (1,982,442 | ) | | | 1,662,507 | |
Non-controlling interests | | | 0 | | | | 0 | | | | 0 | | | | 0 | | | | 2,487 | | | | 2,487 | |
| | | | | | | | | | | | | | | | | | | | | | | | |
Total equity | | | 1,117,675 | | | | 1,087,115 | | | | 1,313,986 | | | | 126,173 | | | | (1,979,955 | ) | | | 1,664,994 | |
| | | | | | | | | | | | | | | | | | | | | | | | |
Liabilities | | | | | | | | | | | | | | | | | | | | | | | | |
| | | | | | |
Non-current liabilities | | | | | | | | | | | | | | | | | | | | | | | | |
| | | | | | |
Grants | | | 159 | | | | 189 | | | | 941 | | | | 77 | | | | 0 | | | | 1,366 | |
| | | | | | |
Provisions | | | 0 | | | | 0 | | | | 10,729 | | | | 323 | | | | 0 | | | | 11,052 | |
| | | | | | |
Non-current financial liabilities | | | | | | | | | | | | | | | | | | | | | | | | |
Loans and borrowings, bonds and other marketable securities | | | 392,536 | | | | 2,370,484 | | | | 45,776 | | | | 429 | | | | 0 | | | | 2,809,225 | |
Advances and notes between parent and subsidiaries | | | 0 | | | | 0 | | | | 391,239 | | | | 5,934 | | | | (397,173 | ) | | | 0 | |
Other financial liabilities | | | 16,469 | | | | 111,612 | | | | 7,802 | | | | 680 | | | | 0 | | | | 136,563 | |
| | | | | | | | | | | | | | | | | | | | | | | | |
Total non-current financial liabilities | | | 409,005 | | | | 2,482,096 | | | | 444,817 | | | | 7,043 | | | | (397,173 | ) | | | 2,945,788 | |
Deferred tax liabilities | | | 11,292 | | | | 49,874 | | | | 86,264 | | | | 4,046 | | | | 386,965 | | | | 538,441 | |
| | | | | | | | | | | | | | | | | | | | | | | | |
Total non-current liabilities | | | 420,456 | | | | 2,532,159 | | | | 542,751 | | | | 11,489 | | | | (10,208 | ) | | | 3,496,647 | |
| | | | | | |
Current liabilities | | | | | | | | | | | | | | | | | | | | | | | | |
| | | | | | |
Provisions | | | 341 | | | | 0 | | | | 36,084 | | | | 3,726 | | | | 40,961 | | | | 81,112 | |
| | | | | | |
Current financial liabilities | | | | | | | | | | | | | | | | | | | | | | | | |
Loans and borrowings, bonds and other marketable securities | | | 24,096 | | | | 50,294 | | | | 34,168 | | | | 39,231 | | | | 0 | | | | 147,789 | |
Advances and notes between parent and subsidiaries | | | 31,238 | | | | (8,154 | ) | | | 324,861 | | | | 20,584 | | | | (368,529 | ) | | | 0 | |
Other financial liabilities | | | 96 | | | | 0 | | | | 14,288 | | | | 123 | | | | 0 | | | | 14,507 | |
| | | | | | | | | | | | | | | | | | | | | | | | |
Total current financial liabilities | | | 55,430 | | | | 42,140 | | | | 373,317 | | | | 59,938 | | | | (368,529 | ) | | | 162,296 | |
| | | | | | |
Debts with associates | | | 2,435 | | | | 0 | | | | 0 | | | | 0 | | | | 0 | | | | 2,435 | |
| | | | | | |
Trade and other payables | | | | | | | | | | | | | | | | | | | | | | | | |
Suppliers | | | 41,352 | | | | 7,954 | | | | 394,425 | | | | 65,981 | | | | (228,990 | ) | | | 280,722 | |
Other payables | | | 1,394 | | | | 2,018 | | | | 19,223 | | | | 4,700 | | | | 0 | | | | 27,335 | |
Current income tax liabilities | | | 0 | | | | (2,010 | ) | | | 4,217 | | | | 2,484 | | | | 0 | | | | 4,691 | |
| | | | | | | | | | | | | | | | | | | | | | | | |
Total trade and other payables | | | 42,746 | | | | 7,962 | | | | 417,865 | | | | 73,165 | | | | (228,990 | ) | | | 312,748 | |
Other current liabilities | | | 3,417 | | | | 2,227 | | | | 71,468 | | | | 10,374 | | | | 0 | | | | 87,486 | |
| | | | | | | | | | | | | | | | | | | | | | | | |
Total current liabilities | | | 104,369 | | | | 52,329 | | | | 898,734 | | | | 147,203 | | | | (556,558 | ) | | | 646,077 | |
| | | | | | | | | | | | | | | | | | | | | | | | |
Total liabilities | | | 524,825 | | | | 2,584,488 | | | | 1,441,485 | | | | 158,692 | | | | (566,766 | ) | | | 4,142,724 | |
| | | | | | | | | | | | | | | | | | | | | | | | |
Total equity and liabilities | | | 1,642,500 | | | | 3,671,603 | | | | 2,755,471 | | | | 284,865 | | | | (2,546,721 | ) | | | 5,807,718 | |
| | | | | | | | | | | | | | | | | | | | | | | | |
The accompanying note forms an integral part of the consolidated financial statements
F-92
APPENDIX V
GRIFOLS, S.A. AND SUBSIDIARIES
Condensed Consolidated Income Statements
for the year ended 31 December 2009
| | | | | | | | | | | | | | | | | | | | | | | | |
| | | Parent | | | Issuer | | | Guarantor
Subsidiaries | | | Non- Guarantor
Subsidiaries | | | Consolidating
Adjustments | | | Consolidated | |
| | | | | | | | | (expressed in thousands of euros) | | | | | | | |
Profit and loss | | | | | | | | | | | | | | | | | | | | |
Revenues | | | 64,981 | | | | 19,074 | | | | 1,367,208 | | | | 373,372 | | | | (911,449 | ) | | | 913,186 | |
Changes in inventories of finished goods and work in progress | | | 0 | | | | 0 | | | | 103,193 | | | | 989 | | | | (31,089 | ) | | | 73,093 | |
Self-constructed non-current assets | | | 2,406 | | | | 571 | | | | 11,605 | | | | 6,973 | | | | 19,587 | | | | 41,142 | |
Supplies | | | (449 | ) | | | 0 | | | | (809,640 | ) | | | (215,708 | ) | | | 739,523 | | | | (286,274 | ) |
Other operating income | | | 59 | | | | 0 | | | | 678 | | | | 706 | | | | 0 | | | | 1,443 | |
Personnel expenses | | | (23,337 | ) | | | (12,781 | ) | | | (181,298 | ) | | | (55,763 | ) | | | 11 | | | | (273,168 | ) |
Other operating expenses | | | (31,633 | ) | | | (5,727 | ) | | | (258,789 | ) | | | (67,898 | ) | | | 160,666 | | | | (203,381 | ) |
Amortisation and depreciation | | | (5,659 | ) | | | (850 | ) | | | (27,319 | ) | | | (5,726 | ) | | | 0 | | | | (39,554 | ) |
Non-financial and other capital grants | | | 431 | | | | 0 | | | | 637 | | | | 120 | | | | 0 | | | | 1,188 | |
Impairment and net losses on disposal of fixed assets | | | (148 | ) | | | (2 | ) | | | (843 | ) | | | (154 | ) | | | 0 | | | | (1,147 | ) |
| | | | | | | | | | | | | | | | | | | | | | | | |
Results from operating activities | | | 6,651 | | | | 285 | | | | 205,432 | | | | 36,911 | | | | (22,751 | ) | | | 226,528 | |
| | | | | | | | | | | | | | | | | | | | | | | | |
Finance income | | | 9,395 | | | | 6,054 | | | | 3,699 | | | | 1,384 | | | | (13,465 | ) | | | 7,067 | |
Dividends | | | 72,226 | | | | 0 | | | | 0 | | | | 165 | | | | (72,391 | ) | | | 0 | |
Finance expense | | | (10,660 | ) | | | (10,267 | ) | | | (16,787 | ) | | | (3,762 | ) | | | 14,389 | | | | (27,087 | ) |
Change in fair value of financial instruments | | | (979 | ) | | | 0 | | | | 146 | | | | 0 | | | | 246 | | | | (587 | ) |
Gains/ (losses) on disposal of financial instruments | | | 0 | | | | 0 | | | | (1,482 | ) | | | 0 | | | | 1,237 | | | | (245 | ) |
Exchange gains/ (losses) | | | (723 | ) | | | (858 | ) | | | (242 | ) | | | 90 | | | | 0 | | | | (1,733 | ) |
| | | | | | | | | | | | | | | | | | | | | | | | |
Net Finance expense | | | 69,259 | | | | (5,071 | ) | | | (14,666 | ) | | | (2,123 | ) | | | (69,984 | ) | | | (22,585 | ) |
| | | | | | | | | | | | | | | | | | | | | | | | |
Share of profit/ (loss) of equity accounted investees | | | 0 | | | | 0 | | | | 0 | | | | 0 | | | | 51 | | | | 51 | |
| | | | | | | | | | | | | | | | | | | | | | | | |
Profit before income tax from continuing operations | | | 75,910 | | | | (4,786 | ) | | | 190,766 | | | | 34,788 | | | | (92,684 | ) | | | 203,994 | |
| | | | | | | | | | | | | | | | | | | | | | | | |
Income tax expense | | | (2,987 | ) | | | 1,810 | | | | (52,913 | ) | | | (8,124 | ) | | | 5,790 | | | | (56,424 | ) |
| | | | | | | | | | | | | | | | | | | | | | | | |
Profit after income tax from continuing operations | | | 72,923 | | | | (2,976 | ) | | | 137,853 | | | | 26,664 | | | | (86,894 | ) | | | 147,570 | |
| | | | | | | | | | | | | | | | | | | | | | | | |
Consolidated profit for the year | | | 72,923 | | | | (2,976 | ) | | | 137,853 | | | | 26,664 | | | | (86,894 | ) | | | 147,570 | |
| | | | | | | | | | | | | | | | | | | | | | | | |
Profit attributable to equity holders of the Parent | | | 72,923 | | | | (2,976 | ) | | | 137,853 | | | | 26,664 | | | | (86,492 | ) | | | 147,972 | |
Profit/ (loss) attributable to non-controlling interests | | | 0 | | | | 0 | | | | 0 | | | | 0 | | | | (402 | ) | | | (402 | ) |
The accompanying note forms an integral part of the consolidated financial statements
F-93
APPENDIX V
GRIFOLS, S.A. AND SUBSIDIARIES
Condensed Consolidated Income Statements
for the year ended 31 December 2010
| | | | | | | | | | | | | | | | | | | | | | | | |
| | | Parent | | | Issuer | | | Guarantor
Subsidiaries | | | Non-Guarantor
Subsidiaries | | | Consolidating
Adjustments | | | Consolidated | |
| | | (expressed in thousands of euros) | |
Profit and loss | | | | | | | | | | | | | | | | | | | | | | | | |
Revenues | | | 66,966 | | | | 21,313 | | | | 1,351,397 | | | | 428,832 | | | | (877,778 | ) | | | 990,730 | |
Changes in inventories of finished goods and work in progress | | | 0 | | | | 0 | | | | 25,189 | | | | (1,872 | ) | | | 22,432 | | | | 45,749 | |
Self-constructed non-current assets | | | 580 | | | | 1,208 | | | | 10,165 | | | | 2,672 | | | | 18,888 | | | | 33,513 | |
Supplies | | | (464 | ) | | | 0 | | | | (730,275 | ) | | | (247,988 | ) | | | 673,909 | | | | (304,818 | ) |
Other operating income | | | 93 | | | | 0 | | | | 1,014 | | | | 89 | | | | 0 | | | | 1,196 | |
Personnel expenses | | | (23,931 | ) | | | (13,651 | ) | | | (189,100 | ) | | | (62,326 | ) | | | 0 | | | | (289,008 | ) |
Other operating expenses | | | (29,043 | ) | | | (7,195 | ) | | | (260,663 | ) | | | (77,038 | ) | | | 168,679 | | | | (205,260 | ) |
Amortisation and depreciation | | | (7,384 | ) | | | (992 | ) | | | (28,623 | ) | | | (8,222 | ) | | | (555 | ) | | | (45,776 | ) |
Transaction costs of Talecris business combination | | | (14,710 | ) | | | (222 | ) | | | (2,064 | ) | | | (3 | ) | | | 0 | | | | (16,999 | ) |
Non-financial and other capital grants | | | 259 | | | | 0 | | | | 470 | | | | (1 | ) | | | 0 | | | | 728 | |
Impairment and net losses on disposal of fixed assets | | | (2 | ) | | | (139 | ) | | | (756 | ) | | | (578 | ) | | | 1,103 | | | | (372 | ) |
| | | | | | | | | | | | | | | | | | | | | | | | |
Results from operating activities | | | (7,636 | ) | | | 322 | | | | 176,754 | | | | 33,565 | | | | 6,678 | | | | 209,683 | |
| | | | | | | | | | | | | | | | | | | | | | | | |
Finance income | | | 4,054 | | | | 15,172 | | | | 2,856 | | | | 1,243 | | | | (18,799 | ) | | | 4,526 | |
Dividends | | | 76,491 | | | | 0 | | | | 0 | | | | 160 | | | | (76,651 | ) | | | 0 | |
Finance expense | | | (8,124 | ) | | | (32,274 | ) | | | (22,759 | ) | | | (5,304 | ) | | | 18,801 | | | | (49,660 | ) |
Change in fair value of financial instruments | | | (7,670 | ) | | | 0 | | | | 0 | | | | 77 | | | | 0 | | | | (7,593 | ) |
Gains/ (losses) on disposal of financial instruments | | | 0 | | | | 0 | | | | 1,573 | | | | (879 | ) | | | (603 | ) | | | 91 | |
Exchange gains/ (losses) | | | 75 | | | | (455 | ) | | | (389 | ) | | | 2,385 | | | | 0 | | | | 1,616 | |
| | | | | | | | | | | | | | | | | | | | | | | | |
Net Finance expense | | | 64,826 | | | | (17,557 | ) | | | (18,719 | ) | | | (2,318 | ) | | | (77,252 | ) | | | (51,020 | ) |
| | | | | | | | | | | | | | | | | | | | | | | | |
Share of profit/ (loss) of equity accounted investees | | | 0 | | | | 0 | | | | 0 | | | | 0 | | | | (879 | ) | | | (879 | ) |
| | | | | | | | | | | | | | | | | | | | | | | | |
Profit before income tax from continuing operations | | | 57,190 | | | | (17,235 | ) | | | 158,035 | | | | 31,247 | | | | (71,453 | ) | | | 157,784 | |
| | | | | | | | | | | | | | | | | | | | | | | | |
Income tax expense | | | 6,036 | | | | 6,509 | | | | (45,182 | ) | | | (7,445 | ) | | | (2,435 | ) | | | (42,517 | ) |
| | | | | | | | | | | | | | | | | | | | | | | | |
Profit after income tax from continuing operations | | | 63,226 | | | | (10,726 | ) | | | 112,853 | | | | 23,802 | | | | (73,888 | ) | | | 115,267 | |
| | | | | | | | | | | | | | | | | | | | | | | | |
Consolidated profit for the year | | | 63,226 | | | | (10,726 | ) | | | 112,853 | | | | 23,802 | | | | (73,888 | ) | | | 115,267 | |
| | | | | | | | | | | | | | | | | | | | | | | | |
| | | | | | |
Profit attributable to equity holders of the Parent | | | 63,226 | | | | (10,726 | ) | | | 112,853 | | | | 23,906 | | | | (73,746 | ) | | | 115,513 | |
Profit/ (loss) attributable to non-controlling interests | | | 0 | | | | 0 | | | | 0 | | | | (104 | ) | | | (142 | ) | | | (246 | ) |
The accompanying note forms an integral part of the consolidated financial statements
F-94
APPENDIX V
GRIFOLS, S.A. AND SUBSIDIARIES
Condensed Consolidated Income Statements
for the year ended 31 December 2011
| | | | | | | | | | | | | | | | | | | | | | | | |
| | | Parent | | | Issuer | | | Guarantor
Subsidiaries | | | Non-Guarantor
Subsidiaries | | | Consolidating
Adjustments | | | Consolidated | |
| | | | | | | | (expressed in thousands of euros) | | | | |
Profit and loss | | | | | | | | | | | | | | | | |
Revenues | | | 63,490 | | | | 25,567 | | | | 2,480,571 | | | | 453,738 | | | | (1,227,753 | ) | | | 1,795,613 | |
Changes in inventories of finished goods and work in progress | | | 0 | | | | 0 | | | | (38,014 | ) | | | (2,831 | ) | | | 5,695 | | | | (35,150 | ) |
Self-constructed non-current assets | | | 690 | | | | 1,535 | | | | 14,283 | | | | 4,707 | | | | 13,333 | | | | 34,548 | |
Supplies | | | (407 | ) | | | 0 | | | | (1,165,831 | ) | | | (276,403 | ) | | | 1,011,089 | | | | (431,552 | ) |
Other operating income | | | 95 | | | | 0 | | | | 2,232 | | | | (134 | ) | | | 0 | | | | 2,193 | |
Personnel expenses | | | (26,099 | ) | | | (14,373 | ) | | | (386,723 | ) | | | (67,757 | ) | | | 6,311 | | | | (488,641 | ) |
Other operating expenses | | | (42,722 | ) | | | (15,676 | ) | | | (470,113 | ) | | | (89,201 | ) | | | 189,202 | | | | (428,510 | ) |
Amortisation and depreciation | | | (6,803 | ) | | | (1,033 | ) | | | (48,792 | ) | | | (8,037 | ) | | | (25,974 | ) | | | (90,639 | ) |
Transaction costs of Talecris business combination | | | (43,998 | ) | | | (351 | ) | | | (3 | ) | | | 0 | | | | 0 | | | | (44,352 | ) |
Non-financial and other capital grants | | | 333 | | | | 0 | | | | 971 | | | | 0 | | | | 0 | | | | 1,304 | |
Impairment and net losses on disposal of fixed assets | | | (7,135 | ) | | | 0 | | | | (8,645 | ) | | | (21,359 | ) | | | 1,186 | | | | (35,953 | ) |
| | | | | | | | | | | | | | | | | | | | | | | | |
Results from operating activities | | | (62,556 | ) | | | (4,331 | ) | | | 379,936 | | | | (7,277 | ) | | | (26,911 | ) | | | 278,861 | |
| | | | | | | | | | | | | | | | | | | | | | | | |
Finance income | | | 10,968 | | | | 23,352 | | | | (41,519 | ) | | | 1,457 | | | | 11,503 | | | | 5,761 | |
Dividends | | | 53,352 | | | | 0 | | | | 0 | | | | 159 | | | | (53,511 | ) | | | 0 | |
Finance expense | | | (28,141 | ) | | | (165,253 | ) | | | (37,550 | ) | | | (6,837 | ) | | | 37,219 | | | | (200,562 | ) |
Change in fair value of financial instruments | | | 4,501 | | | | (4,980 | ) | | | 1,758 | | | | 0 | | | | 0 | | | | 1,279 | |
Gains/ (losses) on disposal of financial instruments | | | (19,930 | ) | | | 0 | | | | (5,697 | ) | | | (1,022 | ) | | | 25,844 | | | | (805 | ) |
Exchange gains/ (losses) | | | 184 | | | | 7,001 | | | | (7,877 | ) | | | (2,755 | ) | | | 0 | | | | (3,447 | ) |
| | | | | | | | | | | | | | | | | | | | | | | | |
Net Finance expense | | | 20,934 | | | | (139,880 | ) | | | (90,885 | ) | | | (8,998 | ) | | | 21,055 | | | | (197,774 | ) |
| | | | | | | | | | | | | | | | | | | | | | | | |
Share of profit/ (loss) of equity accounted investees | | | 0 | | | | 0 | | | | 144 | | | | 0 | | | | (1,208 | ) | | | (1,064 | ) |
| | | | | | | | | | | | | | | | | | | | | | | | |
Profit before income tax from continuing operations | | | (41,622 | ) | | | (144,211 | ) | | | 289,195 | | | | (16,275 | ) | | | (7,064 | ) | | | 80,023 | |
| | | | | | | | | | | | | | | | | | | | | | | | |
Income tax expense | | | 23,757 | | | | 54,149 | | | | (93,501 | ) | | | (1,313 | ) | | | (12,887 | ) | | | (29,795 | ) |
| | | | | | | | | | | | | | | | | | | | | | | | |
Profit after income tax from continuing operations | | | (17,865 | ) | | | (90,062 | ) | | | 195,694 | | | | (17,588 | ) | | | (19,951 | ) | | | 50,228 | |
| | | | | | | | | | | | | | | | | | | | | | | | |
Consolidated profit for the year | | | (17,865 | ) | | | (90,062 | ) | | | 195,694 | | | | (17,588 | ) | | | (19,951 | ) | | | 50,228 | |
| | | | | | | | | | | | | | | | | | | | | | | | |
Profit attributable to equity holders of the Parent | | | (17,865 | ) | | | (90,062 | ) | | | 195,694 | | | | (17,588 | ) | | | (19,872 | ) | | | 50,307 | |
Profit/ (loss) attributable to non-controlling interests | | | 0 | | | | 0 | | | | 0 | | | | 0 | | | | (79 | ) | | | (79 | ) |
The accompanying note forms an integral part of the consolidated financial statements
F-95
APPENDIX V
GRIFOLS, S.A. AND SUBSIDIARIES
Condensed Consolidated Statements of Cash Flows
for the year ended 31 December 2009
| | | | | | | | | | | | | | | | | | | | | | | | |
| | | Parent | | | Issuer | | | Guarantor
Subsidiaries | | | Non- Guarantor
Subsidiaries | | | Consolidating
Adjustments | | | Consolidated | |
| | | | | | | | | (expressed in thousands of euros) | | | | |
Cash flows from/(used in) operating activities | | | | | | | | | | | | | | | | | | | | | | | | |
| | | | | | |
Profit before income tax | | | 75,910 | | | | (4,786 | ) | | | 190,766 | | | | 34,788 | | | | (92,684 | ) | | | 203,994 | |
Adjustments for: | | | (64,395 | ) | | | 6,960 | | | | 34,101 | | | | 15,848 | | | | 69,287 | | | | 61,800 | |
Amortisation and depreciation | | | 5,659 | | | | 850 | | | | 27,319 | | | | 5,726 | | | | 0 | | | | 39,554 | |
Other adjustments: | | | (70,054 | ) | | | 6,110 | | | | 6,782 | | | | 10,122 | | | | 69,287 | | | | 22,246 | |
(Profit) /losses on equity accounted investments | | | 0 | | | | 0 | | | | 0 | | | | 0 | | | | (51 | ) | | | (51 | ) |
Exchange differences | | | 723 | | | | 858 | | | | 242 | | | | (90 | ) | | | (0 | ) | | | 1,733 | |
Impairment of assets and net provision charges | | | 15 | | | | 0 | | | | (378 | ) | | | 857 | | | | (441 | ) | | | 53 | |
(Profits) / losses on disposal of fixed assets | | | 148 | | | | 2 | | | | 843 | | | | 154 | | | | 0 | | | | 1,147 | |
Government grants taken to income | | | (431 | ) | | | 0 | | | | (637 | ) | | | (120 | ) | | | 0 | | | | (1,188 | ) |
Net finance expense | | | (71,094 | ) | | | 9,104 | | | | 2,801 | | | | 7,650 | | | | 69,091 | | | | 17,552 | |
Other adjustments | | | 585 | | | | (3,854 | ) | | | 3,911 | | | | 1,671 | | | | 688 | | | | 3,001 | |
Change in operating assets and liabilities | | | 64,484 | | | | (70,131 | ) | | | (42,265 | ) | | | (21,021 | ) | | | (35,195 | ) | | | (104,127 | ) |
Change in inventories | | | 31 | | | | 0 | | | | (119,451 | ) | | | (14,745 | ) | | | 21,061 | | | | (113,104 | ) |
Change in trade and other receivables | | | 14,276 | | | | (44,627 | ) | | | (71,598 | ) | | | (20,188 | ) | | | 109,587 | | | | (12,549 | ) |
Change in current financial assets and other current assets | | | 57,822 | | | | (52,577 | ) | | | 57,541 | | | | (6,128 | ) | | | (57,945 | ) | | | (1,287 | ) |
Change in current trade and other payables | | | (7,645 | ) | | | 27,073 | | | | 91,243 | | | | 20,040 | | | | (107,898 | ) | | | 22,813 | |
Other cash flows used in operating activities | | | 51,198 | | | | (1,187 | ) | | | (39,676 | ) | | | (11,597 | ) | | | (72,225 | ) | | | (73,487 | ) |
Interest paid | | | (9,889 | ) | | | (2,362 | ) | | | (2,265 | ) | | | (7,135 | ) | | | 6,932 | | | | (14,719 | ) |
Interest received | | | 6,932 | | | | 0 | | | | 2,256 | | | | 253 | | | | (6,932 | ) | | | 2,509 | |
Dividends received | | | 72,226 | | | | 0 | | | | 0 | | | | 0 | | | | (72,226 | ) | | | 0 | |
Income tax paid | | | (18,070 | ) | | | 1,175 | | | | (39,667 | ) | | | (4,715 | ) | | | 0 | | | | (61,277 | ) |
Net cash from operating activities | | | 127,197 | | | | (69,144 | ) | | | 142,926 | | | | 18,018 | | | | (130,817 | ) | | | 88,180 | |
| | | | | | |
Cash flows from/(used in) investing activities | | | | | | | | | | | | | | | | | | | | | | | | |
Payments for investments | | | (45,238 | ) | | | (6,092 | ) | | | (72,920 | ) | | | (19,379 | ) | | | 7,003 | | | | (136,626 | ) |
Group companies and business units | | | (32,497 | ) | | | 0 | | | | 0 | | | | 10,109 | | | | 7,003 | | | | (15,385 | ) |
Property, plant and equipment and intangible assets | | | (12,490 | ) | | | (4,081 | ) | | | (72,770 | ) | | | (29,429 | ) | | | (0 | ) | | | (118,770 | ) |
Other financial assets | | | (251 | ) | | | (2,011 | ) | | | (150 | ) | | | (59 | ) | | | (0 | ) | | | (2,471 | ) |
Proceeds from the sale of investments | | | 39 | | | | (1 | ) | | | 182 | | | | 453 | | | | (0 | ) | | | 673 | |
Property, plant and equipment | | | 39 | | | | (1 | ) | | | 182 | | | | 453 | | | | 0 | | | | 673 | |
Other financial assets | | | 0 | | | | 0 | | | | 0 | | | | 0 | | | | (0 | ) | | | 0 | |
Associates (note 2 ( c)) | | | 0 | | | | 0 | | | | 0 | | | | 0 | | | | 0 | | | | 0 | |
Net cash used in investing activities | | | (45,199 | ) | | | (6,093 | ) | | | (72,738 | ) | | | (18,926 | ) | | | 7,003 | | | | (135,953 | ) |
| | | | | | |
Cash flows from/(used in) financing activities | | | | | | | | | | | | | | | | | | | | | | | | |
Proceeds from and payments for equity instruments | | | 26,730 | | | | 0 | | | | 6,923 | | | | 60 | | | | (7,058 | ) | | | 26,655 | |
Issue | | | 0 | | | | 0 | | | | 6,923 | | | | 60 | | | | (7,059 | ) | | | (76 | ) |
Acquisition of own shares | | | (25,186 | ) | | | 0 | | | | 0 | | | | 0 | | | | 0 | | | | (25,186 | ) |
Disposal of treasury shares | | | 51,917 | | | | 0 | | | | 0 | | | | 0 | | | | 0 | | | | 51,917 | |
Proceeds from and payments for financial liability instruments | | | (28,061 | ) | | | 318,419 | | | | (14,808 | ) | | | 10,136 | | | | 58,727 | | | | 344,413 | |
Issue | | | 78,933 | | | | 406,807 | | | | 22,614 | | | | 16,724 | | | | (0 | ) | | | 525,078 | |
Redemption and repayment | | | (95,331 | ) | | | (39,510 | ) | | | (34,533 | ) | | | (11,291 | ) | | | 0 | | | | (180,665 | ) |
Debts with group companies | | | (11,662 | ) | | | (48,878 | ) | | | (2,889 | ) | | | 4,703 | | | | 58,726 | | | | 0 | |
Dividends and interest on other equity instruments paid | | | (80,651 | ) | | | (5,552 | ) | | | (57,404 | ) | | | (9,456 | ) | | | 72,150 | | | | (80,913 | ) |
Other cash flows from financing activities | | | 54 | | | | 174 | | | | 431 | | | | 82 | | | | 0 | | | | 741 | |
Other amounts received from financing activities | | | 54 | | | | 174 | | | | 431 | | | | 82 | | | | 0 | | | | 741 | |
Net cash from/(used in) financing activities | | | (81,928 | ) | | | 313,041 | | | | (64,858 | ) | | | 822 | | | | 123,818 | | | | 290,896 | |
Effect of exchange rate fluctuations on cash | | | 0 | | | | 0 | | | | (54 | ) | | | (65 | ) | | | 0 | | | | (119 | ) |
Net increase / (decrease) in cash and cash equivalents | | | 71 | | | | 237,804 | | | | 5,276 | | | | (151 | ) | | | 4 | | | | 243,004 | |
Cash and cash equivalents at beginning of the year | | | 73 | | | | 0 | | | | 1,915 | | | | 4,384 | | | | (4 | ) | | | 6,368 | |
Cash and cash equivalents at end of year | | | 144 | | | | 237,804 | | | | 7,191 | | | | 4,233 | | | | 0 | | | | 249,372 | |
The accompanying note forms an integral part of the consolidated financial statements.
F-96
APPENDIX V
GRIFOLS, S.A. AND SUBSIDIARIES
Condensed Consolidated Statements of Cash Flows
for the year ended 31 December 2010
| | | | | | | | | | | | | | | | | | | | | | | | |
| | | | | | | | | Guarantor | | | Non-Guarantor | | | Consolidating | | | | |
| | | Parent | | | Issuer | | | Subsidiaries | | | Subsidiaries | | | Adjustments | | | Consolidated | |
| | | (expressed in thousands of euros) | |
Cash flows from/(used in) operating activities | | | | | | | | | | | | | | | | | | | | | | | | |
Profit before income tax | | | 57,190 | | | | (17,235 | ) | | | 158,035 | | | | 31,247 | | | | (71,453 | ) | | | 157,784 | |
Adjustments for: | | | (59,557 | ) | | | 49,580 | | | | 23,077 | | | | 6,508 | | | | 72,743 | | | | 92,351 | |
Amortisation and depreciation | | | 7,384 | | | | 992 | | | | 28,623 | | | | 8,222 | | | | 555 | | | | 45,776 | |
Other adjustments: | | | (66,941 | ) | | | 48,588 | | | | (5,546 | ) | | | (1,714 | ) | | | 72,188 | | | | 46,575 | |
(Profit) /losses on equity accounted investments | | | 0 | | | | 0 | | | | 0 | | | | 0 | | | | 879 | | | | 879 | |
Exchange differences | | | (75 | ) | | | 455 | | | | 389 | | | | (2,385 | ) | | | 0 | | | | (1,616 | ) |
Impairment of assets and net provision charges | | | (1,097 | ) | | | 0 | | | | (160 | ) | | | 518 | | | | 1,652 | | | | 913 | |
(Profits) / losses on disposal of fixed assets | | | 2 | | | | 139 | | | | 756 | | | | 578 | | | | (1,751 | ) | | | (276 | ) |
Government grants taken to income | | | (259 | ) | | | 0 | | | | (470 | ) | | | 1 | | | | 0 | | | | (728 | ) |
Net finance expense | | | (65,578 | ) | | | 30,875 | | | | 2,513 | | | | 2,731 | | | | 76,901 | | | | 47,442 | |
Other adjustments | | | 66 | | | | 17,119 | | | | (8,574 | ) | | | (3,157 | ) | | | (5,493 | ) | | | (39 | ) |
Change in operating assets and liabilities | | | 2,233 | | | | 145,612 | | | | (199,272 | ) | | | 7,902 | | | | (35,242 | ) | | | (78,767 | ) |
Change in inventories | | | (92 | ) | | | 0 | | | | (23,919 | ) | | | 8,854 | | | | (3,149 | ) | | | (18,306 | ) |
Change in trade and other receivables | | | 4,915 | | | | 170,362 | | | | 54,428 | | | | 13,110 | | | | (266,361 | ) | | | (23,546 | ) |
Change in current financial assets and other current assets | | | (20,490 | ) | | | (13,649 | ) | | | (2,979 | ) | | | (1,263 | ) | | | (34,641 | ) | | | (73,022 | ) |
Change in current trade and other payables | | | 17,900 | | | | (11,101 | ) | | | (226,802 | ) | | | (12,799 | ) | | | 268,909 | | | | 36,107 | |
Other cash flows used in operating activities | | | 77,492 | | | | (26,404 | ) | | | (28,009 | ) | | | (13,704 | ) | | | (76,491 | ) | | | (67,116 | ) |
Interest paid | | | (5,891 | ) | | | (31,361 | ) | | | (4,404 | ) | | | (2,525 | ) | | | 4,052 | | | | (40,129 | ) |
Interest received | | | 4,052 | | | | 1,110 | | | | 4,326 | | | | 0 | | | | (4,052 | ) | | | 5,436 | |
Dividends received | | | 76,491 | | | | 0 | | | | 0 | | | | 0 | | | | (76,491 | ) | | | 0 | |
Income tax paid | | | 2,840 | | | | 3,847 | | | | (27,931 | ) | | | (11,179 | ) | | | 0 | | | | (32,423 | ) |
Net cash from operating activities | | | 77,358 | | | | 151,553 | | | | (46,169 | ) | | | 31,953 | | | | (110,443 | ) | | | 104,252 | |
| | | | | | |
Cash flows from/(used in) investing activities | | | | | | | | | | | | | | | | | | | | | | | | |
Payments for investments | | | (7,854 | ) | | | (16,042 | ) | | | (67,863 | ) | | | (19,020 | ) | | | 2,191 | | | | (108,588 | ) |
Group companies and business units | | | (8 | ) | | | 0 | | | | (884 | ) | | | (1,523 | ) | | | 941 | | | | (1,474 | ) |
Property, plant and equipment and intangible assets | | | (7,788 | ) | | | (12,405 | ) | | | (67,006 | ) | | | (17,453 | ) | | | 1,250 | | | | (103,402 | ) |
Other financial assets | | | (58 | ) | | | (3,637 | ) | | | 27 | | | | (44 | ) | | | 0 | | | | (3,712 | ) |
Proceeds from the sale of investments | | | 109 | | | | 946 | | | | (2,169 | ) | | | 5,555 | | | | 91 | | | | 4,532 | |
Property, plant and equipment | | | 109 | | | | 946 | | | | (1,289 | ) | | | 4,054 | | | | 91 | | | | 3,911 | |
Other financial assets | | | 0 | | | | 0 | | | | (880 | ) | | | 1,501 | | | | 0 | | | | 621 | |
Associates | | | 0 | | | | 0 | | | | 0 | | | | 0 | | | | 0 | | | | 0 | |
| | | | | | |
Net cash used in investing activities | | | (7,745 | ) | | | (15,096 | ) | | | (70,032 | ) | | | (13,465 | ) | | | 2,282 | | | | (104,056 | ) |
| | | | | | |
Cash flows from/(used in) financing activities | | | | | | | | | | | | | | | | | | | | | | | | |
Proceeds from and payments for equity instruments | | | (1,250 | ) | | | 0 | | | | 0 | | | | 890 | | | | (890 | ) | | | (1,250 | ) |
Issue | | | 0 | | | | 0 | | | | 0 | | | | 890 | | | | (890 | ) | | | 0 | |
Acquisition of own shares | | | (1,250 | ) | | | 0 | | | | 0 | | | | 0 | | | | 0 | | | | (1,250 | ) |
Disposal of treasury shares | | | 0 | | | | 0 | | | | 0 | | | | 0 | | | | 0 | | | | 0 | |
Proceeds from and payments for financial liability instruments | | | (41,495 | ) | | | (165,388 | ) | | | 165,287 | | | | 8,437 | | | | 32,093 | | | | (1,066 | ) |
Issue | | | 63,226 | | | | (2,616 | ) | | | 30,546 | | | | 27,082 | | | | 0 | | | | 118,238 | |
Redemption and repayment | | | (99,505 | ) | | | 0 | | | | (16,672 | ) | | | (3,127 | ) | | | 0 | | | | (119,304 | ) |
Debts with group companies | | | (5,216 | ) | | | (162,772 | ) | | | 151,413 | | | | (15,518 | ) | | | 32,093 | | | | 0 | |
Dividends and interest on other equity instruments paid | | | (27,229 | ) | | | 0 | | | | (55,298 | ) | | | (21,713 | ) | | | 76,958 | | | | (27,282 | ) |
Other cash flows from financing activities | | | 242 | | | | 0 | | | | 56 | | | | 25 | | | | 0 | | | | 323 | |
Other amounts received from financing activities | | | 242 | | | | 0 | | | | 81 | | | | 0 | | | | 0 | | | | 323 | |
Net cash from/(used in) financing activities | | | (69,732 | ) | | | (165,388 | ) | | | 110,045 | | | | (12,361 | ) | | | 108,161 | | | | (29,275 | ) |
Effect of exchange rate fluctuations on cash | | | 0 | | | | 18,583 | | | | 409 | | | | 364 | | | | 0 | | | | 19,356 | |
Net increase / (decrease) in cash and cash equivalents | | | (119 | ) | | | (10,348 | ) | | | (5,747 | ) | | | 6,491 | | | | 0 | | | | (9,723 | ) |
Cash and cash equivalents at beginning of the year | | | 144 | | | | 237,804 | | | | 7,191 | | | | 4,233 | | | | 0 | | | | 249,372 | |
Cash and cash equivalents at end of year | | | 25 | | | | 227,456 | | | | 1,444 | | | | 10,724 | | | | 0 | | | | 239,649 | |
The accompanying note forms an integral part of the consolidated financial statements.
F-97
APPENDIX V
GRIFOLS, S.A. AND SUBSIDIARIES
Condensed Consolidated Statements of Cash Flows
for the year ended 31 December 2011
| | | | | | | | | | | | | | | | | | | | | | | | |
| | | | | | | | | Guarantor | | | Non-Guarantor | | | Consolidating | | | | |
| | | Parent | | | Issuer | | | Subsidiaries | | | Subsidiaries | | | Adjustments | | | Consolidated | |
| | | (expressed in thousands of euros) | |
Cash flows from/(used in) operating activities | | | | | | | | | | | | | | | | | | | | | | | | |
Profit before income tax | | | (41,622 | ) | | | (144,211 | ) | | | 289,195 | | | | (16,275 | ) | | | (7,064 | ) | | | 80,023 | |
Adjustments for: | | | (21,252 | ) | | | 159,350 | | | | 134,874 | | | | 52,945 | | | | (12,002 | ) | | | 313,915 | |
Amortisation and depreciation | | | 6,803 | | | | 1,033 | | | | 48,792 | | | | 8,037 | | | | 25,974 | | | | 90,639 | |
Other adjustments: | | | (28,055 | ) | | | 158,317 | | | | 86,082 | | | | 44,908 | | | | (37,976 | ) | | | 223,276 | |
(Profit) /losses on equity accounted investments | | | 0 | | | | 0 | | | | 0 | | | | 0 | | | | 1,064 | | | | 1,064 | |
Exchange differences | | | (184 | ) | | | (7,001 | ) | | | 7,877 | | | | 2,755 | | | | 0 | | | | 3,447 | |
Impairment of assets and net provision charges | | | 20,194 | | | | 0 | | | | 11,772 | | | | 16,672 | | | | (24,832 | ) | | | 23,806 | |
(Profits) / losses on disposal of fixed assets | | | (7,134 | ) | | | 0 | | | | 5,141 | | | | 21,359 | | | | 0 | | | | 19,366 | |
Government grants taken to income | | | (333 | ) | | | 0 | | | | (971 | ) | | | 0 | | | | 0 | | | | (1,304 | ) |
Net finance expense | | | (40,902 | ) | | | 165,257 | | | | (21,762 | ) | | | 3,773 | | | | 74,201 | | | | 180,567 | |
Other adjustments | | | 304 | | | | 61 | | | | 84,025 | | | | 349 | | | | (88,409 | ) | | | (3,670 | ) |
Change in operating assets and liabilities | | | (90,489 | ) | | | (216,226 | ) | | | (179,614 | ) | | | (5,265 | ) | | | 440,315 | | | | (51,279 | ) |
Change in inventories | | | (98 | ) | | | 0 | | | | 24,032 | | | | (7,100 | ) | | | (9,925 | ) | | | 6,909 | |
Change in trade and other receivables | | | 5,213 | | | | 8,423 | | | | (178,585 | ) | | | (4,069 | ) | | | 114,876 | | | | (54,142 | ) |
Change in current financial assets and other current assets | | | (93,754 | ) | | | (227,148 | ) | | | (96,487 | ) | | | 1,326 | | | | 425,384 | | | | 9,321 | |
Change in current trade and other payables | | | (1,850 | ) | | | 2,499 | | | | 71,426 | | | | 4,578 | | | | (90,020 | ) | | | (13,367 | ) |
Other cash flows used in operating activities | | | 52,608 | | | | (78,895 | ) | | | (29,275 | ) | | | (4,707 | ) | | | (62,163 | ) | | | (122,431 | ) |
Interest paid | | | (19,370 | ) | | | (113,158 | ) | | | (5,686 | ) | | | (3,007 | ) | | | 1,338 | | | | (139,883 | ) |
Interest received | | | 10,148 | | | | 254 | | | | 3,328 | | | | 0 | | | | (10,148 | ) | | | 3,582 | |
Dividends received | | | 53,352 | | | | 0 | | | | 0 | | | | 0 | | | | (53,352 | ) | | | 0 | |
Income tax paid | | | 8,478 | | | | 34,009 | | | | (26,917 | ) | | | (1,700 | ) | | | 0 | | | | 13,870 | |
Net cash from operating activities | | | (100,755 | ) | | | (279,982 | ) | | | 215,181 | | | | 26,698 | | | | 359,087 | | | | 220,228 | |
Cash flows from/(used in) investing activities | | | | | | | | | | | | | | | | | | | | | | | | |
| | | | | | |
Payments for investments | | | (47,550 | ) | | | (1,769,568 | ) | | | 11,048 | | | | (17,966 | ) | | | 39,572 | | | | (1,784,464 | ) |
| | | | | | |
Group companies and business units | | | (39,627 | ) | | | (1,763,601 | ) | | | 143,293 | | | | (1,509 | ) | | | 36,575 | | | | (1,624,869 | ) |
| | | | | | |
Property, plant and equipment and intangible assets | | | (7,338 | ) | | | (3,991 | ) | | | (132,648 | ) | | | (15,922 | ) | | | 0 | | | | (159,899 | ) |
| | | | | | |
Other financial assets | | | (585 | ) | | | (1,976 | ) | | | 403 | | | | (535 | ) | | | 2,997 | | | | 304 | |
| | | | | | |
Proceeds from the sale of investments | | | 33,279 | | | | (1 | ) | | | 150,178 | | | | (17,718 | ) | | | 0 | | | | 165,738 | |
| | | | | | |
Property, plant and equipment | | | 33,279 | | | | (1 | ) | | | 144,706 | | | | (17,718 | ) | | | 0 | | | | 160,266 | |
| | | | | | |
Associates | | | 0 | | | | 0 | | | | 5,472 | | | | 0 | | | | 0 | | | | 5,472 | |
| | | | | | |
Net cash used in investing activities | | | (14,271 | ) | | | (1,769,569 | ) | | | 161,226 | | | | (35,684 | ) | | | 39,572 | | | | (1,618,726 | ) |
| | | | | | |
Cash flows from/(used in) financing activities | | | | | | | | | | | | | | | | | | | | | | | | |
Proceeds from and payments for equity instruments | | | (2,870 | ) | | | 0 | | | | 0 | | | | 1,810 | | | | (1,770 | ) | | | (2,830 | ) |
Issue | | | (2,870 | ) | | | 0 | | | | 0 | | | | 1,810 | | | | (1,770 | ) | | | (2,830 | ) |
Proceeds from and payments for financial liability instruments | | | 197,027 | | | | 2,250,242 | | | | (253,087 | ) | | | 18,608 | | | | (450,240 | ) | | | 1,762,550 | |
Issue | | | 463,300 | | | | 2,524,290 | | | | 13,163 | | | | (6,012 | ) | | | 0 | | | | 2,994,741 | |
Redemption and repayment | | | (247,834 | ) | | | (428,667 | ) | | | (554,942 | ) | | | (748 | ) | | | 0 | | | | (1,232,191 | ) |
Debts with group companies | | | (18,439 | ) | | | 154,619 | | | | 288,692 | | | | 25,368 | | | | (450,240 | ) | | | 0 | |
Dividends and interest on other equity instruments paid | | | 0 | | | | 0 | | | | (47,600 | ) | | | (5,752 | ) | | | 53,352 | | | | 0 | |
Other cash flows from financing activities | | | (17,917 | ) | | | (266,335 | ) | | | (496 | ) | | | 0 | | | | 0 | | | | (284,748 | ) |
Deferred acquisition costs of financial instruments related to acquisition of Talecris | | | (18,257 | ) | | | (266,335 | ) | | | (496 | ) | | | 0 | | | | 0 | | | | (285,088 | ) |
Other amounts received from financing activities | | | 340 | | | | 0 | | | | 0 | | | | 0 | | | | 0 | | | | 340 | |
Net cash from/(used in) financing activities | | | 176,240 | | | | 1,983,907 | | | | (301,183 | ) | | | 14,666 | | | | (398,658 | ) | | | 1,474,972 | |
Effect of exchange rate fluctuations on cash | | | 0 | | | | 7,436 | | | | 17,103 | | | | (76 | ) | | | 0 | | | | 24,463 | |
Net increase / (decrease) in cash and cash equivalents | | | 61,214 | | | | (58,208 | ) | | | 92,327 | | | | 5,604 | | | | 0 | | | | 100,937 | |
Cash and cash equivalents at beginning of the year | | | 25 | | | | 227,456 | | | | 1,444 | | | | 10,724 | | | | 0 | | | | 239,649 | |
Cash and cash equivalents at end of year | | | 61,239 | | | | 169,248 | | | | 93,771 | | | | 16,328 | | | | 0 | | | | 340,586 | |
The accompanying note forms an integral part of the consolidated financial statements
F-98