AlphaMark Large Cap Growth Fund AlphaMark Small Cap Growth Fund Each a series of AlphaMark Investment Trust Annual Report August 31, 2012 |
ALPHAMARK INVESTMENT TRUST
SHAREHOLDERS LETTER
Dear Shareholder:
The AlphaMark Funds’ (the “Funds”) investment philosophy is founded on an appreciation of risk. We attempt to identify for The AlphaMark Funds high quality companies with strong cash flows. This strategy is used to provide the potential for growth while acknowledging the inherent risks of the stock market. The last year has been one of fits and starts for the economy. The economy has been unable to achieve a true recovery because at no point are all areas of the economy working in concert. Since the fall of last year, we have seen the median home price drop through the spring of 2012 and then start an upward trend. This may signal a true stabilization of the housing market, but certainly not a forceful recovery. Every recovery since World War II has relied on a housing recovery as an integral part of that recovery. Consumer confidence was at a low point during October of 2011 and hit a recent high in the spring of this year. The stock market followed suit throughout the spring but lost its momentum towards the middle of summer, only to bounce back as we head into the fourth quarter. The unemployment rate has hovered around 8% for the last 12 months. It will be difficult to see an improvement until there is meaningful job growth. Typically it takes monthly job growth in excess of 250,000 new jobs over a period of 6 to 12 months to create a marked improvement in the unemployment rate. The Fed has pledged to keep interest rates at historically low rates for the next couple of years. They have also announced that they intend to purchase mortgage bonds to help improve mortgage rates even further. Even with all of this new money being added into the system, inflation has still not been a problem. This is the result of the U.S. dollar being so weak. The manufacturing sector has been strong over the last 12 months, mainly because of the weak dollar. A true recovery is going to need to see meaningful job growth, a housing recovery and a confident consumer. Some of the pieces are in place and others are moving in the right direction. The Euro debt crisis will more than likely be a cloud over the economy for the foreseeable future. So it is not time to celebrate yet. However, there are some silver linings in that cloud. We remain disciplined in our approach, never wavering from our core philosophy of seeking out quality companies that have growing cash flows, historical revenue and earnings growth and are currently exhibiting earnings growth momentum. We apply our proprietary valuation techniques to each of the stocks that we own for our Funds, buying only those stocks that represent what we believe to be an excellent value.
AlphaMark Large Cap Growth
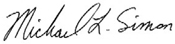
During the year ended August 31, 2012, the net asset value per share of the AlphaMark Large Cap Growth Fund (“AMLCX”) rose from $12.07 (adjusted for current year distributions) to $13.76, a total return of 14.03%. During this time, the S&P 500 Index and the Russell 1000 Growth Index gained 18.00% and 17.37%, respectively. Our discipline is to never
let any of our holdings become so large that they present undue risk to the portfolio. In order to achieve this, we consistently trim gains from any of our positions that are doing well. The main contributors of gains in the AMLCX over the last 12 months came from the following sectors: Health Care (Amgen +58%, Biogen Idec +60%, Novo Nordisk +52%), Consumer Discretionary (Ross Stores +90%, Discovery Communications +31%), and Financials (American Express +19%, IntercontinentalExchange +15%). The main contributors of loss in the AMLCX came from the Materials sector (Cliffs Natural Resources -55%, Joy Global -35%). We continue to maintain a diversified strategy across the various sectors of the economy. Historically, we have always sought out high quality companies that have earnings momentum. In our view, these types of companies have not been rewarded by the market over the last 12 months. In addition, earnings momentum is almost nonexistent. There have been slightly more negative earnings adjustments versus the norm over the last 12 months. We believe that the lowered expectations across the market present an opportunity for high quality earnings momentum stocks to outperform over the next couple of years.
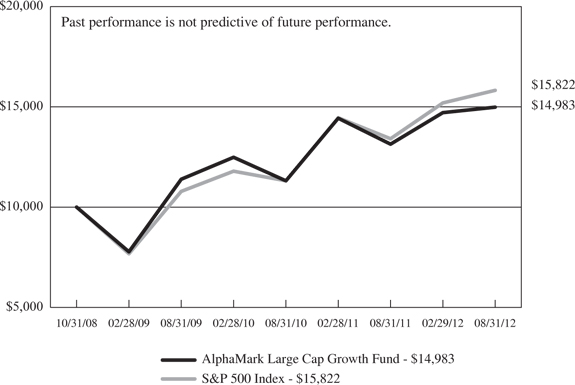
As of August 31, 2012, AMLCX’s assets were diversified among 33 stock positions. Our five largest areas of investment were: Information Technology (24.7%), Health Care (17.8%), Consumer Discretionary (15.2%), Industrials (15.1%) and Financials (7.4%). Cash equivalents represented 0.6% of the Fund’s net assets.
As of August 31, 2012, AMLCX had net assets of $17.1 million.
AlphaMark Small Cap Growth
During the year ended August 31, 2012, the net asset value per share of the AlphaMark Small Cap Growth Fund (“AMSCX”) grew from $14.05 to $14.31, a total return of 12.02%. During this time, the Russell 2000 Growth Index gained 12.72%. The main contributors of gains in the AMSCX over the last 12 months came from the following sectors: Information Technology (3D Systems +134%, Liquidity Services +61%, Netlogic Microsystems +60%, Wright Express +58%, Medidata Solutions +56%) and Health Care (Questcor Pharmaceuticals +68%). The main contributors of loss in the AMSCX are in the following sectors: Materials (Balchem -37%) and Energy (Mitcham Industries -31%, Berry Petroleum -21%). We continue to maintain a portfolio that is diversified across the various sectors of the economy.
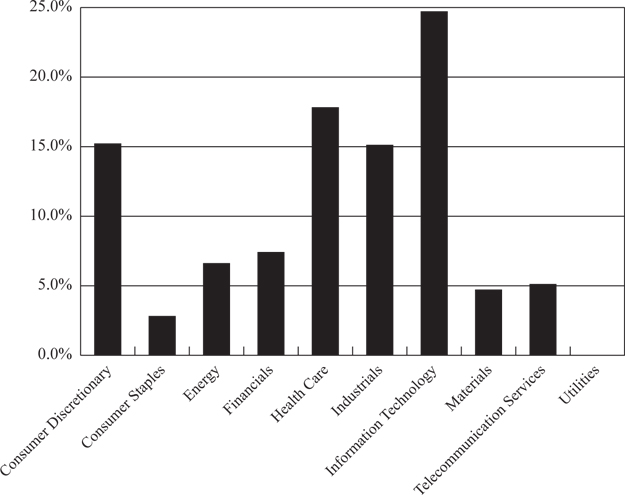
As of August 31, 2012, AMSCX’s assets were invested among 27 stock positions. Our four largest areas of investment were: Information Technology (37.2%), Health Care (17.3%), Consumer Discretionary (15.0%) and Industrials (14.2%). Cash equivalents represented 1.5% of the Fund’s net assets. We are confident that as we enter into a period of economic growth with a tilt towards earnings momentum, our investment philosophy and our disciplined approach to picking stocks will add value to the Fund.
As of August 31, 2012, AMSCX had net assets of $17.7 million.
In conclusion, no investment style will outperform every year. The nature of the market is change and volatility. Because the market has lowered expectations across the board, we believe that high quality companies that have consistently met or beat their earnings expectations will be rewarded over the coming months. We continually review current holdings for any weaknesses and make adjustments when necessary. There are still some headwinds in the economy, yet we are optimistic that high quality companies can still succeed. We look forward to providing you with Funds that will capture the momentum of high quality stocks as the economy recovers.
Sincerely,
Michael L. Simon
President and Chief Investment Officer
AlphaMark Advisors, LLC
Past performance is not predictive of future performance. Investment results and principal value will fluctuate so that shares, when redeemed, may be worth more or less than their original cost. Current performance may be higher or lower than the performance data quoted.
An investor should consider the investment objectives, risks, charges and expenses of the Funds carefully before investing. The Funds’ prospectus contains this and other important information. To obtain a copy of the Funds’ prospectus please call 1-866-420-3350 and a copy will be sent to you free of charge. Please read the prospectus carefully before you invest. The Funds are distributed by Ultimus Fund Distributors, LLC.
The Letter to Shareholders seeks to describe some of the Advisor’s current opinions and views of the financial markets. Although the Advisor believes it has a reasonable basis for any opinions or views expressed, actual results may differ, sometimes significantly so, from those expected or expressed.
ALPHAMARK LARGE CAP GROWTH FUND PERFORMANCE INFORMATION August 31, 2012 (Unaudited) |
Comparison of the Change in Value of a $10,000 Investment
in the AlphaMark Large Cap Growth Fund
versus the S&P 500 Index
Average Annual Total Returns (a) (for periods ended August 31, 2012) |
| | | | |
| AlphaMark Large Cap Growth Fund | 14.03% | 11.12% | |
| S&P 500 Index | 18.00% | 12.72% | |
| (a) | The returns shown do not reflect the deduction of taxes a shareholder would pay on Fund distributions or the redemption of Fund shares. |
| | |
| * | Represents the period from the commencement of operations (October 31, 2008) through August 31, 2012. |
ALPHAMARK SMALL CAP GROWTH FUND PERFORMANCE INFORMATION August 31, 2012 (Unaudited) |
Comparison of the Change in Value of a $10,000 Investment
in the AlphaMark Small Cap Growth Fund
versus the Russell 2000 Growth Index
Average Annual Total Returns (a) (for periods ended August 31, 2012) |
| | | | |
| AlphaMark Small Cap Growth Fund | 12.02% | 13.57% | |
| Russell 2000 Growth Index | 12.72% | 15.37% | |
| (a) | The returns shown do not reflect the deduction of taxes a shareholder would pay on Fund distributions or the redemption of Fund shares. |
| | |
| * | Represents the period from the commencement of operations (October 31, 2008) through August 31, 2012. |
ALPHAMARK LARGE CAP GROWTH FUND PORTFOLIO INFORMATION August 31, 2012 (Unaudited) |
Sector Diversification (% of Net Assets)
| Top Ten Equity Holdings |
| | |
| Novo Nordisk A/S - ADR | | 3.9% |
| American Express Co. | | 3.7% |
| IntercontinentalExchange, Inc. | | 3.7% |
| Regeneron Pharmaceuticals, Inc. | | 3.6% |
| Amgen, Inc. | | 3.6% |
| Tenaris S.A. - ADR | | 3.5% |
| Southwest Airlines Co. | | 3.5% |
| Flowserve Corp. | | 3.5% |
| Biogen Idec, Inc. | | 3.4% |
| Apple, Inc. | | 3.3% |
ALPHAMARK SMALL CAP GROWTH FUND PORTFOLIO INFORMATION August 31, 2012 (Unaudited) |
Sector Diversification (% of Net Assets)
| Top Ten Equity Holdings |
| | |
| Credit Acceptance Corp. | | 4.1% |
| PVH Corp. | | 4.0% |
| Genesco, Inc. | | 4.0% |
| Inter Parfums, Inc. | | 3.9% |
| Ultratech, Inc. | | 3.9% |
| Radware Ltd. | | 3.9% |
| Ensign Group, Inc. (The) | | 3.9% |
| Monotype Imaging Holdings, Inc. | | 3.8% |
| Silicon Motion Technology Corp. - ADR | | 3.8% |
| 3D Systems Corp. | | 3.8% |
ALPHAMARK LARGE CAP GROWTH FUND SCHEDULE OF INVESTMENTS August 31, 2012 |
| | | | | | |
| Consumer Discretionary — 15.2% | | | | | | |
| Auto Components — 3.1% | | | | | | |
Autoliv, Inc. | | | 8,844 | | | $ | 524,361 | |
| | | | | | | | | |
| Hotels, Restaurants & Leisure — 6.0% | | | | | | | | |
McDonald's Corp. | | | 5,104 | | | | 456,757 | |
Starwood Hotels & Resorts Worldwide, Inc. | | | 10,263 | | | | 565,799 | |
| | | | | | | | 1,022,556 | |
| Media — 3.1% | | | | | | | | |
Discovery Communications, Inc. - Class A * | | | 9,771 | | | | 535,842 | |
| | | | | | | | | |
| Specialty Retail — 3.0% | | | | | | | | |
Ross Stores, Inc. | | | 7,380 | | | | 510,622 | |
| | | | | | | | | |
| Consumer Staples — 2.8% | | | | | | | | |
| Personal Products — 2.8% | | | | | | | | |
Estée Lauder Cos., Inc. (The) - Class A | | | 7,898 | | | | 473,485 | |
| | | | | | | | | |
| Energy — 6.6% | | | | | | | | |
| Energy Equipment & Services — 3.5% | | | | | | | | |
Tenaris S.A. - ADR | | | 14,500 | | | | 604,795 | |
| | | | | | | | | |
| Oil, Gas & Consumable Fuels — 3.1% | | | | | | | | |
CNOOC Ltd. - ADR | | | 2,799 | | | | 530,131 | |
| | | | | | | | | |
| Financials — 7.4% | | | | | | | | |
| Consumer Finance — 3.7%. | | | | | | | | |
American Express Co. | | | 10,892 | | | | 635,004 | |
| | | | | | | | | |
| Diversified Financial Services — 3.7% | | | | | | | | |
IntercontinentalExchange, Inc. * | | | 4,592 | | | | 627,726 | |
| | | | | | | | | |
| Health Care — 17.8% | | | | | | | | |
| Biotechnology — 10.6% | | | | | | | | |
Amgen, Inc. | | | 7,343 | | | | 616,225 | |
Biogen Idec, Inc. * | | | 4,002 | | | | 586,653 | |
Regeneron Pharmaceuticals, Inc. * | | | 4,167 | | | | 616,924 | |
| | | | | | | | 1,819,802 | |
| Pharmaceuticals — 7.2% | | | | | | | | |
Novo Nordisk A/S - ADR | | | 4,226 | | | | 663,947 | |
Perrigo Co. | | | 5,165 | | | | 567,995 | |
| | | | | | | | 1,231,942 | |
See accompanying notes to financial statements.
ALPHAMARK LARGE CAP GROWTH FUND SCHEDULE OF INVESTMENTS (Continued) |
COMMON STOCKS — 99.4% (Continued) | | | | | | |
| Industrials — 15.1% | | | | | | |
| Airlines — 3.5% | | | | | | |
Southwest Airlines Co. | | | 67,000 | | | $ | 598,980 | |
| | | | | | | | | |
| Commercial Services & Supplies — 2.6% | | | | | | | | |
Waste Management, Inc. | | | 13,090 | | | | 452,652 | |
| | | | | | | | | |
| Electrical Equipment — 3.3% | | | | | | | | |
Rockwell Automation, Inc. | | | 7,850 | | | | 565,671 | |
| | | | | | | | | |
| Machinery — 5.7% | | | | | | | | |
Flowserve Corp. | | | 4,630 | | | | 591,066 | |
Joy Global, Inc. | | | 7,164 | | | | 382,414 | |
| | | | | | | | 973,480 | |
| Information Technology — 24.7% | | | | | | | | |
| Computers & Peripherals — 6.2% | | | | | | | | |
Apple, Inc. | | | 858 | | | | 570,776 | |
EMC Corp. * | | | 18,528 | | | | 487,101 | |
| | | | | | | | 1,057,877 | |
| Electronic Equipment, Instruments & Components — 2.4% | | | | | | | | |
Amphenol Corp. - Class A | | | 6,888 | | | | 419,273 | |
| | | | | | | | | |
| Internet Software & Services — 10.6% | | | | | | | | |
Akamai Technologies, Inc. * | | | 11,000 | | | | 412,610 | |
eBay, Inc. * | | | 10,796 | | | | 512,486 | |
Google, Inc. - Class A * | | | 682 | | | | 467,231 | |
NetEase, Inc. - ADR * | | | 7,933 | | | | 413,071 | |
| | | | | | | | 1,805,398 | |
| Semiconductors & Semiconductor Equipment — 2.6% | | | | | | | | |
Broadcom Corp. - Class A * | | | 12,673 | | | | 450,272 | |
| | | | | | | | | |
| Software — 2.9% | | | | | | | | |
Oracle Corp. | | | 15,412 | | | | 487,790 | |
| | | | | | | | | |
| Materials — 4.7% | | | | | | | | |
| Chemicals — 2.7% | | | | | | | | |
Eastman Chemical Co. | | | 8,300 | | | | 458,658 | |
| | | | | | | | | |
| Metals & Mining — 2.0% | | | | | | | | |
Cliffs Natural Resources, Inc. | | | 9,432 | | | | 338,043 | |
See accompanying notes to financial statements.
ALPHAMARK LARGE CAP GROWTH FUND SCHEDULE OF INVESTMENTS (Continued) |
COMMON STOCKS — 99.4% (Continued) | | | | | | |
| Telecommunication Services — 5.1% | | | | | | |
| Diversified Telecommunication Services — 5.1% | | | | | | |
CenturyLink, Inc. | | | 10,475 | | | $ | 442,673 | |
Verizon Communications, Inc. | | | 10,181 | | | | 437,172 | |
| | | | | | | | 879,845 | |
| | | | | | | | | |
Total Common Stocks (Cost $12,816,268) | | | | | | $ | 17,004,205 | |
| |
MONEY MARKET FUNDS — 0.6% | | | | | | |
Fidelity Institutional Money Market Portfolio - Select Class, 0.11% (a) | | | 79,919 | | | $ | 79,919 | |
Invesco Liquid Assets Portfolio (The) - Institutional Class, 0.17% (a) | | | 26,636 | | | | 26,636 | |
Total Money Market Funds (Cost $106,555) | | | | | | $ | 106,555 | |
| | | | | | | | | |
Total Investments at Value — 100.0% (Cost $12,922,823) | | | | | | $ | 17,110,760 | |
| | | | | | | | | |
Other Assets in Excess of Liabilities — 0.0% | | | | | | | 3,851 | |
| | | | | | | | | |
Net Assets — 100.0% | | | | | | $ | 17,114,611 | |
| ADR - American Depositary Receipt. |
| |
| * | Non-income producing security. |
| | |
| (a) | The rate shown is the 7-day effective yield as of August 31, 2012. |
| | |
| See accompanying notes to financial statements. |
ALPHAMARK SMALL CAP GROWTH FUND SCHEDULE OF INVESTMENTS August 31, 2012 |
| | | | | | |
| Consumer Discretionary — 15.0% | | | | | | |
| Auto Components — 3.4% | | | | | | |
Cooper Tire & Rubber Co. | | | 30,000 | | | $ | 599,700 | |
| | | | | | | | | |
| Leisure Equipment & Products — 3.6% | | | | | | | | |
Sturm Ruger & Co., Inc. | | | 14,730 | | | | 637,809 | |
| | | | | | | | | |
| Specialty Retail — 4.0% | | | | | | | | |
Genesco, Inc. * | | | 9,930 | | | | 701,554 | |
| | | | | | | | | |
| Textiles, Apparel & Luxury Goods — 4.0% | | | | | | | | |
PVH Corp. | | | 7,610 | | | | 714,579 | |
| | | | | | | | | |
| Consumer Staples — 7.5% | | | | | | | | |
| Beverages — 3.6% | | | | | | | | |
Viña Concha y Toro S.A. - ADR | | | 16,712 | | | | 642,576 | |
| | | | | | | | | |
| Personal Products — 3.9% | | | | | | | | |
Inter Parfums, Inc. | | | 41,696 | | | | 692,154 | |
| | | | | | | | | |
| Financials — 7.7% | | | | | | | | |
| Consumer Finance — 4.1% | | | | | | | | |
Credit Acceptance Corp. * | | | 7,325 | | | | 721,220 | |
| | | | | | | | | |
| Diversified Financial Services — 3.6% | | | | | | | | |
MarketAxess Holdings, Inc. | | | 19,770 | | | | 643,909 | |
| | | | | | | | | |
| Health Care — 17.3% | | | | | | | | |
| Biotechnology — 3.0% | | | | | | | | |
SciClone Pharmaceuticals, Inc. * | | | 110,015 | | | | 539,074 | |
| | | | | | | | | |
| Health Care Equipment & Supplies — 6.7% | | | | | | | | |
Cantel Medical Corp. | | | 23,500 | | | | 605,360 | |
Cynosure, Inc. - Class A * | | | 22,000 | | | | 572,000 | |
| | | | | | | | 1,177,360 | |
| Health Care Providers & Services — 3.9% | | | | | | | | |
Ensign Group, Inc. (The) | | | 23,230 | | | | 683,891 | |
| | | | | | | | | |
| Pharmaceuticals — 3.7% | | | | | | | | |
Questcor Pharmaceuticals, Inc. * | | | 15,000 | | | | 651,600 | |
See accompanying notes to financial statements.
ALPHAMARK SMALL CAP GROWTH FUND SCHEDULE OF INVESTMENTS (Continued) |
COMMON STOCKS — 98.9% (Continued) | | | | | | |
| Industrials — 14.2% | | | | | | |
| Airlines — 3.4% | | | | | | |
Allegiant Travel Co. * | | | 9,000 | | | $ | 596,160 | |
| | | | | | | | | |
| Electrical Equipment — 7.3% | | | | | | | | |
AZZ, Inc. | | | 20,456 | | | | 649,683 | |
EnerSys * | | | 17,500 | | | | 651,875 | |
| | | | | | | | 1,301,558 | |
| Trading Companies & Distributors — 3.5% | | | | | | | | |
Titan Machinery, Inc. * | | | 26,650 | | | | 614,282 | |
| | | | | | | | | |
| Information Technology — 37.2% | | | | | | | | |
| Communications Equipment — 3.9% | | | | | | | | |
Radware Ltd. * | | | 21,000 | | | | 685,650 | |
| | | | | | | | | |
| Computers & Peripherals — 3.8% | | | | | | | | |
3D Systems Corp. * | | | 15,285 | | | | 668,107 | |
| | | | | | | | | |
| Internet Software & Services — 3.7% | | | | | | | | |
Liquidity Services, Inc. * | | | 12,500 | | | | 654,875 | |
| | | | | | | | | |
| IT Services — 7.5% | | | | | | | | |
ExlService Holdings, Inc. * | | | 25,830 | | | | 665,639 | |
Wright Express Corp. * | | | 9,900 | | | | 651,816 | |
| | | | | | | | 1,317,455 | |
| Semiconductors & Semiconductor Equipment — 14.5% | | | | | | | | |
Entropic Communications, Inc. * | | | 115,000 | | | | 624,450 | |
Silicon Motion Technology Corp. - ADR * | | | 43,860 | | | | 672,812 | |
Ultratech, Inc. * | | | 20,900 | | | | 689,282 | |
Veeco Instruments, Inc. * | | | 17,000 | | | | 583,100 | |
| | | | | | | | 2,569,644 | |
| Software — 3.8% | | | | | | | | |
Monotype Imaging Holdings, Inc. * | | | 44,950 | | | | 678,296 | |
| | | | | | | | | |
Total Common Stocks — (Cost $15,227,702) | | | | | | $ | 17,491,453 | |
| See accompanying notes to financial statements. |
ALPHAMARK SMALL CAP GROWTH FUND SCHEDULE OF INVESTMENTS (Continued) |
MONEY MARKET FUNDS — 1.5% | | | | | | |
Fidelity Institutional Money Market Portfolio - Select Class, 0.11% (a) | | | 198,696 | | | $ | 198,696 | |
Invesco Liquid Assets Portfolio (The) - Institutional Class, 0.17% (a) | | | 66,232 | | | | 66,232 | |
Total Money Market Funds (Cost $264,928) | | | | | | $ | 264,928 | |
| | | | | | | | | |
Total Investments at Value — 100.4% (Cost $15,492,630) | | | | | | $ | 17,756,381 | |
| | | | | | | | | |
Liabilities in Excess of Other Assets — (0.4%) | | | | | | | (75,908 | ) |
| | | | | | | | | |
Net Assets — 100.0% | | | | | | $ | 17,680,473 | |
| ADR - American Depositary Receipt. |
| |
| * | Non-income producing security. |
| | |
| (a) | The rate shown is the 7-day effective yield as of August 31, 2012. |
| | |
| See accompanying notes to financial statements. |
ALPHAMARK INVESTMENT TRUST STATEMENTS OF ASSETS AND LIABILITIES August 31, 2012 |
| | AlphaMark Large Cap Growth Fund | | | AlphaMark Small Cap Growth Fund | |
| ASSETS | | | | | | |
| Investments in securities: | | | | | | |
At acquisition cost | | $ | 12,922,823 | | | $ | 15,492,630 | |
At value (Note 1) | | $ | 17,110,760 | | | $ | 17,756,381 | |
Dividends receivable | | | 21,937 | | | | 6,444 | |
Receivable for investment securities sold | | | — | | | | 3,158,900 | |
Receivable for capital shares sold | | | 358 | | | | 8,192 | |
Other assets | | | 2,858 | | | | 2,874 | |
TOTAL ASSETS | | | 17,135,913 | | | | 20,932,791 | |
| | | | | | | | | |
| LIABILITIES | | | | | | | | |
Payable for investment securities purchased | | | — | | | | 3,232,445 | |
Payable for capital shares redeemed | | | 3,000 | | | | 1,016 | |
Accrued advisory fees (Note 3) | | | 5,839 | | | | 6,296 | |
Payable to administrator (Note 3) | | | 5,640 | | | | 5,650 | |
Accrued distribution fees (Note 3) | | | 3,303 | | | | 3,391 | |
Other accrued expenses | | | 3,520 | | | | 3,520 | |
TOTAL LIABILITIES | | | 21,302 | | | | 3,252,318 | |
| | | | | | | | | |
NET ASSETS | | $ | 17,114,611 | | | $ | 17,680,473 | |
| | | | | | | | | |
| Net assets consist of: | | | | | | | | |
Paid-in capital | | $ | 11,854,633 | | | $ | 13,693,828 | |
Undistributed net realized gains from security transactions | | | 1,072,041 | | | | 1,722,894 | |
Net unrealized appreciation on investments | | | 4,187,937 | | | | 2,263,751 | |
NET ASSETS | | $ | 17,114,611 | | | $ | 17,680,473 | |
| | | | | | | | | |
Shares of beneficial interest outstanding (unlimited number of shares authorized, no par value) | | | 1,243,622 | | | | 1,235,761 | |
| | | | | | | | | |
Net asset value, offering price and redemption price per share (a) (Note 1) | | $ | 13.76 | | | $ | 14.31 | |
| (a) | Redemption price varies based on length of time shares are held. |
| | |
| See accompanying notes to financial statements. |
ALPHAMARK INVESTMENT TRUST STATEMENTS OF OPERATIONS For the Year Ended August 31, 2012 |
| | AlphaMark Large Cap Growth Fund | | | AlphaMark Small Cap Growth Fund | |
| INVESTMENT INCOME | | | | | | |
Dividend income | | $ | 234,814 | | | $ | 130,851 | |
Foreign withholding taxes on dividends | | | (6,597 | ) | | | (3,573 | ) |
TOTAL INVESTMENT INCOME | | | 228,217 | | | | 127,278 | |
| | | | | | | | | |
| EXPENSES | | | | | | | | |
Investment advisory fees (Note 3) | | | 160,658 | | | | 173,938 | |
Distribution fees (Note 3) | | | 40,164 | | | | 43,485 | |
Fund accounting fees (Note 3) | | | 30,031 | | | | 30,163 | |
Administration fees (Note 3) | | | 23,092 | | | | 24,778 | |
Professional fees | | | 23,262 | | | | 23,262 | |
Transfer agent fees (Note 3) | | | 12,000 | | | | 12,000 | |
Insurance expense | | | 9,710 | | | | 9,790 | |
Registration and filing fees | | | 9,574 | | | | 9,789 | |
Custody and bank service fees | | | 8,761 | | | | 9,558 | |
Trustees' fees and expenses | | | 6,039 | | | | 6,039 | |
Compliance service fees (Note 3) | | | 6,000 | | | | 6,000 | |
Postage and supplies | | | 3,820 | | | | 4,566 | |
Printing of shareholder reports | | | 1,667 | | | | 2,067 | |
Other expenses | | | 4,516 | | | | 4,402 | |
TOTAL EXPENSES | | | 339,294 | | | | 359,837 | |
Fee reductions by the Advisor (Note 3) | | | (98,308 | ) | | | (98,929 | ) |
NET EXPENSES | | | 240,986 | | | | 260,908 | |
| | | | | | | | | |
NET INVESTMENT LOSS | | | (12,769 | ) | | | (133,630 | ) |
| | | | | | | | | |
REALIZED AND UNREALIZED GAINS (LOSSES) ON INVESTMENTS | | | | | | | | |
Net realized gains from security transactions | | | 1,251,218 | | | | 2,107,928 | |
Net change in unrealized appreciation/ depreciation on investments | | | 884,544 | | | | (44,093 | ) |
NET REALIZED AND UNREALIZED GAINS ON INVESTMENTS | | | 2,135,762 | | | | 2,063,835 | |
| | | | | | | | | |
NET INCREASE IN NET ASSETS FROM OPERATIONS | | $ | 2,122,993 | | | $ | 1,930,205 | |
| See accompanying notes to financial statements. |
ALPHAMARK LARGE CAP GROWTH FUND STATEMENTS OF CHANGES IN NET ASSETS |
| | | | | | |
| FROM OPERATIONS | | | | | | |
Net investment loss | | $ | (12,769 | ) | | $ | (55,086 | ) |
Net realized gains from security transactions | | | 1,251,218 | | | | 565,846 | |
Net change in unrealized appreciation/ depreciation on investments | | | 884,544 | | | | 1,419,705 | |
Net increase in net assets from operations | | | 2,122,993 | | | | 1,930,465 | |
| | | | | | | | | |
| DISTRIBUTIONS TO SHAREHOLDERS | | | | | | | | |
From net realized gains | | | (644,132 | ) | | | (468,270 | ) |
| | | | | | | | | |
| CAPITAL SHARE TRANSACTIONS | | | | | | | | |
Proceeds from shares sold | | | 2,342,828 | | | | 5,295,956 | |
Net asset value of shares issued in reinvestment of distributions to shareholders | | | 644,132 | | | | 468,270 | |
Proceeds from redemption fees collected (Note 1) | | | 535 | | | | 697 | |
Payments for shares redeemed | | | (3,207,906 | ) | | | (3,379,912 | ) |
Net increase (decrease) in net assets from capital share transactions | | | (220,411 | ) | | | 2,385,011 | |
| | | | | | | | | |
TOTAL INCREASE IN NET ASSETS | | | 1,258,450 | | | | 3,847,206 | |
| | | | | | | | | |
| NET ASSETS | | | | | | | | |
Beginning of year | | | 15,856,161 | | | | 12,008,955 | |
End of year | | $ | 17,114,611 | | | $ | 15,856,161 | |
| | | | | | | | | |
ACCUMULATED NET INVESTMENT INCOME | | $ | — | | | $ | — | |
| | | | | | | | | |
| CAPITAL SHARE ACTIVITY | | | | | | | | |
Shares sold | | | 181,355 | | | | 405,823 | |
Shares reinvested | | | 53,323 | | | | 35,883 | |
Shares redeemed | | | (249,856 | ) | | | (255,861 | ) |
Net increase (decrease) in shares outstanding | | | (15,178 | ) | | | 185,845 | |
Shares outstanding at beginning of year | | | 1,258,800 | | | | 1,072,955 | |
Shares outstanding at end of year | | | 1,243,622 | | | | 1,258,800 | |
| See accompanying notes to financial statements. |
ALPHAMARK SMALL CAP GROWTH FUND STATEMENTS OF CHANGES IN NET ASSETS |
| | | | | | |
| FROM OPERATIONS | | | | | | |
Net investment loss | | $ | (133,630 | ) | | $ | (133,021 | ) |
Net realized gains from security transactions | | | 2,107,928 | | | | 1,649,145 | |
Net change in unrealized appreciation/ depreciation on investments | | | (44,093 | ) | | | 1,208,815 | |
Net increase in net assets from operations | | | 1,930,205 | | | | 2,724,939 | |
| | | | | | | | | |
| DISTRIBUTIONS TO SHAREHOLDERS | | | | | | | | |
From net realized gains | | | (1,505,898 | ) | | | (504,063 | ) |
| | | | | | | | | |
| CAPITAL SHARE TRANSACTIONS | | | | | | | | |
Proceeds from shares sold | | | 5,075,700 | | | | 6,830,417 | |
Net asset value of shares issued in reinvestment of distributions to shareholders | | | 1,505,898 | | | | 504,063 | |
Proceeds from redemption fees collected (Note 1) | | | 900 | | | | 1,267 | |
Payments for shares redeemed | | | (4,866,020 | ) | | | (4,745,834 | ) |
Net increase in net assets from capital share transactions | | | 1,716,478 | | | | 2,589,913 | |
| | | | | | | | | |
TOTAL INCREASE IN NET ASSETS | | | 2,140,785 | | | | 4,810,789 | |
| | | | | | | | | |
| NET ASSETS | | | | | | | | |
Beginning of year | | | 15,539,688 | | | | 10,728,899 | |
End of year | | $ | 17,680,473 | | | $ | 15,539,688 | |
| | | | | | | | | |
ACCUMULATED NET INVESTMENT INCOME | | $ | — | | | $ | — | |
| | | | | | | | | |
| CAPITAL SHARE ACTIVITY | | | | | | | | |
Shares sold | | | 359,759 | | | | 455,961 | |
Shares reinvested | | | 112,801 | | | | 33,604 | |
Shares redeemed | | | (343,162 | ) | | | (324,623 | ) |
Net increase in shares outstanding | | | 129,398 | | | | 164,942 | |
Shares outstanding at beginning of year | | | 1,106,363 | | | | 941,421 | |
Shares outstanding at end of year | | | 1,235,761 | | | | 1,106,363 | |
| See accompanying notes to financial statements. |
ALPHAMARK LARGE CAP GROWTH FUND FINANCIAL HIGHLIGHTS Per Share Data for a Share Outstanding Throughout Each Period |
| | | | | | | | | | | Period Ended August 31, 2009(a) | |
| Net asset value at beginning of period | | $ | 12.60 | | | $ | 11.19 | | | $ | 11.37 | | | $ | 10.00 | |
| | | | | | | | | | | | | | | | | |
| Income (loss) from investment operations: | | | | | | | | | | | | | | | | |
| Net investment income (loss) | | | (0.01 | ) | | | (0.04 | ) | | | (0.04 | ) | | | 0.01 | |
Net realized and unrealized gains (losses) on investments | | | 1.70 | | | | 1.86 | | | | (0.03 | ) | | | 1.38 | |
| Total from investment operations | | | 1.69 | | | | 1.82 | | | | (0.07 | ) | | | 1.39 | |
| | | | | | | | | | | | | | | | | |
| Less distributions: | | | | | | | | | | | | | | | | |
| From net investment income | | | — | | | | — | | | | — | | | | (0.01 | ) |
| From net realized gains | | | (0.53 | ) | | | (0.41 | ) | | | (0.11 | ) | | | (0.01 | ) |
| Total distributions | | | (0.53 | ) | | | (0.41 | ) | | | (0.11 | ) | | | (0.02 | ) |
| | | | | | | | | | | | | | | | | |
| Proceeds from redemption fees collected (Note 1) | | | 0.00 | (b) | | | 0.00 | (b) | | | — | | | | — | |
| | | | | | | | | | | | | | | | | |
| Net asset value at end of period | | $ | 13.76 | | | $ | 12.60 | | | $ | 11.19 | | | $ | 11.37 | |
| | | | | | | | | | | | | | | | | |
Total return (c) | | | 14.03% | | | | 16.15% | | | | (0.69% | ) | | | 13.92% | (d)(e) |
| | | | | | | | | | | | | | | | | |
| Net assets at end of period | | $ | 17,114,611 | | | $ | 15,856,161 | | | $ | 12,008,955 | | | $ | 11,449,045 | |
| | | | | | | | | | | | | | | | | |
| Ratio of total expenses to average net assets | | | 2.11% | | | | 2.08% | | | | 2.32% | | | | 2.49% | (f) |
| | | | | | | | | | | | | | | | | |
Ratio of net expenses to average net assets (g) | | | 1.50% | | | | 1.50% | | | | 1.50% | | | | 1.50% | (f) |
| | | | | | | | | | | | | | | | | |
Ratio of net investment income (loss) to average net assets (g) | | | (0.08% | ) | | | (0.35% | ) | | | (0.32% | ) | | | 0.12% | (f) |
| | | | | | | | | | | | | | | | | |
| Portfolio turnover rate | | | 52% | | | | 47% | | | | 30% | | | | 120% | (d) |
| (a) | Represents the period from the commencement of operations (October 31, 2008) through August 31, 2009. |
| | |
| (b) | Amount rounds to less than $0.01 per share. |
| | |
| (c) | Total return is a measure of the change in value of an investment in the Fund over the period covered, which assumes any dividends or capital gains distributions are reinvested in shares of the Fund. The returns shown do not reflect the deduction of taxes a shareholder would pay on Fund distributions or the redemption of Fund shares. |
| | |
| (d) | Not annualized. |
| | |
| (e) | During the period ended August 31, 2009, the Fund received a payment from the administrator of $95,117 for losses realized on the sale of investments as a result of a cash reporting error, which otherwise would have reduced the total return by 1.60%. |
| | |
| (f) | Annualized. |
| | |
| (g) | Ratio was determined after advisory fee reductions and expense reimbursements (Note 3). |
| | |
| See accompanying notes to financial statements. |
ALPHAMARK SMALL CAP GROWTH FUND FINANCIAL HIGHLIGHTS Per Share Data for a Share Outstanding Throughout Each Period |
| | | | | | | | | | | Period Ended August 31, 2009(a) | |
| Net asset value at beginning of period | | $ | 14.05 | | | $ | 11.40 | | | $ | 10.23 | | | $ | 10.00 | |
| | | | | | | | | | | | | | | | | |
| Income (loss) from investment operations: | | | | | | | | | | | | | | | | |
| Net investment loss | | | (0.11 | ) | | | (0.12 | ) | | | (0.11 | ) | | | (0.04 | ) |
Net realized and unrealized gains on investments | | | 1.70 | | | | 3.29 | | | | 1.28 | | | | 0.27 | |
| Total from investment operations | | | 1.59 | | | | 3.17 | | | | 1.17 | | | | 0.23 | |
| | | | | | | | | | | | | | | | | |
| Less distributions: | | | | | | | | | | | | | | | | |
| From net realized gains | | | (1.33 | ) | | | (0.52 | ) | | | — | | | | — | |
| | | | | | | | | | | | | | | | | |
| Proceeds from redemption fees collected (Note 1) | | | 0.00 | (b) | | | 0.00 | (b) | | | — | | | | — | |
| | | | | | | | | | | | | | | | | |
| Net asset value at end of period | | $ | 14.31 | | | $ | 14.05 | | | $ | 11.40 | | | $ | 10.23 | |
| | | | | | | | | | | | | | | | | |
Total return (c) | | | 12.02% | | | | 27.52% | | | | 11.44% | | | | 2.30% | (d) |
| | | | | | | | | | | | | | | | | |
| Net assets at end of period | | $ | 17,680,473 | | | $ | 15,539,688 | | | $ | 10,728,899 | | | $ | 8,773,981 | |
| | | | | | | | | | | | | | | | | |
| Ratio of total expenses to average net assets | | | 2.07% | | | | 2.14% | | | | 2.55% | | | | 2.78% | (e) |
| | | | | | | | | | | | | | | | | |
Ratio of net expenses to average net assets (f) | | | 1.50% | | | | 1.50% | | | | 1.50% | | | | 1.50% | (e) |
| | | | | | | | | | | | | | | | | |
Ratio of net investment loss to average net assets (f) | | | (0.77% | ) | | | (0.86% | ) | | | (1.07% | ) | | | (0.62% | )(e) |
| | | | | | | | | | | | | | | | | |
| Portfolio turnover rate | | | 117% | | | | 111% | | | | 73% | | | | 107% | (d) |
| (a) | Represents the period from the commencement of operations (October 31, 2008) through August 31, 2009. |
| | |
| (b) | Amount rounds to less than $0.01 per share. |
| | |
| (c) | Total return is a measure of the change in value of an investment in the Fund over the period covered, which assumes any dividends or capital gains distributions are reinvested in shares of the Fund. The returns shown do not reflect the deduction of taxes a shareholder would pay on Fund distributions or the redemption of Fund shares. |
| | |
| (d) | Not annualized. |
| | |
| (e) | Annualized. |
| | |
| (f) | Ratio was determined after advisory fee reductions and expense reimbursements (Note 3). |
| | |
| See accompanying notes to financial statements. |
ALPHAMARK INVESTMENT TRUST NOTES TO FINANCIAL STATEMENTS August 31, 2012 |
| 1. | Organization and Significant Accounting Policies |
AlphaMark Large Cap Growth Fund and AlphaMark Small Cap Growth Fund (individually, a “Fund” and collectively, the “Funds”) are no-load series of AlphaMark Investment Trust (the “Trust”), an open-end management investment company established as an Ohio business trust under a Declaration of Trust dated June 24, 2008. The public offering of shares of the Funds commenced on October 31, 2008.
The investment objective of each Fund is long-term growth of capital. AlphaMark Large Cap Growth Fund is a diversified fund and AlphaMark Small Cap Fund is a non-diversified fund.
Securities valuation – The Funds’ portfolio securities are valued as of the close of business of the regular session of trading on the New York Stock Exchange (normally 4:00 p.m., Eastern time). Securities which are traded on stock exchanges are valued on the basis of their last sales prices on the exchanges on which they are primarily traded, or, if not traded on a particular day, at the closing bid price. Securities quoted by NASDAQ are valued at the NASDAQ Official Closing Price or, if not traded on a particular day, at the last bid price as reported by NASDAQ. Securities traded in the over-the-counter market are valued at the last sale price, if available, otherwise, at the mean of the closing bid and ask prices. Securities and other assets for which market quotations are not readily available or are considered to be unreliable due to significant market or other events are valued at their fair value as determined in good faith in accordance with consistently applied procedures established by and under the general supervision of the Board of Trustees and will be classified as Level 2 or 3 within the fair value hierarchy (see below), depending on the inputs used. The fair value of securities with remaining maturities of 60 days or less are valued at amortized cost, absent unusual circumstances.
Accounting principles generally accepted in the United States (“GAAP”) establish a single authoritative definition of fair value, set out a framework for measuring fair value and require additional disclosures about fair value measurements.
Various inputs are used in determining the value of each Fund’s investments. These inputs are summarized in the three broad levels listed below:
Level 1 – quoted prices in active markets for identical securities
Level 2 – other significant observable inputs
Level 3 – significant unobservable inputs
ALPHAMARK INVESTMENT TRUST NOTES TO FINANCIAL STATEMENTS (Continued) |
The inputs or methodology used for valuing securities are not necessarily an indication of the risks associated with investing in those securities. The inputs used to measure fair value may fall into different levels of the fair value hierarchy. In such cases, for disclosure purposes, the level in the fair value hierarchy within which the fair value measurement falls in its entirety is determined based on the lowest level input that is significant to the fair value measurement.
The following is a summary of the inputs used to value the Funds’ investments by security type, as of August 31, 2012:
AlphaMark Large Cap Growth Fund
| | | | | | | | | | | | |
Common Stocks | | $ | 17,004,205 | | | $ | — | | | $ | — | | | $ | 17,004,205 | |
Money Market Funds | | | 106,555 | | | | — | | | | — | | | | 106,555 | |
Total | | $ | 17,110,760 | | | $ | — | | | $ | — | | | $ | 17,110,760 | |
AlphaMark Small Cap Growth Fund
| | | | | | | | | | | | |
Common Stocks | | $ | 17,491,453 | | | $ | — | | | $ | — | | | $ | 17,491,453 | |
Money Market Funds | | | 264,928 | | | | — | | | | — | | | | 264,928 | |
Total | | $ | 17,756,381 | | | $ | — | | | $ | — | | | $ | 17,756,381 | |
See each Fund’s Schedule of Investments for a listing of the common stocks valued using Level 1 inputs by industry type.
The Funds did not have any transfers in and out of any Level as of the year ended August 31, 2012. The Funds did not hold any derivative instruments or assets or liabilities that were measured at fair value on a recurring basis using significant unobservable inputs (Level 3) as of the year ended August 31, 2012. It is the Funds’ policy to recognize transfers into and out of any Level at the end of the reporting period.
Share valuation – The net asset value per share of each Fund is calculated daily by dividing the total value of each Fund’s assets, less liabilities, by the number of shares outstanding. The offering price and redemption price per share of each Fund is equal to the net asset value per share, except that shares of the Funds are subject to a redemption fee of 1.5%, payable to the applicable Fund, if redeemed within sixty days of the date of purchase. During the years ended August 31, 2012 and 2011, proceeds from redemption fees totaled $535 and $697, respectively, for AlphaMark Large Cap Growth Fund and $900 and $1,267, respectively, for AlphaMark Small Cap Growth Fund.
ALPHAMARK INVESTMENT TRUST NOTES TO FINANCIAL STATEMENTS (Continued) |
Security transactions and investment income – Security transactions are accounted for on trade date. Gains and losses on securities sold are determined on a specific identification basis. Realized gains or losses from sales of securities are determined by comparing the identified cost of the security lot sold with the net sales proceeds. Interest income is accrued as earned. Dividend income is recorded on the ex-dividend date. Withholding taxes on foreign dividends have been provided for in accordance with the Funds’ understanding of the applicable country’s tax rules and rates.
Expenses – Expenses of the Trust that are directly identifiable to a specific Fund are charged to that Fund. Expenses which are not readily identifiable to a specific Fund are allocated in such a manner as deemed equitable.
Distributions to shareholders – Dividends arising from net investment income and distributions of net realized capital gains, if any, are declared and paid annually in December. The amount of distributions from net investment income and net realized capital gains are determined in accordance with federal income tax regulations which may differ from GAAP. Dividends and distributions to shareholders are recorded on the ex-dividend date.
The tax character of distributions paid to shareholders of the Funds during the years ended August 31, 2012 and 2011 was as follows:
| | | | | | | | | | |
| AlphaMark Large Cap Growth Fund | 8/31/12 | | $ | 34,564 | | | $ | 609,568 | | | $ | 644,132 | |
| | 8/31/11 | | $ | — | | | $ | 468,270 | | | $ | 468,270 | |
| AlphaMark Small Cap Growth Fund | 8/31/12 | | $ | 247,822 | | | $ | 1,258,076 | | | $ | 1,505,898 | |
| | 8/31/11 | | $ | — | | | $ | 504,063 | | | $ | 504,063 | |
Estimates – The preparation of financial statements in conformity with GAAP requires management to make estimates and assumptions that affect the reported amounts of assets and liabilities and the disclosure of contingent assets and liabilities as of the date of the financial statements and the reported amounts of income and expenses during the reporting period. Actual results could differ from those estimates.
Federal income tax – It is each Fund’s policy to comply with the special provisions of Subchapter M of the Internal Revenue Code applicable to regulated investment companies. As provided therein, in any fiscal year in which a Fund so qualifies and distributes at least 90% of its taxable net income, the Fund (but not the shareholders) will be relieved of federal income tax on the income distributed. Accordingly, no provision for income taxes has been made.
ALPHAMARK INVESTMENT TRUST NOTES TO FINANCIAL STATEMENTS (Continued) |
In order to avoid imposition of the excise tax applicable to regulated investment companies, it is also each Fund’s intention to declare as dividends in each calendar year at least 98% of its net investment income (earned during the calendar year) and 98.2% of its net realized capital gains (earned during the twelve months ended October 31) plus undistributed amounts from prior years.
The following is computed on a tax basis for each item as of August 31, 2012:
| | AlphaMark Large Cap Growth Fund | | | AlphaMark Small Cap Growth Fund | |
| Tax cost of portfolio investments | | $ | 12,960,381 | | | $ | 15,518,363 | |
| Gross unrealized appreciation | | $ | 4,737,274 | | | $ | 2,852,020 | |
| Gross unrealized depreciation | | | (586,895 | ) | | | (614,002 | ) |
| Net unrealized appreciation | | | 4,150,379 | | | | 2,238,018 | |
| Undistributed ordinary income | | | — | | | | 249,033 | |
| Undistributed long-term gains | | | 1,504,443 | | | | 1,499,594 | |
| Qualified late year losses | | | (394,844 | ) | | | — | |
| Total distributable earnings | | $ | 5,259,978 | | | $ | 3,986,645 | |
The difference between the federal income tax cost of portfolio investments and the financial statement cost for the Funds is due to certain timing differences in the recognition of capital gains or losses under income tax regulations and GAAP. These “book/tax” differences are temporary in nature and are due to the tax deferral of losses on wash sales.
Net qualified late year losses, incurred after October 31, 2011 and within the taxable year, are deemed to arise on the first day of the Funds’ next taxable year. During the period from November 1, 2011 until August 31, 2012, AlphaMark Large Cap Fund incurred $394,844 of late year capital losses, which it intends to defer to September 1, 2012 for federal tax purposes.
For the year ended August 31, 2012, AlphaMark Large Cap Growth Fund and AlphaMark Small Cap Growth Fund reclassified $12,769 and $133,630, respectively, of net investment loss against undistributed net realized gains from security transactions on the Statements of Assets and Liabilities. Such reclassifications, the result of permanent differences between financial statement and income tax reporting requirements, had no effect on the Funds’ net assets or net asset value per share.
ALPHAMARK INVESTMENT TRUST NOTES TO FINANCIAL STATEMENTS (Continued) |
The Funds recognize the tax benefits or expenses of uncertain tax positions only when the position is “more likely than not” to be sustained assuming examination by tax authorities. Management has reviewed the Funds’ tax positions and concluded that no provision for unrecognized tax benefits or expenses should be recorded related to uncertain tax positions taken in the Funds’ tax returns for all open tax years (tax years ended August 31, 2010 through August 31, 2012). During the year ended August 31, 2012, the Funds did not incur any interest or penalties. Generally, tax authorities can examine tax returns filed during the last three years. Each Fund identifies its major tax jurisdiction as U.S. Federal.
| 2. | Investment Transactions |
During the year ended August 31, 2012, cost of purchases and proceeds from sales of investment securities, other than short-term investments and U.S. government securities, were as follows:
| | AlphaMark Large Cap Growth Fund | | | AlphaMark Small Cap Growth Fund | |
| Cost of purchases of investment securities | | $ | 8,219,842 | | | $ | 20,224,755 | |
| Proceeds from sales of investment securities | | $ | 8,969,914 | | | $ | 20,013,287 | |
| 3. | Transactions with Affiliates |
The President of AlphaMark Advisors, LLC (the “Advisor”), the investment advisor to the Funds, is also the President and a Trustee of the Trust. Certain other officers of the Trust are also officers of the Advisor, or of Ultimus Fund Solutions, LLC (“Ultimus”), the Funds’ administrator, transfer agent, and fund accounting agent, and Ultimus Fund Distributors, LLC (“UFD”), the Funds’ principal underwriter.
The Chief Compliance Officer (the “CCO”) of the Trust is an employee of the Advisor. Each Fund reimburses the Advisor $6,000 annually for the services provided by the CCO to the Trust.
INVESTMENT ADVISORY AGREEMENT
Under the terms of Investment Advisory Agreements between the Trust and the Advisor, the Advisor serves as the investment advisor to the Funds. Each Fund pays the Advisor an investment advisory fee computed at the annual rate of 1.00% of its average daily net assets.
ALPHAMARK INVESTMENT TRUST NOTES TO FINANCIAL STATEMENTS (Continued) |
The Advisor has contractually agreed, until at least December 31, 2012, to reduce its investment advisory fees and to reimburse other Fund operating expenses to the extent necessary to limit each Fund’s annual ordinary operating expenses (excluding brokerage costs, taxes, interest, organization costs and extraordinary expenses) to 1.50% of its average daily net assets. Pursuant to this agreement, the Advisor reduced its fees by $98,308 and $98,929 with respect to AlphaMark Large Cap Growth Fund and AlphaMark Small Cap Growth Fund, respectively, during the year ended August 31, 2012. Any such fee reductions or expense reimbursements by the Advisor are subject to repayment by the Funds, provided that the repayment does not cause a Fund’s ordinary operating expenses to exceed the expense limit, and provided further that the fees and expenses which are the subject of the repayment were incurred within three years of the repayment. As of August 31, 2012, the Advisor may in the future recover fee reductions and expense reimbursements totaling $291,794 and $300,401 from AlphaMark Large Cap Growth Fund and AlphaMark Small Cap Growth Fund, respectively. The Advisor may recover these amounts no later than the dates stated below:
| | AlphaMark Large Cap Growth Fund | | | AlphaMark Small Cap Growth Fund | |
| August 31, 2013 | | $ | 100,971 | | | $ | 103,227 | |
| August 31, 2014 | | | 92,515 | | | | 98,245 | |
| August 31, 2015 | | | 98,308 | | | | 98,929 | |
| | | $ | 291,794 | | | $ | 300,401 | |
ADMINISTRATION AGREEMENT
Under the terms of an Administration Agreement with the Trust, Ultimus provides executive and administrative services and internal regulatory compliance services for the Funds. Ultimus supervises the preparation of tax returns, reports to shareholders of the Funds, reports to and filings with the Securities and Exchange Commission (“SEC”) and state securities commissions and prepares materials for meetings of the Board of Trustees. Effective August 1, 2012, each Fund pays to Ultimus a monthly fee at an annual rate of 0.10% of its average daily net assets up to $250 million; 0.075% of such assets between $250 million and $500 million; and 0.05% of such assets in excess of $500 million, subject to a minimum monthly fee of $2,000. Prior to August 1, 2012, each Fund paid Ultimus a monthly fee at an annual rate of 0.15% of its average daily net assets, subject to a minimum monthly fee of $2,000, which was discounted by 15% through December 31, 2011.
ALPHAMARK INVESTMENT TRUST NOTES TO FINANCIAL STATEMENTS (Continued) |
FUND ACCOUNTING AGREEMENT
Under the terms of a Fund Accounting Agreement with the Trust, Ultimus calculates each Fund’s daily net asset value per share and maintains the financial books and records of the Funds. For these services, each Fund pays to Ultimus a base fee of $2,500 per month, plus an asset-based fee at the annual rate of 0.01% of the first $500 million of its average daily net assets and 0.005% of such assets in excess of $500 million. The base fee and asset-based fee were discounted by 15% through December 31, 2011.
TRANSFER AGENT AND SHAREHOLDER SERVICES AGREEMENT
Under the terms of a Transfer Agent and Shareholder Services Agreement with the Trust, Ultimus maintains the records of each shareholder’s account, answers shareholders’ inquiries concerning their accounts, processes purchases and redemptions of each Fund’s shares, acts as dividend and distribution disbursing agent and performs other shareholder service functions. For these services, Ultimus receives from each Fund a fee, payable monthly, at an annual rate of $20 per shareholder account, provided, however, that the minimum fee with respect to each Fund is $1,000 per month if a Fund has 25 shareholder accounts or less, $1,250 if a Fund has more than 25 but less than 100 shareholder accounts, and $1,500 per month if a Fund has 100 or more shareholder accounts. In addition, each Fund reimburses Ultimus for out-of-pocket expenses including, but not limited to, postage and supplies.
DISTRIBUTION AGREEMENT
Pursuant to the terms of a Distribution Agreement with the Trust, UFD provides distribution services and serves as principal underwriter for the Funds. UFD is a wholly-owned subsidiary of Ultimus. UFD receives compensation of $6,000 annually for its services to the Trust.
DISTRIBUTION PLAN
The Trust has adopted a plan of distribution pursuant to Rule 12b-1 under the Investment Company Act of 1940 (the “Plan”) which allows the Funds to incur expenses related to the distribution of the Funds’ shares. The annual fees payable under the Plan may not exceed an amount equal to 0.25% of each Fund’s average daily net assets.
PRINCIPAL HOLDERS OF FUND SHARES
As of August 31, 2012, Charles Schwab & Co., Inc., for the benefit of its customers, owned of record 98% and 97% of the outstanding shares of AlphaMark Large Cap Fund and AlphaMark Small Cap Fund, respectively.
ALPHAMARK INVESTMENT TRUST NOTES TO FINANCIAL STATEMENTS (Continued) |
If a Fund has significant investments in the securities of issuers in industries within a particular sector, any development affecting that sector will have a greater impact on the value of the net assets of the Fund than would be the case if the Fund did not have significant investments in that sector. In addition, this may increase the risk of loss of an investment in the Fund and increase the volatility of the Fund’s net asset value per share. As of August 31, 2012, AlphaMark Large Cap Growth Fund and AlphaMark Small Cap Growth Fund had 24.7% and 37.2%, respectively, of the value of its net assets invested in stocks within the Information Technology sector. From time to time, circumstances may affect a particular sector and the companies within such sector. For instance, economic or market factors, regulation or deregulation, or other developments may negatively impact all companies in a particular sector and therefore the value of the Fund’s portfolio would be adversely affected.
| 5. | Contingencies and Commitments |
The Funds indemnify the Trust’s officers and Trustees for certain liabilities that might arise from their performance of their duties to the Funds. Additionally, in the normal course of business, the Funds enter into contracts that contain a variety of representations and warranties and which provide general indemnifications. Each Fund’s maximum exposure under these arrangements is unknown, as this would involve future claims that may be made against the Funds that have not yet occurred. However, based on experience, the Trust expects the risk of loss to be remote.
The Funds are required to recognize in the financial statements the effects of all subsequent events that provide additional evidence about conditions that existed as of the date of the Statements of Assets and Liabilities. For non-recognized subsequent events that must be disclosed to keep the financial statements from being misleading, the Funds are required to disclose the nature of the event as well as an estimate of its financial effect, or a statement that such an estimate cannot be made. Management has evaluated subsequent events through the issuance of these financial statements and has noted no such events.
ALPHAMARK INVESTMENT TRUST REPORT OF INDEPENDENT REGISTERED PUBLIC ACCOUNTING FIRM |
To the Shareholders and Board of Trustees of
AlphaMark Investment Trust
We have audited the accompanying statements of assets and liabilities, of AlphaMark Investment Trust, comprising AlphaMark Large Cap Growth Fund and AlphaMark Small Cap Growth Fund (the “Funds”), including the schedules of investments, as of August 31, 2012, and the related statements of operations for the year then ended, the statements of changes in net assets for each of the two years in the period then ended, and the financial highlights for each of the four periods in the period then ended. These financial statements and financial highlights are the responsibility of the Funds’ management. Our responsibility is to express an opinion on these financial statements and financial highlights based on our audits.
We conducted our audits in accordance with the standards of the Public Company Accounting Oversight Board (United States). Those standards require that we plan and perform the audit to obtain reasonable assurance about whether the financial statements and financial highlights are free of material misstatement. An audit includes examining, on a test basis, evidence supporting the amounts and disclosures in the financial statements. Our procedures included confirmation of securities owned as of August 31, 2012, by correspondence with the custodian and broker. An audit also includes assessing the accounting principles used and significant estimates made by management, as well as evaluating the overall financial statement presentation. We believe that our audits provide a reasonable basis for our opinion.
In our opinion, the financial statements and financial highlights referred to above present fairly, in all material respects, the financial position of each of the Funds constituting the AlphaMark Investment Trust, as of August 31, 2012, the results of their operations for the year then ended, the changes in their net assets for each of the two years in the period then ended, and the financial highlights for each of the four periods in the period then ended, in conformity with accounting principles generally accepted in the United States of America.
COHEN FUND AUDIT SERVICES, LTD.
Cleveland, Ohio
October 18, 2012
ALPHAMARK INVESTMENT TRUST ABOUT YOUR FUNDS’ EXPENSES (Unaudited) |
We believe it is important for you to understand the impact of costs on your investment. All mutual funds have operating expenses. As a shareholder of the Funds, you incur ongoing costs, including management fees, distribution (12b-1) fees and other operating expenses. These ongoing costs, which are deducted from each Fund’s gross income, directly reduce the investment return of the Funds.
A mutual fund’s ongoing costs are expressed as a percentage of its average net assets. This figure is known as the expense ratio. The following examples are intended to help you understand the ongoing costs (in dollars) of investing in the Funds and to compare these costs with the ongoing costs of investing in other mutual funds. The examples below are based on an investment of $1,000 made at the beginning of the period shown and held for the entire period (March 1, 2012 – August 31, 2012).
The table below illustrates each Fund’s ongoing costs in two ways:
Actual fund return – This section helps you to estimate the actual expenses that you paid over the period. The “Ending Account Value” shown is derived from each Fund’s actual return, and the third column shows the dollar amount of operating expenses that would have been paid by an investor who started with $1,000 in the Funds. You may use the information here, together with the amount you invested, to estimate the expenses that you paid over the period.
To do so, simply divide your account value by $1,000 (for example, an $8,600 account value divided by $1,000 = 8.6), then multiply the result by the number given for the Funds under the heading “Expenses Paid During Period.”
Hypothetical 5% return – This section is intended to help you compare the Funds’ ongoing costs with those of other mutual funds. It assumes that each Fund had an annual return of 5% before expenses during the period shown, but that the expense ratio is unchanged. In this case, because the return used is not the Funds’ actual return, the results do not apply to your investment. The example is useful in making comparisons because the SEC requires all mutual funds to calculate expenses based on a 5% return. You can assess each Fund’s ongoing costs by comparing this hypothetical example with the hypothetical examples that appear in shareholder reports of other funds.
Note that expenses shown in the table are meant to highlight and help you compare ongoing costs only. The Funds do not impose any sales loads. However, a redemption fee of 1.5% is applied on the sale of shares redeemed within sixty days of the date of purchase. The calculations assume no shares were bought or sold during the period. Your actual costs may have been higher or lower, depending on the amount of your investment and the timing of any purchases or redemptions.
ALPHAMARK INVESTMENT TRUST ABOUT YOUR FUNDS’ EXPENSES (Unaudited) (Continued) |
More information about the Funds’ expenses, including annual expense ratios, can be found in this report. For additional information on operating expenses and other shareholder costs, please refer to the Funds’ prospectus.
AlphaMark Large Cap Growth Fund
| | Beginning Account Value March 1, 2012 | | | Ending Account Value August 31, 2012 | | | Expenses Paid During Period* | |
| Based on Actual Fund Return | | $ | 1,000.00 | | | $ | 1,018.50 | | | $ | 7.61 | |
| Based on Hypothetical 5% Return | | $ | 1,000.00 | | | $ | 1,017.60 | | | $ | 7.61 | |
| * | Expenses are equal to AlphaMark Large Cap Growth Fund’s annualized expense ratio of 1.50% for the period, multiplied by the average account value over the period, multiplied by 184/366 (to reflect the one-half year period). |
AlphaMark Small Cap Growth Fund
| | Beginning Account Value March 1, 2012 | | | Ending Account Value August 31, 2012 | | | Expenses Paid During Period* | |
| Based on Actual Fund Return | | $ | 1,000.00 | | | $ | 1,004.20 | | | $ | 7.56 | |
| Based on Hypothetical 5% Return | | $ | 1,000.00 | | | $ | 1,017.60 | | | $ | 7.61 | |
| * | Expenses are equal to AlphaMark Small Cap Growth Fund’s annualized expense ratio of 1.50% for the period, multiplied by the average account value over the period, multiplied by 184/366 (to reflect the one-half year period). |
ALPHAMARK INVESTMENT TRUST BOARD OF TRUSTEES AND EXECUTIVE OFFICERS (Unaudited) |
The Board of Trustees has overall responsibility for management of the Trust’s affairs. The Trustees serve during the lifetime of the Trust and until its termination, or until death, resignation, retirement or removal. The Trustees, in turn, elect the officers of the Trust to actively supervise its day-to-day operations. The officers have been elected for an annual term. The following are the Trustees and executive officers of the Trust:
| Interested Trustee |
| Name, Age & Address | Position(s) Held with the Trust | Term of Office & Length of Time Served | Principal Occupation(s) During Past 5 Years | Number of Funds Overseen by Trustee | Directorships of Public Companies Held by Trustee |
Michael L. Simon* 250 Grandview Drive Fort Mitchell, KY 41017 Age: 45 | President and Trustee | Since July, 2008 | Founder, President and Chief Investment Officer of the Advisor. | 2 | None |
| Independent Trustees |
John W. Hopper, Jr. 250 Grandview Drive Fort Mitchell, KY 41017 Age: 52 | Chairman and Trustee | Since September, 2008 | Founder and partner of Silverstone Advisors, LLC (a boutique investment banking and consulting firm); prior to February, 2008, Chief Executive Officer of Conexio Technology Solutions, LLC. | 2 | None |
C. Christopher Muth 250 Grandview Drive Fort Mitchell, KY 41017 Age: 57 | Trustee | Since September, 2008 | Partner of Dinsmore & Shohl LLP (law firm); prior to April, 2010, member of Greenebaum Doll & McDonald PLLC (law firm). | 2 | None |
T. Brian Brockhoff 250 Grandview Drive Fort Mitchell, KY 41017 Age: 48 | Trustee | Since September, 2008 | Principal of Bailey Capital Partners, Inc. (mortgage bankers). | 2 | None |
| * | Mr. Simon, as an affiliated person of the Advisor, is considered an “interested person” of the Trust within the meaning of Section 2(a)(19) of the Investment Company Act of 1940. |
ALPHAMARK INVESTMENT TRUST BOARD OF TRUSTEES AND EXECUTIVE OFFICERS (Unaudited) (Continued) |
| Executive Officers |
| Name, Age & Address | Position(s) Held with the Trust | Length of Time Served | Principal Occupation(s) During Past 5 Years |
Christian A. Lucas 250 Grandview Drive Fort Mitchell, KY 41017 Age: 40 | Vice President | Since July, 2008 | Member/Owner of the Advisor. |
Anne M. Haggerty 250 Grandview Drive Fort Mitchell, KY 41017 Age: 51 | Chief Compliance Officer | Since March, 2009 | Director of Operations and Chief Compliance Officer of the Advisor; prior to December, 2007, Manager of Trading Operations of Fifth Third Asset Management, Inc. (investment advisory firm). |
Robert G. Dorsey 225 Pictoria Drive, Suite 450 Cincinnati, OH 45246 Age: 55 | Vice President | Since July, 2008 | Managing Director of Ultimus and UFD. |
Mark J. Seger 225 Pictoria Drive, Suite 450 Cincinnati, OH 45246 Age: 50 | Treasurer | Since July, 2008 | Managing Director of Ultimus and UFD. |
Wade R. Bridge 225 Pictoria Drive, Suite 450 Cincinnati, OH 45246 Age: 43 | Secretary | Since July, 2011 | Director of Fund Administration of Ultimus and Vice President of UFD. |
Additional information about members of the Board of Trustees and executive officers is available in the Statement of Additional Information (“SAI”). To obtain a free copy of the SAI, please call 1-866-420-3350.
ALPHAMARK INVESTMENT TRUST OTHER INFORMATION (Unaudited) |
A description of the policies and procedures that the Funds use to vote proxies relating to portfolio securities is available without charge upon request by calling toll-free 1-866-420-3350, or on the SEC’s website at http://www.sec.gov. Information regarding how the Funds voted proxies relating to portfolio securities during the most recent 12-month period ended June 30 is also available without charge upon request by calling toll-free 1-866-420-3350, or on the SEC’s website at http://www.sec.gov.
The Trust files a complete listing of portfolio holdings for the Funds with the SEC as of the end of the first and third quarters of each fiscal year on Form N-Q. These filings are available upon request by calling 1-866-420-3350. Furthermore, you may obtain a copy of these filings on the SEC’s website at http://www.sec.gov. The Trust’s Forms N-Q may also be reviewed and copied at the SEC’s Public Reference Room in Washington, DC, and information on the operation of the Public Reference Room may be obtained by calling 1-800-SEC-0330.
ALPHAMARK INVESTMENT TRUST APPROVAL OF INVESTMENT ADVISORY AGREEMENTS (Unaudited) |
The Board of Trustees, including the Independent Trustees voting separately, have reviewed and approved the continuance of the Investment Advisory Agreements with the Advisor for the AlphaMark Large Cap Growth Fund (the “Large Cap Fund”) and the AlphaMark Small Cap Growth Fund (the “Small Cap Fund”, and together with the Large Cap Fund, the “Funds”). These approvals took place at an in-person meeting held on July 17, 2012, at which a majority of the Independent Trustees were present.
The Trustees were advised by independent counsel of their fiduciary obligations in approving the Investment Advisory Agreements and the Trustees requested such information from the Advisor as they deemed reasonably necessary to evaluate the terms of such Agreements and whether such Agreements continue to be in the best interests of the Funds and their shareholders. The Trustees reviewed the factors which are considered pertinent in reaching an informed business judgment concerning the continuance of the Investment Advisory Agreements, including: (i) the nature, quantity and quality of the services provided under the Investment Advisory Agreements; (ii) the investment performance of the Funds and the Advisor; (iii) the cost of services provided and the profits realized by the Advisor and any affiliates from their relationships with the Funds and the financial strength of the Advisor; (iv) the extent to which the Advisor realizes economies of scale as a Fund grows larger; (v) whether fee levels reflect such economies of scale for the benefit of shareholders; (vi) whether and how the Board relied on comparisons of services to be rendered to and fees to be paid by the Funds with the services provided by and the fees paid to other investment advisers or the services provided to and the fees paid by other clients of the Advisor; and (vii) any ancillary benefits derived or to be derived by the Advisor from its relationship with the Funds, such as soft dollar arrangements. The Trustees reviewed the background, qualifications, education and experience of the Advisor’s investment and operational personnel. The Trustees also considered the quality of administrative and other services provided to the Trust, the Advisor’s compliance program, and the Advisor’s role in coordinating such services and programs. They also reviewed the applicable case law with independent counsel. Throughout the process the Independent Trustees were advised by experienced independent counsel. The Independent Trustees reviewed the Investment Advisory Agreements with management and also met in a private session with counsel at which no representatives of the Advisor were present.
Below is a summary of the discussions and findings of the Trustees in regard to their approval of the continuance of the Investment Advisory Agreements.
| (i) | The nature, extent, and quality of the services provided by the Advisor. In this regard, the Independent Trustees reviewed the services being provided to the Funds by the Advisor. They discussed the responsibilities of the Advisor under the Advisory Agreements and the Advisor’s compensation under the Advisory Agreements. The Independent Trustees reviewed the background and experience of |
ALPHAMARK INVESTMENT TRUST APPROVAL OF INVESTMENT ADVISORY AGREEMENTS (Unaudited) (Continued) |
| | the Advisor’s key investment and operating personnel. They noted that the Advisor has had no significant turnover and continues to provide experienced professionals to manage the operations at the Advisor. After reviewing the foregoing information, the Independent Trustees concluded that the quality, extent and nature of the services provided by the Advisor to each Fund were satisfactory. |
| (ii) | The investment performance of the Funds and Advisor. In this regard, the Independent Trustees compared the performance of the Large Cap Fund with the performance of the S&P 500 Index, the Fund’s primary benchmark, over various periods ended May 31, 2012. The Independent Trustees considered that the Large Cap Fund outperformed the S&P 500 Index for the year-to-date and since inception periods ended May 31, 2012, but trailed the S&P 500 Index for the three months and one year periods ended May 31, 2012. They further considered the Large Cap Fund’s periods of outperformance and underperformance over the life of the Fund. They were also provided with comparative performance statistics of the universe of funds categorized by Morningstar as large cap growth funds with under $50 million in assets, which is the category to which the Large Cap Fund has been assigned. The Independent Trustees noted that for the year-to-date and one year periods ended June 30, 2012, the Large Cap Fund’s total returns (10.26% and 0.64%, respectively) exceeded the total returns of the average fund in the Morningstar large cap growth category with under $50 million in net assets (8.33% and 0.05%, respectively). It was further noted that for the year-to-date and one year periods ended June 30, 2012, the Large Cap Fund also outperformed the returns of the median fund in the large cap growth category with under $50 million in net assets (8.38% and 0.34%, respectively). The Independent Trustees reviewed performance information with respect to the Advisor’s other managed accounts with similar investment objectives, which indicated that the Large Cap Fund underperformed such other accounts for the periods ended May 31, 2012. They considered that, based on representations by the Advisor, those performance differences are primarily attributable to no fees being deducted from the other accounts performance numbers. The Independent Trustees also considered the consistency of the Advisor’s management of the Large Cap Fund with the Fund’s investment objective and policies. The Independent Trustees concluded that the investment performance of the Large Cap Fund has been satisfactory. |
The Independent Trustees reviewed the performance of the Small Cap Fund, which was compared to the performance of the Russell 2000 Growth Index, the Fund’s primary benchmark, over various periods ended May 31, 2012. It was noted by the Independent Trustees that the Small Cap Fund underperformed the Russell 2000 Growth Index over the year-to-date, one year and since inception periods ended May 31, 2012. They further noted that for the three month period ended May
ALPHAMARK INVESTMENT TRUST APPROVAL OF INVESTMENT ADVISORY AGREEMENTS (Unaudited) (Continued) |
31, 2012 the Small Cap Fund (-4.56%) outperformed the Russell 2000 Growth Index (-6.80%). The Independent Trustees were also provided with comparative performance statistics of the universe of funds categorized by Morningstar as “small cap growth” funds with under $50 million in assets, which is the category to which the Small Cap Fund has been assigned. The Independent Trustees noted that for the year-to-date, one year and three year periods ended June 30, 2012, the Small Cap Fund’s returns (6.82%, -3.00% and 19.50%, respectively) outperformed the performance of the average fund in the Morningstar small cap growth category (6.70%, -6.37% and 16.52%, respectively) over the same periods. The Independent Trustees reviewed performance information with respect to the Advisor’s other managed accounts with similar investment objectives, which indicated that the Small Cap Fund underperformed such other accounts for the periods ended May 31, 2012. They considered that, based on representations by the Advisor, those performance differences are primarily attributable to no fees being deducted from the other accounts performance numbers. The Independent Trustees considered the consistency of the Advisor’s management of the Small Cap Fund with the Fund’s investment objective and policies. The Independent Trustees concluded that the investment performance of the Small Cap Fund has been satisfactory.
| (iii) | The costs of the services to be provided and profits to be realized by the Advisor from its relationship with the Funds. In this regard, the Independent Trustees considered the Advisor’s staffing, personnel and operations; the financial condition of the Advisor and the level of commitment to the Funds by the principals of the Advisor; the asset levels of each Fund; the overall expenses of each Fund; and the distribution arrangements for each Fund. The Independent Trustees reviewed the rate of the advisory fees paid by the Funds under the Advisory Agreements and compared them to average advisory fee ratios of similar mutual funds compiled from statistics reported by Morningstar. They also compared the total operating expense ratios of the Funds with average expense ratios of representative funds with their respective Morningstar categories. It was noted by the Independent Trustees that, although, the Large Cap Fund’s advisory fee of 1.00% was higher than the average advisory fee (0.80%), the Large Cap Fund’s net expense ratio (1.50%) was lower than the average expense ratio (1.52%) for Morningstar’s large cap growth fund category with under $50 million in assets. The Independent Trustees also discussed the Advisor’s commitment to cap the Large Cap Fund’s ordinary operating expenses at 1.50% per annum. The Independent Trustees performed a similar comparison for the Small Cap Fund, finding that the Small Cap Fund’s advisory fee of 1.00% was higher than the average advisory fee (0.93%) and the Fund’s net expense ratio of 1.50% was considerably lower than the average expense ratio (1.80%) for Morningstar’s small cap growth fund category with |
ALPHAMARK INVESTMENT TRUST APPROVAL OF INVESTMENT ADVISORY AGREEMENTS (Unaudited) (Continued) |
| | under $50 million in assets. The Independent Trustees also discussed the Advisor’s commitment to cap the Small Cap Fund’s ordinary operating expenses at 1.50% per annum. |
The Independent Trustees then considered the Advisor’s analysis of its revenues and expenses with respect to its services provided to each Fund for periods ended May 31, 2012. The Independent Trustees took into account that the Advisor has received only a portion of its advisory fees with respect to its services to the Funds in order to maintain each Fund’s 1.50% per annum expense cap. It was noted by the Independent Trustees that the Advisor has yet to realize any profits for such services to each Fund.
The Independent Trustees reviewed the balance sheet of the Advisor as of December 31, 2011. They also considered the Advisor’s representation that no material changes have occurred to the Advisor’s financial condition since the balance sheet date. The Independent Trustees concluded that the Advisor has adequate financial resources to continue serving as the Funds’ investment adviser. The Independent Trustees considered the “fallout benefits” to the Advisor, including the additional exposure the Advisor has received as a result of managing the Funds. The Independent Trustees concluded that the fees paid by each Fund to the Advisor are reasonable in light of the quality of the services received.
| (iv) | The extent to which economies of scale would be realized as the Funds grow and whether advisory fee levels reflect these economies of scale for the benefit of the Funds’ investors. The Independent Trustees considered the current net assets for each Fund and discussed the expense cap arrangements between the Trust and the Advisor. The Independent Trustees noted that each Fund has grown its assets to the point where the Advisor is currently collecting a portion of its advisory fee. They also noted that the Funds will need to realize additional growth in assets before the Advisor will begin collecting its full advisory fees from the Funds. The Independent Trustees concluded that, at the Funds’ current asset levels, it would not be relevant to consider the extent to which economies of scale are being realized and that it is not necessary or appropriate at this time to consider adding fee breakpoints to the advisory fee schedules for the Funds. |
In conclusion, the Trustees did not identify any single factor as all-important or controlling in their determination to approve the Investment Advisory Agreements. The Trustees, including all of the Independent Trustees, concluded that the terms of each Investment Advisory Agreement were fair and reasonable, that the Advisor’s fees were reasonable in light of the services provided to the Funds and the benefits received by the Advisor, and that continuance of the Investment Advisory Agreements is in the best interests of each Fund and its shareholders.
| ALPHAMARK INVESTMENT TRUST |
Investment Adviser AlphaMark Advisors, LLC 250 Grandview Drive, Suite 175 Fort Mitchell, Kentucky 41017 Administrator Ultimus Fund Solutions, LLC P.O. Box 46707 Cincinnati, Ohio 45246-0707 1-866-420-3350 Legal Counsel Sullivan & Worcester LLP One Post Office Square Boston, Massachusetts 02109 | Custodian US Bank NA 425 Walnut Street Cincinnati, OH 45202 Board of Trustees John W. Hopper, Jr., Chairman C. Christopher Muth T. Brian Brockhoff Michael L. Simon Officers Michael L. Simon, President Christian A. Lucas, Vice President Robert G. Dorsey, Vice President Mark J. Seger, Treasurer Wade R. Bridge, Secretary Anne M. Haggerty, Chief Compliance Officer |
 |
As of the end of the period covered by this report, the registrant has adopted a code of ethics that applies to the registrant’s principal executive officer, principal financial officer, principal accounting officer or controller, or persons performing similar functions, regardless of whether these individuals are employed by the registrant or a third party. Pursuant to Item 12(a)(1), a copy of registrant’s code of ethics is filed as an exhibit to this Form N-CSR. During the period covered by this report, the code of ethics has not been amended, and the registrant has not granted any waivers, including implicit waivers, from the provisions of the code of ethics.
| Item 3. | Audit Committee Financial Expert. |
The registrant’s board of trustees has determined that the registrant does not have an audit committee financial expert serving on its audit committee. The audit committee determined that, although none of its members meet the technical definition of an audit committee financial expert, the members have sufficient financial expertise to address any issues that are likely to come before the committee.
| Item 4. | Principal Accountant Fees and Services. |
| | (a) | Audit Fees. The aggregate fees billed for professional services rendered by the principal accountant for the audit of the registrant’s annual financial statements or for services that are normally provided by the accountant in connection with statutory and regulatory filings or engagements were $22,000 and $22,000 with respect to the registrant’s fiscal years ended August 31, 2012 and 2011, respectively. |
| | (b) | Audit-Related Fees. No fees were billed in either of the last two fiscal years for assurance and related services by the principal accountant that are reasonably related to the performance of the audit of the registrant’s financial statements and are not reported under paragraph (a) of this Item. |
| | (c) | Tax Fees. The aggregate fees billed for professional services rendered by the principal accountant for tax compliance, tax advice, and tax planning were $5,000 and $5,000 with respect to the registrant’s fiscal years ended August 31, 2012 and 2011, respectively. The services comprising these fees are the preparation of the registrant’s federal income and excise tax returns. |
| | (d) | All Other Fees. No fees were billed in either of the last two fiscal years for products and services provided by the principal accountant, other than the services reported in paragraphs (a) through (c) of this Item. |
| | (e)(1) | The audit committee has not adopted pre-approval policies and procedures described in paragraph (c)(7) of Rule 2-01 of Regulation S-X. |
| | (e)(2) | None of the services described in paragraph (b) through (d) of this Item were approved by the audit committee pursuant to paragraph (c)(7)(i)(C) of Rule 2-01 of Regulation S-X. |
| | (f) | Less than 50% of hours expended on the principal accountant’s engagement to audit the registrant’s financial statements for the most recent fiscal year were attributed to work performed by persons other than the principal accountant’s full-time, permanent employees. |
| | (g) | With respect to the fiscal years ended August 31, 2012 and 2011, aggregate non-audit fees of $5,000 and $5,000, respectively, were billed by the registrant’s principal accountant for services rendered to the registrant. No non-audit fees were billed in either of the last two fiscal years by the registrant’s principal accountant for services rendered to the registrant’s investment adviser (not including any sub-adviser whose role is primarily portfolio management and is subcontracted with or overseen by another investment adviser), and any entity controlling, controlled by, or under common control with the adviser that provides ongoing services to the registrant. |
| | (h) | The principal accountant has not provided any non-audit services to the registrant’s investment adviser (not including any sub-adviser whose role is primarily portfolio management and is subcontracted with or overseen by another investment adviser), and any entity controlling, controlled by, or under common control with the investment adviser that provides ongoing services to the registrant. |
| Item 5. | Audit Committee of Listed Registrants. |
Not applicable
| Item 6. | Schedule of Investments. |
| | (a) | Not applicable [schedule filed with Item 1] |
| Item 7. | Disclosure of Proxy Voting Policies and Procedures for Closed-End Management Investment Companies. |
| Item 8. | Portfolio Managers of Closed-End Management Investment Companies. |
| Item 9. | Purchases of Equity Securities by Closed-End Management Investment Company and Affiliated Purchasers. |
| Item 10. | Submission of Matters to a Vote of Security Holders. |
The registrant’s Committee of Independent Trustees shall review shareholder recommendations for nominations to fill vacancies on the registrant’s board of trustees if such recommendations are submitted in writing and addressed to the Committee at the registrant’s offices. The Committee may adopt, by resolution, a policy regarding its procedures for considering candidates for the board of trustees, including any recommended by shareholders.
| Item 11. | Controls and Procedures. |
(a) Based on their evaluation of the registrant’s disclosure controls and procedures (as defined in Rule 30a-3(c) under the Investment Company Act of 1940) as of a date within 90 days of the filing date of this report, the registrant’s principal executive officer and principal financial officer have concluded that such disclosure controls and procedures are reasonably designed and are operating effectively to ensure that material information relating to the registrant, including its consolidated subsidiaries, is made known to them by others within those entities, particularly during the period in which this report is being prepared, and that the information required in filings on Form N-CSR is recorded, processed, summarized, and reported on a timely basis.
(b) There were no changes in the registrant’s internal control over financial reporting (as defined in Rule 30a-3(d) under the Investment Company Act of 1940) that occurred during the second fiscal quarter of the period covered by this report that have materially affected, or are reasonably likely to materially affect, the registrant’s internal control over financial reporting.
File the exhibits listed below as part of this Form. Letter or number the exhibits in the sequence indicated.
(a)(1) Any code of ethics, or amendment thereto, that is the subject of the disclosure required by Item 2, to the extent that the registrant intends to satisfy the Item 2 requirements through filing of an exhibit: Attached hereto
(a)(2) A separate certification for each principal executive officer and principal financial officer of the registrant as required by Rule 30a-2(a) under the Act (17 CFR 270.30a-2(a)): Attached hereto
(a)(3) Any written solicitation to purchase securities under Rule 23c-1 under the Act (17 CFR 270.23c-1) sent or given during the period covered by the report by or on behalf of the registrant to 10 or more persons: Not applicable
(b) Certifications required by Rule 30a-2(b) under the Act (17 CFR 270.30a-2(b)): Attached hereto
| Exhibit 99.CODE ETH | Code of Ethics |
| | |
| Exhibit 99.CERT | Certifications required by Rule 30a-2(a) under the Act |
| | |
| Exhibit 99.906CERT | Certifications required by Rule 30a-2(b) under the Act |
SIGNATURES
Pursuant to the requirements of the Securities Exchange Act of 1934 and the Investment Company Act of 1940, the registrant has duly caused this report to be signed on its behalf by the undersigned, thereunto duly authorized.
(Registrant) AlphaMark Investment Trust
| By (Signature and Title)* | /s/ Michael L. Simon | |
| | | Michael L. Simon, President | |
| | | | |
| Date | October 29, 2012 | | |
| | | | |
| | | | |
| Pursuant to the requirements of the Securities Exchange Act of 1934 and the Investment Company Act of 1940, this report has been signed below by the following persons on behalf of the registrant and in the capacities and on the dates indicated. |
| | | | |
| By (Signature and Title)* | /s/ Michael L. Simon | |
| | | Michael L. Simon, President | |
| | | | |
| Date | October 29, 2012 | | |
| | | | |
| | | | |
| By (Signature and Title)* | /s/ Mark J. Seger | |
| | | Mark J. Seger, Treasurer | |
| | | | |
| Date | October 29, 2012 | | |
* Print the name and title of each signing officer under his or her signature.