 Andrew Lane Chairman, President & CEO MRC Global Inc. // Bank of America Merrill Lynch Fall Bus Tour August 21, 2012 Exhibit 99.1 |
 Investor Presentation August 21, 2012 2 Forward Looking Statements and GAAP Disclaimer This presentation contains forward-looking statements, including, for example, statements about the Company’s business strategy, its industry, its future profitability, growth in the Company’s various markets, the strength of future activity levels, and the Company’s expectations, beliefs, plans, strategies, objectives, prospects and assumptions. These forward-looking statements are not guarantees of future performance. These statements involve known and unknown risks, uncertainties and other factors that may cause the Company’s actual results and performance to be materially different from any future results or performance expressed or implied by these forward-looking statements. For a discussion of key risk factors, please see the risk factors disclosed in the Company’s registration statement on Form S-1 effective April 11, 2012, related to our common stock, and our Quarterly Statement on Form 10-Q for the quarter ended June 30, 2012, both of which are available on the SEC’s website at www.sec.gov. Undue reliance should not be placed on the Company’s forward-looking statements. Although forward-looking statements reflect the Company’s good faith beliefs, reliance should not be placed on forward-looking statements because they involve known and unknown risks, uncertainties and other factors, which may cause our actual results, performance or achievements to differ materially from anticipated future results, performance or achievements expressed or implied by such forward-looking statements. The Company undertakes no obligation to publicly update or revise any forward-looking statement, whether as a result of new information, future events, changed circumstances or otherwise, except to the extent required by law. Statement Regarding use of Non-GAAP Measures: The Non-GAAP financial measures contained in this presentation (including, without limitation, EBITDA, Adjusted EBITDA, Adjusted EBITDA Margin, Adjusted Gross Profit, Return on Net Assets (RONA) and variations thereof) are not measures of financial performance calculated in accordance with GAAP and should not be considered as alternatives to net income (loss) or any other performance measure derived in accordance with GAAP or as alternatives to cash flows from operating activities as a measure of our liquidity. They should be viewed in addition to, and not as a substitute for, analysis of our results reported in accordance with GAAP, or as alternative measures of liquidity. Management believes that certain non-GAAP financial measures provide a view to measures similar to those used in evaluating our compliance with certain financial covenants under our credit facilities and provide financial statement users meaningful comparisons between current and prior year period results. They are also used as a metric to determine certain components of performance-based compensation. The adjustments and Adjusted EBITDA are based on currently available information and certain adjustments that we believe are reasonable and are presented as an aid in understanding our operating results. They are not necessarily indicative of future results of operations that may be obtained by the Company. |
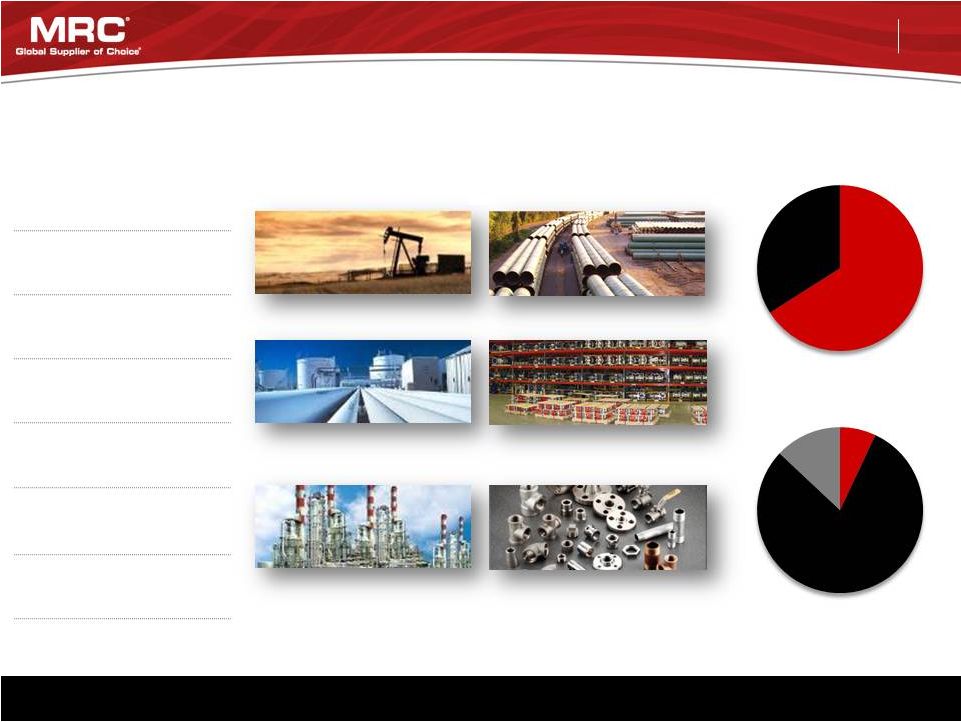 MRC is the largest global distributor of pipe, valves and fittings (PVF) to the energy industry. MRC is the largest global distributor of pipe, valves and fittings (PVF) to the energy industry. Company Snapshot International 7% Canada 13% MRO 66% Projects 34% U.S. 80% Investor Presentation August 21, 2012 3 By the Numbers Industry Sectors Product Categories Business Model 2011 Sales $4.83 B Upstream Line Pipe / OCTG Locations 410+ Countries 18 Midstream Valves Customers 12,000+ Suppliers 12,000+ Downstream/ Industrial Fittings / Flanges SKU’s 150,000+ Employees 4,500+ |
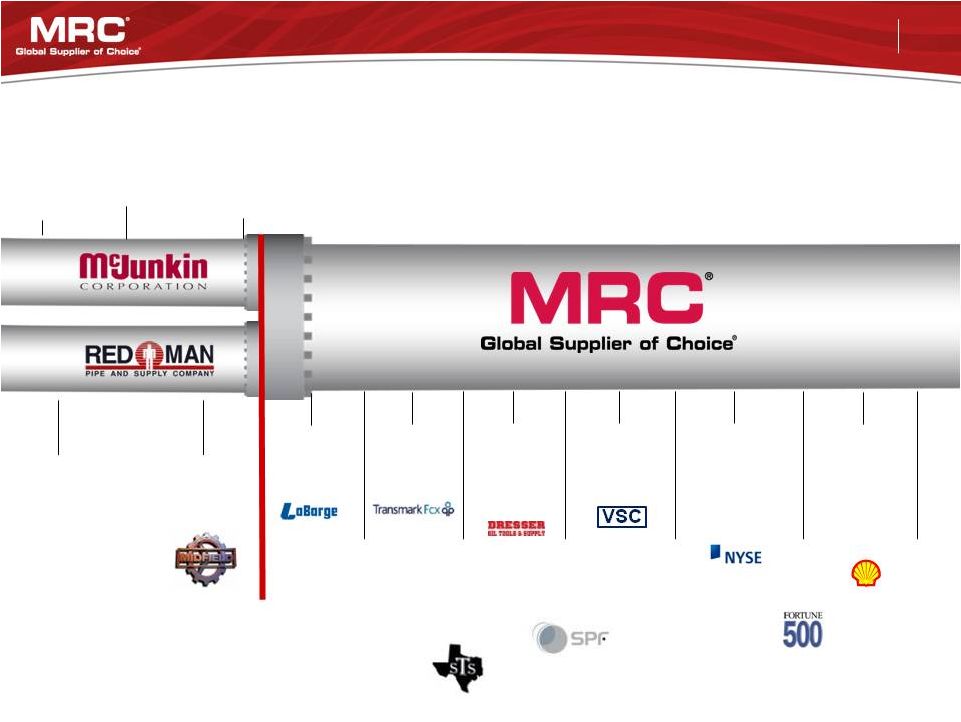 Investor Presentation August 21, 2012 4 Founded 1921 1989 Acquires Appalachian Pipe & Supply 2007 Goldman Sachs Capital Partners Strategic Investment 1977 Founded 2005 Acquires Midfield Supply 2008 MRC acquires LaBarge 2007 Merger of McJunkin and Red Man to form MRC 2009 MRC opens Houston HQ 2009 MRC acquires Transmark 2010 MRC acquires South Texas Supply 2010 MRC acquires Dresser Oil Tools 2011 MRC acquires SPF 2011 MRC acquires VSC 2012 MRC acquires OneSteel Piping Systems 2012 MRC Global IPO; begins trading on NYSE MRC’s 91 Year History // The Road to the Fortune 500 2012 MRC signs the industry’s first global valve contract with Shell 2012 MRC listed on Fortune 500 2012 MRC acquires Chaparral Supply |
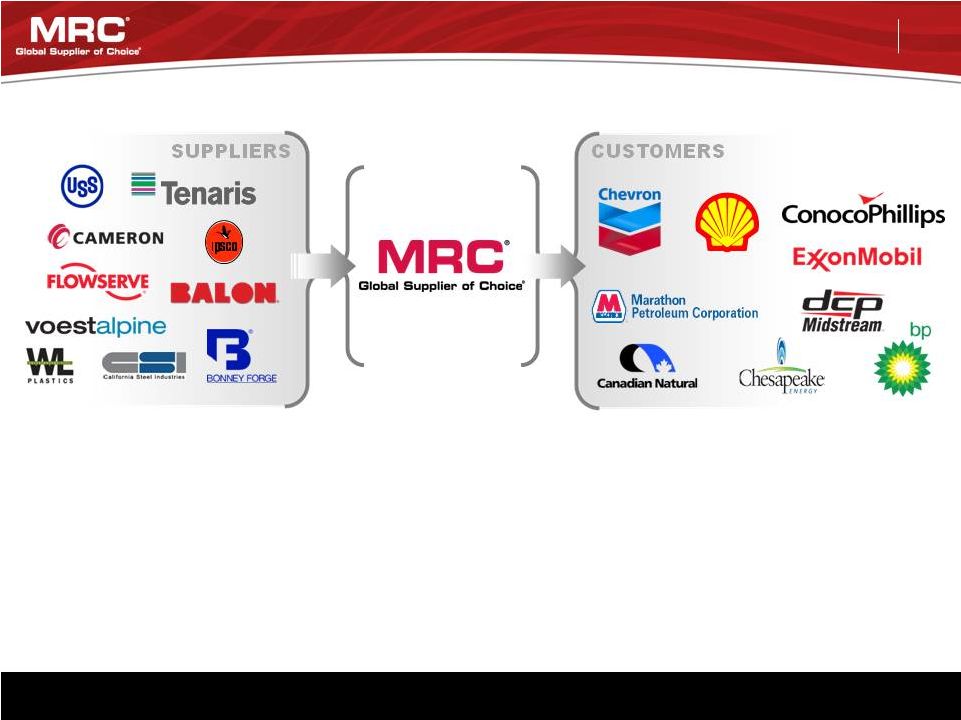 Investor Presentation August 21, 2012 5 Supplier Benefits • • • Customer Benefits • • • • MRC plays a critical role in the complex, technical, global energy supply chain. Business Model Mutual Benefits • • • Access to over 12,000+ customers Manufacturing and scale efficiencies Leverage MRC’s technical sales force Trusted long-term partnerships Financial stability MRC Approved Supplier List / Quality Program Access to over 12,000+ suppliers worldwide Efficiencies and inventory management Access to a broad product offering ($1B+ inventory) Access to global sourcing from 35 countries |
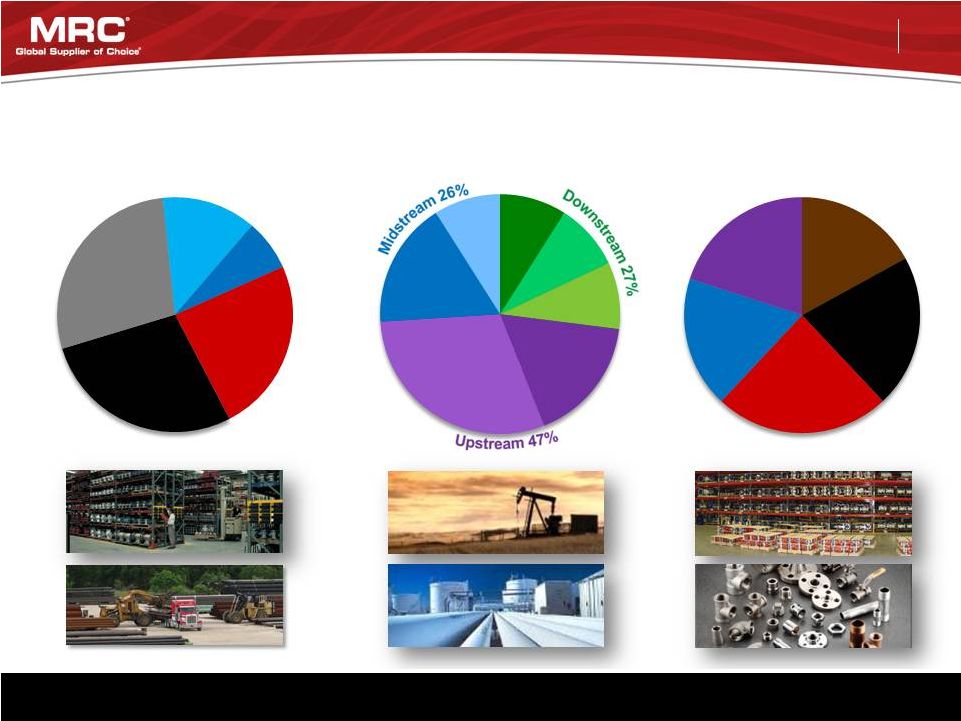 Investor Presentation August 21, 2012 6 By Geography Note: Business mix based on 2011 sales By Product Line MRC is diversified by geography, industry sector, and product line. Transmission 17% MRC Diversification Drilling & Completion Tubulars 17% Production Infrastructure, Materials & Supplies 30% International 7% Western US 24% Gulf Coast 28% Eastern US 28% Canada 13% Chemical 9% Refining 9% Other/ Industrial 9% Gas Utility 9% OCTG 17% Line Pipe 21% Valves 24% Fittings & Flanges 18% Other 20% By Industry Sector |
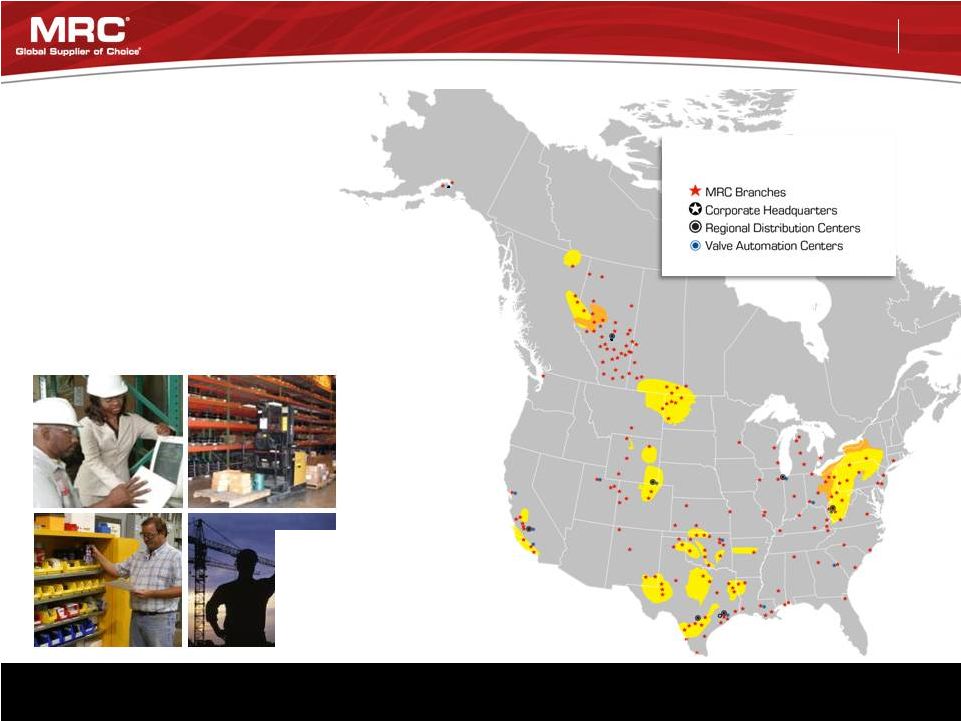 Investor Presentation August 21, 2012 7 Horn River Montney Duvernay Bakken Niobrara Monterey Mississippian Lime Granite Washington Woodford Fayetteville Barnett Haynesville Permian Basin Eagle Ford Utica Marcellus North America Shales North America Core Business Model Well positioned to capitalize on shale, heavy oil and oil sands activity. North America E&P spending to grow 6% in 2012*. * Barclays Equity Research • • • • 175+ Branches 160+ Pipe Yards 7 Regional Distribution Centers 14 Valve Automation Centers North American Infrastructure |
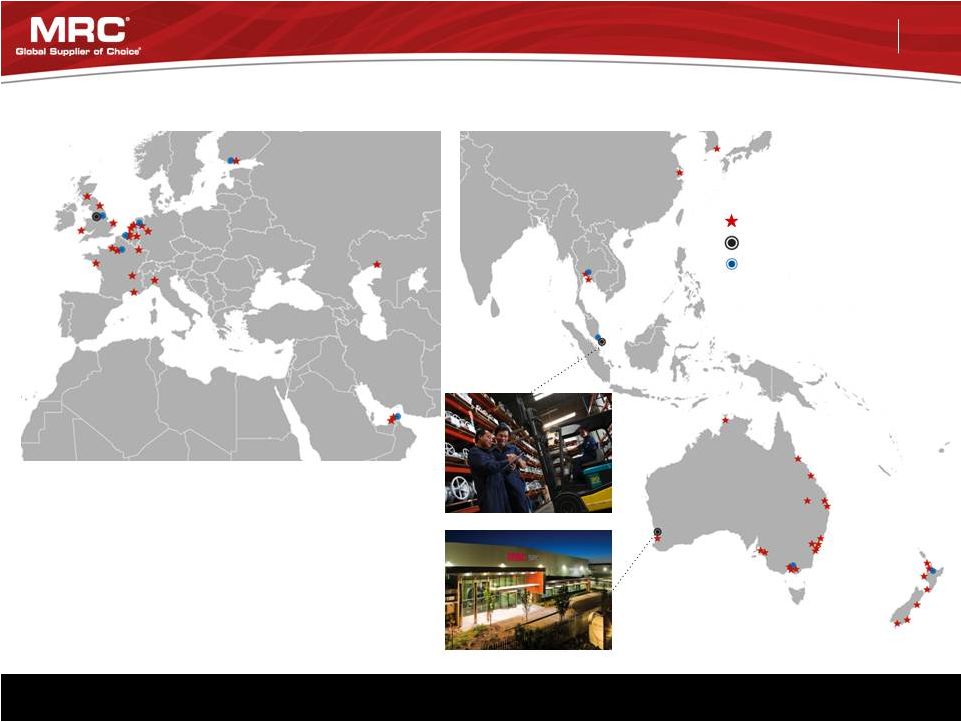 Investor Presentation August 21, 2012 8 International E&P spending forecast to grow 12% in 2012*. International Growth Model * Barclays Equity Research MRC Branches / Locations Regional Distribution Centers Valve Automation Centers Expanding International Presence • • • • 40+ Branches 2 Pipe Yards Regional Distribution Centers in UK, Singapore and Australia 10 Valve Automation Centers |
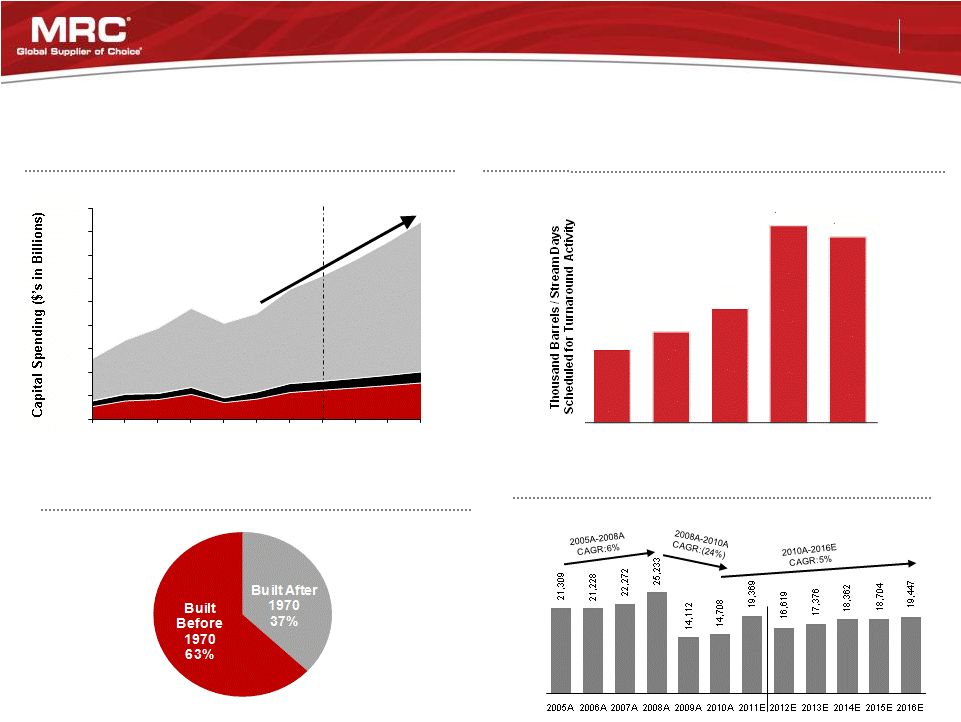 Investor Presentation August 21, 2012 9 Strong Growth in Global E&P Spending Source: Barclays 2012 E&P Spending Outlook Mid Year Update. U.S. Refining Turnaround Activity Positive Trends U.S. Additions to Natural Gas Pipelines U.S. Aging Infrastructure / New Legislation to Drive Pipeline Replacement Source: Industrial Info Resource, Inc. Based on quarterly average planned unit outages. Source: Pipeline Safety and Hazardous Materials Administration, Wall Street Journal, for Top 10 states by pipeline mileage Outside North America U.S. Investor Presentation August 21, 2012 9 444 548 688 1,193 1,126 2009A 2010A 2011E 2012E 2013E Actual Estimates Outside North America Canada U.S. 0 100 200 300 400 500 600 900 700 800 2005 2006 2007 2008 2009 2010 2011 2012 2013 2014 2015 Source: ICF International, North American Midstream Infrastructure Through 2035 – A Secure Energy Future, Prepared for the INGAA Foundation, June 28, 2011 |
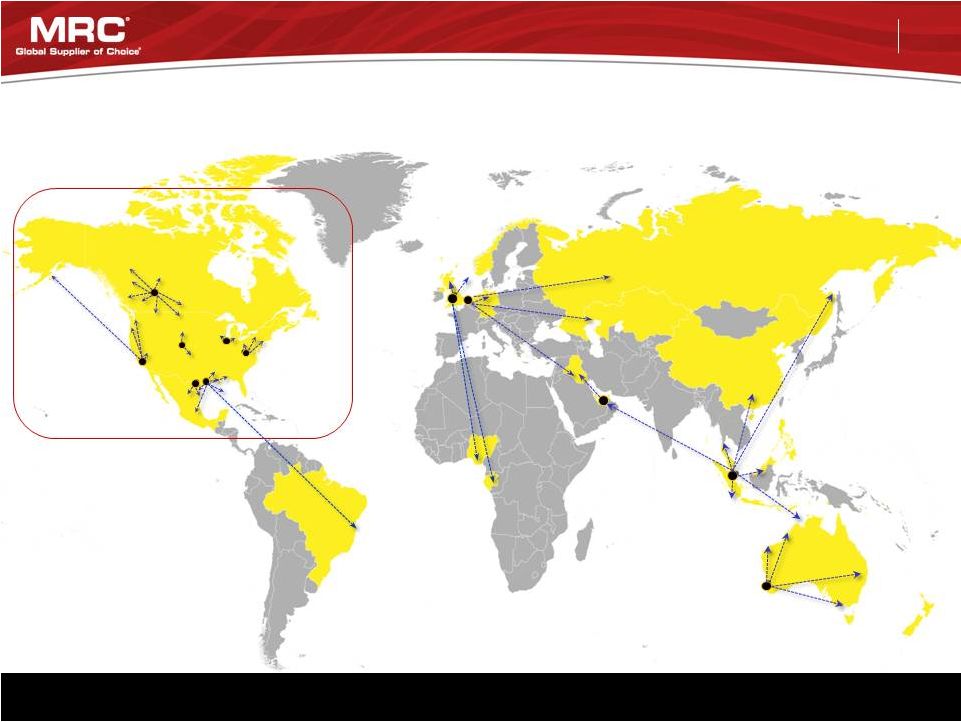
 Investor Presentation August 21, 2012 10 Global Procurement Today 10 – 15 Years Ago Next 1 to 5 Years Consolidating energy industry benefits global players. Changing PVF Energy Distribution Landscape Purchasing more consolidated Contracts by end segment: Contracts cover PVF Customers align with suppliers with size/scale Centralized Procurement Upstream Midstream Downstream Global upstream / midstream / downstream PVF contracts Pipe Valves Fittings Flanges Supplies Decentralized Procurement PVF purchasing handled locally Facility-by-facility basis Separate contracts by product class: |
 MRC & Shell // Global Valve Contract for MRO & Projects Industry’s first global valve and combined North American PFF contract. Deepwater GOM NA Tight Gas & Liquids Brazil Offshore BC-10 West Africa Future Middle East RDC FLNG / LNG Oceania Sakhalin Shell Offshore Shell has one of the top 5 global CAPEX budgets Coal Bed Methane Cracker Unit Pittsburgh, PA China Tight Gas Tar Sands Kashagan Ph1 Alaska Offshore LNG / GTL LNG Salym Development Investor Presentation August 21, 2012 11 North America Includes PFF |
 Investor Presentation August 21, 2012 12 Increasing MRC Shareholder Value Growth Efficiency / Profitability Organic Growth Increase Returns on Working Capital Investment Optimize Cost of Capital • North American shale activity • Midstream infrastructure • Downstream – refining turnaround activity and resurgence in petrochemical activity • Australia – new PVF leadership position • Optimize inventory mix • Global sourcing • Focus on higher margin products • Target leverage at 2.0x – 3.0x • Reduce overall cost of debt Acquisitions • International geographic extensions • Valve & actuation • North American region / shale bolt-ons Revenue Growth: Target 10% to 12% per year Organic: 8% to 9% Acquisitions: 2% to 3% Adjusted EBITDA Margin Improvement in near term in mid term in 5 years 8.0 to 8.5% 9.0 to 9.5% 10+% |
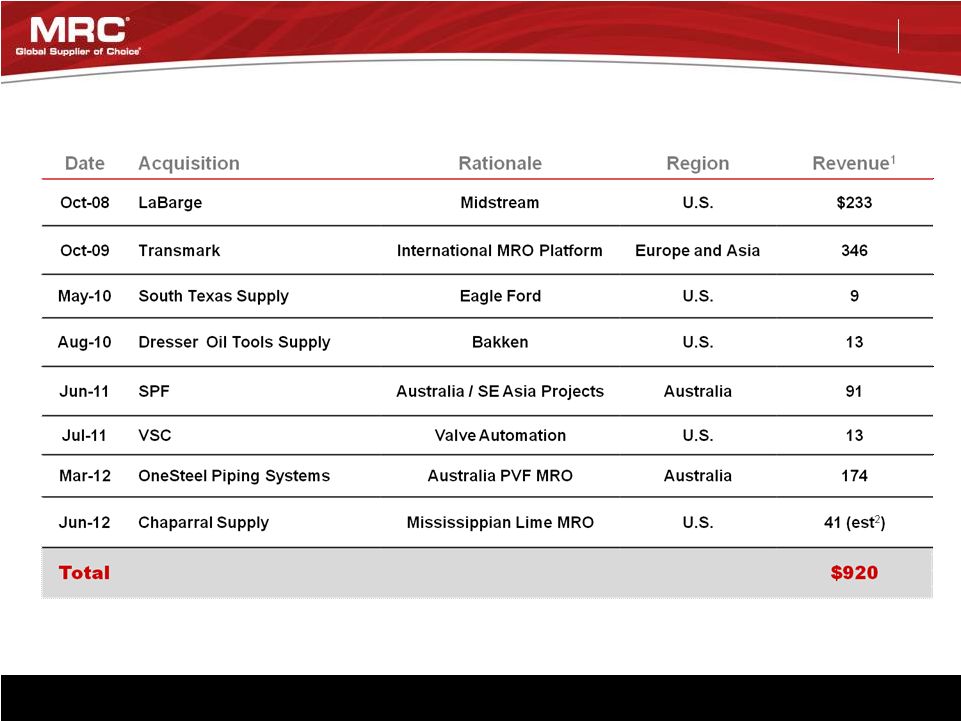 Investor Presentation August 21, 2012 13 MRC has completed and successfully acquired $920 million of revenues since mid 2008. 1 Reflects reported revenues for the year of acquisition 2 Estimate based on supply agreement with SandRidge Energy (US$ in millions) Track Record of Successful M&A |
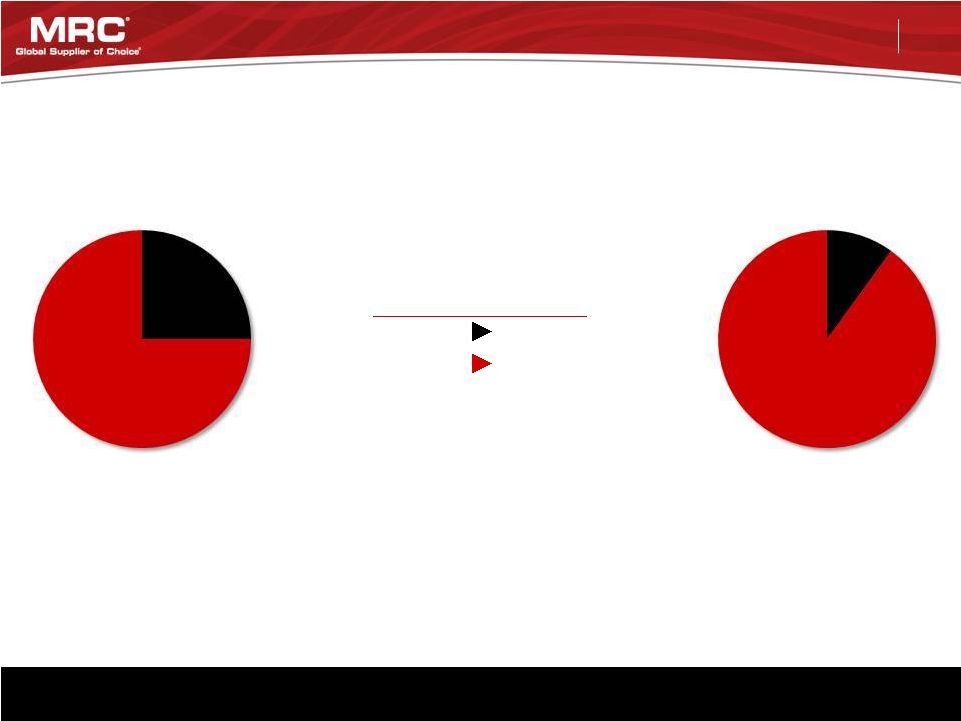 Investor Presentation August 21, 2012 14 Historic Margins OCTG 5-7% All Other 17-19% Multi-Year Strategy to Shift Away from OCTG Towards Higher Margin, Less Volatile Products Key Components to Strategy Remain committed to one-stop PVF focused customers Focus on energy infrastructure E&P spend Increase earnings stability Improve overall margins Reduce inventory risk Reduce volatility and exposure to North America rig count Shift to Higher Margin Products Short term loss of revenue offset by long term benefits 2013 (Target) 2008 (Actual) All other 75% OCTG 25% OCTG 10% All other 90% |
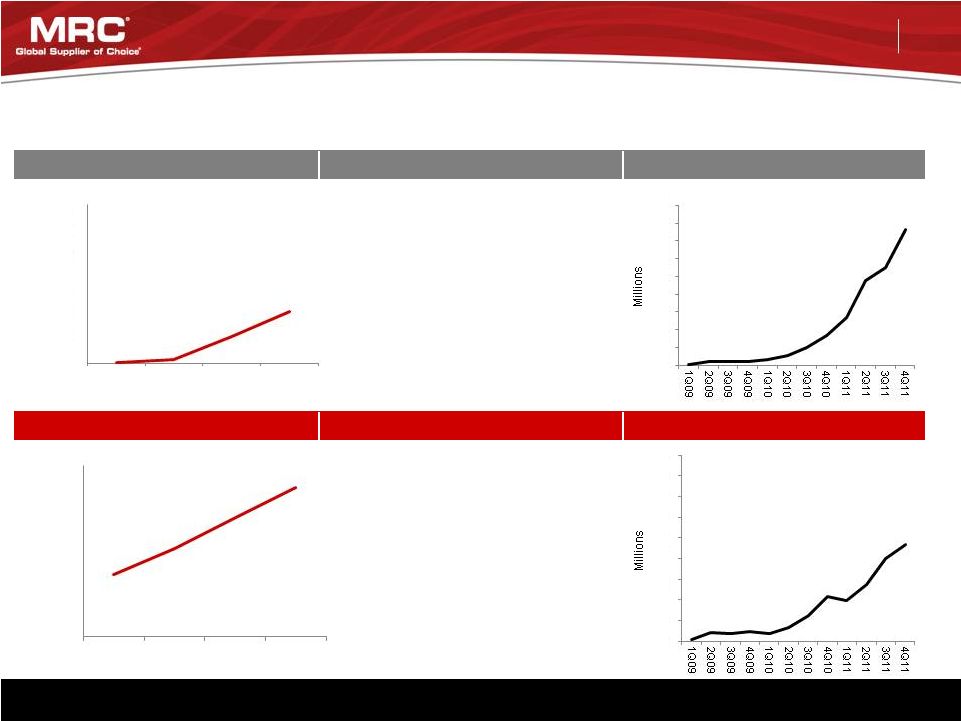 Investor Presentation August 21, 2012 15 Strategic investments in shale plays driving North America Growth. Strategic Investments to Capitalize on Shale Growth Eagle Ford Production MRC Investment in the Eagle Ford MRC Sales in the Eagle Ford May 2010 Acquisition – South Texas Supply March 2011 Opened Regional Distribution Center in San Antonio, TX Bakken Production MRC Investment in the Bakken MRC Sales in the Bakken August 2010 Acquisition – Dresser Oil Tools & Supply January 2012 Opened Regional Distribution Center in Cheyenne, WY - 100,000 200,000 300,000 400,000 500,000 600,000 2009 2010 2011 2012A $0 $10 $20 $30 $40 $50 $60 $70 $80 $90 - 100,000 200,000 300,000 400,000 500,000 600,000 2009 2010 2011 2012A Eagle Ford Rig: Stephens Eagle Ford Sales: MRC data Eagle Ford Production: www.rrc.state.tx.us; 2012 Annualized $0 $10 $20 $30 $40 $50 $60 $70 $80 $90 Bakken Rig: Stephens Bakken Sales: MRC data Bakken Production: MidstreamBusiness.com, "Bakken's Rapid Ascent” 2012 Annualized |
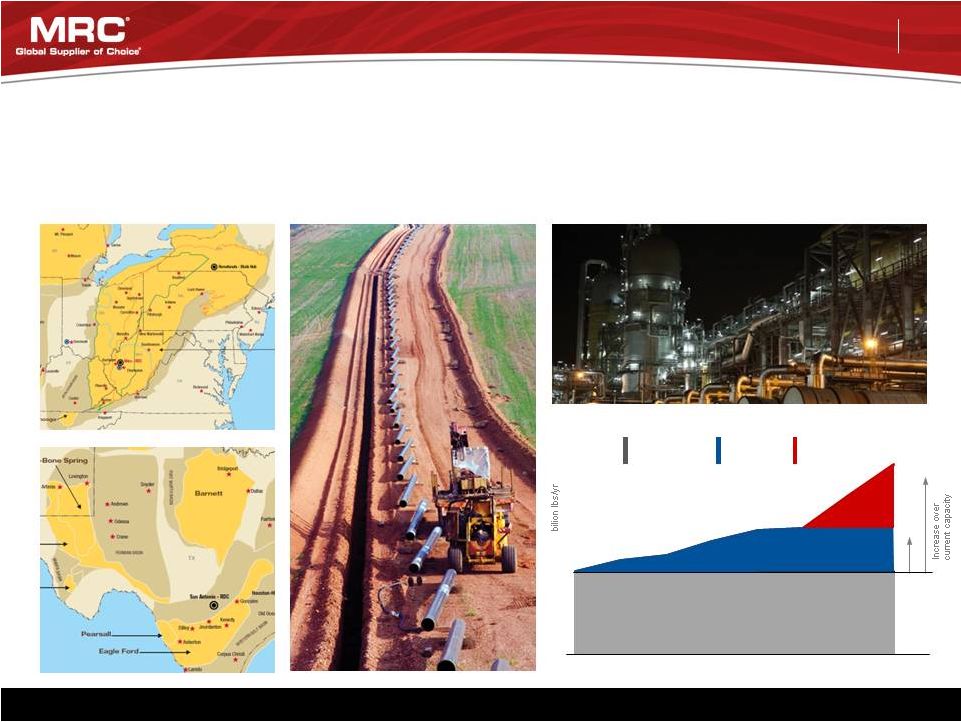 Investor Presentation August 21, 2012 16 Increased Access to and Supply of NGL’s Have Created Opportunities for MRC Over the Next 5 to 7 Years Upstream Production Midstream Infrastructure Growth Forecast MRC is well positioned to capitalize on this trend across the upstream, midstream, & downstream market segments. Downstream Processing Expansion & New Builds New Build Crackers billion lbs/yr 15% 38% Production Expansion billion lbs/yr Current Ethylene Production billion lbs/yr *Source: Tudor Pickering Holt & Co 80 60 40 72 79 57 59 60 63 65 66 2011 2012 2013 2014 2015 2016 2017 2018 |
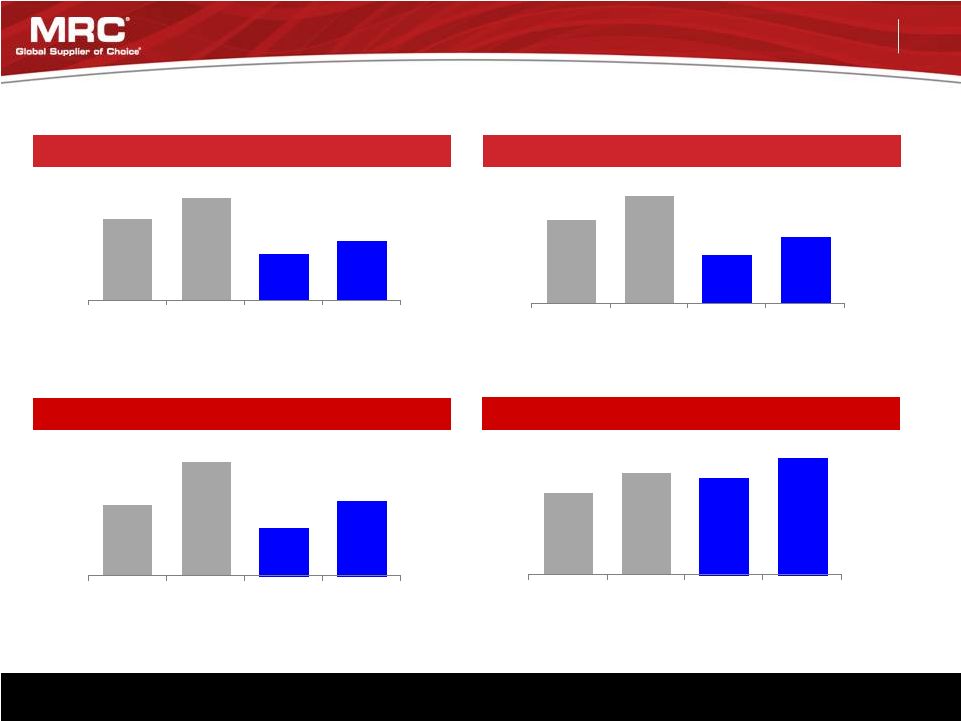 Investor Presentation August 21, 2012 17 $224 $361 $151 $239 2010 2011 1st Half 2011 1st Half 2012 Sales Adjusted Gross Profit and % Margin Source: Company management RONA calculation = Adjusted EBITDA divided by the sum of accounts receivable, inventory (plus the LIFO reserve), and PP&E less accounts payable. Adjusted EBITDA and % Margin Return on Net Assets (RONA) Strong growth and improving profitability. Y-o-Y Growth 26% 30% Y-o-Y Growth 28% 39% Y-o-Y Growth 61% 59% 17.2% 17.6% 17.6% 18.8% 5.8% 7.5% 7.0% 8.5% (US$ in millions) Financial Trends $3,846 $4,832 $2,160 $2,813 2010 2011 1st Half 2011 1st Half 2012 $663 $850 $381 $530 2010 2011 1st Half 2011 1st Half 2012 19.6% 24.1% 23.1% 27.8% 2010 2011 1st Half 2011 1st Half 2012 |
 Investor Presentation August 21, 2012 18 First Half Update Year Over Year Results In Millions, except per share data 1 Half 2012 1 Half 2011 Sales $ 2,813 $ 2,160 30% Cost of sales 2,335 1,840 Gross profit 478 320 SG&A 297 242 Operating income 181 78 Net income $ 69 $ 4 EPS $ 0.75 $ 0.04 Adjusted EBITDA $ 239 $ 151 59% Adjusted EBITDA% 8.5% 7.0% Full Year 2012 Outlook Sales $5.5 to $5.65 billion Adjusted EBITDA 8.2% to 8.6% of sales Adjusted Gross Profit 18.3% to 19.0% of sales Effective Tax Rate 35.0% to 36.0% Capital Expenditures $26 to $27 million Cash from Operations $125 - $150 million Capital Structure April 2012 IPO with net proceeds of $333 million Total Net Debt $1.315 billion Net Debt / Adjusted EBITDA 2.9X Net Debt / Adjusted EBITDA 2012 EOY Target 2.5X st st |