 Wells Fargo Securities May 9, 2013 1 MRC Global Inc. // Wells Fargo Securities 2013 Industrial and Construction Conference May 9, 2013 Jim Braun EVP & CFO Exhibit 99.1 * * * * * * * * * * * * * * |
 Wells Fargo Securities May 9, 2013 2 2 |
 Wells Fargo Securities May 9, 2013 3 By the Numbers Industry Sectors Product Categories Business Model 2012 Sales $5.57 B Upstream Line Pipe / OCTG Locations 400+ Countries 44+ Midstream Valves Customers 18,000+ Suppliers 18,000+ Downstream/ Industrial Fittings / Flanges SKU’s 175,000+ Employees 4,750+ Company Snapshot MRC is the largest global distributor of pipe, valves and fittings (PVF) to the energy industry |
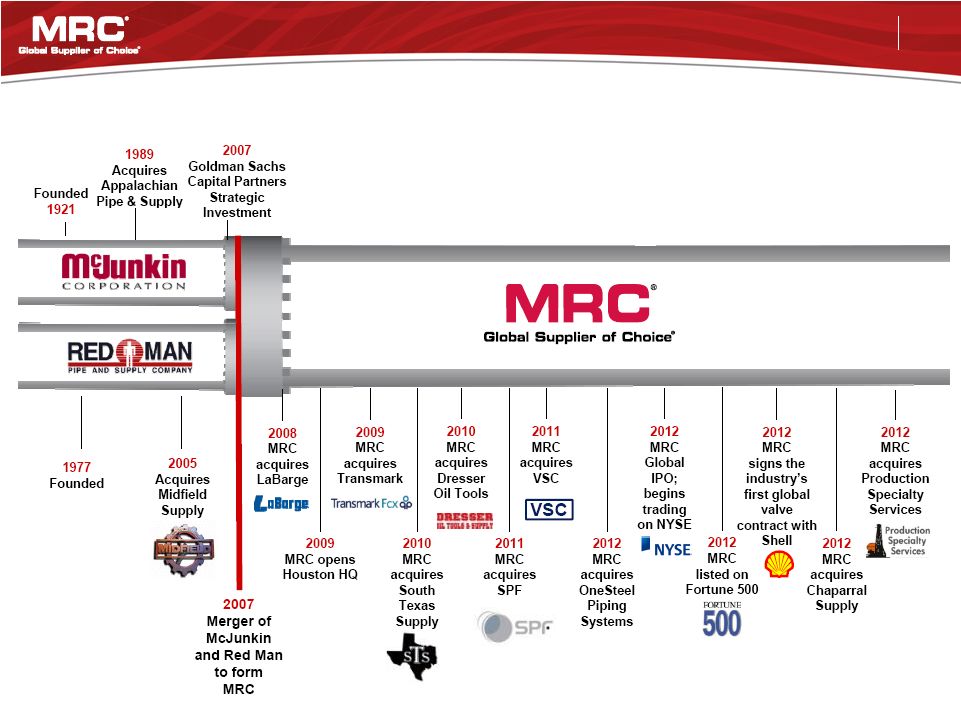 Wells Fargo Securities May 9, 2013 4 MRC’s 92 Year History // The Road to the Fortune 500 |
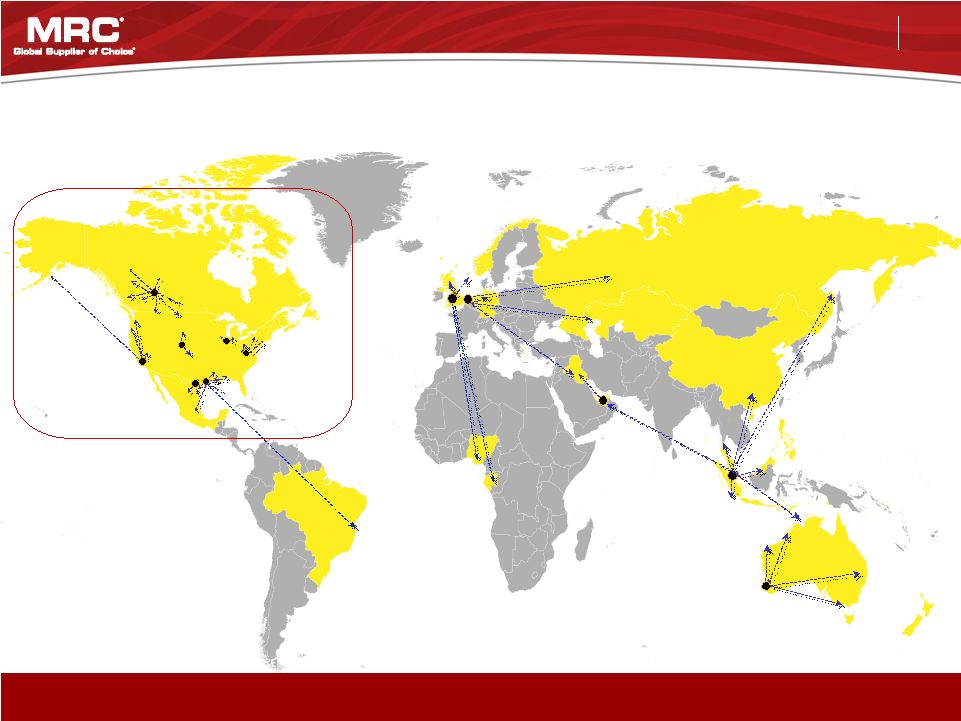
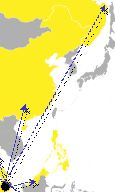
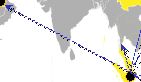
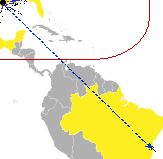
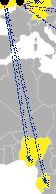
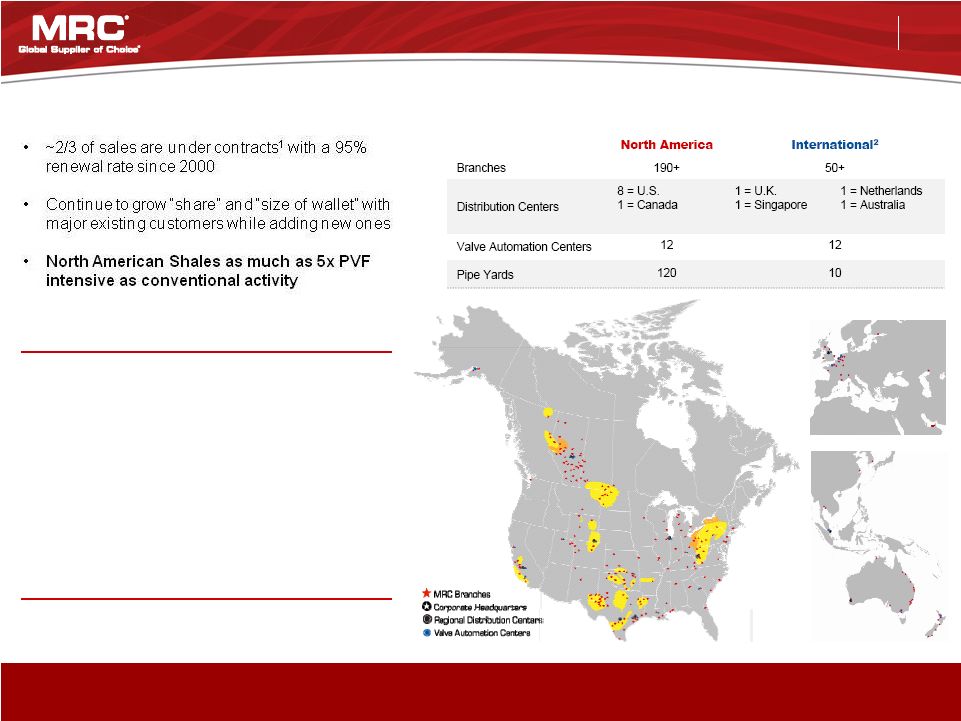 Wells Fargo Securities May 9, 2013 5 Clear Market Leader Globally and in the Shales Leading industrial distributor of PVF globally to the energy and industrials sectors Note: As of 31-Dec-2012 1 Including contracts and pricing arrangements. 2 International locations include sales offices and pipe yards at MRC locations. Ecuador Equatorial Guinea Finland France Germany India Indonesia Iraq Italy Kazakhstan Kuwait Malaysia Mexico Netherlands New Zealand Nigeria Norway Pakistan Peru Poland Russia Saudi Arabia 44+ Countries & 400+ Locations Angola Aruba Australia Austria Belgium Brunei Cameroon Canada China Colombia Denmark Branch operations and significant direct export sales Singapore South Africa South Korea Spain Sweden Thailand Trinidad Turkey United Arab Emirates United Kingdom United States |
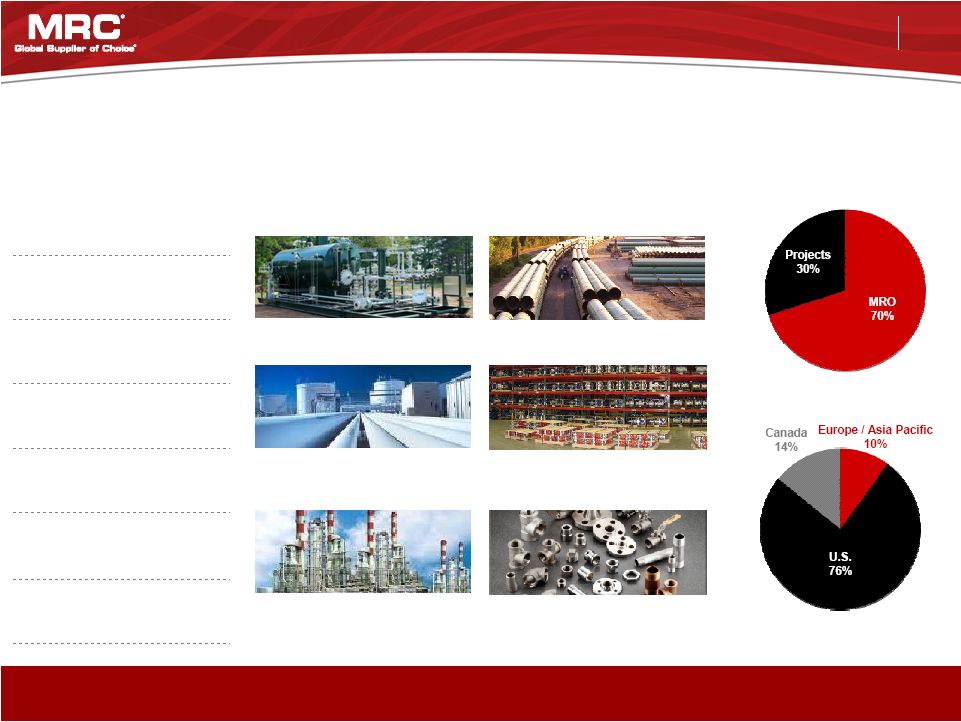
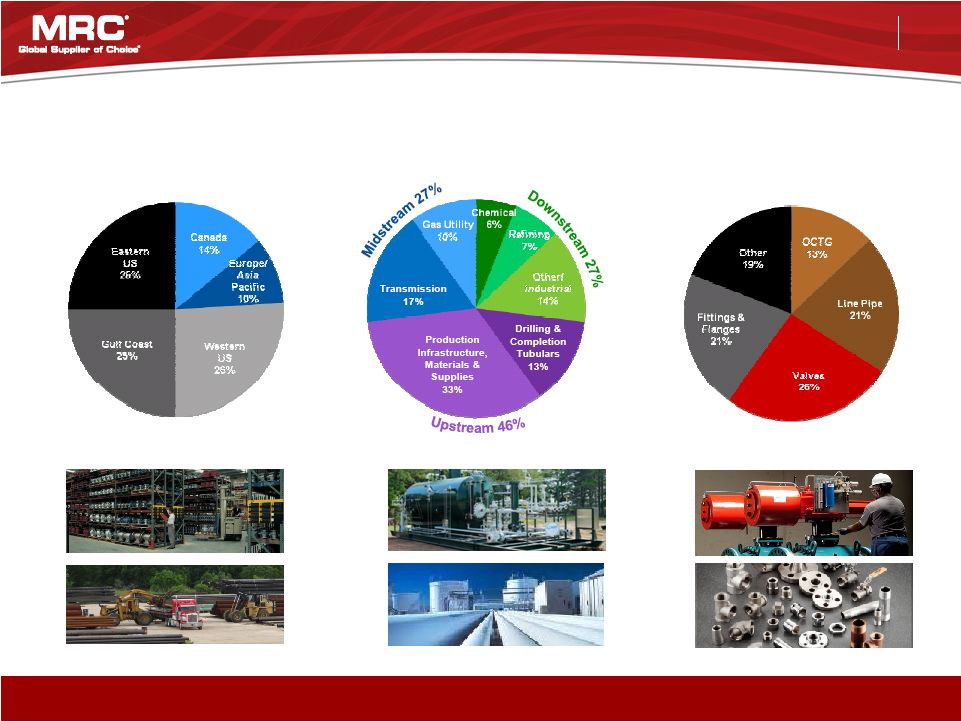 Wells Fargo Securities May 9, 2013 6 By Geography Note: Business mix based on fiscal year 2012. By Product Line By Industry Sector MRC Diversification 1 - Approximately 17% (or $200 M) of total for valves is valve automation Industry leading product, end market and geographic diversification |
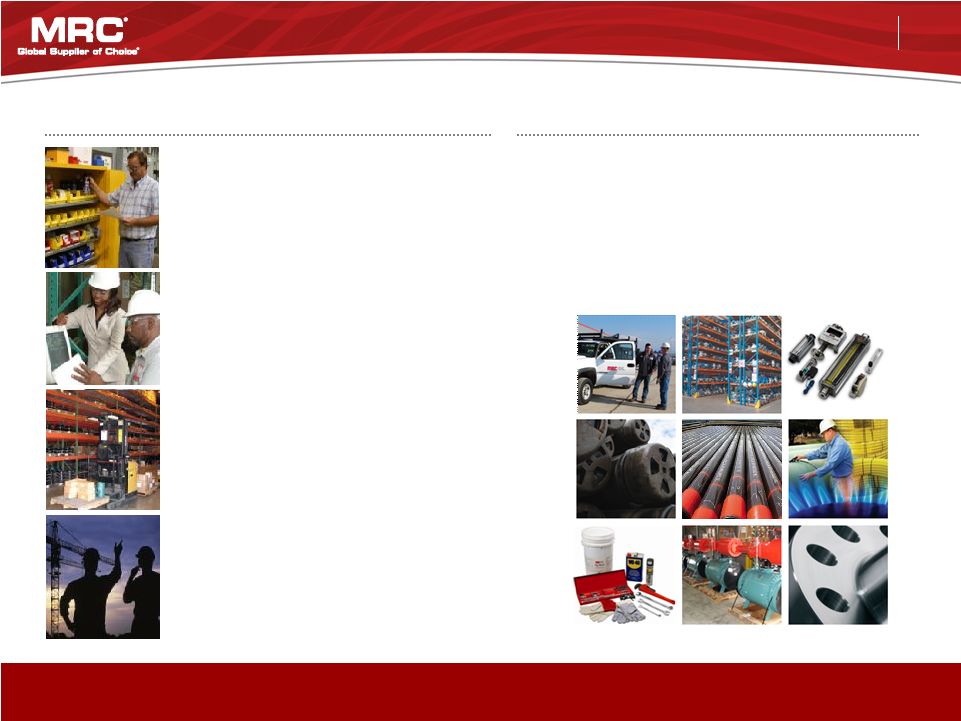 Wells Fargo Securities May 9, 2013 7 Core Distribution Processes • Cost Savings and Efficiencies • Order Management and Product Bundling • Quality Assurance • Supplier Registration • Logistics Management • Customer Reporting Integrated Services • Technical Assistance / Product Recommendation • Inventory Consignment / Just-in- Time Delivery • Customized IT Solutions • Warehouse Management Service Offerings Products Delivery of Mission Critical Products and Value Added Services Generating savings and efficiencies for our customers while enabling them to focus on their core competencies • 175,000+ unique, mission-critical products used in high pressure, high stress or abrasive operating environments • Low cost relative to overall cost of maintenance or project spend so service is paramount |
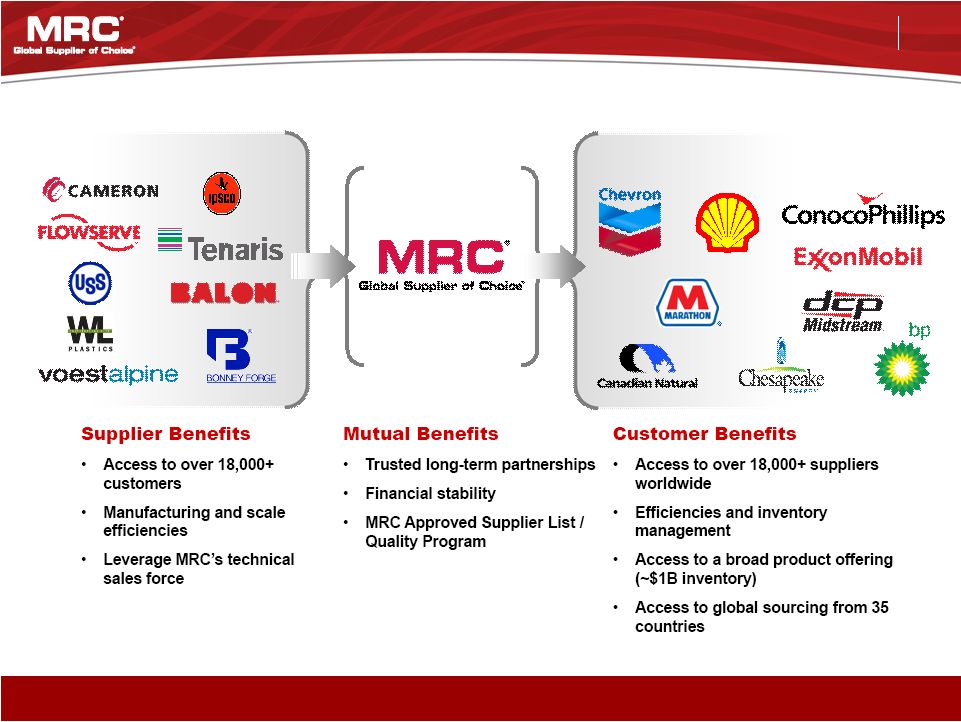 Wells Fargo Securities May 9, 2013 8 MRC plays a critical role in the complex, technical, global energy supply chain Strong Long-Term Relationships with “Blue Chip” Customers and Suppliers CUSTOMERS SUPPLIERS |
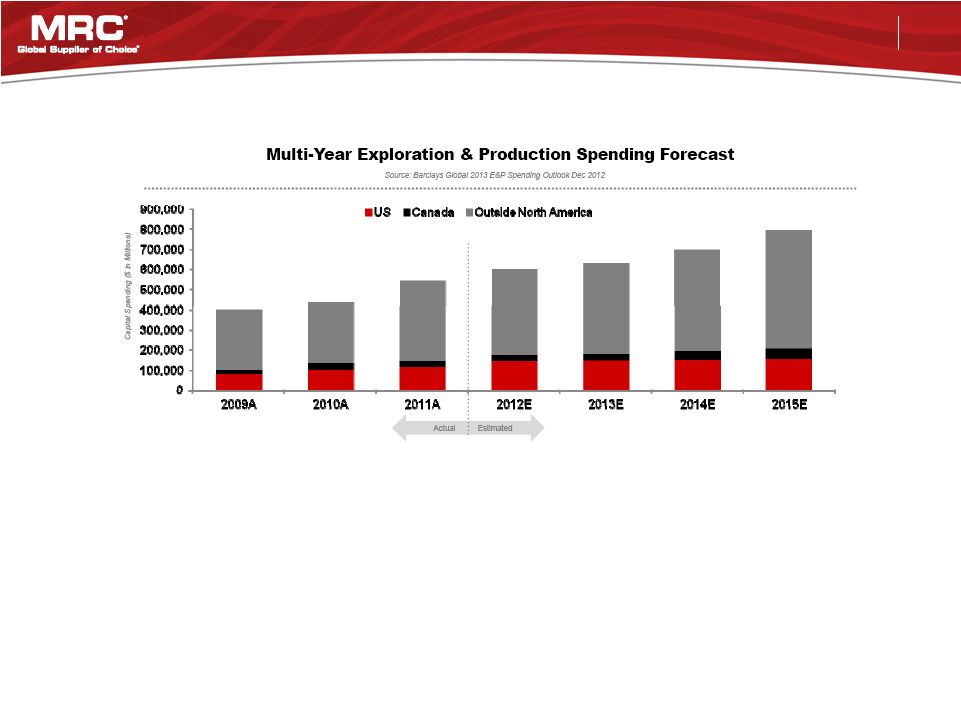 Wells Fargo Securities May 9, 2013 9 Positive Energy and Industrial Spending Trends • Global: Energy demand continues to grow with sizable MRO/project opportunities given the age of global energy infrastructure and slowly improving global economy • Upstream: Shales extremely active, shift to Oil/NGL E&P, Natural Gas MRO production, Oil Sands activity seeing strong growth • Midstream: Shale activity in new unsupported areas; increased pipeline integrity regulation plus aging pipeline infrastructure accelerating MRO rates; gas utilities continue to outsource PVF procurement • Downstream: MRO and infrastructure projects accelerating; strong growth in chemical/industrial with low natural gas prices and steady PMI; rebound in refinery utilization / margins |
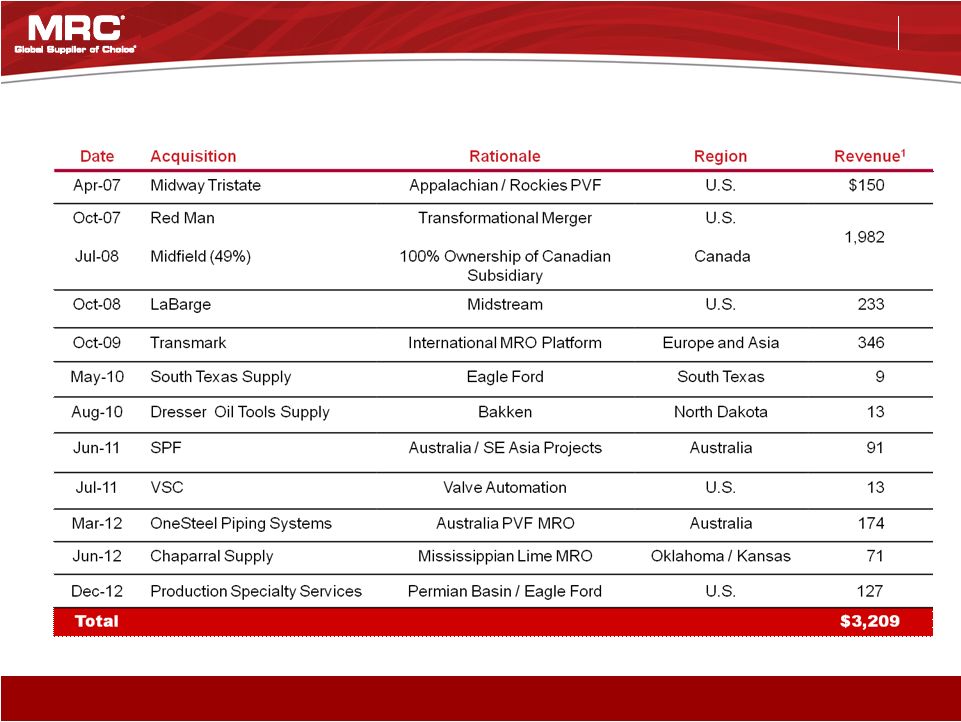 Wells Fargo Securities May 9, 2013 10 (US$ in millions) 1 Reflects reported revenues for the year of acquisition MRC has completed and successfully acquired $3 billion of revenues since 2007 M&A Driven Growth: Track Record of Success |
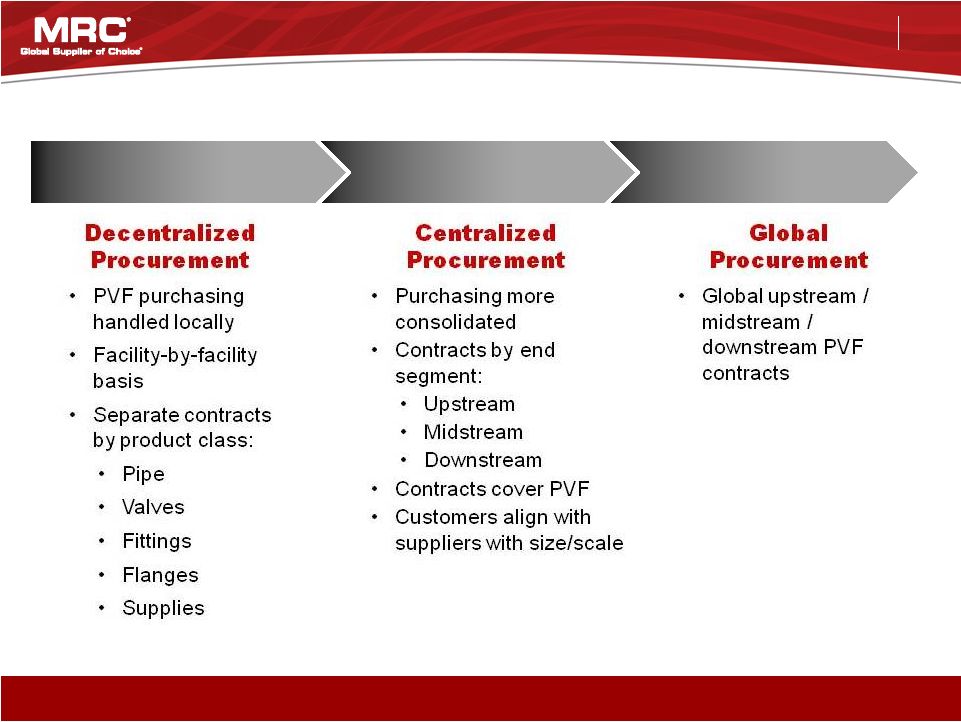 Wells Fargo Securities May 9, 2013 11 Today 10 – 15 Years Ago Next 1 to 5 Years Changing PVF Energy Distribution Landscape Consolidating energy industry benefits global players |
               Wells Fargo Securities May 9, 2013 12 MRC & Shell // Global Valve Contract for MRO and Projects Industry’s first valve and combined North American PFF contract Deepwater GOM NA Tight Gas & Liquids Brazil Offshore BC-10 West Africa Future Middle East RDC FLNG / LNG Oceania Sakhalin Shell Offshore Shell has one of the top 5 global CAPEX budgets Coal Bed Methane Cracker Unit Pittsburgh, PA China Tight Gas Tar Sands Kashagan Ph1 Alaska Offshore LNG / GTL North America Includes PFF LNG Salym Development |
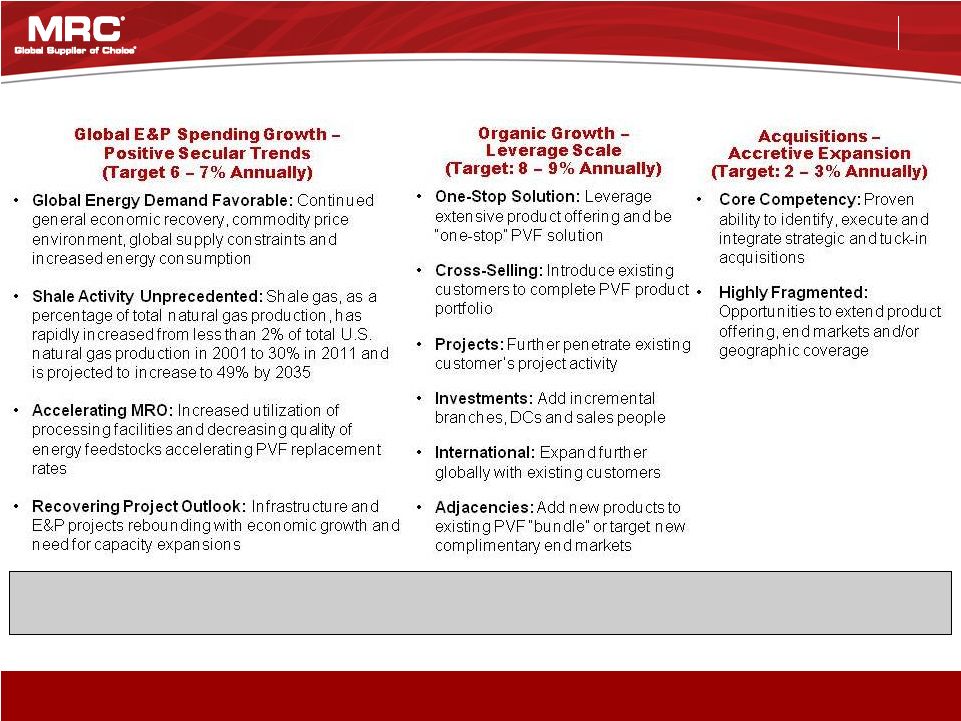 Wells Fargo Securities May 9, 2013 13 Large, Fragmented Market with Significant Growth Opportunities MRC is in an excellent position to continue to exceed industry growth Long-term Targets: Revenue Growth: 10-12% | Adjusted EBITDA Margin: 10+% | Leverage: 2.0 – 3.0x Note: All targets are long term. |
 Wells Fargo Securities May 9, 2013 14 Financial Overview |
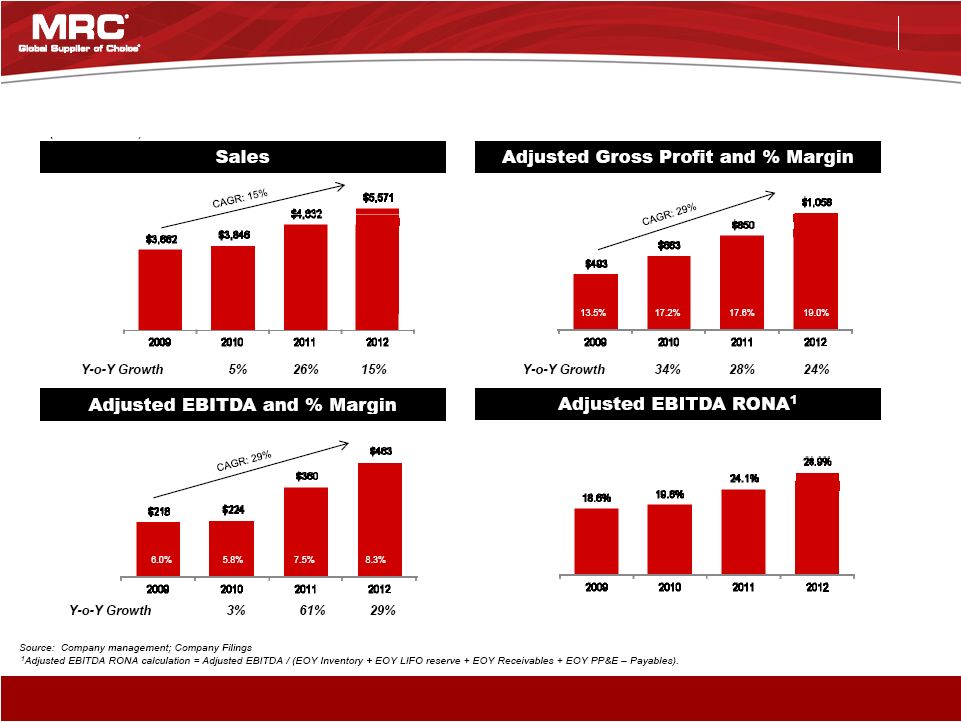 Wells Fargo Securities May 9, 2013 15 Strong Growth and Margin Drive Attractive Returns (US$ in millions) Strong growth and continued improving profitability |
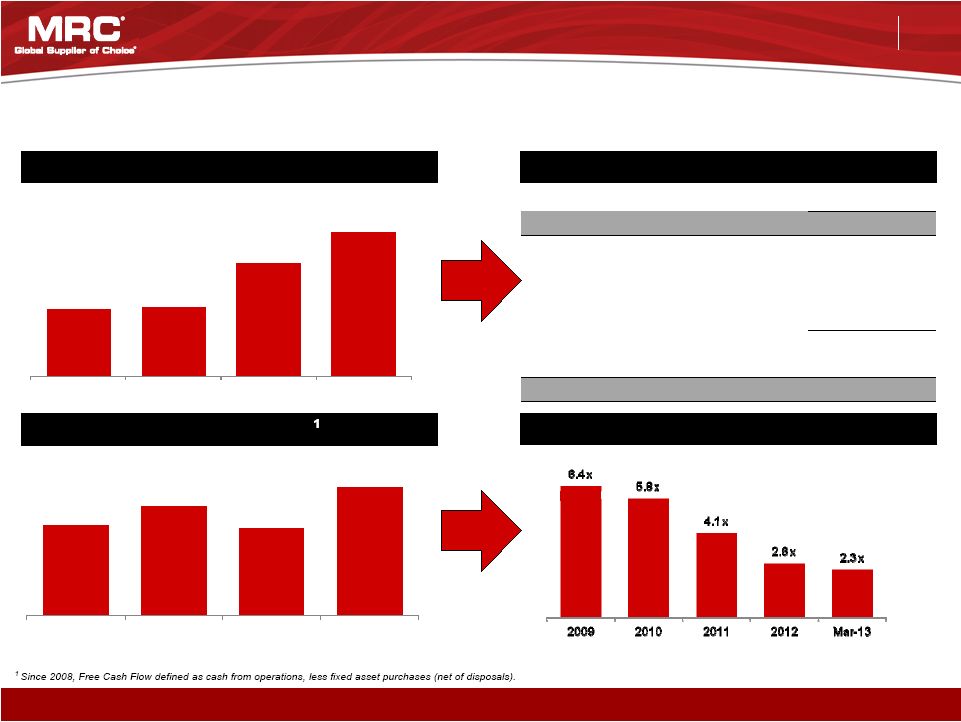 Wells Fargo Securities May 9, 2013 16 Significant Cash Flow for Deleveraging and Growth Investments Adjusted EBITDA – Capex and % Margin Capital Structure Cumulative FCF Net Leverage (US$ in millions) Strong cash flows allow for continued deleveraging ($ in millions) March 31, 2013 Cash and Cash Equivalents $ 27 Total Debt (including current portion): Term Loan B due 2019, net of discount 641 Global ABL Facility due 2017 426 Other 6 Total Debt $ 1,073 Total Equity 1,231 Total Capitalization $ 2,304 $495 $597 $479 $695 2009 2010 2011 2012 $202 $210 $342 $437 2009 2010 2011 2012 5.5% 5.5% 7.1% 7.8% |
 Wells Fargo Securities May 9, 2013 17 |
 Wells Fargo Securities May 9, 2013 18 Appendix |
 Wells Fargo Securities May 9, 2013 19 March 31 December 31 ($ in millions) 2013 2012 2012 2011 2010 2009 Net income (loss) $ 46.2 $ 37.5 $118.0 $ 29.0 $(51.8) $(339.8) Income taxes 25.0 21.1 63.7 26.8 (23.4) (15.0) Interest expense 15.3 33.7 112.5 136.8 139.6 116.5 Write off of debt issuance costs - 1.7 1.7 9.5 - - Depreciation and amortization 5.4 4.1 18.6 17.0 16.6 14.5 Amortization of intangibles 13.2 12.3 49.5 50.7 53.9 46.6 Amortization of purchase price accounting - - - - - 15.7 Change in fair value of derivative instruments (0.6) (2.1) (2.2) (7.0) 4.9 (8.9) Closed locations - - - - (0.7) 1.4 Share based compensation 1.9 1.8 8.5 8.4 3.7 7.8 Franchise taxes - - - 0.4 0.7 1.4 Loss (gain) on early extinguishment of debt - - 114.0 - - (1.3) Goodwill and intangibles impairment - - - - - 386.1 Inventory write-down - - - - 0.4 46.5 IT system conversion costs - - - - - 2.4 M&A transaction & integration expenses - - - 0.5 1.4 17.5 Pension settlement - - 4.4 - - - Legal and consulting expenses - - (1.2) 9.9 4.2 1.9 Joint venture termination - - - 1.7 - - Provision for uncollectible accounts - - - 0.4 (2.0) 1.0 Severance and related costs - - - 1.1 3.2 4.4 MRC Transmark pre-Acquisition contribution - - - - - 38.5 LIFO (3.1) 6.9 (24.1) 73.7 74.6 (115.6) Other expenses 0.6 (1.8) (0.2) 1.6 (1.1) (3.1) Adjusted EBITDA $ 103.9 $ 115.2 $ 463.2 $ 360.5 $ 224.2 $ 218.5 |
 Wells Fargo Securities May 9, 2013 20 December 31 ($ in millions) EBITDA $ 463.2 $ 360.5 $ 224.2 $ 218.5 AR $ 823.2 $ 791.3 $ 596.4 $ 506.2 Inventory at AC 1,121.2 1,074.2 866.8 898.5 Fixed Assets 122.5 107.4 104.7 111.5 (-) AP (438.4) (479.6) (426.6) (338.5) PSS Adjustment (28.0) — — — Total Adjusted Net Assets $ 1,600.5 $ 1,493.3 $ 1,141.3 $ 1,177.7 Inventory at LIFO 970.2 899.1 765.4 871.6 (+) LIFO reserve 151.0 175.1 101.4 26.9 Total Inventory $ 1,121.2 $ 1,074.2 $ 866.8 $ 898.5 RONA 28.9 % 24.1 % 19.6 % 18.6 % 2011 2010 2009 2012 December 31 ($ in millions) Stockholders' Equity $ 1,185.9 $ 720.8 $ 689.8 $ 743.9 Long term debt 1,256.6 1,526.7 1,360.2 1,452.6 Deferred taxes 334.5 357.2 373.7 377.9 Other liabilities 147.7 143.3 140.8 170.2 Intangible assets (1,359.7) (1,333.1) (1,366.5) (1,425.7) LIFO reserve 151.0 175.1 101.4 26.9 Other assets (50.4) (50.6) (101.9) (111.9) Cash (37.1) (46.1) (56.2) (56.2) PSS Adjustment (28.0) — — — Total Adjusted Net Assets $ 1,600.5 $ 1,493.3 $ 1,141.3 $ 1,177.7 Net income (loss) $ 118.0 $ 29.0 $(51.8) $(339.8) Stockholders' equity 1,185.9 720.8 689.8 743.9 Net income / stockholders'equity 10.0 % 4.0 % (7.5)% (45.7)% 2012 2011 2010 2009 |
 Wells Fargo Securities May 9, 2013 21 March 31 December 31 ($ in millions) 2013 2012 2012 2011 2010 2009 Gross Profit $ 246.6 $ 236.6 $ 1,013.7 $ 708.2 $ 518.1 $ 548.0 Depreciation and amortization 5.4 4.1 18.6 17.0 16.6 14.5 Amortization of intangibles 13.2 12.3 49.5 50.7 53.9 46.6 (Decrease) increase in LIFO reserve (3.1) 6.9 (24.1) 73.7 74.6 (115.6) Adjusted Gross Profit $ 262.1 $ 259.9 $ 1,057.7 $ 849.6 $ 663.2 $ 493.5 December 31 ($ in millions) 2012 2011 2010 2009 Cash from operations $ 240.1 $(102.9) $ 112.7 $ 505.5 Fixed asset purchases (26.2) (18.1) (14.3) (16.7) Disposal of fixed assets 2.3 3.1 3.1 6.5 Free cash flow $216.2 $(117.9) $ 101.5 $ 495.3 Cummulative free cash flow $ 695.1 $ 478.9 $ 596.8 $ 495.3 |