
MRC Global 2Q 2019 Earnings Presentation August 1, 2019 We Make Energy Flow 1
2Q 2019 Earnings Presentation MRC Global 2 Forward Looking Statements and Non-GAAP Disclaimer This presentation contains forward-looking statements within the meaning of Section 27A of the Securities Act and Section 21E of the Exchange Act. Words such as “will,” “expect,” “expected,” “looking forward,” “guidance,” “on-track”, “Results in mid-cycle Adjusted EBITDA” and similar expressions are intended to identify forward-looking statements. Statements about the company’s business, including its strategy, its industry, the company’s future profitability, the company’s guidance on its sales, Adjusted EBITDA, gross profit, gross profit percentage, Adjusted Gross Profit, Adjusted Gross Profit percentage, tax rate, capital expenditures and cash from operations, growth in the company’s various markets and the company’s expectations, beliefs, plans, strategies, objectives, prospects and assumptions are not guarantees of future performance. These statements are based on management’s expectations that involve a number of business risks and uncertainties, any of which could cause actual results to differ materially from those expressed in or implied by the forward-looking statements. These statements involve known and unknown risks, uncertainties and other factors, most of which are difficult to predict and many of which are beyond our control, including the factors described in the company’s SEC filings that may cause our actual results and performance to be materially different from any future results or performance expressed or implied by these forward-looking statements. For a discussion of key risk factors, please see the risk factors disclosed in the company’s SEC filings, which are available on the SEC’s website at www.sec.gov and on the company’s website, www.mrcglobal.com. Our filings and other important information are also available on the Investor Relations page of our website at www.mrcglobal.com. Undue reliance should not be placed on the company’s forward-looking statements. Although forward-looking statements reflect the company’s good faith beliefs, reliance should not be placed on forward-looking statements because they involve known and unknown risks, uncertainties and other factors, which may cause the company’s actual results, performance or achievements or future events to differ materially from anticipated future results, performance or achievements or future events expressed or implied by such forward-looking statements. The company undertakes no obligation to publicly update or revise any forward-looking statement, whether as a result of new information, future events, changed circumstances or otherwise, except to the extent required by law. Statement Regarding Use of Non-GAAP Measures: The Non-GAAP financial measures contained in this presentation (Adjusted EBITDA and Adjusted Gross Profit) are not measures of financial performance calculated in accordance with U.S. Generally Accepted Accounting Principles (GAAP) and should not be considered as alternatives to net income or gross profit. They should be viewed in addition to, and not as a substitute for, analysis of our results reported in accordance with GAAP. Management believes that these non-GAAP financial measures provide investors a view to measures similar to those used in evaluating our compliance with certain financial covenants under our credit facilities and provide meaningful comparisons between current and prior year period results. They are also used as a metric to determine certain components of performance-based compensation. They are not necessarily indicative of future results of operations that may be obtained by the Company. 2
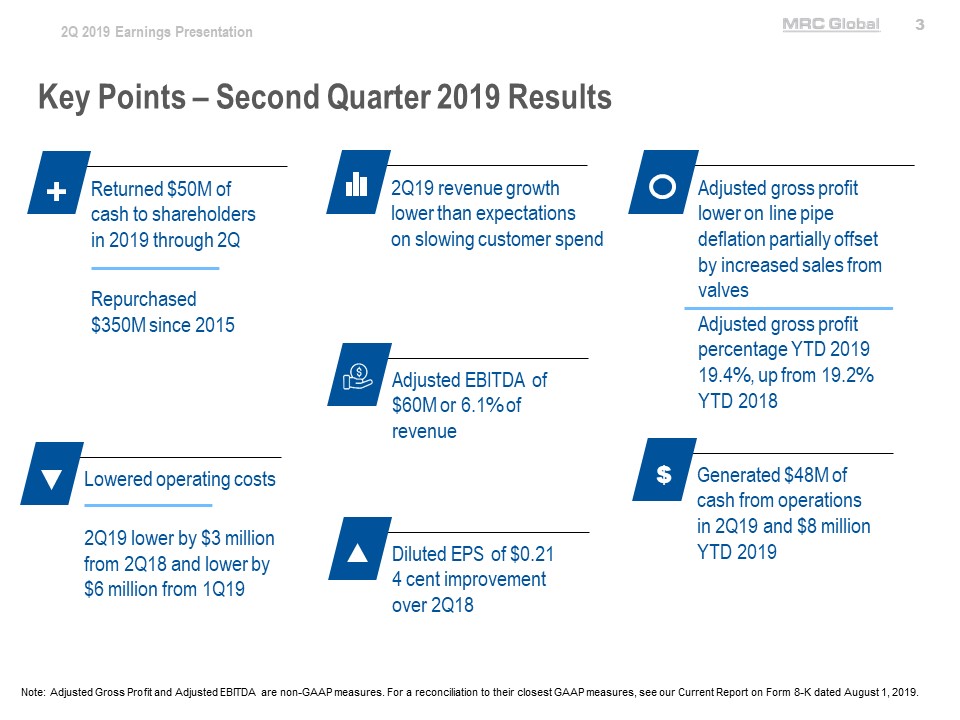
2Q 2019 Earnings Presentation MRC Global 3 Key Points – Second Quarter 2019 Results Returned $50M of cash to shareholders in 2019 through 2Q Repurchased $350M since 2015 2Q19 revenue growth lower than expectations on slowing customer spend Adjusted gross profit lower on line pipe deflation partially offset by increased sales from valves Adjusted gross profit percentage YTD 2019 19.4%, up from 19.2% YTD 2018 Adjusted EBITDA of $60M or 6.1% of revenue Lowered operating costs 2Q19 lower by $3 million from 2Q18 and lower by $6 million from 1Q19 Diluted EPS of $0.21 4 cent improvement over 2Q18 Generated $48M of cash from operations in 2Q19 and $8 million YTD 2019 Note: Adjusted Gross Profit and Adjusted EBITDA are non-GAAP measures. For a reconciliation to their closest GAAP measures, see our Current Report on Form 8-K dated August 1, 2019. 3
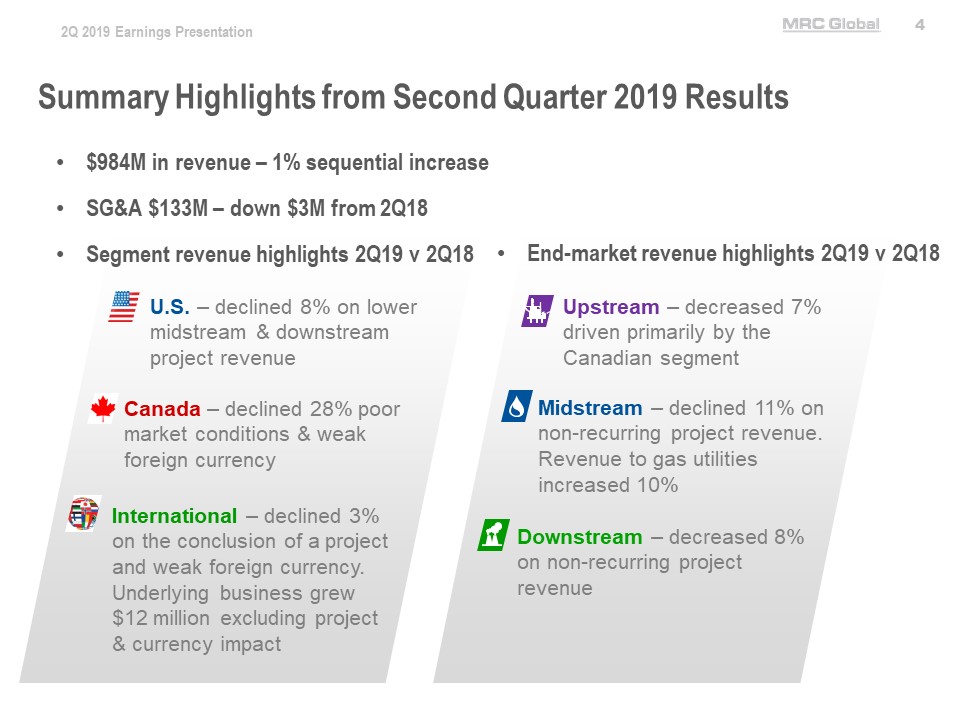
2Q 2019 Earnings Presentation MRC Global 4 Summary Highlights from Second Quarter 2019 Results $984M in revenue – 1% sequential increase SG&A $133M – down $3M from 2Q18 Segment revenue highlights 2Q19 v 2Q18 End-market revenue highlights 2Q19 v 2Q18 U.S. – declined 8% on lower midstream & downstream project revenue Canada – declined 28% poor market conditions & weak foreign currency International – declined 3% on the conclusion of a project and weak foreign currency. Underlying business grew $12 million excluding project & currency impact Upstream – decreased 7% driven primarily by the Canadian segment Midstream – declined 11% on non-recurring project revenue. Revenue to gas utilities increased 10% Downstream – decreased 8% on non-recurring project revenue 4
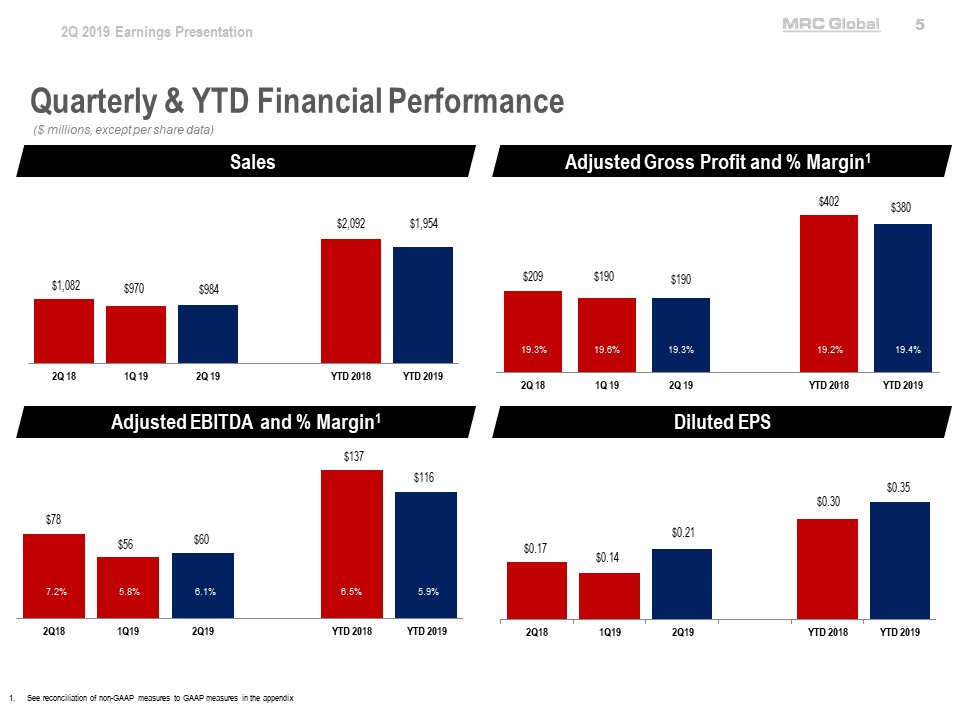
2Q 2019 Earnings Presentation MRC Global 5 Quarterly & YTD Financial Performance ($ millions, except per share data) Sales 2Q18 $1,082 1Q19 $970 2Q19 $984 YTD 2018 $2,092 YTD 2019 $1,954 Adjusted Gross Profit and % Margin1 2Q18 $209 19.3% 1Q19 $190 19.6% 2Q19 $190 19.3% YTD 2018 $402 19.2% YTD 2019 $380 19.4% Adjusted EBITDA and % Margin1 2Q18 $78 7.2% 1Q19 $56 5.8% 2Q19 $60 6.1% YTD 2018 $137 6.5% YTD 2019 $116 5.9% Diluted EPS 2Q18 $0.17 1Q19 $0.14 2Q19 $0.21 YTD 2018 $0.30 YTD 2019 $0.35 1. See reconciliation of non-GAAP measures to GAAP measures in the appendix 5
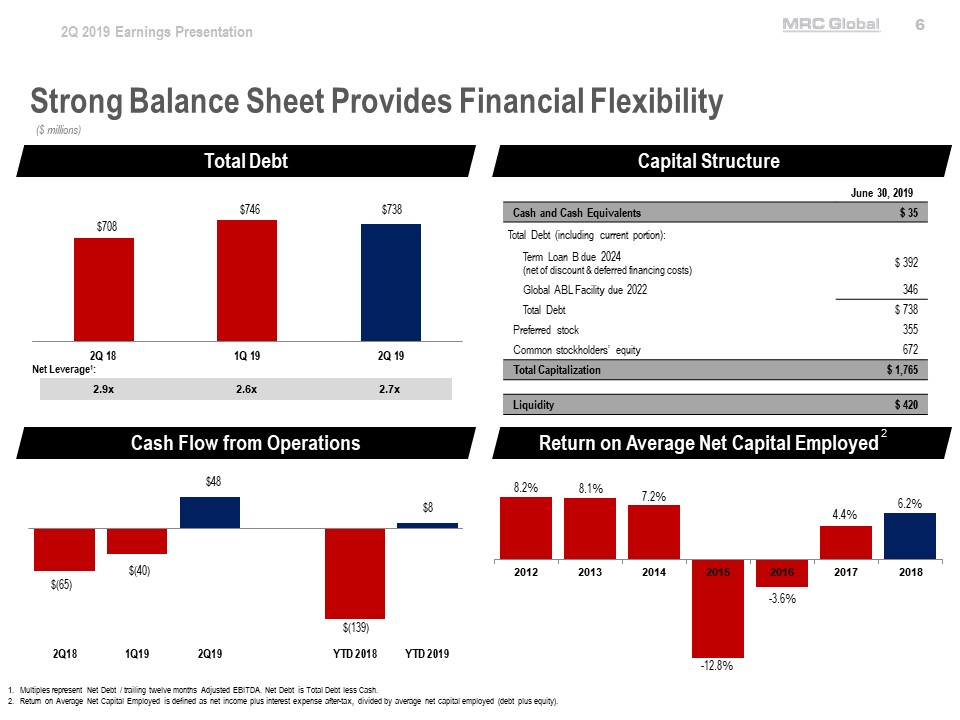
2Q 2019 Earnings Presentation MRC Global 6 Strong Balance Sheet Provides Financial Flexibility ($ millions) Total Debt Net Leverage1: 2.9x 2.6x 2.7x 2Q18 $708 1Q19 $746 2Q19 $738 Capital Structure June 30, 2019 Cash and Cash Equivalents $35 Total Debt (including current portion): Term Loan B due 2024 (net of discount & deferred financing costs) $392 Global ABL Facility due 2022 346 Total Debt $738 Preferred stock 355 Common stockholders’ equity 672 Total Capitalization $1,765 Liquidity $420 Cash Flow from Operations 2Q18 $(65) 1Q19 $(40) 2Q19 $48 YTD 2018 $(139) YTD 2019 $8 Return on Average Net Capital Employed2 2012 8.2% 2013 8.1% 2014 7.2% 2015 -12.8% 2016 -3.6% 2017 4.4% 2018 6.2% 1. Multiples represent Net Debt / trailing twelve months Adjusted EBITDA. Net Debt is Total Debt less Cash. 2. Return on Average Net Capital Employed is defined as net income plus interest expense after-tax, divided by average net capital employed (debt plus equity). 6
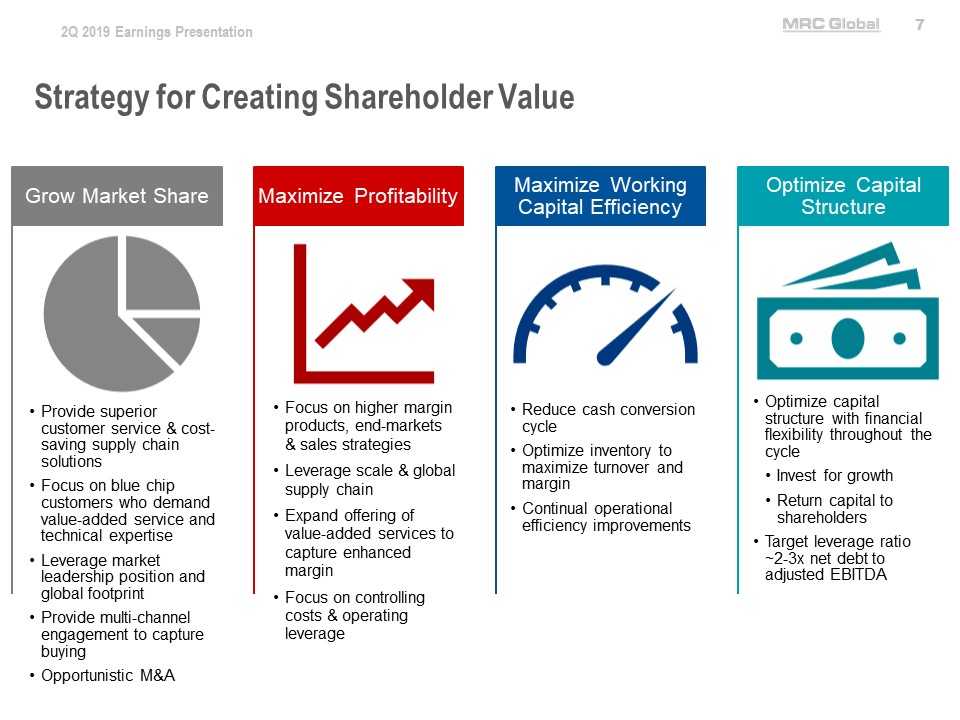
2Q 2019 Earnings Presentation MRC Global 7 Strategy for Creating Shareholder Value Grow Market Share Provide superior customer service & cost-saving supply chain solutions Focus on blue chip customers who demand value-added service and technical expertise Leverage market leadership position and global footprint Provide multi-channel engagement to capture buying Opportunistic M&A Maximize Profitability Focus on higher margin products, end-markets & sales strategies Leverage scale & global supply chain Expand offering of value-added services to capture enhanced margin Focus on controlling costs & operating leverage Maximize Working Capital Efficiency Reduce cash conversion cycle Optimize inventory to maximize turnover and margin Continual operational efficiency improvements Optimize Capital Structure Optimize capital structure with financial flexibility throughout the cycle Invest for growth Return capital to shareholders Target leverage ratio ~2-3x net debt to adjusted EBITDA 7
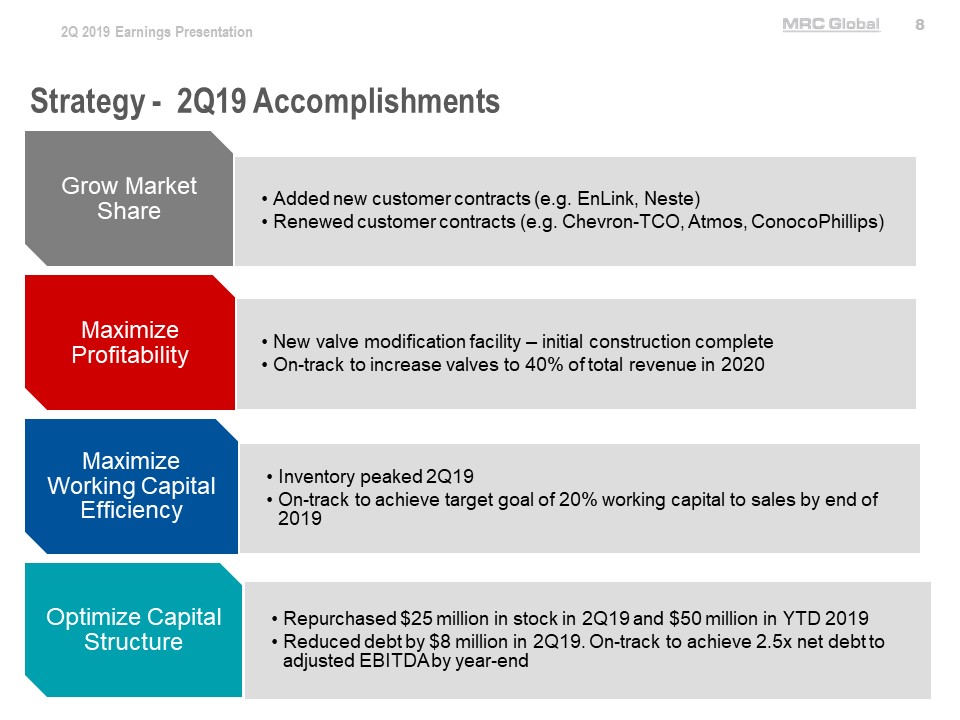
2Q 2019 Earnings Presentation MRC Global 8 Strategy - 2Q19 Accomplishments Grow Market Share Added new customer contracts (e.g. EnLink, Neste) Renewed customer contracts (e.g. Chevron-TCO, Atmos, ConocoPhillips) Maximize Profitability New valve modification facility – initial construction complete On-track to increase valves to 40% of total revenue in 2020 Maximize Working Capital Efficiency Inventory peaked 2Q19 On-track to achieve target goal of 20% working capital to sales by end of 2019 Optimize Capital Structure Repurchased $25 million in stock in 2Q19 and $50 million in YTD 2019 Reduced debt by $8 million in 2Q19. On-track to achieve 2.5x net debt to adjusted EBITDA by year-end 8
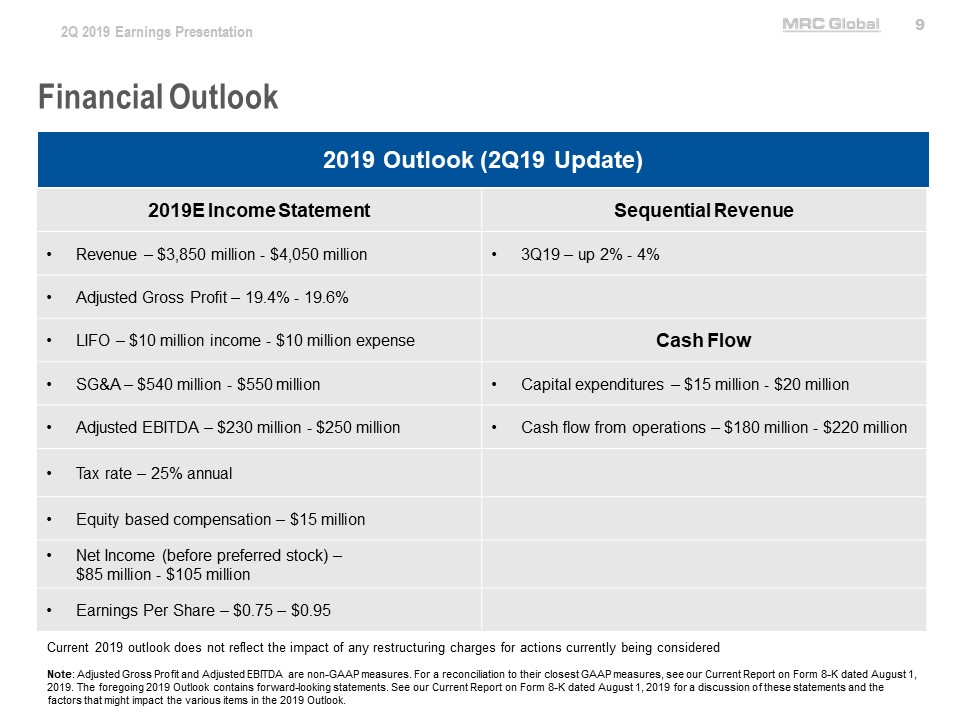
2Q 2019 Earnings Presentation MRC Global 9 Financial Outlook 2019 Outlook (2Q19 Update) 2019E Income Statement Revenue – $3,850 million - $4,050 million Adjusted Gross Profit – 19.4% - 19.6% LIFO – $10 million income - $10 million expense SG&A – $540 million - $550 million Adjusted EBITDA – $230 million - $250 million Tax rate – 25% annual Equity based compensation – $15 million Net Income (before preferred stock) – $85 million - $105 million Earnings Per Share – $0.75 – $0.95 Sequential Revenue 3Q19 – up 2% - 4% Cash Flow Capital expenditures – $15 million - $20 million Cash flow from operations – $180 million - $220 million Current 2019 outlook does not reflect the impact of any restructuring charges for actions currently being considered Note: Adjusted Gross Profit and Adjusted EBITDA are non-GAAP measures. For a reconciliation to their closest GAAP measures, see our Current Report on Form 8-K dated August 1, 2019. The foregoing 2019 Outlook contains forward-looking statements. See our Current Report on Form 8-K dated August 1, 2019 for a discussion of these statements and the factors that might impact the various items in the 2019 Outlook. 9
a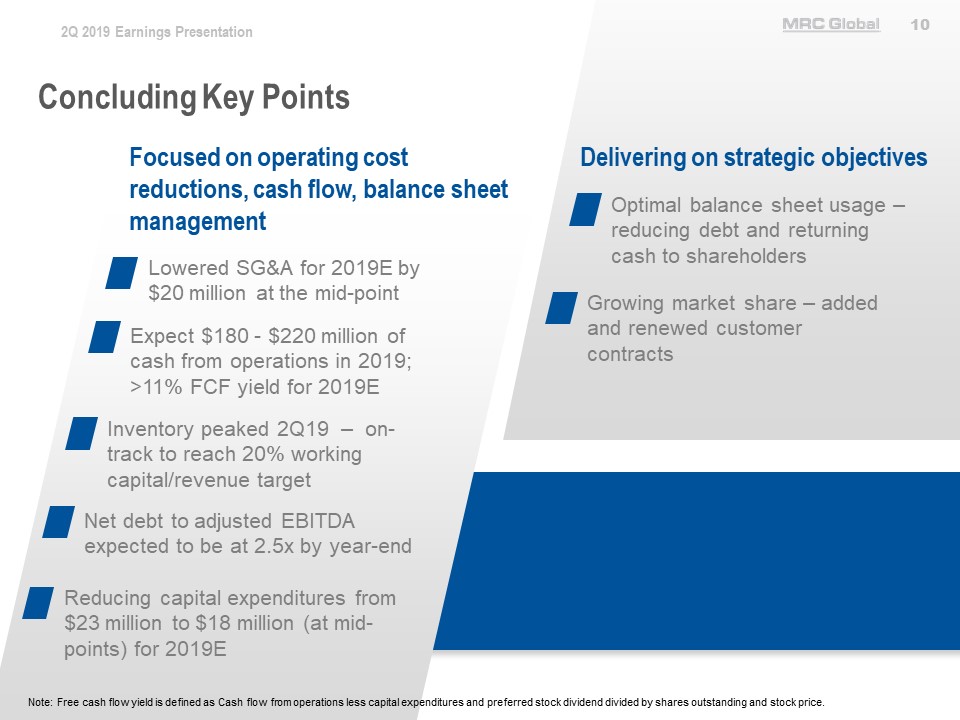
2Q 2019 Earnings Presentation MRC Global 10 Concluding Key Points Focused on operating cost reductions, cash flow, balance sheet management Lowered SG&A for 2019E by $20 million at the mid-point Expect $180 - $220 million of cash from operations in 2019; >11% FCF yield for 2019E Inventory peaked 2Q19 – on-track to reach 20% working capital/revenue target Net debt to adjusted EBITDA expected to be at 2.5x by year-end Reducing capital expenditures from $23 million to $18 million (at mid-points) for 2019E Delivering on strategic objectives Optimal balance sheet usage – reducing debt and returning cash to shareholders Growing market share – added and renewed customer contracts Note: Free cash flow yield is defined as Cash flow from operations less capital expenditures and preferred stock dividend divided by shares outstanding and stock price. 10

2Q 2019 Earnings Presentation MRC Global 11 Appendix 11
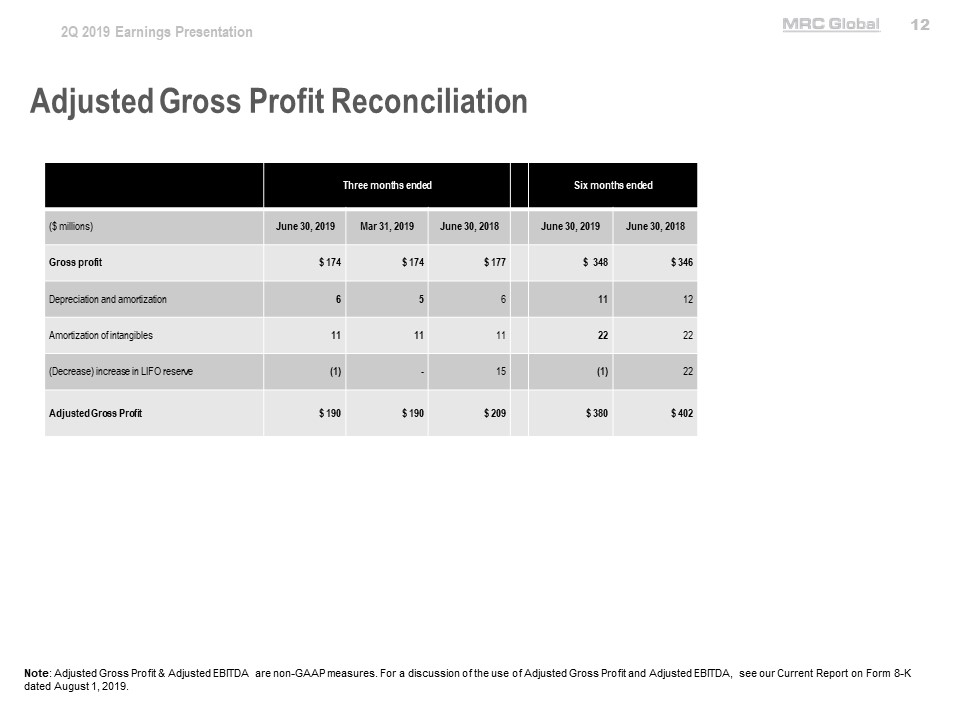
2Q 2019 Earnings Presentation MRC Global 12 Adjusted Gross Profit Reconciliation Three months Six months ended ($ millions) June 30, 2019 Mar 31, 2019 June 30, 2018 June 30, 2019 June 30, 2018 Gross profit $174 $174 $177 $348 $346 Depreciation and amortization 6 5 6 11 12 Amortization of intangibles 11 11 11 22 22 (Decrease) increase in LIFO reserve (1) – 15 (1) 22 Adjusted Gross Profit $190 $190 $209 $380 $402 Note: Adjusted Gross Profit & Adjusted EBITDA are non-GAAP measures. For a discussion of the use of Adjusted Gross Profit and Adjusted EBITDA, see our Current Report on Form 8-K dated August 1, 2019. 12
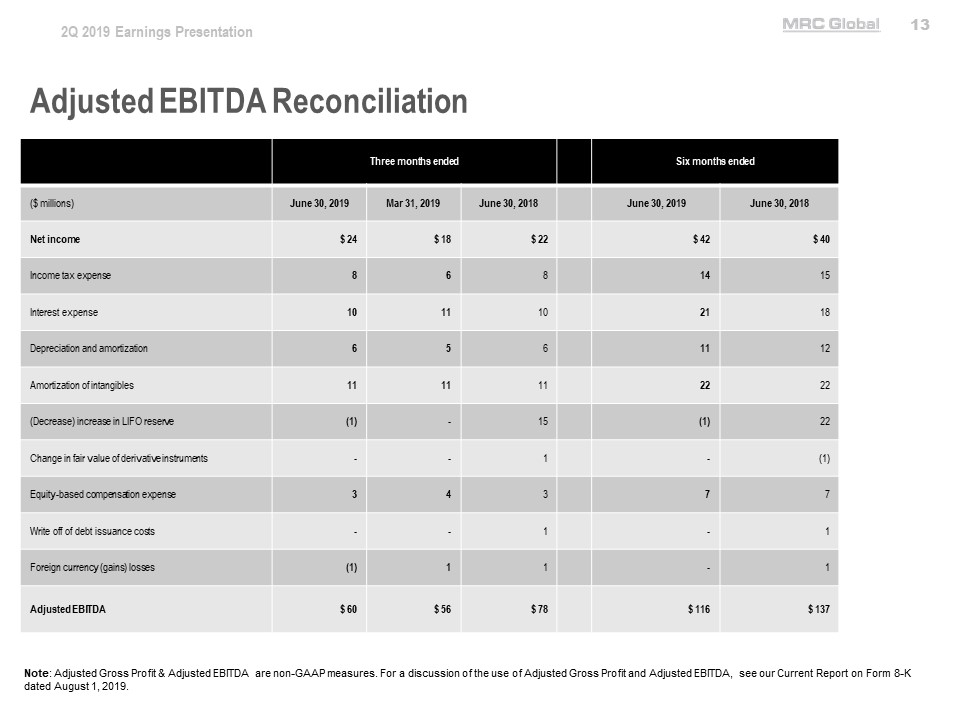
2Q 2019 Earnings Presentation MRC Global 13 Adjusted EBITDA Reconciliation Three months ended Six months ended ($ millions) June 30, 2019 Mar 31, 2019 June 30, 2018 June 30, 2019 June 30, 2018 Net income $24 $18 $22 $42 $40 Income tax expense 8 6 8 14 15 Interest expense 10 11 10 21 18 Depreciation and amortization 6 5 6 11 12 Amortization of intangibles 11 11 11 22 22 (Decrease) increase in LIFO reserve (1) – 15 (1) 22 Change in fair value of derivative instruments - - 1 – (1) Equity-based compensation expense 3 4 3 7 7 Write off of debt issuance costs - - 1 – 1 Foreign currency (gains) losses (1) 1 1 – 1 Adjusted EBITDA $60 $56 $78 $116 $137 Note: Adjusted Gross Profit & Adjusted EBITDA are non-GAAP measures. For a discussion of the use of Adjusted Gross Profit and Adjusted EBITDA, see our Current Report on Form 8-K dated August 1, 2019. 13