Exhibit 99.2

MRC Global 1Q 2020 Earnings Presentation April 28, 2020 Andrew Lane President & CEO Kelly Youngblood Executive Vice President & CFO We Make Energy Flow 1
Forward Looking Statements and Non-GAAP Disclaimer This presentation contains forward-looking statements within the meaning of Section 27A of the Securities Act and Section 21E of the Exchange Act. Words such as “will,” “expect,” “looking forward,” “guidance,” “targeting”, and similar expressions are intended to identify forward-looking statements. Statements about the company’s business, including its strategy, its industry, the company’s future profitability, the company’s guidance on its sales, Adjusted EBITDA, gross profit, gross profit percentage, Adjusted Gross Profit, Adjusted Gross Profit percentage, tax rate, capital expenditures and cash from operations, growth in the company’s various markets and the company’s expectations, beliefs, plans, strategies, objectives, prospects and assumptions are not guarantees of future performance. These statements are based on management’s expectations that involve a number of business risks and uncertainties, any of which could cause actual results to differ materially from those expressed in or implied by the forward-looking statements. These statements involve known and unknown risks, uncertainties and other factors, most of which are difficult to predict and many of which are beyond our control, including the factors described in the company’s SEC filings that may cause our actual results and performance to be materially different from any future results or performance expressed or implied by these forward-looking statements, including the company’s Current Report on Form 8-K dated April 28, 2020. For a discussion of key risk factors, please see the risk factors disclosed in the company’s SEC filings, which are available on the SEC’s website at www.sec.gov and on the company’s website, www.mrcglobal.com. Our filings and other important information are also available on the Investor Relations page of our website at www.mrcglobal.com. Undue reliance should not be placed on the company’s forward-looking statements. Although forward-looking statements reflect the company’s good faith beliefs, reliance should not be placed on forward-looking statements because they involve known and unknown risks, uncertainties and other factors, which may cause the company’s actual results, performance or achievements or future events to differ materially from anticipated future results, performance or achievements or future events expressed or implied by such forward-looking statements. The company undertakes no obligation to publicly update or revise any forward-looking statement, whether as a result of new information, future events, changed circumstances or otherwise, except to the extent required by law. Statement Regarding Use of Non-GAAP Measures: The Non-GAAP financial measures contained in this presentation (Adjusted EBITDA and Adjusted Gross Profit) are not measures of financial performance calculated in accordance with U.S. Generally Accepted Accounting Principles (GAAP) and should not be considered as alternatives to net income or gross profit. They should be viewed in addition to, and not as a substitute for, analysis of our results reported in accordance with GAAP. Management believes that these non-GAAP financial measures provide investors a view to measures similar to those used in evaluating our compliance with certain financial covenants under our credit facilities and provide meaningful comparisons between current and prior year period results. They are also used as a metric to determine certain components of performance-based compensation. They are not necessarily indicative of future results of operations that may be obtained by the company. 1Q 2020 Earnings Presentation MRC Global 2
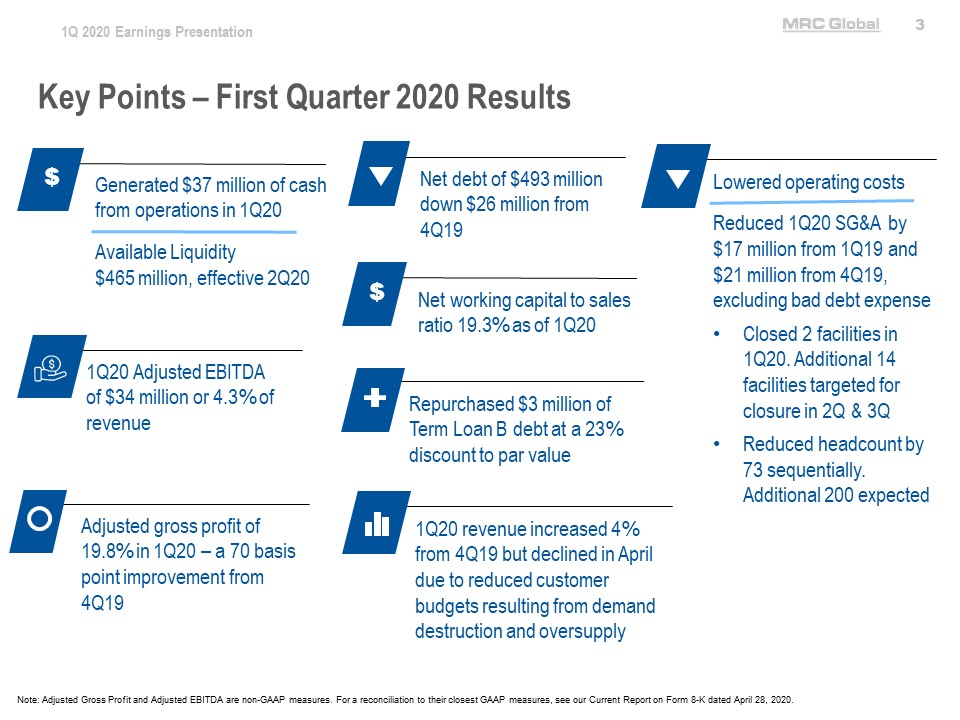
Key Points – First Quarter 2020 Results Generated $37 million of cash from operations in 1Q20 Available Liquidity $465 million, effective 2Q20 1Q20 Adjusted EBITDA of $34 million or 4.3% of revenue Adjusted gross profit of 19.8% in 1Q20 – a 70 basis point improvement from 4Q19 Net debt of $493 million down $26 million from 4Q19 Net working capital to sales ratio 19.3% as of 1Q20 Repurchased $3 million of Term Loan B debt at a 23% discount to par value 1Q20 revenue increased 4% from 4Q19 but declined in April due to reduced customer budgets resulting from demand destruction and oversupply Lowered operating costs Reduced 1Q20 SG&A by $17 million from 1Q19 and $21 million from 4Q19, excluding bad debt expense Closed 2 facilities in 1Q20. Additional 14 facilities targeted for closure in 2Q & 3Q Reduced headcount by 73 sequentially. Additional 200 expected Note: Adjusted Gross Profit and Adjusted EBITDA are non-GAAP measures. For a reconciliation to their closest GAAP measures, see our Current Report on Form 8-K dated April 28, 2020. 1Q 2020 Earnings Presentation MRC Global 3
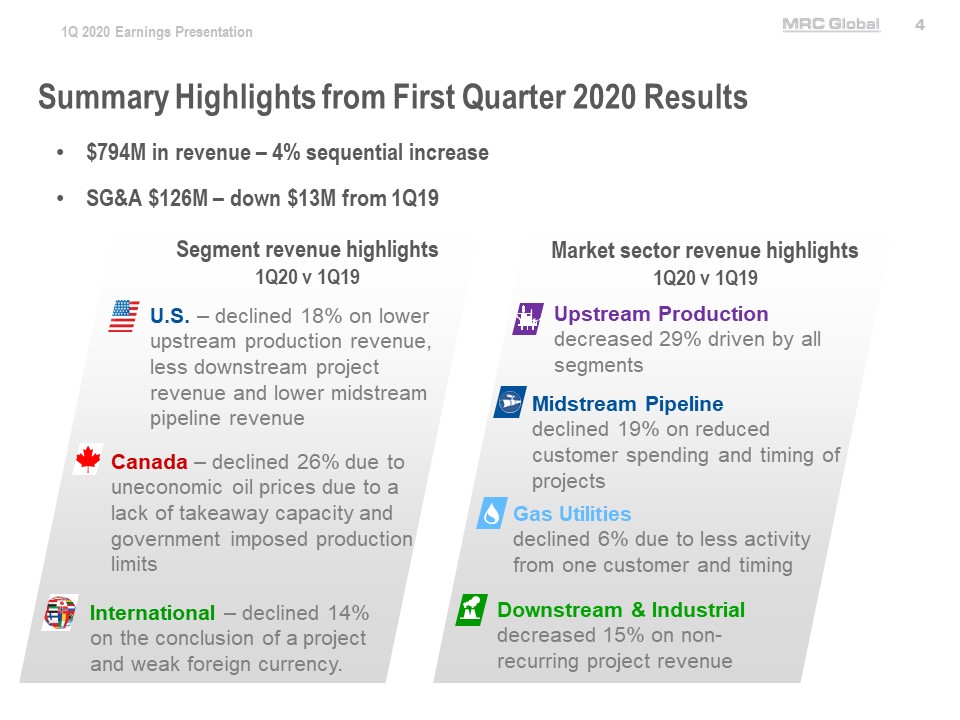
Summary Highlights from First Quarter 2020 Results $794M in revenue – 4% sequential increase SG&A $126M – down $13M from 1Q19 Segment revenue highlights 1Q20 v 1Q19 U.S. – declined 18% on lower upstream production revenue, less downstream project revenue and lower midstream pipeline revenue Canada – declined 26% due to uneconomic oil prices due to a lack of takeaway capacity and government imposed production limits International – declined 14% on the conclusion of a project and weak foreign currency. Market sector revenue highlights 1Q20 v 1Q19 Upstream Production decreased 29% driven by all segments Midstream Pipeline declined 19% on reduced customer spending and timing of projects Gas Utilities declined 6% due to less activity from one customer and timing Downstream & Industrial decreased 15% on non-recurring project revenue 1Q 2020 Earnings Presentation MRC Global 4
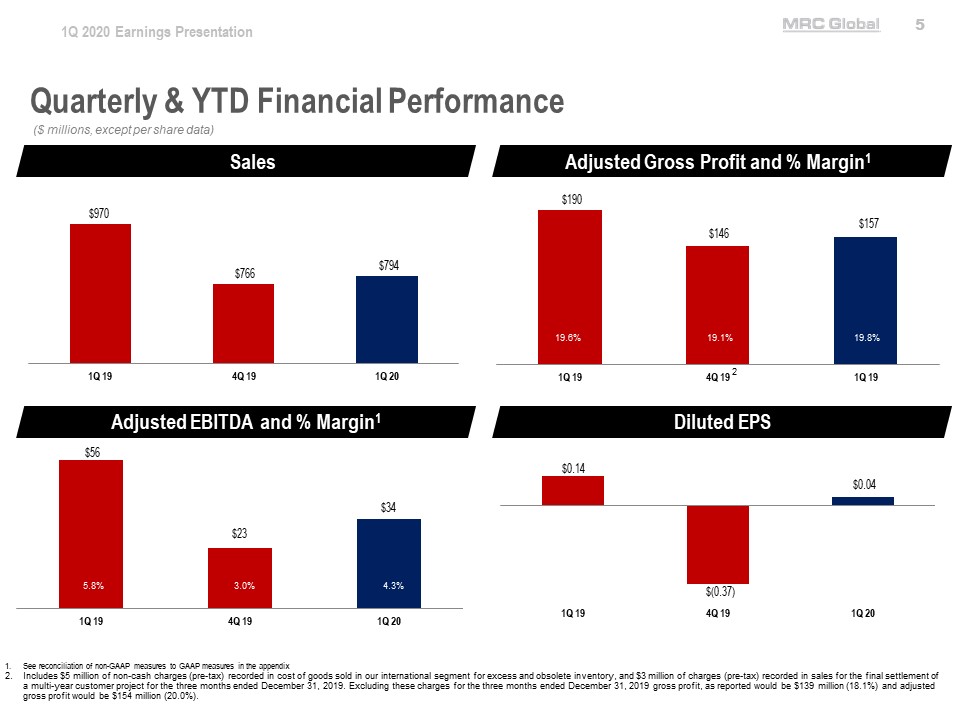
Quarterly & YTD Financial Performance ($ millions, except per share data) Sales 1Q 19 $970 4Q 19 $766 1Q 20 $794 Adjusted Gross Profit and % Margin 1 1Q 19 19.6% $190 4Q 19 2 19.1% $146 1Q 19 19.8% $157 Adjusted EBITDA and % Margin 1 1Q 19 5.8% $56 4Q 19 3.0% $23 1Q 20 4.3% $34 Diluted EPS 1Q 19 $0.14 4Q 19 $(0.37) 1Q 20 $0.04 1. See reconciliation of non-GAAP measures to GAAP measures in the appendix 2. Includes $5 million of non-cash charges (pre-tax) recorded in cost of goods sold in our international segment for excess and obsolete inventory, and $3 million of charges (pre-tax) recorded in sales for the final settlement of a multi-year customer project for the three months ended December 31, 2019. Excluding these charges for the three months ended December 31, 2019 gross profit, as reported would be $139 million (18.1%) and adjusted gross profit would be $154 million (20.0%). 1Q 2020 Earnings Presentation MRC Global 5
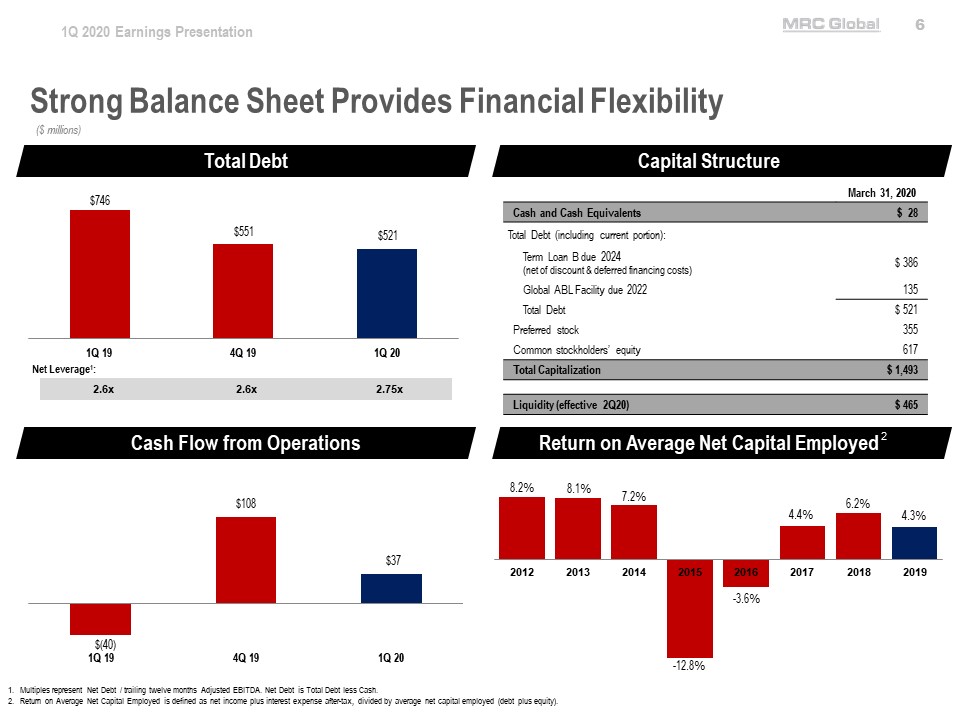
Strong Balance Sheet Provides Financial Flexibility ($ millions) Total Debt 1Q 19 $746 4Q 19 $551 1Q 20 $521 Net Leverage 1 : 2.6x 2.6x 2.75x Capital Structure March 31,2020 Cash and Cash Equivalents $ 28 Total Debt (including current portion): Term Loan B due 2024 $386 (net of discount & deferred financing costs) Global ABL Facility due 2022 135 Total Debt $521 Preferred stock 355 Common stockholders’ equity 617 Total Capitalization $1,493 Liquidity (effective 2Q20) $465 Cash Flow from Operations 1Q 19 $(40) 4Q 19 $108 1Q 20 $37 Return on Average Net Capital Employed 2 2012 8.2% 2013 8.1% 2014 7.2% 2015 -12.8% 2016 -3.6% 2017 4.4% 2018 6.2% 2019 4.3% 1. Multiples represent Net Debt / trailing twelve months Adjusted EBITDA. Net Debt is Total Debt less Cash. 2. Return on Average Net Capital Employed is defined as net income plus interest expense after-tax, divided by average net capital employed (debt plus equity). 1Q 2020 Earnings Presentation MRC Global 6
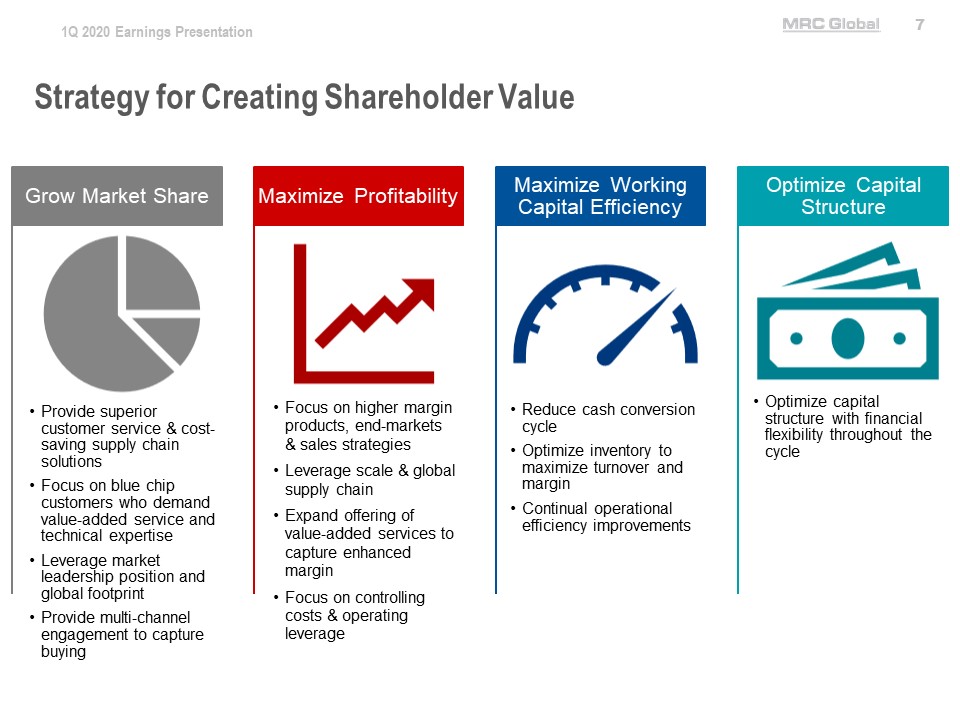
Strategy for Creating Shareholder Value Grow Market Share Provide superior customer service & cost-saving supply chain solutions Focus on blue chip customers who demand value-added service and technical expertise Leverage market leadership position and global footprint Provide multi-channel engagement to capture buying Maximize Profitability Focus on higher margin products, end-markets & sales strategies Leverage scale & global supply chain Expand offering of value-added services to capture enhanced margin Focus on controlling costs & operating leverage Maximize Working Capital Efficiency Reduce cash conversion cycle Optimize inventory to maximize turnover and margin Continual operational efficiency improvements Optimize Capital Structure Optimize capital structure with financial flexibility throughout the cycle 1Q 2020 Earnings Presentation MRC Global 7
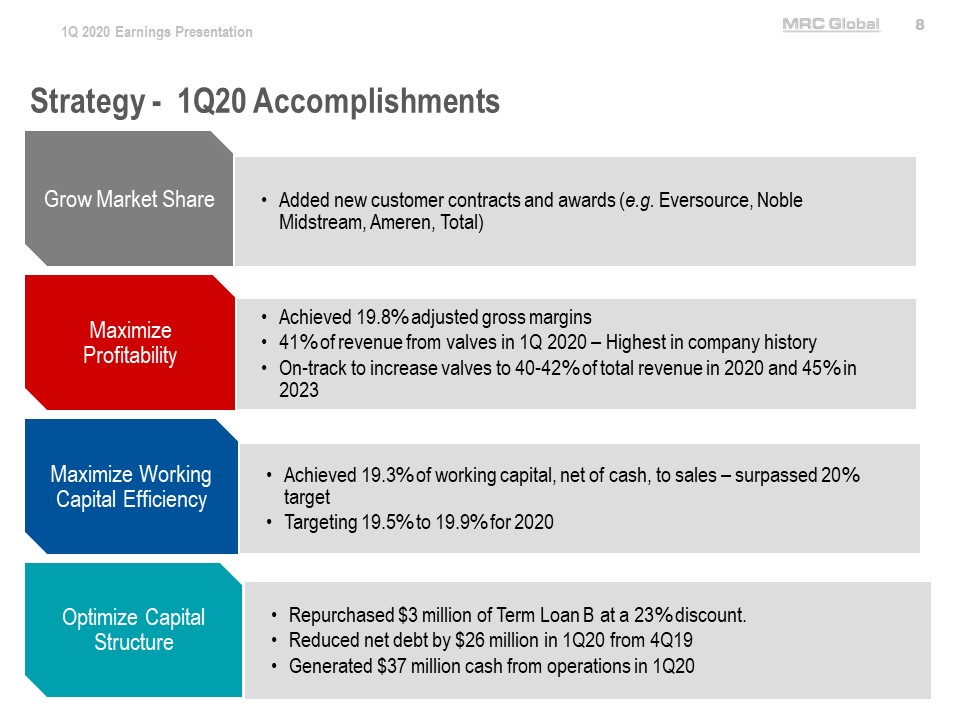
Strategy - 1Q20 Accomplishments Grow Market Share Added new customer contracts and awards (e.g. Eversource, Noble Midstream, Ameren, Total) Maximize Profitability Achieved 19.8% adjusted gross margins 41% of revenue from valves in 1Q 2020 – Highest in company history On-track to increase valves to 40-42% of total revenue in 2020 and 45% in 2023 Maximize Working Capital Efficiency Achieved 19.3% of working capital, net of cash, to sales – surpassed 20% target Targeting 19.5% to 19.9% for 2020 Optimize Capital Structure Repurchased $3 million of Term Loan B at a 23% discount. Reduced net debt by $26 million in 1Q20 from 4Q19 Generated $37 million cash from operations in 1Q20 1Q 2020 Earnings Presentation MRC Global 8
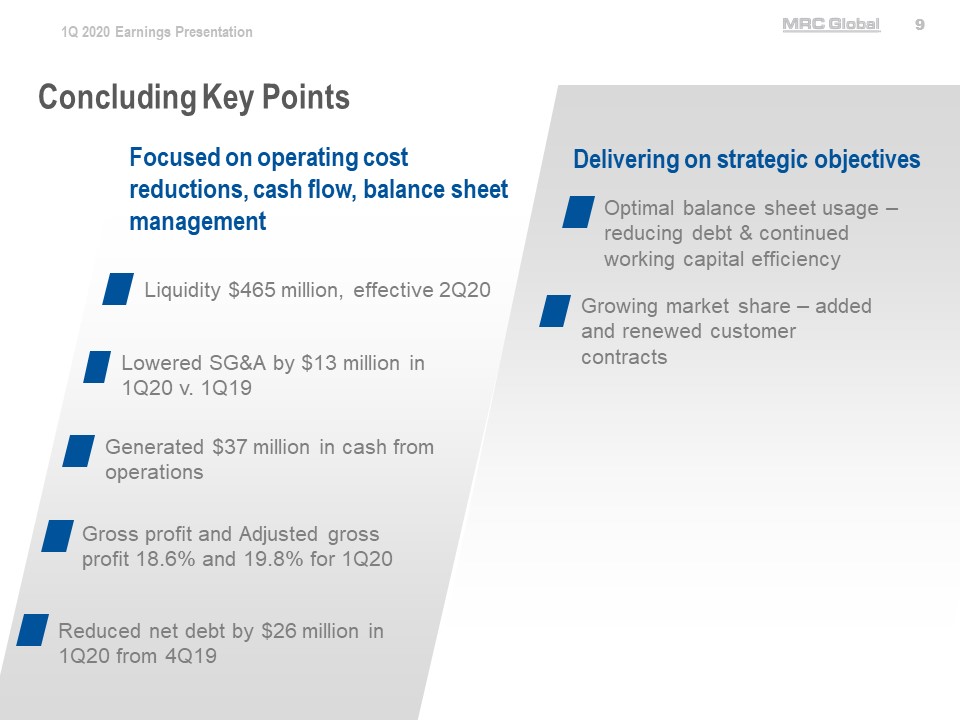
Concluding Key Points Focused on operating cost reductions, cash flow, balance sheet management Liquidity $465 million, effective 2Q20 Lowered SG&A by $13 million in 1Q20 v. 1Q19 Generated $37 million in cash from operations Gross profit and Adjusted gross profit 18.6% and 19.8% for 1Q20 Reduced net debt by $26 million in 1Q20 from 4Q19 Delivering on strategic objectives Optimal balance sheet usage – reducing debt & continued working capital efficiency Growing market share – added and renewed customer contracts 1Q 2020 Earnings Presentation MRC Global 9
Appendix 1Q 2020 Earnings Presentation MRC Global 10
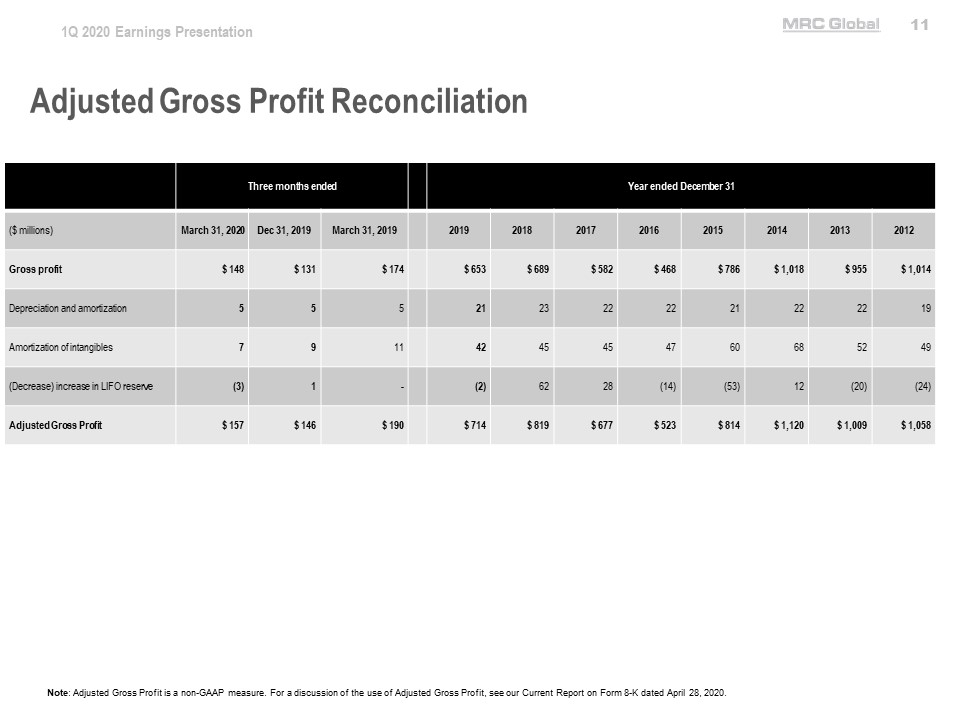
Adjusted Gross Profit Reconciliation Three months ended Year ended December 31 ($ millions) March 31, 2020 Dec 31, 2019 March 31, 2019 2019 2018 2017 2016 2015 2014 2013 2012 Gross profit $ 148 $ 131 $ 174 $ 653 $ 689 $ 582 $ 468 $ 786 $ 1,018 $ 955 $ 1,014 Depreciation and amortization 5 5 5 21 23 22 22 21 22 22 19 Amortization of intangibles 7 9 11 42 45 45 47 60 68 52 49 (Decrease) increase in LIFO reserve (3) 1 - (2) 62 28 (14) (53) 12 (20) (24) Adjusted Gross Profit $ 157 $ 146 $ 190 $ 714 $ 819 $ 677 $ 523 $ 814 $ 1,120 $ 1,009 $ 1,058 Note: Adjusted Gross Profit is a non-GAAP measure. For a discussion of the use of Adjusted Gross Profit, see our Current Report on Form 8-K dated April 28, 2020. 1Q 2020 Earnings Presentation MRC Global 11
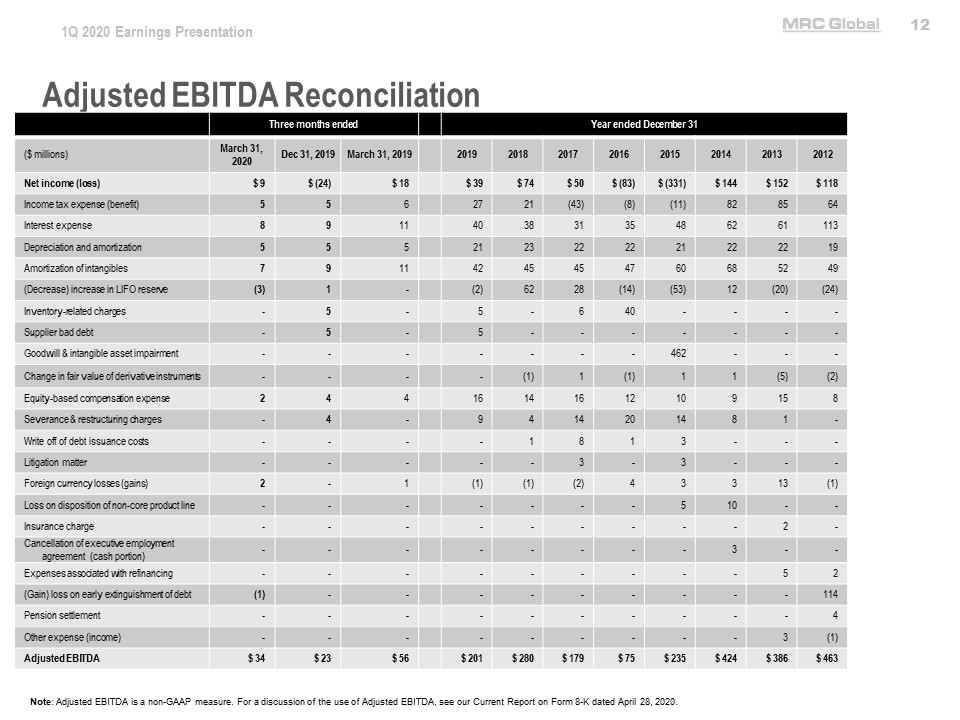
Adjusted EBITDA Reconciliation Three months ended Year ended December 31 ($ millions) March 31, 2020 Dec 31, 2019 March 31, 2019 2019 2018 2017 2016 2015 2014 2013 2012 Net income (loss) $ 9 $ (24) $ 18 $ 39 $ 74 $ 50 $ (83) $ (331) $ 144 $ 152 $ 118 Income tax expense (benefit) 5 5 6 27 21 (43) (8) (11) 82 85 64 Interest expense 8 9 11 40 38 31 35 48 62 61 113 Depreciation and amortization 5 5 5 21 23 22 22 21 22 22 19 Amortization of intangibles 7 9 11 42 45 45 47 60 68 52 49 (Decrease) increase in LIFO reserve (3) 1 - (2) 62 28 (14) (53) 12 (20) (24) Inventory-related charges - 5 - 5 - 6 40 - - - - Supplier bad debt - 5 - 5 - - - - - - - Goodwill & intangible asset impairment - - - - - - - 462 - - - Change in fair value of derivative instruments - - - - (1) 1 (1) 1 1 (5) (2) Equity-based compensation expense 2 4 4 16 14 16 12 10 9 15 8 Severance & restructuring charges - 4 - 9 4 14 20 14 8 1 - Write off of debt issuance costs - - - - 1 8 1 3 - - - Litigation matter - - - - - 3 - 3 - - - Foreign currency losses (gains) 2 - 1 (1) (1) (2) 4 3 3 13 (1) Loss on disposition of non-core product line - - - - - - - 5 10 - - Insurance charge - - - - - - - - - 2 - Cancellation of executive employment agreement (cash portion) - - - - - - - - 3 - - Expenses associated with refinancing - - - - - - - - - 5 2 (Gain) loss on early extinguishment of debt (1) - - - - - - - - - 114 Pension settlement - - - - - - - - - - 4 Other expense (income) - - - - - - - - - 3 (1) Adjusted EBITDA $ 34 $ 23 $ 56 $ 201 $ 280 $ 179 $ 75 $ 235 $ 424 $ 386 $ 463 Note: Adjusted EBITDA is a non-GAAP measure. For a discussion of the use of Adjusted EBITDA, see our Current Report on Form 8-K dated April 28, 2020. 1Q 2020 Earnings Presentation MRC Global 12