Investor Presentation - 4Q 2021 Update March 4, 2022 Rob Saltiel President & CEO Kelly Youngblood Executive Vice President & CFO Exhibit 99.1
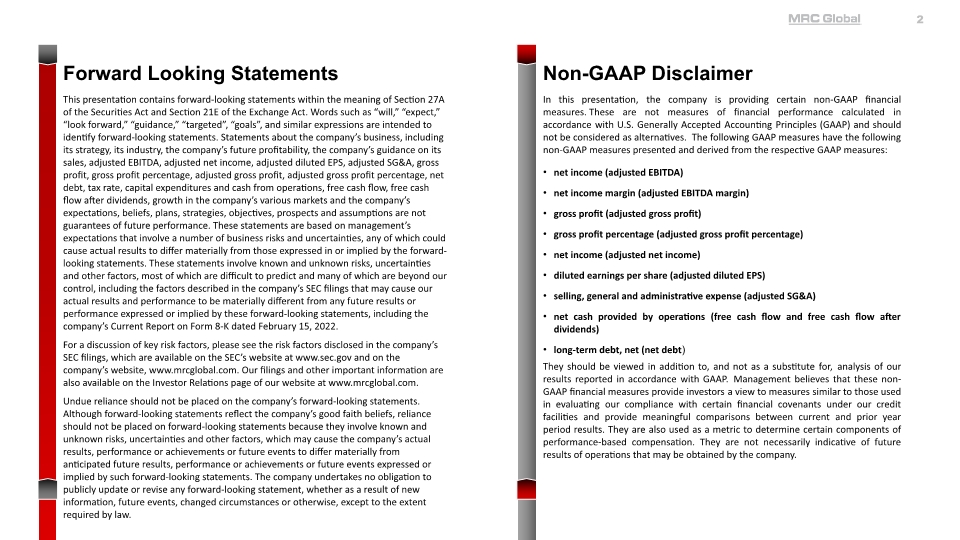
MRC Global A Compelling Investment Opportunity 100 YEARS Diversified portfolio with multiple levers for growth Technical and value-added supply-chain solutions
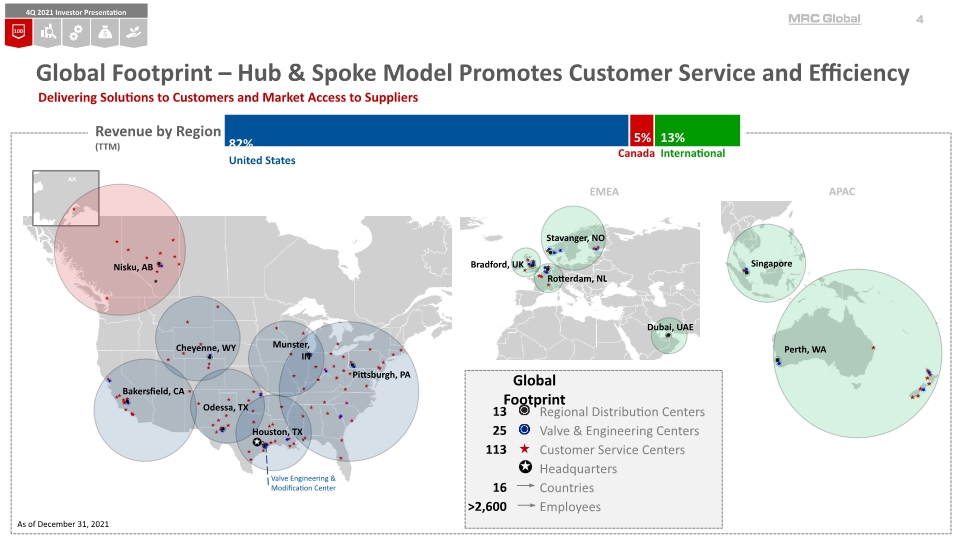
Global Footprint – Hub & Spoke Model Promotes Customer Service and Efficiency Delivering Solutions to Customers and Market Access to Suppliers As of December 31, 2021 4Q 2021 Investor Presentation
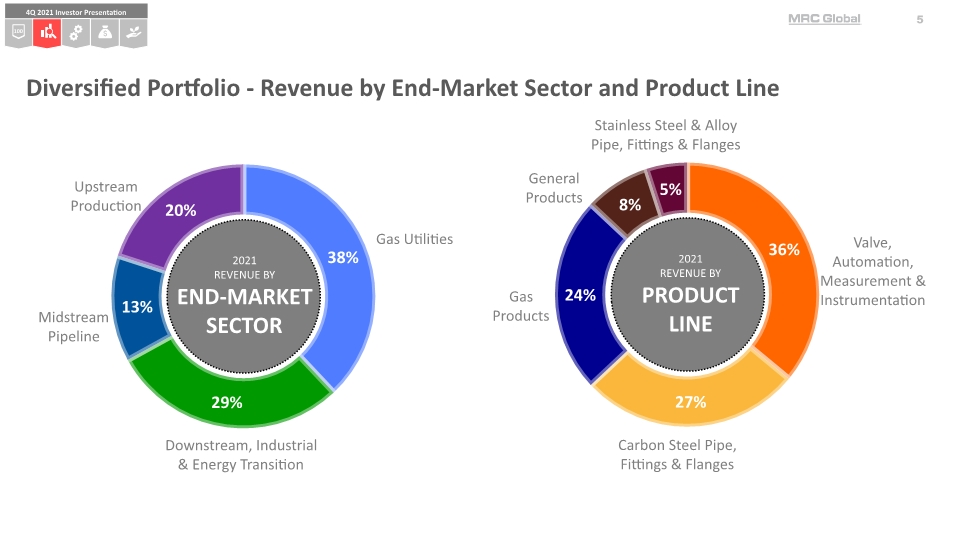
Diversified Portfolio - Revenue by End-Market Sector and Product Line Valve, Automation, Measurement & Instrumentation Carbon Steel Pipe, Fittings & Flanges Gas Products General Products Stainless Steel & Alloy Pipe, Fittings & Flanges Upstream Production Gas Utilities Downstream, Industrial & Energy Transition Midstream Pipeline 2021 REVENUE BY PRODUCT LINE 2021 REVENUE BY END-MARKET SECTOR
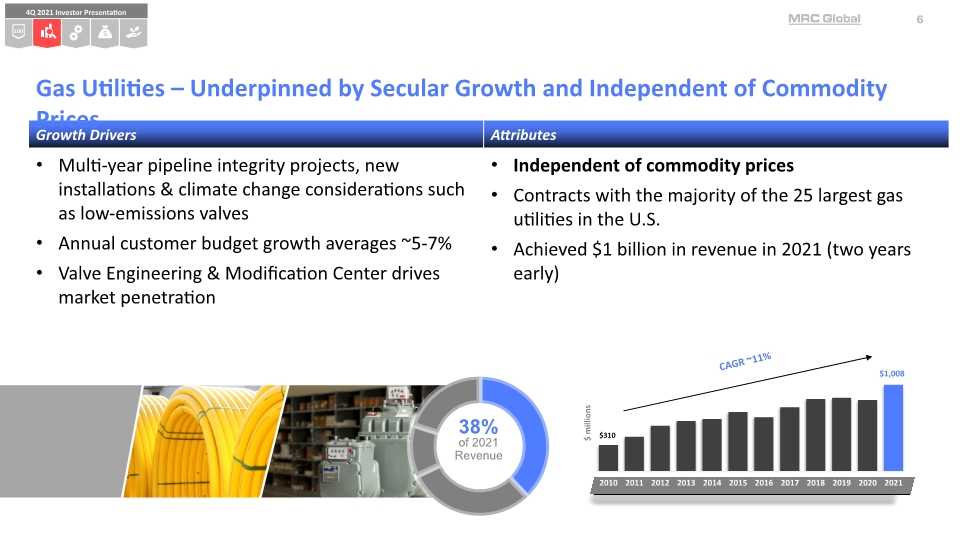
Gas Utilities – Underpinned by Secular Growth and Independent of Commodity Prices 38% of 2021 Revenue $1,008
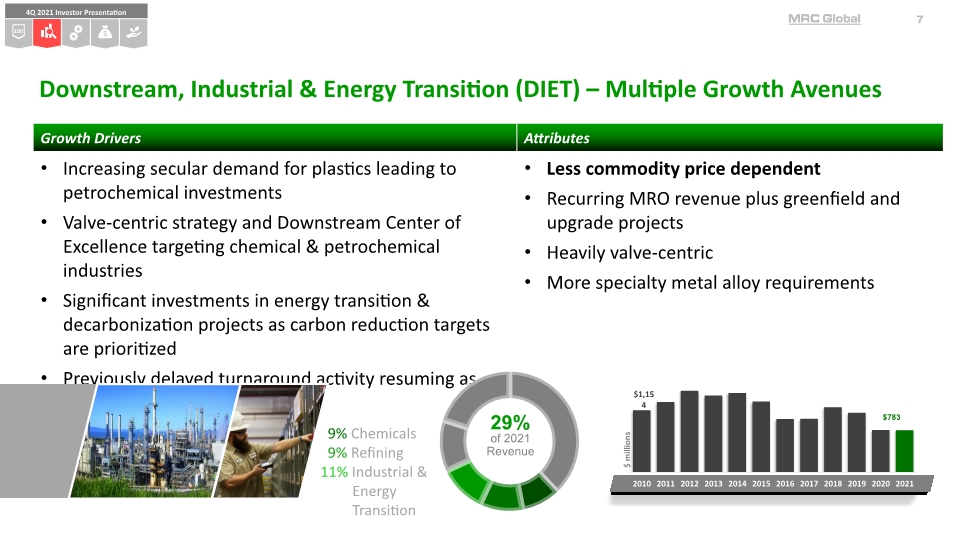
Downstream, Industrial & Energy Transition (DIET) – Multiple Growth Avenues 9% Chemicals 9% Refining 11% Industrial & Energy Transition 29% of 2021 Revenue
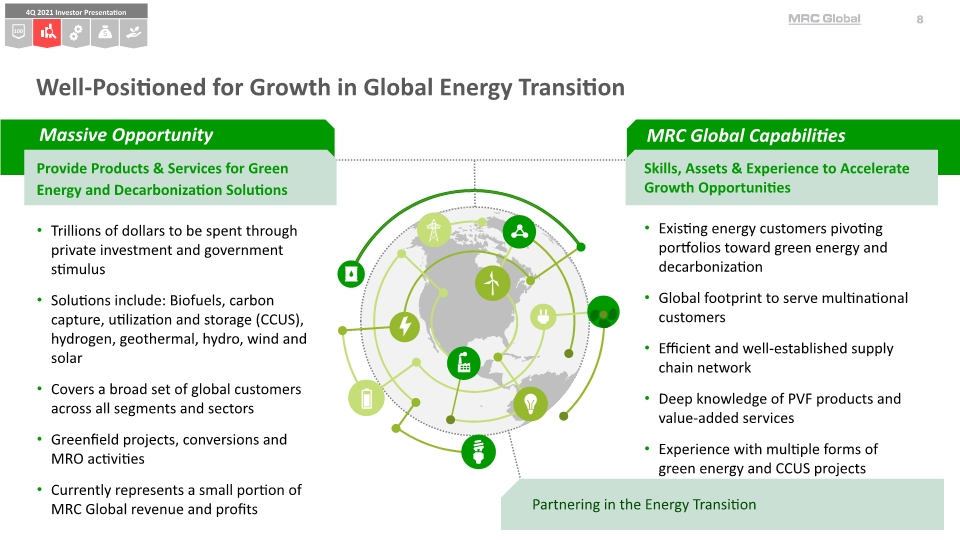
Well-Positioned for Growth in Global Energy Transition Provide Products & Services for Green Energy and Decarbonization Solutions Trillions of dollars to be spent through private investment and government stimulus Solutions include: Biofuels, carbon capture, utilization and storage (CCUS), hydrogen, geothermal, hydro, wind and solar Covers a broad set of global customers across all segments and sectors Greenfield projects, conversions and MRO activities Currently represents a small portion of MRC Global revenue and profits Skills, Assets & Experience to Accelerate Growth Opportunities Existing energy customers pivoting portfolios toward green energy and decarbonization Global footprint to serve multinational customers Efficient and well-established supply chain network Deep knowledge of PVF products and value-added services Experience with multiple forms of green energy and CCUS projects Partnering in the Energy Transition
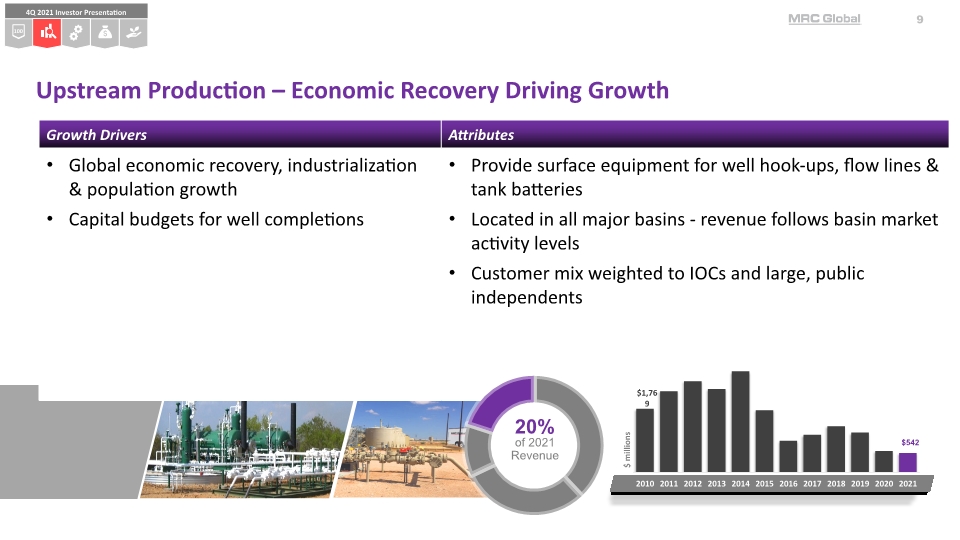
Upstream Production – Economic Recovery Driving Growth $ millions 20% of 2021 Revenue
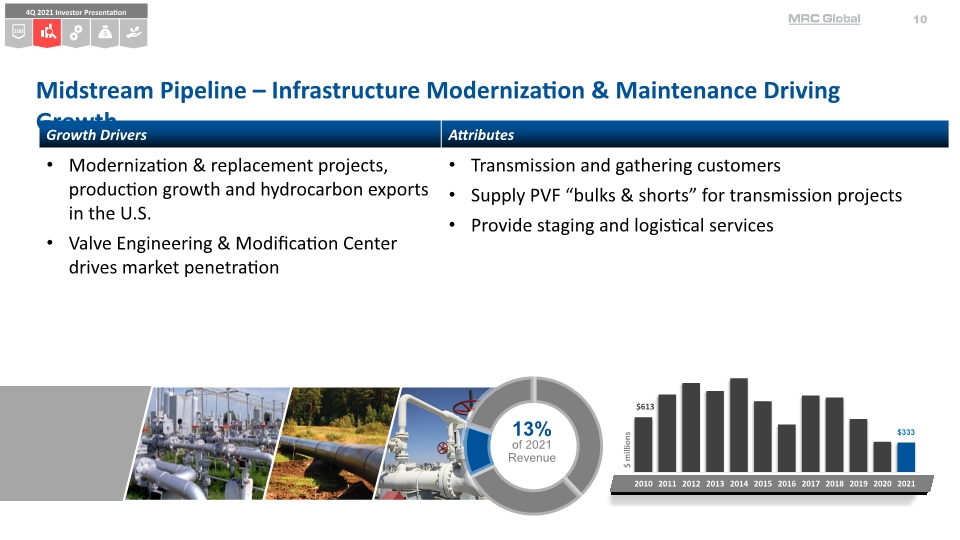
Midstream Pipeline – Infrastructure Modernization & Maintenance Driving Growth $ millions 13% of 2021 Revenue
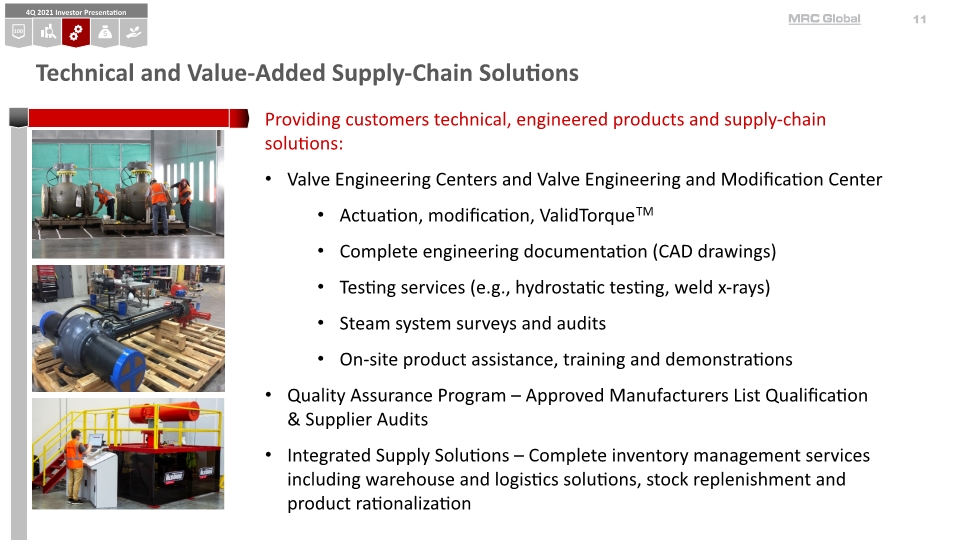
Technical and Value-Added Supply-Chain Solutions Providing customers technical, engineered products and supply-chain solutions: Valve Engineering Centers and Valve Engineering and Modification Center Actuation, modification, ValidTorqueTM Complete engineering documentation (CAD drawings) Testing services (e.g., hydrostatic testing, weld x-rays) Steam system surveys and audits On-site product assistance, training and demonstrations Quality Assurance Program – Approved Manufacturers List Qualification & Supplier Audits Integrated Supply Solutions – Complete inventory management services including warehouse and logistics solutions, stock replenishment and product rationalization
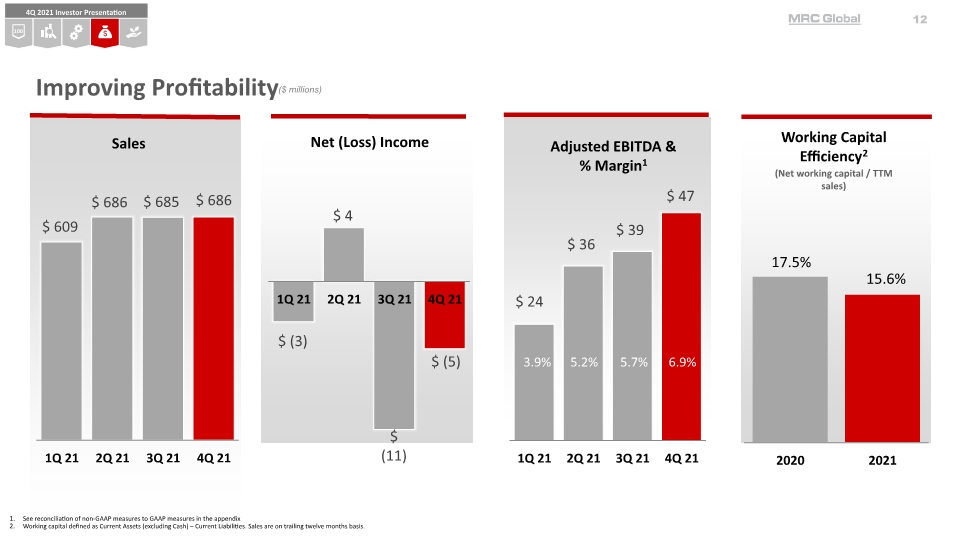
($ millions) Working Capital Efficiency2 (Net working capital / TTM sales) Adjusted EBITDA & % Margin1 Improving Profitability See reconciliation of non-GAAP measures to GAAP measures in the appendix Working capital defined as Current Assets (excluding Cash) – Current Liabilities. Sales are on trailing twelve months basis. Sales
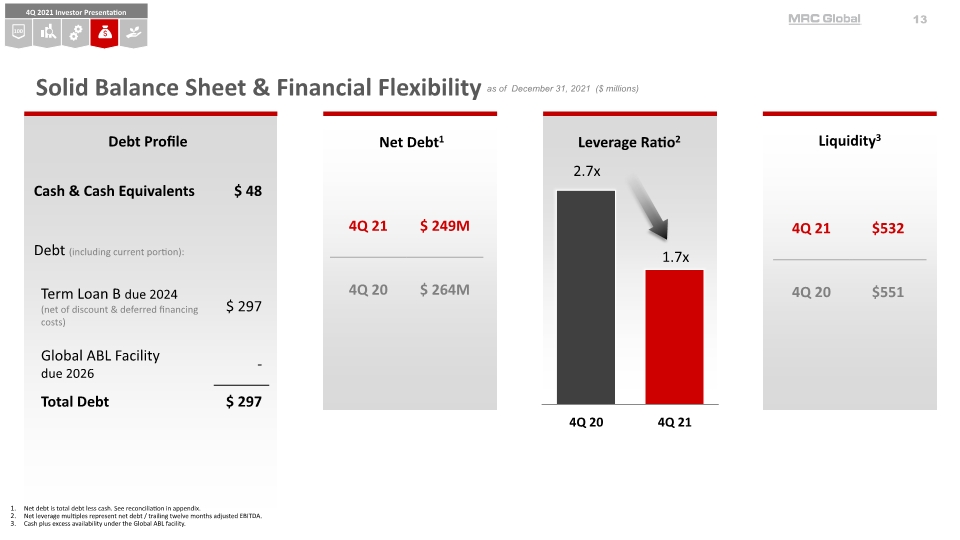
Leverage Ratio2 Liquidity3 as of December 31, 2021 ($ millions) Solid Balance Sheet & Financial Flexibility Net debt is total debt less cash. See reconciliation in appendix. Net leverage multiples represent net debt / trailing twelve months adjusted EBITDA. Cash plus excess availability under the Global ABL facility. Net Debt1
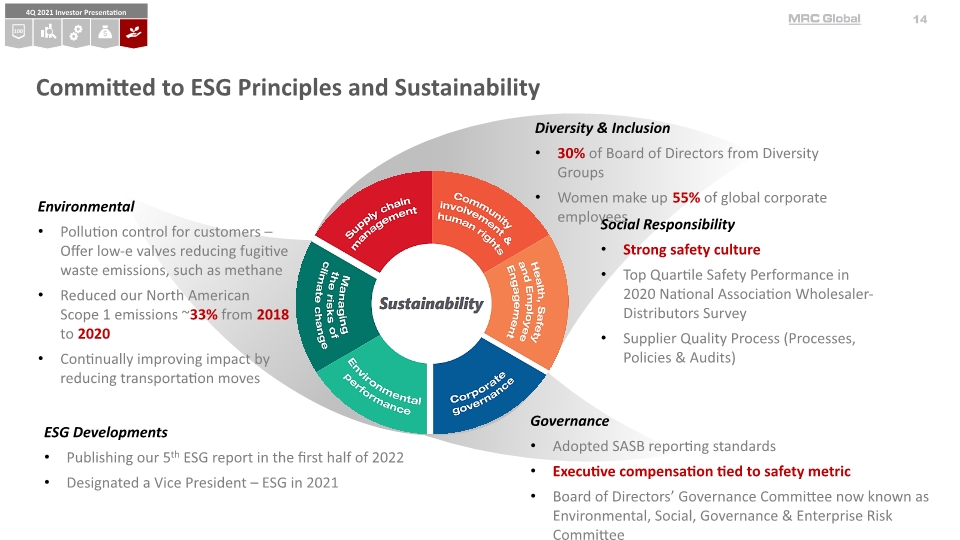
Committed to ESG Principles and Sustainability Diversity & Inclusion 30% of Board of Directors from Diversity Groups Women make up 55% of global corporate employees Social Responsibility Strong safety culture Top Quartile Safety Performance in 2020 National Association Wholesaler-Distributors Survey Supplier Quality Process (Processes, Policies & Audits) Environmental Pollution control for customers – Offer low-e valves reducing fugitive waste emissions, such as methane Reduced our North American Scope 1 emissions ~33% from 2018 to 2020 Continually improving impact by reducing transportation moves Governance Adopted SASB reporting standards Executive compensation tied to safety metric Board of Directors’ Governance Committee now known as Environmental, Social, Governance & Enterprise Risk Committee ESG Developments Publishing our 5th ESG report in the first half of 2022 Designated a Vice President – ESG in 2021
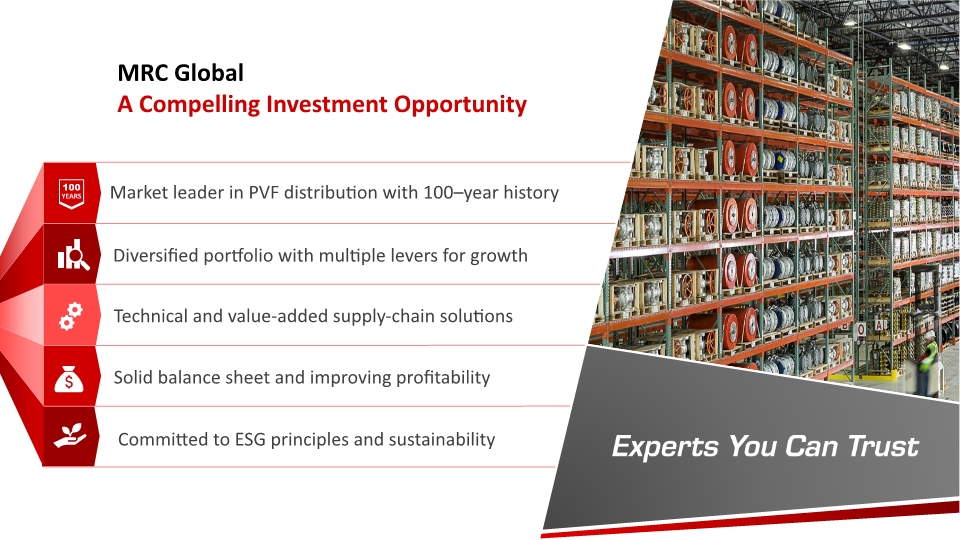
MRC Global A Compelling Investment Opportunity 100 YEARS Diversified portfolio with multiple levers for growth Technical and value-added supply-chain solutions
APPENDIX
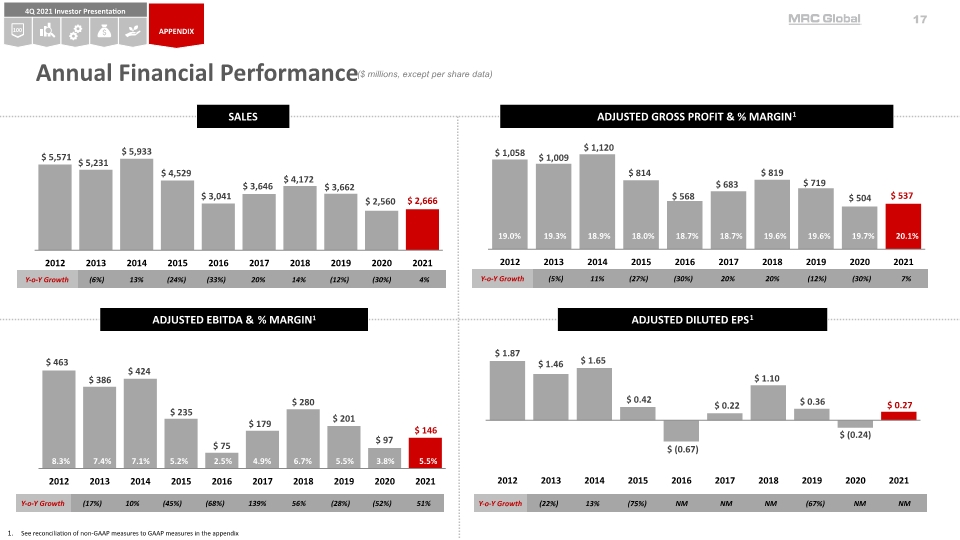
Annual Financial Performance ($ millions, except per share data) See reconciliation of non-GAAP measures to GAAP measures in the appendix APPENDIX ADJUSTED EBITDA & % MARGIN1 ADJUSTED DILUTED EPS1 SALES ADJUSTED GROSS PROFIT & % MARGIN1
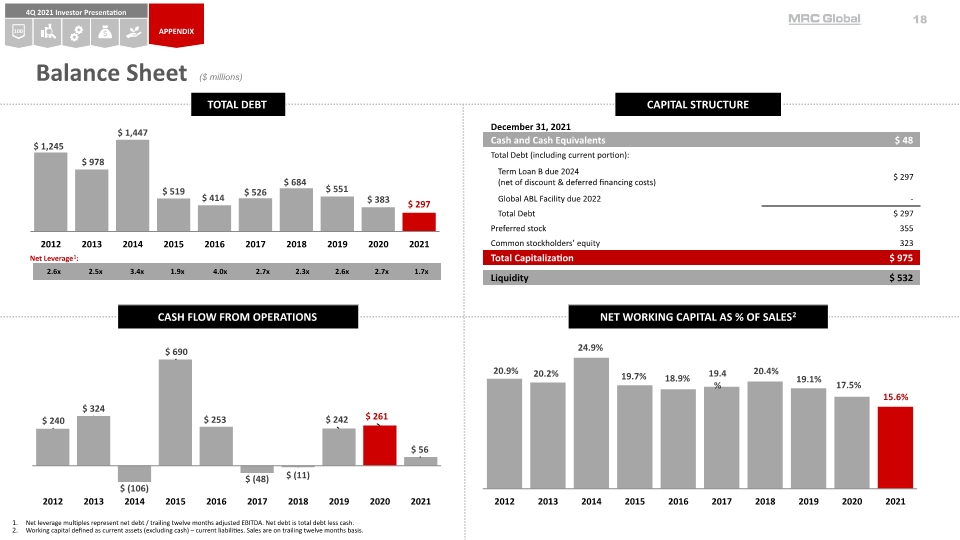
Balance Sheet ($ millions) Net leverage multiples represent net debt / trailing twelve months adjusted EBITDA. Net debt is total debt less cash. Working capital defined as current assets (excluding cash) – current liabilities. Sales are on trailing twelve months basis. Net Leverage1: TOTAL DEBT CASH FLOW FROM OPERATIONS CAPITAL STRUCTURE NET WORKING CAPITAL AS % OF SALES2 APPENDIX
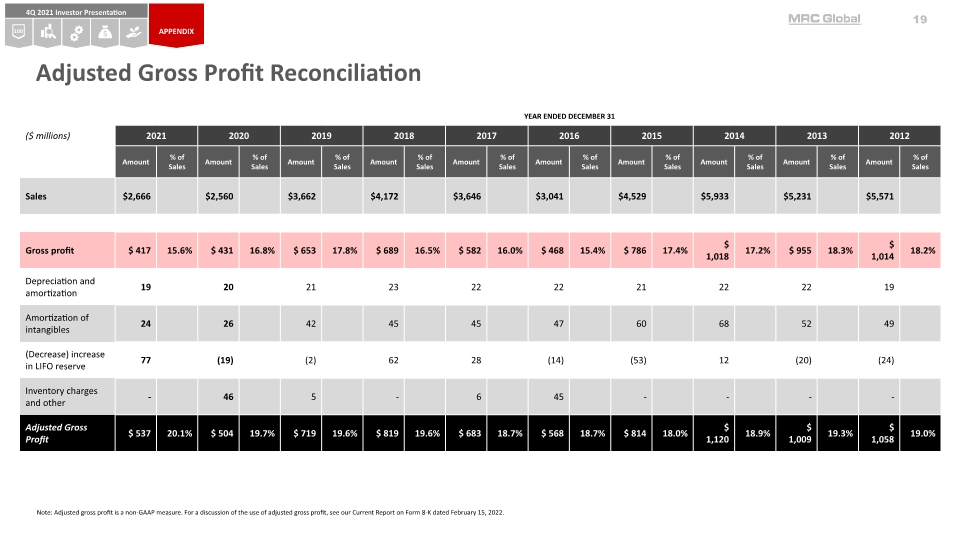
Note: Adjusted gross profit is a non-GAAP measure. For a discussion of the use of adjusted gross profit, see our Current Report on Form 8-K dated February 15, 2022. APPENDIX Adjusted Gross Profit Reconciliation
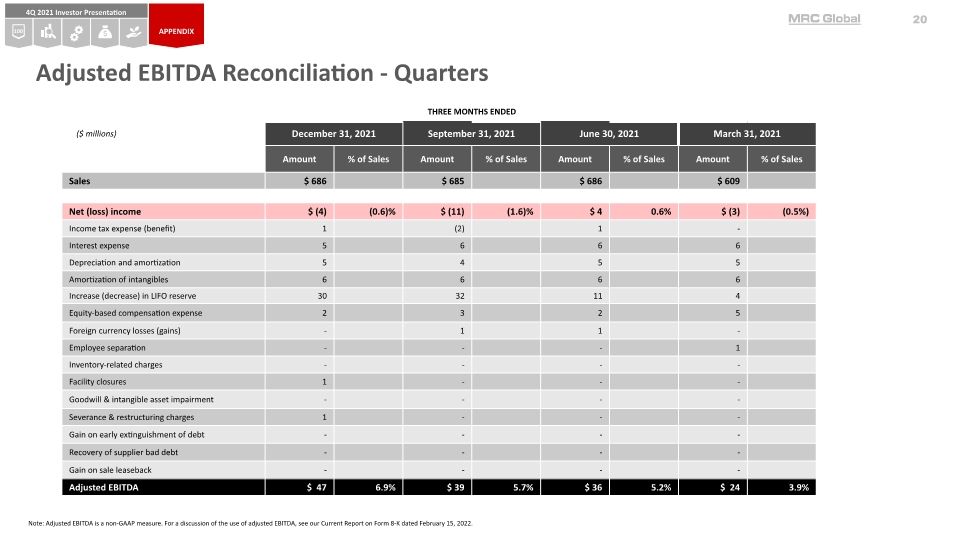
Note: Adjusted EBITDA is a non-GAAP measure. For a discussion of the use of adjusted EBITDA, see our Current Report on Form 8-K dated February 15, 2022. Adjusted EBITDA Reconciliation - Quarters APPENDIX
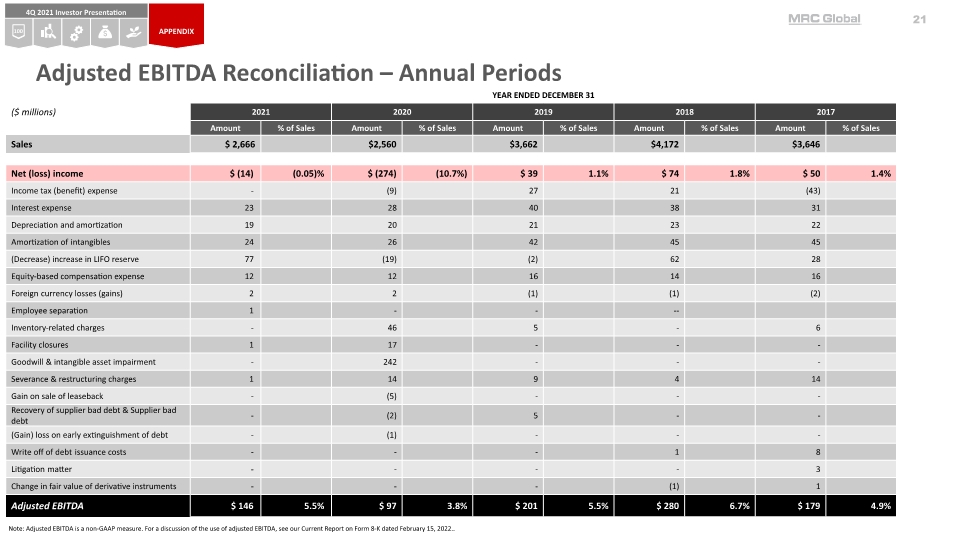
Note: Adjusted EBITDA is a non-GAAP measure. For a discussion of the use of adjusted EBITDA, see our Current Report on Form 8-K dated February 15, 2022.. Adjusted EBITDA Reconciliation – Annual Periods APPENDIX
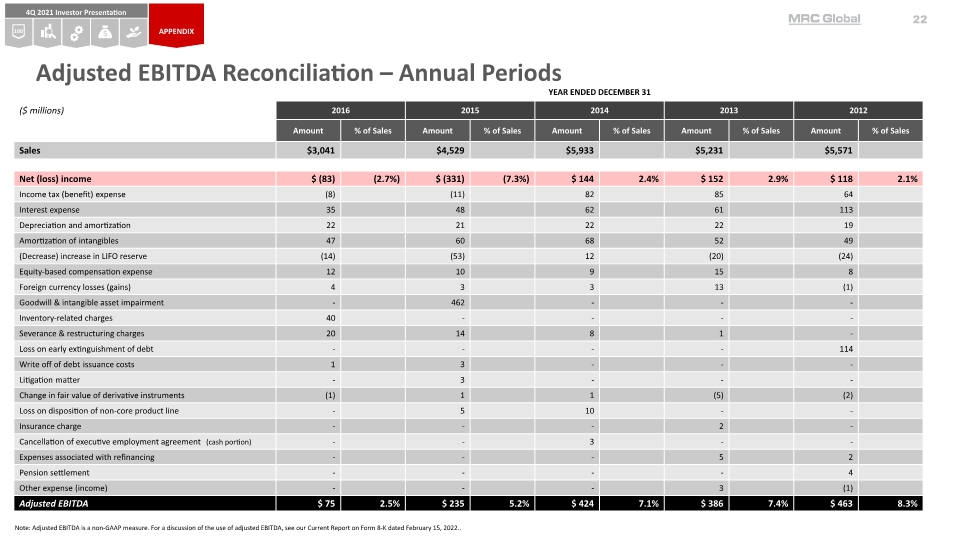
Note: Adjusted EBITDA is a non-GAAP measure. For a discussion of the use of adjusted EBITDA, see our Current Report on Form 8-K dated February 15, 2022.. Adjusted EBITDA Reconciliation – Annual Periods APPENDIX
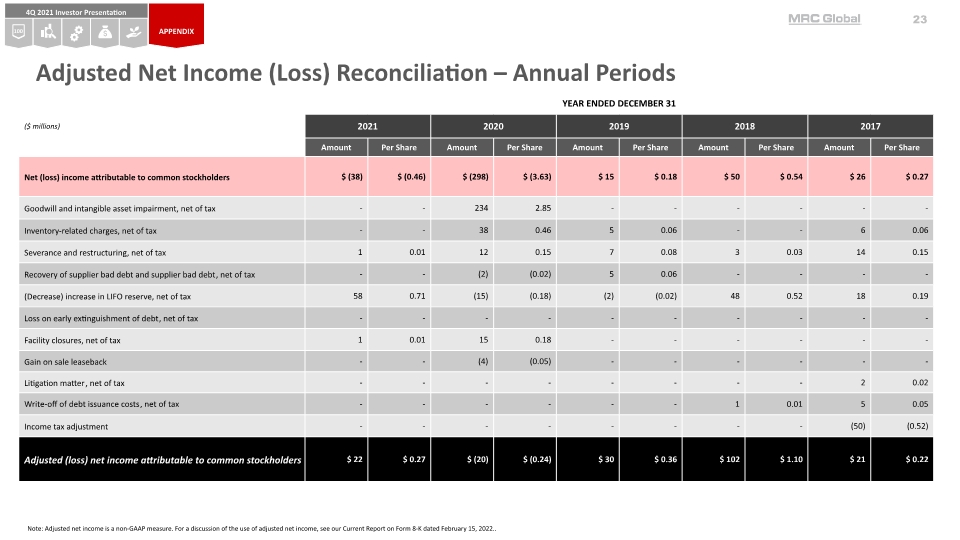
Note: Adjusted net income is a non-GAAP measure. For a discussion of the use of adjusted net income, see our Current Report on Form 8-K dated February 15, 2022.. Adjusted Net Income (Loss) Reconciliation – Annual Periods APPENDIX
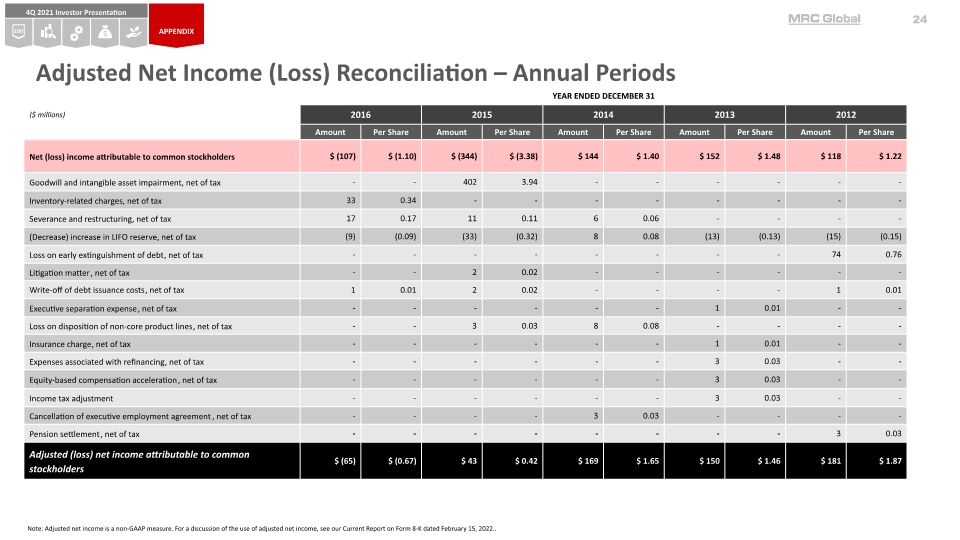
Note: Adjusted net income is a non-GAAP measure. For a discussion of the use of adjusted net income, see our Current Report on Form 8-K dated February 15, 2022.. Adjusted Net Income (Loss) Reconciliation – Annual Periods APPENDIX
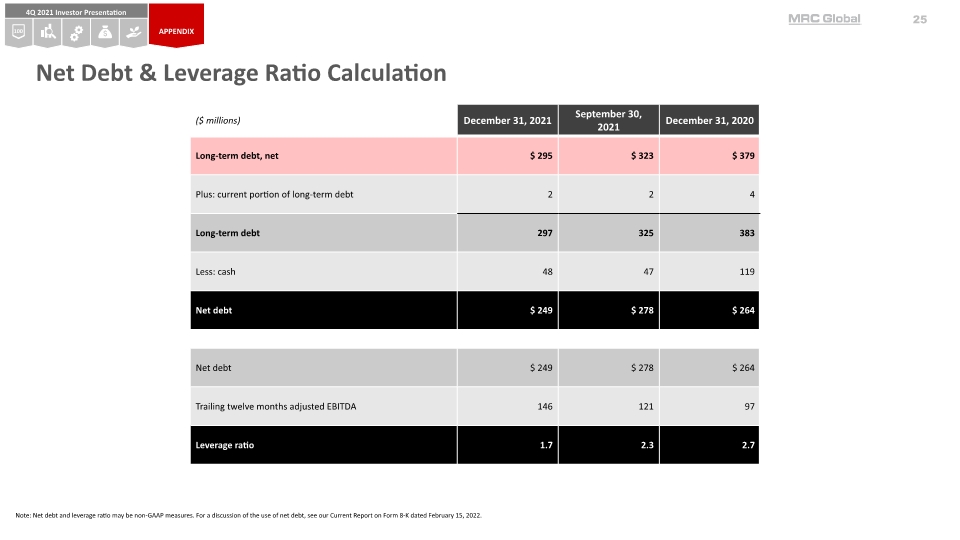
Note: Net debt and leverage ratio may be non-GAAP measures. For a discussion of the use of net debt, see our Current Report on Form 8-K dated February 15, 2022. Net Debt & Leverage Ratio Calculation APPENDIX


