Table of Contents
UNITED STATES
SECURITIES AND EXCHANGE COMMISSION
Washington, D.C. 20549
FORM 20-F
| ¨ | REGISTRATION STATEMENT PURSUANT TO SECTION 12(b) OR (g) OF THE SECURITIES EXCHANGE ACT OF 1934 |
OR
| x | ANNUAL REPORT PURSUANT TO SECTION 13 OR 15(d) OF THE SECURITIES EXCHANGE ACT OF 1934 |
For the fiscal year ended December 31, 2013
OR
| ¨ | TRANSITION REPORT PURSUANT TO SECTION 13 OR 15(d) OF THE SECURITIES EXCHANGE ACT OF 1934 |
OR
| ¨ | SHELL COMPANY REPORT PURSUANT TO SECTION 13 OR 15(d) OF THE SECURITIES EXCHANGE ACT OF 1934 |
Commission File Number: 001-34129
CENTRAIS ELÉTRICAS BRASILEIRAS S.A. – ELETROBRAS
(exact name of registrant as specified in its charter)
BRAZILIAN ELECTRIC POWER COMPANY
(translation of registrant’s name into English)
Federative Republic of Brazil
(jurisdiction of incorporation or organization)
Avenida Presidente Vargas, 409 – 9th floor, Edifício Herm. Stoltz – Centro, CEP 20071-003, Rio de Janeiro, RJ, Brazil
(address of principal executive offices)
Securities registered or to be registered pursuant to Section 12(b) of the Act:
Title of each class | Name of each exchange on which registered | |
| American Depositary Shares, evidenced by American Depositary Receipts, each representing one Common Share | New York Stock Exchange | |
| Common Shares, no par value* | New York Stock Exchange | |
| American Depositary Shares, evidenced by American Depositary Receipts, each representing one Class B Preferred Share | New York Stock Exchange | |
| Preferred Shares, no par value* | New York Stock Exchange | |
| * | Not for trading but only in connection with the registration of the American Depositary Shares pursuant to the requirements of the SEC. |
Securities registered or to be registered pursuant to Section 12(g) of the Act: None.
Securities for which there is a reporting obligation pursuant to Section 15(d) of the Act: None.
The number of outstanding shares of each of the issuer’s classes of capital or common stock as of December 31, 2013 was:
| 1,087,050,297 | Common Shares | |||||
| 146,920 | Class A Preferred Shares | |||||
| 2,252 | Class B Preferred Shares |
Indicate by check mark if the registrant is a well-known seasoned issuer, as defined in Rule 405 of the Securities Act. ¨ Yes x No
If this report is an annual or transition report, indicate by check mark if the registrant is not required to file reports pursuant to Section 13 or 15(d) of the Securities Exchange Act of 1934. ¨ Yes x No
Indicate by checkmark whether the registrant (1) has filed all reports required to be filed by Section 13 or 15(d) of the Securities Exchange Act of 1934 during the preceding 12 months (or for such shorter period that the registrant was required to file such reports), and (2) has been subject to such filing requirements for the past 90 days. x Yes ¨ No
Indicate by check mark whether the registrant has submitted electronically and posted on its corporate Web site, if any, every Interactive Data File required to be submitted and posted pursuant to Rule 405 of Regulation S-T (§232.405 of this chapter) during the preceding 12 months (or for such shorter period that the registrant was required to submit and post such files). Yes ¨ No x
Indicate by check mark whether the registrant is a large accelerated filer, or a non-accelerated filer. See definition of “accelerated filer and large accelerated filer” in Rule 12-b-2 of the Exchange Act.
Large accelerated filer x Accelerated filer ¨ Non accelerated filer ¨
Indicate by check mark which basis of accounting the registrant has used to prepare the financial statements included in this filing:
U.S. GAAP ¨ | IFRS x | Other ¨ |
Indicate by check mark which financial statement item the registrant has elected to follow. ¨ Item 17 x Item 18
If this is an annual report, indicate by check mark whether the registrant is a shell company (as defined in Rule 12b-2 of the Exchange Act.). ¨ Yes x No
Table of Contents
| Page | ||||||
ITEM 1. | 6 | |||||
ITEM 2. | 6 | |||||
ITEM 3. | 6 | |||||
ITEM 4. | 24 | |||||
ITEM 4A. | 70 | |||||
ITEM 5. | 70 | |||||
ITEM 6. | 92 | |||||
ITEM 7. | 97 | |||||
ITEM 8. | 99 | |||||
ITEM 9. | 100 | |||||
ITEM 10. | 109 | |||||
ITEM 11. | 121 | |||||
ITEM 12. | 122 | |||||
ITEM 12.D. | 122 | |||||
ITEM 13. | 123 | |||||
ITEM 14. | Material Modifications to the Rights of Security Holders and Use of Proceeds | 123 | ||||
ITEM 15. | 123 | |||||
ITEM 15T. | 125 | |||||
ITEM 16A. | 125 | |||||
ITEM 16B. | 125 | |||||
ITEM 16C. | 126 | |||||
ITEM 16D. | 126 | |||||
ITEM 16E. | Purchases of Equity Securities by the Issuer and Affiliated Purchasers | 127 | ||||
ITEM 16F. | 127 | |||||
ITEM 16G. | 127 | |||||
ITEM 17. | 127 | |||||
ITEM 18. | 127 | |||||
ITEM 19. | 128 | |||||
- i -
Table of Contents
PRESENTATION OF FINANCIAL AND OTHER INFORMATION
In this annual report, unless otherwise indicated or the context otherwise requires, all references to “we,” “our,” “ours,” “us” or similar terms refer to Centrais Elétricas Brasileiras S.A. – Eletrobras and its consolidated subsidiaries.
We prepare our consolidated annual financial statements in compliance with International Financial Reporting Standards (“IFRS”) as issued by the International Accounting Standards Board (“IASB”).
The last financial statements available under generally accepted accounting principles in the United States (“U.S. GAAP”) which were filed with the United States Securities and Exchange Commission were those for the year ended December 31, 2009.
Beginning in 2011, we adopted certain changes to the presentation of our consolidated financial statements in an effort to make the presentation in those financial statements of each company within our group more consistent. Accordingly, we added and deleted a limited number of line items in our balance sheet, income of statement and cash flow statement as of and for the years ended December 31, 2013, 2012 and 2011.
We restated our consolidated financial statements as of and for the year ended December 31, 2012 as a result of the adoption, on January 1, 2013 (with a corresponding restatement of the opening balance as of January 1, 2012), of IFRS 11 (Joint Arrangements), or IFRS 11. We retroactively applied IFRS 11 to 2012 for comparison purposes pursuant to IAS 8 (Accounting Policies, Changes in Accounting Estimates and Errors). The adoption of this new pronouncement impacted several line items of our consolidated financial statements relating to the method of accounting for the results of joint venture entities, which are now recognized using the equity method of accounting instead of the proportional consolidation method we used prior to our adoption of IFRS 11. See note 3C.1 to our consolidated financial statements for a description of this pronouncement and its impact on our consolidated financial statements. We applied IFRS 11 beginning with January 1, 2012, based on the issued amendments to IFRS 10, IFRS 11 and IFRS 12 revising the transition guidance to provide relief from full retrospective application. As a result of these amendments, we retroactively adjusted our consolidated financial statements for the annual period immediately preceding the date of initial application (January 1, 2013) (the “Immediately Preceding Period”). Consequently, our financial information as of and for the years ended December 31, 2013 and 2012 reflects the effects of IFRS 11 and these consolidated financial statements are fully comparable. As we were not required to, and did not, restate our consolidated financial statements as of and for the year ended December 31, 2011, with the exception of the assets and liabilities which were restated,these consolidated financial statements are not directly comparable to our consolidated financial statements as of and for the years ended December 31, 2013 and 2012.
In addition, for the year ended December 31, 2013, we changed our reportable segments to better portray the operations of each segment and to better reflect how we manage our business. Under the new reportable segment structure we will continue to segment our core operations in the Brazilian generation, transmission, and distribution markets; however, we will no longer eliminate inter-segment balances. This is a change from prior years, where we presented segment balances net of inter-segment eliminations. Our financial data as of December 31, 2011 were derived from our audited consolidated financial statements that are not included in this annual report. Because these consolidated financial statements, and the related financial data, were not restated to reflect the change in segment presentation described above, they are not comparable to our consolidated financial statements and the related financial data, as of and for the years ended December 31, 2013 and 2012 included in this annual report.
In this annual report, the term “Brazil” refers to the Federative Republic of Brazil and the phrase “Brazilian Government” refers to the federal government of Brazil. The term “Central Bank” refers to the Central Bank. The terms “real” and “reais” and the symbol “R$” refer to the legal currency of Brazil. The terms “U.S. dollar” and “U.S. dollars” and the symbol “U.S.$” refer to the legal currency of the United States of America.
Certain figures in this document have been subject to rounding adjustments. Accordingly, figures shown as totals in certain tables may not be an arithmetic aggregation of the figures that precede them.
Terms contained within this annual report have the following meanings:
| • | Eletrobras Amazonas Energia, orAmazonas Energia:Amazonas Energia S.A., a distribution company wholly owned by Eletrobras and operating in the State of Amazonas. Amazonas Energia was formed in 2008 as a result of the merger between Ceam and Manaus Energia S.A.; |
| • | ANDE: Administración Nacional de Electricidad; |
- 1 -
Table of Contents
| • | ANEEL:Agência Nacional de Energia Elétrica, the Brazilian Electric Power Agency; |
| • | Average tariff or rate: total sales revenue divided by total MWh sold for each relevant period, including unbilled electricity. Total sales revenue, for the purpose of computing average tariff or rate, includes both gross billings before deducting VAT and other taxes and unbilled electricity sales upon which such taxes have not yet accrued; |
| • | Basic Network: interconnected transmission lines, dams, energy transformers and equipment with voltage equal to or higher than 230 kV, or installations with lower voltage as determined by ANEEL; |
| • | BNDES: Banco Nacional de Desenvolvimento Econômico e Social, the Brazilian Development Bank; |
| • | Brazilian Corporate Law: Law No. 6,404 of December 15, 1976, as amended; |
| • | Capacity charge: the charge for purchases or sales based on contracted firm capacity whether or not consumed; |
| • | CCC Account:Conta de Consumo de Combustível, or Fuel Consumption Account; |
| • | CCEAR:Contratos de Comercialização de Energia no Ambiente Regulado, contracts for the commercialization of energy in the Regulated Market; |
| • | CDE Account:Conta de Desenvolvimento Energético, the energy development account; |
| • | Ceam:Eletrobras Amazonas Energia, a distribution company that used to operate in the State of Amazonas. In March 2008, Ceam merged with Manaus Energia S.A. The resulting entity is Amazonas Energia S.A.; |
| • | CGE:Câmara de Gestão da Crise de Energia Elétrica, the Brazilian Energy Crisis Management Committee; |
| • | Eletrobras CGTEE, orCGTEE:Companhia de Geração Térmica de Energia Elétrica, a generation subsidiary of Eletrobras; |
| • | CMN:Conselho Monetário Nacional, the highest authority responsible for Brazilian monetary and financial policy; |
| • | CNEN:Comissão Nacional de Energia Nuclear S.A., the Brazilian national commission for nuclear energy; |
| • | CNPE:Conselho Nacional de Política Energética, the advisory agency to the President of the Republic of Brazil for the formulation of policies and guidelines in the Energy sector; |
| • | Concessionairesor concessionaire companies: companies to which the Brazilian Government transfers rights to supply electrical energy services (generation, transmission, distribution) to a particular region in accordance with agreements entered into between the companies and the Brazilian Government pursuant to Law No. 8,987 (dated February 1995), as amended, and Law No. 9,074 (the Power Sector Law, dated July 7, 1995), as amended (together, the “Concessions Laws”); |
| • | Distribution: the transfer of electricity from the transmission lines at grid supply points and its delivery to consumers through a distribution system. Electricity reaches consumers such as residential consumers, small industries, commercial properties and public utilities at a voltage of 220/127 volts; |
| • | Distributor: an entity supplying electrical energy to a group of customers by means of a distribution network; |
| • | DNAEE:Departamento National de Águas e Energia Elétrica, the Brazilian national department of water and electrical energy; |
| • | Electricity Regulatory Law: Law No. 10,848 (Lei do Novo Modelo do Setor Elétrico), enacted on March 15, 2004, as amended, and which regulates the operations of companies in the electricity industry; |
| • | Eletrobras Distribuição Alagoas, orDistribuição Alagoas:Companhia Energética de Alagoas, a distribution company operating in the State of Alagoas (Ceal); |
| • | Cepel:Centro de Pesquisas de Energia Elétrica, a research center of the Brazilian electric sector; |
| • | Eletrobras:Centrais Elétricas Brasileiras S.A. – Eletrobras; |
| • | Eletrobras Chesf, orChesf:Companhia Hidro Elétrica do São Francisco, a generation and transmission subsidiary of Eletrobras; |
| • | Eletrobras Distribuição Acre, orDistribuição Acre:Companhia de Eletricidade de Acre, a distribution company operating in the State of Acre (Eletroacre); |
| • | Eletrobras Distribuição Piauí, orDistribuição Piauí:Companhia Energética de Piauí, a distribution company operating in the State of Piauí (Cepisa); |
| • | Eletrobras Distribuição Rondônia, orDistribuição Rondônia:Centrais Elétricas de Rondônia, a distribution company operating in the State of Rondônia (Ceron); |
- 2 -
Table of Contents
| • | Eletrobras Distribuição Roraima, orDistribuição Roraima,formally known as Boa Vista Energia S.A.,a distribution company operating in the city of Boa Vista, in the State of Roraima; |
| • | Eletrobras Eletronorte, orEletronorte:Centrais Elétricas do Norte do Brasil S.A., a generation and transmission subsidiary of Eletrobras; |
| • | Eletrobras Eletronuclear, orEletronuclear:Eletrobras Termonuclear S.A., a generation subsidiary of Eletrobras; |
| • | Eletrobras Eletropar, orEletropar:Eletrobras Participações S.A., a holding company subsidiary created to hold equity investments (formerly,Light Participações S.A. – LightPar); |
| • | Eletrobras Eletrosul, orEletrosul:Eletrosul Centrais Elétricas S.A., a generation and transmission subsidiary of Eletrobras; |
| • | Eletrobras Furnas, orFurnas:Furnas Centrais Elétricas S.A., a generation and transmission subsidiary of Eletrobras; |
| • | Energy charge: the variable charge for purchases or sales based on actual electricity consumed; |
| • | Environmental Crimes Act: Law No. 9,605, dated February 12, 1998, as amended; |
| • | Final consumer (end user): a party who uses electricity for its own needs; |
| • | FND:Fundo National do Desestatização, the national privatization fund; |
| • | Free consumers: customers that were connected to the system after July 8, 1995 and have a contracted demand above 3 MW at any voltage level; or customers that were connected to the system prior to July 8, 1995 and have a contracted demand above 3 MW at voltage level higher than or equal to 69 kV; |
| • | Gigawatt ( GW): one billion watts; |
| • | Gigawatt hour ( GWh): one gigawatt of power supplied or demanded for one hour, or one billion watt hours; |
| • | High voltage: a class of nominal system voltages equal to or greater than 100,000 volts (100 kVs) and less than 230,000 volts (230 kVs); |
| • | Hydroelectric plantor hydroelectric facility or hydroelectric power unity (HPU): a generating unit that uses water power to drive the electric generator; |
| • | IRFS: International Financial Reporting Standards as issued by the International Accounting Standards Board; |
| • | IGP-M:Índice Geral de Precos-Mercado, the Brazilian general market price index, similar to the retail price index; |
| • | INB:Indústrias Nucleares Brasileiras, a Brazilian Government-owned company responsible for processing uranium used as power to provide electricity at Angra I and Angra II Nuclear Plants; |
| • | Installed capacity: the level of electricity which can be delivered from a particular generating unit on a full-load continuous basis under specified conditions as designated by the manufacturer; |
| • | Interconnected Power System: systems or networks for the transmission of energy, connected together by means of one or more links (lines and/or transformers); |
| • | Isolated system: generation facilities in the North of Brazil not connected to the national transmission grid; |
| • | Itaipu:Itaipu Binacional, the hydroelectric generation facility owned equally by Brazil and Paraguay; |
| • | Kilowatt (kW): 1,000 watts; |
| • | Kilowatt Hour (kWh): one kilowatt of power supplied or demanded for one hour; |
| • | Kilovolt (kV): one thousand volts; |
| • | Megawatt (MW): one million watts; |
| • | Megawatt hour (MWh): one megawatt of power supplied or demanded for one hour, or one million watt hours; |
| • | Mixed capital company: pursuant to Brazilian Corporate Law, a company with public and private sector shareholders, but controlled by the public sector; |
| • | MME:Ministério de Minas e Energia, the Brazilian Ministry of Mines and Energy; |
| • | MRE:Mercado Regulado de Energia, the Brazilian Energy Regulated Market; |
| • | National Environmental Policy Act: Law No. 6,938, dated August 31, 1981, as amended; |
- 3 -
Table of Contents
| • | Northeast region: the States of Alagoas, Bahia, Ceará, Maranhão, Paraíba, Pernambuco, Piauí, Rio Grande do Norte and Sergipe; |
| • | ONS:Operador Nacional do Sistema, the national system operator; |
| • | Power Sector Law: Law No. 9,074 of July 7, 1997, as amended; |
| • | Procel:Programa Nacional de Combate ao Desperdício de Energia Elétrica, the national electrical energy conservation program; |
| • | Proinfa:Programa de Incentivo às Fontes Alternativas de Energia, the program for incentives to develop alternative energy sources; |
| • | RGR Fund:Reserva Global de Reversão, a fund we administer, funded by consumers and providing compensation to all concessionaires for non-renewal or expropriation of their concessions used as source of funds for the expansion and improvement of the electrical energy sector; |
| • | Selic rate: an official overnight government rate applied to funds traded through the purchase and sale of public debt securities established by the special system for custody and settlement; |
| • | Small Hydroelectric Power Plants: power plants with capacity from 1 MW to 30 MW; |
| • | Substation: an assemblage of equipment which switches and/or changes or regulates the voltage of electricity in a transmission and distribution system; |
| • | TFSEE:Taxa de Fiscalização de Serviços de Energia Elétrica, the fee for the supervision of electricity energy services; |
| • | Thermoelectric plant or thermoelectric power unity (TPU): a generating unit which uses combustible fuel, such as coal, oil, diesel natural gas or other hydrocarbon as the source of energy to drive the electric generator; |
| • | Transmission: the bulk transfer of electricity from generating facilities to the distribution system at load center station by means of the transmission grid (in lines with capacity between 69 kV and 525 kV); |
| • | TWh: Terawatt hour (1,000 Gigawatt hours); |
| • | UBP Fund:Fundo de Uso de Bem Publico, the public asset use fund; |
| • | U.S. GAAP: generally accepted accounting principles in the United States; |
| • | Volt (V): the basic unit of electric force analogous to water pressure in pounds per square inch; and |
| • | Watt: the basic unit of electrical power. |
CAUTIONARY STATEMENT REGARDING FORWARD-LOOKING INFORMATION
This annual report includes certain forward-looking statements, including statements regarding our intent, belief or current expectations or those of our officers with respect to, among other things, our financing plans, trends affecting our financial condition or results of operations and the impact of future plans and strategies. These forward-looking statements are subject to risks, uncertainties and contingencies including, but not limited to, the following:
| • | general economic, regulatory, political and business conditions in Brazil and abroad; |
| • | interest rate fluctuations, inflation and the value of thereal in relation to the U.S. dollar; |
| • | changes in volumes and patterns of customer electricity usage; |
| • | competitive conditions in Brazil’s electricity generation, transmission and distribution markets; |
| • | the effects of competition; |
| • | our level of debt; |
| • | the likelihood that we will receive payment in connection with account receivables; |
| • | changes in rainfall and the water levels in the reservoirs used to run our hydroelectric power generation facilities; |
| • | our financing and capital expenditure plans; |
| • | our ability to serve our customers on a satisfactory basis; |
| • | existing and future governmental regulation as to electricity rates, electricity usage, competition in our concession area and other matters; |
| • | our ability to execute our business strategy, including our growth strategy; |
- 4 -
Table of Contents
| • | adoption of measures by the granting authorities in connection with our concession agreements; |
| • | changes in other laws and regulations, including, among others, those affecting tax and environmental matters; |
| • | future actions that may be taken by the Brazilian Government, our controlling shareholder; |
| • | the outcome of our tax, civil and other legal proceedings; and |
| • | other risk factors as set forth under “Item 3.D, Risk Factors.” |
The forward-looking statements referred to above also include information with respect to our capacity expansion projects that are in the planning and development stages. In addition to the above risks and uncertainties, our potential expansion projects involve engineering, construction, regulatory and other significant risks, which may:
| • | delay or prevent successful completion of one or more projects; |
| • | increase the costs of projects; and |
| • | result in the failure of facilities to operate or generate income in accordance with our expectations. |
The words “believe,” “may,” “will,” “estimate,” “continue,” “anticipate,” “intend,” “expect” and similar words are intended to identify forward-looking statements. We undertake no obligation to update publicly or revise any forward-looking statements as a result of new information, future events or otherwise. In light of these risks and uncertainties, the forward-looking information, events and circumstances discussed in this annual report might not occur. Our actual results and performance could differ substantially from those anticipated in our forward-looking statements.
- 5 -
Table of Contents
PART I
ITEM 1. IDENTITY OF DIRECTORS, SENIOR MANAGEMENT AND ADVISERS
Not applicable.
ITEM 2. OFFER STATISTICS AND EXPECTED TIMETABLE
Not applicable.
Background
The tables below contain a summary of our financial data as of and for years ended December 31, 2013, 2012, 2011, 2010 and 2009. Our financial data as of December 31, 2013 and 2012 and as of January 1, 2012 and for the two years ended December 31, 2013 were derived from our consolidated financial statements, which appear elsewhere in this annual report prepared in accordance with IFRS, as issued by the IASB. As in “Presentation of Financial and Other Information” and in further detail in note 3C.1 to our audited consolidated financial statements, we restated our financial data as of and for the year ended December 31, 2012 as a result of the retroactive adoption of IFRS 11. You should read our selected financial data in conjunction with our financial statements and the related notes included in this annual report. Our financial data as of December 31, 2010 and 2009 and for the three years ended December 31, 2011 were derived from our audited consolidated financial statements that are not included in this annual report. Because we did not restate these consolidated financial statements, and the related financial data to reflect the adoption of IFRS 11, they are not comparable to our consolidated financial statements and the financial data as of and for the years ended December 31, 2013 and 2012.
The following paragraphs discuss some important features of the presentation of the selected financial information and our consolidated financial statements. These features should be considered when evaluating the selected financial information.
A. Selected Financial Data
Consolidated Balance Sheet Information
| As of December 31, | ||||||||||||||||||||
| 2013 | 2012(1) | 2011(1) | 2010(2) | 2009(2) | ||||||||||||||||
| (R$ thousands) | ||||||||||||||||||||
Assets | ||||||||||||||||||||
Current | ||||||||||||||||||||
Cash and cash equivalents | 3,597,583 | 2,501,515 | 3,109,844 | 9,220,169 | 8,617,294 | |||||||||||||||
Restricted cash | 879,801 | 3,509,323 | 3,034,638 | 2,058,218 | 1,341,719 | |||||||||||||||
Marketable securities | 6,095,908 | 6,352,791 | 11,031,953 | 6,774,073 | 7,662,640 | |||||||||||||||
Accounts Receivable | 3,587,282 | 4,082,695 | 4,069,402 | 3,779,930 | 3,102,079 | |||||||||||||||
Financial asset of concession agreements | 1,168,002 | 318,293 | 1,271,365 | 1,723,522 | 1,570,376 | |||||||||||||||
Loans and financings | 2,838,503 | 2,611,830 | 2,622,304 | 1,359,269 | 1,926,193 | |||||||||||||||
Fuel consumption account – CCC | 1,275,334 | 1,240,811 | 1,184,936 | 1,428,256 | 877,833 | |||||||||||||||
Investment remuneration | 268,060 | 167,197 | 215,823 | 178,604 | 78,726 | |||||||||||||||
Recoverable taxes | 839,767 | 1,498,726 | 999,405 | 1,825,905 | 1,326,933 | |||||||||||||||
Income Tax and Social Contribution | 1,940,005 | 1,227,005 | 898,788 | — | — | |||||||||||||||
Reimbursement rights | 10,910,073 | 7,302,160 | 3,498,606 | 1,704,239 | 221,519 | |||||||||||||||
Warehouse (storeroom) | 614,607 | 446,157 | 350,572 | 378,637 | 350,470 | |||||||||||||||
Stock of nuclear fuel | 343,730 | 360,751 | 388,663 | 297,972 | 324,634 | |||||||||||||||
Indemnifications – Law 12,783 | 3,476,495 | 8,882,836 | — | — | — | |||||||||||||||
Financial instruments | 108,339 | 249,265 | 191,919 | 283,220 | 227,540 | |||||||||||||||
Other | 1,136,345 | 1,118,481 | 1,099,953 | 1,557,857 | 1,173,270 | |||||||||||||||
|
|
|
|
|
|
|
|
|
| |||||||||||
Total current assets | 39,079,834 | 41,869,836 | 33,968,171 | 32,569,871 | 28,801,226 | |||||||||||||||
|
|
|
|
|
|
|
|
|
| |||||||||||
Non-current | ||||||||||||||||||||
Long term assets | ||||||||||||||||||||
Reimbursement rights | 1,669,583 | 901,029 | 500,333 | 371,599 | 99,178 | |||||||||||||||
Loans and financings | 12,335,838 | 12,932,963 | 12,993,679 | 8,300,171 | 9,839,828 | |||||||||||||||
Accounts receivable | 1,310,821 | 1,256,685 | 1,295,180 | 1,706,292 | 1,431,080 | |||||||||||||||
Marketable securities | 192,580 | 400,370 | 385,966 | 769,905 | 687,188 | |||||||||||||||
Stock of nuclear fuel | 507,488 | 481,495 | 435,633 | 523,957 | 755,434 | |||||||||||||||
Recoverable taxes | 1,990,527 | 1,737,406 | 2,293,344 | 4,338,682 | 4,493,223 | |||||||||||||||
Income Tax and Social Contribution | 3,010,574 | 4,854,337 | 3,059,529 | — | — | |||||||||||||||
Judicial deposit | 2,877,516 | 2,691,114 | 2,105,335 | 1,750,678 | 1,521,317 | |||||||||||||||
Fuel consumption account – CCC | 16,275 | 521,097 | 727,136 | 785,327 | 1,173,580 | |||||||||||||||
Financial asset of concession of agreements | 23,704,037 | 22,915,696 | 26,881,123 | 40,643,712 | 39,096,939 | |||||||||||||||
- 6 -
Table of Contents
| As of December 31, | ||||||||||||||||||||
| 2013 | 2012(1) | 2011(1) | 2010(2) | 2009(2) | ||||||||||||||||
| (R$ thousands) | ||||||||||||||||||||
Financial instruments | 107,816 | 223,099 | 185,031 | 297,020 | 228,020 | |||||||||||||||
Advances for future capital increase | 490,429 | 70,423 | 4,000 | 7,141 | 4,000 | |||||||||||||||
Indemnifications – Law 12,783 | 2,019,684 | 5,554,435 | — | — | — | |||||||||||||||
Other | 830,309 | 647,682 | 604,731 | 1,165,529 | 666,967 | |||||||||||||||
|
|
|
|
|
|
|
|
|
| |||||||||||
| 51,063,477 | 55,187,831 | 51,471,020 | 60,660,013 | 59,996,755 | ||||||||||||||||
|
|
|
|
|
|
|
|
|
| |||||||||||
Investments | 17,414,994 | 14,677,150 | 11,124,380 | 4,724,647 | 5,288,107 | |||||||||||||||
Property, plant and equipment | 30,038,514 | 29,494,833 | 41,552,365 | 46,682,498 | 41,597,605 | |||||||||||||||
Intangible assets | 788,582 | 1,204,563 | 1,287,880 | 2,263,972 | 2,024,683 | |||||||||||||||
|
|
|
|
|
|
|
|
|
| |||||||||||
Total non-current assets | 99,305,567 | 100,564,377 | 105,435,645 | 53,671,117 | 48,910,395 | |||||||||||||||
|
|
|
|
|
|
|
|
|
| |||||||||||
Total assets | 138,385,401 | 142,434,213 | 139,403,816 | 146,901,001 | 137,708,376 | |||||||||||||||
|
|
|
|
|
|
|
|
|
| |||||||||||
| (1) | Data for 2012 and as of and for the year ended December 31, 2012 and the opening balance January 1, 2012, have been restated to reflect the application of IFRS 11, as described in note 3C.1 to our consolidated financial statements. |
| (2) | We have not restated data for 2010 and 2009 to reflect the application of IFRS 11, as described in note 3C.1 to our financial statements. |
| As of December 31, | ||||||||||||||||||||
| 2013 | 2012(1) | 2011(1) | 2010(2) | 2009(2) | ||||||||||||||||
| (R$ thousands) | ||||||||||||||||||||
Liabilities and shareholders’ equity | ||||||||||||||||||||
Current | ||||||||||||||||||||
Borrowings | 1,969,765 | 1,337,279 | 1,637,864 | 1,868,465 | 1,115,274 | |||||||||||||||
Debentures | 12,804 | 1,305 | — | — | — | |||||||||||||||
Financial Liability | — | 787,115 | — | — | — | |||||||||||||||
Compulsory loan | 7,935 | 12,298 | 16,331 | 16,925 | 13,675 | |||||||||||||||
Suppliers | 7,740,578 | 6,423,074 | 5,487,947 | 5,165,765 | 3,079,614 | |||||||||||||||
Advances from clients | 511,582 | 469,892 | 413,041 | 341,462 | 63,400 | |||||||||||||||
Payable Taxes | 839,426 | 814,422 | 819,776 | 1,102,672 | 963,365 | |||||||||||||||
Income Tax and Social Contribution | 15,262 | 313,888 | 130,409 | — | — | |||||||||||||||
Fuel consumption account – CCC | 941,285 | 1,369,201 | 3,079,796 | 2,579,546 | 923,535 | |||||||||||||||
Shareholders’ remuneration | 528,204 | 3,952,268 | 4,350,509 | 3,424,520 | 3,214,450 | |||||||||||||||
National Treasury Credits | 39,494 | 131,047 | 109,050 | 92,770 | 76,036 | |||||||||||||||
Estimated liabilities | 1,288,713 | 1,173,678 | 772,880 | 772,071 | 672,214 | |||||||||||||||
Reimbursement Obligations | 8,377,400 | 5,988,698 | 1,955,966 | 759,214 | 857,001 | |||||||||||||||
Post-Employment Benefits | 265,082 | 127,993 | 446,366 | 330,828 | 351,149 | |||||||||||||||
Provision for contingencies | 23,654 | 28,695 | 30,827 | 257,580 | 252,708 | |||||||||||||||
Regulatory fees | 714,862 | 654,230 | 625,069 | 584,240 | 589,433 | |||||||||||||||
Leasing | 181,596 | 162,929 | 142,997 | 120,485 | 108,827 | |||||||||||||||
Concessions payable | 3,567 | 1,870 | — | 25,098 | — | |||||||||||||||
Derivative financial instruments | 225,423 | 185,031 | 261,489 | 237,209 | 40,050 | |||||||||||||||
Other | 2,011,257 | 1,399,559 | 849,860 | 690,661 | 949,116 | |||||||||||||||
|
|
|
|
|
|
|
|
|
| |||||||||||
Total current liabilities | 25,697,889 | 25,334,472 | 21,130,177 | 18,369,511 | 13,269,847 | |||||||||||||||
|
|
|
|
|
|
|
|
|
| |||||||||||
Non-current | ||||||||||||||||||||
Borrowings | 30,506,522 | 25,292,871 | 22,377,889 | 31,269,971 | 28,392,542 | |||||||||||||||
National Treasury credits | — | 37,072 | 155,676 | 250,485 | 311,306 | |||||||||||||||
Suppliers | 791,293 | — | — | — | — | |||||||||||||||
Debentures | 205,878 | 68,015 | — | 710,536 | — | |||||||||||||||
Advances from clients | 776,252 | 830,234 | 879,452 | 928,653 | 978,980 | |||||||||||||||
Compulsory loan | 358,905 | 321,894 | 211,554 | 141,425 | 127,358 | |||||||||||||||
Decommission obligations | 1,136,342 | 988,490 | 408,712 | 375,968 | 323,326 | |||||||||||||||
Operational provision | 1,061,490 | 1,005,908 | 843,029 | — | — | |||||||||||||||
Fuel consumption account – CCC | 455,455 | 2,401,069 | 954,013 | 785,327 | 1,344,380 | |||||||||||||||
Provision for contingencies | 5,695,104 | 5,100,389 | 4,441,168 | 3,901,289 | 3,528,917 | |||||||||||||||
Post-Employment Benefits | 1,218,688 | 2,774,791 | 985,185 | 2,066,702 | 1,992,012 | |||||||||||||||
Onerous contracts | 3,244,335 | 5,155,524 | 96,204 | — | — | |||||||||||||||
Reimbursement obligations | 2,317,798 | 1,801,059 | 1,475,262 | 1,091,271 | 435,548 | |||||||||||||||
Leasing | 1,891,628 | 1,860,104 | 1,775,544 | 1,694,547 | 1,639,448 | |||||||||||||||
Shareholders’ remuneration | — | — | 3,143,222 | 5,601,077 | 7,697,579 | |||||||||||||||
- 7 -
Table of Contents
| As of December 31, | ||||||||||||||||||||
| 2013 | 2012(1) | 2011(1) | 2010(2) | 2009(2) | ||||||||||||||||
| (R$ thousands) | ||||||||||||||||||||
Concessions payable | 60,904 | 71,180 | 63,430 | 1,089,726 | 761,131 | |||||||||||||||
Advances for future capital increase | 174,570 | 161,308 | 171,135 | 5,173,856 | 4,712,825 | |||||||||||||||
Derivative financial instruments | 232,226 | 291,252 | 185,031 | 303,331 | 228,020 | |||||||||||||||
Regulatory Fees | 375,982 | 428,383 | 392,134 | — | — | |||||||||||||||
Payable Taxes | 892,950 | 620,397 | 1,081,873 | 1,217,649 | 1,273,890 | |||||||||||||||
Income tax and Social Contribution | 533,713 | 598,750 | 572,425 | — | — | |||||||||||||||
Other | 68,659 | 10,458 | 844,533 | 1,399,267 | 1,312,220 | |||||||||||||||
|
|
|
|
|
|
|
|
|
| |||||||||||
Total non-current liabilities | 51,998,604 | 49,819,148 | 41,057,471 | 58,001,080 | 55,059,480 | |||||||||||||||
|
|
|
|
|
|
|
|
|
| |||||||||||
Shareholders’ equity | ||||||||||||||||||||
Share capital | 31,305,331 | 31,305,331 | 31,305,331 | 26,156,567 | 26,156,567 | |||||||||||||||
Capital reserves | 26,048,342 | 26,048,342 | 26,048,342 | 26,048,342 | 26,048,342 | |||||||||||||||
Profit reserves | 4,334,565 | 11,361,225 | 19,095,822 | 17,329,661 | 15,663,924 | |||||||||||||||
Asset valuation adjustment | 68,368 | 208,672 | 220,915 | 163,335 | 179,427 | |||||||||||||||
Additional Proposed Dividend | 433,962 | 433,962 | 706,018 | 753,201 | 370,755 | |||||||||||||||
Other comprehensive income | (1,696,858 | ) | (2,273,587 | ) | (532,919 | ) | (146,992 | ) | 827,491 | |||||||||||
Non-controlling shareholders’ interest | 195,198 | 196,648 | 372,659 | 226,296 | 132,543 | |||||||||||||||
|
|
|
|
|
|
|
|
|
| |||||||||||
Total shareholders’ equity | 60,688,908 | 67,280,593 | 77,216,168 | 70,530,410 | 69,379,050 | |||||||||||||||
|
|
|
|
|
|
|
|
|
| |||||||||||
Total liabilities and shareholders’ equity | 138,385,401 | 142,434,213 | 139,403,816 | 146,901,001 | 137,708,376 | |||||||||||||||
|
|
|
|
|
|
|
|
|
| |||||||||||
| (1) | Data for 2012 and as of and for the year ended December 31, 2012 and the opening balance January 1, 2012, have been restated to reflect the application of IFRS 11, as described in note 3C.1 to our consolidated financial statements. |
| (2) | We have not restated data for 2010 and 2009 to reflect the application of IFRS 11, as described in note 3C.1 to our financial statements. |
Consolidated Income Statement
| For the year ended December 31, | ||||||||||||||||||||
| 2013 | 2012(1) | 2011(2) | 2010(2) | 2009(2) | ||||||||||||||||
| (R$ thousands) | ||||||||||||||||||||
Net operating revenue | 23,835,644 | 28,014,296 | 29,532,744 | 26,832,085 | 23,140,905 | |||||||||||||||
Operating expenses | ||||||||||||||||||||
Personnel, supplies and services | 9,244,586 | 7,670,823 | 7,670,716 | 7,370,713 | 6,486,218 | |||||||||||||||
Electricity purchased for reselling | 5,515,206 | 4,863,288 | 3,386,289 | 4,315,084 | 3,581,396 | |||||||||||||||
Charges upon use of electric network | 1,560,883 | 1,586,809 | 1,420,934 | 1,353,839 | 1,263,408 | |||||||||||||||
Construction - Distribution | 1,013,684 | 1,345,519 | 711,740 | 810,475 | 361,709 | |||||||||||||||
Construction – Transmission | 1,797,324 | 1,960,474 | 3,567,868 | 2,143,009 | 1,362,251 | |||||||||||||||
Construction – Generation | 736,855 | — | — | — | — | |||||||||||||||
Fuel for electricity production | 1,492,368 | 693,751 | 162,673 | 252,502 | 756,285 | |||||||||||||||
Remuneration and reimbursement | 405,809 | 667,923 | 1,328,994 | 1,087,341 | 1,188,032 | |||||||||||||||
Depreciation | 1,285,351 | 1,528,692 | 1,549,988 | 1,498,059 | 1,499,117 | |||||||||||||||
Amortization | 215,189 | 160,269 | 173,897 | 94,417 | 125,129 | |||||||||||||||
Operating provisions | 3,258,205 | 4,971,221 | 2,848,749 | 2,497,262 | 2,140,406 | |||||||||||||||
Donations and contributions | 332,031 | 379,002 | 289,964 | 261,006 | 237,978 | |||||||||||||||
Voluntary Redundancy Scheme | 256,860 | — | — | — | — | |||||||||||||||
Other | 2,089,704 | 1,814,116 | 2,278,090 | 1,406,761 | 1,658,656 | |||||||||||||||
| 29,204,055 | 27,641,887 | 25,389,902 | 23,090,468 | 20,660,585 | ||||||||||||||||
Operating result before financial result | (5,368,411 | ) | 372,409 | 4,142,842 | 3,741,617 | 2,480,320 | ||||||||||||||
Financial result | ||||||||||||||||||||
Financial revenue | ||||||||||||||||||||
Revenue from interest, commissions and fees | 1,146,055 | 1,172,031 | 757,450 | 781,872 | 1,035,487 | |||||||||||||||
Revenue from financial investments | 556,469 | 1,565,875 | 1,664,517 | 1,537,435 | 1,464,782 | |||||||||||||||
Arrears surcharge on electricity | 305,404 | 230,597 | 359,208 | 393,987 | 228,145 | |||||||||||||||
Monetary restatement | 454,634 | 720,816 | 652,949 | 616,141 | 356,023 | |||||||||||||||
Exchange rate variation gain | 539,059 | 460,559 | 669,731 | — | — | |||||||||||||||
- 8 -
Table of Contents
| For the year ended December 31, | ||||||||||||||||||||
| 2013 | 2012(1) | 2011(2) | 2010(2) | 2009(2) | ||||||||||||||||
| (R$ thousands) | ||||||||||||||||||||
Remuneration for indemnification - Law 12,783 | 441,024 | 211,532 | — | — | — | |||||||||||||||
Other financial revenues | 269,666 | 297,411 | 158,471 | 394,890 | 736,766 | |||||||||||||||
Financial expenses | ||||||||||||||||||||
Debt charges | (2,031,402 | ) | (1,420,938 | ) | (1,708,670 | ) | (1,675,821 | ) | (1,758,473 | ) | ||||||||||
Leasing charges | (379,771 | ) | (412,152 | ) | (350,861 | ) | (332,449 | ) | (213,470 | ) | ||||||||||
Charges on shareholders’ resources | (189,967 | ) | (502,178 | ) | (1,178,989 | ) | (1,298,647 | ) | (1,468,713 | ) | ||||||||||
Losses on derivatives | (238,938 | ) | — | — | — | — | ||||||||||||||
Exchange rate variation loss | — | — | — | (431,497 | ) | (4,018,643 | ) | |||||||||||||
Other financial expenses | — | — | — | — | — | |||||||||||||||
|
|
|
|
|
|
|
|
|
| |||||||||||
| 265,946 | 1,684,475 | 234,453 | (364,122 | ) | (3,638,097 | ) | ||||||||||||||
Result/loss before participation in associates and other investments | (5,102,465 | ) | 2,056,884 | 4,056,037 | 3,377,495 | (1,157,777 | ) | |||||||||||||
Result of participation in associates and other investments | 177,768 | 612,202 | 482,785 | 669,755 | 1,571,032 | |||||||||||||||
Income before effects of Law 12,783 | (4,924,697 | ) | 2,669,086 | 4,538,822 | 4,047,250 | 413,255 | ||||||||||||||
Effects – Law 12,783 | — | (10,085,380 | ) | — | — | — | ||||||||||||||
Income before income tax and social contribution | (4,924,697 | ) | (7,416,294 | ) | 4,538,822 | 4,047,250 | 413,255 | |||||||||||||
Income tax and Social Contribution | (1,366,678 | ) | 490,642 | (776,803 | ) | (1,494,265 | ) | 836,885 | ||||||||||||
|
|
|
|
|
|
|
|
|
| |||||||||||
Net income (loss) for the year | (6,291,375 | ) | (6,925,652 | ) | 3,762,019 | 2,552,985 | 1,250,140 | |||||||||||||
|
|
|
|
|
|
|
|
|
| |||||||||||
Attributable to controlling shareholders | (6,286,663 | ) | (6,878,916 | ) | 3,732,565 | 2,247,913 | 911,467 | |||||||||||||
Attributable to non-controlling shareholders | (4,712 | ) | (46,736 | ) | 29,454 | 305,072 | 338,673 | |||||||||||||
| (1) | Data for 2012 and as of and for the year ended December 31, 2012, have been restated to reflect the application of IFRS 11, as described in note 3C.1 to our consolidated financial statements. With respect to IFRS 11, we recognized the results of our joint venture entities using the equity method of accounting in 2013 and 2012 and as of and for the year ended December 31, 2012 rather than through the proportional consolidation method we applied previously. |
| (2) | We have not restated data for 2011, 2010 and 2009 to reflect the application of IFRS 11, as described in note 3C.1 to our financial statements. In particular, data for 2013 and 2012 reflect the results of our joint venture entities through proportional consolidation in 2011, 2010 and 2009, as opposed to the equity method of accounting applicable in 2013 and 2012. |
Brazilian Corporate Law and our by-laws provide that we must pay our shareholders mandatory dividends equal to at least 25% of our adjusted net income for the preceding fiscal year. In addition, our by-laws require us to give: (i) class “A” preferred shares a priority in the distribution of dividends, at 8% each year over the capital linked to those shares; and (ii) class “B” preferred shares that were issued on or after June 23, 1969 a priority in the distribution of dividends, at 6% each year over the capital linked to those shares. In addition, preferred shares must receive a dividend 10% over the dividend paid to the common shares.
The following table sets out our declared dividends for the periods indicated:
| Year | ||||||||||||
| 2013(1) | 2012(1) | 2011(1) | ||||||||||
| (R$) | ||||||||||||
Common Shares | 0.40 | 0.40 | 1.23 | |||||||||
Class A Preferred Shares | 2.18 | 2.18 | 2.17 | |||||||||
Class B Preferred Shares | 1.63 | 1.63 | 1.63 | |||||||||
| (1) | Interest on own capital. |
- 9 -
Table of Contents
The following table sets forth a summary of dividends/interest on own capital declared per share for the periods presented, both at the time declared and as adjusted for our 500:1 reverse stock split effected in 2007.
Dividend per Share
| Declared | Paid(2) | |||||||||||||||||||||||||||||||
| On 12/31/2007 | Equivalent on 08/20/2007(1) | On 06/30/2008 | Equivalent on 08/20/2007(1) | |||||||||||||||||||||||||||||
| R$ | U.S.$ | R$ | U.S.$ | R$ | U.S.$ | R$ | U.S.$ | |||||||||||||||||||||||||
Common | 0.40155520020 | 0.22670084130 | 0.40155520020 | 0.22670084130 | 0.423339988 | 0.265933782 | 0.423339988 | 0.265933782 | ||||||||||||||||||||||||
Preferred A | 2.01949731106 | 1.14012155539 | 2.01949731106 | 1.14012155539 | 2.129057146 | 1.337431463 | 2.129057146 | 1.337431463 | ||||||||||||||||||||||||
Preferred B | 1.51462298231 | 0.85509116599 | 1.51462298231 | 0.85509116599 | 1.596792859 | 1.003073597 | 1.596792859 | 1.003073597 | ||||||||||||||||||||||||
| Declared | Paid(2) | |||||||||||||||||||||||||||||||
| On 12/31/2008 | Equivalent on 08/20/2007(1) | On 05/20/2009 | Equivalent on 08/20/2007(1) | |||||||||||||||||||||||||||||
| R$ | U.S.$ | R$ | U.S.$ | R$ | U.S.$ | R$ | U.S.$ | |||||||||||||||||||||||||
Common | 1.484883733 | 0.635380288 | 1.484883733 | 0.635380288 | 1.548692924 | 0.662684178 | 1.548692924 | 0.662684178 | ||||||||||||||||||||||||
Preferred A | 2.174044374 | 0.930271448 | 2.174044374 | 0.930271448 | 2.267468532 | 0.970247553 | 2.267468532 | 0.970247553 | ||||||||||||||||||||||||
Preferred B | 1.630533280 | 0.697703586 | 1.630533280 | 0.697703586 | 1.703562217 | 0.728952596 | 1.703562217 | 0.728952596 | ||||||||||||||||||||||||
| Declared | Paid(2) | Declared | Paid | |||||||||||||||||||||||||||||
| On 12/31/2009 | On 05/18/2010 | On 12/31/2010 | On 06/29/2011 | |||||||||||||||||||||||||||||
| R$ | U.S.$ | R$ | U.S.$ | R$ | U.S.$ | R$ | U.S.$ | |||||||||||||||||||||||||
Common | 0.4096631540 | 0.713305484 | 0.422548776 | 0.235784150 | 0.832245170 | 1.386686902 | 0.877358220 | 1.380084480 | ||||||||||||||||||||||||
Preferred A | 2.1740443750 | 3.785446066 | 2.242427174 | 1.251284624 | 2.174043683 | 3.622391585 | 2.291890859 | 3.605144321 | ||||||||||||||||||||||||
Preferred B | 1.6305332814 | 2.839084549 | 1.681820380 | 0.938463467 | 1.630533280 | 2.716794551 | 1.718918690 | 2.703859099 | ||||||||||||||||||||||||
| Declared | Paid(2) | Declared | ||||||||||||||||||||||
| On 12/31/2011 | On 5/29/2012 | On 12/31/2012 | ||||||||||||||||||||||
| R$ | U.S.$ | R$ | U.S.$ | R$ | U.S.$ | |||||||||||||||||||
Common | 1.231779162 | 2.310571353 | 1.280047007 | 0.641820601 | 0.399210837 | 0.195356416 | ||||||||||||||||||
Preferred A | 2.178256581 | 4.085973695 | 2.263612588 | 1.134984250 | 2.178256581 | 1.065944008 | ||||||||||||||||||
Preferred B | 1.633692440 | 3.064480279 | 1.697709445 | 0.851238189 | 1.633692440 | 0.799458008 | ||||||||||||||||||
| Declared | Paid(2) | Declared(3) | ||||||||||||||||||||||
| On 12/31/2012 | On 9/20/2013 | On 12/31/2013 | ||||||||||||||||||||||
| R$ | U.S.$ | R$ | U.S.$ | R$ | U.S.$ | |||||||||||||||||||
Common | 0.399210837 | 0.195356416 | 0.421402082 | 0.191086057 | 0,39921083663 | 0.17640779347 | ||||||||||||||||||
Preferred A | 2.178256581 | 1.065944008 | 2.299341032 | 1.042643192 | 2,17825658673 | 0.96255262339 | ||||||||||||||||||
Preferred B | 1.633692440 | 0.799458008 | 1.724505778 | 0.781982396 | 1,63369244005 | 0.72191446754 | ||||||||||||||||||
| (1) | Adjusted to reflect the reverse stock split. |
| (2) | Adjusted by Selic rate variation. |
| (3) | Eletrobras expects to pay the dividends declared on December 31, 2013 by year-end 2014. |
Exchange Controls and Foreign Exchange Rates
The Brazilian foreign exchange system allows the purchase and sale of foreign currency and the international transfer ofreais by any person or legal entity, regardless of the amount, subject to certain regulatory procedures.
Since 1999, the Central Bank has allowed thereal/U.S. dollar exchange rate to float freely, and since then, thereal/U.S. dollar exchange rate has fluctuated considerably. Until early 2003, the value of thereal declined relative to the U.S. dollar and then began to stabilize. Thereal appreciated against the U.S. dollar in 2004-2007. In 2008, as a result of the worsening of the global financial and economic crisis thereal depreciated 31.9% against the U.S. dollar, and on December 31, 2008 the exchange rate of thereal in relation to the U.S. dollar was R$2.34 per U.S.$1.00. In 2009, thereal appreciated 25.5% against the U.S. dollar, due to improved economic conditions in Brazil. In 2010, thereal appreciated 4.3% against the U.S. dollar. In 2011, thereal depreciated 12.6% against the U.S. dollar. In 2012, thereal depreciated 8.9% against the U.S. dollar. In 2013, thereal depreciated 14.6% against the U.S. dollar. In the past, the Central Bank has intervened occasionally to control instability in foreign exchange rates. We cannot predict whether the Central Bank or the Brazilian Government will continue to allow therealto float freely or will intervene in the exchange rate market through a currency band system or otherwise. We cannot assure that the real will not depreciate substantially or continue to appreciate against the U.S. dollar in the near future.
- 10 -
Table of Contents
The following table sets forth the period end, average, high and low selling rates published by the Central Bank expressed inreais per U.S.$ for the periods and dates indicated.
| Reais per U.S. Dollar | ||||||||||||||||
Year Ended | Period-end | Average | Low | High | ||||||||||||
December 31, 2009 | 1.7412 | 1.9905 | 1.7024 | 2.4218 | ||||||||||||
December 31, 2010 | 1.6662 | 1.7593 | 1.6554 | 1.8811 | ||||||||||||
December 31, 2011 | 1.8758 | 1.6746 | 1.5345 | 1.9016 | ||||||||||||
December 31, 2012 | 2.0435 | 1.9550 | 1.7024 | 2.1121 | ||||||||||||
December 31, 2013 | 2.3426 | 2.1605 | 1.9528 | 2.4457 | ||||||||||||
The following table sets forth the period end, high and low commercial market/foreign exchange market selling rates published by the Central Bank expressed inreais per U.S.$ for the periods and dates indicated.
| Reais per U.S. Dollar | ||||||||||||||||
Month | Period-end | Average | Low | High | ||||||||||||
December 2013 | 2.3426 | 2.1605 | 1.9528 | 2.4457 | ||||||||||||
January 2014 | 2.4263 | 2.3822 | 2.3335 | 2.4397 | ||||||||||||
February 2014 | 2.3334 | 2.3837 | 2.3334 | 2.4238 | ||||||||||||
March 2014 | 2.2630 | 2.3261 | 2.2603 | 2.3649 | ||||||||||||
April 2014 (through April 28, 2014) | 2.2370 | 2.2333 | 2.1974 | 2.2811 | ||||||||||||
Brazilian law provides that, whenever there is a serious imbalance in Brazil’s balance of payments or there are serious reasons to foresee a serious imbalance, temporary restrictions may be imposed on remittances of foreign capital abroad. We cannot assure you that such measures will not be taken by the Brazilian Government in the future. See “Item 3.D, Risk Factors – Risks Relating to Brazil.”
We currently maintain our financial books and records inreais. For ease of presentation, however, certain consolidated financial information contained in this annual report has been presented in U.S. dollars. See “Item 8, Financial Information.”
B. Capitalization and Indebtedness
Not applicable.
C. Reasons for the Offer and Use of Proceeds
Not applicable.
D. Risk Factors
Risks Relating to our Company
The renewal of our concessions, which were due to expire between 2015 and 2017, pursuant to Law No. 12,783, may adversely affect our financial condition and results of operations.
On September 11, 2012, the Brazilian Government enacted Provisional Measure No. 579/2012, later converted into Law No. 12,783, or “Law No. 12,783”, in order to regulate the terms and conditions for the renewal of concessions for the generation, distribution and transmission of electricity which were due to expire between 2015 and 2017. The terms of the law provide that companies may, only once, renew their generation and transmission concessions for a further thirty year term, provided they accept certain conditions established by ANEEL, such as accepting the revised tariffs to be calculated by ANEEL, and submitting to the agency’s quality standards.
On December 4, 2012, we renewed the generation and transmission concessions which were due to expire between 2015 and 2017 of Eletrobras Chesf, Eletrobras Eletronorte, Eletrobras Eletrosul and Eletrobras Furnas for further 30 year terms pursuant to Law No. 12,783. By doing so, we accepted the application of the significantly reduced revised tariffs and annual permitted revenues (Receita Anual Permitida) as remuneration for our generation and transmission activities in accordance with the Ministry for Mining and Energy’s Ordinance Nos. 579 and 580. While renewing our generation and transmission concessions for an additional 30 years assures us of long-term revenue generating assets, for the year ended
- 11 -
Table of Contents
December 31, 2013 the effects of Law 12,783, and specifically the significantly reduced tariffs effective from January 1, 2013 with respect to those assets with concessions expiring in the years 2015 through 2017, resulted in a non-recurring charge of R$10.1 billion. Furthermore, we expect that in the future our revenues from concessions that have been renewed pursuant to Law 12,783 will be significantly lower, and may result in us incurring losses in subsequent periods. For more information regarding the effects of Law No. 12,783 on our income, please see “Item 5, Operating and Financial Review and Prospects — Overview —The Effects of Law No. 12,783” below. For further information about which of our concessions were renewed pursuant to Law No. 12,783, please see “Item 4, Information on the Company —Business Overview —Generation—Concessions.”
The amount of any indemnification payments to be received following renewal of our concessions, which were due to expire between 2015 and 2017, may not be sufficient to cover our investments in these concessions.
By agreeing to renew the concessions, which were due to expire between 2015 and 2017, we accepted indemnification for the unamortized portion of our assets relating to those concessions. We claimed indemnification from ANEEL (i) in relation to any transmission assets, which became operational prior to 2000 (pursuant to Provisional Measure No. 591/2012) and (ii) for the modernization of any generation assets in accordance with Law No. 12,783. ANEEL has not yet issued a decision on such claims. There are no clear rules for the quantification of indemnification claims in relation to investments made in concession assets renewed pursuant to Law No. 12,783 or as to the timing of the payment of such indemnification claims. In addition, we may be required to further invest in the renewed concessions and, as of the date of this annual report, there are no clear rules determining whether these investments will be reimbursed and how. The value of any indemnification payments received by us might be less than the amounts we accounted for and invested in those transmission and generation assets, which could materially adversely affect our financial condition and results of operations. For further information regarding the effects of Law No. 12,783, please see Note 2.1 to the Financial Statements.
The value of the revised tariffs we calculated based on our expected expenses, costs and revenues may be higher than the tariffs we will eventually receive.
Law No. 12,783 determines, among other things, the tariffs to be charged by concessionaires based on costs of operation and maintenance, charges, taxes and payments for the use of the transmission and distribution systems. By agreeing to renew our concessions early, we made certain assumptions about the assets of Eletrobras Furnas, Eletrobras Chesf and Eletrobras Eletrosul that may not materialize over time, particularly in relation to planned cost reductions. As a result, the tariffs we will receive in time may be lower than predicted or may be paid only after a significant amount of time, which could materially adversely affect our financial condition and results of operations.
There are no guarantees that our existing concession contracts will be renewed and, if so, at what terms.
We carry out our generation, transmission and distribution activities pursuant to concession agreements entered into with the Brazilian Government through ANEEL.
The Brazilian Government may renew any existing concessions that were not renewed pursuant to Law No. 12,783 for an additional period of 30 years without the need to carry out a new public bidding process. In case we request such a renewal, the Brazilian Government may grant their approval on less favorable terms. This applies to approximately 37.5% of our generation assets, all of our distribution assets and 5.8% of our transmission assets, other than Itaipu and our nuclear power plants, Angra I and Angra II.
Given the Brazilian Government’s discretion in relation to the renewal of concessions, we may face considerable competition from our competitors during the renewal process. Consequently, we cannot give you any assurances that our concessions will be renewed or renewed under similar conditions. Further, our shareholders may choose not to renew any expiring concessions if the terms of the renewal are not favorable, which would adversely affect our financial condition and results of operations.
The value of any government bonds received by us in exchange for our credits in Itaipu might be less than the value of our credits.
Law No. 12,783 authorized the Brazilian Government to acquire any of the credits we hold against Itaipu as a result of our financing of the construction of the Itaipu hydroelectric power plant in exchange for Brazilian Government bonds (títulos da dívida pública mobiliária) of an equivalent value. Should the Brazilian Government acquire these credits, the value of any government bonds transferred to us may be less than the value of our credits in Itaipu and could materially adversely affect our financial condition and results of operations.
- 12 -
Table of Contents
Any hydroelectric generation concessions renewed pursuant to Law No. 12,783 are subject to a quota allocation regime.
As a result of the renewal of our hydroelectric generation concessions, our generation companies must comply with a quota allocation regime under which those companies are required to provide power to distribution companies which also renewed their concessions pursuant to Law No. 12,783. Accordingly, we cannot access the free market, which generally attracts higher returns, to sell any electricity generated by such companies, and our financial condition and results of operations could be materially and adversely affected.
We are controlled by the Brazilian Government, the current policies and priorities of which directly affect our operations and may conflict with interests of our investors.
The Brazilian Government, as our controlling shareholder, has pursued (and may continue to pursue) some of its macroeconomic and social objectives through us using principally Brazilian Government funds, which we administer. These funds are the RGR Fund, the CCC Account and the CDE Account.
The Brazilian Government also has the power to appoint seven out of the 10 members of our Conselho de Administração (or Board of Directors) and, through them, a majority of the executive officers responsible for our day-to-day management. Additionally, the Brazilian Government currently holds the majority of our voting shares. Consequently, the Brazilian Government has the majority of votes at our shareholders’ meetings, which empowers it to approve most matters prescribed by law, including the following: (i) the partial or total sale of the shares of our subsidiaries; (ii) increase of our capital stock through a subscription of new shares; (iii) our dividend distribution policy, as long as it complies with the minimum dividend distribution regulated by law; (iv) issuances of securities in the domestic market and internationally; (v) corporate spin-offs and mergers; (vi) swaps of our shares or other securities; and (vii) the redemption of different classes of our shares, independent from approval by holders of the shares and classes that are subject to redemption.
Our operations impact the commercial, industrial and social development promoted by the Brazilian Government. The Brazilian Government has in the past and may in the future require us to make investments, incur costs or engage in transactions (which may include, for example, requiring us to make acquisitions) that may not be consistent with our objective of maximizing our profits.
We are subject to rules limiting borrowing by public sector companies and may not be able to obtain sufficient funds to complete our proposed capital expenditure programs.
Our current budget anticipates capital expenditures for expansion, modernization, research, infrastructure and environmental projects of approximately R$14.1 billion in 2014. We cannot assure you that we will be able to finance our proposed capital expenditure programs from either our cash flow or external resources. Moreover, as a state controlled company, we are subject to certain rules limiting our indebtedness and investments and must submit our proposed annual budgets, including estimates of the amounts of our financing requirements and sources of our financing, to the Ministry of Planning, Budget and Management and the Brazilian Congress for approval. Thus, if our operations do not fall within the parameters and conditions established by such rules and the Brazilian Government, we may have difficulty in obtaining the necessary financing authorizations, which could create difficulties in raising funds. If we are unable to obtain such funds, our ability to invest in capital expenditures for expansion and maintenance may be adversely impacted, which would materially adversely affect the execution of our growth strategy, particularly our investment in large scale projects, which could materially adversely affect our financial condition and results of operations.
We own a number of subsidiaries whose performance significantly influences our results.
We conduct our business mainly through our operating subsidiaries, including Eletrobras Eletronorte, Eletrobras CGTEE, Eletrobras Eletronuclear, Eletrobras Chesf, Eletrobras Furnas, Eletrobras Eletrosul, Eletrobras Distribuição Alagoas, Eletrobras Distribuição Acre, Amazonas Energia, Eletrobras Distribuição Piauí, Eletrobras Distribuição Rondônia and Eletrobras Distribuição Roraima. In addition, we and our subsidiaries invest in special purpose companies for the development of certain projects, such as the construction of our hydroelectric plants Belo Monte, Santo Antonio, Interligação Elétrica do Madeira, Manaus Transmissora de Energia and Norte Brasil. Our ability to meet our financial obligations is therefore related in part to the cash flow and earnings of our subsidiaries and special purpose companies and the distribution or other transfer of those earnings to us in the form of dividends, loans or other advances and payment.
- 13 -
Table of Contents
Some of our subsidiaries or special purpose companies are, or may in the future be, subject to loan agreements that require that any indebtedness of these subsidiaries or special purpose companies to us be subordinate to the indebtedness under those loan agreements. Our subsidiaries and any special purpose companies are separate legal entities. Any right we may have to receive assets of any subsidiary or special purpose company or other payments upon their liquidation or reorganization will be effectively subordinated to the claims of that subsidiary’s or special purpose company’s creditors (including tax authorities, trade creditors and lenders to such subsidiaries), except to the extent that we are a creditor of that subsidiary or special purpose company, in which case our claims would still be subordinated to any security interest in the assets of that subsidiary or special purpose company and indebtedness of that subsidiary or special purpose company senior to that held by us.
The amounts we receive from the Fuel Consumption Account may decrease.
The Brazilian Government introduced the Fuel Consumption Account, or CCC Account, in 1973. The current purpose of the CCC Account is to equalize the costs of energy for electricity companies located in areas where the generation matrix is mainly thermoelectric and, therefore, more expensive compared to hydrological energy, in order to avoid peaks in the tariffs paid by end consumers in such locations final consumers of such locations. In recent periods, the amounts we (and other companies in our industry) have received as reimbursements from the CCC Account have exceeded our contributions to that account.
Following the enactment of Law No. 12,783, we are no longer required to make payments to the CCC Account. Nevertheless, the CCC Account has not been extinguished. The assets which remain will still be distributed to generation and distribution companies which may incur additional expenses due to the use of thermoelectric plants should hydrological conditions be unfavorable. To ensure its continuing viability, Law No. 12,783 allows for transfers between theConta de Desenvolvimento Energético (Energy Development Account or CDE Account) and the CCC Account.
The reimbursements we receive from the CCC Account may not be sufficient to cover our costs incurred as a result of thermoelectric energy generation and, accordingly, our financial condition and results of operations may be materially adversely affected.
We may be unable to fully implement our strategy.
Our ability to implement the principal components of our strategy depends on a series of factors, among them, our ability to:
| • | Implement an operational efficiency plan aimed at reducing costs, increasing revenues and improving the quality and reliability of our services; |
| • | Expand our business in a sustainable and profitable manner; and |
| • | Improve our business model, corporate governance and management. |
We cannot guarantee that we will be to accomplish these objectives in their entirety or successfully. Any impact on the main elements of our strategy may adversely affect our financial condition and results of operations.
If any of our assets were deemed assets dedicated to providing an essential public service, they would not be available for liquidation in the event of our bankruptcy and could not be subject to attachment to secure a judgment.
On February 9, 2005, the Brazilian Government enacted Law No. 11,101, or the New Bankruptcy Law. The New Bankruptcy Law, which came into effect on June 9, 2005, governs judicial recovery, extrajudicial recovery and liquidation proceedings and replaces the debt reorganization judicial proceeding known asconcordata (reorganization) for judicial and extrajudicial recovery. The New Bankruptcy Law provides that its provisions do not apply to government owned and mixed capital companies (such as Eletrobras). However, the Brazilian Federal Constitution establishes that mixed capital companies, such as Eletrobras, which operate a commercial business, will be subject to the legal regime applicable to private corporations in respect of civil, commercial, labor and tax matters. Furthermore, Law No. 12,767/2012 provides that judicial and extrajudicial recovery do not apply to public entity concessionaires until the termination of those concessions. Accordingly, it is unclear whether or not the provisions relating to judicial and extrajudicial recovery and liquidation proceedings of the New Bankruptcy Law would apply to us.
- 14 -
Table of Contents
We believe that a substantial portion of our assets, including our generation assets, our transmission network and our limited distribution network, would be deemed by Brazilian courts to be related to providing an essential public service. Accordingly, these assets would not be available for liquidation in the event of our bankruptcy or available for attachment to secure a judgment. In either case, these assets would revert to the Brazilian Government pursuant to Brazilian law and the terms of our concession agreements. Although the Brazilian Government would in such circumstances be under an obligation to compensate us in respect of the reversion of these assets, we cannot assure you that the level of compensation received would be equal to the market value of the assets and, accordingly, our financial condition and results of operations may be affected.
We may be liable for damages, subject to further regulation and have difficulty obtaining financing if there is a nuclear accident involving our subsidiary Eletrobras Eletronuclear.
Our subsidiary Eletrobras Eletronuclear, as an operator of two nuclear power plants, is subject to strict liability under Brazilian law for damages in the event of a nuclear accident. The Vienna Convention on Civil Liability for Nuclear Accidents (or the Vienna Convention) became binding in Brazil in 1993. The Vienna Convention provides that an operator of a nuclear installation, such as Eletrobras Eletronuclear, in a jurisdiction which has adopted legislation implementing the Vienna Convention, will be strictly liable for damages in the event of a nuclear accident (except as covered by insurance). Eletrobras Eletronuclear is regulated by several federal and state agencies. As of December 31, 2013, Eletrobras Eletronuclear’s Angra I and Angra II plants were insured for an aggregate amount of U.S.$926 million in the event of a nuclear accident (see “Item 4.B, Business Overview – Generation – Nuclear Plants”). In addition to the liability for damages in the event of a nuclear accident, Eletrobras Eletronuclear has acquired insurance to cover operational risks due to potential equipment failure, in the amount of U.S.$390.4 million for each unit. We cannot assure that this coverage will be sufficient in the event of a nuclear accident. Accordingly, any nuclear accident may have a material adverse effect on our financial condition and results of operations.
The Brazilian nuclear regulatory authority CNEN has not established any additional safety requirement existing or planned for the nuclear power plants as a result of the Fukushima accident in Japan. Eletrobras Eletronuclear complied with all the requests of CNEN regarding the lessons learned from the Fukushima accident, including the performance of “stress tests” developed for European reactors in accordance with the technical guidelines set forth by the European Commission. The Brazilian site conditions for the existing plants were subject before the Fukushima accident to an extensive reevaluation for licensing the construction of the third unit (Angra III) at the same site. The results of the reevaluation confirmed the adequacy of the safety design criteria.
The technology applied in the Brazilian nuclear power plants and the design, incorporating additional safety features such as double emergency supply systems and alternatives for passive reactor cooling, should withstand accidents beyond the design basis. Nonetheless, Eletrobras Eletronuclear established a comprehensive program to evaluate and enlarge its existing safety margins and allocated approximately US$150 million to be applied towards this effect through 2016. Therefore, the Fukushima accident did not affect nuclear power generation in Brazil; our current plants remain operational and our projects are still on schedule.
We do not have alternative supply sources for the key raw materials that our thermal and nuclear plants use.
Our thermal plants operate on coal and/or oil and our nuclear plants operate on processed uranium. In each case, we are entirely dependent on third parties for the provision of these raw materials. In the event that supplies of these raw materials become unavailable for any reason, we do not have alternative supply sources and, therefore, the ability of our thermal and/or nuclear plants, as applicable, to generate electricity would be materially adversely affected, which may materially adversely affect our financial condition and results of operations.
Our distribution companies operate under challenging market conditions and historically, in the aggregate, have incurred losses.
Our distribution activities are carried out in the northern and northeastern regions of Brazil, representing 22.9% of our consolidated net revenue as of December 31, 2013. The northern and northeastern regions of Brazil are the poorest regions in the country, and our distribution subsidiaries incur significant commercial losses due to illegal connections, as well as relatively high levels of default by consumers in those regions. Historically, in the aggregate, our distribution subsidiaries have incurred losses which have adversely affected our consolidated results of operations. In May 2008, we implemented a new management structure for our distribution activities. As a result, several measures have been taken in order to reduce commercial losses and to renegotiate debts due by consumers in default with our distribution subsidiaries. However, we cannot be certain that such measures will succeed, and that the losses suffered by our distribution subsidiaries will be
- 15 -
Table of Contents
substantially reduced. We also cannot be certain that the conditions in the market where theses subsidiaries operate will not deteriorate. Additionally, the independent auditor’s report has an emphasis of matter paragraph related to the operational continuity of controlled distribution companies.
In addition, the tariffs we charge for the sale of electricity to customers are determined by ANEEL, pursuant to concession agreements and Brazilian law, which establishes mechanisms that allow for periodic adjustment. ANEEL determines the level of any adjustment by analyzing the costs of each distribution company and their weighted average cost of capital, or WACC. The third tariff review cycle for energy distribution companies resulted in a WACC of 6.6%.
We may incur losses and spend time and money defending pending litigation and administrative proceedings.
We are currently a party to numerous legal proceedings relating to civil, administrative, environmental, labor and tax claims filed against us. These claims involve substantial amounts of money and other remedies. Several individual disputes account for a significant part of the total amount of claims against us. We have established provisions for all amounts in dispute that represent a probable loss in the view of our legal advisors and in relation to those disputes that are covered by laws, administrative decrees, decrees or court rulings that have proven to be unfavorable. As of December 31, 2013, we provisioned a total aggregate amount of approximately R$5,719 million in respect of our legal proceedings, of which R$295 million were related to tax claims, R$4,487 million were related to civil claims and R$931 million were related to labor claims. (See “Item 8.A, Consolidated Financial Statements and Other Information – Litigation”).
In the event that claims involving a material amount and for which we have no provisions were to be decided against us, or in the event that the losses estimated turn out to be significantly higher that the provisions made, the aggregate cost of unfavorable decisions could have a material adverse effect on our financial condition and results of operations. In addition, our management may be required to direct its time and attention to defending these claims, which could preclude them from focusing on our core business. Depending on the outcome, certain litigation could result in restrictions in our operations and have a material adverse effect on certain of our businesses.
Our insurance coverage may be insufficient to cover potential losses.
Our business is generally subject to a number of risks and hazards, including industrial accidents, labor disputes, unexpected geological conditions, changes in the regulatory environment, environmental hazards and weather and other natural phenomena. Additionally, we and our subsidiaries are liable to third parties for losses and damages caused by any failure to provide generation, transmission and distribution services.
Our insurance covers only part of the losses that we may incur. We maintain insurance in amounts that we believe to be adequate to cover damages to our plants caused by fire, general third-party liability for accidents and operational risks. If we are unable to renew our insurance policies from time to time or losses or other liabilities occur that are not covered by insurance or that exceed our insurance limits, we could be subject to significant unexpected additional losses.
Judgment may not be enforceable against our directors or officers.
All of our directors and officers named in this annual report reside in Brazil. We, our directors and officers and our Fiscal Council members, have not agreed to accept service of process in the United States. Substantially all of our assets, as well as the assets of these persons, are located in Brazil. As a result, it may not be possible to effect service of process within the United States or other jurisdictions outside Brazil upon these persons, attach their assets, or enforce against them or us in United States courts, or the courts of other jurisdictions outside Brazil, judgments predicated upon the civil liability provisions of the securities laws of the United States or the laws of other jurisdictions.
If we are unable to remedy the material weaknesses in our internal controls, the reliability of our financial reporting and the preparation of our consolidated financial statements may be materially adversely affected.
Pursuant to SEC regulations, our management, including our Chief Executive Officer and Chief Financial Officer, evaluate the effectiveness of our disclosure controls and procedures, including the effectiveness of our internal control over financial reporting. Our internal controls over financial reporting are designed to provide reasonable assurance regarding the reliability of financial reporting and the preparation of consolidated financial statements for external purposes in accordance with generally accepted accounting principles. As a result of our management’s evaluation of the effectiveness of our disclosure, controls and procedures in 2013, our management determined that these controls and procedures were not effective due to material weaknesses in our internal controls over financial reporting. These material weaknesses included our lack of design and maintenance of effective operating controls over:
| • | financial reporting based criteria established by the Committee of Sponsoring Organizations of the Treadway Commission, or COSO, including: internal control deficiencies not remediated in a timely manner; |
- 16 -
Table of Contents
| • | monitoring and approval controls over specific enterprise resource planning, or ERP, that could lead to non authorized manual journal entries; |
| • | the completeness/accuracy of the judicial deposits and legal lawsuits, including periodic reviews/updates of them and the expected losses for accrual purposes; |
| • | the impairment calculation of assets; and |
| • | the appropriate review/monitoring related to the preparation of consolidated financial statements and related disclosures, and insufficient headcount of internal accounting personnel. |
In response to these findings by our management, we have begun to implement steps to remedy each of these material weaknesses. In the event we are unable to remedy these material weaknesses, the reliability of our financial reporting and the preparation of our consolidated financial statements may be materially adversely affected, which may materially adversely affect our company and our reputation.
Risks Relating to Brazil
The Brazilian Government has exercised, and continues to exercise, significant influence over the Brazilian economy. Brazilian economic and political conditions have a direct impact on our business, financial condition, results of operations and prospects.
The Brazilian economy has been characterized by the significant involvement of the Brazilian Government, which often changes monetary, credit and other policies to influence Brazil’s economy. The Brazilian Government’s actions to control inflation and effect other policies have often involved wage and price controls, depreciation of thereal, controls over remittances of funds abroad, intervention by the Central Bank to affect base interest rates and other measures. We have no control over, and cannot predict, what measures or policies the Brazilian Government may take in the future. Our business, financial condition, results of operations and prospects may be adversely affected by changes in Brazilian Government policies, as well as general factors including, without limitation:
| • | Brazilian economic growth; |
| • | inflation; |
| • | interest rates; |
| • | variations in exchange rates; |
| • | exchange control policies; |
| • | liquidity of the domestic capital and lending markets; |
| • | fiscal policy and changes in tax laws; and |
| • | other political, diplomatic, social and economic policies or developments in or affecting Brazil. |
Changes in, or uncertainties regarding the implementation of, the policies listed above could contribute to economic uncertainty in Brazil, thereby increasing the volatility of the Brazilian securities market and the value of Brazilian securities traded abroad.
- 17 -
Table of Contents
The stability of the Brazilian real is affected by its relationship with the U.S. dollar, inflation and Brazilian Government policy regarding exchange rates. Our business could be adversely affected by any recurrence of volatility affecting our foreign currency-linked receivables and obligations.
The Brazilian currency has experienced high degrees of volatility in the past. The Brazilian Government has implemented several economic plans, and has used a wide range of foreign currency control mechanisms, including sudden devaluation, small periodic devaluation during which the occurrence of the changes varied from daily to monthly, floating exchange market systems, exchange controls and parallel exchange market. From time to time, there was a significant degree of fluctuation between the U.S. dollar and the Brazilianreal and other currencies. On December 31, 2013, the exchange rate between thereal and the dollar was R$2.34 to U.S.$1.00.
Thereal may not maintain its current value or the Brazilian Government may implement foreign currency control mechanisms. Any governmental interference with the exchange rate, or the implementation of exchange control mechanisms, could lead to a depreciation of thereal, which could reduce the value of our receivables and make our foreign currency-linked obligations more expensive. Other than in respect of our revenues and receivables denominated in U.S. dollars, such devaluation could materially adversely affect our business, operations or prospects.
On December 31, 2013, approximately 34% of our consolidated indebtedness, which equaled R$11,080 million, was denominated in foreign currencies, of which R$10,668 million (or approximately 33% of our consolidated indebtedness) was denominated in U.S. dollars.
Inflation, and the Brazilian Government’s measures to curb inflation, may contribute significantly to economic uncertainty in Brazil and materially adversely impact our operating results.
Brazil has historically experienced high rates of inflation. Inflation and some of the Brazilian Government’s measures taken in an attempt to curb inflation have had significant negative effects on the Brazilian economy generally. Since the introduction of thereal in 1994, Brazil’s rate of inflation has been substantially lower than in previous periods. However, inflationary pressures persist, and policies adopted to contain inflationary pressures and uncertainties regarding possible future governmental intervention have contributed to economic uncertainty.
Brazil may experience high levels of inflation in the future. Inflationary cost pressures may lead to further government intervention, including the introduction of policies that could adversely affect our business, financial condition, results of operations and prospects.
Risks Relating to the Brazilian Power Industry
In 2014, the Federal Government permitted CCEE to use credit facilities to assist distribution companies overcome financial difficulties in connection with thermoelectric power acquisition costs. There can be no assurance that CCEE will be able to contract financing that is sufficient to cover our losses or that the financial terms and conditions agreed by CCEE will be favorable to our business and operations.
On March 13, 2014, the Brazilian Federal Government announced the following measures to assist distribution companies with financial difficulties in connection with thermoelectric power acquisition costs for the period from February to December, 2014: (i) an electricity commercialization auction to be held by ANEEL and MME on April, 2014 in response to the power contracting deficit of distribution companies; and (ii) the National Treasury’s contribution of up to R$4.0 billion through the Energy Development Account (Conta de Desenvolvimento Energético – CDE).
In addition, the Federal Government allowed the Energy Trading Chamber, or CCEE, to contract financings in the amount of up to R$8.0 billion to fund the elevated costs incurred by distribution companies with electricity purchases from thermoelectric plants. Decree No, 8,221, dated April 1, 2014, created the Regulated Marked Account (Conta no Ambiente de Contratação Reguladaor Conta-ACR), which will reserve the funds to contract and pay such financial obligations. Distribution companies will, after the 2015 tariff review procedures, withhold specific amounts defined by ANEEL to CDE in order to pay for the financings contracted by CCEE.
There can be no assurance that CCEE will be able to contract financings that are sufficient to cover our losses in connection with the power acquisition costs we incurred at the beginning of 2014. In addition, CCEE may use credit facilities under terms and conditions that are not favorable to our business and operations, which may adversely affect our financial condition and results of operations.
- 18 -
Table of Contents
We cannot predict whether the constitutionality of the Electricity Regulatory Law will be upheld; if it is not, we may face both uncertainty and costs in re-aligning our business.
In 2004, the Brazilian Government enacted the Electricity Regulatory Law, a far reaching piece of legislation that provides the framework for regulation of the electricity sector in Brazil. Among other changes, the new legislation (i) modifies the rules regarding the purchase and sale of electric power between generation companies and distribution companies; (ii) established new rules for the auction of generation companies; (iii) created the Electric Power Commercialization Chamber (“CCEE”) and new divisional bodies; and (iv) modified the responsibilities of the Energy and Mining Ministry and ANEEL. We have aligned our business within this framework. However, the constitutionality of the Electricity Regulatory Law is being challenged in the Brazilian Supreme Court. The Supreme Court has not yet issued a final ruling in this case although it recently agreed to deny a request to suspend the effectiveness of the Electricity Regulatory Law while the challenge is pending. If the Supreme Court were to hold that the Electricity Regulatory Law is unconstitutional, this would result in significant uncertainty in Brazil as to the appropriate regulatory framework for the electricity sector, which could materially adversely affect the operation of our business. Moreover, we have no way of predicting the terms of any alternative framework for the regulation of electricity in Brazil. We would likely face costs in re-aligning our business to meet the requirements of any such framework, which would materially adversely affect our financial condition and results of operations.
We could be penalized by ANEEL for failing to comply with the terms of our concession agreements and applicable legislation and we may not recover the full value of our investment in the event that any of our concession agreements are terminated.
We carry out our generation, transmission and distribution activities in accordance with concession agreements we execute with the Brazilian Government through ANEEL. The length of such concessions varies from 20 to 35 years. ANEEL may impose penalties on us in the event that we fail to comply with any provision of our concession agreements and of the legislation and regulation applicable to the electricity sector. Depending on the extent of the non-compliance, these penalties could include substantial fines (in some cases up to two percent of our gross revenues in the fiscal year immediately preceding the assessment), restrictions on our operations (such as exclusion from upcoming auctions), intervention or termination of the concession. For example, on May 22, 2010, our subsidiary Eletrobras Furnas received a R$53.7 million fine from ANEEL, as a result of ANEEL determining that there were two malfunctions in the protection system of the Itaberá and Ivaiporã substations that led to power outages and disruption in generation on November 10, 2009. Further, In April 2014, ANEEL excluded Eletrobras Chesf, Eletrobras Furnas, Eletrobras Eletrosul and CEEE-GT from the upcoming transmission auctions due to delays in the construction of transmission lines previously awarded to these subsidiaries. ANEEL may also terminate our concessions prior to their due date in the event that we fail to comply with their provisions, are declared bankrupt or are dissolved, or in the event that ANEEL determines that such termination would serve the public interest (see “Item 4.B, Business Overview – Generation – Concessions”).
As of December 31, 2013, we believe we were in compliance with all material terms of our concession agreements. However, we cannot assure you that we will not be penalized by ANEEL for a future breach of our concession agreements or that our concessions will not be terminated in the future. In the event that ANEEL were to terminate any of our concessions before their expiration date, the compensation we recover for the unamortized portion of our investment may not be sufficient for us to recover the full value of our investment and, accordingly, could have a material adverse effect on our financial condition and results of operations.
We may be subject to administrative intervention if we provide our services in an inadequate manner or violate contractual obligations, regulations and other legal obligations.
In August 2012 the Brazilian Government published a provisional measure which later became Law No. 12,767/2012, permitting ANEEL to intervene in electric power concessions considered part of the public service in order to guarantee adequate levels of service as well as compliance with the terms and conditions under the concession contract, regulations and other relevant legal obligations. If ANEEL were to intervene in concessions as part of an administrative procedure, management would have to present a recovery plan to correct any violations and failures that gave rise to the intervention. Should the recovery plan be dismissed or not presented within the timelines stipulated by the regulations, ANEEL may, among other things, expropriate or forfeit the concession, reallocate our assets or adopt measures which may alter our shareholding structure.
If the holders of our concessions are subject to an administrative intervention, we and our subsidiaries may be subject to an internal reorganization in accordance with the recovery plan presented by management, which may adversely affect our financial condition and results of operations. In addition, should the recovery plan be rejected by the administrative authorities, ANEEL would be able to use its powers described above, which may adversely affect our financial condition and results of operations.
- 19 -
Table of Contents
Our generation, transmission and distribution activities are regulated and supervised by the Brazilian Government. Our business could be adversely affected by any regulatory changes or by termination of the concessions prior to their expiration dates, and any indemnity payments for the early terminations may be less than the full amount of our investments.
According to Brazilian law, ANEEL has the authority to regulate and supervise the generation, transmission and distribution activities of electrical energy concessionaries, such as us and our subsidiaries, including in relation to investments, additional expenses, tariffs and the passing of costs to customers, among other matters. Regulatory changes in the electrical energy sector are hard to predict and may have a material adverse impact on our financial condition and results of operations.
Concessions may be terminated early through expropriation and/or forfeiture. Granting authorities may expropriate concessions in the interest of the public as expressly provided for by law, in which case granting authorities carry out the service during the concession period. A granting authority may declare the forfeiture of concessions after ANEEL or the MME conduct an administrative procedure and declare that the concessionaire (a) did not provide proper service for more than 30 consecutive days and did not present any acceptable alternative to ANEEL or to ONS, or failed to comply with the applicable law or regulation; (b) lost the technical, financial or economic conditions required to provide the service properly; and/or (c) did not comply with the fines charged by the granting authority.
Penalties are set forth in ANEEL Resolution No. 63, of May 12, 2004, and include warnings, substantial fines (in certain cases up to 2.0% of the revenue for the fiscal year immediately preceding the evaluation), restrictions on the concessionaire’s operations, intervention or termination of the concession.
We may contest any expropriation or forfeiture and will be entitled to receive compensation for our investments in expropriated assets that have not been fully amortized or depreciated. However, the indemnity payments may not be sufficient to fully recover our investments, which could materially adversely affect our financial condition and results of operations.
ANEEL establishes the tariffs for generation, transmission and distribution based on certain criteria established by law.
Eletrobras conducts its generation, transmission and distribution activities in accordance with the terms of the concession contracts entered into with the Brazilian Government through ANEEL and in certain cases ANEEL is responsible for setting the tariffs. The concessions renewed in 2012 pursuant to Law No. 12,783 were conditional on ANEEL establishing new tariffs and annual permitted revenue rates. If ANEEL questions or rejects our tariff adjustment requests based on our investments incurred to date, our financial condition and results of operations may be adversely affected.
We are subject to strict safety, health and environmental laws and regulations that may become more stringent in the future and may result in increased liabilities and increased capital expenditures.
Our operations are subject to comprehensive federal, state and local safety, health and environmental legislation as well as supervision by agencies of the Brazilian Government that are responsible for the implementation of such laws. Among other things, these laws require us to obtain environmental licenses for the construction of new facilities or the installation and operation of new equipment required for our business. The rules are complex and may change over time, making our ability to comply with the applicable requirements more difficult or even impossible, thereby precluding our continuing or future generation, transmission and distribution operations. For example, the Ministry of Environment required us to fulfill 33 steps related to health and safety and the environment in order to receive a permit for operation of our Madeira river project. We see increasing health and safety requirements as a trend in our industry. Moreover, private individuals, non-governmental organizations and the public have certain rights to commence legal proceedings to obtain injunctions to suspend or cancel the licensing process. In addition, Brazilian Government agencies could take enforcement action against us for any failure to comply with applicable laws. Such enforcement action could include, among other things, the imposition of fines, revocation of licenses and suspension of operations. Such failures may also result in criminal liability, irrespective of our strict liability to perform environmental remediation and to indemnify third parties for environmental damage. We cannot accurately predict the effect that compliance with enhanced environmental, health or safety regulations may have on our business. If we do not secure the appropriate permits, our growth strategy will be significantly adversely affected, which may materially adversely affect our results of operations and our financial condition.
- 20 -
Table of Contents
Environmental regulations require us to perform environmental impact studies on future projects and obtain regulatory permits.
We must conduct environmental impact studies and obtain regulatory permits for our current and future projects. We cannot assure you that these environmental impact studies will be approved by the Brazilian Government, that public opposition will not result in delays or modifications to any proposed project or that laws or regulations will not change or be interpreted in a manner that could materially adversely affect our operations or plans for the projects in which we have an investment. We believe that concern for environmental protection is an increasing trend in our industry. Changes in environmental regulations, or changes in the policy of enforcement of existing environmental regulations, could materially adversely affect our results of operations and our financial condition by delaying the implementation of electricity projects, increasing the costs of expansion, or subjecting us to regulatory fines for non-compliance with environmental regulations.
We are affected by hydrological conditions and our results of operations could be affected
Hydrological conditions could adversely affect our operations. For example, hydrological conditions that result in a low supply of electricity in Brazil could cause, among other things, the implementation of broad electricity conservation programs, including mandatory reductions in electricity generation or consumption. The most recent period of extremely low rainfall in a large portion of Brazil was in the years immediately prior to 2001, and as a result, the Brazilian Government instituted a program to reduce electricity consumption from June 1, 2001 to February 28, 2002. Furthermore, precipitation levels recorded in 2012 and 2013 were relatively low, which in turn reduced the levels of reservoirs at our hydroelectric power plants. Consequently, we needed to rely on thermal plants to generate energy we had expected to generate from our hydroelectric plants, which was significantly more expensive.
A recurrence of unfavorable hydrological conditions that result in a reduced supply of electricity to the Brazilian market could cause, among other things, the implementation of broad electricity conservation programs, including mandatory reductions in electricity consumption or the imposition of special taxes on the sector to finance thermal power plants, which are often more expensive than hydroelectric plants per MW of energy produced. Therefore, it is possible that prolonged periods of reduced precipitation levels could adversely affect our financial condition and the results of operations in the future. Our generation capacity could also be affected by events such as floods which might damage our installations. This may in turn materially adversely affect our financial condition and results of operations.
Construction, expansion and operation of our electricity generation, transmission and distribution facilities and equipment involve significant risks that could lead to lost revenues or increased expenses.
The construction, expansion and operation of facilities and equipment for the generation, transmission and distribution of electricity involve many risks, including:
| • | the inability to obtain required governmental permits and approvals; |
| • | the unavailability of equipment; |
| • | supply interruptions; |
| • | work stoppages; |
| • | labor unrest; |
| • | social unrest; |
| • | interruptions by weather and hydrological conditions; |
| • | unforeseen engineering and environmental problems; |
| • | increases in electricity losses, including technical and commercial losses; |
- 21 -
Table of Contents
| • | construction and operational delays, or unanticipated cost overruns; |
| • | the unavailability of adequate funding; and |
| • | expenses related to the operation and maintenance segment cannot be fully approved by ANEEL. |
For example, we experienced work stoppages during the construction of our Jirau, Santo Antônio hydroelectric plants and the Belo Monte which is a plant we own through a joint-venture. We do not have insurance coverage for some of these risks, particularly for those related to weather conditions. Furthermore, the implementation of investments in the transmission sector has suffered delays due to the difficulty to obtain the necessary government permits and approvals. This has led to delays in investments in generation due to the lack of transmission lines to drain production. If we experience any of these or other unforeseen risks, we may not be able to generate, transmit and distribute electricity in amounts consistent with our projections, which may have a material adverse effect on our financial condition and results of operations.
We are strictly liable for any damages resulting from inadequate supply of electricity to distribution companies, and our contracted insurance policies may not fully cover such damages.
Under Brazilian law, we are strictly liable for direct and indirect damages resulting from the inadequate supply of electricity to distribution companies, such as abrupt interruptions or disturbances arising from the generation, distribution or transmission systems. Accordingly, we may be held liable for such damages even if we were not at fault. As a result of the inherent uncertainty involved in these matters, we do not maintain any provisions in relation to potential damage, and these interruptions or disturbances may not covered by our insurance policies or may exceed the coverage limits of such policies. Accordingly, if we are found liable to pay damages in a material amount, our financial condition and results of operations would be materially adversely affected to a greater degree than those claims where we have recorded provisions.
Risks Relating to our Shares and ADSs
If you hold our preferred shares, you will have extremely limited voting rights.
In accordance with the Brazilian Corporate Law and our by-laws, holders of the preferred shares, and, by extension, holders of the ADSs representing them, are not entitled to vote at our shareholders’ meetings, except in very limited circumstances. This means, among other things, that a preferred shareholder is not entitled to vote on corporate transactions, including mergers or consolidations with other companies. Our principal shareholder, who holds the majority of common shares with voting rights and controls us, is therefore able to approve corporate measures without the approval of holders of our preferred shares. Accordingly, an investment in our preferred shares is not suitable for you if voting rights are an important consideration in your investment decision.
Exercise of voting rights with respect to common and preferred shares involves additional procedural steps.
When holders of common shares are entitled to vote, and in the limited circumstances where the holders of preferred shares are able to vote, holders may exercise voting rights with respect to the shares represented by ADSs only in accordance with the provisions of the deposit agreement relating to the ADSs. There are no provisions under Brazilian law or under our by-laws that limit ADS holders’ ability to exercise their voting rights through the depositary bank with respect to the underlying shares. However, there are practical limitations upon the ability of ADS holders to exercise their voting rights due to the additional procedural steps involved in communicating with such holders. For example, holders of our shares will receive notice directly from us and will be able to exercise their voting rights by either attending the meeting in person or voting by proxy. ADS holders, by comparison, will not receive notice directly from us. Rather, in accordance with the deposit agreement, we will provide the notice to the depositary bank, which will in turn, as soon as practicable thereafter, mail to holders of ADSs the notice of such meeting and a statement as to the manner in which instructions may be given by holders. To exercise their voting rights, ADS holders must then instruct the depositary bank how to vote their shares. Because of this extra procedural step involving the depositary bank, the process for exercising voting rights will take longer for ADS holders than for holders of shares. ADSs for which the depositary bank does not receive timely voting instructions will not be voted at any meeting.
- 22 -
Table of Contents
If we issue new shares or our shareholders sell shares in the future, the market price of your ADSs may be reduced.
Sales of a substantial number of shares, or the belief that this may occur, could decrease the prevailing market price of our common and preferred shares and ADSs by diluting the shares’ value. If we issue new shares or our existing shareholders sell shares they hold, the market price of our common and preferred shares, and of the ADSs, may decrease significantly. Such issuances and sales also might make it more difficult for us to issue shares or ADSs in the future at a time and a price that we deem appropriate and for you to sell your securities at or above the price you paid for them.
Political, economic and social events as well as the perception of risk in other countries, including the United States, European Union and emerging countries, may affect the market prices for securities in Brazil, including Eletrobras shares.
The Brazilian securities market is influenced by economic and market conditions in other countries, including the United States, European Union and emerging countries. Despite the significant different economic conjecture between these countries and Brazil, investors’ reactions to events in these countries may have a relevant adverse effect on the market value of Brazilian securities, especially those listed on the stock exchange. Crisis in the United States, European Union or emerging countries may reduce investors’ interest in Brazilian companies, including Eletrobras. For example, the prices of shares listed on BM&FBOVESPA have been historically affected by fluctuations of the American interest rate as well as the variations of the main indexes for North-American shares. Events in other countries and capital markets may adversely affect the market price of Eletrobras shares to the extent that, in the future, it could difficult or prevent access to capital markets and investment financing on acceptable terms.
The Global Financial Crisis that began in the second half of 2008 had significant consequences, including in Brazil, such as volatility on the stock and credit market, lack of credit, higher interest rates, general economic deceleration, volatile exchange rates, inflationary pressure, among others, that could adversely affect us, affect the price of Brazilian securities, including Eletrobras shares.
The persistence of uncertainty in Europe, especially in Greece, Spain, Italy and Portugal, intensified the concern about their fiscal sustainability and their default risk, therefore reducing investor confidence and bringing volatility to the markets. Furthermore, projected growth in the United States remains low, considering certain savings criteria, firmer fiscal policies and lower global growth rates. The continuous financial deterioration of these countries appears to have adversely affected the global economy and, indirectly, the emerging markets, including Brazil and China, which have already begun to show signs of slowing their rate of growth.
Exchange controls and restrictions on remittances abroad may adversely affect holders of ADSs.
You may be adversely affected by the imposition of restrictions on the remittance to foreign investors of the proceeds of their investments in Brazil and the conversion ofreais into foreign currencies. The Brazilian Government imposed remittance restrictions for approximately three months in late 1989 and early 1990. Restrictions like these would hinder or prevent the conversion of dividends, distributions or the proceeds from any sale of our shares, as the case may be, fromreais into U.S. dollars and the remittance of the U.S. dollars abroad. We cannot assure you that the Brazilian Government will not take similar measures in the future.
Exchanging ADSs for the underlying shares may have unfavorable consequences.
As an ADS holder, you benefit from the electronic certificate of foreign capital registration obtained by the custodian for our preferred shares underlying the ADSs in Brazil, which permits the custodian to convert dividends and other distributions with respect to the preferred shares into non-Brazilian currency and remit the proceeds abroad. If you surrender your ADSs and withdraw preferred shares, you will be entitled to continue to rely on the custodian’s electronic certificate of foreign capital registration for only five business days from the date of withdrawal. Thereafter, upon the disposition of or distributions relating to the preferred shares unless you obtain your own electronic certificate of foreign capital registration or you qualify under Brazilian foreign investment regulations that entitle some foreign investors to buy and sell shares on Brazilian stock exchanges without obtaining separate electronic certificates of foreign capital registration you would not be able to remit abroad non-Brazilian currency. In addition, if you do not qualify under the foreign investment regulations you will generally be subject to less favorable tax treatment of dividends and distributions on, and the proceeds from any sale of, our preferred shares.
- 23 -
Table of Contents
If you attempt to obtain your own electronic certificate of foreign capital registration, you may incur expenses or suffer delays in the application process, which could delay your ability to receive dividends or distributions relating to our preferred shares or the return of your capital in a timely manner. The depositary’s electronic certificate of foreign capital registration may also be adversely affected by future legislative changes.
You may receive reduced dividend payments if we incur net losses or our net income does not reach certain levels.
Under Brazilian Corporate Law and our by-laws, we must pay our shareholders a mandatory distribution equal to at least 25% of our adjusted net income for the preceding fiscal year, with holders of preferred shares having priority of payment. Our by-laws require us to pay holders of our preferred shares annual dividends equal to the greater of 8% (in the case of our class “A” preferred shares (subscribed on June 23, 1969) and 6% (in the case of our class “B” preferred shares (subscribed on June 24, 1969), calculated by reference to the capital stock portion of each type and class of stock. The priority minimum dividend payable to holders of our preferred shares must be paid whenever there is a net profit or, in the event of losses in that year, whenever a reserve of profits is available. If our net income is negative or insufficient in a fiscal year, our management may recommend at the annual shareholders’ meeting in respect of that year that the payment of the mandatory dividend should not be made. In these circumstances there is no impediment for the majority shareholder to further capitalize the Company, which could result in the dilution of the current shareholders’ shares.
You may not be able to exercise preemptive rights with respect to the preferred or common shares.
You may not be able to exercise the preemptive rights relating to the preferred or common shares underlying your ADSs unless a registration statement under the United States Securities Act of 1933, as amended, (the “Securities Act”), is effective with respect to those rights or an exemption from the registration requirements of the Securities Act is available. We are not obligated to file a registration statement with respect to the shares relating to these preemptive rights, and we cannot assure you that we will file any such registration statement. Unless we file a registration statement or an exemption from registration applies, you may receive only the net proceeds from the sale of your preemptive rights by the depositary or, if the preemptive rights cannot be sold, they will be allowed to lapse and accordingly your ownership position relating to the preferred or common shares will be diluted.
Changes in Brazilian tax laws may have an adverse impact on the taxes applicable to a disposition of our shares or ADSs.
Law No. 10,833 of December 29, 2003 provides that the disposition of assets located in Brazil by a non-resident to either a Brazilian resident or a non-resident is subject to taxation in Brazil, regardless of whether the disposition occurs outside or within Brazil. This provision results in the imposition of income tax on the gains arising from a disposition of our common or preferred shares by a non-resident of Brazil to another non-resident of Brazil. There is no judicial guidance as to the application of Law No. 10,833 of December 29, 2003 and, accordingly, we are unable to predict whether Brazilian courts may decide that it applies to dispositions of our ADSs between non-residents of Brazil. However, in the event that the disposition of assets is interpreted to include a disposition of our ADSs, this tax law would accordingly result in the imposition of withholding taxes on the disposition of our ADSs by a non-resident of Brazil to another non-resident of Brazil.
Because any gain or loss recognized by a U.S. Holder (as defined in “Item 10.E, Taxation – Material United States Federal Income Tax Consequences”) will generally be treated as a U.S. source gain or loss unless such credit can be applied (subject to applicable limitations) against tax due on the other income treated as derived from foreign sources, such U.S. Holder would not be able to use the foreign tax credit arising from any Brazilian tax imposed on the disposition of our common or preferred shares or our ADSs.
ITEM 4. INFORMATION ON THE COMPANY
Overview
Directly and through our subsidiaries, we are involved in the generation, transmission and distribution of electricity in Brazil. As of December 31, 2013, we controlled approximately 34% of the installed power generating capacity within Brazil. Through our subsidiaries, we are also responsible for approximately 50% of the installed transmission capacity above 230 kV in Brazil. Our revenues derive mainly from:
| • | the generation of electricity and its sale to electricity distribution companies and free consumers; |
| • | the transmission of electricity on behalf of other electricity concessionaires; and |
| • | the distribution of electricity to end consumers. |
- 24 -
Table of Contents
For the year ended December 31, 2013, we derived 70.0%, 18.6% and 18.9% of our net revenue (after eliminations) from our electricity generation, transmission and distribution businesses, respectively. For the year ended December 31, 2013, our net revenues were R$23,836 million, compared to R$28,014 million for the year ended December 31, 2012.
A. History and Development
General
We were established on June 11, 1962 as a mixed capital company with limited liability and unlimited duration. We are subject to Brazilian Corporate Law. Our executive offices are located at Avenida Presidente Vargas, 409, 13th Floor, Edifício Herm. Stolz, CEP 20071-003, Rio de Janeiro, RJ, Brazil. Our telephone number is +55 21 2514 4637. Our legal name is Centrais Elétricas Brasileiras S.A. – Eletrobras and our commercial name is Eletrobras.
Capital Expenditures
In the last five years, we have invested an average of R$6.1 billion per year in in expansion, modernization, research, infrastructure and environmental quality. Approximately 46% was invested in our generation segment, 34% in our transmission segment and the balance in our distribution segment and other investments.
Our core business is the generation, transmission and distribution of energy and we intend to invest heavily in these segments in the upcoming years.
Companies are now selected to construct new generation units and transmission lines by a tender process. It is, therefore, difficult to predict the precise amounts that we will invest in these segments going forward. We are, however, working to secure a significant number of new contracts either alone or as part of a consortium including the private sector.
According to the EPE 10 Year Plan, it is estimated that Brazil will have 155,736 km of transmission lines and 183,053 MW of installed generation capacity by 2022. These investments by Brazil will represent approximately R$260.38 billion. As the current largest player in the market based on length of transmission lines, we expect to participate in the majority of these new investments. In accordance with the Business Plan, we believe that over the next five years we will invest approximately R$52.4 billion in our generation, transmission and distribution businesses. For these investments, we expect to use the funding derived from our net cash flow as well as from accessing national and international capital markets and through bank financing.
Our capital expenditures for fixed assets, intangible assets and concession assets in 2013, 2012 and 2011 were R$5,712.1 million, R$7,199.8 million and R$11,569.9 million, respectively.
B. Business Overview
Strategy
Our main strategic objectives are to achieve sustained growth and profitability, while maintaining our position as a leader in the Brazilian electricity sector. In order to achieve these objectives, our main strategies are as follows:
| • | Expand and improve efficiency in our generation, transmission and distribution business. Our business is focused on our core operations in the Brazilian generation, transmission and distribution markets. Our strategy is to select and optimize opportunities that arise in the auction process for new generation plants and transmission lines in accordance with the Electricity Regulatory Law. By focusing on generation, transmission and distribution, we believe that we will be able to maximize profits by improving efficiency in the operation and maintenance of our assets and capitalizing on opportunities arising from greenfield projects or from the selective acquisition of existing assets. Our Corporate Strategy Plan for 2010 to 2020 sets as a target the achievement of a global leadership position in clean energy production by 2020, while keeping our rates of return at competitive levels. Our recently released Business and Management Director Plan for 2013 to 2017 foresees a five-year investment target of R$52,4 billion corresponding to a goal of new 13.2 GW of generation capacity and the addition of 19,000 km of transmission lines. |
| • | Renewed strategy for distribution business. With respect to our distribution segment, since 2008 we have adopted a renewed strategy for the management of our distribution companies in order to improve their operational efficiency. Their governance and management were reorganized, so that all companies now have the same board of directors and CEO. Initially, the new administration focused on improving each company’s quality of service and increasing its total income. Processes and policies were standardized in order to make the distribution business more efficient and to centralize the purchase of material and services as well as the negotiations with debtors. Although we have already made substantial progress in terms of efficiency, we |
- 25 -
Table of Contents
intend to continue to develop policies to further reduce any commercial and technical losses, improving the financial position of these subsidiaries. With this renewed focus and funding and technical guidance from the World Bank, we embarked upon a large project called “Energy +” in 2012. We believe that we will be able to achieve our operational efficiency goals by 2015. For further information about our distribution companies, please see “Item 4.B, Business Overview – Distribution – Distribution Companies.” |
| • | We seek to maintain high corporate governance standards and to promote sustainability in order to enhance our brand value as well as the market appreciation of our stock. Our shares are listed on the BM&FBOVESPA’s Level 1 segment and on the NYSE. We use compliance with the numerous regulations from the stock exchanges as a roadmap for the continuous implementation of best practices in corporate governance. Our current corporate governance standards fully reflect the orientations of our Corporate Strategic Plan for 2010 to 2020 and are included in the audit and administration manuals, the internal regulations of the Board of Directors and Audit Committee as well as our by-laws. We believe that improving our corporate governance standards will help us achieve growth, profitability and increased market share as a result of the positive effect these standards have on our brand, both domestically and internationally. As part of this strategy, we established controls and procedures, in accordance with the Sarbanes Oxley Act of 2002. For a further discussion of our internal controls please see “Item 15—Controls and Procedures.” In addition, we are a signatory to the United Nations Global Compact, the world’s largest corporate responsibility initiative, and, for the sixth consecutive year, were selected as a member of BM&FBOVESPA’s ISE Corporate Sustainability Index. We are also aiming to become a member of the Dow Jones Sustainability Index. In 2012, as an important first step, we were included in the Down Jones Sustainability Emerging Markets Index. We believe that membership these indices, and registration with organizations recognized for the most stringent governance standards in the world will enable us to significantly raise our global profile and reputation. We strive to maintain our leadership in an increasingly competitive market, positioning ourselves as a company that emphasizes social and environmental responsibility as a path to maintaining business sustainability, providing career development prospects as well as a good working environment for our employees and improved living standards for the communities that live close to our facilities and plants. In order to maintain our present market share, we are committed to the expansion of our generation, transmission and distribution businesses, focusing on improving the performance of our investments as well as our operational efficiency, restructuring our management model and expanding into international markets. |
| • | Selectively identify growth opportunities in certain international markets. In accordance with our Corporate Strategic Plan for 2010 to 2020, we are conducting feasibility studies for investments in neighboring countries, including Argentina, Colombia, Peru, Uruguay and Nicaragua. Our strategic goal is to generate new energy that can be added to the Interconnected Power System and to integrate certain electrical power systems in the Americas. In order to achieve sustainable growth, we believe that certain international electricity markets offer attractive opportunities, which could present an interesting trade-off when compared to the domestic market. We plan to selectively identify opportunities in these markets in the future. We may also identify and pursue growth opportunities outside South and Central America, mainly in Africa and North America, including renewable energy projects. |
Generation
Our principal activity is the generation of electricity. Net revenues (including financial revenues at the holding company level) from generation represented 72.2%, 70.6% and 64.7% of our total net revenues (after eliminations) in the years ended December 31, 2013, 2012 and 2011, respectively.
Pursuant to Law No. 5,899, of July 5, 1973, and Decree 4,550, of December 27, 2002, Eletrobras must sell all energy produced by Itaipu to distribution companies in the Southern, Southeastern and Midwestern regions in Brazil (see “Item 5, Operating and Financial Review and Prospects – Electric Power Market – Itaipu”).
We had an installed capacity of 42,987 MW as of December 31, 2013, 42,333 MW as of December 31, 2012 and 41,621 MW (including the 350 MW capacity of Candiota III, which is in operation since January 3, 2011) as of December 31, 2011. The increase in capacity over these periods reflects continuous growth. Additionally, we have approximately 13,700 MW in planned projects throughout Brazil through 2018, which are currently under construction, and we have begun feasibility studies for an additional approximately 20,300 MW.
- 26 -
Table of Contents
The map below shows the geographic location of our generation assets as of December 31, 2013:
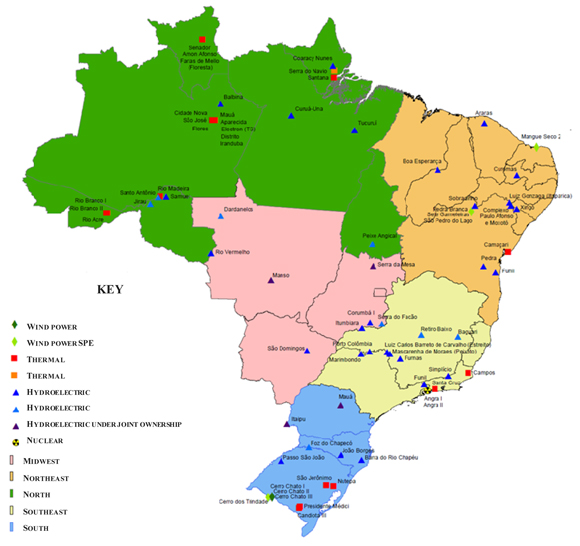
- 27 -
Table of Contents
Concessions
As of December 31, 2013, we operated under the following concessions/authorizations granted by ANEEL for our generation businesses:
Concessions/Authorizations | State | Type of Plant | Installed | End of Concession/ | Began Service | |||||||
Eletrobras CGTEE | ||||||||||||
São Jerônimo | Rio Grande do Sul | Thermal | 20.00 | July 2015 | April 1953 | |||||||
Presidente Médici | Rio Grande do Sul | Thermal | 446.00 | July 2015 | January 1974 | |||||||
Nutepa | Rio Grande do Sul | Thermal | 24.00 | July 2015 | February 1968 | |||||||
Candiota III | Rio Grande do Sul | Thermal | 350.00 | January 2024 | January 2011 | |||||||
Eletrobras Chesf | ||||||||||||
Funil(1) | Bahia | Hydroelectric | 30.00 | December 2042(8) | March 1962 | |||||||
Pedra(1) | Bahia | Hydroelectric | 20.00 | December 2042(8) | April 1978 | |||||||
Araras | Ceará | Hydroelectric | 4.00 | July 2015 | February 1967 | |||||||
Curemas | Bahia | Hydroelectric | 3.52 | November 2024 | June 1957 | |||||||
Paulo Afonso Complex and Moxotó (Apolônio Sales) | Bahia | Hydroelectric | 4,280.00 | December 2042(8) | January 1955 | |||||||
Sobradinho | Bahia | Hydroelectric | 1,050.30 | December 2042(8) | April 1979 | |||||||
Luiz Gonzaga | Pernambuco | Hydroelectric | 1,479.60 | December 20428) | February 1988 | |||||||
Boa Esperança | Piauí/Maranhão | Hydroelectric | 237.30 | December 2042(8) | January 1970 | |||||||
Xingó | Sergipe/Alagoas | Hydroelectric | 3,162.00 | December 2042(8) | April 1994 | |||||||
Piloto | Bahia | Hydroelectric | 2.00 | July 2015 | February 1949 | |||||||
Camaçari | Bahia | Thermal | 360.00 | August 2027 | February 1979 | |||||||
Dardanelos (7) | Mato Grosso | Hydroelectric | 261.00 | July 2042(8) | August 2011 | |||||||
Jirau(9) | Rondônia | Hydroelectric | 3,750.00 | August 2043 | October 2013 | |||||||
São Pedro do Lago | Bahia | Wind | 30.00 | February 2046 | January 2013 | |||||||
Pedra Branca | Bahia | Wind | 30.00 | February 2046 | January 2013 | |||||||
Sete Gameleiras | Bahia | Wind | 30.00 | February 2046 | January 2013 | |||||||
Eletrobras Eletronorte | ||||||||||||
Rio Acre | Acre | Thermal | 45.49 | Indefinite | April 1994 | |||||||
Rio Branco II | Acre | Thermal | 32.75 | Indefinite | April 1981 | |||||||
Rio Branco I | Acre | Thermal | 18.65 | Indefinite | February 1998 | |||||||
Santana | Amapá | Thermal | 177.74 | Indefinite | January 1993 | |||||||
Rio Madeira | Rondônia | Thermal | 119.35 | Indefinite | April 1968 | |||||||
Coaracy Nunes | Amapá | Hydroelectric | 78.00 | December 2042(8) | October 1975 | |||||||
Tucurui | Pará | Hydroelectric | 8,535.00 | July 2024 | November 1984 | |||||||
Samuel | Rondônia | Hydroelectric | 216.75 | September 2029 | July 1989 | |||||||
Curuá-Una(2) | Pará | Hydroelectric | 30.30 | July 2028 | July 1977 | |||||||
Senador Arnon Afonso Farias de Mello | Roraima | Thermal | 85.99 | Indefinite | December 1990 | |||||||
Serra do Navio(5) | Amapá | Thermal | 23.30 | May 2037 | November 2008 | |||||||
Electron (TG) | Amazonas | Thermal | 121.10 | Indefinite | June 2005 | |||||||
Dardanelos(7) | Mato Grosso | Hydroelectric | 261.00 | July 2042(8) | August 2011 | |||||||
Eletrobras Eletronuclear(3) | ||||||||||||
Angra I | Rio de Janeiro | Nuclear | 640.00 | Indefinite | January 1985 | |||||||
Angra II | Rio de Janeiro | Nuclear | 1,350.00 | Indefinite | September 2000 | |||||||
Eletrobras Eletrosul | ||||||||||||
Cerro Chato I | Rio Grande do Sul | Wind | 30.00 | August 2045 | November 2011 | |||||||
Cerro Chato II | Rio Grande do Sul | Wind | 30.00 | August 2045 | September 2011 | |||||||
Cerro Chato III | Rio Grande do Sul | Wind | 30.00 | August 2045 | May 2011 | |||||||
Passo São João | Rio Grande do Sul | Hydroelectric | 77.00 | August 2041 | July 2012 | |||||||
Mauá | Paraná | Hydroelectric | 363.00 | July 2042(8) | November 2012 | |||||||
São Domingos | Mato Grosso do sul | Hydroelectric | 48.00 | December 2037 | June 2013 | |||||||
Barra do Rio Chapéu | Santa Catarina | Small Hydroelectric | 15.15 | May 2037 | February 2013 | |||||||
Jõao Borges | Santa Catarina | Small Hydroelectric | 19.0 | December 2034 | July 2013 | |||||||
- 28 -
Table of Contents
Concessions/Authorizations | State | Type of Plant | Installed | End of Concession/ | Began Service | |||||||||
Eletrobras Holding | ||||||||||||||
Mangue Seco 2 | Rio Grande do Norte | Wind | 26.00 | July 2045 | September 2011 | |||||||||
Eletrobras Furnas | ||||||||||||||
Corumbá I | Goiás | Hydroelectric | 375.00 | November 2014 | April 1997 | |||||||||
Simplício | Rio de Janeiro/ Minas Gerais | Hydroelectric | 306.00 | August 2041 | June 2013 | |||||||||
Serra da Mesa | Goiás | Hydroelectric | 1,275.00 | December 2042(8) | April 1998 | |||||||||
Furnas | Minas Gerais | Hydroelectric | 1,216.00 | November 2038 | March 1963 | |||||||||
Itumbiara | Minas Gerais/Goiás | Hydroelectric | 2,082.00 | February 2020 | February 1980 | |||||||||
Marimbondo | São Paulo/Minas Gerais | Hydroelectric | 1,440.00 | December 2042(8) | April 1975 | |||||||||
Peixoto (Mascarenhas de Moraes) | Minas Gerais | Hydroelectric | 476.00 | October 2023 | April 1973 | |||||||||
Porto Colômbia | Minas Gerais | Hydroelectric | 320.00 | December 2042(8) | March 1973 | |||||||||
Manso | Mato Grosso | Hydroelectric | 212.00 | February 2035 | October 2000 | |||||||||
Funil(1) | Minas Gerais | Hydroelectric | 216.00 | December 2042(8) | April 1969 | |||||||||
Estreito | São Paulo | Hydroelectric | 1,050.00 | December 2042(8) | January 1969 | |||||||||
Campos(4) | Rio de Janeiro | Thermal | 30.00 | July 2007 | April 1977 | |||||||||
Santa Cruz | Rio de Janeiro | Thermal | 932.00 | December 2042(8) | March 1967 | |||||||||
Peixe Angical(5) | Tocantins | Hydroelectric | 452.00 | November 2036 | June 2006 | |||||||||
Baguari(5) | Minas Gerais | Hydroelectric | 140.00 | August 2041 | November 2009 | |||||||||
Retiro Baixo(5) | Minas Gerais | Hydroelectric | 82.00 | August 2041 | March 2010 | |||||||||
Foz do Chapecó(5) | Rio Grande do Sul | Hydroelectric | 855.00 | November 2036 | August 2010 | |||||||||
Serra do Facão(5) | Goiás | Hydroelectric | 212.60 | November 2036 | October 2010 | |||||||||
Santo Antônio | Rondônia | Hydroelectric | 3,568.80 | June 2043 | March 2012 | |||||||||
Itaipu(6) | ||||||||||||||
Itaipu Binacional | Paraná | Hydroelectric | 14,000.00 | Not applicable | — | |||||||||
Eletrobras Amazonas Energia | ||||||||||||||
Aparecida | Amazonas | Thermal | 282.05 | Indefinite | February 1984 | |||||||||
Mauá | Amazonas | Thermal | 738.10 | Indefinite | April 1973 | |||||||||
Balbina | Amazonas | Hydroelectric | 277.50 | March 2027 | January 1989 | |||||||||
UT CO Cidade Nova | Amazonas | Thermal | 29.70 | Indefinite | August 2008 | |||||||||
UT AS São José | Amazonas | Thermal | 73.40 | Indefinite | February 2008 | |||||||||
UT FO Flores | Amazonas | Thermal | 124.70 | Indefinite | August 2008 | |||||||||
UTE Iranduba | Amazonas | Thermal | 66.60 | Indefinite | November 2010 | |||||||||
UTE Distrito | Amazonas | Thermal | 51.30 | Indefinite | October 2010 | |||||||||
Others | Amazonas | Thermal | 439.00 | Indefinite | — | |||||||||
Eletrobras Distribuição Rondônia | ||||||||||||||
Rio Vermelho | Rondônia | Small Hydroelectric Central | 2.60 | Indefinite | November 1986 | |||||||||
Under Construction Suitable Plants | ||||||||||||||
Simplício | Rio de Janeiro/ Minas Gerais | Hydroelectric | 306 | August 2041 | February 2013 | |||||||||
Batalha | Minas Gerais/Goiás | Hydroelectric | 52.50 | August 2041 | May 2013 | |||||||||
São Domingos | Mato Grosso do Sul | Hydroelectric | 48.00 | December 2037 | March 2013 | |||||||||
Barra do Rio Chapéu | Santa Catarina | Small Hydroelectric Central | 15.00 | December 2035 | January 2013 | |||||||||
João Borges | Santa Catarina | Small Hydroelectric Central | 19.00 | December 2035 | April 2013 | |||||||||
Angra III | Rio de Janeiro | Nuclear | 1,405.00 | Indefinite | June 2016 | |||||||||
Casa Nova | Bahia | Wind | 180.00 | January 2045 | August 2013 | |||||||||
- 29 -
Table of Contents
Concessions/Authorizations | State | Type of Plant | Installed | End of Concession/ | Began Service | |||||||
Mauá 3 | Amazonas | Thermal | 589.61 | Indefinite | April 2014 | |||||||
Special Purpose Vehicle | ||||||||||||
Jirau(10) | Rondônia | Hydroelectric | 3,750.00 | August 2043 | April 2013 | |||||||
Santo Antônio(10) | Rondônia | Hydroelectric | 3,568.80 | June 2043 | March 2012 | |||||||
Belo Monte | Pará | Hydroelectric | 11,233.00 | August 2045 | February 2015 | |||||||
Miassaba 3 | Rio Grande do Norte | Wind | 68.50 | August 2045 | April 2013 | |||||||
Teles Pires | Mato Grosso/Pará | Hydroelectric | 1,820.00 | December 2046 | September 2014 | |||||||
Rei dos Ventos 1 | Rio Grande do Norte | Wind | 58.45 | December 2045 | June 2013 | |||||||
Rei dos Ventos 3 | Rio Grande do Norte | Wind | 60.12 | December 2045 | May 2013 | |||||||
Livramento Complex | Rio Grande do Sul | Wind | 78.00 | April 2047 | March 2013 | |||||||
Santa Vitória do Palmar Complex | Rio Grande do Sul | Wind | 258.00 | March 2047 | November 2013 | |||||||
Chuí Complex | Rio Grande do Sul | Wind | 144.00 | March 2047 | October 2014 | |||||||
Famosa I | Rio Grande do Norte | Wind | 22.50 | May 2042 | July 2014 | |||||||
Pau-Brasil | Ceará | Wind | 15.00 | March 2042 | July 2014 | |||||||
Rosada | Rio Grande do Norte | Wind | 30.00 | September 2042 | July 2014 | |||||||
São Paulo | Ceará | Wind | 17.50 | March 2042 | July 2014 | |||||||
| (1) | Approval for the renovation of the environmental licenses of both Funil and Pedra has been requested but the licences have not yet been granted. However, this does not affect the operations at either plant. |
| (2) | This plant was transferred from Celpa to Eletrobras Eletronorte in December 2005 as payment for outstanding debts owed by Celpa to Eletrobras Eletronorte relating to sales of energy. |
| (3) | The nuclear plants are authorized to operate for 40 years from the date on which they commenced operations. A few years prior to this due expiration date, each applicable nuclear energy company may request an extension of its respective permit from CNEN. In order to obtain an extension, CNEN may request the replacement of certain equipment. For example, in the case of Angra I, CNEN requested the replacement of a steam generator following our request to extend the permit by 20 years. |
| (4) | This plant is not operational. |
| (5) | Serra do Navio, Peixe Angical, Baguari, Retiro Baixo, Foz do Chapecó, Serra do Facão and Santo Antônio are special purpose entities in which we hold an ownership interest of 49.0%, 40.0%, 15.0%, 49.0%, 40.0%, 49.5%, and 39.0%, respectively. Figures in this table refer to the total capacity of each plant. |
| (6) | Itaipu does not operate pursuant to a concession but rather the Itaipu Treaty that expires in 2023. We own 50.0% of Itaipu Binacional. |
| (7) | Our subsidiaries Eletrobras Eletronorte and Eletrobras Chesf both owned 24.0% of this unit. Figure in this table refers to the total capacity of the plant. |
| (8) | Renewed pursuant to Law No. 12,783. |
| (9) | Our subsidiaries Eletrobras Eletrosul and Eletrobras Chesf both owned 20.0% of this unit. Figure in this table refers to the total capacity of the plant. |
| (10) | Plants in test phase or under construction and, accordingly, operating at reduced capacity. |
Source: internal sources.
Types of Plants
Hydroelectric power plants accounted for 88.0% of our total power generated in 2013, compared to 89.7% in 2012 and 90.7% in 2011.
We also generate electricity through our thermal and nuclear plants. Thermal plants accounted for 5.1% of our total power generated in 2013, compared to 4.0% in 2012 and 2.9% in 2011. Nuclear plants accounted for 6.9% of our total power generated in 2013, compared to 6.3% in 2012 and 6.4% in 2011.
- 30 -
Table of Contents
The following table sets out the total amount of electricity generated in the periods indicated, measured in megawatt hours, broken down by type of plant:
| Year Ended December 31, | ||||||||||||
| 2013 | 2012 | 2011(2) | ||||||||||
| (MWh) | ||||||||||||
Type of plant: | ||||||||||||
Hydroelectric(1) | 202,649,175 | 229,916,793 | 221,787,327 | |||||||||
Thermal | 11,761,506 | 10,353,648 | 7,013,394 | |||||||||
Nuclear | 15,829,384 | 16,006,532 | 15,644,251 | |||||||||
|
|
|
|
|
| |||||||
Total(3) | 230,240,065 | 256,276,973 | 244,444,973 | |||||||||
|
|
|
|
|
| |||||||
| (1) | Including 100% of the Itaipu plant. |
| (2) | Does not consider energy generated by SPEs in which we hold equity interests. |
| (3) | Does not consider MWh produced by any wind plant. |
Hydroelectric Plants
Hydroelectric plants are our most cost-efficient source of electricity, although efficiency is significantly dependent on meteorological factors, such as the level of rainfall. Based on our experience with both types of plants, we believe construction costs for hydroelectric plants are higher than for thermal plants; however, the average useful life of hydroelectric plants is longer. We use our hydro-powered plants to provide the bulk of our primary and back-up electricity generated during peak periods of high demand. During periods of rapid change in supply and demand, hydroelectric plants also provide greater production flexibility than our other forms of electric generation because we are able to instantly increase (or decrease) output from these sources, in contrast to thermal or nuclear facilities where there is a time lag while output is adjusted.
As of December 31, 2013, we owned and operated 33 hydroelectric plants. In addition, we hold a 50.0% interest in Itaipu, the other 50.0% of which is owned by a Paraguayan governmental entity and participations in the Peixe Angical (40.0%), Jirau (40.0%), Serra do Facão (49.5%), Retiro Baixo (49.0%), Foz do Chapecó (40.0%), Baguari (15.0%), Dardanelos (49%) and Santo Antônio (49.0%) plants. Also, we have participation in the Serra Mesa (48.5%), Manso (70.0%) and Mauá (49.0%). The ONS is solely responsible for determining, in any year, how much electricity each of our plants should generate. As of December 31, 2013, the total installed capacity of our hydroelectric plants was 46,105 MW (including 50.0% of Itaipu and our participations in the SPEs referred to above). The following table sets out information with respect to hydroelectric plants owned by us and with partners as of December 31, 2013 and for the year then ended:
| Installed(1) Capacity | Assured Energy(2) | Began Service | ||||||||||
| (MW) | ||||||||||||
Hydroelectric plants: | ||||||||||||
Funil (Eletrobras Chesf) | 30.0 | 13.95 | 1962 | |||||||||
Pedra | 20.0 | 3.74 | 1978 | |||||||||
Araras | 4.0 | — | 1967 | |||||||||
Curemas | 3.52 | 1.00 | 1957 | |||||||||
Piloto, Paulo Afonso complex and Moxotó | 4,269.6 | 2,225.00 | 1955 | |||||||||
Sobradinho | 1,050.3 | 531.00 | 1979 | |||||||||
Luiz Gonzaga | 1,479.6 | 959.00 | 1988 | |||||||||
Boa Esperança | 237.0 | 143.00 | 1970 | |||||||||
Xingó | 3,162.0 | 2,139.00 | 1994 | |||||||||
Coaracy Nunes(3) | 78.0 | — | 1975 | |||||||||
Tucurui complex | 8,535.0 | 4,140.00 | 1984 | |||||||||
Samuel(3) | 216.8 | 92.7 | 1989 | |||||||||
Curuá-Una(3) | 30.3 | 24.00 | 1977 | |||||||||
Furnas | 1,216.0 | 598.00 | 1963 | |||||||||
Estreito | 1,050.0 | 495.00 | 1969 | |||||||||
Peixoto (Mascarenhas de Morais) | 476.0 | 295.00 | 1973 | |||||||||
Porto Colômbia | 320.0 | 185.00 | 1973 | |||||||||
Marimbondo | 1,440.0 | 726.00 | 1975 | |||||||||
Itumbiara | 2,082.0 | 1,015.00 | 1980 | |||||||||
Funil (Eletrobras Furnas) | 216.0 | 121.00 | 1969 | |||||||||
Corumbá I | 375.0 | 209.00 | 1997 | |||||||||
Simplício | 306.0 | 192.0 | 2013 | |||||||||
Serra da Mesa(4) | 1,275.0 | 671.00 | 1998 | |||||||||
- 31 -
Table of Contents
| Installed(1) Capacity | Assured Energy(2) | Began Service | ||||||||||
| (MW) | ||||||||||||
Manso(4) | 212.0 | 92.00 | 2000 | |||||||||
Passo São João | 77.0 | 41.1 | 2012 | |||||||||
Mauá(13) | 363.0 | 117.8 | 2012 | |||||||||
São Domingos | 48.0 | 36.0 | 2013 | |||||||||
Barra do Rio Chapéu | 15.15 | 8.61 | 2013 | |||||||||
João Borges | 19.0 | 10.14 | 2013 | |||||||||
Itaipu(6) | 14,000.0 | 8,577.00 | 1985 | |||||||||
Rio Vermelho | 2.6 | 2.0 | 1986 | |||||||||
Balbina(3) | 277.5 | — | 1989 | |||||||||
Peixe Angical(5) | 452.0 | 271.00 | 2006 | |||||||||
Baguari(7) | 140.0 | 80.00 | 2009 | |||||||||
Retiro Baixo(8) | 82.0 | 39.00 | 2010 | |||||||||
Foz do Chapecó(10) | 855.0 | 432.00 | 2010 | |||||||||
Serra do Facão(9) | 212.6 | 182.40 | 2010 | |||||||||
Santo Antônio(12) | 3,568.8 | 2,342.03 | 2012 | |||||||||
Dardanelos(11) | 261.0 | 154.90 | 2011 | |||||||||
Jirau(14) | 3,750.0 | 2,184.6 | 2013 | |||||||||
| (1) | The installed capacity of Itaipu is 14,000 MW. Itaipu is equally owned by Brazil and Paraguay. |
| (2) | Assured energy is the maximum amount per year that each plant is permitted to sell in auctions/supply to the Interconnected Power System, an amount determined by ONS. Any energy produced in excess of assured energy is sold in the Free Market. |
| (3) | The Balbina, Curuá-Una, Samuel and Coaracy Nunes plants are part of the isolated system and do not have an assured energy restriction. |
| (4) | We own 48.46% of the Serra Mesa plant and 70.0% of the Manso plant. Figures in this table refer to the entire capacity/utilization of each plant. |
| (5) | We own 40.0% of the Peixe Angical plant. Figures in this table refer to the entire capacity/utilization of the plant. |
| (6) | We own 50.0% of the Itaipú plant. Figures in this table refer to the entire capacity/utilization of the plant. |
| (7) | We own 15.0% of the Baguari plant. Figures in this table refer to the entire capacity/utilization of the plant. |
| (8) | We own 49.0% of the Retiro Baixo plant. Figures in this table refer to the entire capacity/utilization of the plant. |
| (9) | We own 49.5% of the Serra do Facão plant. Figures in this table refer to the entire capacity/utilization of the plant. |
| (10) | We own 40.0% of the Foz do Chapecó plant. Figures in this table refer to the entire capacity/utilization of the plant. |
| (11) | We own 49.0% of the Dardanelos plant. |
| (12) | We own 49.0% of the Santo Antônio plant. As of December 31, 2013, the installed operating capacity was 1,128 MW. |
| (13) | We own 49.0% of the Mauá plant. |
| (14) | We own 40.0% of the Jirau plant. |
The following table describes the energy generated by the hydroelectric plants owned by us, the assured energy and the actual operational utilization. We have converted the measurement of the assured energy to MWh so that we can compare it against the energy generated.
| Assured Energy | Generated Energy(1) | Actual Operational Utilization | ||||||||||
| ( MWh) | (%) | |||||||||||
Hydroelectric plants: | ||||||||||||
Funil (Eletrobras Chesf) | 122,202 | 29,346 | 24.01 | |||||||||
Pedra | 32,762 | 2,779 | 8.48 | |||||||||
Araras | 0 | 0 | — | |||||||||
Curemas | 8,760 | 2,004 | 22.87 | |||||||||
Piloto, Paulo Afonso complex and Moxotó | 19,491,000 | 11,442,669 | 58.71 | |||||||||
Sobradinho | 4,651,560 | 1,987,823 | 42.73 | |||||||||
Luiz Gonzaga | 8,400,840 | 4,958,192 | 59.02 | |||||||||
Boa Esperança | 1,252,680 | 714,387 | 57.03 | |||||||||
Xingó | 18,737,640 | 12,677,103 | 67.66 | |||||||||
Coaracy Nunes(2) | — | 595,111 | — | |||||||||
Tucurui complex | 36,266,400 | 39,190,227 | 108.06 | |||||||||
Samuel | 812,052 | 721,12 | 88.80 | |||||||||
Curuá-Una(2) | 210,240 | 204,391 | 97.22 | |||||||||
Furnas | 5,238,480 | 3,908,676 | 74.61 | |||||||||
Estreito | 4,336,200 | 3,294,823 | 75.98 | |||||||||
Peixoto (Mascarenhas de Morais) | 2,584,200 | 2,168,514 | 83.91 | |||||||||
Porto Colômbia | 1,620,600 | 1,626,466 | 100.36 | |||||||||
Marimbondo | 6,359,760 | 5,852,377 | 92.02 | |||||||||
- 32 -
Table of Contents
| Assured Energy | Generated Energy(1) | Actual Operational Utilization | ||||||||||
| ( MWh) | (%) | |||||||||||
Itumbiara | 8,891,400 | 5,530,206 | 62.20 | |||||||||
Funil (Eletrobras Furnas) | 1,059,960 | 993,720 | 93.75 | |||||||||
Corumbá I | 1,830,840 | 1,931,098 | 105,48 | |||||||||
Simplício | 1,681,920 | 576,534 | 34.28 | |||||||||
Serra da Mesa(3) | 5,877,960 | 2,805,416 | 47.73 | |||||||||
Manso(3) | 805,920 | 453,078 | 56.22 | |||||||||
Passo São João | 360,036 | 350,077 | 97.23 | |||||||||
Mauá(5) | 848,844 | 401,337 | 47.28 | |||||||||
São Domingos | 318,864 | 157,328 | 49.34 | |||||||||
Barra do Rio Chapéu | 75,424 | 64,474 | 85.48 | |||||||||
João Borges | 88,826 | 37,112 | 41.78 | |||||||||
Rio Vermelho | 17,520 | 18,664 | 106.53 | |||||||||
Balbina | — | 1,323,889 | — | |||||||||
|
|
|
|
|
| |||||||
Total(1) | 131,982,890 | 104,019,040 | 78.81 | |||||||||
| (1) | Excluding (i) Itaipu, which is owned equally by Brazil and Paraguay; and (ii) any energy generated through our participation in SPEs. |
| (2) | The Balbina, and Coaracy Nunes plants are part of the isolated system and do not have an assured energy restriction. |
| (3) | We own 48.46% of the Serra Mesa plant and 70.0% of the Manso plant. |
| (4) | This percentage is based on the average operational utilization. |
| (5) | We own 49.0% of the Mauá plant. |
See “ – Concessions” for information on the hydroelectric power plants operated by Eletrobras Chesf, Eletrobras Eletronorte and Eletrobras Furnas.
Hydroelectric utilities in Brazil are required to pay royalty fees to the Brazilian states and municipalities in which a plant is located or in which land may have been flooded by a plant’s reservoir for the use of hydrological resources. Fees are established independently by each state and/or municipality as applicable and are based on the amount of energy generated by each utility and are paid directly to the states and municipalities. Fees for the states and municipalities in which we operate were R$406 million in 2013, compared to R$668 million in 2012 and R$1,329 million in 2011. These fees are recorded as operating costs in our consolidated financial statements.
Our subsidiaries have acquired concessions for the construction of 8 new hydroelectric power plants. Information regarding these new plants is set out in the table below:
| Installed Capacity | Construction began | Service begins(1) | ||||||
| (MW) | ||||||||
New plants: | ||||||||
Batalha(3) | 52.5 | June 2008 | January 2014 | |||||
Santo Antônio(2) | 3,568.8 | September 2008 | March 2012 | |||||
Belo Monte | 11,233.0 | June 2011 | February 2015 | |||||
Teles Pires | 1,820.0 | August 2011 | September 2014 | |||||
Santo Cristo | 19.5 | August 2013 | December 2014 | |||||
Coxilha Rica | 18.0 | August 2013 | — | |||||
São Manoel | 700.0 | — | May 2018 | |||||
Sinop | 400.0 | April 2014 | January 2018 | |||||
Jirau(4) | 3,750 | December 2009 | September 2013 | |||||
| (1) | Estimated dates based on current timetable. |
| (2) | Sixteen turbines operating, totaling 1,128MW of installed capacity. |
| (3) | Batalha will be operated only by Eletrobras Furnas. |
| (4) | One turbine operating, totalling 75MW of installed capacity. |
São Domingos, João Borges and Santo Cristo will be operated solely by our subsidiary Eletrobras Eletrosul. Santo Antônio will be operated by Furnas and partners. Teles Pires will be operated by our subsidiaries Eletrobras Furnas and Eletrobras Eletrosul with partners. Jirau will be operated by our subsidiaries Eletrobras Eletrosul and Eletrobras Chesf with third parties and. Belo Monte will be operated by Eletrobras holding, Eletrobras Eletronorte and Eletrobras Chesf. We intend to finance these plants from cash flow from operations, and, if necessary, from financing obtained in the international capital markets and/or multilateral agencies.
- 33 -
Table of Contents
On August 19, 2011, IBAMA granted Companhia Hidrelétrica Teles Pires an installation license for the construction of UHE Teles Pires on the Teles Pires River. The plant’s dam will be located between the States of Mato Grosso and Pará. Companhia Hidrelétrica Teles Pires is a SPE whose main shareholders are Neoenergia (50.1%), Eletrobras Eletrosul (24.5%), Eletrobras Furnas (24.5%) and Odebrecht Participações e Investimentos (0.9%). These companies form the Teles Pires Energia Eficiente consortium.
Thermal Plants
As of December 31, 2013, we owned and operated 124 thermal plants. In addition, we hold a 49.00% interest in the Serra do Navio plant. Thermal plants include coal and oil power generation units. The total installed capacity of our thermal plants was 4,556 MW as of December 31, 2013, compared to 4,555 MW as of December 31, 2012 and 4,535 MW as of December 31, 2011.
The following table sets out information regarding our thermal plants as of December 31, 2013 and for the year ended:
| Installed Capacity | Generated Energy(2) | Assured Energy(1) | ||||||||||
| (MW) | (MWh) | (MWh) | ||||||||||
Thermal plants: | ||||||||||||
P. Médici (Candiota) | 446.00 | 806,809 | 2,203,140 | |||||||||
S. Jerônimo (Candiota) | 20.00 | 22,598 | 110,376 | |||||||||
Candiota III | 350.00 | 2,007,012 | 2,658,660 | |||||||||
Nutepa (Candiota) | 24.00 | — | 53,436 | |||||||||
Santa Cruz | 932.00 | 2,372,774 | 6,018,120 | |||||||||
Campos | 30.00 | 218 | 183,960 | |||||||||
Camaçari | 346.80 | 1,095,044 | 2,013,048 | |||||||||
Electron | 12.11 | 8,761 | — | |||||||||
Rio Madeira | 119.35 | — | — | |||||||||
Santana | 177.74 | 577,826 | — | |||||||||
RioBranco I | 18.65 | — | — | |||||||||
RioBranco II | 32.75 | — | — | |||||||||
Rio Acre | 45.49 | — | — | |||||||||
Mauá | 738.10 | 1,464,493 | — | |||||||||
Senador Arnon Farias de Mello | 85.99 | — | — | |||||||||
Aparecida | 282.50 | 1,088,864 | — | |||||||||
Cidade Nova | 29.60 | 81,517 | — | |||||||||
São José | 73.40 | 244,741 | — | |||||||||
Flores | 124.70 | 400,173 | — | |||||||||
Distrito | 51.30 | 147,992 | — | |||||||||
Iranduba | 66.60 | 168,460 | — | |||||||||
Others in the Isolated System | 439.85 | 1,274,224 | — | |||||||||
|
|
|
|
|
| |||||||
Total | 4,556.00 | 11,761,506 | 13,240,740 | |||||||||
|
|
|
|
|
| |||||||
| (1) | Assured Energy is only determined in respect of plants from the Interconnected Power System, but not the Isolated system. Most of our thermal plants are part of the Isolated system. |
| (2) | Generated Energy does not include energy generated through our participations in SPEs. |
In December 2005, our subsidiary Eletrobras CGTEE was granted authorization to begin construction on an extension of the Candiota thermal plant. This extension has increased the installed capacity of the Candiota thermal plant by 350 MW and will require an investment of approximately R$939 million. Construction on this extension began in July 2006 and commercial operation commenced in January 2011.
Each of our thermal plants operates on coal and/or oil. The fuel for the thermal plants is delivered by road, rail, pipeline or waterway, depending on the plant’s location.
Although we do not have alternatives if our sources of these raw materials become unavailable or uneconomical, we have spare capacity in our hydroelectric plants and we are increasing our investment in transmission lines, which when completed, will allow us to partially compensate for any disruption in supplies. We are not subject to price volatility with respect to these raw materials because the Brazilian Government and entities that the Brazilian Government controls regulate prices, which they set annually.
We seek to operate our thermal plants at a consistent, optimal level in order to provide a constant source of electricity production. Our thermal plants are significantly less efficient and have significantly shorter useful lives, than our
- 34 -
Table of Contents
hydroelectric plants. We incurred gross expenditure for fuel purchased for energy production of R$1,492 million for 2013, compared to R$709 million for 2012 and R$163 million for 2011, which are reimbursed to us from the CCC Account in accordance with Law No. 12,111.
We have recovered a substantial portion of the thermal plants’ excess operating costs, which correspond to the difference between the cost of a thermal plant and the cost of a hydroelectric plant, through reimbursements pursuant to the CCC Account. The Brazilian Government created the CCC Account in 1973 for the purpose of building financial reserves to cover the costs of using fossil fuel thermal power plants, which are more expensive to operate than hydroelectric plants, in the Basic Network and the Interconnected Power System should a power shortage create a need for increased production of thermal power plants. Consumers through electricity distributors in Brazil are required to contribute annually to the CCC Account, which in effect serves as an insurance fund against an extraordinary situation, such as a rainfall shortage, which would require increased use of thermal plants. The aggregate amount of the annual required contribution is calculated on the basis of the current year’s cost of fuel estimates for all thermal plants. Each utility is then allocated a proportional contribution towards the aggregate amount based on such utility’s total electricity sales during the previous year. In 1993, the scope of the CCC Account was extended to include a portion of the costs of thermal electricity generation in isolated, non-integrated grids in remote areas of Brazil’s northern region.
Each of CGTEE, Amazonas Energia, Eletrobras Distribuição Rondônia and Eletrobras Eletronorte receives CCC Account reimbursement for its thermal plant fuel costs, thereby reducing the operating costs of each of their plants. We administer the CCC Account. Reimbursements from the CCC Account for the fuel costs of thermal plants connected to the Basic Network are being phased out in conjunction with the development of a competitive wholesale market. In the event of a complete phase out of the CCC Account, we will have to bear the entire operating costs of our thermal plants.
The following tables set forth information relating to the price paid and amount of fuel purchased for use in our thermal plants in the periods indicated:
| Year Ended December 31, | ||||||||||||
| 2013 | 2012 | 2011 | ||||||||||
| (R$ thousands) | ||||||||||||
Type of fuel | ||||||||||||
Coal | 138,676 | 144,000 | 95,719 | |||||||||
Light oil | 3,716,258 | 4,571,130 | 3,872,179 | |||||||||
Crude Oil | 32,079 | 36,000 | 30,529 | |||||||||
Gas | 990,070 | 100,690 | 30,549 | |||||||||
Uranium | 298,800 | 309,600 | 294,800 | |||||||||
|
|
|
|
|
| |||||||
Total | 5,175,883 | 5,161,400 | 4,323,776 | |||||||||
|
|
|
|
|
| |||||||
| Year Ended December 31, | ||||||||||||
| 2013 | 2012 | 2011 | ||||||||||
Type of fuel | ||||||||||||
Coal (tons) | 3,196,524 | 2,711,544 | 1,957,566 | |||||||||
Light oil (litres) | 887,443,900 | 1,063,497,912 | 681,019,419 | |||||||||
Crude Oil (tons) | 29,351 | 33,725 | 25,879,055 | |||||||||
Gas (m3) | 1,556,833,498 | 259,552,623 | 46,446,077 | |||||||||
Uranium (Kg) | 251,596 | 282,010 | 263,345 | |||||||||
Nuclear Plants
Nuclear power plants represent a relatively costly source of electricity for us. The Brazilian Government, however, has a special interest in the continuing existence of nuclear power plants in Brazil and is required by law to maintain ownership and control over these plants. Accordingly, we expect to continue to own 99.9% of Eletrobras Eletronuclear.
Through Eletrobras Eletronuclear, we operate two nuclear power plants, Angra I, with an installed capacity of 640 MW and Angra II, with 1,350 MW. In addition, Eletrobras Eletronuclear started the construction of a new nuclear plant, called Angra III, during the second half of 2009. The construction is estimated to take between 3 and 5.5 years. On March 5, 2009, IBAMA issued an installation license to Eletrobras Eletronuclear with a validity of 6 years and on March 9, 2009, CNEN issued a partial construction license to Eletrobras Eletronuclear. Once constructed, we estimate that Angra III will have an installed capacity of 1,405 MW and that the cost of its construction will be approximately R$13.1 billion.
- 35 -
Table of Contents
The following table sets out information regarding our nuclear plants as of December 31, 2013 and for the year then ended:
| Installed Capacity | Generated Energy | Assured Energy(1) | Began Service(2) | |||||||||||
| (MW) | (MWh) | (MWh) | ||||||||||||
Nuclear plant: | ||||||||||||||
Angra I | 640 | 4,448,618 | 4,465,848 | January 1, 1985 | ||||||||||
Angra II | 1,350 | 11,380,766 | 10,553,172 | September 1, 2000 | ||||||||||
|
|
|
|
|
| |||||||||
Total | 1,990 | 15,829,384 | 15,019,020 | |||||||||||
|
|
|
|
|
| |||||||||
| (1) | For our nuclear plants, assured energy is not limited by ONS or any other regulatory body. |
| (2) | Commercial operation in: Angra I – January 1985 and Angra II – September 2000. |
We estimate that Angra I will be operating at 88% capacity in 2014 in line with industry standards. Accordingly, the assured energy of Angra I will be 4,051,537.7 MWh/yr in 2014.
We also estimate that Angra II will be operating at 91% capacity in 2014 in line with industry standards. Accordingly, the assured energy of Angra II will be 9,750,657.00 MWh/yr in 2014.
Both Angra I and Angra II utilize uranium obtained pursuant to a contract with INB, a Brazilian Government-owned company responsible for processing uranium used in nuclear plants. The fuel elements are shipped by truck to the nuclear plant and under the terms of the contract; Eletrobras Eletronuclear bears responsibility for the safe delivery of that fuel. To date, Eletrobras Eletronuclear (and the previous owner of Angra I – Eletrobras Furnas) has experienced no material difficulty in the transportation of fuel to Angra I and Angra II. In addition, low-level nuclear waste (such as filters and certain resins) is stored in specially designed containers in an interim storage site on the grounds of the plants. As is the case with many other countries, Brazil has not yet devised a permanent storage solution for nuclear waste. High-level nuclear waste (spent nuclear fuel) is stored in the fuel cells (compact storage racks in the fuel pool) of the plants. The liability relating to the decommissioning of nuclear power plants Angra I and Angra II commenced at the same time as the operations began at these two units in 1985 and 2000, respectively. The amount of this provision is supported by a technical report of a working group of Eletrobras Eletronuclear created in 2001. In relation to Angra I, the estimated decommissioning cost as of December 31, 2013 would have been U.S.$432 million and in relation to Angra II, the estimated decommissioning cost as of December 31, 2013 would have been U.S.$530 million. The economic useful life of the plants was estimated to be 40 years. Eletrobras Eletronuclear makes provisions for the estimated present value of the decommissioning costs related to Angra I and Angra II.
The electricity generated by Eletrobras Eletronuclear during the year ended December 31, 2013 was soldpro rata among a group of energy distribution companies at a regulated price pursuant to ANEEL Resolution No. 1,405/14. These sales resulted in a fixed income of R$1,882 million during the year ended December 31, 2013.
Sales of Electricity Generated
We sold approximately R$18,077 million of electricity generated in 2013, compared to R$21,415 million in 2012 and R$20,608 million in 2011. These sales are made only to distribution companies (which constitute the main sources of sales of electricity generated) or free consumers. We own certain distribution companies that operate in the northern and northeastern regions of Brazil and we sell a relatively small portion of the electricity we generate to these distribution companies, which does not give rise to revenues in our generation segment as discussed in “ – Distribution.”
We sell the electricity generated pursuant to both supply contracts with industrial end-users and to an auction process for sales to distribution companies. The following table sets forth, by type of sale, sales of electricity generated in the regions we served in the periods presented:
| Year Ended December 31, | ||||||||||||||||||||||||
| 2013 | 2012 | 2011 | ||||||||||||||||||||||
| (R$ thousands) | (MWh) | (R$ thousands) | (MWh) | (R$ thousands) | (MWh) | |||||||||||||||||||
Type of sale: | ||||||||||||||||||||||||
Through auctions and initial contracts (energy charge) | 5,758,786 | 119,127,743 | 10,353,618 | 123,899,079 | 12,752,931 | 121,534,206 | ||||||||||||||||||
Through free market agreements or bilateral contracts (energy charge) | 5,179,433 | 51,522,379 | 4,791,900 | 47,820,840 | 4,311,341 | 54,777,952 | ||||||||||||||||||
Itaipu | 7,138,762 | 88,467,305 | 6,269,438 | 88,783,159 | 5,772,654 | 83,486,772 | ||||||||||||||||||
|
|
|
|
|
|
|
|
|
|
|
| |||||||||||||
Total | 18,076,981 | 259,117,427 | 21,414,956 | 260,503,078 | 22,836,926 | 259,798,930 | ||||||||||||||||||
|
|
|
|
|
|
|
|
|
|
|
| |||||||||||||
- 36 -
Table of Contents
With respect to supply contracts, the amount that we receive from each sale is determined on the basis of a “capacity charge” and “energy charge” (or, in some cases, both). A capacity charge is based on a guaranteed capacity amount specified in MW and is charged without regard to the amount of electricity actually delivered. The charge is for a fixed amount (and so is not dependent on the amount of electricity that is actually supplied). In contrast, an energy charge is based on the amount of electricity actually used by the recipient (and is expressed in MWh). Our purchases of Itaipu electricity, and our sales of Itaipu electricity to distributors, are paid for on the basis of a capacity charge (including a charge for transmission paid to Eletrobras Furnas). Our sales of electricity (through our subsidiaries Eletrobras Chesf and Eletrobras Eletronorte) to final consumers, especially to industrial customers, are billed on the basis of both a capacity charge and an energy charge. With respect to auction sales, as discussed in “The Brazilian Power Industry – Regulation under the Electricity Regulatory Law,” invitations to participate in auctions are prepared by ANEEL and, in the event that we are successful, we enter into sale and purchase contracts with the relevant distribution company for an amount of electricity that is proportionate to such company’s estimated demand over the contract period.
Transmission
Transmission of Electricity
Billings in our transmission segment are fixed by ANEEL, which sets a fixed billing each year. Net revenues (including financial revenues at the holding company level) from transmission represented 19% of our total net revenues (after eliminations) in 2013, compared to 25.5% in 2012 and 26.3% in 2011. The electricity that we generate is transported through Brazil’s tension transmission network, with 53,706 km of transmission lines belonging to us above 230 kV as of December 31, 2013, compared to 52,516 km in 2012 and 53,923 km as of December 31, 2011. Including our partnerships with private companies in SPCs/Consortia we have approximately 63,283 km above 138 KV in operation as of December 31, 2013. For further information, see “ – Lending and Financing Activities – Equity Participation.” In Brazil, the majority of hydroelectric plants are located a considerable distance from the major load centers and therefore, in order to reach consumers, an extensive transmission system has been developed. Transmission is the bulk transfer of electricity, at very high voltages (from 230 kV to 750 kV), from the generation facilities to the distribution systems at the load centers by means of the transmission grid. There is one Interconnected Power System in Brazil that links the northern and northeastern regions to the south and southeast regions. Coordinating the transmission systems is necessary to optimize the investments and operating costs and to ensure reliability and adequate load supply conditions throughout the Interconnected Power System.
- 37 -
Table of Contents
The map below shows the geographic location of our transmission assets as of December 31, 2013:
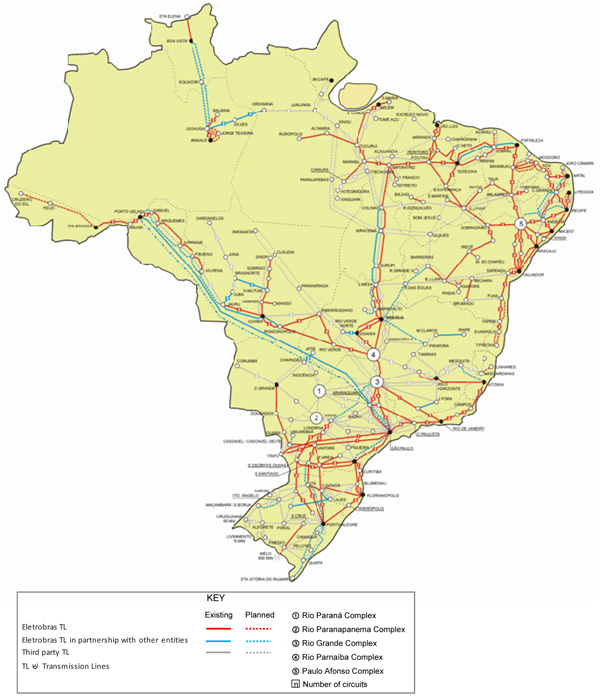
- 38 -
Table of Contents
Transmission Concessions
As of December 31, 2013, our transmission operations were carried out pursuant to the following concessions granted by ANEEL (excluding transmission operations carried out through any SPEs):
| Total length | Voltage Levels | Average years remaining of concession | ||||||||||
| (km) | (kV) | |||||||||||
Eletrobras Furnas | 19,868.0 | 69 – 750 | 28.3 | |||||||||
Eletrobras Chesf | 19,343.7 | 69 – 500 | 28.7 | |||||||||
Eletrobras Eletrosul | 10,703.0 | 69 – 500 | 28.1 | |||||||||
Eletrobras Eletronorte | 9,983.0 | 69 – 500 | 27.2 | |||||||||
Eletrobras Amazonas Energia | 673.0 | 69 – 230 | Not applicable | |||||||||
Due to the development of the hydroelectric resources of the Amazon region, which requires the transmission of large amounts of energy, Brazil has developed the Interconnected Power System. A national transmission grid provides generators with access to customers in all regions. Eletrobras Furnas and Eletrobras Eletronorte built the first north-south transmission system linking the northern and southern regions of Brazil, which consists of approximately 1,250 km of 500 kV transmission lines and which began operation in 1998. A second north-south transmission system, the construction of which was funded by the private sector, began operation in 2004. The following table sets forth the length of transmission lines (in km) by subsidiary and by voltage as of December 31, 2013:
| 750 kV | 600 kV (DC)(1) | 525/500 kV | 345 kV | 230 kV | 138 kV | 132/ 13.8kV | Total | |||||||||||||||||||||||||
Company: | ||||||||||||||||||||||||||||||||
Eletrobras Chesf | — | — | 5,204 | — | 13,349 | 454.0 | 337 | 19,343.7 | ||||||||||||||||||||||||
Eletrobras Eletronorte | — | — | 3,243 | — | 5,578 | 959 | 203 | 9,983.0 | ||||||||||||||||||||||||
Eletrobras Eletrosul | — | — | 3,609 | — | 5,184 | 1,841 | 13 | 10,703 | ||||||||||||||||||||||||
Eletrobras Furnas | 2,698.0 | 1,612.0 | 4,669.0 | 6,267.0 | 1,929.0 | 2,528.0 | 165 | 19,868.0 | ||||||||||||||||||||||||
Eletrobras Amazonas Energia | — | — | — | — | 365.0 | — | 308 | 672.9 | ||||||||||||||||||||||||
|
|
|
|
|
|
|
|
|
|
|
|
|
|
|
| |||||||||||||||||
Total(2) | 2,698.0 | 1,612.0 | 16,275.0 | 6,267.0 | 26,405.0 | 5,783.0 | 1,081.0 | 60,570.0 | ||||||||||||||||||||||||
|
|
|
|
|
|
|
|
|
|
|
|
|
|
|
| |||||||||||||||||
| (1) | DC means direct current. |
| (2) | This table does not include transmission lines owned by SPEs in which we participate. Had such transmission lines been included, the total would be 64,364 km. |
The following table sets forth, on a consolidated basis, the percentage of the total transmission grid above 230 kV in Brazil that we were responsible for as of December 31, 2013, considering our participations in SPEs:
| 750 kV | 600 kV (DC)(1) | 525/500 kV | 400 kV | 345 kV | 230 kV | Total | ||||||||||||||||||||||
Entity: | ||||||||||||||||||||||||||||
Eletrobras | 100.00 | 100.00 | 45.98 | 0.00 | 61.97 | 54.86 | 56.23 | |||||||||||||||||||||
Others | 0.00 | 0.00 | 54.02 | 100.00 | 38.03 | 45.14 | 43.77 | |||||||||||||||||||||
|
|
|
|
|
|
|
|
|
|
|
|
|
| |||||||||||||||
Total | 100.00 | 100.00 | 100.00 | 100.00 | 100.00 | 100.00 | 100.00 | |||||||||||||||||||||
|
|
|
|
|
|
|
|
|
|
|
|
|
| |||||||||||||||
| (1) | DC means direct current. |
Except in relation to a small portion of transmission lines of Eletrobras Eletronorte located in the isolated system, the transmission lines in the Interconnected Power System are totally integrated.
As of December 31, 2013, we owned approximately 50.0% of all transmission lines in Brazil (230 kV and above) and, as a result, received fees from companies that transmit electricity on these lines. Net operating revenues from transmission were R$4,203 million in 2013, compared to R$6,741 million in 2012 and R$7,779 million in 2011. As a generation company, we must also pay a tariff in respect of our transmission of electricity over those transmissions that we do not own. Taking into account all transmission lines in Brazil (230 kV and above), this means we pay a tariff in respect of 44% of all transmission lines in Brazil.
Losses of electricity in the transmission system of Eletrobras were, in 2013, approximately 2% of all electricity transmitted in the system.
We operate as part of an integrated and coordinated national electricity system for Brazil. The Concessions Law authorizes us to begin to charge fees for the use of our transmission system by other electricity companies.
- 39 -
Table of Contents
Through Eletrobras Furnas, we charge a tariff (approximately R$1,528.79 per MW/month as of December 31, 2013) for the transmission of electricity generated by Itaipu and purchased for resale. The transmission charge for the power Itaipu generates is used to compensate Eletrobras Furnas, which owns the applicable transmission line, for making its transmission system available for the exclusive use of plant-connection installations. This system comprises the 750 kV Itaipu / Ivaiporã and the 600 kV DC Itaipu / Ibiúna transmission lines that are not part of the Basic Network.
Expansion of Transmission Activities
Our main transmission companies took part in a planning initiative related to the expansion of the PAE 2009/2012 transmission network through the Regional Transmission Study Group (GET), which is responsible for such transmission expansion initiatives at a regional level. In addition, our transmission companies took part in the regional networks and plant integration studies.
PAE initiatives included, among others, studies on the integration of the Belo Monte hydroelectric plant, focusing on alternative means of transmission to allow for the distribution of electric power from the Belo Monte plant to the northern, northeastern and southeastern regions of Brazil.
Distribution
Distribution of Electricity
We operate in distribution activities. Net revenues (including financial revenues at holding company level), from distribution represented 18.9% of our total net revenues (after eliminations) in 2013, compared to 16.7% in 2012 and 8.3% in 2011.
Distribution Companies
The following companies in our group undertake distribution activities pursuant to distribution concessions granted by ANEEL:
| • | Eletrobras Distribuição Roraima, which distributes electricity to the city of Boa Vista, in the State of Roraima, pursuant to a concession that ends on July 7, 2015; |
| • | Eletrobras Amazonas Energia, which distributes electricity to the city of Manaus, in the State of Amazonas, pursuant to a concession that ends on July 7, 2015; |
| • | Eletrobras Distribuição Alagoas, which distributes electricity in the State of Alagoas pursuant to a concession that ends on July 12, 2015; |
| • | Eletrobras Distribuição Piauí, which distributes electricity in the State of Piauí pursuant to a concession that ends on July 12, 2015; |
| • | Eletrobras Distribuição Rondônia, which distributes electricity in the State of Rondônia pursuant to a concession that ends on July 12, 2015; and |
| • | Eletrobras Distribuição Acre, which distributes electricity in the State of Acre pursuant to a concession that ends on July 12, 2015. |
The table below indicates relevant operational numbers of our distribution companies as of December 31, 2013:
Company | Number of Consumers | Number of Municipalities | Distribution Lines (km) | Substations | ||||||||||||
Eletrobras Amazonas Energia | 827,235 | 62 | 44,381 | 53 | ||||||||||||
Eletrobras Distribuição Alagoas | 981,454 | 102 | 40,761 | 40 | ||||||||||||
Eletrobras Distribuição Piauí | 1,102,032 | 224 | 86,273 | 81 | ||||||||||||
Eletrobras Distribuição Rondônia | 564,892 | 52 | 55,760 | 57 | ||||||||||||
Eletrobras Distribuição Acre | 231,144 | 22 | 17,733 | 15 | ||||||||||||
Eletrobras Distribuição Roraima | 97,203 | 1 | 3,467 | 03 | ||||||||||||
Each of Eletrobras Distribuição Alagoas, Eletrobras Distribuição Piauí, Eletrobras Distribuição Rondônia and Eletrobras Distribuição Acre was previously owned by the individual Brazilian state in which each respective company operated.Companhia Energética de Roraima, which is owned by the State of Roraima, transferred the assets and liabilities pertaining to the city of Boa Vista to a newly formed company called Eletrobras Distribuição Roraima and controlled by Eletrobras Eletronorte. We first made equity investments in these companies in 1996 with the objective of improving their financial condition and preparing them for privatization. Eletrobras Amazonas Energia was created in 2008 as a result of the merger between Ceam and Manaus Energia S.A.; Ceam was also previously owned by the Brazilian state in which it operated and we also made an investment in Ceam in 1996 with the objective of improving its financial condition and preparing it for privatization.
- 40 -
Table of Contents
Eletrobras Amazonas Energia, Eletrobras Distribuição Alagoas, Eletrobras Distribuição Piauí, Eletrobras Distribuição Rondônia, Eletrobras Distribuição Roraima and Eletrobras Distribuição Acre operate in particularly challenging market conditions – the North and Northeastern regions of Brazil are among the poorest regions in the country. One of our principal continuing challenges in respect of these companies is reducing the amount of commercial losses (principally being the theft of electricity) and customer defaults that these companies suffer from. We are attempting to address these problems by developing mechanisms that make theft of electricity more difficult and by renegotiating debts that customers of these companies currently owe.
Management Structure for our Distribution Activities
In May of 2008 we introduced a new management structure for our distribution activities. Until May 2008, we managed our investment in Eletrobras Amazonas Energia, Eletrobras Distribuição Alagoas, Eletrobras Amazonas Energia, Eletrobras Distribuição Piauí, Eletrobras Distribuição Rondônia, Eletrobras Distribuição Roraima and Eletrobras Distribuição Acre through theComitê Gestor das Empresas Federais de Distribuição (a management committee) which focused on, among other matters, proposing financial strategies and targets to improve the financial condition of these companies.
Pursuant to the new structure, this management committee no longer exists. The new structure involves one executive officer at the Eletrobras level, currently Luiz Hiroshi Sakamoto, acting as chief executive officer of each of the companies involved in distribution. Each of the companies involved in distribution will then have the same chief financial officer, engineering director, commercial director and regulatory director, in each case appointed by the chief executive officer of these distribution companies.
Transmission and Distribution System
Our transmission and distribution network consists of overhead transmission lines and sub-stations with varying voltage ranges. The clients we serve through our distribution network are classified by voltage level. With respect to our distribution to state utilities and industrial companies, we distribute electricity at higher voltage levels (up to 750 kV), while we distribute to residential and certain commercial companies at lower voltage levels (either at 230 kV, 138 kV or 69 kV).
System Performance
The following table sets forth information concerning our electricity losses for our distribution companies, and the frequency and duration of electricity outages per customer per year for the periods indicated:
| Year Ended December 31, | ||||||||||||
| 2013 | 2012 | 2011 | ||||||||||
Technical losses | 9.51 | % | 9.61 | % | 9.57 | % | ||||||
Commercial losses | 21.17 | % | 21.40 | % | 24.71 | % | ||||||
|
|
|
|
|
| |||||||
Total electricity losses | 30.69 | % | 31.01 | % | 34.28 | % | ||||||
|
|
|
|
|
| |||||||
Outages: | ||||||||||||
Frequency of outages per customer per year (number of outages) | 27.8 | 31.4 | 31.5 | |||||||||
Duration of outages per customer per year (in hours) | 39.9 | 38.7 | 39.3 | |||||||||
Average response time (in minutes) | 309.5 | 239.0 | 220.2 | |||||||||
Electricity Losses
We experience two types of electricity losses: technical losses and commercial losses. Technical losses are those that occur in the ordinary course of our distribution of electricity. Commercial losses are those that result from illegal connections, fraud or billing errors. Total electricity losses for our distribution business were 30.69% of energy generated and bought in the year ended December 31, 2013 compared to 31.01% of energy generated and bought in the year ended December 31, 2012 and 34.28% of energy generated and bought in the year ended December 31, 2011.
Reducing the level of commercial losses in the distribution companies presents a continuing challenge to us. Commercial losses at these companies have averaged approximately 21.17% of electricity generated and sold over recent periods. We are attempting to address these problems by developing procedures that make theft of electricity more difficult and by renegotiating debts that customers of these companies currently owe.
- 41 -
Table of Contents
For example, we have invested in a system that monitors the electricity consumption of some of our large clients by taking remote readings. As a result, Eletrobras’ distribution companies were able to recover 491,102 MWh in 2013 following 424,147 inspections. In 2013, we were able to reduce our electricity losses by 809,595 MWh.
In 2013, our distribution companies experienced a reduction in losses. Particularly, Eletrobras Distribuição Alagoas and Eletrobras Distribuição Rondônia, reduced its losses by 2.95 percentage points and 4.96 percentage points, respectively. In February 2011, we entered into a loan agreement with the World Bank in the amount of U.S.$495 million. This money will be used in the “Eletrobras Distribution Rehabilitation Project” (the name given by the World Bank to our project “Projeto Energia +”), with the main objective of improving the quality of our services and improving the economic and financial condition of our distribution companies. Once implemented, this project is intended to reduce our losses and consequently to strengthen the operational revenues of our distribution companies.
The following table sets out information regarding total losses in our distribution segment recorded by each distribution company set forth below:
| Year Ended December 31, | ||||||||||||
| 2013 | 2012 | 2011 | ||||||||||
| (percentages) | ||||||||||||
Company: | ||||||||||||
Eletrobras Distribuição Alagoas | 26.13 | 27.00 | 29.95 | |||||||||
Eletrobras Distribuição Piauí | 29.97 | 30.35 | 33.03 | |||||||||
Eletrobras Distribuição Rondônia | 23.97 | 22.82 | 27.78 | |||||||||
Eletrobras Distribuição Acre | 24.26 | 20.99 | 23.38 | |||||||||
Eletrobras Amazonas Energia | 38.34 | 39.06 | 41.84 | |||||||||
Eletrobras Distribuição Roraima | 12.12 | 12.29 | 15.78 | |||||||||
Power Outages
With respect to the Interconnected Power System, we aim to respond to repair requests within one and a half to two and a half hours, depending on the scale and nature of the problem. Our average response time in the Interconnected Power System in 2013 was 6.21 hours. The following table sets forth our average response time, in hours, to repair requests in the Interconnected Power System:
| Year Ended December 31, | ||||||||
| 2013 | 2012 | |||||||
Company: | ||||||||
Eletrobras Distribuição Alagoas | 6.80 | 3.98 | ||||||
Eletrobras Distribuição Piauí | 5.51 | 4.80 | ||||||
Eletrobras Distribuição Acre(1) | 8.06 | — | ||||||
Eletrobras Distribuição Rondônia(1) | 4.44 | — | ||||||
Average | 6.21 | 4.39 | ||||||
|
|
|
| |||||
| (1) | Eletrobras Distribuição Acre and Eletrobras Distribuição Rondônia became part of the Interconnected Power System in 2013. |
With respect to distribution operations in the Isolated system, we aim to respond to repair requests within half an hour to two hours, depending on the scale and nature of the problem. Our average response time in the Isolated system in 2013 was 3.06 hours. The following table sets forth our average response time, in hours, to repair requests in the Isolated system:
| Year Ended December 31, | ||||||||
| 2013 | 2012 | |||||||
Company: | ||||||||
Eletrobras Distribuição Acre(1) | — | 6.30 | ||||||
Eletrobras Distribuição Rondônia(1) | — | 4.86 | ||||||
Eletrobras Amazonas Energia | 4.90 | 2.86 | ||||||
Eletrobras BoaVista Energia | 1.23 | 1.10 | ||||||
Average | 3.06 | 3.78 | ||||||
|
|
|
| |||||
| (1) | Eletrobras Distribuição Acre and Eletrobras Distribuição Rondônia became part of the Interconnected Power System in 2013. |
- 42 -
Table of Contents
Customers
The following table sets forth our total distribution of electricity in terms of MWh and gross revenues, by type of user, for the periods indicated:
| Year Ended December 31, | ||||||||||||
| 2013 | 2012 | 2011 | ||||||||||
| (MWh) | ||||||||||||
Distribution to: | �� | |||||||||||
Industrial | 3,082,649 | 3,143,808 | 2,874,000 | |||||||||
Residential | 6,113,871 | 5,564,719 | 4,906,000 | |||||||||
Commercial | 3,451,267 | 3,316,135 | 2,978,000 | |||||||||
Rural | 739,102 | 708,803 | 586,000 | |||||||||
Public Lighting | 747,711 | 590,901 | 520,028 | |||||||||
|
|
|
|
|
| |||||||
Other | 1,957,553 | 1,891,530 | 1,813,972 | |||||||||
|
|
|
|
|
| |||||||
Total | 16,092,153 | 15,215,896 | 13,678,000 | |||||||||
|
|
|
|
|
| |||||||
Tariffs
We classify our customers into two different groups, Group A and Group B, based on the voltage level at which we supply the electricity to our customers. Each customer is placed in a certain tariff level defined by law and based on its respective classification, although some volume-based discounts are available. Group B customers pay higher tariffs, compensating the aggregated costs in all sub-systems in which electricity flows to supply them. There are differentiated tariffs in Group B by types of customer (such as residential, commercial, rural and industrial). Customers in Group A pay lower tariffs, depending on consumer levels established by ANEEL because they demand electricity at higher voltages, which requires a lower level of use of the energy distribution system. Tariffs we charge for sales of electricity to final customers are determined pursuant to our concession agreements and regulations established by ANEEL. These concession agreements and related regulations establish a cap on tariffs that provides for annual, periodic and extraordinary adjustments. For a discussion of the regulatory regime applicable to our tariffs and their adjustment, see “ – The Brazilian Power Industry.”
Group A customers receive electricity at 2.3 kV or higher. Tariffs for Group A customers are based on the voltage level at which electricity is supplied, and the time of year and the time of day electricity is supplied, although customers may opt for a differentiated tariff in peak periods. Tariffs for Group A customers are composed of two components: a “capacity charge” and an “energy charge.”
The capacity charge, expressed inreais per MW, is based on the higher of: (i) contracted firm capacity; or (ii) power capacity actually used. The energy charge, expressed inreais per MWh, is based on the amount of electricity actually consumed. Tariffs charged to Group A customers are lower than those for Group B customers because Group A customers consume electricity at higher voltage ranges, and therefore avoid the costs associated with lowering the electricity voltage as is required for consumption by our Group B customers.
Group B customers receive electricity at less than 2.3 kV (220V and 127V). Tariffs for Group B customers consist solely of an energy consumption charge and are based on the classification of the customer.
Billing Procedures
The procedure we use for billing and payment for electricity supplied to our customers is determined by customer category. Meter readings and invoicing take place on a monthly basis for low voltage consumers, with the exception of rural consumers whose meters are read in intervals varying from one to three months, as authorized by relevant regulation. Bills are prepared from meter readings or on the basis of estimated usage. Low voltage customers are billed within five business days after the invoice date. In case of nonpayment, a notification of nonpayment accompanied by the next month’s invoice is sent to the customer and a period of 15 days is provided to satisfy the amount owed to us. If payment is not received within three business days after the 15-day period, the customer’s electricity supply is suspended. High voltage customers are billed on a monthly basis with payment required within five business days after the invoice date. In the event of non-payment, a notice is sent to the customer two business days after the due date, giving a deadline of 15 days to make payment. If payment is not made within three business days after the notice, the customer is subject to discontinuation of service.
- 43 -
Table of Contents
As of December 31, 2013, 2012 and 2011, customers in default represented an average of 14.6%, 17.3% and 18.9%, respectively. These default rates have decreased over recent years and we do expect to see material changes in these default rates in the foreseeable future.
Purchase of Electricity for Distribution
We purchased 16,873 GWh of electricity for distribution in 2013, compared to 16,585 GWh in 2012 and 15,576 GWh in 2011. Our distribution companies purchase electricity in the public auction process from a pool of generation companies that provide bids setting out the maximum price at which they will supply electricity. After all bids are received, the average price of all bids is calculated and this is the price that we pay for the electricity. The purchase is made from all generation companies that provided bids.
Lending and Financing Activities
Loans Made by Us
Brazilian law allows us to only lend to our subsidiaries. Historically, Brazilian law allowed us to act as lender to our subsidiaries and to public energy utilities under our control. While certain of those subsidiaries are no longer in our group, the majority of our loans are to related parties. Prior to the privatization of the Brazilian electricity industry that began in 1996, this was a particularly widespread part of our operations because most companies in the industry were state-owned, allowing us to engage in lending activities to them. However, as the result of privatization, the number of companies to whom we may lend has diminished and lending is no longer a significant aspect of our business. The total amounts we recorded on our balance sheet: R$15.2 billion as of December 31, 2013, R$15.5 billion as of December 31, 2012 and R$15.6 billion as of December 31, 2011. Of this total amount, loans to Itaipu accounted for R$11.9 billion as of December 31, 2013, R$11.6 billion as of December 31, 2012 and R$5.8 billion.
Sources of Funds
We obtain funding for our lending activities from loans from financial institutions and offerings in the international capital markets. As of December 31, 2013, our consolidated long-term debt was R$30,507 million, compared to R$25,293 million as of December 31, 2012 and R$22,378 million as of December 31, 2011, with the majority of our foreign currency debt (approximately 35% over the three-year period) denominated in U.S. dollars. Further details of our borrowings are set out in “ – Liquidity and Capital Resources – Cash Flows.”
In addition, we utilize borrowings from the RGR Fund, which we administer, to on-lend to our subsidiaries and other electricity companies. As of December 31, 2013, December 31, 2012 and December 31, 2011, we incurred interest at 5.0% in respect of borrowings from the RGR Fund and charge an average administrative fee of up to 2.0% on funds which we on-lend to subsidiaries and other entities.
Equity Participation
We act as a minority participant in private sector generation and transmission companies and joint ventures. We are also authorized to issue guarantees for those companies in which we participate as an equity investor. We are constantly considering investments in a number of such companies, focusing primarily on those in line with our strategy of building on our core businesses of generation and transmission (see “Item 7.B, Related Party Transactions”).
The current participations that we have are in private sector generation and transmission companies and joint ventures. Participation is determined primarily on merit and profitability criteria based on our managerial controls.
The table below shows an estimate of the total percentage of our participation in transmission and generation companies as of December 31, 2013:
Special Purpose Company/Consortium | Object of investment | Eletrobras Participation | ||
Transmission | ||||
| Interligação Elétrica do Madeira S.A. | 600 kV transmission line of 2,375 km | Eletrobras Chesf (24.5%) | ||
| Eletrobras Furnas (24.5%) | ||||
| Plus Rectifier and Inverter Station | ||||
| Norte Brasil Transmissora de Energia S.A. | 600kV Transmission Line of 2,375 km: | Eletrobras Eletronorte (24.5%) | ||
| Eletrobras Eletrosul (24.5%) | ||||
| SE Coletora – Araraquara 2, Porto Velho | ||||
- 44 -
Table of Contents
Special Purpose Company/Consortium | Object of investment | Eletrobras Participation | ||
| Estação Transmissora de Energia S.A. | 500/±600 kV Conversion and Inversion Station 01 | Eletrobras Eletronorte (100.0%) | ||
| Manaus Transmissora de Energia S.A. | 500 kV Transmission Line of 587 km: | Eletrobras Chesf (19.5%) Eletrobras Eletronorte (30.0%) | ||
| Oriximiná – Silves; 500 kV Transmission Line of 224 km and Subestations Itacoatiara e Cariri: Silves –Lechuga | ||||
| STN – Sistema de Transmissão Nordeste S.A.(2) | 500 kV Transmission Line of 546 km: | Eletrobras Chesf (49.0%) | ||
| Teresina-Sobral-Fortaleza | ||||
| Intesa – Integração de Energia S.A.(2) | 500 kV Transmission Line of 695 km: Colinas-Miracema-Gurupí-Peixe Nova-Serra da Mesa 2 | Eletrobras Chesf (12.0%), Eletrobras Eletronorte (37.0%) | ||
| Porto Velho Transmissora de Energia S.A. | 230 kV transmission lines of 17 km: 500/230 kV SE Coletora Porto Velho | Eletrobras Eletrosul (100.0%) | ||
| Ártemis – Transmissora de Energia S.A.(2) | 525 kV Transmission Line of 476 km: S. Santiago-Ivaporã-Cascavel | Eletrobras Eletrosul (100.0%) | ||
| Transenergia Renovável | 230/138 kV Transmission Line of 635 km: Connects biomass plants and small hydroelectric plants to the Sistema Interligado Nacional (SIN) | Eletrobras Furnas (49.0%) | ||
| Brasnorte Transmissora de Energia S.A.(2) | 230kV Transmission Lines of 402 km: Jauru-Juba-C2; LT Maggi-Nova Mutum | Eletrobras Eletronorte (49.7%) | ||
| RS Energia – Empresa de Transmissão de Energia do Rio Grande do Sul S.A.(2) | 525 kV Transmission Line of 260 km: Campos Novos-Nova Santa Rita and 230 kV transmission line of 33 km SE Monte Claro – SE Garibaldi | Eletrobras Eletrosul (100.0%) | ||
| Companhia Transleste de Transmissão S.A.(2) | 345 kV Transmission Line of 139 km: Montes Claros-Irapé | Eletrobras Furnas (24.5%) | ||
| Amazônia Eletronorte Transmissora de Energia S.A. – Aete(2) | 230 kV Transmission Line of 193 km: Coxipó-Cuiabá-Rondonópolis and SE Seccionadora Cuiabá | Eletrobras Eletronorte (49.0%) | ||
| Etau – Empresa de Transmissão do Alto Uruguai(2)S.A. | 240 kV Transmission Line of 187 km: Campos Novos-Barra Grande-Lagoa Vermelha-Santa Marta | Eletrobras Eletrosul (27.4%) | ||
| Uirapuru Transmissora de Energia S.A.(2) | 525 kV Transmission Line of 122 km: Ivaiporã-Londrina | Eletrobras Eletrosul (100.0%) | ||
| Companhia Transudeste de Transmissão S.A.(2) | 345 kV Transmission Line of 144 km: Itutinga-Juiz de Fora | Eletrobras Furnas (25.0%) | ||
| Companhia Transirapé de Transmissão S.A.(2) | 345 kV Transmission Line of 61 km: Irapé-Araçuaí | Eletrobras Furnas (24.5%) | ||
| Companhia Centroeste de Minas S.A. | 345 kV Transmission Line of 63 km: Eletrobras Furnas-Pimenta II | Eletrobras Furnas (49.0%) | ||
- 45 -
Table of Contents
Special Purpose Company/Consortium | Object of investment | Eletrobras Participation | ||
| Linha Verde Transmissora de Energia S.A. | 230 kV Transmission Line of 987 km: Porto Velho-Jauru | Eletrobras Eletronorte (49.0%) | ||
| Rio Branco Transmissora de Energia S.A. | 230 kV Transmission Line of 487 km: Porto Velho-Abunã-Rio Branco | Eletrobras Eletronorte (100.0%) | ||
| Transmissora Matogrossense de Energia S.A. | 500 kV Transmission Line of 348 km: Jauru – Cuiabá and SE Jauru | Eletrobras Eletronorte (49.0%) | ||
| Transenergia São Paulo S.A. | Itatiba Substation, 500 kV | Eletrobras Furnas (49.0%) | ||
| Transenergia Goiás S.A | 230 kV Transmission Line of 188 km: Serra da Mesa-Niquelândia-Barro Alto | Eletrobras Furnas (49.0%) | ||
| Consórcio Goiás Transmissão | 500 kV Transmission Line of 193 km: Rio Verde Norte –Trindade. and 230 kV Transmission Line of 66 km: Xavantes-Trindade-Carajás and SE Trindade | Eletrobras Furnas (49.0%) | ||
| Consórcio MGE Transmissão | 500 kV Transmission Line of 248 km: Mesquita-Viana 2. and 345 kV transmission line of 10 km: Viana – Viana 2 and SE Viana 2 | Eletrobras Furnas (49.0%) | ||
| TDG Transmissora Delmiro Gouveia SA | 230 kV Transmission Line of 96 km: São Luiz II – São Luiz III and SE Pecém and SE Aquiraz II | Eletrobras Chesf (49.0%) | ||
| Interligação Elétrica Garanhus SA | 500 kV Transmission Line of 653 km: Luiz Gonzaga – Garanhus, Garanhus – Campina Grande III and Garanhus – Pau Ferro and 230 kV transmission line of 13 km: Garanhus – Angelim I | Eletrobras Chesf (49.0%) | ||
| Transnorte Energia SA | 500 kV Transmission Line of 715 km: Engenheiro Lechuga – Equador (RR) – Boa Vista e SEs | Eletrobras Eletronorte (49.0%) | ||
| Costa Oeste Transmissora de Energia SA | 230 kV Transmission Line of 143 km Cascavel Oeste –Umuarama | Eletrobras Eletrosul (49.0%) | ||
| Marumbi Transmissora de Energia SA | 525 kV Transmission Line of 28 km: Curitia – Curitia Leste | Eletrobras Eletrosul (20.0%) | ||
| Transmissora Sul Brasileira de Energia SA | 525 kV Transmission Line of 495 km: Salto Santiago –Itá –Nova Santa Rita and 230 kV transmission line of 303 km: Nova Santa Rita –Camaquã –Quinta | Eletrobras Eletrosul (80.0%) | ||
| Consórcio Caldas Novas | SE Corumbá 345/138 kV – 2 x 75 MVA | Eletrobras Furnas (49.9%) | ||
| Generation | ||||
| Madeira Energia SA | HPU Santo Antonio with 3,150 MW | Eletrobras Furnas (39.0%) | ||
| Energia Sustentável do Brasil | HPU Jirau with 3,750 MW | Eletrobras Chesf (20.0%) Eletrobras Eletrosul (20.0%) | ||
- 46 -
Table of Contents
Special Purpose Company/Consortium | Object of investment | Eletrobras Participation | ||
| Foz do Chapecó Energia S.A. | HPU Foz do Chapecó with 855 MW | Eletrobras Furnas (40.0%) | ||
| Enerpeixe S.A.(2) | HPU Peixe Angical with 452 MW | Eletrobras Furnas (40.0%) | ||
| Consórcio Energético Cruzeiro do Sul S.A. | HPU Mauá with 361 MW | Eletrobras Eletrosul (49.0%) | ||
| Serra de Facão S.A. | HPU Serra do Facão with 213 MW | Eletrobras Furnas (49.5%) | ||
| Energetica Águas da Pedra S.A.–EAPSA (Aripuanã; Água Das Pedras) | HPU Dardanelos with 261 MW | Eletrobras Chesf (24.5%), Eletrobras Eletronorte (24.5%) | ||
| Baguari I Geração de Energia Elétrica S.A.(2) | HPU Baguari with 140 MW | Eletrobras Furnas (15.0%) | ||
| Retiro Baixo Energética S.A. | HPU Retiro Baixo with 82 MW | Eletrobras Furnas (49.0%) | ||
| AMAPARI Energia S.A.(2) | TPU Serra do Navio and Small HPU Capivara with 53 MW | Eletrobras Eletronorte (49.0%) | ||
| Norte Energia S.A. | HPU Belo Monte with 11,233 MW | Eletrobras Eletronorte (19.9%) Eletrobras Chesf (15.0%) Eletrobras Holding (15.0%) | ||
| Brasventos Eolo Geradora de Energia S.A. | Parque Eólico Rei doVentos I with 58 MW | Eletrobras Furnas (24.5%) Eletrobras Eletronorte (24.5%) | ||
| Rei dos Ventos 3 Geradora de Energia S.A. | Parque Eólico Rei dos Ventos 3 with 60MW | Eletrobras Furnas (24.5%) Eletrobras Eletronorte (24.5%) | ||
| Brasventos Miassaba 3 Geradora de Energia S.A. | Parque Eólico Miassaba 3 with 68 MW | Eletrobras Furnas (24.5%) Eletrobras Eletronorte (24.5%) | ||
| Companhia Hidrelétrica Teles Pires | HPU Teles Pires with 1,820 MW | Eletrobras Eletrosul (24.5%) Eletrobras Furnas (24.5%) | ||
| Cerro Chato I S.A. | Parque Eólico Cerro Chato I with 30 MW | Eletrobras Eletrosul (100.0%) | ||
| Cerro Chato II S.A. | Parque Eólico Cerro Chato I Iwith 30 MW | Eletrobras Eletrosul (100.0%) | ||
| Cerro Chato III S.A. | Parque Eólico Cerro Chato III with 30 MW | Eletrobras Eletrosul (100.0%) | ||
| Eólica Mangue Seco 2 Geradora e Comercializadora de Energia Elétrica | Eólica Mangue Seco 2 with 26 MW | Eletrobras Holding (49.0%) | ||
| Chuí Holding S.A. | Eólicas Chuí I a V with 98 MW and Eólicas Minuano VI and VII with 46 MW | Eletrobras Eletrosul (49.0%) | ||
| Livramento Holding S.A. | Eólicas Cerro Chato IV, V and VI, Ibirapuitã e Trindade with 78 MW | Eletrobras Eletrosul (49.0%) | ||
| Santa Vitória do Palmar Holding S.A. | Eólicas Geribatu I to X with 258 MW | Eletrobras Eletrosul (49.0%) | ||
| São Pedro do Lago S.A. | Eólica São Pedro do Lago with 30 MW | Eletrobras Chesf (49.0%) | ||
| Pedra Branca S.A. | Eólica Pedra Branca with 30 MW | Eletrobras Chesf (49.0%) | ||
| Sete Gameleiras S.A. | Eólica Sete Gameleiras with 30 MW | Eletrobras Chesf (49.0%) | ||
- 47 -
Table of Contents
Special Purpose Company/Consortium | Object of investment | Eletrobras Participation | ||
| Central Geradora Eólica Famosa I S.A. | Eólica Famosa I with 23 MW | Eletrobras Furnas (49.0%) | ||
| Central Geradora Eólica Pau – Brasil S.A. | Eólica Pau – Brasil with 15 MW | Eletrobras Furnas (49.0%) | ||
| Central Geradora Eólica Rosada S.A. | Eólica Rosada with 30 MW | Eletrobras Furnas (49.0%) | ||
| Central Geradora Eólica São Paulo | Eólica São Paulo with 18 MW | Eletrobras Furnas (49.0%) | ||
| Energia dos Ventos I | Eólica Goiabeira with 19 MW | Eletrobras Furnas (49.0%) | ||
| Energia dos Ventos II | Eólica Ubatuba with 13 MW | Eletrobras Furnas (49.0%) | ||
| Energia dos Ventos III | Eólica Santa Catarina with 16 MW | Eletrobras Furnas (49.0%) | ||
| Energia dos Ventos IV | Eólica Pitombeira with 27 MW | Eletrobras Furnas (49.0%) | ||
| Energia dos Ventos V | Eólica São Januário with 19 MW | Eletrobras Furnas (49.0%) | ||
| Energia dos Ventos VI | Eólica Nossa Senhora de Fátima with 29 MW | Eletrobras Furnas (49.0%) | ||
| Energia dos Ventos VII | Eólica Jandaia with 29 MW | Eletrobras Furnas (49.0%) | ||
| Energia dos Ventos VIII | Eólica São Clemente with 19 MW | Eletrobras Furnas (49.0%) | ||
| Enegia dos Ventos IX | Eólica Jandaia I with 19 MW | Eletrobras Furnas (49.0%) | ||
| Energia dos Ventos X | Eólica Horizonte with 14 MW | Eletrobras Furnas (49.0%) | ||
| Caiçara I SA | Eólica Caiçara I with 30 MW | Eletrobras Chesf (49.0%) | ||
| Caiçara II SA | Eólica Caiçara II with 21 MW | Eletrobras Chesf (49.0%) | ||
| Junco I SA | Eólica Junco I with 30 MW | Eletrobras Chesf (49.0%) | ||
| Junco II SA | Eólica Junco II with 30 MW | Eletrobras Chesf (49.0%) | ||
Brazilian Government Programs
In addition to the Proinfa program created by the Brazilian Government in 2002 to create certain incentives for the development of alternative sources of energy (discussed more fully in “The Brazilian Power Industry – Proinfa”), we also participate in four additional Brazilian Government programs:
| • | the Programa Reluz (Relighting Program), a program introduced in order to bring basic lighting to the main public areas of certain municipalities in Brazil; |
| • | the Programa Procel (Conservation Program), a program that aims to promote energy conservation and efficiency; |
| • | Luz Para Todos(Light for All), a program that aims to bring electricity to an additional 12 million people in Brazil; and |
| • | Programa de Desenvolvimento Tecnológico e Industrial (Program of Technological and Industrial Development), a program to coordinate research and development activities in the Brazilian electricity sector and promote the development and manufacture of equipment required to ensure the development of the sector. |
Any funds used by us in respect of these programs come from the Brazilian Government itself, in the form of funds allocated for the sector, and accordingly we do not use our own funds for these programs.
We also participate in other initiatives using our own funds, one of which is theProjeto Ribeirinhas, or Riverbank Communities Project. Through this initiative, we aim to evaluate the applicability and sustainability of technologies based on renewable resources of energy in certain small communities living in the Amazon region.
Research and Development
See “Item 5.C, Research and Development, Patents and Licenses”
- 48 -
Table of Contents
International Activities
As of December 31, 2013, we did not operate internationally. However, as part of our strategy we continue to explore certain opportunities in international electricity markets and selectively identify profitable opportunities in those markets for the future, mainly related to the integration of the electrical power systems in the Americas. As part of our internationalization plan, we have established representative offices in Lima, Peru; Panama City, Panama and Montevideo, Uruguay in order to comply with local rules, which provide that concessions may only be granted to companies that maintain a local representative office. These offices will also provide a connection between us and partners in Latin America. We are actively seeking to invest in generation projects in other Latin America countries and we have also already begun to commercialize power with some of these countries. We also hold equity interests in three specific purpose entities (SPEs), in Uruguay, Peru and Nicaragua, which are currently undertaking feasibility studies for wind and hydro generation projects. Furthermore, we are in the process of obtaining the necessary licenses for the construction in Brazil of an interconnection line between Brazil and Uruguay, which is scheduled to begin in 2013. As part of the expansion strategy, we may also identify and pursue selected growth opportunities, including renewable generation and transmission lines, outside of South America, notably in Africa.
Environmental
General
Environmental issues can significantly impact our operations. For example, large hydroelectric plants can cause the flooding of large areas of land and the relocation of large numbers of people. The Brazilian Constitution gives both the Brazilian Government and state and local governments power to enact laws designed to protect the environment and to issue regulations under such laws. While the Brazilian Government has the power to promulgate general environmental regulations, state and local governments have the power to enact more stringent environmental regulations. Accordingly, most of the environmental regulations in Brazil are state and local rather than federal.
Any failure to comply with environmental laws and regulations may result in criminal liability, irrespective of the strict liability to perform environmental remediation and to indemnify third parties for environmental damages. These failures may also subject us to administrative penalties such as fines, suspension of public agency subsidies or injunctions requiring us to discontinue, temporarily or permanently, the prohibited activities.
In order to build a hydroelectric plant, Brazilian electricity companies must comply with a number of environmental safeguards. For projects for which the environment impact is considered significant, such as generation projects with an output above 10 MW, as well as transmission lines above 230 kV, together with certain other environmentally sensitive projects, first, a comprehensive environmental impact study must be prepared by external experts who make recommendations as to how to minimize the impact of the plant on the environment. The study, together with a specific environmental report on the project prepared by the company, is then submitted to federal, state or local governmental authorities, depending on the projected impact, for analysis and approval. Such study and report are used for the environmental licensing of the project, which is generally carried out by means of a three stage licensing process, which comprises (i) a license to attest the viability of the project (Licença Prévia or LP), (ii) a license to begin work (Licença de Instalação or LI), and (iii) a license to operate the project (Licença de Operação or LO). In addition, the company is required by law to devote up to 0.5% of the total cost of any investment in new projects with a significant environmental impact to environmental preservation. Nevertheless, the constitutionality of this law is being questioned, and a final decision on the matter is still pending. Accordingly, the final ruling issued on such claim may result in changes to the applicable percentage. Since the early 1980’s, the Brazilian electricity sector has endeavored to improve its treatment of the social and environmental aspects of power project planning, implementation and operation. In general, our generation subsidiaries are in compliance with applicable environmental regulations in Brazil, and the environmental policies and guidelines of the electricity sector. Our generation and transmission facilities benefit from certain exemptions to licensing requirements because their operations commenced before the applicable environmental legislation. Nonetheless, some environmental authorities have issued notices of infringement alleging the absence of environmental licenses. See “Item 8.A, Consolidated Financial Statements and Other Information – Litigation – Environmental Proceedings.”
As of December 31, 2013, our subsidiary Eletrobras Eletronuclear operated two nuclear power plants in the State of Rio de Janeiro, Angra 1 and Angra 2 and a third nuclear power plant, Angra 3, is under construction. Because Eletrobras Eletronuclear initiated its activities before the enactment of an environmental legislation, Angra 1 was licensed by CNEN under the nuclear and environmental regulations in effect at that time. Currently, Brazilian law requires the issuance of: (i) an authorization for nuclear enterprises by CNEN; and (ii) an environmental license issued by the Instituto Brasileiro do Meio Ambiente e Recursos Naturais Renováveis (or IBAMA, the Brazilian Federal environmental authority).
A study group formed by the Federal Public Attorney’s Office, CNEN, IBAMA, the Fundação Estadual de Engenharia do Meio Ambiente (or FEEMA, which was one of the environmental authorities in the State of Rio de Janeiro, currently unified in one single entity, theInstituto Estadual do Ambiente or INEA), Eletrobras Eletronuclear and Eletrobras prepared
- 49 -
Table of Contents
a Termo de Ajustamento de Conduta (a Conduct Adjustment Agreement or TAC) according to which the guidelines for the environmental licensing update procedure should be established. Angra 2 has obtained all the environmental licenses necessary for its operations, but the Federal Public Attorney’s Office challenged its renewal, which it conditioned upon the compliance with a TAC and according to which Eletrobras Eletronuclear should implement a program in order to improve emergency plans, environmental monitoring programs and effluents treatment systems. Until these obligations are accomplished, IBAMA and CNEN should abstain from issuing any definitive licenses or authorizations for the operation of Angra II. An assessment comprising the accomplishments of the TAC was issued by IBAMA to the Public Attorney in June 2006. After evaluation of the status of completion of these conditions, IBAMA issued a report concluding that all technical conditions compiled in the TAC were satisfied. In September 2011, IBAMA informed that an Unified LO would be issued for the nuclear installations in operation at the CNAAA site – Angra 1, Angra 2 and the Radwaste Management Centre (including initial storage facilities). It is expected that the Environmental LO for the CNAAA will be issued in the first half of 2014. With respect to CNEN’s license, both nuclear power plants currently have their own Authorization for Permanent Operation (Autorização de Operação Permanente – AOP). The AOP of Angra 1 will expire in August 2024, and the AOP of Angra 2 will expire in June 2041. Eletrobras Eletronuclear also holds a LI in connection with the construction of Angra 3 and other applicable environmental licenses for other buildings and facilities within the site of the nuclear power plants. Eletrobras Eletronuclear is strictly liable for nuclear accidents as an operator of nuclear plants in Brazil. See “Item 3.D, Risk Factors – Risks Relating to Our Company – We may be liable for damages, subject to further regulation and have difficulty obtaining financing if there is a nuclear accident involving our subsidiary Eletrobras Eletronuclear.”
Energy Conservation
Over the past 20 years, the Brazilian Government has implemented a number of actions directed to energy conservation on the electricity sector. The Brazilian Government normally finances these actions and we administer them. The most important project in this area is the Procel.
ThePrograma de Conservação de Energia Elétrica – Procel (the national electric conservation program) was created in 1985 to improve energy efficiency and rationalization of the use of natural resources throughout Brazil. MME coordinates the program and we are responsible for its execution. The main objective of Procel is to encourage cooperation among various sectors of Brazilian society to improve energy conservation both on the production and consumer sides.
Alternative Electricity Sources
In 2002 the Brazilian Government created the Programa de Incentivo às Fontes Alternativas de Energia Elétrica– Proinfa (the program for the development of alternative electricity sources), with the objective of diversifying the Brazilian energy matrix by searching for regional solutions with the use of renewable energy sources.
The Brazilian Power Industry
General
According to Regulation No. 937, dated November 24, 2010, MME approved a ten-year expansion plan (Plano Decenal de Expansão de Energia Elétrica or PDE 2010-2019), which provides guidance to the Brazilian government and to all agents in the Brazilian energy industry in order to ensure that there is a sustainable supply of energy in Brazil, including electricity, taking into consideration environmental needs, the Brazilian economy and a business’ technical capabilities.
The studies carried out in the PDE include a plan for the next ten years and are subject to annual reviews which take into account, among other aspects, changes in the forecast for the growth of electricity consumption and the re-evaluations of the economical and operational feasibility of the generation projects, as well as the estimates regarding the expansion of transmission lines.
According to ANEEL, in December 2011, when taking into account the SIN generating units, the power generators installed in the isolated systems and in the generators owned by individuals, Brazil had a total installed capacity of 116,796 MW.
Currently, the SIN is divided into four electric sub-systems: South-East/Mid-West, South, North-East and North. One of the goals of the PDE is to complete the integration of the isolated systems of Manaus-Macapá, into the North sub-systems by November 2012.
In addition to the SIN, there are also the isolated systems, i.e., those systems that do not make part of the SIN, are generally located in the Northern and North-Eastern regions of Brazil, have as sole source of energy the electricity generated by coal-fired and oil-fuelled thermal plants which are extremely pollutants and have a generation cost three to four times higher than, for instance, a hydro-electric power station. The CCC account was introduced by article 13, III of Law No. 5899, of
- 50 -
Table of Contents
July 5, 1973, as amended, with the purpose of generating financial reserves payable to distribution companies and to some generation companies (all of which should make annual contributions to the CCC Account) in order to cover some of the costs of the operation of thermoelectric plants in the event of adverse hydrological conditions, and also of subsidizing the electricity generated by the “isolated systems” in order to allow consumers of the isolated systems to bear charges for electricity equivalent to the charges borne by consumers served by hydraulic generation (however Law No. 12,783 terminated the apportionment of the benefit of reduction of the costs for fuel consumption within electric energy generation). There is currently a significant discrepancy between charges paid by consumers in the Northern and Northeastern regions when compared to what is charged from the Southern/South-Eastern Region consumers. Therefore, interconnecting the isolated systems to the SIN would enable consumers from these regions to have access to hydroelectric energy sources, which results in reduced production costs and a convergence of prices in these regions to other regions of the country.
Accordingly, the PDE further intends to integrate the isolated systems to the SIN. Such integration would be carried out through the construction of the transmission lines of Jauru/Vilhena (230kV), Tucuruí/Manaus (Cariri) (500kV) and Jurapari/Macapá (230kV), within the shortest term possible, given that the preliminary analysis for implementing the integration project has already been concluded.
In addition to the integration of the isolated systems, the PDE also provides for the expansion of electricity generation through the improvement of the generation capacity, defined by the PDE as the execution of a set of works aimed at enhancing the capacity and efficiency while modernizing the already existing power plants, which should not represent a lot in terms of ensured power but would contribute to meet the increase in the highest level expected of electricity demand.
According to ANEEL, the total installed electricity generation capacity in Brazil in 2013 was 126,383,975 KW with 3,025 operating ventures. Currently, there are 147 ventures currently under construction and another 543 with permits granted. An additional generation capacity of 35,849,675 KW is expected in the coming years.
Pursuant to the EPE 10 Year Plan, Brazil’s total installed power generation capacity is projected to increase to 182.4 GW by 2021, of which 111.7 GW 61.25 is projected to be hydroelectric and 70.6 GW 38.75 to be thermoelectric and from other sources.
We currently control approximately 34% of the installed power generating capacity within Brazil and are responsible for approximately 50% of the installed transmission capacity above 230 kV. In addition, some Brazilian states control entities involved in the generation, transmission and distribution of electricity. The remainder of the market is held by several companies including Cemig, Copel, Tractebel, CPFL, Duke and Brasil Energia. Certain of these companies have entered into joint venture arrangements in the past.
In net revenue terms, we believe we are the largest generation and transmission company in Brazil. We mainly compete for generation and transmission businesses through a competitive auction process.
In 2013, according to theEmpresa de Pesquisa Energética (the Energetic Research Company or EPE), the electricity consumption in Brazil reached 463,740 GWh, which represented an increase compared to total consumption in 2012 by 3.5%. The electricity consumption in Brazil in 2012 was 448,113 GWh according to EPE, which represented a 3.5% increase compared to the total consumption of 433,034 GWh in 2011.
Historical Background
The Brazilian Constitution provides that the development, use and sale of energy may be undertaken directly by the Brazilian Government or indirectly through the granting of concessions, permissions or authorizations. Historically, the Brazilian power industry has been dominated by generation, transmission and distribution concessionaires controlled by the Brazilian Government. This changed during Fernando Henrique Cardoso’s administration (1995-2002), during which many state controlled companies were privatized in an effort to increase efficiency and competition. In recent years, the Brazilian Government has taken a number of measures to remodel the power industry. In general, these measures were aimed at increasing the role of private investment and eliminating foreign investment restrictions, thus increasing overall competition in the power industry.
In particular, the Brazilian Government has taken the following measures:
| • | The Brazilian Constitution was amended in 1995 by Constitutional Amendment No. 6 to allow foreign companies to invest in Brazilian companies that hold power generation concessions. Prior to this amendment, all generation concessions were held either by a Brazilian individual or an entity controlled by Brazilian individuals or by the Brazilian Government; |
| • | The Brazilian Government enacted Law No. 8,987 on February 13, 1995 as amended by Law No. 11,196 of November 21, 2005 and Law No. 11,445 of January 5, 2007 (or the Concessions Law) and Law No. 9,074 on |
- 51 -
Table of Contents
July 7, 1995, as amended (or the Power Concessions Law), that together: (i) required that all concessions for the provision of energy related services be granted through public bidding processes; (ii) gradually allowed certain electricity consumers with significant demand, designated “free consumers,” to purchase electricity directly from suppliers holding a concession, permission or authorization; (iii) provided for the creation of generation entities (or Independent Power Producers) which, by means of a concession, permission or authorization, may generate and sell, for their own account and at their own risk, all or part of their electricity to free consumers, distribution concessionaires and trading agents, among others; (iv) granted free consumers and electricity suppliers open access to all distribution and transmission systems; and (v) eliminated the need for a concession to construct and operate power projects with capacity from 1 MW to 30 MW (the so calledPequenas Centrais Hidrelétricas – PCHs) although an authorization or permission from ANEEL or MME is required, as the case may be; |
| • | Beginning in 1995, a portion of the controlling interests held by us and various states in certain generation and distribution companies were sold to private investors. At the same time, certain state governments also sold their stakes in major distribution companies; |
| • | In 1998, the Brazilian Government enacted Law No. 9,648 (or the Power Industry Law) to overhaul the basic structure of the electricity industry. The Power Industry Law provided for the following: |
| • | the establishment of a self-regulated body responsible for coordinating the purchase and sale of electric energy available in the Interconnected System (Mercado Atacadista de Energia Elétrica – MAE), or the Wholesale Energy Market – MAE, an entity which replaced the prior system of regulated generation prices and supply contracts. The Wholesale Energy Market – MAE was later replaced by the CCEE; |
| • | a requirement that distribution and generation companies enter into initial energy supply agreements (or the Initial Supply Contracts) generally “take or pay” commitments, at prices and volumes approved by ANEEL. The main purpose of the Initial Supply Contracts was to ensure distribution companies access to a stable electricity supply at prices that guaranteed a fixed rate of return for the electricity generation companies during the transition period leading to the establishment of a free and competitive electricity market; |
| • | the creation of the National Electricity System Operator (Operador Nacional do Sistema Elétrico), or ONS, a non-profit, private entity responsible for the operational management of the generation and transmission activities of the Interconnected Power System; and |
| • | the establishment of public bidding processes for concessions for the construction and operation of power plants and transmission facilities. |
| • | In 2001, Brazil faced a serious energy crisis that lasted until the end of February 2002. As a result, the Brazilian Government implemented measures that included: |
| • | a program for the rationing of electricity consumption in the most adversely affected regions, namely the southeast, central-west and northeast regions of Brazil; and |
| • | the creation of the CGE, which passed a series of emergency measures that provided for reduced electricity consumption targets for residential, commercial and industrial consumers in the affected regions by introducing special tariff regimes that encouraged the reduction of electricity consumption. |
| • | In March 2002, the CGE suspended the emergency measures and electricity rationing as a result of large increases in supply (due to a significant rise in reservoir levels) and a moderate reduction in demand, and accordingly, the Brazilian Government enacted new measures in April 2002 that, among other things, stipulated an extraordinary tariff readjustment to compensate financial losses incurred by the electricity suppliers as a result of the mandatory electricity rationing. |
| • | On March 15, 2004, the Brazilian Government enacted the Law No. 10,848 and on July 30, 2004, the Decree No. 5.163, or the Electricity Regulatory Law, in an effort to further restructure the power industry with the ultimate goal of providing consumers with secure electricity supplies combined with low tariffs, which law was regulated by a number of decrees enacted by the Brazilian Government in July and August of 2004, and is still subject to further regulation to be issued in the future. See “ – Challenges to the Constitutionality of the Electricity Regulatory Law.” |
| • | At the end of 2012, the Brazilian Government enacted two Provisional Measures (Medidas Provisórias or MP) that have considerably changed the Brazilian electric energy sector overview, namely MP 577, dated as of August 29, 2012 and MP 579, dated as of September 11, 2012. Both of them were approved and converted into Law No. 12,767, dated as of December 27, 2012 and Law No. 12,783, dated as of January 11, 2013, respectively. In general, the MPs provided the regulation in connection with the intervention of the granting authority in the concessions as well as the renewal of the electric energy generation, distribution and transmission concessions, respectively. |
- 52 -
Table of Contents
Concessions
The companies or consortia that wish to build or operate facilities for generation, transmission or distribution of electricity in Brazil must apply to MME or to ANEEL, as representatives of the Brazilian Government, for a concession, permission or authorization, as the case may be. Concessions grant rights to generate, transmit or distribute electricity in the relevant concession area for a specified period, though a concession may be revoked at any time at the discretion of the MME, following consultation with ANEEL. This period is usually 35 years for new generation concessions, and 30 years for new transmission or distribution concessions.
The Concession Law establishes, among other things, the conditions that the concessionaire must comply with when providing electricity services, the rights of the consumers, and the obligations of the concessionaire and the granting authority. Furthermore, the concessionaire must comply with regulations governing the electricity sector. The main provisions of the Concession Law are as follows:
| • | Adequate service. The concessionaire must render adequate service equally with respect to regularity, continuity, efficiency, safety, and accessibility. |
| • | Use of land. The concessionaire may use public land or request the granting authority to expropriate necessary private land for the benefit of the concessionaire. In that case, the concessionaire must compensate the private landowners affected. |
| • | Strict liability. The concessionaire is strictly liable for all damages arising from the provision of its services. |
| • | Changes in controlling interest. The granting authority must approve any direct or indirect change in the concessionaire’s controlling interest. |
| • | Intervention by the granting authority. The granting authority may intervene in the concession, by means of an administrative proceeding, to ensure the adequate performance of services, as well as full compliance with applicable contractual and regulatory provisions. Such intervention procedure was regulated by MP No. 577/2012, duly converted into Law No. 12,767/2012. |
| • | Termination of the concession. The termination of the concession agreement may be accelerated by means of expropriation and/or forfeiture. Expropriation is the early termination of a concession for reasons related to the public interest that must be expressly declared by law. Forfeiture must be declared by the granting authority after a final administrative ruling that the concessionaire, among other things: (i) has failed to render adequate service or to comply with applicable law or regulation; (ii) no longer has the technical, financial or economic capacity to provide adequate service; or (iii) has not complied with penalties assessed by the granting authority. The concessionaire may contest any expropriation or forfeiture in the courts. The concessionaire is entitled to indemnification for its investments in expropriated assets that have not been fully amortized or depreciated, after deduction of any amounts for fines and damages due by the concessionaire. |
| • | Expiration. When the concession expires, all assets, rights and privileges that are materially related to the rendering of the electricity services revert to the Brazilian Government. Following the expiration, the concessionaire is entitled to indemnification for its investments in assets that have not been fully amortized or depreciated at the time of expiration. |
Penalties
Law No. 9,427 of December 26, 1996, as amended, enacted by the Brazilian Government and supplemented by ANEEL’s regulation govern the imposition of sanctions against the agents of the electricity sector and classify the appropriate penalties based on the nature and importance of the breach (including warnings, fines, temporary suspension from the right to participate in bidding procedures for new concessions, licenses or authorizations and forfeiture). For each breach, the fines can be up to 2.0% of the revenue of the concessionaire in the 12-month period preceding any assessment notice or, for independent producers or self producers, the estimated amount of energy produced in the same period. Some infractions that may result in fines relate to the failure of the agent to request ANEEL’s approval, including the following (pursuant to ANEEL Resolution No. 63/2004, as amended from time to time):
| • | entering into certain related party transactions; |
| • | sale or assignment of the assets related to services rendered as well as the imposition of any encumbrance (including any security, bond, guarantee, pledge and mortgage) on them or any other assets related to the concession or the revenues of the electricity services; |
| • | changes in direct or indirect controlling interest of the holder of the authorization or concession; and |
| • | non-compliance with the schedule for the beginning of the commercial operation of the power plant, as previously approved by the ANEEL through the relevant contract. |
- 53 -
Table of Contents
With respect to contracts executed between related parties that are submitted for ANEEL’s approval, ANEEL may seek to impose restrictions on the terms and conditions of these contracts and, in extreme circumstances, determine that the contract be terminated early.
Furthermore, ANEEL has the institutional role of controlling the transactions of the energy industry, requiring that such transactions (change of control of the agents of the electric energy sector) be submitted to its prior approval before its implementation.
Renewal of the Concessions – Law No. 12,783
In 2012, the Brazilian Government enacted MP No. 579/2012, which was converted into Law No. 12,783. Among other provisions, the main purpose of this normative act is to regulate the renewal conditions for electric energy generation, distribution and transmission concessions.
Law No. 12,783 (i) establishes the conditions for the renewal of electric energy generation, distribution and transmission concessions; (ii) assures a tariff reduction; and (iii) creates a quotas system characterized by the allocation of the power generated by the hydroelectric plants to the distribution concessionaires of theSistema Interligado Nacional- SIN.
| (i) | Conditions for the renewal of electric energy generation, distribution and transmission concessions |
The granting authority may extend the maturing concessions of electric energy generation, distribution and transmission companies for a maximum period of 30 additional years, as long as the current concessionaires accept new specific conditions legally imposed in order to assure the continuity of the electric energy supply and the tariff-reduction.
The main terms and conditions for the renewal of concession imposed by Law No. 12,783 are:
| • | Hydroelectric generation: The renewal is subject to (i) a tariff determined by ANEEL, (ii) the commercialization in accordance with the quota allocation system and (iii) compliance with quality standards established by ANEEL; |
| • | Self-Producer (Autoprodutor): For the renewal of the concession the Self-Producer will be deemed to provide additional payment for the use of the public assets which will be used by the Federal Government to reduce the energy tariff charged to consumers; |
| • | Thermal Generation: The renewal must be requested by the concessionaire at least twenty four (24) months prior to expiration of the concession. If requested, the renewal will be granted for a maximum period of twenty (20) years; |
| • | Power Transmission: The renewal of transmission concessions is subject to the reduction of the annual permitted revenue (Receita Anual Permitidaor RAP, which is the annual value received by the concessionaire for rendering public transmission services) calculated by ANEEL as well compliance with quality standards established by ANEEL. |
| • | Power Distribution: The renewal is subject to specific conditions set forth in an amendment to the concession agreement (to be executed with companies applying for the renewal of the concessions), in order to optimize the services provided by the distribution concessionaires, as well as compliance with quality standards established by ANEEL. Until December 2013, the Federal Government has not enacted the regulation establishing the specific conditions for the renewal of power distribution concessions. |
These new conditions required for the renewal of concessions will be formalized by means of amendments to the concession agreements.
The concessions that are not renewed in accordance with the terms and conditions established by Law No. 12,783 will revert to the granting authority at the expiration of the concession and, subsequently, subjected to a new bidding procedure conducted by ANEEL, in accordance with the terms set forth in Law 8,666/1993. As a result of the bidding procedure, the generation, transmission or distribution assets will be granted to a concessionaire for a maximum period of 30 years. The concession holder will remain responsible for rendering public services, under the terms and conditions set forth in Law No. 12,783, until the assumption of the new winning bidder.
If the concession is renewed, the concessionaire will be entitled to an indemnification corresponding to the amount of investment made by the concessionaire for non-amortized reversible assets.
- 54 -
Table of Contents
The Ministry of Mines and Energy is responsible for determining the value of the non-amortized investments within these energy concessions to be renewed. In accordance with the Ministry’s determination, the values of our companies’ indemnifications are the following:
Generation Concession Contracts
Concessionaire | Hydroelectric Power Plant | Potential (MW) | Indemnification (R$ thousand) | Commencement of the Operation | ||||||||||
Eletrobras Chesf | Xingó | 3,162.0 | R$ | 2,929,832 | December 16, 1994 | |||||||||
Eletrobras Chesf | Paulo Afonso IV | 2,462.40 | R$ | 360,473 | December 1, 1979 | |||||||||
Eletrobras Chesf | Luiz Gonzaga (Itaparica) | 1,479.6 | R$ | 1,730,602 | June 13, 1988 | |||||||||
Eletrobras Furnas | Marimbondo | 1,440.0 | R$ | 64,368 | October 25, 1975 | |||||||||
Eletrobras Chesf | Apolônio Sales (Moxotó) | 400.0 | R$ | 84,613 | April 15, 1977 | |||||||||
Eletrobras Furnas | Corumbá I | 375.0 | R$ | 679,880 | April 1, 1997 | |||||||||
Eletrobras Chesf | Boa Esperança (Castelo Branco) | 237.3 | R$ | 72,783 | April 7, 1970 | |||||||||
Eletrobras Eletronorte | Coaracy Nunes | 68.0 | R$ | 35,492 | December 30, 1975 | |||||||||
Transmission Concession Contracts
Concessionaire | Concession Contract | Indemnification (R$ thousand) | ||||
Eletrobras Chesf | 061/2001-ANEEL | R$ | 1,587,160 | |||
Eletrobras Eletronorte | 058/2001-ANEEL | R$ | 1,682,267 | |||
Eletrobras Eletrosul | 057/2001-ANEEL | R$ | 1,985,568 | |||
Eletrobras Furnas | 062/2001-ANEEL | R$ | 2,878,027 | |||
| (ii) | Tariff-reduction |
According to Law No. 12,783, the tariff reduction will be the result of: (i) the reduction of sector charges, such as CCC, CDE and RGR; (ii) the new calculation of tariffs and RAPs of the renewed concessions as mentioned above; and (iii) investments provided by Federal Government.
| (iii) | Quotas Allocation System |
Law No. 12,783 also creates a mechanism for the allocation of the power generated by the hydroelectric plants connected to the SIN, whose concessions were renewed under this new regulatory framework, to the Regulated Market, with the purpose of increasing the amount of energy available to the distribution concessionaires and reduce the tariff charged to the final consumer. The quotas and the portion of energy allocated to the distribution concessionaires will be reviewed from time to time.
Administrative Intervention in Concessions
In August 2012 the Brazilian Government enacted Law No. 12,767/2012 with the purpose to regulate ANEEL’s intervention in the concessionaires to ensure the quality of the services provided by concessionaires and the performance of legal, regulatory and contract obligations.
In addition, Law No. 12,767/2012 regulates the termination of the concession in case of extinguishment or bankruptcy of the concessionaire or forfeiture of the concession. Furthermore, this law sets forth an administrative proceeding which is required for the termination of the concession.
As to corporate reorganization procedures (recuperação judicial ou extrajudicial) involving energy concessionaires, Law No. 12,767/2012 changed the regulatory framework as it forbids energy concessionaires to initiate judicial or extrajudicial procedures. See “Item 3.D, Risk Factors – Risks Relating to the Brazilian Power Industry” for more details.
Power Contracting Deficit of Distribution Companies
At the beginning of 2014, due to adverse hydrological conditions, electricity distribution companies faced a contractual deficit in connection with their consumers’ demand of nearly 3,500 MW. Accordingly, energy distribution companies had to purchase electricity from thermoelectric plants to secure the supply of Brazilian’s national electricity demand. Such electricity was acquired at high rates.
- 55 -
Table of Contents
The Federal Government announced, on March 13, 2014, certain measures to assist distribution companies to face these unexpected higher costs and expenses during the period between February to December, 2014, namely: (i) an electricity commercialization auction to be held by ANEEL and MME on April 2014, aiming to compensate the power contracting deficit of power distribution companies; and (ii) a financial contribution by the National Treasury of R$4.0 billion, through the Energy Development Account (Conta de Desenvolvimento Energético – CDE).
The Federal Government also allowed the Energy Trading Chamber, or CCEE to contract financial transactions in the amount of up to R$8.0 billion to assist distribution companies. Accordingly, the Federal Government issued Decree No, 8,221, dated April 1st, 2014, creating the Regulated Marked Account (Conta no Ambiente de Contratação Regulada orCONTA-ACR) which will receive the funding required for hiring and payment of financial obligations. With the purpose to make payments related to the financing contracted by CCEE, distribution companies shall, after the 2015 tariff review cycle, transfer specific amounts defined by ANEEL to CDE.
Principal Authorities
Ministry of Mines and Energy
The MME is the Brazilian Government’s primary regulator of the power industry acting as the granting authority on behalf of the Brazilian Government, and empowered with policy-making, regulatory and supervising capacities. The Brazilian Government, acting primarily through the MME, will undertake certain duties that were previously under the responsibility of ANEEL, including drafting guidelines governing the granting of concessions and the issuance of directives governing the bidding process for concessions relating to public services and public assets.
ANEEL
The Brazilian power industry is regulated by ANEEL, an independent federal regulatory agency. ANEEL’s primary responsibility is to regulate and supervise the power industry in line with the policy dictated by the MME and to respond to matters which are delegated to it by the Brazilian Government and by the MME. ANEEL’s current responsibilities include, among others: (i) administering concessions for electricity generation, transmission and distribution activities, including the approval of electricity tariffs; (ii) enacting regulations for the electricity industry; (iii) implementing and regulating the exploitation of energy sources, including the use of hydroelectric energy; (iv) promoting the public bidding process for new concessions; (v) settling administrative disputes among electricity generation entities and electricity purchasers; and (vi) defining the criteria and methodology for the determination of transmission tariffs.
National Energy Policy Council
On August 6, 1997, pursuant to Article 2 of Law No. 9,478, theConselho Nacional de Politica Energética (the National Energy Policy Council or CNPE) was created to advise the Brazilian president with respect to the development and creation of national energy policy. The CNPE is presided over by the Minister of Mines and Energy, and the majority of its members are ministers of the Brazilian Government. The CNPE was created to optimize the use of Brazil’s energy resources, to assure the supply of electricity to the country and to periodically review the use of regular and alternative energy to determine whether the nation is properly using a variety of sources of energy and is not heavily dependent on a particular source.
National Electricity System Operator
The ONS was created in 1998 by Law No. 9.648 dated May 27, 1998. The ONS is a non-profit private entity comprised of concessionaires, other legal entities holding permissions or authorizations in the electrical energy market, and consumers connected to the interconnected system. The Electricity Regulatory Law granted the Brazilian Government the power to nominate three executive officers to ONS’s board of executive officers. The primary role of the ONS is to coordinate and control the generation and transmission operations in the Interconnected Power System, subject to ANEEL’s regulation and supervision. The objectives and principal responsibilities of the ONS include: operational planning for the generation industry, organizing the use of the domestic Interconnected Power System and international interconnections, guaranteeing that all parties in the industry have access to the transmission network in a non-discriminatory manner, assisting in the expansion of the energy system, proposing plans to the MME for extensions of the Basic Network (which proposals must be taken into account in planning expansion of the transmission system) and submitting rules for the operation of the transmission system for ANEEL’s approval. Generators must declare their availability to ONS, which then attempts to establish an optimal electricity dispatch program.
Energy Trading Chamber
On August 12, 2004, the Brazilian Government enacted a decree setting forth the regulations applicable to the newCâmara de Comercialização de Energia Elétrica(Energy Trading Chamber or CCEE). On November 10, 2004 the CCEE
- 56 -
Table of Contents
succeeded the Wholesale Energy Market – MAE, the market in which all large electricity generation companies, energy traders and importers and exporters of electricity had participated and on which the spot price of electricity was determined. The CCEE assumed all of the assets and operations of the Wholesale Energy Market (which had previously been regulated by ANEEL).
One of the principal roles of the CCEE is to conduct public auctions on the Regulated Market, see “– The Electricity Regulatory Law; the Free Market and the Regulated Market – The Regulated Market.” In addition, the CCEE is responsible, among other things, for: (i) registering all the energy purchase agreements in theContratos de Comercialização de Energia no Ambiente Regulado (Regulated Market or CCEAR), and the agreements resulting from market adjustments and the volume of electricity contracted in the Free Market, see “ – The Electricity Regulatory Law; the Free Market and the Regulated Market – The Free Market;” and (ii) accounting and clearing of short-term transactions.
The CCEE’s members include generation, distribution and trading companies, as well as free consumers. Its board of directors is composed of four directors appointed by its members and one director, who serves as chairman of the board of directors, appointed by the MME.
The MME determines the maximum price of the energy sold in the regulated market through auctions, as specified under Decree No. 5,163 of 2004.
Energy Research Company
On August 16, 2004 the Brazilian Government enacted a decree creating theEmpresa de Pesquisa Energética (Energy Research Company or EPE) a state-owned company which is responsible for conducting strategic research on the energy industry, including with respect to electrical energy, oil, gas, coal and renewable energy sources. The research carried out by EPE is subsidized by the MME as part of its policymaking role in the energy industry. Furthermore, EPE is the entity in charge of the technical qualification of the projects participating in the bids promoted by ANEEL for sale of energy.
Energy Industry Monitoring Committee
The Electricity Regulatory Law authorized the creation, under Federal Decree No. 5,175 of August 9, 2004, of theComitê de Monitoramento do Setor Elétrico (Energy Industry Monitoring Committee or CMSE), which acts under the direction of the MME. The CMSE is responsible for monitoring the supply conditions of the system and for proposing preventive action (including demand-related action and contracting for a supply-side reserve) to restore service conditions where applicable.
Electric Power Transmission in Brazil
Transportation of large volumes of electricity over long distances is made by way of a grid of transmissions lines and substations with high voltages (from 230 kV to 750 kV), known as the Basic Network. Any electric power market agent that produces or consumes power is entitled to use the Basic Network.
Transmission lines in Brazil are usually very long, since most hydroelectric plants are usually located away from the large centers of power consumption. Today, the country’s system is almost entirely interconnected. Only the state of Roraima and parts of the states of Pará, Amazonas, Amapá and Rondônia are still not connected to the Interconnected Power System. In these states, supply is made by small thermal plants or hydroelectric plants located close to their respective capital cities.
The Interconnected Power System provides for the exchange of power among the different regions when a region faces problems generating hydroelectric power due to a drop in their reservoir levels. As the rainy seasons are different in the south, southeast, north and northeast of Brazil, the higher voltage transmission lines (500 kV or 750 kV) make it possible for locations with insufficient power output to be supplied by generating centers that are in a more favorable location.
The operation and management of the Basic Network is the responsibility of ONS, which is also responsible for managing power dispatching from plants on optimized conditions, involving use of the Interconnected Power System hydroelectric reservoirs and fuel thermal plants.
Our transmission system, which consists of a set of transmission lines interconnected to substations, is comprised of approximately 57,290 kilometers of transmission lines, corresponding to approximately 50.0% of the total lines in Brazil with a voltage higher or equal to 230 KV.
Besides operating and maintaining this system in accordance with the standards of performance and quality required by ANEEL, we have actively participated in the expansion of transmission lines through concessions in auctions conducted by ANEEL, alone or through consortiums, as well as through permits for reinforcements of the current system.
- 57 -
Table of Contents
The major transmission projects under development are: (i) LT 230 kV Funil – Itapebi C3 (BA); (ii) LT 230 kV Picos – Tauá II (PI/CE); (iii) LT 345 kV Tijuco Preto – Itapeti – Nordeste (SP); (iv) LT 600 kV Porto Velho – Araraquara (RO/SP); (v) LT 230 kV Eunapólis – Teixeira de Freitas II C2 (BA); (vi) Interligação Manaus – Boa Vista (AM/RR); (vii) Interligação Brasil – Uruguai (RS); (viii) LT 500 kV Salto Santiago – Itá – Nova Santa Rita (PR/SC/RS); (ix) LT 500 kV Nova Santa Rita – Povo Novo – Marmeleiro (RS); and (x) LT 500 kV Bom Despacho 3 – Ouro Preto 2 (MG).
| • | Brazil has a total of six medium and large interconnections with other countries in South America, four of them operated by us, as set forth below: |
| • | with Paraguay, through four 500 kV transmission lines connecting Usina de Itaipu toMargem Direita (Paraguay) substation and the Foz do Iguaçu in Brazil substation. Itaipu’s 50 Hz energy sector is then transported to the Ibiúna substation in São Paulo through a direct current transmission system with a capacity of 6,300 MW; |
| • | with Uruguay, through Rivera’s frequency converter station in Uruguay, with a capacity of 70 MW and a 230 kV transmission line connecting it to the Livramento substation in Brazil; |
| • | with Argentina, through Uruguaiana’s frequency converter station in Brazil, with a capacity of 50 MW and a 132 kV transmission line connecting it to Paso de los Libres in Argentina; and |
| • | with Venezuela, through a 230 kV transmission line with a capacity of 200 MW, which connects the city of Boa Vista, in the State of Roraima, to the city of Santa Elena in Venezuela. |
In the transitional environment (2002-2005), there was a gradual decline in the amounts of power contracted under Initial Supply Contracts, the generating companies paid for the use of the transmission line grid, whereas distributors were required to pay two types of transmission tariffs: (i) nodal tariffs, associated with each connection point from where these distributors demand voltage; and (ii) the transmission tariff, associated with the Initial Supply Contracts, which was applied to part of the demand contracted in that environment. Once the amounts under the Initial Supply Contracts dropped to zero, the power generating, distributing and selling companies and free consumers had free access agreements governing their use of transmission lines on equivalent terms with those of agents that entered the market after free access became compulsory. In this free market environment, transmission tariffs are determined based on the effective use that each party that accesses the Basic Network makes of it.
The Electricity Regulatory Law; the Free Market and the Regulated Market
The Electricity Regulatory Law introduced material changes to the regulation of the power industry with a view to: (i) remedying the deficiencies in the Brazilian electric system and (ii) creating incentives to ensure growth in the electrical energy sector to support Brazilian economic and social development. Through this law, legislators attempted to protect the distribution concessionaires’ captive consumers and to make low cost electrical energy continuity, which has a minimal environmental impact, available. The key features of the Electricity Regulatory Law included:
| • | Creation of: (i) the Regulated Market, in which the purchase and sale of electrical energy must follow rules imposed by the ANEEL and must occur through the CCEE; and (ii) a market specifically addressed to certain participants (e.g., free consumers and commercialization companies), that will permit a certain degree of competition with respect to the Regulated Market, called theAmbiente de Contratação Livre, or the Free Market, in which parties are free to negotiate the terms and conditions of their purchase and sale agreements; |
| • | Restrictions on certain activities of distributors, so as to ensure that they focus only on their core business to guarantee more efficient and reliable services to captive consumers; |
| • | Elimination of self-dealing, to provide an incentive to distributors to purchase electricity at the lowest available prices rather than buying electricity from related parties; and |
| • | Respect for contracts executed prior to the Electricity Regulatory Law, in order to provide stability to transactions carried out before its enactment. |
The Electricity Regulatory Law also excludes us and our subsidiaries from the National Privatization Program, which is a program created by the Brazilian Government in 1990 with a view to promote the privatization process of state-owned companies.
Challenges to the Constitutionality of the Electricity Regulatory Law
Some aspects of the Provisional Measure No. 144, as of December 10 2003, which originated the Electricity Regulatory Law, are being challenged in the Brazilian Supreme Court in Lawsuits No. 3090 and 3100. The provisional requests of both lawsuits were denied by the Brazilian Supreme Court in a decision published on October 26, 2007. A final decision on this matter is subject to majority vote of the 11 judges,provided that a quorum of at least eight justices must be present.
- 58 -
Table of Contents
To date, the Brazilian Supreme Court has not reached a final decision and we do not know when such a decision may be reached. The Brazilian Supreme Court ruled by six votes to four to deny the provisional measure requested to suspend the effects of the Electricity Regulatory Law until the final decision on the case has been made; however, a final decision remains pending. Therefore, the Electricity Regulatory Law is in force as of March 15, 2004 to present date. Regardless of the Supreme Court’s final decision, certain portions of the Electricity Regulatory Law relating to restrictions on distribution companies performing activities unrelated to the distribution of electricity, including sales of energy by distribution companies to free consumers and the elimination of self-dealing are expected to remain in full force and effect.
If all or a relevant portion of the Electricity Regulatory Law is determined unconstitutional by the Brazilian Supreme Court, the regulatory scheme introduced by the Electricity Regulatory Law may lose its effectiveness, generating uncertainty as to how the Brazilian Government will define the rules for the electrical energy sector. Considering that we have already purchased virtually all of our electricity needs through our subsidiaries both in the ACR and ACL and that the pass through to tariffs of such electricity is expected to continue to be regulated by the regime predating the Electricity Regulatory Law, irrespective of the outcome of the Supreme Court’s decision, we believe that in the short term, the effects of any such decision on our activities should be relatively limited. The exact effect of an unfavorable outcome of the legal proceedings on us and the electricity industry as a whole is difficult to predict, but it could have an adverse impact on our business and results of operations even in the short term (see “Risk Factors – Risks Relating to the Brazilian Power Industry”).
Markets for the Trading of Electricity
Under the Electricity Regulatory Law, electricity purchase and sale transactions may be carried out in two different market segments: (i) the Regulated Market, which contemplates the purchase by distribution companies through public bids of all electricity necessary to supply their captive consumers; and (ii) the Free Market, which encompasses purchase of electricity by non-regulated entities (such as free consumers and energy traders).
Nevertheless, electricity generated by plants qualified under the Proinfa, nuclear power plants and Itaipu are governed by a special regime for commercialization and, therefore, are not subject to either the Regulated or the Free Market. The electricity generated by Itaipu, the most relevant among energy sources governed by a separate regime including Decree 4,550 of December 27, 2002, is sold to us and sold to distribution concessionaires in the south and center-south-eastern power markets in proportion to their market share in those markets. The rates at which Itaipu-generated electricity is traded are denominated in U.S. dollars and established pursuant to a treaty between Brazil and Paraguay. As a consequence, Itaipu rates rise or fall in accordance with the variation of the U.S. dollar/real exchange rate. Changes in the price of Itaipu-generated electricity are, however, subject to full pass-through to distribution tariffs.
The Regulated Market
Distribution companies must meet market demand by supplying electricity primarily purchased in public auctions in the Regulated Market. Distribution companies, however, may purchase electricity from: (i) generation companies that are connected directly to such distribution company, except for hydro generation companies with capacity higher than 30 MW and certain thermo generation companies; (ii) electricity generation projects participating in the initial phase of the Proinfa; and certain power distribution companies in the south and center-south-eastern power markets, and (iii) the Itaipu hydroelectric plant.
Electricity public auctions for new generation projects are held: (i) five years before the initial delivery date (referred to as “A-5” auctions); and (ii) three years before the estimated initial delivery date (referred to as “A-3” auctions). Electricity auctions from existing power generation facilities are held (i) one year before the estimated initial delivery date (referred to as “A-1” auctions) and/or (ii) the same year of the estimated initial delivery date (referred to as “A” auctions). Additionally, the Brazilian Government, directly or indirectly through ANEEL, carries out public auctions for the sale of electrical energy to energy distributors to allow distributors to adjust their volume of electrical energy as necessary to meet their customers’ demands, or Market Adjustments.
The public auctions are prepared by ANEEL in compliance with guidelines established by the MME, including the requirement to use the lowest bid as the criteria to determine the winner of the auction.
Each generation company that participates in the auction must execute a contract for purchase and sale of electricity with each distribution company in proportion to the distribution companies’ respective estimated demand for electricity. The CCEARs for both “A-5” and “A-3” auctions have a term of between 15 and 30 years, and the CCEARs for “A-1” auctions have a term between three and 15 years. The CCEARs for “A” auctions have a term between one to 15 years. The CCEARS for alternative energy sources are between 10 and 30 years. The only exception to these rules relates to the market adjustment auction, in which the generation and the distribution companies will enter into two-year bilateral agreements that must be registered with the ANEEL and the CCEE.
- 59 -
Table of Contents
The regulations also establish a pass-through tariff mechanism called Annual Reference Value, which limits the amounts of electric energy acquisition costs that can be passed through to final consumers. The Annual Reference Value corresponds to the weighted average of the electricity prices in the “A-5” and “A-3” auctions, calculated for all distribution companies.
The Annual Reference Value creates an incentive for distribution companies to contract for their expected electricity demand in the “A-5” auctions, where the prices are expected to be lower than in “A-3” auctions. ANEEL allows companies to pass on their electrical energy acquisition costs to final consumers pursuant to the following criteria: (i) in the A-5 auctions, companies are permitted to pass on all costs to consumers, subject to the limitations referred to below; (ii) in the A-3 auctions companies are permitted to: (a) pass all acquisition costs for energy acquired in A-5 auctions up to 2% of the difference between the energy acquired in A-3 auctions during the year and the distributor’s energy requirements; and (b) pass on whichever of the following is less – the A-5 auctions and in the A-3 auctions; (iii) in the A-1 auctions, companies are permitted to pass on all costs to consumer; (iv) in the Market Adjustments auctions and in the acquisitions of energy directly from a generation plant connected to the distributors’ electric system (except as set forth in law), companies are permitted to pass on all costs up to the Annual Reference Value to consumer; and (v) in the alternative energy source auctions and others determined by the Brazilian government, companies are permitted to pass on all costs to consumer.
ANEEL maintains the economic value of the Annual Reference Value by adjusting the Annual Reference Value pursuant to the monetary adjustment index agreed upon in the CCEARs.
The Electricity Regulatory Law establishes the following limitations on the ability of distribution companies to pass through costs to consumers:
| • | No pass-through of costs for electricity purchases that exceed 103.0% of actual demand; |
| • | The pass-through of electricity acquisition costs from new electricity generation projects equal to the difference between the minimum purchase threshold (96% of repossessed energy contracted pursuant to the Electricity Regulatory Law) and the energy purchased in the A-1 auctions will be limited to the weighted average amount (inreais/MWh) of the acquisition prices in the A-1 auctions, except that this limit is applicable solely: (i) in the first three years following A-1 auctions in which the minimum purchase threshold was not reached; (ii) to the CCEARs relating to portion of energy acquired in A-3 and A-5 auctions with the highest price; |
| • | The MME will establish the maximum acquisition price for electricity generated by existing projects; and |
| • | If distribution companies do not comply with the obligation to fully contract their demand, the pass-through of the costs from energy acquired in the CCEE short-term market will be the lower of the Price of Liquidation of Differences (PLD) and the Annual Reference Value. |
Auctions in the Regulated Market, subject to the conditions set forth in the respective requests for proposals, may originate two types of CCEARs: (i) Contratos de Quantidade de Energia (Energy Agreements); and (ii) Contratos de Disponibilidade de Energia (Capacity Agreements).
Under an Energy Agreement, a generator commits to supply a certain amount of electricity and assumes the risk that the electricity supply could be adversely affected by hydrological conditions and low reservoir levels, among other conditions, that could interrupt the supply of electricity, in which case the generator will be required to purchase the electricity elsewhere in order to comply with its supply commitments. Under a Capacity Agreement, a generator commits to make a specified amount of capacity available to the Regulated Market. In this case, the revenue of the generator is guaranteed and the distribution companies face the risk of a supply shortage. However, the increased prices of electricity due to a supply shortage are passed on by the distribution companies to consumers.
The Electricity Regulatory Law sets forth that all electricity generation, distribution and trading companies, independent power producers and free consumers must inform MME, by the first of August of each year, of their estimated electricity demand or estimated electricity generation, as the case may be, for each of the subsequent five years. To encourage power distribution companies to make accurate estimates and to enter into power purchase agreements accordingly, pass-through tariffs, as mentioned above, are permitted provided that the purchased power stays within 103.0% of the distribution company’s actual power demand. Surpluses and shortages of power distribution companies concerning power acquisitions in the Regulated Market may be offset against each other by means of an offsetting mechanism managed by CCEE. According to the Electricity Regulatory Law, electricity distribution entities are entitled to pass on to their customers the costs related to electricity purchased through public auctions as well as any taxes and industry charges related to public bids, subject to certain limitations related to the inability of distribution companies to accurately forecast demand.
- 60 -
Table of Contents
Electrical Energy Trading Convention
ANEEL Resolutions No. 109, of October 26, 2004 and No. 210, of February 24, 2006, govern theConvenção de Comercialização de Energia Elétrica (the Electrical Energy Trading Convention) which regulates the organization and functioning of the CCEE and the electrical energy trading conditions and defines, among others: (i) the rights and obligations of CCEE agents; (ii) the penalties to be imposed on defaulting agents; (iii) the means of dispute resolution; (iv) trading rules in the Regulated and Free Markets; and (v) the accounting and clearing process for short-term transactions.
CCEE is a non-profit organization whose members are all agents of the Brazilian power sector (certain agents are not mandatory members of CCEE and may be represented by other members). CCEE is responsible for (i) registering the conditions concerning power amounts and terms set forth in all power purchase agreements, whether entered into in the Regulated Market or the Free Market; and (ii) the accounting and liquidation of the power market, including the power surpluses and shortages spot market, among other attributions. CCEE is governed by a board of directors comprised of five members, four being nominated by the referred agents while its president is nominated by the MME.
The Free Market
The Free Market covers freely negotiated electricity sales between generation concessionaires, Independent Power Producers, self-generators, energy traders, importers of energy and free consumers. The Free Market also includes bilateral contracts between generators and distribution companies executed before the enactment of the Electricity Regulatory Law, until they expire. Upon expiration, new contracts must be entered into in accordance with the Electricity Regulatory Law guidelines.
Such an extended period of notice seeks to assure that, if necessary, the construction of cost-efficient new generation could be finalized in order to supply the re-entry of free consumers into the Regulated Market. State-owned generators may sell electricity to free consumers, but as opposed to private generators, they are obligated to do so through a public process that guarantees transparency and equal access for all interested parties.
Free Consumers
According to the Electricity Regulatory Law, a free consumer may elect to: (i) continue to procure power from a local distribution company; (ii) buy power directly from an independent producer or from self-producers with surplus power; or (iii) buy power from a power trade agent.
The Electricity Regulatory Law does not permit distribution concessionaires to sell power to free consumers directly (except under certain regulatory conditions).
The Electricity Regulatory Law further establishes that the option to become a free consumer is subject to the prior expiration or termination of its power purchase agreement with the power distribution company. In the event that the power purchase agreement has an indefinite term, the migration to the Free Market is permitted only in the year following receipt of a migration notice by the power distribution company, provided that this notice is presented by July 15 of such year. Once a consumer has migrated to the Free Market, it may only return to the Regulated Market once it has given the relevant distribution company five years’ notice, although the distribution company may reduce that term at its discretion.
The Electricity Regulatory Law has, in principle, established some conditions and power and consumption thresholds that define which consumers could qualify as “free consumers.” These thresholds may be gradually reduced over the years by ANEEL so as to allow an increasing number of consumers to make this election, until such time as all consumers from all the different classes can choose which supplier they want to procure power from.
The law assures suppliers and their respective consumers free access to the grid subject to the payment of tariffs for the use of the electric power grids and connection costs. All regulatory charges to which captive consumers are subject are added to these tariffs in order to assure fair and equal treatment between captive and free consumers.
The regulations above are intended (1) to avoid arbitrage between captive and free markets by Free Consumers, prohibiting opportunistic migrations, as well as (2) to protect power distribution companies by making the captive market more predictable. Further, ANEEL must regulate the migration to the Free Market without increasing captive market tariffs.
Restricted Activities of Distributors
Distribution companies are not permitted to, except as otherwise provided by Law 9,074/1995: (i) develop activities related to the generation or transmission of electricity; (ii) sell electricity to free consumers, except for those in their concession area and under the same conditions and tariffs maintained with respect to captive customers in the Regulated Market; (iii) hold, directly or indirectly, any interest in any other company, corporation or partnership; or (iv) develop commercial
- 61 -
Table of Contents
activities that are unrelated to their respective concessions, except for those permitted by law or in the relevant concession agreement. Generators are not allowed to hold equity interests in excess of 10.0% in distribution companies or to hold a controlling shareholding interest in distribution companies.
Elimination of Self-Dealing
Since the purchase of electricity for captive consumers will be performed through the Regulated Market, so-called self-dealing is no longer permitted, except in the context of agreements that were duly approved by ANEEL before the enactment of the Electricity Regulatory Law. Distribution companies may, however, enter into power purchase agreements with related parties, provided that such agreements are the result of power auctions conducted in the Regulated Market. Before the Electricity Regulatory Law, such companies were permitted to meet up to 30.0% of their electricity needs through electricity that was acquired from affiliated companies.
Ownership Limitations
In 2000, ANEEL established limits on the concentration of certain services and activities within the power industry. Under such limits, with the exception of companies participating in the National Privatization Program (which needed only to comply with such limits once their final corporate restructuring is accomplished) no power company (including both its controlling and controlled companies) could: (i) own more than 20.0% of Brazil’s installed capacity, 25.0% of the installed capacity of the southern/southeastern/mid-western region of Brazil or 35.0% of the installed capacity of the northern/northeastern region of Brazil, except if such percentage corresponded to the installed capacity of a single generation plant; (ii) own more than 20.0% of Brazil’s distribution market, 25.0% of the southern/southeastern/mid-western distribution market or 35.0% of the northern/northeastern distribution market, except in the event of an increase in the distribution of electricity exceeding the national or regional growth rates; or (iii) own more than 20.0% of Brazil’s trading market with final consumers, 20.0% of Brazil’s trading market with non-final consumers or 25.0% of the sum of the above percentages.
In accordance with paragraph one, Article 31 of the Electricity Regulatory Law, we and our subsidiaries Eletrobras Furnas, Eletrobras Chesf, Eletrobras Eletronorte, Eletrobras Eletrosul and Eletrobras CGTEE were excluded from the National Privatization Program. Accordingly, we were subject to the limits and conditions imposed on the participation of agents in the activities of the electricity sector, in accordance with ANEEL Resolution No. 278/2000, which is aimed at achieving effective competition between agents and preventing a concentration in the services and activities undertaken by agents within the electricity sector.
On November 10, 2009, ANEEL issued Resolution No. 378, which revoked and replaced Resolution No. 278/2000 and established that ANEEL, upon identifying an act that may result in unfair competition or in significant control of the generation, transmission and distribution markets, must notify the Secretary of Economic Law(Secretaria de Direito Econômico, or SDE) of the Ministry of Justice, pursuant to art. 54 of Law No. 8,884 of June 11, 1994. After notification, the SDE must inform the antitrust authority, the Administrative Counsel of Economic Defense (Conselho Administrativo de Defesa Econômica), or CADE. If necessary, the SDE will require ANEEL to analyze potential infractions under Resolution No. 378, while CADE must determine any applicable punishment, which may vary from pecuniary penalties to the dissolution of the company, pursuant to articles 23 and 24 of the abovementioned law.
Tariffs for the Use of the Distribution and Transmission Systems
ANEEL oversees tariff regulations that govern access to the distribution and transmission systems and establish tariffs for the use of and access to said systems. The tariffs are: (i) network usage charges, which are charges for the use of the proprietary local grid of distribution companies (or TUSD); and (ii) a tariff for the use of the transmission system, which is the Basic Network and its ancillary facilities (or TUST). Additionally, distribution companies in the Southern/Southeastern Interconnected Power System pay specific charges for the transmission of electricity generated at Itaipu and for access to the transmission system.
TUSD
The TUSD is paid by generators, free consumers and special consumers for the use of the distribution system of the distribution company to which the relevant generator or free consumer is connected and are revised annually according to an inflation index. The amount to be paid is based on a formula set forth and consolidated by ANEEL Resolution No. 166/2005, as amended, by ANEEL Resolution No. 399/2010, and may vary pursuant to a number of different factors, including, for instance, costs of the network, operating costs and energy losses, among others. Our distribution companies receive the TUSD paid by free consumers in their concession areas and by some other distribution companies which are connected to our distribution system.
- 62 -
Table of Contents
TUST
The TUST is paid by distribution companies and uses, including generators, free consumers and special consumers, for the use of the Basic Network. The amount to be paid is based on a formula set by ANEEL Resolution No. 67/2004, as amended by ANEEL Resolution No. 442/2011, and it may vary pursuant to a number of different factors. According to criteria established by ANEEL, owners of the different parts of the transmission grid have transferred the coordination of their facilities to the ONS in return for receiving regulated payments from users of the transmission system. Network users, including generation companies, distribution companies and free consumers, have signed contracts with the ONS entitling them to use the transmission grid in return for the payment of published tariffs. Other parts of the grid that are owned by transmission companies but which are not considered part of the transmission grid are made available directly to the interested users who pay a specified fee to the relevant transmission company.
Contract for Access to the Intermediary Connection System – Access Charge
Some distribution companies, especially in the State of São Paulo, access the Basic Network through an intermediary connection system located between their respective distribution lines and the Basic Network. This connection is formalized by means of a Contract for the Access to the Intermediary Connection System entered into with transmission concessionaires that own such facilities. Compensation for the transmission companies is regulated by ANEEL and is defined in accordance with the cost of the assets used, whether they are their exclusive property or shared among the electricity industry agents. The correspondent compensation incidental to the use of the intermediary connection system is revised annually by ANEEL according to an inflation index and to the costs relating to the assets.
Itaipu Transportation Charge
The Itaipu plant has an exclusive transmission grid operated in alternating and continuous voltage, which is not considered to be part of the Basic Network or of the intermediary connection system. The use of such system is compensated by a specific charge, denominated the Itaipu transportation charge, paid by those companies entitled to quotas of the electricity from Itaipu, in proportion to their quotas.
Distribution Tariffs
Distribution tariff rates are subject to review by ANEEL, which has the authority to adjust and review tariffs in response to changes in electricity purchase costs and market conditions. When adjusting distribution tariffs ANEEL divides the costs of distribution companies between: (i) costs that are beyond the control of the distributor (or Parcel A costs); and (ii) costs that are under the control of distributors (or Parcel B costs). The readjustment of tariffs is based on a formula that takes into account the division of costs between the two categories.
| • | Parcel A costs include, among others, the following: |
| • | costs of electricity purchased for resale pursuant to Initial Supply Contracts; |
| • | costs of electricity purchased from Itaipu; |
| • | costs of electricity purchased pursuant to bilateral agreements that are freely negotiated between parties; and |
| • | certain other connection and usage charges for the transmission and distribution systems. |
Parcel B costs are determined by subtracting all the Parcel A costs from the distribution company’s revenues.
Each distribution company’s concession agreement provides for an annual tariff adjustment (reajuste anual). In general, Parcel A costs are fully passed through to consumers. Parcel B costs, however, are adjusted for inflation in accordance with the IGP-M index.
Electricity distribution companies are also entitled torevisão periódica (revisions) every five years. These revisions are aimed at: (i) assuring that revenues are sufficient to cover Parcel B operating costs and that adequate compensation for essential investments for the services within the scope of each such company’s concession; and (ii) determining the “X factor,” which is an efficiency factor based on three components: (a) expected gains of productivity from increase in scale; (b) evaluations by consumers (verified by ANEEL); and (c) labor costs.
Accordingly, upon the completion of each periodic revision, application of the X factor requires distribution companies to share their productivity gains with final consumers.
The pass-through of electricity purchase costs under supply agreements negotiated before the enactment of the Electricity Regulatory Law is subject to a ceiling based on a value established by ANEEL for each different source of energy (such as hydroelectric, thermoelectric and alternative sources of energy). This ceiling is adjusted annually in order to reflect increases in costs incurred by generators. That adjustment takes into account: (i) inflation; (ii) costs incurred in hard currency; and (iii) fuel related costs (such supply of natural gas). Costs incurred correspond to at least 25.0% of all costs incurred by generators.
- 63 -
Table of Contents
In addition, concessionaires of electricity distribution are entitled torevisão extraordinária (extraordinary review) of tariffs, on a case by case basis, to ensure their financial equilibrium and compensate them for unpredictable costs, including taxes, that significantly change their cost structure.
Incentive Programs for Alternative Sources of Electricity
Thermoelectric Priority Program
In 2000, a federal decree created thePrograma Prioritário de Termeletricidade (the Thermoelectric Priority Program or PPT), for purposes of diversifying the Brazilian energy matrix and decreasing its strong dependency on hydroelectric plants. The benefits granted to thermoelectric plants under the PPT include: (i) guaranteed gas supply for 20 years; (ii) assurance that costs related to the acquisition of the electricity produced by thermoelectric plants will be transferred to tariffs up to a normative value determined by ANEEL; and (iii) guaranteed access to a BNDES special financing program for the power industry.
Proinfa
In 2002, the Proinfa program was established by the Brazilian Government to create certain incentives for the development of alternative sources of energy, such as wind energy projects, Small Hydroelectric Power Plants and biomass projects. As with some other social programs, we are involved in the administration of the Proinfa program.
Under the Proinfa program, we purchase electricity generated by these alternative sources for a period of up to 20 years and transfer it to free consumers and certain electricity distribution companies (which are responsible for including the costs of the program in the tariffs for all final consumers in their respective concession area, except for low-income consumers). In its initial phase, the Proinfa program is limited to a total contracted capacity of 3,300 MW (1,100 MW for each of the three alternative energy sources).
In its second phase, which should start after the 3,300 MW limit is reached, the Proinfa program is intended, in a period of up to 20 years, to have contracted capacity equivalent to 10.0% of the annual domestic consumption of electricity. Upon the success of electricity auctions promoted by the Federal Governmental, the second phase of Proinfa has not yet been launched.
Research and Development – R & D
Concessionaires and companies authorized to engage in public power distribution, generation and transmission businesses are required to invest annually at least 1.0% of their net operating income in electric power research and development. Companies that only generate power from wind, biomass and Small Hydroelectric Power Plants are not subject to this requirement.
Regulatory Charges
Global Reversion Reserve Fund
In certain circumstances, power companies are compensated for assets used in connection with a concession if the concession is eventually revoked or is not renewed. In 1971, the Brazilian Congress created a Reserva Global de Reversão (a Global Reversion Reserve Fund or RGR Fund) designed to provide funds for such compensation. In February 1999, ANEEL revised the assessment of a fee requiring all distributors and certain generators operating under public service regimes to make monthly contributions to the RGR Fund at an annual rate equal to 2.5% of the company’s fixed assets in service, but not to exceed 3.0% of total operating revenues in any year. In recent years, no concessions have been revoked or have failed to be renewed, and in recent years the RGR Fund has been used principally to finance generation and distribution projects. With the introduction of MP No. 517/2010, the RGR Fund is scheduled to be phased out by 2035, and ANEEL is required to revise the tariff so that the consumer will receive some benefit from the termination of the RGR Fund. In accordance with Law No. 12,783, distribution concessions, transmission concessions granted after September 12, 2012 and all renewed generation and transmission concessions will no longer be deemed to pay RGR charges by January 1st, 2013.
Public Use Fund
The Brazilian Government has imposed a fee on Independent Power Producers reliant on hydrological resources, except for Small Hydroelectric Power Plants, similar to the fee levied on public industry companies in connection with the RGR Fund. Independent Power Producers are required to make contributions to theFundo de Uso de Bem Público (the Public
- 64 -
Table of Contents
Use Fund or UBP Fund) according to the rules of the corresponding public bidding process for the granting of concessions. We received the UBP Fund payments until December 31, 2002. All payments to the UBP Fund since December 31, 2002 are paid directly to the Brazilian Government.
Fuel Consumption Account
Distribution companies, and generation companies that sell directly to final consumers, must contribute to theConta de Consumo de Combustível (the Fuel Consumption Account or CCC Account). The CCC Account was created in 1973 to generate financial reserves to cover elevated costs associated with the increased use of thermoelectric energy plants, in the event of a rainfall shortage, given the higher marginal operating costs of thermoelectric energy plants compared to hydroelectric energy plants. In February 1998, the Brazilian Government provided for the phasing out of the CCC Account. Subsidies from the CCC Account have been phased out over a three-year period beginning in 2003 for thermoelectric energy plants constructed prior to February 1998 and belonging to the Interconnected Power System. Thermoelectric plants constructed after that date will not be entitled to subsidies from the CCC Account. In April 2002, the Brazilian Government established that subsidies from the CCC Account would continue to be paid to those thermoelectric plants located in isolated regions for a period of 20 years in order to promote generation of electricity in those regions.
Law No. 12,111 amended the formula for calculation of the CCC Account relating to the Isolated System. The amount of the reimbursement through the CCC Account is equal to the total cost of generation minus the total amount of energy utilized by the agent at the average unitary energy price determined at auctions of the Interconnected system. The total cost of generation includes the cost of fuel, the cost of energy purchased and associated power, operation and maintenance costs for distribution, asset depreciation, return on investment, energy sector fees, goods circulation tax (provided it is not compensated by the distribution company) and other costs associated with the rendering of services in remote regions. Our subsidiaries which produce energy in the North of Brazil are being reimbursed for their production costs through the CCC Account. The CCC Account’s regulatory agency established thresholds for costs associated with the generation of energy, and costs above these thresholds are not reimbursed.
However, Law No. 12,783 extinguished the apportionment of the benefit of reduction of the costs for fuel consumption within electric energy generation.
Energy Development Account
In 2002, the Brazilian Government instituted theConta de Desenvolvimento Energético (Energy Development Account or CDE Account), which is funded through annual payments made by concessionaires for the use of public assets, penalties and fines imposed by ANEEL and, since 2003, the annual fees to be paid by agents offering electricity to final consumers, by means of a charge to be added to the tariffs for the use of the transmission and distribution systems. These fees are adjusted annually. The CDE Account was created to support the: (i) development of electricity production throughout the country; (ii) production of electricity by alternative energy sources; and (iii) universalization of energy services throughout Brazil. The CDE Account will be in effect for 25 years and is regulated by ANEEL and managed by us.
The Electricity Regulatory Law establishes that the failure to pay the contribution to the RGR Fund, Proinfa program, the CDE Account, the CCC Account, or payments due by virtue of purchase of electricity in the Regulated Market or from Itaipu prevents the non-paying party from receiving a tariff readjustment (except for an extraordinary review) or receiving resources arising from the RGR Fund, CDE Account or CCC Accounts.
Electricity Reallocation Mechanism
TheMecanismo de Realocação de Energia (energy reallocation mechanism) provides financial protection against hydrological risks for hydro-generators according to energy commercialization rules in effect, to mitigate the shared hydrological risks that affect the generators and assure the optimal use of the hydroelectric resources of the Interconnected Power System.
The mechanism guarantees that all the generators that participate in it will be able to sell the amount of electricity which they have contracted to sell under long-term contracts as determined by ANEEL, which we refer to as “assured electricity,” irrespective of their actual electricity production,provided that the power plants participating in the mechanism, as a whole, have generated sufficient electricity. In other words, the mechanism reallocates electricity, transferring surplus electricity from those generators whose generation was in excess of their assured electricity, to those whose generation was less than assured electricity. The effective generation dispatch is determined by the ONS, which takes into account nationwide electricity demand, the hydrological conditions of the Interconnected Power System and transmission limitations.
- 65 -
Table of Contents
Reimbursement of the generation costs of the relocated electricity is provided to compensate generators that relocate electricity to the system in excess of their assured electricity. Generators are reimbursed for their variable operational costs (except fuel) and costs for the use of water. The total costs of the relocated electricity (from all generators that provided electricity to the energy reallocation mechanism) are then combined and paid by the generators that receive electricity from the mechanism.
The mechanism includes all hydroelectric power plants subject to the centralized dispatching of the ONS, small hydroelectric stations that opt to participate in the mechanism and thermal power plants with centralized dispatching, included in the Initial Supply Contracts and whose fuel costs are subsidized by the Fuel Consumption Account. Since 2003, the Fuel Consumption Account power plants only partially participated in the mechanism, due to the gradual reduction of the subsidy.
Electric Power Services Supervision Fee – TFSEE
ANEEL also charges a supervision fee from electric power services agents and concessionaires. This fee is called the Electric Power Services Supervision Fee (or TFSEE) and was created under Law No. 9,427 of December 26, 1996, as amended by Law No. 12,111 of December 9, 2009, and Law No. 12.783/2013, and is charged at the rate of 0.4% of the annual economic benefit posted by the agent or concessionaire. The economic benefit is determined based on the installed capacity of authorized generating and transmitting concessionaires or on annual sales income posted by distribution concessionaires. This fee is collected by ANEEL in twelve monthly installments.
Financial Compensation For Use Of Water Resources (CFURH)
The states, the Federal District, and municipalities, as well as direct public federal administration bodies all receive financial compensation from generating companies for use of water resources and loss of productive land due to the flooding of the area for the construction and generation of electric power. CFURH is based on power output and paid to the states and municipalities in which the plant or reservoir is situated. ANEEL is responsible for the collection and management of such fee. This charge is not assessed on Small Hydroelectric Power Plants, as they are exempt from this requirement.
Emergency Capacity Charge (ECE)
ECE was created as provided for in Article 1 of Law No. 10,438 of April 26, 2002, as amended by Law No. 12,212 of January 20, 2010. It is assessed proportionally to the final individual total consumption of all consumers served by the Interconnected Power System and classified as a specific tariff charge. ANEEL ruled that its basis would be the cost of contracting generating capacity or voltage estimated byComercializadora Brasileira de Energia Emergencial (or CBEE) in any given year.
Rationing
The Electricity Regulatory Law establishes that, in a situation where the Brazilian Government decrees a compulsory reduction in the consumption of electricity in a certain region, all energy amount agreements in the Regulated Market, registered within the CCEE in which the buyer is located, must have their volumes adjusted in the same proportion to the consumption reduction.
The Effects of the New Bankruptcy Law on Us
On February 9, 2005, the Brazilian Government enacted Law No. 11,101, or the New Bankruptcy Law. The New Bankruptcy Law, which came into effect on June 9, 2005, governs judicial recovery, extrajudicial recovery and liquidation proceedings and replaces the debt reorganization judicial proceeding known asconcordata(reorganization) for judicial recovery and extrajudicial recovery. The New Bankruptcy Law provides that its provisions do not apply to government owned and mixed capital companies. However, the Brazilian Federal Constitution establishes that mixed capital companies, such as Eletrobras, which operate a commercial business, will be subject to the legal regime applicable to private corporations in respect of civil, commercial, labor and tax matters. Therefore it is unclear whether or not the provisions in connection with judicial and extrajudicial recovery and liquidation proceedings of the New Bankruptcy Law would apply to us.
Judicial Recovery
In order to request judicial recovery, a debtor must fulfill the following requirements: (i) conduct its business in a regular manner for more than two years; (ii) not be bankrupt (or, in the event that the debtor was bankrupt in the past, then all obligations arising therefrom must have been declared extinguished by a judgment not subject to appeal); (iii) not have been granted a judicial recovery or special judicial recovery in the five or eight years prior to its request, respectively; and
- 66 -
Table of Contents
(iv) not have been convicted of (or not have a controlling partner or manager who has been convicted of) a bankruptcy crime. All claims in existence at the time of the request for judicial recovery are subject to such procedure (including potential claims), except for claims of tax authorities, creditors acting as fiduciary owners of real or personal properties, lessors, owners or committed sellers of real estate, including for real estate developments, or owners under sale agreements with a title retention clause (paragraph 3 of Article 49 of the New Bankruptcy Law). The judicial recovery can be implemented by means of one or more of the following transactions, amongst others (i) the granting of special terms and conditions for the payment of the debtor’s obligations; (ii) spin-off, merger, transformation of the company, incorporation of a wholly-owned subsidiary or the assignment of quotas or shares; (iii) transfer of corporate control; (iv) partial or total replacement of the debtor’s management, as well as the granting to its creditors the right to independently appoint management and the power of veto; (v) capital increase; (vi) leasing of its premises; (vii) reduction in wages, compensation of hours and reduction of the workday, by means of collective bargaining; (viii) payment in kind or the renewal of the debtor’s debts; (ix) creation of a company composed of creditors; (x) partial sale of assets; (xi) equalization of the debtor’s financial charges; (xii) constitution of anusufruct on the company; (xiii) shared management of the company; (xiv) issuance of securities; and (xv) creation of a special purpose company for purposes of receiving the debtor’s assets.
However, in accordance with Law No. 12,767/2012, energy concessionaires may no longer initiate judicial or extrajudicial corporate reorganization procedures (recuperação judicial ou extrajudicial).
Extrajudicial Recovery
The New Bankruptcy Law also created the extrajudicial recovery mechanism, by means of which a debtor who meets the requirements for the judicial recovery (as outlined above) may propose and negotiate with its creditors an extrajudicial recovery plan, which must be submitted to the court for approval. Once approved, such a plan will constitute a valid means of enforcement. The extrajudicial recovery is not applicable, however, to any claims relating to labor- or workplace related accidents, as well as to any claims excluded from judicial recovery. In addition, the request for court approval of an extrajudicial recovery plan will does not impose a moratorium on the rights, suits and enforcement proceedings of creditors not subject to such plan, and those creditors will still be able to request the debtor’s bankruptcy.
As mentioned above, energy concessionaires may no longer initiate judicial or extrajudicial corporate reorganization procedures (recuperação judicial ou extrajudicial).
Liquidation
The New Bankruptcy Law changed the order in which claims are classified in the context of liquidation proceedings to the following order, which is set out in order of priority: (i) labor claims in general (limited to a maximum amount of 150 times the minimum monthly Brazilian wage per creditor) and labor claims related to indemnification for workplace accidents; (ii) claims of secured creditors (limited to the amount of the guarantee); (iii) tax claims (except for tax fines); (iv) personal claims enjoying special privileges (as defined in other statutes); (v) personal claims enjoying general privileges (among others, unsecured creditors who have provided goods or services to the debtor during its judicial recovery and creditors who are so defined in other statutes); (vi) unsecured debts (creditors not provided for in the preceding items, labor creditors whose claims exceed the 150-minimum monthly wages limitation, and creditors whose claims exceed the amount of their respective guarantees); (vii) contractual fines and monetary fines arising from the disobedience of statutes; and (viii) subordinated debts (as provided for by law or in an agreement, and creditors who are partners or managers of the debtor company but not in the context of a labor relationship). The New Bankruptcy Law establishes that only a creditor claiming for an amount in excess of 40 times the minimum monthly Brazilian wage can commence liquidation proceedings. However, it is permitted for creditors to commence a class action in order to comply with the minimum amount mentioned above. The New Bankruptcy Law also extended (i) the time period in which a debtor must present its defense in connection with a request for its bankruptcy from 24 hours to ten days, and (ii) the suspension period during which no assets may be sold or liquidated from 60 to 90 days (from either the date of filing the bankruptcy petition, the request for judicial recovery or from the date of the first protest of a note due to its non-payment by the company).
C. Organizational Structure
We operate generation, transmission and distribution activities in Brazil through the following twelve regional subsidiaries:
| • | Itaipu, a plant in which we and a Paraguayan governmental entity (ANDE) each hold a 50.0% interest and which we believe is one of the world’s largest hydroelectric plants by volume of energy generated; |
| • | Eletrobras Furnas, which engages in generation and transmission activities in the southeast and part of the midwest regions of Brazil; |
| • | Eletrobras Chesf, which engages in generation and transmission in the northeast region of Brazil; |
| • | Eletrobras Eletronorte, which engages in generation, transmission and limited distribution activities in the north and part of the midwest regions of Brazil; |
- 67 -
Table of Contents
| • | Eletrobras Eletronuclear, which owns and operates two nuclear plants, Angra I and Angra II, and is planning to construct a third, Angra III; |
| • | Eletrobras Amazonas Energia, which engages in generation, transmission and distribution in the State of Amazonas. Eletrobras Amazonas Energia operates in the interior of the State of Amazonas, an area that, until March, 2008, was operated by Ceam, which was previously directly held by Eletrobras but no longer exists as a standalone operating company; |
| • | Eletrobras Eletrosul, which engages in transmission activities in the State of Santa Catarina, Rio Grande do Sul, Mato Grosso do Sul and Paraná; |
| • | Eletrobras Distribuição Piauí, which engages in distribution activities in the State of Piauí; |
| • | Eletrobras Distribuição Alagoas, which engages in distribution activities in the State of Alagoas; |
| • | Eletrobras Distribuição Rondônia, which engages in distribution activities in the State of Rondônia; |
| • | Eletrobras Distribuição Roraima, which engages in distribution activities in the State of Roraima; |
| • | Eletrobras CGTEE, which owns and operates thermal plants in the south region of Brazil; and |
| • | Eletrobras Distribuição Acre, which engages in distribution activities in the state of Acre. |
We are also the main sponsor ofCepel, the largest technological research and development center in the electricity industry in Latin America.
We also hold a majority interest in Eletrobras Eletropar, a holding company that holds minority interests in the following five Brazilian distribution companies: (i) AES Eletropaulo Metropolitana de Eletricidade de São Paulo S.A – AES Eletropaulo; (ii) Energias do Brasil S.A. – Energias do Brasil; (iii) Companhia de Transmissão de Energia Elétrica Paulista – CTEEP; (iv) Empresa Metropolitana de Águas e Energia S.A. – EMAE; and (v) Companhia Piratininga de Força e Luz – CPFL.
- 68 -
Table of Contents
The following organizational chart shows our summarized shareholder structure and subsidiaries as of the date of this annual report (we also have minority shareholdings in 26 utility companies throughout Brazil, not indicated in this chart):
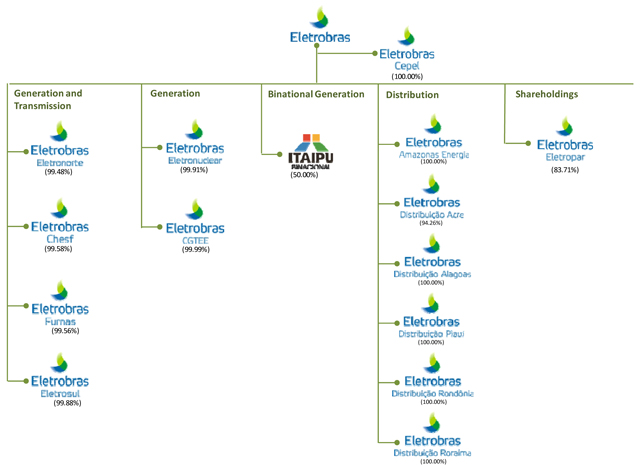
On February 22, 2008, the Board of Directors of our subsidiary Eletrobras Eletrosul resolved to purchase 69,352,857 shares, or 51% of the total shares, of Empresa de Transmissão de Energia de Santa Catarina S.A. – SC Energia and 72,537 shares, or 51% of the total shares, of Empresa de Transmissão de Energia do Rio Grande do Sul S.A. – RS Energia, each of which focuses on the transmission of electricity. The acquisitions were approved by ANEEL in Authoritative Resolution No. 1,665 on November 18, 2008, and the acquisition was completed on February 11, 2009. This acquisition improved our transmission capacity in the southern region of Brazil by providing us with an additional 620 km of transmission lines (360 km from Energia de Santa Catarina S.A. – SC Energia, and 260km from Empresa de Transmissão de Energia do Rio Grande do Sul S.A. – RS Energia).
On January 31, 2011, the Board of Directors of our subsidiary Eletrobras Eletrosul approved the purchase of 71,264,300 shares, or 51% of the total shares, in Artemis Transmissora de Energia S.A. and 5,100,000 shares, or 26% of the total shares, in Uirapuru Transmissora de Energia S.A., each of which focuses on the transmission of electricity. The acquisitions were approved by ANEEL in Authoritative Resolution No. 2.840 on March 29, 2011. The incorporation of Artemis Transmissora de Energia S.A. was approved by the shareholders of our subsidiary Eletrobras Eletrosul on January 11, 2013.
On October 2, 2013, Eletrobras acquired from Administración Nacional de Usinas Y Transmisiones Eléctricas – UTE a 50% equity interest in Rouar S.A., a company based in Montevideu, Uruguay and engaged in the generation of electricity by means of wind power.
On December 30, 2013, Eletrobras Eletronorte approved the merger of its wholly owned subsidiary Rio Branco Transmissora de Energia S.A. into Eletronorte.
- 69 -
Table of Contents
D. Property, Plant and Equipment
Our principal properties consist of hydroelectric generation plants and transmission networks which are located all over Brazil. The book value of our total property, plant and equipment as of December 31, 2013, December 31, 2012 and December 31, 2011 was R$30,039 million, R$29,494 million and R$41,552 million, respectively. As a result of the existing large hydroelectric power capacity still available in Brazil, we believe hydroelectric energy will continue to have a prominent role in providing for the growth in consumption of electrical energy.
ITEM 4A. UNRESOLVED STAFF COMMENTS
Not applicable.
ITEM 5. OPERATING AND FINANCIAL REVIEW AND PROSPECTS
The following discussion should be read in conjunction with our audited Consolidated Financial Statements included elsewhere in this annual report.
Overview
Directly and through our subsidiaries, we are involved in the generation, transmission and distribution of electricity in Brazil. Our revenues derive mainly from:
| • | the generation of electricity through our subsidiaries and its sale to electricity distribution companies and free consumers, which in 2013, 2012 and 2011 accounted for R$16,688 million, or 65.5%, R$19,185 million, or 62.6% and R$19,093 million or 65.2% of our total net revenues, respectively. In 2013, of R$16,688 million in revenue, R$ 2,055 million was from operation and maintenance and R$14,633 was from exploration; |
| • | the transmission of electricity, which in 2013, 2012 and 2011 accounted for R$4,203 million, or 16.5%, R$6,741 million, or 22.0 % and R$7,778 million, or 28.3% of our total net revenues, respectively. In 2013, of R$4,203 million in revenue, R$ 2,854 million was from the operation and maintenance and R$1,349 was from exploration; and |
| • | the distribution of electricity to end consumers, which in 2013, 2012 and 2011 accounted for R$4,499 million, or 17.7%, R$4,676 million, or 15.2% and R$2,468 million, or 18.4% of our total net revenues, respectively. |
The primary drivers of our financial performance are demand for electricity (which in turn is impacted by macroeconomic conditions and external events such as electricity rationing, which occurred in 2001 and 2002) and the pricing of electricity (which is determined as set out in “Item 4.B, The Brazilian Power Industry”). Although levels of electricity consumption now exceed those that existed before the energy crisis that occurred in 2001 and 2002, that energy crisis continues to impact our recognition of revenues and, accordingly, our results of operations.
The Effects of Law No. 12,783
In 2012, the Brazilian Congress enacted MP No. 579/2012, which was converted into Law No. 12,783, which materially changed the Brazilian electricity sector. The law allowed current holders of concessions to operate electricity generation and transmission assets, which were due to expire during the years 2015 through 2017, to renew those concessions for an additional maximum period of 30 years effective January 1, 2013, but at significantly lower tariff levels. As an option under the law, Eletrobras and other concessionaires could have entered into a potentially competitive bidding process to renew their generation and transmission concessions. Law No. 12,783 also affected distribution concessions by lowering the tariffs but has not yet affected renewal of distribution concessions. Eletrobras has expressed its interest in renewing its distribution concessions at the lower tariff rates but regulations have not been promulgated yet. In 2013, there was a change of regime in the revenue framework with respect to renewed generation and transmission concessions requiring the exploration method and the operating and maintenance methods to be separately disclosed pursuant to Law 12,783/2013. For these reasons, as of 2013 companies that renewed generation and transmission concessions pursuant to Law No. 12,783 have received lower tariff payments in relation to these assets than the payments made before the enactment of Law No. 12,783. For renewal generation concessions there is a new business model, whether the tarrif cover just a standard operating and maintainance cost plus a margin of 10%, rather than the non renewal generation concession which the company could sell the generated energy.
Under Law No. 12,783, the Federal Government agreed to indemnify Eletrobras and other electricity concessionaires for part of the value of non-amortized investments Eletrobras and other concessionaires made during the term of their concessions. Some of these indemnity payments have been agreed and paid, while others have been estimated for purposes of the 2012 consolidated financial statements based on information available to Eletrobras. While some indemnities will be paid to concessionaires in installments over many years, the full amount of the agreed or estimated indemnity payments
- 70 -
Table of Contents
are accounted for in the 2012 consolidated financial statements. Accordingly, Eletrobras recorded a significant charge of R$10.09 billion in its 2012 consolidated financial statements, based on the impacts of the renewal of its concessions in accordance with Law No. 12,783. While this charge was nonrecurring, in the future Eletrobras expects that its revenues from concessions that have been renewed under the new law will be significantly lower, and the Company may incur in net losses in the 2014 fiscal year and in subsequent periods.
The shareholders of Eletrobras approved the renewal of concessions under the new law despite the nonrecurring R$10.09 billion charge and the significant expected negative impact on revenues from the relevant concessions in subsequent periods.
Onerous Contracts
Eletrobras was party to a number of contracts for the sale of electricity in connection with concessions that were scheduled to expire in the years 2015 through 2017. With the implementation of Law No. 12,783, many of these contracts have become “onerous” to Eletrobras, as they were based on old tariff levels. At the prior tariff levels, these contracts were expected to be profitable, but based on the new reduced tariff levels, the contracts will result in further losses for Eletrobras.
In 2013, we recognized reversals of provisions for onerous contract losses. Please refer to note 35 of our consolidated financial statements for a further discussion regarding the reversal of these provisions.
Principal Factors Affecting our Financial Performance
Brazilian Macroeconomic Conditions
We are affected by conditions in the Brazilian economy. The macroeconomic scenario in Brazil has been characterized by increased economic activity and a consistent trajectory of the inflation indices. The exchange rate, however, has been volatile.
Except for 2009, which was significantly affected by the global financial crisis, Brazilian GDP has increased over the past several years. In 2007, Brazilian GDP grew 5.4% according to theInstituto Brasileiro de Geografia e Estatística (IBGE), as compared to 3.7% in 2006. In 2007, the inflation rate, as measured by the Brazilian Extended Consumer Price Index (Índice Nacional de Preços ao Consumidor Amplo), or IPCA, was 4.5%, which allowed for a reduction of the Selic rate to 11.25%.
The year 2008 was characterized by the negative effects of the global financial crisis. The main impact of this crisis on the Brazilian economy was reduced expectations for economic activity in 2009 and 2010. Reduced expectations for the year of 2009 triggered an increase in capital costs to third parties, a devaluation of thereal, a decrease of prices in the stock market, and a reduction of industrial production.
Nevertheless, the crisis did not significantly affect the growth rate of the Brazilian economy, with GDP increasing 5.1% in 2008. Inflation, as measured by IPCA, was 5.9% for the year ended on December 31, 2008, which was within the target established by the Central Bank. The inflation rate remained within this range primarily as a result of the Central Bank increasing the base interest rate in 2008 from 11.25% to 13.75%.
In 2009, the Brazilian economy showed certain resistance to the effects of the crisis. Even so, the Brazilian economy ended the year at a level of economic growth close to zero, influenced by the weak performance of the industrial sector. Additionally, macroeconomic conditions and a stable economy allowed the Central Bank to again focus on reducing interest rates. The Selic rate reached 8.7%, its lowest level, in July 2009. Similarly, thereal appreciated 34.2% against the U.S. dollar throughout 2009. According to the Central Bank, international reserves were above U.S.$200.0 billion (U.S.$239.1 billion as of December 31, 2009), demonstrating a significant increase as compared to 2008.
Following a 0.2% decrease in GDP in 2009, the Brazilian economy improved in 2010 with a growth of approximately 7.5%. This economic recovery was due in part to a strong domestic market expansion. Income transfer policies, a continuous increase in the minimum wage and growth in employment levels and credit also contributed to this recovery. Household consumption was estimated to have increased by 7.9% which, together with long-term investment, were the main factors for strong aggregate demand performance in 2010. Gross fixed capital grew 25.59% in 2010, reaching an investment rate of 18.4%.
In 2011, GDP increased 3.3% due to continued growth in domestic demand. This reduction in the rate of growth, compared to 2010, can be explained by the reduction of global growth.
- 71 -
Table of Contents
In 2012, GDP increased 0.9% despite the global financial crisis. The official inflation rate, measured by IPCA, reached 5.84%, which was basically influenced by internal factors. Internally, the prices of food and beverage put pressure on the inflation index.
In 2013, GDP increased 2.3% despite the pressure on developing countries. The official inflation rate reached a high of 5.9%, which was basically influenced by internal factors such as the prices of food, fuel and transport.
As for monetary policy, in response to increasing inflationary pressure in 2013, the Central Bank steadily increased the SELIC rate as of April 2012 increasing the SELIC rate by 37.93% throughout the year from 7.25% as of January 1, 2013 to 10.00% as of December 31, 2013.
Pursuant to Brazilian Central Bank information (Relatório de Inflação, December 2012), with regard to the Brazilian trade balance (net) in 2012, Brazil posted a surplus of U.S.$19.4 billion, with exports totaling U.S.$242.6 billion (5.3% lower than in 2011), mainly due to the moderate pace of economic activity worldwide and with the decreases in commodity prices relevant to the agenda of the country, such as iron ore. Imports amounted to U.S.$223.1 billion in 2012 compared to U.S.$226.2 billion in 2011, an decrease of 1.4%. This decrease resulted from a 0.4% increase in prices and decrease of 1.3% in volume of imports. The highlights in terms of prices were the increases in the categories of durable consumer goods (5.8%) and fuels and lubricants (3.3%), partially offset by a 1.1% reduction in raw materials and intermediate products. The decrease in volume of imports reflected, in particular, decreases in the quantities of consumer durables imported (17.9%) and fuels and lubricants (4.8%), contrasting with the 9.6% expansion in the volume of goods consumer non-durables.
The balance of payments reached a surplus of U.S.$58.6 billion in 2011 and a surplus of U.S.$18.9 billion in 2012. The current account presented a deficit of U.S.$52.5 billion in 2011 and a deficit U.S.$54.2 billion in 2012 (which equates to 2.1% and 2.4% of GDP, respectively), compared to the deficit of U.S.$47.4 billion, or 2.2% of GDP, recorded in 2010. Net inflows of foreign direct investment reached a record value of U.S.$68.0 billion in 2012, an increase of 0.6% compared to the previous year’s outcome of U.S.$67.7 billion in 2011. Foreign portfolio investment showed net inflows of U.S.$8.2 billion in 2012, 76.6% lower than in 2011.
The exchange rate in 2013 experienced low volatility, especially when compared to the period during the international financial crisis period. Thereby, the influx of capital has exerted a lower pressure on the exchange rate. As a result, the real/U.S. dollar exchange rate increased in 2013 from R$2.0435 to R$2.3426/1.00.
The Central Bank’s policies with respect to both the spot and futures markets have caused international reserves to decreased 0.75%, totaling U.S.$376.0 billion in December 2013.
The following table shows data relating to Brazilian GDP growth, inflation and thereal/U.S. dollar exchange rate for the periods indicated:
| Year Ended December 31, | ||||||||||||
| 2013 | 2012 | 2011 | ||||||||||
GDP growth rate | 2.3 | % | 0.9 | % | 2.7 | % | ||||||
Inflation (IGP-M) | 5.51 | % | 7.82 | % | 5.1 | % | ||||||
Inflation (IPCA) | 5.91 | % | 5.84 | % | 6.5 | % | ||||||
Appreciation (depreciation) of thereal vs. the U.S. dollar | 14.64 | % | 8.94 | % | 12.6 | % | ||||||
Period-end exchange rate – U.S.$1.00 | 2.3426 | R$ | 2.0435 | R$ | 1.8758 | |||||||
Average exchange rate – U.S.$1.00 | 2.1605 | R$ | 1.9544 | R$ | 1.6746 | |||||||
Sources: Fundação Getúlio Vargas, Ipeadata Instituto Brasileiro de Geografia e Estatística and the Central Bank.
Electric Power Market
Electricity consumption in Brazil registered an increase of 3.5% in 2013, higher than the GDP growth rate for the same period of 2.3%. All consumer classes showed growth in electricity consumption, particularly residential and commercial consumers, which increased by 6.1% and 5.7%, respectively.
After the economic downturn in 2009, 2010 showed a strong recovery in industrial production, which positively impacted industrial consumption of electricity. In 2013, industrial consumption increased due to higher consumption in the Northeast and Southeast regions. The Mid-west region of Brazil showed the largest growth in industrial consumption, with growth rates of 11.6%.
- 72 -
Table of Contents
The electric power consumption in Brazil by geographic region is presented below:
Energy Consumption in the Network (GWh):
Consumption Class | 2013 | 2012 | Variation | |||||||||||||||||||||||||
Region | Residential | Industrial | Commercial | Others | Total | Total | % | |||||||||||||||||||||
North | 7,422 | 14,153 | 4,411 | 4,166 | 30,152 | 28,876 | 4,4 | |||||||||||||||||||||
Northeast | 23,856 | 28,736 | 12,633 | 14,601 | 79,827 | 75,28 | 6,0 | |||||||||||||||||||||
Southeast | 63,947 | 100,183 | 45,656 | 30,273 | 240,058 | 235,3 | 2,0 | |||||||||||||||||||||
South | 19,672 | 32,339 | 14,164 | 14,670 | 80,845 | 78,085 | 3,5 | |||||||||||||||||||||
Mid-West | 9,961 | 9,184 | 6,848 | 6,865 | 32,858 | 30,735 | 6,9 | |||||||||||||||||||||
Consumption Class | 2012 | 2011 | Variation | |||||||||||||||||||||||||
Region | Residential | Industrial | Commercial | Others | Total | Total | % | |||||||||||||||||||||
North | 6,762 | 14,114 | 4,141 | 3,858 | 28,876 | 27,777 | 3.95 | |||||||||||||||||||||
Northeast | 21,294 | 28,796 | 11,598 | 13,592 | 75,280 | 71,914 | 4.68 | |||||||||||||||||||||
Southeast | 61,593 | 100,771 | 43,364 | 29,572 | 235,300 | 230,668 | 2.01 | |||||||||||||||||||||
South | 18,692 | 31,297 | 13,747 | 14,349 | 78,085 | 74,470 | 4.86 | |||||||||||||||||||||
Mid-West | 9,224 | 8,493 | 6,436 | 6,582 | 30,735 | 28,205 | 8.97 | |||||||||||||||||||||
Source: Permanent Committee of Analysis and Monitoring of Electric Power Market – Copam/EPE.
Itaipu
Itaipu, one of the world’s largest hydroelectric plants, is jointly owned by Brazil and Paraguay and was established and is operated pursuant to a treaty between those countries.
Pursuant to the Itaipu treaty, we are required to sell not only the 50.0% of electricity produced by Itaipu that, through us, Brazil owns, but also that part of Paraguay’s share of electricity not used by Paraguay. As a result we sell approximately 95.0% of the electricity produced by Itaipu. Articles 7 and 8 of Law No. 5,899 of July 5, 1973 set out the framework which distribution companies use to calculate the total amount of energy purchased from Itaipu.
While Itaipu produces a large amount of electricity, the Itaipu treaty requires that sales of Itaipu electricity be made on a no-profit basis, with no net effect on our results of operations.
In order to effect the “no profit” requirement, profits from the sale of Itaipu electricity are credited in subsequent periods to residential and rural consumers of electricity through the Interconnected Power System through their electricity bills (thus reducing our revenues from electricity sales) and losses are taken into account by ANEEL in calculating tariffs for electricity in subsequent periods.
Pursuant to Law No. 11,480/2007, we were able to apply an “adjustment factor” to any financial contracts entered into between us and Itaipu and any credit assignments entered into between us and the Brazilian Federal Treasury prior to December 31, 2007. The aim of this “adjustment factor” was to offset the impact of the rate of inflation in the United States on the U.S. dollar payments. Accordingly, this “adjustment factor” measures the rate of inflation by reference to the consumer price index (CPI) and another index which tracks changes in industry prices. This law was repealed and Decree No. 6,265 of November 22, 2007 came into force which determines that a rate equivalent to the previous “adjustment factor” is to be passed on to distribution companies on an annual basis.
Beginning in 2010, we began to account for Itaipu as a financial asset on our balance sheet and record its income under other operating revenues. Since January 1, 2013, we no longer consolidate the results of Itaipuon a line by line basis. For a further discussion of these changes in accounting treatment of Itaipu, see notes 3.11, subsections II and IV of our consolidated financial statements.
Exchange Rate Variations
Fluctuations in the value of thereal against the U.S. dollar, particularly devaluations and/or depreciations of thereal, have had and will continue to have an effect on the results of our operations. In particular, pursuant to the Itaipu treaty, all revenues from Itaipu are denominated in U.S. dollars. Because the financial statements of Itaipu Binacional are prepared in U.S. dollars and translated toreais at the exchange rate published by the Central Bank at the period end, any movement in the exchange rate between thereal and the U.S. dollar can have a major impact on our results, in particular the “Foreign exchange and monetary gain” component of the line item “Financial income (expense), net.”
- 73 -
Table of Contents
However, because pursuant to the Itaipu treaty the operation of Itaipu is not permitted to have any net effect on our operating results, any loss or gain incurred as a result of any appreciation or depreciation of the U.S. dollar against thereal, among other things, will subsequently be compensated for by the tariffs we charge to our residential and rural consumers. In our income statement, the effects of Itaipu on the line items described above are netted out and recorded in the line item “Deferred loss from Itaipu.” Until that compensation takes place, the accumulated results of profits or losses from Itaipu operations, net of compensation through tariff adjustments, is carried on our balance sheet as a current asset under “Reimbursement rights.”
Eletrobras Eletronorte
For many years our subsidiary Eletrobras Eletronorte was used as a vehicle for the development of Brazil’s northern region, functioning in some ways as a development agency. In particular, it has supplied electricity pursuant to supply contracts at prices which did not cover its costs. We began to re-negotiate these supply contracts, which are mainly with companies in the aluminium smelting industry, in 2004 with the aim of revising the tariffs to cover Eletrobras Eletronorte’s operating costs and gradually pay off its debts. Eletrobras Eletronorte entered into a contract on May 11, 2004 to sell electricity to ALBRAS to provide electrical energy for ALBRAS’ industrial operations, priced on the basis of the international aluminium price. This contract came into effect on June 1, 2004. ALBRAS may terminate the contract with two years’ notice if they elect to discontinue production or start using their own resources for power generation. ALBRAS is not required to pay any amounts related to termination. The total term of this contract is 20 years and the contract includes an energy prepayment of R$876 million. See note 21 of our consolidated financial statements.
One of the main sources of income of Eletrobras Eletronorte derives from the hydroelectric plant of Samuel, whose initial concession expired in September 2009. On July 18, 2006, Eletrobras Eletronorte requested from ANEEL an extension of such concession, which was granted on March 11, 2010 for an additional 20 years.
For 2013 the net gains attributable to Eletrobras Eletronorte amounted to R$1,221 million, compared to losses of R$738,6 million in 2012 and gains of R$58.3 million in 2011.
Regulated Distribution Tariffs
For 2013, 18.9% of our net revenues were derived from the distribution of electricity. The distribution companies generally produce losses, which are likely to continue as the tariffs that may be charged by distribution companies are regulated and adjusted by ANEEL only in accordance with the process set out in “Item 4.B Business Overview – The Brazilian Power Industry – Distribution Tariffs.”
Fixed Transmission Revenues
Unlike revenues from our distribution and generation segments, revenues from our transmission segment are fixed by the Brazilian Government. This applies to all electricity companies with transmission operations in Brazil. As a result of the fact that the transmission revenue fee is fixed, revenues from our transmission segment do not increase or decrease based on the amount of electricity we transmit. The Brazilian Government sets a fixed transmission revenue fee each year that end consumers must pay and this is passed on to us and recorded as revenues from our transmission segment. Thus, our net income may be affected by the fact that our costs in this sector cannot easily be passed on to our customers.
Critical Accounting Policies
In preparing our consolidated financial statements included in this annual report, we made estimates and assumptions that we consider reasonable based on our historical experience and other factors. The presentation of our financial condition and results of operations requires that our management make estimates about inherently uncertain matters, such as the book value of our assets, our liabilities and, consequently, our results of operations. Our financial presentation would be materially affected if we were to use different estimates or if we were to change our estimates in response to future events. To provide an understanding of how our management forms its judgments about future events, including the factors and assumptions underlying those estimates, we have identified the following critical accounting policies.
Deferred tax assets and liabilities
The estimates of taxable income, the basis for the analysis of realization of net deferred tax assets are based on annual budgets and strategic plan, both reviewed periodically. However, future taxable income may be higher or lower than estimates made by management when the need to register or not the deferred tax asset amount was defined.
Provision for impairment of long-lived assets
Eletrobras adopts variables and assumptions in determining the recovery of long-lived assets in order to determine the recoverable value of assets and recognition of impairment when necessary. Management established judgments based on
- 74 -
Table of Contents
historical experience related to the asset, the group of assets or of the cash-generating unit that are applied. These judgments may not materialize in the future. Also, the useful life adopted by the Company is in accordance with the practices determined by ANEEL as applicable on assets linked to the concession of power, which may vary due to the periodic review of the economic useful life of assets, in force. Additionally, the useful life is limited to the concession term only for the operations based on IFRIC 12.
Also the variables and assumptions used by Eletrobras and its subsidiaries in determining discounted cash flows for recognition of impairment of long-lived assets may vary due to inherently uncertain events. These events include: maintenance of levels of energy consumption; growth rate of economic activity in the country; availability of water resources; and determination of the value of reversion at the end of the concession period. Law 12,783/2013, enacted on January 11, 2013, defined the new replacement value (VNR) as the identification basis for public service concessions. We have determined that the identification basis will be based on the VNR, for generation and transmission assets, and by the base value of regulatory compensation (BRR) for distribution assets. These are the bases used to determine the indemnity at the end of concession period for generation, transmission and distribution of electricity. For further information, please see Note 3.11 and changes in provisions made during the year in Note 19 to the Financial Statements. Another significant variable is the discount rate used to discount cash flows.
Basis of determination of indemnification by the Federal Government on concessions
Law 12,783/2013, enacted on January 11, 2013, defined the new replacement value (VNR) as the identification basis for public service concessions. Eletrobras adopts, for the concessions not yet renewed, the assumption that the assets are reversible at the end of the concession contracts, with the right to receive indemnity from Federal Government on investments not yet amortized at the lower net book value and the new estimated replacement value. Following this assumption, for the concessions already renewed we have maintained the receivables with the Federal Government relating to theRede Básica do Sistema Existente – RBSE, the investments made after the basic design of power plants and transmission lines (modernization and improvements), and the thermal generation assets. Such values are subject to approval by ANEEL. For further information regarding the effects of Law No. 12,7383, please see Note 2.1 to the Financial Statements.
Eletrobras has defined the new replacement value (NRV) as a way of measuring the amount to be indemnified by the Federal Government for the share of generation and transmission assets not fully depreciated by the end of the concession. For transmission assets this was defined by the Regulatory Asset Base - RAB.
Useful life of fixed assets
Eletrobras adopts the criteria defined in ANEEL Resolution 367 of June 2, 2009, in determining the estimated useful life of fixed assets, limited to the concession term for the operations that are based on IFRIC 12, pursuant to the understanding that they fairly represent such lifespan.
Provision for asset decommission
Eletrobras recognizes provisions for decommissioning liabilities for the assets related to their thermonuclear power plants. In order to calculate the amount of the provision, assumptions and estimates are made regarding the discount rates, the expected decommissioning cost and removal of the entire power plant from the location and the expected period of the referred costs. The cost estimate is based on legal and environmental requirements for decommission and removal of the entire plant, as well as the prices of goods and services to be used at the end of the useful life.
Actuarial liabilities
Actuarial liabilities are determined by actuarial calculations prepared by independent accountants based on the life expectancy of the participant (board AT-2000), average retirement age and inflation. However, the actual future results of the accounting estimates used in this financial information may be different from those existing and registered in the accounting book.
Provision for labor, tax and civil risks
Provisions for labor, tax and civil risks, when applicable, are made for contingent tax, labor and civil risks expected as probable loss based, on the evaluation of management and legal counsel inside and outside Eletrobras. The accrued amounts are recorded based on the estimated cost of the outcomes of the referred contingencies. Contingent risks with the expectation of possible loss are disclosed by the management, not being constituted a provision. This assessment is supported by the judgment of management, along with its legal counsel, considering case law, decisions in the courts, the history of any agreements and decisions, the experience of management and legal counsel, as well as other relevant aspects.
- 75 -
Table of Contents
Allowance for doubtful accounts
Eletrobras records provisions on receivable accounts that the administration understands to be uncertain over their receipt.
Evaluation of financial instruments
Eletrobras uses valuation techniques that include information that are not based on observable market data to estimate the fair value of certain types of financial instruments. Note 44 presents information on key assumptions used in determining the fair value of financial instruments, as well as the sensitivity analysis of these assumptions. We believe that the selected valuation techniques and assumptions used are appropriate for determining the fair value of financial instruments.
Onerous contracts
We use the assumptions related to economic costs and benefits of each contract to determine the existence or not of an onerous contract. In the case of long term commitments as sale and purchase of energy, the estimate in determining the amount of provision for the future sale of the contract is the historical average PLD approved by Eletrobras’ management as a basis for the calculation of the provision for onerous contracts exclusively for accounting, as well as the discount rate applied to the cash flows. The actual values of the PLD over the years may be higher or lower to the assumptions used by Eletrobras. In addition, Eletrobras may have onerous contracts on concessions where the current expected cost for operation and maintenance is not fully covered by the revenues.
Description of Principal Line Items
Operating Revenues
Electrical Energy Sales
We derive our revenues from the generation, transmission and distribution of electricity, as set out below:
| • | revenues in our generation segment derive from the commercialization and sale to distribution companies and free consumers of electricity that we have generated (including the electricity generated by our share of the Itaipu project) and the resale of electricity from Paraguay’s share of the Itaipu project not used in Paraguay. Revenues from our electricity generation segment are recorded based on the output delivered at rates specified under contract terms or prevailing regulatory rates. For generation concessions renewed pursuant to Law 12,783/2013, there was a change of regime in the revenue framework, whereas the exploration method and the operating and maintenance methods are required by the law to be separately disclosed beginning in 2013; |
| • | revenues from our transmission segment derive from the construction, operation and maintenance of transmission networks for other electricity concessionaires and certain revenues arising from applying inflation and other indexes to the value of our investments. Revenues received from other concessionaires using our basic transmission network are recognized in the month that the services are provided to the other concessionaires. These revenues are fixed each year by the Brazilian Government. These revenues also include as financial revenue the value calculated over receivables registered as financial assets (formerly recorded as “Property, Plant and Equipment”), based on fees calculated from the receipt of annual permitted revenues (Receita Anual Permitida), or RAP (which is based on gross RAP minus the amount allocated for operations and maintenance revenue) until the concession agreements for energy transmission services terminate. For transmission concessions renewed pursuant to Law 12,783/2013, there was a change of regime in the revenue framework, whereas the exploration method and the operating and maintenance methods are required by the law to be separately disclosed beginning in 2013; and |
| • | revenues in our distribution segment derive from the sale to end consumers of electricity that we purchase from generation companies and also some electricity that we generate in thermal plants in certain isolated areas in the north region of Brazil for distribution, as well as certain revenues from the construction, operation and maintenance of distribution networks. Electricity distribution sales to final customers are recognized when power is provided. Invoices for these sales are rendered on a monthly basis. Unbilled revenues from the billing cycle up to the end of each month are estimated based on the prior month’s billing and are accrued at the end of the month. Differences between estimated and actual unbilled revenues, if any, are recognized in the following month. |
A very large proportion of our revenues, in any given year, derives from the sale or resale of electricity from Itaipu. However, the Brazil and Paraguay treaty pursuant to which Itaipu operates provides that these activities must have no effect on our net income.
Other Operating Revenues
Other operating revenues derive from charges imposed on end consumers for late payments in respect of electricity sold in our distribution segment and, to a lesser extent on other operating revenues that are not attributable to our distribution, generation or transmission segments, which we record under our “corporate” segment. These mainly include fees for the administration of the RGR Fund and other governmental funds. We also derive other operating revenues from telecommunication companies using certain parts of our infrastructure to install telecommunication lines.
- 76 -
Table of Contents
Taxes on Revenues
Taxes on revenues consist ofImposto sobre a Circulação de Mercadorias e Serviços – ICMS (or VAT), a sales tax charged on gross revenues. We are subject to different VAT rates in the different states in which we operate, with the VAT rates ranging from 7.0% to 27.0%. Pursuant to applicable regulations, we are not liable for any taxes or revenues in our transmission segment.
Additionally, we are subject to two federal taxes imposed on the gross revenues of corporate entities: the Program of Social Integration (Programa de Integração Social) – PIS/PASEP and Contribution for the Financing of Social Security (Contribuição para o Financiamento da Seguridade Social) – COFINS.
Regulatory Charges on Revenues
These deductions from gross revenues comprise payments made to the CCC Account, the RGR Fund, the CDE Account, PROINFA and similar charges levied on electricity sector participants. Regulatory charges are calculated in accordance with formulas established by ANEEL, which differ according to the type of sector charges, and thus there is no direct correlation between revenues and sector charges.
Operating Costs and Expenses
Personnel, Supplies and Services
Our operating costs and expenses related to personnel, supplies and services primarily consist of daily administrative expenses for employees, equipment and infrastructure, as well as expenses related to outsourcing security, maintenance and external consultants and advisors. Due to the diverse nature of these expenses, we apply certain subjective criteria to allocate such expenses to our operational activities. These expenses do not account for raw materials used to generate power.
Electricity Purchased for Resale
Our distribution and generation segments both purchase electricity for resale. Electricity purchased in the distribution segment is purchased from other generators. Electricity purchased in the generation segment represents the Paraguayan portion of the energy from Itaipu that is not used in Paraguay and that we resell to distribution companies and free consumers.
Fuel for Electricity Production
The cost of fuel is a significant component of our operating expenses. These costs, however, are subsequently reimbursed from the CCC Account, pursuant to Law No. 12,111.
Use of the Grid
These costs represent charges for transmission of energy over the power lines of third parties.
Interest Payments and Penalties
These costs represent interest payments in respect of our financing with third parties as well as potential penalties for late payments.
Depreciation and Amortization
This represents depreciation and amortization for our property, plant, equipment and intangible assets. We record property, plant and equipment as construction or acquisition costs, as applicable, less accumulated depreciation calculated based on the straight-line method, at rates that take into consideration the estimated useful lives of the assets. Repair and maintenance costs that extend the useful lives of the related assets are capitalized, while other routine costs are charged to our result of operations. Interest relating to debt obtained from third parties incurred during the construction period is capitalized. Amortization of intangible assets, included in the scope of IFRIC 12, is based on the concession period.
Operating Provisions
This reflects provisions we make in respect of: (i) legal proceedings to which we are party; (ii) allowances for doubtful accounts and impairments; and (iii) onerous contracts.
- 77 -
Table of Contents
Deferred Loss from Itaipu
As discussed above in “ – Principal Factors affecting our Financial Performance – Itaipu,” the net effect of the results of operations of Itaipu is recorded in this line item and the accumulated effects of Itaipu operations, net of compensation through tariff adjustments, is carried on our balance sheet as a current and noncurrent asset under “Financial asset – Itaipu.”
Donations and Contributions
This reflects expenses relating to investments in new information technology and research and development, as well as investments in cultural programs and sponsorships.
Other Operating Costs
Our other operating costs comprise a number of miscellaneous costs that we incur as part of our day-to-day operations. The most significant components are: (i) costs of leasing goods such as generation units for the Isolated System; (ii) costs of operations and maintenance of our facilities that provide for electricity services; (iii) telecommunication costs comprising primarily costs incurred for telephone and internet services; (iv) insurance costs, including insurance for our facilities and property; and (v) costs of disposal of assets, primarily transformers.
Results of Equity Interests
Results arising from the equity adjustment for our interests in other companies.
Financial Income (Expenses), Net
Financial Income
This reflects interest income and commissions we receive from loans we made in accordance with the provisions of Brazilian law that permitted us to act as a lender to certain public utility companies (see “Item 4.B, Business Overview – Lending and Financing Activities” for a description of our outstanding loans to other Brazilian utility companies).
Financial Expenses
This principally reflects payments of dividends to our shareholders, as well as debt and leasing expenses. This also reflects the U.S. dollar/real exchange rate variation relating to Itaipu.
Foreign Exchange and Monetary Gain (Loss)
Foreign exchange gain (losses) mainly relate to Itaipu, as the financial statements of Itaipu Binacional are presented in U.S. dollars, and this represents our largest exposure to foreign currency risk. A devaluation or depreciation of thereal against the U.S. dollar increases our revenues, as it increases the value of the contribution from Itaipu, although the effect of this contribution is netted out, as discussed above. An appreciation of thereal decreases our revenues because it decreases the value of the contribution from Itaipu, although the effect of this contribution is similarly netted out as a depreciation of the cost of construction of Itaipu.
A. Operating Results
Changes to the Presentation of our Operating Results
We restated our consolidated financial statements as of and for the year ended December 31, 2012 as a result of the adoption, on January 1, 2013 (with a corresponding restatement of the opening balance as of January 1, 2012), of IFRS 11. We retroactively applied IFRS 11 to 2012 for comparison purposes pursuant to IAS 8 (Accounting Policies, Changes in Accounting Estimates and Errors). The adoption of this new pronouncement impacted several line items of our consolidated financial statements relating to the method of accounting for the results of joint venture entities, which are now recognized using the equity method of accounting instead of the proportional consolidation method we used prior to our adoption of IFRS 11. See note 3C.1 to our consolidated financial statements for a description of this pronouncement and its impact on our consolidated financial statements. We applied IFRS 11 beginning from January 1, 2012, based on the issued amendments to IFRS 10, IFRS 11 and IFRS 12, revising the transition guidance to provide relief from full retrospective application. As a result of these amendments, we retroactively adjusted our consolidated financial statements for the Immediately Preceding Period. Consequently, data related to the results for the years ended December 2013 and 2012 are being presented and reflect the effects of IFRS 11. Data related to periods prior to 2012 have not been retroactively adjusted and are being presented using the proportional consolidation method for joint-ventures entities, except the balance sheets.
Presentation of Segmentation Information
For the year ended December 31, 2013, we changed our reportable segments to better portray the operations of each segment and to better reflect how we manage our business. Under the new reportable segment structure we will continue
- 78 -
Table of Contents
to segment our core operations in the Brazilian generation, transmission, and distribution markets; however, inter-segment balances have not been eliminated. This is a change from prior years, where we will no longer eliminate segment balances net of inter-segment eliminations. Our financial data as of December 31, 2011 were derived from our audited consolidated financial statements that are not included in this annual report. Because these consolidated financial statements, and the related financial data, were not restated to reflect the change in segment presentation described above, they are not comparable to our consolidated financial statements, and the related financial data, as of and for the years ended December 31, 2013 and 2012 included in this annual report.
Segment reporting is intended to provide a better view of how the Company manages and evaluates its businesses. The accounting policies for each segment are the same as those described in the summary of significant accounting policies.
The following table shows our revenues and operating expenses as a percentage of net operating revenues:
| Year Ended December 31, | ||||||||||||
| 2013 | 2012 | 2011 | ||||||||||
Revenues | ||||||||||||
Electricity sales: | ||||||||||||
Distribution | 22.9 | % | 22.7 | % | 18.4 | % | ||||||
Generation | 72.2 | % | 68.0 | % | 65.2 | % | ||||||
Transmission | 19.0 | % | 26.0 | % | 28.3 | % | ||||||
Other operating revenues | 4.2 | % | 3.4 | % | 4.1 | % | ||||||
Taxes on revenues | (14.6 | )% | (13.9 | )% | (10.2 | )% | ||||||
Regulatory charges on revenues | (3.7 | )% | (6.2 | )% | (5.8 | )% | ||||||
Net operating revenues | 100.0 | % | 100.0 | % | 100.0 | % | ||||||
Expenses | ||||||||||||
Operating expenses | (122.5 | )% | (98.7 | )% | (86.0 | )% | ||||||
Financial expenses, net | 1.1 | % | 6.0 | % | 0.8 | % | ||||||
Gains on results of affiliated companies | 0.7 | % | 2.2 | % | 1.6 | % | ||||||
Income before income tax and social contribution | (20.7 | )% | (26.5 | )% | 16.5 | % | ||||||
Income taxes | (5.7 | )% | 1.8 | % | (3.7 | )% | ||||||
Minority interests | 0.0 | % | 0.0 | % | (0.1 | )% | ||||||
Net income | (26.4 | )% | (24.7 | )% | 12.6 | % | ||||||
Year ended December 31, 2013 compared to year ended December 31, 2012
Consolidated Results
This section is an overview of our consolidated results of operations, net of inter-segment eliminations, which are discussed in greater detail with respect to each segment below.
Net Operating Revenues
Net operating revenues for 2013 decreased R$4,178 million, or 14.9%, to R$23,836 million from R$28,014 million in 2012. This decrease was due to:
| • | a decrease of R$2,778 million, or 37.5%, in our transmission operating revenues from R$7,437 million in 2012 to R$4,659 million in 2013, due to a decrease in tariffs and annual permitted revenues (Receita Anual Permitida) pursuant to Law No. 12,783; |
| • | a decrease of R$3,137 million, or 14.2%, in revenues from our generation operating revenues from R$22,210 million in 2012 to R$19,073 million in 2013, due to (i) a 15.6% decrease in the volume of energy sales from R$21,415 million in 2012 to R$18,077 million in 2013; and (ii) a decrease in tariffs and annual permitted revenues (Receita Anual Permitida) pursuant to Law No. 12,783. This decrease was due to the change in the volume of energy sales from 261 TWh in 2012 to 259 TWh in 2013; and |
| • | a decrease of R$581 million, or 8.8%, in our distribution operating revenues from R$6,585 million in 2012 to R$6,004 million in 2013, due to (i) a 3.9% decrease in the supply of energy from R$4,859 million in 2012 to R$4,991 million in 2013; and (ii) a decrease in tariffs and annual permitted revenues (Receita Anual Permitida) pursuant to Law No. 12,783. Despite an increase in the volume of energy sold from 15.2 TWh in 2012 to 16.1 TWh in 2013, the significant reduction in tariff levels caused the decrease in operating revenue. |
- 79 -
Table of Contents
Operating Costs and Expenses
Operating costs and expenses for 2013 increased by R$1,562 million, or 5.7%, from R$27,642 million in 2012 to R$29,204 million in 2013.
The primary drivers of the increase in operating costs and expenses were:
| • | a R$1,574 million, or 20.5%, increase in personnel costs from R$7,671 million in 2012 to R$9,245 million in 2013, mainly due to (i) the awarding of increased annual bonuses to the employees; and (ii) R$1,400 million payments to certain employees as an inducement for early retirement; |
| • | a R$799 million, or 115.1%, increase in fuel costs for the production of electric energy from R$1,492 million in 2013 compared to R$694 million in 2012. This increase was due to an increase in the production of thermal energy due to our need to supplement hydroelectric generation with thermal generation because of adverse hydrological conditions in 2013. As a result of these adverse hydrological conditions, we unexpectedly needed to operate the Camaçari Plant during 2013, which required us to purchase a significant amount of gas as fuel for the plant; |
| • | a R$652 million, or 13.4% increase in electric energy purchased for resale from R$4,863 million in 2012 to R$5,515 million in 2013. This increase is principally due to an increase in the cost of electricity in the spot market; and |
| • | a R$309 million, or 17.0% increase in other expenses from R$1,814 million in 2012 to R$2,123 million in 2013. This increase was mainly due to a guarantee we paid to a third party in connection with an obligation of Eletrobras Amazonas Energia. |
This increase in these costs and expenses was partially offset by:
| • | a R$1,713 million, or 34.5%, decrease in operating provisions to R$3,258 million in 2013 from R$4,971 million in 2012, principally due to a reduction in costs relating to onerous contracts mainly due to a decrease in the interest rates of those contracts, approval of new tariffs in Furnas and the increase in the price of the spot market related to energy contracts. This decrease in costs was partially offset by an increase in provisions for pending lawsuits related to the repayment of compulsory loans made by certain end-users of electricity as a result of a change in the likelihood of loss under such claims from possible to probable; and |
| • | a R$262 million, or 39.2%, decrease in remuneration and reimbursement to R$406 million in 2013 from R$668 million in 2012, principally due to the decrease in royalties payments, as a result of adverse hydrological conditions which led to a decreased use of our hydroelectric plants. |
Financial Income (Expenses), Net
Financial income (expenses), net resulted in income of R$266 million in 2013 compared to income of R$1,684 million in 2012. This decrease was mainly due to:
| • | a R$1,009 million, or 64.5%, decrease in revenue from financial investments to R$556 million in 2013 from R$1,556 million in 2012, as the decrease in our revenues led us to reduce the number of loans we granted to public utility companies, decreasing the interest income and commissions paid to us; and |
| • | a R$312 million, or 62.2%, decrease in charges on shareholders’ resources to R$190 million in 2013 from R$502 million in 2012, principally due to the payment of the annual dividend that had been previously retained. |
This decrease in net financial income (expenses) was partially offset by:
| • | a R$229 million, or 108.5%, increase in remuneration pursuant to Law No. 12,783 to R$441 million in 2013 from R$211 million in 2012, which increased in line with the rate of inflation; and |
| • | a R$78 million, or 17.0%, increase in exchange rate variation gains to R$539 million in 2013 from R$461 million in 2012, principally due to an increase in revenues denominated in U.S. dollars as a result of the depreciation of the real against the U.S. dollar during 2013 compared to 2012. |
- 80 -
Table of Contents
Equity Investments
Equity investments decreased R$434 million, or 71%, from R$612 million in 2012 to R$177 million in 2013 reflecting adjustments we made to the results of certain affiliated companies as a result of Law No. 12,783.
Income Taxes and Social Contribution
Income taxes and social contribution decreased by R$1,857 million from a credit of R$490 million in 2012 to an expense of R$1,367 million in 2013. The decrease was primarily due to a write off of deferred tax credits that we do not expect to be able to utilize due to the reduction in our revenues.
Net Loss
As a result of the factors discussed above, our net loss for 2013 decreased by R$634 million, or 9.2%, to a loss of R$6,291 million in 2013 from a loss of R$6,925 million in 2012.
Results of Generation Segment
Net Operating Revenues
Net operating revenues for the generation segment decreased R$2,498 million, or 13.0%, to R$16,688 million in 2013 from R$19,185 million in 2012 due to the factors set forth below.
Electricity Sales
Electricity sales decreased R$5,385 million, or 30.9%, to R$12,036 million in 2013 from R$17,422 million in 2012. This decrease was due to a decrease in tariffs pursuant to Law No. 12,783. The volume of energy sold decreased from 261 TWh in 2012 to 259 TWh in 2013.
Operation and Maintenance
Revenues derived from operation and maintenance of renewed assets pursuant to Law 12,783/2013 totaled R$2,198 million in 2013.
Other Operating Revenues
Other operating revenues decreased R$251 million, or 49.2%, to R$260 million in 2013 from R$512 million in 2012. The decrease is principally due to a decrease in income received from CCC and CDE charged to the final consumers. Pursuant to Law No. 12,783, CCC fees were extinguished and CDE fees were reduced by 50%. This applied to the results of Eletrobras Eletronorte which operates in the generation segment, but also sells a certain amount of energy directly to final consumers.
Taxes on Revenues
Taxes on revenues decreased R$354 million, or 17.1%, to R$1,720 million in 2013 from R$2,075 million in 2012 as a result of decreased revenues. For a description of the calculation of taxes on revenues please see “—Description of Principal Line Items—Operating Revenues—Taxes on Revenues.”
Regulatory Charges on Revenues
Regulatory charges on revenues decreased R$285 million, or 30%, to R$665 million in 2013 from R$950 million in 2012 due to decreased revenues and to the extinction of RGR and of CCC in most of the companie’s subsidiaries.
Operating Costs and Expenses
Operating costs and expenses for the generation segment decreased R$4,420 million, or 24.7%, to R$13,448 million in 2013 from R$17,868 million in 2012. The primary components of this decrease were:
| • | a R$5,170 million decrease in operating provisions to income of R$1,469 million in 2013 from an expense of R$3,700 million in 2012. This increase was due to the reversal of an onerous contract provision made in connection with our Jirau plant. |
- 81 -
Table of Contents
| • | a R$280 million, or 5.8%, decrease in energy acquired for resale to R$4,555 million in 2013 from R$4,836 million in 2012. This decrease was mainly due to increased efficiency in our operations; and |
| • | a R$271 million, or 40.5%, decrease in remuneration and reimbursements to R$397 million in 2013 from R$668 million in 2012. This decrease was mainly due to a decrease in the volume of power generated and a decrease in the amount paid to the states and municipalities where our plants’ reservoirs are located, due to the increased use of our thermal plants as a result of adverse hydrological conditions; |
This decrease was partially offset by:
| • | a R$683 million, or 23.5%, increase in payroll and related charges to R$3,593 million in 2013 from R$2,911 million in 2012. This increase is due to an increase in average salaries in line with the inflation rate, payments to certain employees as an inducement for early retirement and the awarding of increased annual bonuses to the employees; and |
| • | a R$784 million, or 113.0%, increase in expenses for fuel for energy generation to R$1,477 million in 2013 from R$694 million in 2012. This increase was mainly due to an increase in the production of thermal energy due to our need to supplement hydroelectric generation with thermal generation because of adverse hydrological conditions in 2013. As a result of these adverse hydrological conditions, we unexpectedly needed to operate the Camaçari Plant during 2013, which required us to purchase a significant amount of gas as fuel for the plant. |
Results of Transmission Segment
Net Operating Revenues
Net operating revenues for the transmission segment decreased R$2,538 million, or 37.6%, to R$4,203 million in 2013 from R$6,741 million in 2012 primarily due to a decrease in tariffs and annual permitted revenues (Receita Anual Permitida) pursuant to Law No. 12,783 as well as the other factors set forth below.
Operation and Maintenance
Operation and maintenance of revenue decreased R$377 million, or 14.7%, to R$2,167million in 2013 from R$2,545 million in 2012 primarily as a result of the effects of Law No. 12,783.
Regulatory Charges on Revenues
Regulatory charges on revenues decreased R$300 million, or 67.0%, to R$147 million in 2013 from R$446 million in 2012 primarily as a result of decreased revenues. For a description of the calculation of taxes on revenues please see “—Description of Principal Line Items—Operating Revenues—Regulatory Charges on Revenues”.
Updates from the internal rate of return
Updates from the internal rate of return decreased R$2,300 million, or 80.6%, to R$552 million in 2013 from R$2,852 million in 2012 due to a decrease in the internal rates set by the regulator used to calculate annual compensation received pursuant to the implementation of Law No. 12,783.
Operating Costs and Expenses
Operating costs and expenses for the transmission segment increased R$844 million, or 15.2%, to R$6,400 million in 2013 from R$5,557 million in 2012. The primary components of this increase were:
| • | a R$337 million, or 11.6%, increase in payroll and related charges to R$3,233 million in 2013 from R$2,896 million in 2012. This increase was mainly due to an increase in average salaries in line with the inflation rate and payments to certain employees as an inducement for early retirement; and |
| • | a R$235 million, or 29.3% increase in operating provisions to R$1,036 million in 2013 from R$801 million in 2012. This increase was mainly due to an increase in impairment provisions made in connection with the transmission segment pursuant to Law No. 12,783. |
- 82 -
Table of Contents
This increase was partially offset by:
| • | a R$31 million, or 64.1%, decrease in donations and contributions to R$17 million in 2013 from R$49 million in 2012. This decrease was mainly due to a decrease in revenues; and |
| • | a R$30 million, or 46.7%, decrease in depreciation and amortization to R$34 million in 2013 from R$64 million in 2012. This decrease was mainly due to the renewal of concessions under Law No. 12,783. Pursuant to this law, we became the operator of the new concessions, but no longer record the assets. Accordingly, this decreased the amount of depreciation charges. |
Results of Distribution Segment
Net Operating Revenues
Net operating revenues for the distribution segment decreased R$177 million, or 3.8%, to R$4,499 million in 2013 from R$4,614 million in 2012 due to the factors set forth below. This decrease was primarily due to a decrease in the RTE (Revisão Tarifaria Extraordinária) tariff pursuant to Law No. 12,783.
Electricity Sales
Electricity sales decreased R$166 million, or 3.6%, to R$4,449 million in 2013 from R$15 million in 2012. This decrease was due to a reduction of tariff payments made to Eletrobras’s distribution companies.
Other Operating Revenues
Other operating revenues increased R$318 million, or 142.2%, to R$542 million in 2013 from R$224 million in 2012 principally due to the fact that our distribution companies received an incentive from the Brazilian Government, Account for Energy Development – CDE (Conta de Desenvolvimento Energético), in order to compensate the company for the tariff reduction passed to the final consumers.
Taxes on Revenues
Taxes on revenues decreased R$121 million, or 7.7%, to R$1,438 million in 2013 from R$1,559 million in 2012 primarily as a result of decreased revenues. For a description of the calculation of taxes on revenues please see “—Description of Principal Line Items—Operating Revenues—Taxes on Revenues.”
Regulatory Charges on Revenues
Regulatory charges on revenues decreased R$283 million, or 80.9%, to R$67 million in 2013 from R$350 million in 2012 primarily as a result of decreased revenues due to the effects of Law No. 12,783. For a description of the calculation of regulatory charges on revenues please see “—Description of Principal Line Items—Operating Revenues—Regulatory Charges on Revenues.”
Operating Costs and Expenses
Operating costs and expenses for the distribution segment decreased R$1,189 million, or 21.9%, to R$6,610 million in 2013 from R$5,421 million in 2012. The primary components of this decrease were:
| • | a R$535 million, or 90.3%, decrease in operating provisions to R$57 million in 2013 from R$592 million in 2012. This decrease was mainly due to the reversal of certain provisions including (i) R$131 million by Eletrobras Distribuição Rondônia in relation to the Termonorte II contract; (ii) R$118 million by Eletrobras Distribuição Roraima in relation to a provision for doubtful allowance of consumers and (iii) a provision of R$78 million made by Eletrobras Distribuição Rondônia for doubtful allowance of consumers. |
| • | a R$1,322 million, or 375.4%, increase in other operating expenses to R$1,675 million in 2013 from R$355 million in 2012. This increase was mainly due to (i) a penalty imposed by ANEEL of R$100 million for non-compliance with efficiency metrics (DEC and FEC) established by ANEEL; (ii) R$50 million relating to leasing of Eletrobras Distribuidora Amazonas and (iii) an expense of R$300 million related to uncollectable losses; |
| • | a R$423 million, or 23.8%, increase in the cost of electric energy purchased for resale to R$2,206 million in 2013 from R$1,782 million in 2012. This increase was due to an increase in the cost of electricity on the spot market; and |
| • | a R$112 million, or 8.8%, increase in payroll and related charges to R$1,393 million in 2013 from R$1,280 million in 2012. This increase was mainly due to an increase in average salaries in line with the inflation rate and payments to certain employees as an inducement for early retirement. |
- 83 -
Table of Contents
Results of Administration Segment
Operating Costs and Expenses
Operating costs and expenses for the administration segment increased R$4,590 million, or 178%, to R$7,161 million in 2013 from R$2,572 million in 2012. The primary component of this increase was:
| • | a R$4,728 million, or 599.8%, increase in operating provisions to R$5,674 million in 2013 from R$946 million in 2012. This increase was mainly due to the (i) compulsory loan provision in the amount of R$1,292 million; and (ii) to a provision for capital deficient of subsidiaries in the amount of R$2,842 million; |
Equity Investments
Equity investments for the administration segment decreased R$7,013 million, or 93%, to R$520 million in 2013 from R$7,533 million in 2012 mainly due to the concessions renewed under Law 12,783/2013.
Financial Results
Financial results for the administration segment decreased R$1,045 million, or 33%, to R$2,126 million in 2013 from R$3,170 million in 2012 substantially due to cash reduction which lead to a decrease of R$928 million in the income from financial investments.
Income Taxes and Social Contribution
Income taxes and social contribution for the administration segment increased R$682 million, or 106%, to R$1,326 million in 2013 from R$644 million in 2012 mainly due to a writte off of deferred tax credits. See “Year ended December 31, 2012 compared to year ended December 31, 2011 – Consolidated Results – Income Taxes and Social Contribution.”
Year ended December 31, 2012 compared to year ended December 31, 2011
Consolidated Results
This section is an overview of our consolidated results of operations, which are discussed in greater detail with respect to each segment below.
As a result of the changes to our financial information for 2012 described in “Presentation of Financial and Other Information” and “Operating Results – Changes to the Presentation of our Operating Results,” our financial information for 2011 is not fully comparable with our financial information for 2012. Accordingly, we describe any increases or decreased in line items including the change in presentation and the adoption of IFRS 11 as well as describing what the effects on our line items would have been had we not made the changes in presentation and had we not adopted IFRS 11. For further information regarding these changes in presentation and the adoption of IFRS 11, see “Operating Results – Changes to the Presentation of our Operating Results.”
Net Operating Revenues
Our net operating revenues for 2012 decreased R$1,518 million, or 5.1%, to R$28,014 million in 2012 from R$29,533 million in 2011. The decrease was due to an R$ 6.049 million impact of IFRS 11. R$1,947 million was related to desconsolidations in the transmission segment and R$3.719 million was related to desconsolidation of Itaipu. Had it not been for the adoption of IFRS 11, our net operating revenues would have increased R$4,531 million, or 15.3%, to R$34,064 million from R$29,533 million in 2011 due to:
| • | an increase of R$92 million, or 0.5%, in revenues from our generation operating revenues due to (i) an 8.3% increase in the volume of energy sales from R$20,608 million in 2011 to R$21,415 million in 2012; (ii) an increase in the volume of energy sales from 260 TWh in 2011 to 261 TWh in 2012; and (iii) a R$581 million reimbursement in 2012 related to rates billed to Eletrobras Eletronuclear; |
| • | an increase of R$2,208 million, or 89.5%, in our distribution operating revenues due to (i) a 135.4% increase in the supply of energy from R$1,954 million in 2011 to R$4,599 million in 2012; (ii) an increase in the volume of energy sold from 13.7 TWh in 2011 to 15.2 TWh in 2012, due in part to higher electricity sales in Northern Brazil and (iii) an increase of 160,000 distribution consumers; and |
| • | a decrease of R$1,038 million, or 13.3%, in our transmission operating revenues, from R$7,779 million in 2011 to R$6,741 million in 2012, due to an adjustment in the calculation of transmission rates to appropriately reflect the contractual rate of return of the financial asset, which led to an increase of R$384 million in revenues. In addition, had it not been for the adoption of IFRS 11, the operational and maintenance revenues would have increased. |
Operating Costs and Expenses
Our net operating costs for 2012 increased by R$2,415 million, or 9.6%, from R$25,390 million in 2011 to R$27,642 million in 2012. The primary drivers of the increase in net operating costs were:
| • | a R$2,180 million, or 76.5%, increase in operating provisions from R$2,849 million in 2011. The increase in operating provisions is due to (i) a R$1.6 billion related to onerous contracts and (ii) a R$0.6 billion provision for impairment; |
| • | a R$440 million, or 33.7%, increase in other operational costs and expenses from R$1,306 million in 2011. The increase in our other operational costs and expenses, is mainly due to equipment rentals for our distribution lines as a result of the expansion of our distribution network; |
| • | a R$60 million, or 0.8%, increase in personnel costs from R$7,671 million in 2011. The increase in personnel costs, is mainly due to the awarding of increased annual bonuses to employees; |
| • | a R$974 million, or 28.8%, decrease in construction costs from R$4,280 million in 2011. Had it not been for the adoption of IFRS 11, construction costs would have increased mainly due to an increase in capital expenditures related to distribution infrastructure, including the expansion of our distribution networks; |
- 84 -
Table of Contents
| • | a R$282 million, or 19.9%, increase in grid utilization expenses from R$1,421 million in 2011. The increase in grid utilization expenses is mainly due to an increases in tariffs and third party transmission lines reflecting an increase in transmission volume; |
| • | a R$661 million, or 49.7%, decrease in remuneration and reimbursements from R$1,329 million in 2011. Had it not been for the adoption of IFRS 11, remuneration and reimbursements would have increased mainly due to increased royalty charges due to the operations of new hydroelectric plants, including Santo Antônio, Passo São João and Mauá; |
| • | a R$531 million, or a 325.8%, increase in fuel costs for the production of electric energy from a net expense of R$163 million in 2011, due to an increase in the production of thermal gas due to our need to supplement hydroelectric generation with thermal generation, partially because of delays in the Candiota III (Phase C) plant becoming operational; and |
| • | a R$1,477 million, or a 43.6%, increase in electric energy purchased for resale from R$3,386 million in 2011, due to (i) an increase in the cost of electricity in the spot market; and (ii) a large energy purchase and penalties involving UTE Candiota III (Phase C). |
Results of Generation Segment
Net Operating Revenues
Due to the retrospective adoption of IFRS 11, our net operating revenues for the generation segment decreased R$2,255 million, or 10.5%, to R$19,185 million in 2012 from R$21,440 million in 2011 due to the factors set forth below. Had it not been for the adoption of IFRS 11, our net operating revenues for the generation segment would have increased R$1,980 million, or 10.4%.
Electricity Sales
Due to changes made to the presentation of our segmentation information for 2012, our electricity sales decreased R$1,422 million, or 6.2%, to R$21,415 million in 2012 from R$22,837 million in 2011. Had it not been for the change in presentation, our electricity sales would have increased due to an increase in the volume of energy sold by Itaipu and the devaluation of thereal against the U.S. Dollar, which had the effect of increasing the electricity sales of Itaipu inrealterms.
Other Operating Revenues
Other operating revenues decreased R$277 million, or 35.1%, to R$512 million in 2012 from R$789 million in 2011 principally due to fewer generation equipment rentals to third parties during the year compared with the prior year.
Taxes on Revenues
Our taxes on revenues increased R$67 million, or 3.3%, to R$2,074 million in 2012 from R$2,008 million in 2011 due to the fact that our revenues would have increased had it not been for the adoption of the IFRS 11. For a description of the calculation of taxes on revenues please see “—Description of Principal Line Items—Operating Revenues—Taxes on Revenues. “
Regulatory Charges on Revenues
Regulatory charges on revenues decreased R$173 million, or 15.4%, to R$950 million in 2012 from R$1,123 million in 2011 as a result of a significant increase in revenues from Itaipu who is not subject to regulatory charges.
Operating Costs and Expenses
Operating costs and expenses for the generation segment increased R$1,371 million, or 8.3%, to R$17,868 million in 2012 from R$16,498 million in 2011. The primary components of this increase were:
| • | a R$2,194 million, or 145.7%, increase in operating provisions to R$3,700 million in 2012 from R$1,506 million in 2011. This increase was due to (i) a R$1.6 billion related to onerous contracts and (ii) a R$0.6 billion provision for impairment; |
- 85 -
Table of Contents
| • | a R$531 million, or 327%, increase in the fuel for energy generation to R$694 million in 2012 from R$163 million in 2011. This increase was due to an increase in the production of thermal gas due to our need to supplement hydroelectric generation with thermal generation, partially because of delays in the Candiota III (Phase C) plant becoming operational; |
| • | a R$421 million, or 54.9%, increase in other operating expenses to R$1,189 million in 2012 from R$768 million in 2011. This increase was due to an increase in the average price of power generation equipment from third parties in the Isolated System and a decrease in the amount recovered from CCC reimbursement from excess operating costs. The decrease in CCC reimbursement, despite paying more in fuel costs in 2012, is due to a change in the level of reimbursement based in ANEEL regulations which reduced reimbursement levels for less efficient plants; |
| • | a R$61 million, or 3.1%, increase in grid utilization expenses to R$2,014 million in 2012 from R$1,953 million in 2011. This increase was due to increased use of the third party electricity grid as the result of the increase in the volume of power generated as well as an annual tariff adjustment based on the rate of inflation; |
This increase was partially off-set by:
| • | a R$661 million, or 49.7%, decrease in remuneration and reimbursements to R$668 million in 2012 from R$1,329 million in 2011 due to the retrospective adoption of IFRS 11. Had it not been for the adoption of IFRS 11, our remuneration and reimbursements would have increased due to an increase in the volume of power generated and an increase in the amount paid to the states and municipalities where the Candiota III plant’s reservoir is located; and |
| • | a R$231 million, or 4.6%, decrease in energy acquired for resale to R$4,836 million in 2012 from R$5,067 million in 2011. Had it not been for the adoption of IFRS 11, our energy acquired for resale would have increased mainly due to (i) an increase in the cost of electricity in the spot market and (ii) increased energy purchases to meet contractual obligations based on the expected date that the Candiota III (Phase C) plant was expected to become operational (but which was delayed). |
Results of Transmission Segment
Net Operating Revenues
Due to the retrospective adoption of IFRS 11, our net operating revenues for the transmission segment decreased R$1,553 million, or 18.7%, to R$6,741 million in 2012 from R$8,294 million in 2011 due to the factors set forth below. Had it not been for the adoption of IFRS 11, our net operating revenues would have increased from R$7,779 million in 2011 due to the factors set forth below.
Transmission of Electricity
Due to the retroactive adoption of IFRS 11, transmission of electricity decreased R$1,581 million in 2012, or 17.8%, to R$7,281 million in 2012 from R$8,862 million in 2011. Had it not been for the adoption of IFRS 11, our transmission of electricity would have increased as a result of an inflation adjustment to the fixed transmission tariff set by the Brazilian Government and the operation and construction of new transmission lines in 2012.
Operation and Maintenance
Operation and maintenance of revenue increased R$50.4 million, or 2.0%, to R$2,545 million in 2012 from R$2,494 million in 2011 due to the operation of new transmission lines.
Other Operating Revenues
Our other operating revenues for the transmission segment decreased R$0.9 million, or 0.6%, to R$155 million in 2012 from R$156 million in 2011 principally as a result of a decrease in leases of fixed assets, including poles used to transmit broadband.
Taxes on Revenues
Due to the retrospective adoption of IFRS 11, our taxes on revenues decreased R$36 million, or 12.6%, to R$249 million in 2012 from R$284 million in 2011. Had it not been for the adoption of IFRS 11, our taxes on revenues would have increased primarily as a result of increased revenues. For a description of the calculation of taxes on revenues please see “—Description of Principal Line Items—Operating Revenues—Taxes on Revenues”.
- 86 -
Table of Contents
Regulatory Charges on Revenues
Regulatory charges on revenues increased R$7 million, or 1.8%, to R$447 million in 2012 from R$439 million in 2011. For a description of the calculation of taxes on revenues please see “—Description of Principal Line Items—Operating Revenues—Regulatory Charges on Revenues” above.
Operating Costs and Expenses
Due to the retrospective adoption of IFRS 11, our operating costs and expenses for the transmission segment decreased R$1,515 million, or 21.4%, to R$5,557 million in 2012 from R$7,071 million in 2011. Had it not been for the adoption of IFRS 11, our operating costs and expenses would have increased due to a R$166 million, or 6.0%, increase in personnel, supplies and services expenses to R$2,896 million in 2012 from R$2,766 million in 2011, mainly due to an increase in average salaries in line with inflation.
Results of Distribution Segment
Net Operating Revenues
Net operating revenues for the distribution segment increased R$2,208 million, or 89.5%, to R$4,676 million in 2012 from R$2,467 million in 2011 due to the factors set forth below.
Electricity Sales
Electricity sales increased R$2,083 million, or 82.3%, to R$4,614 million in 2012 from R$2,532 million in 2011 due to an increase of 12.2% in the volume of electricity sold as well as an increase in the number of customers (especially in the North of Brazil as a result of the “Light for All” program) and in the average tariff for final customers.
Other Operating Revenues
Other operating revenues increased R$57 million, or 34.4%, to R$223 million in 2012 from R$167 million in 2011 principally due to the fact that our distribution companies received a slight increase in rental payments from renting out its telecommunications lines to third parties, mostly for cellular stations.
Taxes on Revenues
Taxes on revenues increased R$864 million, or 124%, to R$1,559 million in 2012 from R$695 million in 2011 as a result of our increased gross revenues. For a description of the calculation of taxes on revenues please see “—Description of Principal Line Items—Operating Revenues—Taxes on Revenues.”
Regulatory Charges on Revenues
Regulatory charges on revenues increased R$184 million, or 111.4%, to R$350 million in 2012 from R$166 million in 2011 as a result of our increased gross revenues. For a description of the calculation of taxes on revenues please see “—Description of Principal Line Items—Operating Revenues—Regulatory Charges on Revenues.”
Operating Costs and Expenses
Our operating costs and expenses for the distribution segment increased R$2,697 million, or 99.0%, to R$5,421 million in 2012 from R$2,725 million in 2011 due to:
| • | a R$1,090 million, or 157.5%, increase in the cost of electric energy purchased for resale to R$1,782 million in 2012 from R$692 million in 2011. This increase was due to an increase in the cost of electricity in the spot market; |
| • | a R$474 million, or 78.6%, increase in construction expenses to R$1,076 million in 2012 from R$603 million in 2011, as a result of an increase in capital expenditures related to construction to expand our distribution network; |
| • | a R$352 million, or 37.9%, increase in personnel, supplies and services expenses to R$1,280 million in 2012 from R$928 million in 2011. This increase was mainly due increase in average salaries and other charges; |
- 87 -
Table of Contents
| • | a R$333 million, or 127.9%, increase in operating provisions to R$593 million in 2012 from R$260 million in 2011 mainly due to the increase of allowance for doubtful accounts; |
| • | a R$274 million, or 349.7%, increase in other operating expenses to R$352 million in 2012 from R$78 million in 2011. This increase was mainly due to an increase in rental expenses for equipment used for power generation in the Isolated System by Eletrobras Distribuição Acre; and |
| • | a R$169 million, or 180.8%, increase in grid utilization expenses to R$263 million in 2012 from R$94 million in 2011, due to an increase in the use of third party electricity grids. |
B. Liquidity and Capital Resources
Our principal sources of liquidity derive from the cash generated by our operations and from loans received from various sources, including the RGR Fund (established to compensate electricity concessionaires for uncompensated expenses when the concessions ended), loans from third parties, including certain international agencies, and realizations of various investments we have made with Banco do Brasil S.A., with whom we are required by law to deposit any surplus cash assets. In addition, on October 20, 2011 we issued U.S.$1.75 billion 5.75% notes due in 2021.
We require funding principally in order to finance the upgrade and expansion of our generation and transmission facilities and in order to repay our maturing debt obligations. In addition, through our subsidiaries, we are bidding in auctions for new transmission lines and new generation contracts. In the event that we are successful in any of these auctions, we will need additional cash to fund investments necessary to expand the applicable operations.
From time to time, we consider potential new investment opportunities and we may finance such investments with cash generated by our operations, loans, issuances of debt and equity securities, capital increases or other sources of funding that may be available at the relevant time. At present we have the ability to fund up to R$1.2 billion of capital expenditure out of existing resources without the need to access the capital markets. Those funds represent a portion of the revenues we have generated from our sales of electricity and the interest we have received from our lending activities.
Cash Flows
The following table summarizes our net cash flows for the periods presented:
| For the Year Ended December 31, | ||||||||||||
| 2013 | 2012 | 2011 | ||||||||||
| (in R$ thousands) | ||||||||||||
Net Cash Flows: | ||||||||||||
Provided by operating activities | 9,329,355 | 13,349,926 | 4,286,867 | |||||||||
Provided by (used in) investing activities | (8,155,408 | ) | (10,857,514 | ) | (10,904,111 | ) | ||||||
Provided by (used in) financing activities | (77,879 | ) | (3,100,740 | ) | 2,356,861 | |||||||
|
|
|
|
|
| |||||||
Total | 1,096,068 | (608,329 | ) | (4,260,382 | ) | |||||||
|
|
|
|
|
| |||||||
Cash Flow from Operating Activities
Our cash flows from operating activities primarily result from:
| • | the sale and transmission of electricity to a stable and diverse base of retail and wholesale customers at fixed prices; and |
| • | restricted deposits for legal proceedings in cases where we are a plaintiff in a proceeding and are ordered to pay a deposit to the relevant court. Cash flows from operating activities have been sufficient to meet operating and capital expenditures requirements during the periods under discussion. |
In 2013, our cash flows from operating activities decreased R$4.1 billion, from R$13.4 billion in 2012 to R$9.3 billion in 2013. This variation was due to an R$4.1 billion decrease in revenue due to the application of Law No. 12,783.
Cash Flows from Investing Activities
Our cash flows from investing activities primarily reflect:
| • | restricted investments, being the surplus cash we are required to either deposit with Banco do Brasil S.A. (or in certain other investments issued by the Brazilian Government); |
- 88 -
Table of Contents
| • | investment acquisitions, being partnerships we enter into with third parties in the private sector in relation to the operation of new plants; |
| • | acquisitions of fixed assets, being primarily investments in equipment necessary for operational activities; and |
| • | income derived from the following: |
| (i) | LFT bonds issued by the Brazilian Government: these bonds are indexed to the Selic and bear no interest. |
| (ii) | LTN bonds issued by the Brazilian Government: these bonds are indexed by a fixed rate and bear no interest. |
| (iii) | Equity participation in the following companies: (i) Lajeado Energia S.A., (ii) CEB Lajeado S.A., and (iii) Paulista Lajeado Energia S.A. We receive dividends from these equity interests based on the annual profits earned by each company. |
In 2013, our cash flows from investing activities decreased R$2.7 billion, or 24.8%, from an outflow of R$10.9 billion in 2012 to an outflow of R$8.2 billion in 2013. This variation was due to the acquisition of fixed assets and to the receipt of financings income and loans.
Cash Flows from Financing Activities
Our cash flows used in financing activities primarily reflect interest income we receive from short-term and long-term loans made to non-affiliated companies that operate in the Brazilian electricity sector.
In 2013, our cash flows from financing activities decreased R$3.0 billion, from an outflow of R$3.1 billion in 2012 to an outflow of R$77.9 million in 2013. This variation was mainly due to loans and financings.
Relationship between Appropriated Retained Earnings and Cash Flows
As of December 31, 2013, our balance sheet reflected retained reserves of R$2.1 billion, which consisted of our statutory reserves but do not include unpaid shareholders’ remuneration (see “Item 8.A, Consolidated Financial Statements and Other Information – Policy on dividend distribution”).
Capital Expenditure
In the last five years, we have invested an average of R$6.1 billion per year in expansion, research and development. Approximately 46% was invested in our generation segment, 34% in our transmission segment and the balance in our distribution segment and other investments.
Our core business is the generation, transmission and distribution of energy and we intend to invest heavily in these segments in the next years.
Companies are now selected to construct new generation units and transmission lines by a tender process. It is, therefore, difficult to predict the precise amounts that we will invest in these segments going forward. We are, however, working to secure a significant number of new contracts either alone or as part of a consortium including the private sector.
According to the EPE 10 Year Plan, it is estimated that Brazil will have 142,202 km of transmission lines and 171,138 MW of installed generation capacity by 2020. These investments will represent approximately R$220 billion. As the current largest player in the market, we expect to participate in the majority of these new investments. In accordance with the EPE 10 Year Plan, we believe that over the next ten years we will invest an average of approximately R$22 billion per year. For these investments, we expect to use the funding derived from our net cash flow as well as from accessing national and international capital markets and through bank financing.
Our capital expenditures for fixed assets, intangible assets and concession assets in 2013, 2012 and 2011 were R$5,712.1 million, R$7,199.8 million and R$11,569.9 million, respectively. These values are the budgeted values and do not match the cash flow amounts due to the accounting consolidation process and intercompany elimination.
C. Research and Development, Patents and Licenses
Research and Development
Our research and planning activities are carried out by Cepel, a non-profit entity created in 1974 with the objective of supporting the technological development of the Brazilian electricity sector. We are the primary sponsor of Cepel and participate in coordinating environmental planning and energy conservation programs. Cepel’s clients are our operating
- 89 -
Table of Contents
subsidiaries (including Itaipu and Eletrobras Eletronuclear) and other Brazilian and foreign electric utilities and other industries of the electricity sector. Cepel’s activities aim to achieve high-quality standards and productivity in the electricity sector through technological research and development. Cepel has a network of laboratories to undertake its activities, and maintains technical co-operation agreements with several international electrical energy research and development institutions. Cepel prioritizes strategic and structuring projects, with its activities being distributed among seven research areas, each one carried on by specifics department: (i) DEA – Energy Optimisation and Environmental Issues Department; (ii) DRE – Electrical Networks Department; (iii) DAS – Systems Automation Department; (iv) DLE – Lines and Stations Department; (v) DTD – Distribution Technology Department; (vi) DTE – Department for Special Technologies; and (vii) the Laboratories of Experimental Research – DPA and DPF Departments.
We have a central group survey center that performs scientific studies, measurements, specialist analyses and other tests and analyses that are relevant to our core operations. This center has a certification from the Instituto Nacional de Metrologia (the Brazilian National Metrology Institute) that allows it to certify electrical equipment. Cepel also focuses on the development of energy efficiency projects including those relating to the generation of electricity from renewable sources such as solar and wind power. As part of this focus, Cepel’s structure includes the following projects: (i) the Centro de Referência para Energia Solar e Eólica Sérgio de Salvo Brito (National Reference Center for Solar and Wind Powered Energy of Salvo Brito); (ii) the Casa Solar Eficiente (Solar Efficient House); and (iii) the Centro de Aplicação de Tecnologias Eficientes (Center for the Application of Efficient Technologies).
Patents and Licenses
Among others, we have registered “Eletrobras” as a trademark with the Instituto Nacional de Propriedade Industrial – INPI. Further, Cepel has twenty-seven patents, Eletrobras Eletronorte has thirty-seven patents, Eletrobras Eletrosul has two patents and Eletrobras Furnas has nine patents registered with the INPI relating to equipment and manufacturing processes. In addition, Eletrobras Furnas has one patent registered in the United States and Cepel has six patents registered outside Brazil.
Insurance
We maintain insurance for, fire, natural disasters, accidents involving third parties, certain other risks associated with the transportation and assembly of equipment, construction of plants, and multirisks. Our subsidiaries and Itaipu have similar insurance coverage. We do not have insurance coverage for business interruption risk because we do not believe that the high premiums are justified by the low risks of a major disruption, considering the energy available in the Interconnected Power System. We believe that we maintain insurance that is both customary in Brazil and adequate for the business in which we engage.
D. Trend Information
Our management has identified the following key trends, which contain certain forward-looking information and should be read in conjunction with “Cautionary Statement Regarding Forward-Looking Information” and “Item 3.A, Risk Factors.” Fundamentally, we believe these trends will allow us to continue to grow our business and improve our corporate image:
| • | electricity is in constant demand: unlike certain industries which are particularly vulnerable to cyclical conditions in the market and/or seasonality, the demand for electricity is constant. We believe we will continue to have the ability to set tariffs in accordance with market conditions, particularly in the generation segment. Although tariffs in the transmission segment are set by the Brazilian Government each year, we believe that these tariffs will continue to increase; |
| • | participation in future auctions will allow us to grow: we expect to participate in an increasing number of future new energy auctions, as well as new transmission auctions, and will, accordingly need to invest in new power generation plants (hydroelectric, wind, biomass and thermal) and new transmission lines in order to expand the existing grid and keep our current market share. We also believe that by focusing on generation and transmission, we will be able to maximize profits by improving efficiency in our existing infrastructure and capitalizing on opportunities arising from new infrastructure; |
| • | a decrease in regulatory charges once infrastructure investments have been completed: in recent periods, our financial results have been impacted by regulatory charges regulated by ANEEL. The proceeds of these charges have been used by the Brazilian Government to invest in infrastructure such as the CCC and RGR. As this infrastructure is completed, we believe ANEEL will decrease the levels of regulatory charges, which will have a positive effect on our financial results. However, we do not believe there will be any changes in the short term. Moreover, we believe that the completion of these infrastructure projects will have a beneficial effect on our ability to grow our business; |
- 90 -
Table of Contents
| • | revenues from third parties for maintenance of facilities: although the core of our business will remain the generation and transmission segments, we have successfully increased our revenues in recent periods by using our expertise to provide maintenance services for other companies in our industry. Our subsidiary Eletrobras Eletronorte has been the key conduit for this. We expect this trend to continue, thereby improving our financial position; |
| • | an increasing focus on environmental, health and safety concerns: there is a trend in Brazil and globally towards increasing concerns for the protection of the environment. This impacts us in various ways, including dealing with social and political issues that may arise when we seek to construct new facilities (particularly in remote areas of Brazil) and reduced carbon emission targets from facilities that rely on fossil fuel. One of the key challenges for us will be to balance these environmental concerns against the growth of our business, as these concerns naturally can increase cost pressures. There is also an increasing trend in Brazil towards more stringent health and safety requirements with respect to operating permits for our facilities, which similarly imposes cost pressure challenges on our business; and |
| • | effect of Law No. 12,783: Law No. 12,783 will continue to effect the manner in which we account for our concessions. We expect to renew additional contracts for the maximum period of 30 years at significantly lower tariff levels. As a result, we believe we will continue to write down the value of our renewed concessions and provide “impairments” in cash generating units. |
E. Off-Balance Sheet Arrangements
None of our off-balance sheet arrangements are of the type with respect to which we are required to provide disclosure pursuant to item 5.E of Form 20-F.
F. Contractual Obligations
We set out below, on a segment basis, our long-term debt, long-term purchase obligations, leasing obligations, actuarial debt and obligations for asset retiring for the periods presented:
| Payments due by period as of December 31, 2013 | ||||||||||||||||||||
| (in R$ millions) | ||||||||||||||||||||
| 2015 | 2016 | 2017 | 2018 | 2019 and after | ||||||||||||||||
Long-term debt obligations | 1,368 | 751 | 746 | 554 | 27,086 | |||||||||||||||
Leasing obligations | 181 | 226 | 226 | 226 | 983 | |||||||||||||||
Post-employment benefits | 218 | 132 | 133 | 124 | 612 | |||||||||||||||
Decommissioning of nuclear power plants (i) | — | — | — | — | 2,854 | |||||||||||||||
Purchase obligations | 2,396 | 1,722 | 1,780 | 2,071 | 42,756 | |||||||||||||||
Generation | 426 | 316 | 305 | 408 | 2,913 | |||||||||||||||
Transmission | — | — | — | — | — | |||||||||||||||
Distribution | 1,970 | 1,406 | 1,475 | 1,663 | 39,843 | |||||||||||||||
TOTAL | 4,163 | 2,831 | 2,885 | 2,975 | 74,291 | |||||||||||||||
(i) Decommissioning of nuclear power plants
The decommissioning of nuclear power plants relates to the asset retirement obligation for these plants and the costs to be incurred at the end of their useful lives.
Decommissioning can be understood as a set of measures taken to safely decommission a nuclear plant, reducing residual radioactivity to levels that permit the site of the plant to be classified as of restricted use or of unrestricted use.
- 91 -
Table of Contents
ITEM 6. DIRECTORS, SENIOR MANAGEMENT AND EMPLOYEES
A. Board of Directors and Senior Management
We are managed by ourConselho de Administração (or Board of Directors), composed of up to ten members, and by ourDiretoria (or Board of Executive Officers), which currently consists of six members. Our by-laws also provide for a permanentConselho Fiscal (or Fiscal Council), which is made up of five effective members and their respective alternates. Pursuant to our by-laws, all members of our Board of Directors, Board of Executive Officers and Fiscal Council must be Brazilian citizens.
Board of Directors
The members of our Board of Directors are elected at the general shareholders meeting for a renewable term of one year. As our majority shareholder, the Brazilian Government has the right to appoint seven members of our Board of Directors, of which six are appointed by the MME and one by theMinistério do Estado do Planejamento, Orçamento e Gestão(the Planning, Budget and Management Ministry). The minority shareholders have the right to elect one member, the holders of preferred shares without voting rights representing at least ten percent of our total capital have the right to elect one member and one director shall be elected as a representative of the employees of the company. Currently, our Board of Directors is composed of nine members. One of the members of the Board of Directors is appointed as Chairman. The address of our Board of Directors is Av. Presidente Vargas, 409 13º andar – Rio de Janeiro.
Historically, our Board of Directors meets once a month and when called by a majority of the directors or the Chairman. Among other duties, our Board of Directors is responsible for: (i) establishing our business guidelines; (ii) determining the corporate organization of our subsidiaries or any equity participation by us in other legal entities; (iii) approving our entering into any loan agreement and determining our financing policy; and (iv) approving any guarantee in favor of any of our subsidiaries in connection with any financial agreement.
- 92 -
Table of Contents
The table below sets out the current members of our Board of Directors and their respective positions. The mandate of each member of our Board of Directors expires at the next Ordinary Shareholders’ Meeting. Each member was elected by the Brazilian Government except for Marcelo Gasparino da Silva and João Antônio Lian, who were elected by our minority shareholders and Thadeu Figueiredo Rocha, who was elected as a representative of our employees.
Name | Position | |
Márcio Pereira Zimmermann | Chairman | |
Maurício Muniz Barreto de Carvalho | Director | |
Marcelo Gasparino da Silva | Director | |
Lindemberg de Lima Bezerra | Director | |
Wagner Bittencourt de Oliveira | Director | |
José Antonio Corrêa Coimbra | Director | |
José da Costa Carvalho Neto | Director | |
Thadeu Figueiredo Rocha | Director | |
João Antônio Lian | Director |
Márcio Pereira Zimmermann – Chairman and Board Member: Mr. Zimmermann joined our Board of Directors and was immediately appointed as Chairman on April 30, 2010. He was appointed as Chairman for a second term on June 16, 2011. He was also the Minister of Brazil’s Ministry of Mines and Energy from April through December 2010, and since December 2010, he has served as the Executive Secretary of the same ministry. Mr. Zimmermann was previously the Engineering Director of Eletrobras from October 2001 through January 2003, and he was Research and Development Director of Eletrobras Cepel from 2003 to 2004. Mr. Zimmermann has a degree in Electrical Engineering from the Universidade Católica of the State of Rio Grande do Sul, a post graduate degree in Electrical Systems Engineering from Escola Federal de Engenharia de Itajubá and a masters degree in Electrical Engineering from the Pontifícia Universidade Católica of Rio de Janeiro.
Maurício Muniz Barreto de Carvalho – Board Member: Mr. Carvalho joined our Board of Directors on June 16, 2011. He currently holds the position of Brazil’s Secretary of the Growth Acceleration Program (Programa de Aceleração do Crescimento – PAC) having been appointed to that office in May 2011. Mr. Carvalho previously served as Principal of theEscola Nacional de Administração Pública (ENAP) in the areas of (1) Administration and Finance and (2) Managers and Servers Development from 1999 to 2002. In 2003, he was appointed as head of the Monitoring, Evaluation, Audit and Capacity Board of the Ministry of Education, and afterwards of the Educational Inclusion Programs Board. Mr. Carvalho served as Special Advisor for the Presidency from 2003 to 2004, when he was nominated Deputy Assistant Chief of Articulation and Monitoring of the Civil House of the Presidency, responsible for articulating government action and monitoring strategic projects, particularly the PAC. Mr. Carvalho has a Masters degree in Public Administration and Urban Planning and a Bachelors degree in Public Administration, both fromFundação Getúlio Vargas (FGV).
Marcelo Gasparino da Silva – Board Member: Mr. da Silva joined our Board of Directors on December 03, 2012. He previously served as president of the Advisory Board of the law firm Gasparino, Fabri, Lebarbenchon, Roman, Sachet & Marchiori, until 2006, where he specialized in tax and commercial law in Brasília, Rio de Janeiro, São Paulo and Manaus, and had a wide range of clients including Vale, CSN, Brasil Telecom, Paranapanema, Petrobrás Distribuidora e Claro. From 2007 to 2008, Mr. da Silva was an officer of the executive board at Centrais Elétricas de Santa Catarina S.A. (CELESC). He is a member of several legal and state-owned companies commissions and committees. He currently coordinates the Legal Committee of CELESC and serves as a consultant. He participated in the Executive Programme for Mergers and Acquisitions at the London School of Business. Mr. da Silva holds a degree in law fromUniversidade Federal de Santa Catarina(UFSC). He also holds a degree in Business Taxation Management from ESAG and is currently working towards an MBA in Controllership, Due Diligence and Finance at FGV.
Lindemberg de Lima Bezerra –Board Member: Mr. Bezerra joined our Board of Directors on June 16, 2011. Mr. Bezerra has held the position of Chief of Staff of the Secretary of the Brazilian National Treasury since July 2007. From 1997 to June 2007, Mr. Bezerra was a tax and economics assistant at the National Treasury. Mr. Bezerra holds a degree in economics fromUniversidade Federal do Rio Grande do Sul with a masters degree in economics fromUniversidade de São Paulo.
Wagner Bittencourt de Oliveira – Board Member: Mr. Oliveira has been a member of our Board of Directors since April 2007. In 1975, he undertook a public contest and was admitted to theBanco Nacional de Desenvolvimento Social – BNDES (National Bank of Social and Economical Development). Throughout his career at BNDES he has acted in many positions: Head of Division, Head of Department, Superintendent and, since December 2004, he has been Superintendent of Basic Supplies, which includes mining, metallurgy, cement, paper and cellulose, chemicals, petrochemicals and fertilizers. Mr. Oliveira has accumulated 20 years of executive experience having been the Secretary of the Ministry of
- 93 -
Table of Contents
National Integration (2001), Superintendent of SUDENE (2000 to 2001), CEO ofCompanhia Ferroviária do Nordeste(1998 to 2000) and Superintendent of the Industrial Area (1996 to 1998). Mr. Oliveira is a member of the Board of several companies, such as Usiminas Mecânica and CADAM. Mr. Oliveira is a metallurgical engineer with a degree from PUC-RJ, and has completed a specialized coursework in finance and capital markets.
José Antonio Corrêa Coimbra – Board Member: Mr. Coimbra has been a member of our Board of Directors since April 2009. Mr. Coimbra is currently Head of Office of the Brazil Ministry of Mines and Energy and has published several papers in Brazil and abroad. Within Eletrobras, Mr. Coimbra was previously Director of Engineering of Eletrobras Eletronorte, having worked at that company from 1977 until 2005. Mr. Coimbra is also a member of the Board of Directors of Eletrobras Eletronorte and holds the same position in Eletrobras Cepel. Mr. Coimbra holds a degree in Civil Engineering fromUniversidade Federal do Pará with a Master Degree in Production Engineering fromUniversidade Federal de Santa Catarina.
José da Costa Carvalho Neto – Board Member:Mr. Neto joined our Board of Directors on June 16, 2011. He was previously a Power Plants Professor atPontifícia Universidade Católica-MG, from 1970 to 1977. Subsequently he was the Deputy Secretary of Mines and Energy of Minas Gerais, appointed in 1987. Mr. Neto held the position of Chief Distribution Officer at Cemig from 1991 to 1997, and held the offices of Superintendent, Department and Division Manager as well as the role of Chairman of Cemig between July 1998 and January 1999. He has also held the offices of CEO of Arcadis Logos Energia, Member of the Board of Directors of Logos Engenharia and Enerconsult and Director of Orteng Equipamentos e Sistemas. Mr. Neto holds a degree in Electrical Engineering with a Masters Degree in Electrical Engineering fromUniversidade Federal de Minas Gerais.
Thadeu Figueiredo Rocha – Board Member: Mr. Rocha joined our Board of Directors on May 18, 2012. He previously worked at CEMIG, from 2001 to 2002 and, in 2003, he began working at Eletrobras, where he conducted studies on the long-term market analysis of the energy sector and Eletrobras, the behavior of large industrial consumers, national and regional economic scenarios, and tax policies. He currently works at the department of commercialization of Eletrobras and is also committed to studies related to PROINFA and carbon markets. He holds a degree in Economics fromUniversidade Federal de Minas Gerais(UFMG), a degree in Business Administration from Centro Universitário(UNA) and a degree in Energy Management and Economics fromInstituto Coppead de Administração of Universidade Federal do Rio de JaneiroandInstituto de Economia. He also holds a master and a doctorate degree in Political Sciences fromUniversidade Federal Fluminense. Mr. Rocha also holds an executive MBA in Leadership and Management of State-owned Companies fromFundação Coge, Franklin Covey Business and Uniceub, and participated in many workshops and courses related to the energy sector and economics in general.
João Antônio Lian – Board Member: Mr. Lian joined our Board of Directors on April 30, 2013. He is founder, CEO, and controlling shareholder of Sumatra Comércio Exterior Ltda., a company which exports coffee. Currently, Mr. Lian, is the chairman of CeCafé – Council of Coffe Exporters of Brazil. He is an experienced investor in the Brazilian capital markets, with ample experience dealing with critical situations involving publicly-held companies and their corporate governance practices. Mr. Lian holds an Engineering degree from Unipinhal.
Board of Executive Officers
Our Board of Executive Officers is currently made up of six members appointed by our Board of Directors for a three-years term. Our Board of Executive Officers ordinarily meets every week, or when called by a majority of the officers or by the President. Our Board of Executive Officers determines our general business policy, is responsible for all matters related to our day-to-day management and operations and is the highest controlling body with regards to the execution of our guidelines. We have no control over appointments of our chief executive and chief financial officers because all such appointments are made by our board of directors. Our chief administrative officer is responsible for coordinating the general management of our business including supplies, employment-related issues, training insurance policies and management of our assets. The address of our Board of Executive Officers is Av. Presidente Vargas, 409 13º andar – Rio de Janeiro.
The members of our current Board of Executive Officers were appointed by our Board of Directors and their names and titles are set out below:
Name | Position | |
| José da Costa Carvalho Neto | Chief Executive Officer | |
| Armando Casado de Araújo | Chief Financial and Investor Relations Officer | |
| Valter Luiz Cardeal de Souza | Chief Generation Officer | |
| Manoel Aguinaldo Guimarães | Chief Administrative Officer | |
| Marcos Aurélio Madureira de Silva | Chief Distribution Officer | |
| José Antonio Muniz Lopes | Chief Transmission Officer |
- 94 -
Table of Contents
Mr. José da Costa Carvalho Neto – Chief Executive Officer:See “ –Board of Directors.”
Mr. Armando Casado de Araújo – Chief Financial Officer and Investor Relations Officer: Mr Araújo has over 30 years of experience in the domestic electric power sector. He worked for Eletrobras Eletronorte as Budget Superintendent from 1977. He was then appointed President of theIntegração Transmissão de Energia S.A. He has worked at Eletrobras since June 2008 when he became the assistant to and substitute of the Chief Financial Officer. He was appointed as Chief Financial Officer and Investor Relations Officer on March 30, 2010. Mr. Araújo holds a degree in Business Administration fromFaculdade de Ciências Exatas, Administrativas e Sociais de Brasília, and has completed several post-graduate courses in Finance.
Mr. Valter Luiz Cardeal de Souza – Generation Officer: Mr. Souza has been Engineering Director of Eletrobras since January 14, 2003. He has been active in the electricity sector for over thirty-two years as an employee ofCompanhia Estadual de Energia Elétrica S.A. (CEEE) where, since 1971, he has undertaken important technical and management functions as director in the areas of generation, transmission and distribution. At theDepartamento Nacional de Águas e Energia Elétrica (DNAEE), he was Assistant Executive to the General Manager, Coordinator for the Department of Construction and Application of Electrical Energy and Coordinator and Substitute Director for the Department of Finance and Economics. Mr. Souza also holds the position of President of the board of directors of Eletrobras Eletronorte and Eletrobras CGTEE. Mr. Souza is an electrical and electronic engineer, with a degree from thePontifícia Universidade Católica of Rio Grande do Sul, specializing in energy engineering as well as in production engineering.
Mr. Manoel Aguinaldo Guimarães – Chief Administrative Officer: Mr. Guimarães was appointed as Administrative Officer on October 10, 2013. From 2004 until 2009, he acted as an advisor to the Board of Executive Officers and from 2008 until 2010 as member of the Transformation Management Committee. From 2003 until 2004, Mr. Guimarães acted as Assistant to the CEP. Mr. Guimarães also acted as a director ofCEMAT – Centrais Elétricas Matogrossenses between 2004 and 2006, as chairman of the board of directors ofEletrobras Distribuição Rondônia - Centrais Elétricas de Rondônia S.A – CERON from 2006 and 2008 and as a board member ofEmpresa Amazonense de Transmissão e Energia – EATE. Mr. Guimarães held different positions in COPPE/UFRJ –Instituto Alberto Luiz Coimbra de Pós-Graduação e Pesquisa de Engenharia, of the Universidade Federal do Rio de Janeiro, including as Advisor to the Board of Executive Officers for Human Resources, between 1986 and 1989, Financial and Management Executive Officer between 1989-1990 and 1998-1999. Mr. Guimarães also acted as Coordinator for the Task Force for the Creation of the Career Plan for the Technical Personnel of COPPE/UFRJ in 1978 and was founding member of theCaixa de Assistência Universitária do Rio de Janeiro – CAURJ in 1996. Mr. Guimarães holds a degree in Accounting from UNIGRANRIO (1992) and a post-graduate degree in Quality Systems Management from Universidade Federal do Rio de Janeiro (2002). Mr. Guimarães also holds a MBA degree in Leadership and Management of State-owned Companies.
Mr. Marcos Aurélio Madureira da Silva – Distribution Officer: Mr. da Silva was appointed as Distribution Officer on May 12, 2011. From 1998 to 2010 he acted as a Distribution Officer for Companhia Energética de Minas Gerais S.A. – CEMIG. In addition to this, Mr. da Silva has also acted as an Operations and Commercial Officer of Energisa Soluções and as a Director of the Operador Nacional do Sistema Elétrico. Mr. da Silva holds a degree in electrical engineering and has completed post-graduate courses in business administration and economics engineering.
Mr. José Antonio Muniz Lopes –Transmission Officer: Mr. Lopes was appointed Chief Executive Officer of Eletrobras on March 6, 2008. On March 4, 2008 at the Extraordinary General Stockholders Meeting he was elected a member of our Board of Directors. Mr. Lopes has held several executive positions in companies in the Eletrobras group, such as Chief Executive Officer and Director of Planning and Engineering at Eletrobras Eletronorte from 1996 to 2003, Chief Executive Officer, Managing Director and Chief Financial Officer at Eletrobras Chesf from 1992 to 1993 and Chief Executive Officer at Eletrobras from March 2008 to February 2011. Mr. Lopes was also Deputy Director of the National Department of Energy Development – DNDE of the Ministry of Mines and Energy, where he also served as the Executive Secretary. Mr. Lopes holds a degree in Electrical Engineering from theUniversidade Federal de Pernambuco. He is an expert in the Brazilian electricity sector in which he has worked for more than 30 years.
B. Compensation
The compensation of our Board of Directors, Board of Executive Officers and Fiscal Council is determined by our shareholders at the Ordinary Shareholders’ Meeting held within the first four months of the financial year. That compensation may also include a profit sharing amount at the discretion of our shareholders.
- 95 -
Table of Contents
For 2013 and 2012, the aggregate compensation paid to our Directors, Officers and members of the Fiscal Council (excluding that paid by Itaipu) was R$34 million and R$31 million, respectively. For 2011, the aggregate compensation paid to our Directors, Officers and members of the Fiscal Council (including that paid by our subsidiaries and Itaipu) was R$41 million.
C. Board Practices
Service Contracts
We do not have service contracts with any member of our Board of Directors, Board of Executive Officers or Fiscal Council.
Fiscal Council
Our Fiscal Council is established on a permanent basis and consists of five members and five alternates elected at the annual shareholders meeting for renewable one-year terms. The Brazilian Government has the right to appoint three of the members of our Fiscal Council, and both the minority shareholders and the holders of our preferred shares without voting rights, representing at least ten percent of our total capital, have the right to appoint one member each.
The current members of our Fiscal Council, set out in the table below, and respective alternates were elected during the general shareholders meeting held during April 30, 2013 and in which we elected five members and respective alternates to the Fiscal Council. Their terms of office are due to end at the ordinary shareholder meeting scheduled for 2014.
Member | Alternate | |
| Jarbas Raimundo de Aldano Matos | Ricardo de Paula Monteiro | |
| Danilo de Jesus Vieira Furtado | Jairez Elói de Souza Paulista | |
| Charles Carvalho Guedes | Hailton Madureira de Almeida | |
| Manuel Jeremias Leite Caldas | Josmar Cesta Bignotto | |
| Robert Juenemann | Omar Felipe Fonseca Angelino |
D. Employees
As of December 31, 2013, we (excluding Itaipu) had a total of 22,221 salaried employees compared to 26,154 employees as of December 31, 2012 and 26,672 as of December 31, 2011. Eletrobras itself, excluding Itaipu and other subsidiaries, had 1,044 employees as of December 31, 2013. For the past five years we have not experienced any strikes or other form of work stoppage that have affected our operations or had a significant impact on our results.
In 2013, as part of our cost cutting measures, we offered an early retirement program (Programa de Incentivo ao Desligamento), or PID, which 4,448 of our employees accepted. 4,221 employees left Eletrobras at the end of 2013 as part of the PID. In 2014, this program will be extended to our subsidiary Eletronuclear and the remaining 227 employees that accepted the PID in 2013 will retire. We estimate that this program will provide us with an annual cost saving of R$1.1 billion.
The significant reduction in the number of employees is mainly related to the Voluntary Redundancy Plan (see Items 17 and 18, note 30.2 for further information) affecting 4,055 employees and the restructuring of the corporate, organizational and managerial aspects of Eletrobras’ business model.
As a mixed capital company, we cannot hire employees without a public contest. A public contest involves us placing advertisements in the Brazilian press for open positions and inviting applicants to sit an examination. The last public contest took place in 2010, as a result of which we hired approximately 35 new employees.
Although we are not allowed to hire outsourced employees, our subsidiaries Eletrobras Eletronorte and Eletrobras Furnas employ 1,738 outsourced employees in order to comply with the rules established by the Brazilian Government during the national privatization plan.
The following table sets out the number of outsourced employees at Eletrobras Eletronorte and Eletrobras Furnas:
Subsidiary | Number of Outsourced Employees as of December 31, | |||||||
| 2013 | 2012 | |||||||
Eletrobras Eletronorte | 399 | 471 | ||||||
Eletrobras Furnas | 1.339 | 1,533 | ||||||
|
|
|
| |||||
Total | 1,738 | 2,004 | ||||||
|
|
|
| |||||
- 96 -
Table of Contents
The majority of our employees are members of unions. The main unions that represent our employees areFederação Nacional dos Urbanitários, Federação Nacional dos Engenheiros, Federação Interestadual de Sindicatos de Engenheiros, Federação Nacional de Secretárias e Secretários, Federação Brasileira dos Administradores, Sindicato dos Trabalhadores nas Indústrias de Energia Elétrica de São Paulo, Sindicato dos Eletricitários de Furnas e DME and Sindicato dos Eletricitários do Norte e Noroeste Fluminense. Our relationship with our employees is regulated by collective bargaining agreements executed with these unions and theAssociação dos Empregados da Eletrobras and renegotiated in May each year. This agreement is applicable only to employees of Eletrobras itself. Each of our subsidiaries negotiates its own collective bargaining agreement, on an annual basis, with their respective unions. We generally have a one-day strike each year regarding these collective bargaining agreements.
E. Share Ownership
No member of our Fiscal Council holds any of our shares. The following tables show current ownership of our shares by members of our Board of Directors and Board of Executive officers:
Board of Directors
Name | Number of Common Shares held | |||
Maurício Muniz Barreto de Carvalho | 10 | |||
Lindemberg de Lima Bezerra | 1 | |||
Wagner Bittencourt de Oliveira | 2 | |||
Marcio Pereira Zimmermann | 10 | |||
José Antonio Corrêa Coimbra | 1 | |||
José da Costa Carvalho Neto | 100 | |||
Marcelo Gasparino da Silva* | 2 | |||
Thadeu Figueiredo Rocha | — | |||
João Antônio Lian | 100 | |||
| * | Also holds one class “B” Preferred Share. |
Board of Executive Officers
Name | Number of Common Shares held | |||
José da Costa Carvalho Neto | 100 | |||
José Antonio Muniz Lopes | 1 | |||
Marcos Aurélio Madureira da Silva | — | |||
Valter Luiz Cardeal de Souza | — | |||
Miguel Colasuono | — | |||
Armando Casado de Araújo | — | |||
ITEM 7. MAJOR SHAREHOLDERS AND RELATED PARTY TRANSACTIONS
A. Major Shareholders
As of December 31, 2013, the aggregate amount of our outstanding capital stock was R$31,305 million, consisting of 1,087,050,297 outstanding common shares, together with 146,920 outstanding class “A” preferred shares and 265,436,883 outstanding class “B” preferred shares. This represented 80.4%, 0.01% and 19.6% of our aggregate outstanding capital stock respectively.
As of December 31, 2012, the aggregate amount of our outstanding capital stock was R$31,305 million, consisting of 1,087,050,297 outstanding common shares, together with 146,920 outstanding class “A” preferred shares and 265,436,883 outstanding class “B” preferred shares. This represented 80.4%, 0.01% and 19.6% of our aggregate outstanding capital stock respectively.
- 97 -
Table of Contents
As of December 31, 2013, we had 20,586 beneficial and 15 registered holders of ADSs representing common shares and 7,492 beneficial and 8 registered holders of ADSs representing preferred shares.
As of December 31, 2012, we had 42,486 beneficial and 9 registered holders of ADSs representing common shares and 22,030 beneficial and 6 registered holders of ADSs representing preferred shares.
The following tables show information relating to beneficial ownership in our common and preferred shares as of December 31, 2013 and December 31, 2012:
As of December 31, 2013
Shareholder | Common Shares | Class A Preferred Shares | Class B Preferred Shares | Total | ||||||||||||||||||||||||||||
| (number) | % | (number) | % | (number) | % | (number) | % | |||||||||||||||||||||||||
Brazilian Government | 591.968.382 | 54.46 | % | 2,252 | 0.00 | % | 591,970,634 | 43.76 | % | |||||||||||||||||||||||
BNDES Participações S.A. | 141,757,951 | 13.04 | % | 18,691,102 | 7.04 | % | 160,449,053 | 11.86 | % | |||||||||||||||||||||||
BNDES | 74,545,264 | 6.86 | % | 18,262,671 | 6.88 | % | 92,807,935 | 6.86 | % | |||||||||||||||||||||||
FND | 45,621,589 | 4.20 | % | 45,621,589 | 3.37 | % | ||||||||||||||||||||||||||
FGHAB | 1,000,000 | 0.09 | % | 1,000,000 | 0.07 | % | ||||||||||||||||||||||||||
CEF | 8,701,564 | 0.80 | % | 8,701,564 | 0.64 | % | ||||||||||||||||||||||||||
FGI | 8,750,000 | 3.30 | % | 8,750,000 | 0.65 | % | ||||||||||||||||||||||||||
FGO | 223,455,547 | 20.56 | % | 146,920 | 100.00 | % | 219,730,858 | 82.78 | % | 443,333,325 | 32.78 | % | ||||||||||||||||||||
Others | 222,712,163 | 20.49 | % | 86,076 | 58.59 | % | 200,206,897 | 75.43 | % | 423,005,136 | 31.27 | % | ||||||||||||||||||||
Under BM&FBOVESPA Custody | 69,825,287 | 6.42 | % | 86,075 | 58.59 | % | 95,058,408 | 35.81 | % | 164,969,770 | 12.20 | % | ||||||||||||||||||||
Resident | 87,086,451 | 8.01 | % | 1 | 0.00 | % | 84,075,677 | 31.67 | % | 171,162,129 | 12.65 | % | ||||||||||||||||||||
Non Resident | 65,800,425 | 6.05 | % | 21,072,812 | 7.94 | % | 86,873,237 | 6.42 | % | |||||||||||||||||||||||
J.P. Morgan Chase Bank | ||||||||||||||||||||||||||||||||
Others | 715,409 | 0.07 | % | 60,817 | 41.39 | % | 19,519,959 | 7.35 | % | 20,296,185 | 1.50 | % | ||||||||||||||||||||
Resident | 27,975 | 0.00 | % | 27 | 0.02 | % | 4,002 | 0.00 | % | 32,004 | 0.00 | % | ||||||||||||||||||||
|
|
|
|
|
|
|
|
|
|
|
|
|
|
|
| |||||||||||||||||
Non Resident | ||||||||||||||||||||||||||||||||
| 1,087,050,297 | 146,920 | 265,436,883 | 1,352,634,100 | |||||||||||||||||||||||||||||
|
|
|
|
|
|
|
| |||||||||||||||||||||||||
Total | 591.968.382 | 54.46 | % | 2,252 | 0.00 | % | 591,970,634 | 43.76 | % | |||||||||||||||||||||||
As of December 31, 2012
Shareholder | Common Shares | Class A Preferred Shares | Class B Preferred Shares | Total | ||||||||||||||||||||||||||||
| (number) | % | (number) | % | (number) | % | (number) | % | |||||||||||||||||||||||||
Brazilian Government | 591,968,382 | 54.46 | % | 2,252 | 0.00 | % | 591,970,634 | 43.76 | % | |||||||||||||||||||||||
BNDES Participações S.A. | 141,757,951 | 13.04 | % | 18,691,102 | 7.04 | % | 160,449,053 | 11.86 | % | |||||||||||||||||||||||
BNDES | 76,338,832 | 7.02 | % | 18,262,671 | 6.88 | % | 94,601,503 | 6.99 | % | |||||||||||||||||||||||
FND | 45,621,589 | 4.20 | % | 45,621,589 | 3.37 | % | ||||||||||||||||||||||||||
FGHAB | 1,000,000 | 0.09 | % | 1,000,000 | 0.07 | % | ||||||||||||||||||||||||||
CEF | 8,701,564 | 0.80 | % | 8,701,564 | 0.64 | % | ||||||||||||||||||||||||||
FGI | 8,750,000 | 3.30 | % | 8,750,000 | 0.65 | % | ||||||||||||||||||||||||||
FGO | 468,600 | 0.18 | % | 468,600 | 0.03 | % | ||||||||||||||||||||||||||
Others | 221,661,979 | 20.39 | % | 146,920 | 100.00 | % | 219,262,258 | 82.60 | % | 441,071,157 | 32.61 | % | ||||||||||||||||||||
Under BM&FBOVESPA Custody | 221,423,953 | 20.37 | % | 85,508 | 58.20 | % | 212,496,289 | 80.05 | % | 386,456,775 | 28.57 | % | ||||||||||||||||||||
Resident | 62,118,451 | 5.71 | % | 85,507 | 58.20 | % | 90,872,349 | 34.24 | % | 137,875,099 | 10.19 | % | ||||||||||||||||||||
Non Resident | 91,394,577 | 8.41 | % | 1 | 0.00 | % | 95,637,799 | 36.03 | % | 154,684,610 | 11.44 | % | ||||||||||||||||||||
J.P. Morgan Chase Bank | 67,910,925 | 6.25 | % | 25,986,141 | 9.79 | % | 93,897,066 | 6.94 | % | |||||||||||||||||||||||
Others | 238,026 | 0.02 | % | 18,580 | 12.65 | % | 6,765,969 | 2.55 | % | 7,022,575 | 0.52 | % | ||||||||||||||||||||
Resident | 210,297 | 0.02 | % | 18,553 | 12.63 | % | 6,761,967 | 2.55 | % | 6,990,817 | 0.52 | % | ||||||||||||||||||||
Non Resident | 27,729 | 0.00 | % | 27 | 0.02 | % | 4,002 | 0.00 | % | 31,758 | 0.00 | % | ||||||||||||||||||||
|
|
|
|
|
|
|
|
|
|
|
|
|
|
|
| |||||||||||||||||
Total | 1,087,050,297 | 146,920 | 265,436,883 | 1,352,634,100 | ||||||||||||||||||||||||||||
|
|
|
|
|
|
|
| |||||||||||||||||||||||||
B. Related Party Transactions
We administer certain funds, including the RGR fund, CCC Account and CDE Account, on behalf of the Brazilian Government, our controlling shareholder.
- 98 -
Table of Contents
We sometimes act together with other Brazilian state owned companies or governmental entities. These activities are mainly in the areas of technical cooperation and research and development. In 2000, our Board of Directors approved the execution of a Technical and Financial Cooperation Agreement between ourselves and the MME, for us to perform feasibility studies in relation to the Brazilian hydrographic base, with the purpose of identifying potential sites for the future construction of hydroelectric plants. The estimate value of this contract is R$25 million, to be paid to us by the MME.
We have entered into a joint venture agreement with Petrobras Energia S.A., which is also partly owned by the Brazilian Government, for the construction of a thermoelectric plant in Manaus. We have also entered into a framework agreement to establish the basis and the conditions for the development of energy commercialization contracts to be executed between ourselves and Petrobras in the future.
In addition, we have also made a number of loans to our subsidiaries. For further details please see the description in “Item 4. B, Information on the Company – Business Overview – Lending and Financing Activities – Loans Made by Us.”
There are also certain contractual arrangements in place between Eletrobras Eletronuclear and Eletrobras Furnas for the sale and purchase of energy produced by Eletrobras Eletronuclear, which are more closely described in “Item 4.B, Information on the Company – Business Overview Nuclear Plants.”
We believe our transactions with related parties are conducted on market terms.
For further information see note 46 of the consolidated financial statements.
C. Interests of Experts and Counsel
Not applicable.
A. Consolidated Financial Statements and Other Information
See “Item 3.A, Selected Financial Data” and “Item 18, Consolidated Financial Statements.”
Litigation
We are a defendant in numerous legal proceedings involving civil, tax, labor, corporate and environmental issues arising from the normal course of our business. Based on advice from our external legal advisors and our management’s best estimates, we have classified the potential outflow of future economic benefit.
Provisions are recognized when there is a present obligation (legal or constructive) as a result of a past event, and it is probable that an outflow of resources embodying economic benefits will be required to settle the obligation and a reliable estimate can be made of the amount of the obligation. Contingent liabilities are not recognized in the financial statements but are, where relevant, disclosed unless the possibility of an outflow of economic resources is considered remote.
For more detailed information about Litigation, please refer to note 31 to our audited consolidated financial statements as of December 31, 2013.
Policy on Dividend Distribution
Brazilian Corporate Law and our by-laws provide that we must pay our shareholders a mandatory distribution equal to at least 25.0% of our adjusted net income for the preceding fiscal year. In addition, our by-laws require us to give: (i) class “A” preferred shares a priority in the distribution of dividends, at 8% each year over the capital linked to those shares; and (ii) class “B” preferred shares that were issued on or after June 23, 1969 a priority in the distribution of dividends, at 6% each year over the capital linked to those shares. In addition, preferred shares must receive a dividend 10% over the dividend paid to the common shares.
- 99 -
Table of Contents
The following table sets out our dividends for the periods indicated:
| Year | ||||||||||||
| 2013 | 2012 | 2011 | ||||||||||
Common Shares (ELET 3) | 0.40 | 0.40 | 0.58 | |||||||||
Class A Preferred Shares (ELET 5) | 2.18 | 2.18 | 2.17 | |||||||||
Class B Preferred Shares (ELET 6) | 1.63 | 1.63 | 1.63 | |||||||||
B. Significant Changes
None.
A. Offer and Listing Details
Offer and Listing Details – Common Shares
Our common shares commenced trading on the Brazilian stock exchanges on September 7, 1971. The following table sets forth the reported high and low closing sale prices for our common shares on the BM&FBOVESPA and the approximate average daily trading volume for the annual periods indicated.
| Nominalreais per Common Share | Average Daily Trading Volume | |||||||||||
| High | Low | |||||||||||
| (millions of shares) | ||||||||||||
2009 | 38.75 | 24.07 | 1.102 | |||||||||
2010 | 42.00 | 21.00 | 1.141 | |||||||||
2011 | 25.40 | 15.35 | 1.087 | |||||||||
2012 | 19.36 | 6.16 | 2.052 | |||||||||
2013 | 8.10 | 4.41 | 2.510 | |||||||||
Source: São Paulo Stock Exchange.
The following table sets forth the reported high and low closing sale prices for our common shares on the BM&FBOVESPA and the approximate average daily trading volume for the quarterly periods indicated.
| Nominalreais per Common Share | Average Daily Trading Volume | |||||||||||
| High | Low | |||||||||||
| (millions of shares) | ||||||||||||
First Quarter 2011 | 24.68 | 22.13 | 1.229 | |||||||||
Second Quarter 2011 | 25.40 | 20.34 | 1.141 | |||||||||
Third Quarter 2011 | 20.86 | 15.75 | 1.068 | |||||||||
Fourth Quarter 2011 | 18.32 | 15.35 | 0.935 | |||||||||
First Quarter 2012 | 19.36 | 17.13 | 0.852 | |||||||||
Second Quarter 2012 | 17.38 | 12.70 | 2.898 | |||||||||
Third Quarter 2012 | 15.94 | 11.70 | 1.611 | |||||||||
Fourth Quarter 2012 | 12.22 | 6.16 | 2.896 | |||||||||
First Quarter 2013 | 8.10 | 6.13 | 2.330 | |||||||||
Second Quarter 2013 | 6.95 | 4.54 | 2.716 | |||||||||
Third Quarter 2013 | 6.34 | 4.41 | 2.615 | |||||||||
Fourth Quarter 2013 | 7.55 | 5.69 | 2.365 | |||||||||
Source: São Paulo Stock Exchange.
- 100 -
Table of Contents
The following table sets forth the reported high and low closing sale prices for our common shares on the BM&FBOVESPA and the approximate average daily trading volume for the periods indicated:
| Nominalreais per Common Share | Average Daily Trading Volume | |||||||||||
| High | Low | |||||||||||
| (millions of shares) | ||||||||||||
June 2013 | 5.75 | 4.54 | 2.418 | |||||||||
July 2013 | 4.96 | 4.41 | 1.913 | |||||||||
August 2013 | 5.05 | 4.45 | 2.900 | |||||||||
September 2013 | 6.34 | 5.20 | 3.053 | |||||||||
October 2013 | 7.55 | 6.38 | 2.273 | |||||||||
November 2013 | 6.75 | 5.81 | 2.796 | |||||||||
December 2013 | 6.05 | 5.69 | 2.047 | |||||||||
January 2014 | 6.09 | 5.13 | 2.497 | |||||||||
February 2014 | 5.14 | 4.57 | 2.038 | |||||||||
March 2014 | 6.60 | 4.63 | 3.040 | |||||||||
April 2014 (through April 28, 2014) | 7.92 | 6.75 | 3.110 | |||||||||
Source: São Paulo Stock Exchange.
In the United States, our common shares trade in the form of ADSs. The following table sets forth the reported high and low closing sale prices for our ADSs representing common shares on the NYSE and the approximate average daily trading volume for the periods indicated:
| U.S.$ per ADS (common shares) | Average Daily Trading Volume | |||||||||||
| High | Low | |||||||||||
| (millions of shares) | ||||||||||||
June 2013 | 2.70 | 2.02 | 1.008 | |||||||||
July 2013 | 2.21 | 1.49 | 0.685 | |||||||||
August 2013 | 2.19 | 1.92 | 1.162 | |||||||||
September 2013 | 2.89 | 2.26 | 1.275 | |||||||||
October 2013 | 3.45 | 2.80 | 1.031 | |||||||||
November 2013 | 3.05 | 2.53 | 1.113 | |||||||||
December 2013 | 2.67 | 2.40 | 1.163 | |||||||||
January 2014 | 2.57 | 2.12 | 0.932 | |||||||||
February 2014 | 2.19 | 1.98 | 1.404 | |||||||||
March 2014 | 2.84 | 1.99 | 1.569 | |||||||||
April 2014 (through April 28, 2014) | 3.56 | 2.95 | 1.959 | |||||||||
Source: New York Stock Exchange.
Offer and Listing Details – Preferred Shares
The following table sets forth the reported high and low closing sale prices for our Class B preferred shares on the BM&FBOVESPA and the approximate average daily trading volume for the annual periods indicated.
| Nominalreais per Preferred Share | Average Daily Trading Volume | |||||||||||
| High | Low | |||||||||||
| (millions of shares) | ||||||||||||
2009 | 33.90 | 22.30 | 1.000 | |||||||||
2010 | 35.19 | 24.67 | 0.790 | |||||||||
2011 | 31.46 | 20.34 | 0.736 | |||||||||
2012 | 27.49 | 7.30 | 1.724 | |||||||||
2013 | 13.70 | 8.03 | 2.013 | |||||||||
Source: São Paulo Stock Exchange.
- 101 -
Table of Contents
The following table sets forth the reported high and low closing sale prices for our Class B preferred shares on the BM&FBOVESPA and the approximate average daily trading volume for the quarterly periods indicated.
| Nominalreais per Preferred Share | Average Daily Trading Volume | |||||||||||
| High | Low | |||||||||||
| (millions of shares) | ||||||||||||
First Quarter 2011 | 30.62 | 26.73 | 0.943 | |||||||||
Second Quarter 2011 | 31.46 | 25.97 | 0.627 | |||||||||
Third Quarter 2011 | 26.16 | 20.34 | 0.702 | |||||||||
Fourth Quarter 2011 | 26.98 | 20.82 | 0.685 | |||||||||
First Quarter 2012 | 27.49 | 23.31 | 0.694 | |||||||||
Second Quarter 2012 | 24.09 | 17.31 | 2.314 | |||||||||
Third Quarter 2012 | 21.2 | 17.74 | 1.064 | |||||||||
Fourth Quarter 2012 | 18.25 | 7.30 | 2.891 | |||||||||
First Quarter 2013 | 13.70 | 9.69 | 1.961 | |||||||||
Second Quarter 2013 | 12.75 | 8.03 | 2.620 | |||||||||
Third Quarter 2013 | 10.47 | 8.11 | 1.873 | |||||||||
Fourth Quarter 2013 | 12.00 | 9.88 | 1.587 | |||||||||
Source: São Paulo Stock Exchange.
The following table sets forth the reported high and low closing sale prices for our Class B preferred shares on the BM&FBOVESPA and the approximate average daily trading volume for the periods indicated:
| Nominalreais per Preferred Share | Average Daily Trading Volume | |||||||||||
| High | Low | |||||||||||
| (millions of shares) | ||||||||||||
June 2013 | 10.25 | 8.28 | 2.400 | |||||||||
July 2013 | 9.73 | 8.32 | 1.693 | |||||||||
August 2013 | 9.25 | 8.11 | 1.953 | |||||||||
September 2013 | 10.45 | 9.35 | 1.977 | |||||||||
October 2013 | 12.00 | 10.69 | 1.741 | |||||||||
November 2013 | 11.6 | 10.20 | 1.605 | |||||||||
December 2013 | 10.36 | 9.88 | 1.381 | |||||||||
January 2014 | 10.22 | 8.90 | 2.260 | |||||||||
February 2014 | 9.48 | 8.50 | 1.492 | |||||||||
March 2014 | 10.88 | 8.57 | 1.963 | |||||||||
April 2014 (through April 28, 2014) | 12.28 | 10.87 | 2.194 | |||||||||
Source: São Paulo Stock Exchange.
In the United States, our Class B preferred shares trade in the form of ADSs. The following table sets forth the reported high and low closing sale prices for our ADSs representing Class B preferred shares on the NYSE and the approximate average daily trading volume for the periods indicated:
| U.S.$ per ADS (Class B preferred shares) | Average Daily Trading Volume | |||||||||||
| High | Low | |||||||||||
| (millions of shares) | ||||||||||||
June 2013 | 4.88 | 3.70 | 0.270 | |||||||||
July 2013 | 4.41 | 3.77 | 0.166 | |||||||||
August 2013 | 4.06 | 3.59 | 0.148 | |||||||||
September 2013 | 4.82 | 4.07 | 0.258 | |||||||||
- 102 -
Table of Contents
| U.S.$ per ADS (Class B preferred shares) | Average Daily Trading Volume | |||||||||||
| High | Low | |||||||||||
| (millions of shares) | ||||||||||||
October 2013 | 5.65 | 4.86 | 0.124 | |||||||||
November 2013 | 5.23 | 4.49 | 0.133 | |||||||||
December 2013 | 4.56 | 4.26 | 0.121 | |||||||||
January 2014 | 4.35 | 3.78 | 0.186 | |||||||||
February 2014 | 4.05 | 3.64 | 0.283 | |||||||||
March 2014 | 4.70 | 3.69 | 0.364 | |||||||||
April 2014 (through April 28, 2014) | 5.49 | 4.71 | 0.375 | |||||||||
Source: New York Stock Exchange.
We have an insignificant number of Class A preferred shares, with no material effect on the trading volume on the BM&FBOVESPA.
As a result, as of December 31, 2013, our capital stock was comprised of a total of 1,352,634,100 shares, of which 1,087,050,297 are common shares, 146,920 are class “A” preferred shares and 265,436,883 are class “B” preferred shares.
There are no restrictions on ownership of our preferred shares or common shares by individuals or legal entities domiciled outside Brazil.
The right to convert dividend payments and proceeds from the sale of shares into foreign currency and to remit such amounts outside Brazil is subject to restrictions under foreign investment regulations which generally require, among other things, that the relevant investments have been registered with the Central Bank. Banco Itaú S.A., as custodian for our common and class “B” preferred shares represented by the ADSs, has registered with the Central Bank on behalf of the Depositary the common and class “B” preferred shares that it will hold. This enables holders of ADSs to convert dividends, distributions or the proceeds from any sale of such common and class “B” preferred shares, as the case may be, into U.S. dollars and to remit such U.S. dollars abroad. However, holders of ADSs could be adversely affected by delays in, or a refusal to grant any, required government approval for conversions of Brazilian currency payments and remittances abroad of the common and preferred “B” shares underlying our ADSs.
In Brazil, there are a number of mechanisms available to foreign investors interested in trading directly on the Brazilian stock exchanges or on organized over-the-counter markets.
Under the regulations issued by the Resolution No. 2,689 issued by the National Monetary Council, foreign investors seeking to trade directly on a Brazilian stock exchange or on an organized over-the-counter market must meet the following requirements:
| • | investments must be registered with a custody, clearing or depositary system authorized by CVM or the Central Bank; |
| • | trades of securities are restricted to transactions performed on the stock exchanges or organized over-the-counter markets authorized by the CVM; |
| • | they must establish a representative in Brazil; |
| • | they must complete a form annexed to the Resolution No. 2,689; and |
| • | they must register with the CVM and register the inflow of funds with the Central Bank. |
If these requirements are met, foreign investors will be eligible to trade directly on the Brazilian stock exchanges or on organized over-the-counter markets. These rules extend favorable tax treatment to all foreign investors investing pursuant to these rules. See “Item 10.E, Taxation.” These regulations contain certain restrictions on the offshore transfer of the title of the securities, except in the case of corporate reorganizations effected abroad by a foreign investor.
A certificate of foreign capital registration has been issued in the name of the Depositary with respect to the ADSs and is maintained by Banco Itaú S.A., as custodian for our common and class “B” preferred shares represented by the ADSs, on behalf of the Depositary. Pursuant to such certificate of foreign capital registration, we expect that Depositary will be able to convert dividends and other distributions with respect to the common and class “B” preferred shares represented by ADSs into foreign currency and remit the proceeds outside of Brazil.
- 103 -
Table of Contents
In the event that a holder of ADSs exchanges such ADSs for common or class “B” preferred shares, such holder will be entitled to continue to rely on the Depositary’s certificate of foreign capital registration for five business days after such exchange, following which such holder must seek to obtain its own certificate of foreign capital registration with the Central Bank. Thereafter, any holder of common or class “B” preferred shares may not be able to convert into foreign currency and remit outside Brazil the proceeds from the disposition of, or distributions with respect to, such common and class “B” preferred shares, unless such holder qualifies under Resolution No. 2,689 or obtains its own certificate of foreign capital registration. A holder that obtains a certificate of foreign capital registration will be subject to less favorable Brazilian tax treatment than a holder of ADSs. See “Item 10.E, Taxation – Material Brazilian Tax Considerations.”
Under current Brazilian legislation, the Brazilian Government may impose temporary restrictions on remittances of foreign capital abroad in the event of a serious imbalance or an anticipated serious imbalance of Brazil’s balance of payments. For approximately six months in 1989 and early 1990, the Brazilian Government froze all dividend and capital repatriations held by the Central Bank that were owed to foreign equity investors in order to conserve Brazil’s foreign currency reserves. These amounts were subsequently released in accordance with Brazilian Government directives. There can be no assurance that the Brazilian Government will not impose similar restrictions on foreign repatriations in the future.
B. Plan of Distribution
Not applicable.
C. Markets
Our common shares are traded under the symbol “ELET3” and our class “B” preferred shares are traded under the symbol “ELET6” on theBM&F BOVESPA S.A. - Bolsa de Valores, Mercadorias e Futuros (the São Paulo Stock Exchange or BM&FBOVESPA). The Rio de Janeiro Stock Exchange trades only Brazilian federal, state and municipal public debt or carries out privatization auctions. Stocks and bonds are traded exclusively on the BM&FBOVESPA. As of December 31, 2013, we had approximately 29,376 record holders.
Our ADRs are listed on the NYSE. As of December 31, 2013, we had 20,586 beneficial and 15 registered holders of ADSs representing common shares and 7,492 beneficial and eight registered holders of ADSs representing preferred shares.
Trading, Settlement and Clearance
Regulation of the Brazilian Securities Market
The Brazilian securities markets are regulated by theComissão de Valores Mobiliários (the “CVM”), which was granted regulatory authority over the stock exchanges and securities markets by Brazilian Law No. 6,385, enacted on December 7, 1976 (“Brazilian Securities Law”) and Brazilian Law No. 6,404, enacted on December 15, 1976 (“Brazilian Corporate Law”), and also byConselho Monetário Nacional(the “CMN”) and the Central Bank which possesses, among other powers, licensing authority over brokerage firms and regulates foreign investment and foreign exchange transactions.
The Brazilian securities markets are governed by the Brazilian Securities Law and the Brazilian Corporate Law, as well as regulations issued by the CVM, the Central Bank and the CMN. These laws and regulations provide for, among other things, disclosure requirements applicable to issuers of traded securities, restrictions on insider trading and price manipulation and protection of minority shareholders. On January 3, 2002, the CVM issued Instruction No. 358 which amended the rules applicable to the disclosure of relevant facts, which became effective on April 18, 2002. The CVM has also issued several instructions regarding disclosure requirements, namely, Instructions No. 361 and No. 400 for the regulation of public offerings, Instruction No. 380 for the regulation of internet offerings and Instruction No. 381 for the regulation of independent auditors. Instruction No. 480 for the regulation of the registration of security issuers admitted to negotiation in regulated markets in Brazil, and Instruction No. 481 for the regulation of information and the public request of proxy for shareholders meetings. Instruction No. 480 also requests that publicly held companies disclose a reference form (Formulário de Referência) which maintains a permanently updated record containing relevant information on the issuer. We believe we are currently in accordance with all applicable Brazilian corporate governance standards.
Under the Brazilian Corporate Law, a company is either public, acompanhia aberta, or private, acompanhia fechada. All public companies are registered with the CVM and are subject to reporting and regulatory requirements. A company registered with the CVM may have its securities traded either on the Brazilian stock exchange markets, including the BM&FBOVESPA, or in the Brazilian over-the-counter market. The shares of a public company may also be traded privately, subject to certain limitations. To be listed on the BM&FBOVESPA, a company must apply for registration with the BM&FBOVESPA and the CVM and is subject to regulatory requirements and disclosure requirements.
- 104 -
Table of Contents
Trading on the BM&FBOVESPA
In 2000, the trading activities of shares in Brazil were reorganized through the execution of memoranda of understanding by the Brazilian regional stock exchanges. Under the memoranda, all Brazilian shares are publicly traded exclusively on the São Paulo Stock Exchange – BOVESPA (Bolsa de Valores de São Paulo – BOVESPA).
BOVESPA was a not-for-profit entity owned by its member brokerage firms. In 2008, BOVESPA was converted into a Brazilian publicly-held company and renamed BM&FBOVESPA, as a result of a merger between BOVESPA and the Brazilian Mercantile & Futures Exchange (Bolsa de Mercadorias e Futuros – BM&F). BM&FBOVESPA is currently the most important Brazilian institution to intermediate equity market transactions and it is the only securities, commodities and futures exchange in the country. Trading on such exchange is carried out by member brokerage firms.
The trading of securities on the BM&FBOVESPA may be suspended at the request of a company in anticipation of material announcement. Trading may also be suspended on the initiative of the BM&FBOVESPA or the CVM based on or due to, among other reasons, a belief that a company has provided inadequate information regarding a significant event or has provided inadequate responses to inquiries by the CVM or the BM&FBOVESPA.
Trading in securities listed on the BM&FBOVESPA, including theNovo Mercado and Levels 1 and 2 Segments of Differentiated Corporate Governance Practices, may be carried out off the exchanges in the unorganized over-the-counter market in certain specific circumstances.
Although the Brazilian securities market is the largest in Latin America in terms of capitalization, it is smaller and less liquid than the major U.S. and European securities markets. Moreover, the BM&FBOVESPA is significantly less liquid than the NYSE, or other major exchanges in the world.
Although all of the outstanding shares of a listed company may be traded on the BM&FBOVESPA, fewer than half of the listed shares are actually available for trading by the public, the remainder being held by small groups of controlling persons, by government entities or by one main shareholder. The relative volatility and illiquidity of the Brazilian securities markets may substantially limit your ability to sell the preferred shares at the time and price you desire and, as a result, could negatively impact the market price of these securities.
In order to reduce volatility, the BM&FBOVESPA has adopted a “circuit breaker” system pursuant to which trading sessions may be suspended for a period of 30 minutes, one hour or a longer period whenever specified indices of the BM&FBOVESPA fall below the limits of 10%, 15% and 20% respectively, in relation to the index levels for the previous trading session.
When shareholders trade in shares on the BM&FBOVESPA, the trade is settled in three business days after the trade date. The delivery of and payment for shares are made through BM&FBOVESPA, which handles the multilateral settlement of both financial obligations and transactions involving securities. According to applicable regulations, financial settlement is carried out through a Central Bank system and the transactions involving the sale and purchase of shares are settled through BM&FBOVESPA. All deliveries against final payment are irrevocable.
Trading on the Brazilian stock exchanges by non-residents of Brazil is subject to registration procedures.
Corporate Governance Practices
In 2000, the BM&FBOVESPA introduced three special listing segments, known as Levels 1 and 2 of Differentiated Corporate Governance Practices andNovo Mercado, aimed at fostering a secondary market for securities issued by Brazilian companies listed on the BM&FBOVESPA, by prompting these companies to follow good practices of corporate governance. The listing segments were designed for the trading of shares issued by companies voluntarily undertaking to abide by corporate governance practices and disclosure requirements in addition to those already imposed by Brazilian law. These rules generally increase shareholders’ rights and enhance the quality of information provided to shareholders. Recently, the BM&FBOVESPA has revised the Levels 1 and 2 of Differentiated Corporate Governance Practices andNovo Mercado rules in two occasions. The first round of amendments to theNovo Mercado rules became effective on February 6, 2006, and the first round of amendments to Levels 1 and 2 of Differentiated Corporate Governance Practices became effective on February 10, 2006. The second and most recent round of amendments to theNovo Mercadorules and the Levels 1 and 2 of Differentiated Corporate Governance Practices became effective on May 10, 2011.
As of the effective date, in order to become aNivel 1(Level 1) company, in addition to the obligations imposed by applicable law, an issuer must agree to: (i) ensure that shares representing at least 25% of its total capital are effectively available for trading; (ii) adopt offering procedures that favor widespread ownership of shares whenever making a public offering; (iii) comply with minimum quarterly disclosure standards; (iv) follow stricter disclosure policies with respect to transactions made by its controlling shareholders, members of its board of directors and its officers involving securities issued by the issuer; (v) submit any existing shareholders’ agreements and stock option plans to the BM&FBOVESPA; (vi) make a schedule of corporate events available to its shareholders; (vii) elaborate and disclose a securities trading policy
- 105 -
Table of Contents
applicable to the company, its controlling shareholders, board members and management, as well as the members of other statutory bodies of the company with technical and consultancy functions; (viii) elaborate and disclose a code of conduct establishing the values and principles that shall serve as a guidelines for the company’s activities and relationship with the management, staff, service providers and other entities and individuals affected by the company; and (ix) prohibit holding dual positions as Chairman and Chief Executive Officer (or primary executive officer) of the company.
To become aNivel 2(Level 2) company, in addition to the obligations imposed by applicable law, an issuer must agree, among other things, to: (i) comply with all of the listing requirements for Level 1 companies; (ii) grant tag-along rights for all of its shareholders in connection with a transfer of control of the company, offering the same price paid per share for controlling block common shares; (iii) grant voting rights to holders of preferred shares in connection with certain corporate restructurings and related party transactions, such as: (a) any change of the company into another corporate entity; (b) any merger, consolidation or spin-off of the company; (c) approval of any transactions between the company and its controlling shareholder, including parties related to the controlling shareholder; (d) approval of any valuation of assets to be delivered to the company in payment for shares issued in a capital increase; (e) appointment of an expert to ascertain the fair value of the company’s shares in connection with any deregistration and delisting tender offer from Level 2; and (f) any changes to these voting rights, which will prevail as long as the agreement for adhesion to the Level 2 segment with the BM&FBOVESPA is in effect; (iv) have a board of directors comprised of at least five members, out of which a minimum of 20% of the directors must be independent, with a term limited to two years; (v) prepare annual consolidated financial statements in English, including cash flow statements, in accordance with international accounting standards, such as U.S. GAAP or International Financial Reporting Standards, or IFRS; (vi) effect a tender offer by the company’s controlling shareholder (the minimum price of the shares to be offered will be determined by an appraisal process), if it elects to delist from the Level 2 segment; (vii) adhere exclusively to the rules of the BM&FBOVESPA Arbitration Chamber for resolution of disputes between the company and its investors; (viii) cause the Board of Directors to elaborate and disclose a previous and justified opinion in relation to any and all public offers for the acquisition of shares issued by the company analyzing, among other aspects, the impacts of the offer on the company’s and shareholders’ interests, as well as on the liquidity of the shares issued by the company, and containing a final and justified recommendation for the acceptance or rejection of the offer by the shareholders; and (ix) not to include in the company’s by-laws provisions that (a) restrict the number of votes of a shareholder or of a group of shareholders to percentages below 5% (five percent) of the voting shares, except for the cases of denationalization or of limits imposed by the laws and regulations applicable to the company; and, except as otherwise provided by the law or regulations (b) require a qualified quorum for matters that shall be submitted to the general shareholders’ meeting, or (c) restrict the exercise of a favorable vote by shareholders or burden shareholders that vote in favor of a suppression or change of by-laws provisions.
To be listed in theNovo Mercado segment of the BM&FBOVESPA, an issuer must meet all of the requirements described above under Level 1 and Level 2, in addition to issuing only common (voting) shares.
On September 26, 2006 we entered into an agreement with the BM&FBOVESPA to list our preferred shares on the Level 1 segment, effective on the date immediately after the date of publication of the announcement in Brazil of the listing, pursuant to which we agreed to comply, and continue to be compliant with all of the requirements of a Level 1 listing.
Investment in our Preferred Shares by Non-Residents of Brazil
Investors residing outside Brazil, including institutional investors, are authorized to purchase equity instruments, including our preferred shares, on the Brazilian stock exchangeprovided that they comply with the registration requirements set forth in Resolution No. 2,689 of the CMN and CVM Instruction No. 325, from January 27, 2000, as amended. With certain limited exceptions, under Resolution No. 2,689 investors are permitted to carry out any type of transaction in the Brazilian financial capital markets involving a security traded on a stock, future or organized over-the-counter market. Investments and remittances outside Brazil of gains, dividends, profits or other payments under our preferred shares are made through the exchange market.
In order to become a Resolution No. 2,689 investor, an investor residing outside Brazil must:
| • | appoint at least one representative in Brazil that will be responsible for complying with registration and reporting requirements and procedures with the Central Bank and the CVM. If the representative is an individual or a non-financial company, the investor must also appoint an institution duly authorized by the Central Bank that will be jointly and severally liable for the representative’s obligations; |
| • | complete the appropriate foreign investor registration form; |
| • | through its representative, register itself as a foreign investor with the CVM and register the investment with the Central Bank; |
| • | appoint a representative in Brazil for taxation purposes; |
- 106 -
Table of Contents
| • | obtain a taxpayer identification number from the Brazilian federal tax authorities – Receita Federal (the Brazilian Internal Revenue); and |
| • | securities and other financial assets held by foreign investors pursuant to Resolution No. 2,689 must be registered or maintained in deposit accounts or under the custody of an entity duly licensed by the Central Bank or the CVM. In addition, securities trading by foreign investors are generally restricted to transactions involving securities listed on the Brazilian stock exchanges or traded in organized over-the-counter markets licensed by the CVM. |
Significant Differences between our Corporate Governance Practices and NYSE Corporate Governance Standards
We are subject to the NYSE corporate governance listing standards. As a foreign private issuer, the standards applicable to us are considerably different to the standards applied to U.S. listed companies. Under the NYSE rules, we must comply with the following corporate governance rules: (i) we must satisfy the requirements of Rule 10A-3 of the Exchange Act, including having an audit committee or audit board, pursuant to an applicable exemption available to foreign private issuers, that meets certain requirements, as discussed below; (ii) we must provide the NYSE with annual and interim written affirmations as required under the NYSE corporate governance rules; (iii) we must provide prompt certification by our chief executive officer of any material non-compliance with any corporate governance rules; and (iv) we must provide a brief description of the significant differences between our corporate governance practices and the NYSE corporate governance practices required to be followed by U.S. listed companies. The discussion of the significant differences between our corporate governance practices and those required of U.S. listed companies follows below.
Majority of Independent Directors
The NYSE rules require that a majority of the board must consist of independent directors. Independence is defined by various criteria, including the absence of a material relationship between the director and the listed company. Although Brazilian law does not have a similar requirement,Novo Mercadoand Level 2 rules require that listed companies have a board of directors comprised of at least five members, out of which a minimum of 20% of the directors must be independent pursuant to the different criteria defined in the regulations (such as absence of material relationship between a director and the listed company or the controlling shareholder). The Level 1 segment of BM&FBOVESPA in which we are listed only requires the board to be comprised of a minimum of three members and does not require any participation by independent directors and, therefore, under Brazilian law and the rules of the Level 1, neither our Board of Directors nor our management is required to test the independence of directors before their election to the board. Nevertheless, both Brazilian Corporate Law and the CVM have established rules that require directors to meet certain qualification requirements and that address the compensation and duties and responsibilities of, as well as the restrictions applicable to, a company’s executive officers and directors. While our directors meet the qualification requirements of Brazilian Corporate Law and the CVM, as well as the Level 1 segment of BM&FBOVESPA, we do not believe that a majority of our directors would be considered independent under the NYSE test for director independence. Brazilian Corporate Law and our by-laws require that our directors be elected by our shareholders at a general shareholders’ meeting.
Executive Sessions
NYSE rules require that the non-management directors must meet at regularly scheduled executive sessions without management present. Brazilian Corporate Law does not have a similar provision. According to Brazilian Corporate Law, up to one-third of the members of the Board of Directors can be elected to the Board of Executive Officers. The remaining non-management directors are not expressly empowered to serve as a check on management, and there is no requirement that those directors meet regularly without management. As a result, the non-management directors on our board do not typically meet in executive session.
Nominating/Corporate Governance Committee
NYSE rules require that listed companies have a nominating/corporate governance committee composed entirely of independent directors and governed by a written charter addressing the committee’s required purpose and detailing its required responsibilities, which include, among other things, identifying and selecting qualified board member nominees and developing a set of corporate governance principles applicable to the company. Brazilian law does not have a similar requirement.
Compensation Committee
NYSE rules require that listed companies have a compensation committee composed entirely of independent directors and governed by a written charter addressing the committee’s required purpose and detailing its required responsibilities, which include, among other things, reviewing corporate goals relevant to the chief executive officer’s compensation, evaluating the chief executive officer’s performance, approving the chief executive officer’s compensation levels and recommending
- 107 -
Table of Contents
to the board non-chief executive officer compensation, incentive-compensation and equity-based plans. We are not required under applicable Brazilian law to have a compensation committee. Under Brazilian Corporate Law, the total amount available for compensation of our directors and executive officers and for profit-sharing payments to our executive officers is established by our shareholders at the annual general meeting. The Board of Directors is then responsible for determining the individual compensation and profit-sharing of each executive officer, as well as the compensation of our board and committee members. In making such determinations, the board reviews the performance of the executive officers, including the performance of our chief executive officer, who typically excuses himself from discussions regarding his performance and compensation.
Audit Committee
NYSE rules require that listed companies have an audit committee that: (i) is composed of a minimum of three independent directors who are all financially literate; (ii) meets the SEC rules regarding audit committees for listed companies; (iii) has at least one member who has accounting or financial management expertise; and (iv) is governed by a written charter addressing the committee’s required purpose and detailing its required responsibilities. However, as a foreign private issuer, we need only to comply with the requirement that the audit committee meet the SEC rules regarding audit committees for listed companies. Brazilian Corporate Law requires companies to have a non-permanent Fiscal Council composed of three to five members who are elected at the general shareholders’ meeting.
Shareholder Approval of Equity Compensation Plans
NYSE rules require that shareholders be given the opportunity to vote on all equity compensation plans and material revisions thereto, with limited exceptions. Under Brazilian Corporate Law, shareholders must approve all stock option plans. In addition, any issuance of new shares is subject to shareholder approval.
NYSE rules require that listed companies adopt and disclose corporate governance guidelines. Although applicable Brazilian law does not have a similar requirement, we have adopted corporate governance guidelines which are set forth in the Code of Corporate Governance Practices of Eletrobras (“Código das Práticas de Governança Corporativa da Eletrobras”). Additionally, we have also adopted and observe a disclosure policy, which requires the public disclosure of all relevant information pursuant to guidelines set forth by the CVM, as well as an insider trading policy, which, among other things, establishes black-out periods and requires insiders to inform management of all transactions involving our securities.
Code of Business Conduct and Ethics
NYSE rules require that listed companies adopt and disclose a code of business conduct and ethics for directors, officers and employees, and promptly disclose any waivers of the code for directors or executive officers. BM&F Bovespa has a similar requirement for companies that are listed under Level 1, Level 2 or in theNovo Mercado corporate governance segments, and in 2010 we have introduced the Ethics Code of Eletrobras Companies (“Código de Ética Único das Empresas Eletrobras”) which provides for the ethical principles to be observed by all the members of the board of directors, executive officers, employees, outsourced staff, service providers, trainees and young apprentices.
Internal Audit Function
NYSE rules require that listed companies maintain an internal audit function to provide management and the audit committee with ongoing assessments of the company’s risk management processes and system of internal control. Brazilian law does not have a similar requirement.
D. Selling Shareholders
Not applicable.
E. Dilution
Not applicable.
F. Expenses of the Issue
Not applicable.
- 108 -
Table of Contents
ITEM 10. ADDITIONAL INFORMATION
A. Share Capital
Not applicable.
B. Memorandum and Articles of Association
Corporate Purpose
Our by-laws provide that our corporate purposes are:
| (1) | to construct and operate power plants and transmission lines to generate and distribute electric energy and to enter into related business transactions, such as the trade of electric energy; |
| (2) | to cooperate with the government to establish national energy policy; |
| (3) | to give financial support to our subsidiaries; |
| (4) | to promote and support research of interest to the energy sector, connected with the generation, transmission and distribution of electric energy, as well as studies regarding the utilization of reservoirs for various purposes; |
| (5) | to contribute to the training of the technical personnel required by the Brazilian electric energy sector by means of specialized courses; we may also grant assistance to educational entities in Brazil or abroad; and |
| (6) | to cooperate technically and administratively with our subsidiaries and the government. |
Our Board of Directors do not have the power to vote on compensation to themselves or to exercise borrowing powers. Only our shareholders may approve such matters. There are no prescribed age limits for retirement of members of our Board of Directors.
Description of our Capital Stock
General
We are a mixed capital company, authorized by and constituted in accordance with Brazilian Law No. 3,890-A of April 25, 1961. We are registered with the Brazilian tax authorities with CNPJ no. 00.001.180/0001-26.
Our share capital is divided into three types of shares: common shares, class “A” preferred shares (which were issued before June 23, 1969) and class “B” preferred shares (which have been issued since June 23, 1969).
In September 2006, we entered into an agreement with the BM&FBOVESPA to list our shares on the Level 1 segment of BM&FBOVESPA’s corporate governance, the effectiveness of which began on September 29, 2006. Trading in our shares on the Level 1 began on September 29, 2006.
History of our Capital Stock
In 2013, our share capital was of R$31,305 million, compared to R$31,305 million in 2012.
Treasury Shares
We hold no treasury shares and we do not have a program for repurchasing our shares.
Rights Attaching to Our Shares
Common Shares
Each of our common shares entitles its holder to one vote on all matters submitted to a vote of shareholders at an annual or special shareholders’ general meeting. In addition, upon our liquidation, holders of our shares are entitled to share all of our remaining assets, after payment of all of our liabilities, ratably in accordance with their respective participation in the total amount of the issued and outstanding common shares. Holders of our common shares are entitled to participate on all future capital increases by us.
- 109 -
Table of Contents
Preferred Shares
Our preferred shares have different attributes to our common shares as the holders of our preferred shares are not entitled to vote at annual or special shareholders’ general meetings but have preferential a right to reimbursement of capital, distribution of dividends and priority on insolvency. Our preferred shares cannot be converted into common shares.
Class “A” preferred shares, and bonus shares related to such shares, are entitled to a dividend of 8% per annum, in priority to the distribution of other dividends, to be divided equally between them. Class “B” preferred shares, and bonus shares related to such shares, are entitled to a dividend of 6% per annum, in priority to the distribution of other dividends, to be divided equally between them. An unpaid dividend is not payable in future years. The Class “A” preferred shares and the class “B” preferred shares rank equally on a liquidation.
In addition, the preferred shares are entitled to receive a dividend at least ten percent above the dividend paid to each common share.
Transfer of Our Shares
Our shares are not subject to any share transfer restrictions. Whenever a transfer of ownership of shares occurs, the finance company with which such shares are deposited may collect from the transferring shareholder the cost of any services in connection with the Brazilian transfer thereof, subject to maximum rates established by the CVM.
Pre-emption Rights
No pre-emption rights apply on the transfer of our shares.
Redemption
We cannot redeem our shares.
Registration
Our shares are held in book-entry form with J.P. Morgan Chase Bank N.A., which will act as the custodian agent for our shares. Transfer of our shares will be carried out by means of book entry by J.P. Morgan Chase Bank N.A. in its accounting system, debiting the share account of the seller and crediting the share account of the buyer, upon a written order of the transferor or a judicial authorization or order to affect such transfers.
Notification of Interests in Our Shares
Any shareholder that acquires or disposes of 5% or more of our capital stock of any class is obliged to notify the Company immediately upon completion of the transaction. Such obligation also applies to the holders of ADRs, convertible debentures and stock options. After the receipt of such notification, the Company shall inform such transaction by means of a notice which shall be uploaded in the site of CVM and duly update its corporate information in its Reference Form (Formulário de Referência) within seven business days of the occurrence of the transaction.
Shareholders’ General Meetings
Brazilian corporation law does not allow shareholders to approve matters by written consent obtained as a response to a consent solicitation procedure. All matters subject to approval by the shareholders must be approved in a duly convened general meeting. There are two types of shareholders’ meetings: ordinary and extraordinary. Ordinary meetings take place once a year within 120 days of our fiscal year end and extraordinary meetings can be called whenever necessary.
Shareholders’ meetings are called by our board of directors. Notice of such meetings is posted to shareholders and, in addition, notices are placed in a newspaper of general circulation in our principal place of business and on our website at least 15 days before the meeting.
Shareholders’ meetings take place at our headquarters in Brasília. Shareholders may be represented at a shareholders’ meeting by attorneys-in-fact who are: (i) shareholders of the company; (ii) a Brazilian lawyer; (iii) a member of our management; or (iv) a financial institution.
At duly convened meetings, our shareholders are able to take any action regarding our business. The following actions can only be taken by our shareholders in general meeting:
| • | approving our annual accounts; |
| • | electing and dismissing the members of our board of directors and our fiscal council; |
| • | amending our by-laws; |
| • | approving our merger, consolidation or spin-off; |
- 110 -
Table of Contents
| • | approving our dissolution or liquidation as well as the election and dismissal of liquidators and the approval of their accounts; |
| • | granting stock awards and approving stock splits or reverse stock splits; |
| • | approving stock option plans for our management and employees; and |
| • | approving the payment of dividends. |
Board of Directors, Board of Executive Officers and Fiscal Council
Our by-laws provide for a Board of Directors, composed of up to ten members, a Board of Executive Officers, of unlimited membership, and a permanent Fiscal Council, composed of five effective members.
Qualifications
All members of our Board of Directors, Board of Executive Officers and Fiscal Council must be Brazilian citizens. Our by-laws also provide that the certain people may not be appointed to the management of the company, including those who: are disqualified by the CVM, have been declared bankrupt or have been convicted of certain offenses such as bribery and crimes against the economy.
The minutes of the shareholders’ or directors’ meeting that appoints a member of the Board of Directors or the Board of Executive Officers, respectively, must detail the qualifications of such person and specify the period of their mandate.
Appointment
The members of our Board of Directors are elected at the general shareholders meeting for a renewable term of one year.
As our majority shareholder, the Brazilian Government has the right to appoint seven members of our Board of Directors, of which six are appointed by the MME and one by the Planning, Budget and Management Ministry. The other common shareholders have the right to elect one member, the holders of preferred shares without voting rights representing at least ten percent of our total capital have the right to elect one member and one member shall be elected as the representative of the employees, by means of an election organized by the company and the union entities. One of the members of the Board of Directors is appointed President of the company.
The members of our Board of Executive Officers are appointed by our Board of Directors for an indefinite term.
The Brazilian Government has the right to appoint three of the members of our Fiscal Council, and both the minority shareholders and the holders of our preferred shares have the right to appoint one member each.
Meetings
Under our by-laws, our Board of Directors shall meet at least once a year without the presence of the CEO and twice a year with the presence of our independent auditors. Historically, our Board of Directors meets once per month and when called by a majority of the directors or the Chairman. Among other duties, our Board of Directors is responsible for: (i) establishing our business guidelines; (ii) determining the corporate organization of our subsidiaries or any equity participation by us in other legal entities; (iii) determining our loans and financing policy; and (iv) approving any guarantee in favor of any of our subsidiaries on any financial agreement. Directors cannot participate in discussions or vote in relation to matters in which they are otherwise interested.
Our Board of Executive Officers ordinarily meets every week, or when called by a majority of the officers or by the President. Our Board of Executive Officers determines our general business policy, is responsible for all matters related to our day-to-day management and operations, and is the highest controlling body with regards to the execution of our guidelines. Members of our Board of Executive Officers cannot participate in discussions or vote in relation to matters in which they are otherwise interested.
The Fiscal Council meets once per month.
Disclosure Obligations
Our disclosure obligations are determined by theManual de Divulgação e Uso de Informações Relevantes e Política de Negociação de Valores Mobiliários de Emissão da Eletrobras (Guide to Disclosure and Use of Relevant Information and Policy for the Negotiation of Securities issued by Eletrobras), a copy of which is available on our website. Information found at this website is not incorporated by reference into this annual report.
- 111 -
Table of Contents
C. Material Contracts
Our Itaipu operations are made pursuant to a treaty entered into on April 26, 1973 between the Brazilian Government and the government of Paraguay. A translation of this treaty is included as an exhibit to this annual report. The material terms of this treaty are described in “Item 5. Operating and Financial Review and Prospects.”
D. Exchange Controls
The right to convert dividend or interest payments and proceeds from the sale of shares into foreign currency and to remit such amounts outside Brazil is subject to restrictions under foreign investment legislation which generally requires, among other things, that the relevant investments have been registered with the Central Bank and the CVM. Such restrictions on the remittance of foreign capital abroad may hinder or prevent the custodian for our preferred shares represented by our ADSs or the holders of our preferred shares from converting dividends, distributions or the proceeds from any sale of these preferred shares into U.S. dollars and remitting the U.S. dollars abroad. Holders of our ADSs could be adversely affected by delays in, or refusal to grant any, required government approval to convert Brazilian currency payments on the preferred shares underlying our ADS and to remit the proceeds abroad.
Resolution No. 1,927 of the National Monetary Council provides for the issuance of depositary receipts in foreign markets in respect of shares of Brazilian issuers. It restates and amends Annex V to Resolution No. 1,289 of the National Monetary Council, known as the Annex V Regulations. The ADS program was approved under the Annex V Regulations by the Central Bank and the CVM prior to the issuance of the ADSs. Accordingly, the proceeds from the sale of ADSs by ADR holders outside Brazil are free of Brazilian foreign investment controls, and holders of the ADSs are entitled to favorable tax treatment. See “Item 10.E, Taxation – Material Brazilian Tax Considerations.”
Under Resolution No. 2,689 of the CMN, foreign investors registered with the CVM may buy and sell Brazilian securities, including our preferred shares, on Brazilian stock exchanges without obtaining separate certificates of registration for each transaction. Registration is available to qualified foreign investors, which principally include foreign financial institutions, insurance companies, pension and investment funds, charitable foreign institutions and other institutions that meet certain minimum capital and other requirements. Resolution No. 2,689 also extends favorable tax treatment to registered investors. See “Item 10.E, Taxation – Material Brazilian Tax Considerations.”
Pursuant to the Resolution No. 2,689 foreign investors must: (i) appoint at least one representative in Brazil with the ability to perform actions regarding the foreign investment; (ii) complete the appropriate foreign investor registration form; (iii) obtain registration as a foreign investor with CVM; and (iv) register the foreign investment with the Central Bank.
The securities and other financial assets held by a foreign investor pursuant to Resolution No. 2,689 must be registered or maintained in deposit accounts or under the custody of an entity duly licensed by the Central Bank or by the CVM or be registered in register, clearing and custody systems authorized by the Central Bank or by the CVM. In addition, the trading of securities is restricted to transactions carried out on the stock exchanges or over-the-counter markets licensed by the CVM.
Registered Capital
Amounts invested in our shares by a non-Brazilian holder who qualifies under Resolution No. 2,689 and obtains registration with the CVM, or by the depositary representing an ADS holder, are eligible for registration with the Central Bank. This registration (the amount so registered is referred to as registered capital) allows the remittance outside Brazil of foreign currency, converted at the commercial market rate, acquired with the proceeds of distributions on, and amounts realized through, dispositions of our shares. The registered capital per share purchased in the form of an ADS, or purchased in Brazil and deposited with the depositary in exchange for an ADS, will be equal to its purchase price (stated in U.S. dollars). The registered capital per share withdrawn upon cancellation of an ADS will be the U.S. dollar equivalent of: (i) the average price of a share on the Brazilian stock exchange on which the most shares were traded on the day of withdrawal or; (ii) if no shares were traded on that day, the average price on the Brazilian stock exchange on which the most shares were traded in the fifteen trading sessions immediately preceding such withdrawal. The U.S. dollar equivalent will be determined on the basis of the average commercial market rates quoted by the Central Bank on these dates.
A non-Brazilian holder of shares may experience delays in effecting Central Bank registration, which may delay remittances abroad. This delay may adversely affect the amount in U.S. dollars, received by the non-Brazilian holder.
A certificate of registration has been issued in the name of the depositary with respect to the ADSs and is maintained by the custodian on behalf of the depositary. Pursuant to the certificate of registration, the custodian and the depositary are able to convert dividends and other distributions with respect to the shares represented by our ADSs into foreign currency and remit the proceeds outside Brazil. In the event that a holder of ADSs exchanges such ADSs for shares, such holder will be entitled to continue to rely on the depositary’s certificate of registration for five business days after such exchange,
- 112 -
Table of Contents
following which such holder must seek to obtain its own certificate of registration with the Central Bank. Thereafter, any holder of shares may not be able to convert into foreign currency and remit outside Brazil the proceeds from the disposition of, or distributions with respect to, such shares, unless the holder is a duly qualified investor under Resolution No. 2,689 or obtains its own certificate of registration. A holder that obtains a certificate of registration will be subject to less favorable Brazilian tax treatment than a holder of ADSs. See “Item 10.E, Taxation – Material Brazilian Tax Considerations.”
If the holder does not qualify under Resolution No. 2,689 by registering with the CVM and the Central Bank and appointing a representative in Brazil, the holder will be subject to less favorable Brazilian tax treatment than a holder of ADSs. Regardless of qualification under Resolution No. 2,689, residents in tax havens are subject to less favorable tax treatment than other foreign investors. See “Item 10.E, Taxation – Material Brazilian Tax Considerations.”
Under current Brazilian legislation, the Brazilian Government may impose temporary restrictions on remittances of foreign capital abroad in the event of a serious imbalance or an anticipated serious imbalance of Brazil’s balance of payments. For approximately six months in 1989 and early 1990, the Brazilian Government froze all dividend and capital repatriations held by the Central Bank that were owed to foreign equity investors, in order to conserve Brazil’s foreign currency reserves. These amounts were subsequently released in accordance with Brazilian Government directives. There can be no assurance that the Brazilian Government will not impose similar restrictions on foreign repatriations in the future. See “Item 3.D, Risk Factors – Risks Relating to Brazil.”
E. Taxation
The following discussion addresses the material Brazilian and United States federal income tax consequences of acquiring, holding and disposing of our shares or ADSs.
This discussion is not a comprehensive discussion of all the tax considerations that may be relevant to a decision to purchase our shares or ADSs and is not applicable to all categories of investors, some of which may be subject to special rules, and does not specifically address all of the Brazilian and United States federal income tax considerations applicable to any particular holder. It is based upon the tax laws of Brazil and the United States as in effect on the date of this annual report, which are subject to change, possibly with retroactive effect, and to differing interpretations. Any change in such law may have an impact on the consequences described below. Each prospective purchaser is urged to consult its own tax advisor about the particular Brazilian and United States federal income tax consequences to it of an investment in our shares or ADSs. This discussion is also based upon the representations of the depositary and on the assumption that each obligation in the deposit agreement among us, J.P. Morgan Chase Bank, N.A., as depositary, and the registered holders and beneficial owners of our ADSs, and any related documents, will be performed in accordance with its terms.
Although there presently is no income tax treaty between Brazil and the United States, the tax authorities of the two countries have had discussions that may culminate in such a treaty. We cannot assure you, however, as to whether or when a treaty will enter into force or how it will affect holders of our shares or ADSs.
Material Brazilian Tax Considerations
The following discussion is a summary of the material Brazilian tax considerations regarding the acquisition, ownership and disposition of our shares or ADSs by a holder that is not domiciled in Brazil for purposes of Brazilian taxation and which has registered its investment in such securities with the Central Bank as a U.S. dollar investment (in each case, a Non-Resident Holder). The tax consequences described below do not take into account the effects of any tax treaties or reciprocity of tax treatment entered into by Brazil and other countries. The discussion also does not address any tax consequences under the tax laws of any state or municipality of Brazil.
Introduction
Pursuant to Brazilian law, foreign investors may invest in the shares under Central Bank Resolution No. 2,689.
Resolution No. 2,689 allows foreign investors to invest in Brazilian financial and capital markets, provided that some requirements therein described are fulfilled. In accordance with Resolution No. 2,689, the definition of foreign investor includes individuals, legal entities, mutual funds and other collective investment entities, domiciled or headquartered abroad.
Pursuant to Resolution No. 2,689, foreign investors must: (i) appoint at least one representative in Brazil with powers to perform actions relating to the foreign investment; (ii) complete the appropriate foreign investor registration form; (iii) register as a foreign investor with the CVM and register the foreign investment with the Central Bank; (iv) appoint a representative in Brazil for Taxation purposes; and (v) obtain a taxpayer identification number from the Brazilian Federal Tax Authorities (which will be requested by CVM). For more details about the requirements to be met in order to qualify as foreign investor under Resolution No. 2,689, see “Item 9.C, Markets – Investment in our Preferred Shares by Non-Residents of Brazil.”
- 113 -
Table of Contents
Securities and other financial assets held by foreign investors pursuant to Resolution No. 2,689 must be registered or maintained in deposit accounts or under the custody of an entity duly licensed by the Central Bank or the CVM. In addition, securities trading is restricted to transactions carried out in the stock exchanges or organized over-the-counter markets licensed by the CVM, except for transfers resulting from a corporate reorganization, occurring upon the death of an investor by operation of law or will or as a consequence of the delisting of the relevant shares from a stock exchange and the cancellation of the registration with the CVM.
Income tax
For purposes of Brazilian taxation, there are two types of Non-Resident Holders of our shares or ADSs: (i) Non-Resident Holders that are not resident or domiciled in a “Tax Haven” jurisdiction (i.e., a country or location that does not impose income tax or where the maximum income tax rate is lower than 20% or where the internal legislation imposes restrictions to disclosure of shareholding composition or the ownership of the investment), and that, in the case of holders of our shares, are registered before the Central Bank and the CVM being able to invest in Brazil in accordance with Resolution No. 2,689 (“Registered Holder”); and (ii) other Non-Resident Holders, which include any and all non-residents of Brazil who invest in equity securities of Brazilian companies through any other means and all types of investor that are located in Tax Haven. The investors mentioned in item (i) above which are registered with the Central Bank and the CVM being able to invest in Brazil in accordance with Resolution No. 2,689, are subject to a favorable tax regime in Brazil, as described below. Nonetheless, there can be no assurance that the current preferential treatment for holders of ADSs and Non-Resident Holders of preferred or common shares under Resolution No. 2,689 will continue or will not be changed in the future.
Dividends. Historically, dividends paid by a Brazilian company, such as ourselves, including dividends paid to aNon-Resident Holder, were not subject to income tax withholding in Brazil, to the extent that such amounts were related to profits generated as of January 1, 1996.
However, although controversial, the tax authorities recently issued Normative Instruction n. 1,397/2013 (IN 1,397) providing that tax-free dividends should be calculated and paid out based on the generally accepted accounting principles in force in Brazil on December 31, 2007, that is, before the introduction of the new accounting standards in Brazil in convergence to IFRS (Brazilian GAAP). Dividends paid to Non-Resident Holders in excess to the amount calculated under such criteria should be subject to income tax withholding at a rate of 15.0% (general rule) or 25.0% (in case the beneficiary is located in a “Tax Haven” jurisdiction).
In November 2013, Provisional Measure n. 627 (MP 627) was enacted, providing that Brazilian GAAP will only prevail for tax purposes until 2014 (mandatory) or until 2013 (for taxpayers who decide do enact the provisions of MP 627, as of January 1, 2014). As a result of MP 627, two scenarios are possible regarding the distribution of dividends:
(i) taxpayers who chose to recognize the effects of MP 627 for the year of 2014 will not be subject to income tax withholding on the amount of dividends paid in excess to the calculation criteria for the period between 2008 and November 12, 2013, the date that MP 627 was enacted; and,
(ii) taxpayers who chose not to recognize the effects of MP 627 for the year of 2014 will be obliged to withhold and collect the income tax on dividends in excess of the dividends distributed in the period from 2008 until 2014 (pursuant to IN 1,397).
In any case, dividends distributed as of 2015 (for taxpayers who choose not to follow MP 627 as of January 1, 2014) or as of 2014 (for taxpayers who chose to implement MP 627 as of January 1, 2014) shall not be subject to income tax withholding, as MP 627 establishes that the accounting standards in line with IFRS would be also applicable for tax purposes, and, therefore, there will be no difference between the dividends to be distributed for accounting and tax purposes. Accordingly, dividends paid during 2014 (if we do not elect to apply the provisions of MP 627 as of January 1, 2014) to Non-Resident Holders, in excess to those calculated under the Brazilian GAAP, shall be subject to the imposition of income tax withholding at a rate of 15% or 25% (as explained above). On the other hand, starting from 2015 or if we decide to apply the provisions of MP 627 as starting as of January 1, 2014, such taxation shall not be applicable.
- 114 -
Table of Contents
Considering the impact of IN 1,397 on the taxation of dividends payments, and other discussions regarding its legality, especially in light of the recent enactment of MP 627, such instruction may be subject to further changes or may be revoked by Brazilian tax authorities.
A Provisional Measure is a presidential act with the power of law enacted under urgent or relevant circumstances and it is effective as of the date of its enactment. Notwithstanding, the Brazilian National Congress must vote it within 60 days or it will lose its effectiveness. If the National Congress does not vote the Provisional Measure within 45 days of its publication, the voting will become urgent and the Congress will be prevented from voting other matters, except those with a constitutional term for voting. The 60-day term may be renewed once, if the Provisional Measure is not voted. If the Provisional Measure is accepted by the National Congress, it becomes a federal law, with legal effects as of the date the Provisional Measure was enacted.
Capital Gains. As a general rule, capital gains realized as a result of a disposition transaction are the positive difference between the amount received on the disposition of the units and the respective acquisition cost. Under Brazilian law, income tax on such gains can vary depending on the domicile of the Non-Resident Holder, the type of registration of the investment by the Non-Resident Holder with the Central Bank and how the disposition is carried out, as described below.
(a) Sale of ADS
Gains realized outside Brazil by a Non-Resident Holder on the disposition of ADSs to another Non-Resident Holder should not be subject to Brazilian tax. However, according to Law No. 10,833, enacted on December 29, 2003, or Law No. 10,833, gains recognized on the disposition of assets located in Brazil by a Non-Resident Holder, whether to other Non-Resident Holders or Brazilian holders, are subject to taxation in Brazil. This rule is applicable regardless of whether the disposition is conducted in Brazil or abroad. Although we believe that the ADSs do not fall within the definition of assets located in Brazil for purposes of Law No. 10,833 because they represent securities issued and renegotiated in an offshore exchange market, considering the general and unclear scope of such provisions, as well as the lack of a judicial court ruling in respect thereto, we are unable to predict whether such understanding will ultimately prevail in the courts of Brazil. It is important to note, however, that even if ADSs were considered assets located in Brazil, investors which are resident in non-Tax Haven locations could apply for exemption of capital gain tax according to article 81 of Law No. 8,981/95.
If such argument does not prevail, it is important to mention that with respect to the cost of acquisition to be adopted for calculating such gains, Brazilian law has conflicting provisions regarding the currency in which such amount must be determined. Our view is that the capital gains should be based on the positive difference between the cost of acquisition of the preferred shares or common shares registered with the Brazilian Central Bank in foreign currency and the value of disposal of those preferred shares or common shares in the same foreign currency. However, considering that tax authorities are not bound by such precedent, assessments have been issued adopting the cost of acquisition in Brazilian currency.
(b) Conversion of shares into ADS
The deposit of our shares in exchange for ADSs may be subject to Brazilian tax on capital gains at the rate of 15%, or 25%, in the case of investors domiciled in a Tax Haven, if the acquisition cost of the shares, in the case of other market investors under Resolution No.2,689, or the amount otherwise previously registered with the Central Bank as a foreign investment in the preferred or common shares is lower than:
| (i) | the average price per preferred or common share on a Brazilian stock exchange on which the greatest number of such shares were sold on the day of deposit; or |
| (ii) | if no preferred or common shares were sold on that day, the average price on the Brazilian stock exchange on which the greatest number of preferred or common shares were sold in the 15 trading sessions immediately preceding such deposit. |
In such case, the difference between the amount previously registered, or the acquisition cost, as the case may be, and the average price of the shares calculated as set forth above will be considered to be a capital gain. Although there is no clear regulatory guidance, such taxation should not apply to the case of Non-Resident Holders registered under Resolution No. 2,689 which are not located in a Tax Haven.
(c) Conversion of ADS into shares
Although there is no clear regulatory guidance, the exchange of ADSs for shares should not be subject to Brazilian tax. Non-Resident Holders may exchange ADSs for the underlying shares, sell the shares on a Brazilian stock exchange and remit abroad the proceeds of the sale within five business days from the date of exchange (in reliance on the depositary’s electronic registration), with no tax consequences.
- 115 -
Table of Contents
Upon receipt of the underlying shares in exchange for ADSs, Non-Resident Holders may also elect to register with the Central Bank the U.S. dollar value of such shares as a foreign portfolio investment under Resolution No. 2,689, which will entitle them to the tax treatment referred above.
Alternatively, the Non-Resident Holder is also entitled to register with the Central Bank the U.S. dollar value of such shares as a foreign direct investment under Law 4,131/62, in which case the respective sale would be subject to the tax treatment applicable to transactions carried out of by a Non-Resident Holder that is not a registered holder.
(d) Common and Preferred shares negotiated in Brazil
Capital gains realized by Non-Resident Holder on the disposition of shares sold on the Brazilian stock exchange (which includes the transactions carried out on the organized over-the-counter market):
| • | are subject to the withholding income tax at a zero percent rate, when realized by a Non-Resident Holder that (a) has registered its investment in Brazil before the Central Bank. (a Registered Holder under the regulations of Resolution 2,689); and (b) is not resident in a Tax Haven; and |
| • | are subject to income tax at a rate of 15% with respect to gains realized by a Non-Resident Holder that is not a Registered Holder (including a Non-Resident Holder who qualifies under Law 4,131/62) and gains earned by Tax Haven residents that are Registered Holders. In this case, a withholding income tax of 0.005% over the sale price shall be applicable and withheld by the intermediary institution (i.e., a broker) that receives the order directly from the Non-Resident Holder, which and can be later offset against any income tax due on the capital gain and which will be collected by the Non-Resident Holder’s tax representative in Brazil. |
Any other gains realized on the disposition of units that are not carried out on the Brazilian stock exchange:
| • | are subject to income tax at a rate of 15% when realized by any Non-Resident Holder that is not a Tax Haven resident, no matter if a Registered Holder or not; and |
| • | are subject to income tax at a rate of 25% when realized by a Tax Haven resident, no matter if a Registered Holder or not. |
In the cases above, if the gains are related to transactions conducted on the Brazilian non-organized over-the-counter market with intermediation, the withholding income tax of 0.005% shall also be applicable and withheld by the intermediary institution (i.e., a broker) that receives the order directly from the Non-Resident Holder, which can be later offset against any income tax due on the capital gain and which will be collected by the Non-Resident Holder’s tax representative in Brazil. The Non-Resident Holder will not need to file a Brazilian tax return with the Brazilian tax authorities.
Any exercise of preemptive rights relating to the preferred or common shares or ADSs will not be subject to Brazilian withholding income tax. Any gain on the sale or assignment of preemptive rights relating to shares by the depositary on behalf of holders of ADSs will be subject to Brazilian income taxation according to the same rules applicable to the sale or disposal of shares.
Payments of Interest Attributable to Shareholders’ Equity. In accordance with Law No. 9,249, dated December 26, 1995, as amended, Brazilian corporations may make payments to shareholders characterized as distributions of interest on own capital and treat those payments as a deductible expense for the purposes of calculating Brazilian corporate income tax and, as from 1997, social contribution on net profits, as far as certain limits are observed. Such interest is limited to the dailypro rata variation of the TJLP as determined by the Central Bank from time to time and the amount of deduction cannot exceed the greater of:
| • | 50% of the net income (after the social contribution on net profits and before the provision for corporate income tax, and the amounts attributable to shareholders as interest on net equity) for the period in respect of which the payment is made; or |
| • | 50% of the sum of retained profits and profits reserves as of the date of the beginning of the period in respect of which the payment is made. |
Payments of interest on own capital in respect of the preferred or common shares paid to shareholders who are either Brazilian residents or Non-Resident Residents, including holders of ADSs, are subject to Brazilian income withholding tax at the rate of 15%, or 25% in case of shareholders domiciled in a Tax Haven and shall be deductible by us as long as the payment of a distribution of interest is approved by our shareholders. Although controversial, the Brazilian tax authorities
- 116 -
Table of Contents
have adopted the understanding that interest on shareholders’ equity should be calculated and paid out based on the generally accepted accounting principles in force in Brazil on December 31, 2007, that is, before the introduction of the new accounting standards in Brazil in convergence to IFRS (Brazilian GAAP). See “Income Tax - Dividends” above.
These distributions may be included, at their net value, as part of any mandatory dividend. To the extent payment of interest on shareholders’ equity is so included, the corporation is required to distribute to shareholders an additional amount to ensure that the net amount received by them, after payment of the applicable Brazilian withholding income tax, plus the amount of declared dividends, is at least equal to the mandatory dividend. If we pay interest attributable to shareholders’ equity in any year, and the payment is not recorded as part of the mandatory distribution, no additional amounts would be required to be paid by the Company, with respect to the mandatory dividend amount. The payment of interest on owner capital may be determined by our board of directors. We cannot assure you that our board of directors will not determine that future distributions of profits may be made by means of interest on owner capital instead of by means of dividends. Payments of interest on shareholder’s equity to Non-Resident Holders may be converted into U.S. dollars and remitted outside Brazil, subject to applicable exchange controls, to the extent that the investment is registered with the Central Bank.
Discussion on Low or Nil Tax Jurisdictions
On June 24, 2008, Law 11,727 was enacted establishing the concept of a “privileged tax regime.” Under this new law, a “privileged tax regime” is considered to apply to a jurisdiction that meets any of the following requirements: (1) it does not tax income or taxes income at a maximum rate lower than 20%; (2) it grants tax advantages to a non-resident entity or individual (a) without requiring substantial economic activity in the jurisdiction of such non-resident entity or individual or (b) to the extent such non-resident entity or individual does not conduct substantial economic activity in the jurisdiction of such non-resident entity or individual; (3) it does not tax income generated abroad, or imposes tax on income generated abroad at a maximum rate lower than 20%; or (4) restricts the ownership disclosure of assets and ownership rights or restricts disclosure about the execution of economic transactions.
Although the interpretation of the current Brazilian tax legislation could lead to the conclusion that the above-mentioned concept of “privileged tax regime” should apply only for the purposes of Brazilian transfer pricing and thin capitalization rules, it is unclear whether such concept would also apply to investments carried out in the Brazilian financial and capital markets for purposes of this law. There is no judicial guidance as to the application of Law No. 11,727 of June 24, 2008 and, accordingly, we are unable to predict whether the Brazilian Internal Revenue Service or the Brazilian courts may decide that the “privileged tax regime” concept shall be applicable to deem a Non-Resident Holder as a Tax Haven resident when carrying out investments in the Brazilian financial and capital markets. In the event that the “privileged tax regime” concept is interpreted to be applicable to transactions carried out in the Brazilian financial and capital markets, this tax law would accordingly result in the imposition of taxation on a Non-Resident Holder that meets the privileged tax regime requirements in the same manner and to the same extent applicable to a Tax Haven resident.
Moreover, Law No. 12,249 of June 11, 2010, applied the privileged tax regime concept to other income remitted abroad. Although the concept of privileged tax regime should not affect the tax treatment of a Non-Resident Holder described above, it is not certain whether subsequent legislation or interpretations by the Brazilian tax authorities regarding the definition of “privileged tax regime” will extend such a concept to the tax treatment of a Non-Resident Holder described above.
Tax on Foreign Exchange and Financial Transactions
Foreign Exchange Transactions (IOF/Exchange)
Brazilian law imposes a Tax on Foreign Exchange Transactions, or “IOF/Exchange,” triggered by the conversion ofreais into foreign currency and on the conversion of foreign currency intoreais.
Pursuant to Decree No. 6,306/07, as amended, IOF/Exchange may be levied on foreign exchange transactions, affecting either or both the inflow or outflow of investments. The IOF rates are set by the Brazilian executive branch, and the highest applicable rate is 25%. Currently, for most exchange transactions, the rate of IOF/Exchange is 0.38%.
The rate of IOF/Exchange tax imposed on foreign exchange transactions carried out by a foreign investor for the purpose of investing in the financial and capital markets may vary from time to time as defined by the government and the rates may be different based on the type of investment as well as the time in which such investment is maintained in Brazil.
The inflow of foreign funds for the purchase of shares under Resolution No. 2,689 is subject to 0% IOF/Exchange rate and the same 0% rate levies on the remittance of dividends and payments of interest on shareholder’s equity. Although it is not clearly regulated, the conversion ofreais into dollars for payment of dividends to holders of ADSs should also benefit from the 0% IOF/Exchange rate. The inflow of funds derived from the ADS cancelation for purposes of investing in shares is also subject to a 0% rate of IOF/Exchange.
- 117 -
Table of Contents
Tax on Transactions involving Bonds and Securities (IOF/Bonds Tax)
Brazilian law imposes a Tax on Transactions Involving Bonds and Securities, known as “IOF/Bonds Tax.” Currently, the rate of IOF/Bonds Tax applicable to transactions involving common or preferred shares is zero, although the Brazilian government may increase such rate at any time, up to 1.5% per day, but only in respect to future transactions.
The conversion of shares into ADRs or shares into ADSs was not taxable before November 17, 2009. Following the enactment of Decree No. 7,011 of November 18, 2009, these transactions started to be taxed by the IOF/Bonds Tax at the rate of 1.5% over the transaction value (obtained by multiplying the number of shares/units converted by its closing price at the day before the conversion, or, in the case no negotiation was made on that day, by the last closing price available). However, in view of a recent change in the applicable legislation, starting as of December 24, 2013, the rate was reduced to 0%.
Other Relevant Brazilian Taxes
Some Brazilian states impose gift and inheritance tax on gifts or bequests made by individuals or entities not domiciled or residing in Brazil to individuals or entities domiciled or residing within such states. There are no Brazilian stamp, issue, registration or similar taxes or duties payable by holders of our shares or ADSs.
Registered Capital. The amount of an investment in shares held by a Non-Brazilian Holder who qualifies under Resolution No. 2,689 and obtains registration with the CVM, or by the depositary, as the depositary representing such holder, is eligible for registration with the Central Bank. Such registration allows the remittance outside of Brazil of any proceeds of distributions on the shares, and amounts realized with respect to disposition of such shares. The amounts received in Brazilian currency are converted into foreign currency through the use of the commercial market rate. The registered capital for preferred or common shares purchased in the form of ADSs or purchased in Brazil, and deposited with the depositary in exchange for ADSs will be equal to their purchase price (in U.S. dollars) to the purchaser. The registered capital for shares that are withdrawn upon surrender of ADSs, as applicable, will be the U.S. dollar equivalent of the average price of preferred or common shares, as applicable, on a Brazilian stock exchange on which the greatest number of such shares, as applicable, was sold on the day of withdrawal. If no preferred or common shares, as applicable, were sold on such day, the registered capital will refer to the average price on the Brazilian stock exchange on which the greatest number of such shares, as applicable, was sold in the 15 trading sessions immediately preceding such withdrawal. The U.S. dollar value of the preferred or common shares, as applicable, is determined on the basis of the average commercial market rate quoted by the Central Bank on such date or, if the average price of such shares is determined under the last preceding sentence, the average of such average quoted rates on the same 15 dates used to determine the average price of the shares.
A Non-Resident Holder of our shares may experience delays in effecting such action, which may delay remittances abroad. Such a delay may adversely affect the amount, in U.S. dollars, received by the Non-Resident Holder.
Material United States Federal Income Tax Consequences
The following discussion describes the material United States federal income tax consequences of purchasing, holding and disposing of our shares or ADSs. This discussion applies only to beneficial owners of our ADSs or shares that are “U.S. Holders,” as defined below. This discussion is based on the U.S. Internal Revenue Code of 1986, as amended, or the Code, its legislative history, existing final, temporary and proposed Treasury Regulations, administrative pronouncements by the United States Internal Revenue Service, or IRS, and judicial decisions, all as currently in effect and all of which are subject to change (possibly on a retroactive basis) and to different interpretations. This discussion is also based upon the representations of the depositary and on the assumption that each obligation in the deposit agreement among us, J.P. Morgan Chase Bank, N.A., as depositary, and the registered holders and beneficial owners of our ADSs, and any related documents, will be performed in accordance with its terms.
This discussion does not purport to address all United States federal income tax consequences that may be relevant to a particular holder and you are urged to consult your own tax advisor regarding your specific tax situation. The discussion applies only to U.S. Holders who hold our shares or ADSs as “capital assets” (generally, property held for investment) under the Code and does not address the tax consequences that may be relevant to U.S. Holders in special tax situations including, for example:
| • | financial institutions or insurance companies; |
| • | tax-exempt organizations; |
| • | broker-dealers; |
| • | traders in securities that elect to mark to market; |
- 118 -
Table of Contents
| • | real estate investments trusts, regulated investment companies, partnership or grantor trusts; |
| • | investors whose functional currency is not the United States dollar; |
| • | United States expatriates; |
| • | holders that hold our shares or ADSs as part of a hedge, straddle or conversion transaction; or |
| • | holders that own, directly, indirectly, or constructively, 10% or more of the total combined voting power, if any, of our shares or ADSs. |
Except where specifically described below, this discussion assumes that we are not a passive foreign investment company, or PFIC, for United States federal income tax purposes. Please see the discussion in “Item 10. E, Taxation – Material United States Federal Income Tax Consequences – Passive Foreign Investment Company Rules” below. Further, this discussion does not address the alternative minimum tax consequences of holding our shares or ADSs or the indirect consequences to holders of equity interests in partnerships or other entities that own our shares or ADSs. In addition, this discussion does not address the state, local and non-U.S. tax consequences of holding our shares or ADSs.
You should consult your own tax advisor regarding the United States federal, state, local and non-U.S. income and other tax consequences of purchasing, owning, and disposing of our shares or ADSs in your particular circumstances.
You are a “U.S. Holder” if you are a beneficial owner of shares or ADSs and you are for United States federal income tax purposes:
| • | an individual who is a citizen or resident of the United States; |
| • | a corporation, or any other entity taxable as a corporation, created or organized in or under the laws of the United States, any state thereof, or the District of Columbia; |
| • | an estate the income of which is subject to United States federal income tax regardless of its source; or |
| • | a trust if a court within the United States is able to exercise primary supervision over its administration and one or more United States persons have the authority to control all substantial decisions of the trust. |
If a partnership holds shares or ADSs, the tax treatment of a partner will generally depend upon the status of the partner and upon the activities of the partnership. A prospective investor who is a partner of a partnership holding our shares or ADSs should consult its own tax advisor.
Ownership of ADSs in General
For United States federal income tax purposes, if you are a holder of ADSs, you generally will be treated as the owner of the shares represented by such ADSs. Deposits and withdrawals of shares by a U.S. Holder in exchange for ADSs generally will not result in the realization of gain or loss for United States federal income tax purposes.
The U.S. Treasury has expressed concerns that parties to whom receipts similar to the ADSs are released may be taking actions that are inconsistent with the claiming of foreign tax credits by U.S. Holders of ADSs and that would also be inconsistent with the claiming of the reduced tax rate described below applicable to dividends received by certain non-corporate U.S. Holders. Accordingly, the analysis of the creditability of Brazilian taxes and the availability of the reduced rate for dividends received by certain non-corporate holders could be affected by actions taken by parties to whom the ADSs are released.
Distributions on Shares or ADSs
The gross amount of distributions made to you of cash or property with respect to your shares or ADSs, before reduction for any Brazilian taxes withheld therefrom, will be includible in your income as dividend income to the extent such distributions are paid out of our current or accumulated earnings and profits as determined under United States federal income tax principles. Such dividends will not be eligible for the dividends received deduction generally allowed to corporate U.S. Holders. Subject to applicable limitations, including holding period limitations, and the discussion above regarding concerns expressed by the U.S. Treasury, dividends paid to non-corporate U.S. Holders of ADSs in taxable years beginning before January 1, 2013, are taxable at a maximum rate of 15.0% and dividends paid to non-corporate U.S. Holders of ADSs in later taxable years will be taxable at a maximum rate of 20.0%. U.S. Holders, in particular U.S. Holders of shares, should consult their own tax advisors regarding the implications of this legislation in their particular circumstances.
If you are a U.S. Holder, and we pay a dividend in Brazilianreais, any such dividend will be included in your gross income in an amount equal to the U.S. dollar value of Brazilianreais on the date of receipt by you or, in the case of ADSs, the depositary, regardless of whether or when the payment is in fact converted into U.S. dollars. If the dividend is converted into U.S. dollars on the date of receipt, a U.S. Holder generally should not be required to recognize foreign currency gain or loss in respect of the dividend income.
- 119 -
Table of Contents
If you are a U.S. Holder, dividends paid to you with respect to your shares or ADSs will be treated as foreign source income, which may be relevant in calculating your foreign tax credit limitation. Subject to certain conditions and limitations, Brazilian tax withheld on dividends may be credited against your U.S. federal income tax liability. Instead of claiming a credit, you may, at your election, deduct such otherwise creditable Brazilian taxes in computing your taxable income, subject to generally applicable limitations under U.S. law. The rules governing foreign tax credits and deductions for non-U.S. taxes are complex and, therefore, you should consult your own tax advisor regarding the applicability of these rules in your particular circumstances.
Sale or Exchange or other Taxable Disposition of Shares or ADSs
A U.S. Holder generally will recognize capital gain or loss upon the sale, exchange or other taxable disposition of our shares or ADSs measured by the difference between the U.S. dollar value of the amount realized and the U.S. Holder’s adjusted tax basis in the shares or ADSs. Any gain or loss will be long-term capital gain or loss if the shares or ADSs have been held for more than one year. Long-term capital gains of certain U.S. holders (including individuals) are eligible for reduced rates of United States federal income taxation. The deductibility of capital losses is subject to certain limitations under the Code.
If a Brazilian tax is withheld on the sale or other disposition of a share or ADS, the amount realized by a U.S. Holder will include the gross amount of the proceeds of that sale or other disposition before deduction of the Brazilian tax. Capital gain or loss, if any, realized by a U.S. Holder on the sale, exchange or other taxable disposition of a share or ADS generally will be treated as United States source income or loss for United States foreign tax credit purposes. Consequently, in the case of a disposition of a share that is subject to Brazilian tax imposed on the gain (or, in the case of a deposit, in exchange for an ADS or share, as the case may be, that is not registered pursuant to Resolution No. 2,689, on which a Brazilian capital gains tax is imposed), the U.S. Holder may not be able to benefit from the foreign tax credit for that Brazilian tax unless the U.S. Holder can apply the credit against United States federal income tax payable on other income from non-U.S. sources in the appropriate income category. Alternatively, the U.S. Holder may take a deduction for the Brazilian tax if it does not elect to claim a foreign tax credit for any non-U.S. taxes paid during the taxable year.
Passive Foreign Investment Company Rules
In general, a non-U.S. corporation is a PFIC with respect to a U.S. Holder if, for any taxable year in which the U.S. Holder holds stock in the non-U.S. corporation, at least 75% of its gross income is passive income or at least 50% of the value of its assets (determined on the basis of a quarterly average) produce passive income or are held for the production of passive income. For this purpose, passive income generally includes, among other things, dividends, interest, rents, royalties and gains from the disposition of investment assets (subject to various exceptions). Based upon the nature of our current and projected income, assets and activities, we do not believe the shares or ADSs were for the preceding taxable year nor do we expect them to be, shares of a PFIC for United States federal income tax purposes. However, the determination of whether the shares or ADSs constitute shares of a PFIC is a factual determination made annually and thus may be subject to change. Because these determinations are based on the nature of our income and assets from time to time, as well as certain items that are not directly in our control, such as the value of our shares and ADSs and involve the application of complex tax rules the application of which to our business is not always entirely clear, no assurances can be provided that we will not be considered a PFIC for the current or any past or future tax year.
If we are treated as a PFIC for any taxable year during which you are a U.S. Holder, various adverse consequences could apply to you. Neither gains nor dividends would be subject to the reduced tax rates discussed above that are applicable in certain situations. Rather, gain recognized by you on a sale or other disposition of the shares or ADSs would be allocated ratably over your period for the shares or ADSs. The amounts allocated to the taxable year of the sale or disposition and to any year before we became a PFIC would be taxed as ordinary income. The amount allocated to each other taxable year would be subject to tax at the highest rate in effect for individuals or corporations, as appropriate, and an interest charge would be imposed on such tax as if it had not been paid from the original due date for your tax return for such year. Further, any distribution in respect of shares or ADSs in excess of 125 percent of the average of the annual distributions on shares or ADSs received by you during the preceding three years or, if shorter, your holding period would be subject to taxation as described above. Certain elections may be available (including a mark to market election) to U.S. persons that may mitigate the adverse consequences resulting from PFIC status. In any case, you would be subject to additional U.S. tax form filing requirements.
- 120 -
Table of Contents
Backup Withholding and Information Reporting
In general, dividends on our shares or ADSs, and payments of the proceeds of a sale, exchange or other disposition of shares or ADSs, paid within the United States or through certain United States-related financial intermediaries to a U.S. Holder are subject to information reporting and may be subject to backup withholding at a current maximum rate of 28% unless the holder: (i) establishes, if required to do so, that it is an exempt recipient; or (ii) in the case of backup withholding, provides an accurate taxpayer identification number and certifies that it is a U.S. person and has not lost its exemption from backup withholding has occurred.
You can credit amounts withheld under these rules against your United States Federal income tax liability, or obtain a refund of such amounts that exceed your United States Federal income tax liability,provided that the required information is furnished to the IRS.
Recent legislation has introduced new reporting requirements for certain U.S. Holders. The penalty for failing to comply with these, or existing, reporting requirements can be significant. You should consult their own tax advisors concerning any U.S. reporting requirements that may arise out of their ownership or disposition of ADSs or shares in light of your particular circumstances.
F. Dividends and Paying Agents
Not applicable.
G. Statement by Experts
Not applicable.
H. Documents on Display
Statements contained in this annual report regarding the contents of any contract or other document are complete in all material respects, however, where the contract or other document is an exhibit to this annual report, each of these statements is qualified in all respects by the provisions of the actual contract or other documents.
We are subject to the informational requirements of the Exchange Act applicable to a foreign private issuer. Accordingly, we will be required to file reports and other information with the SEC, including annual reports on Form 20-F and reports on Form 6-K. You may inspect reports and copy reports and other information filed with or furnished to the SEC at the SEC’s Public Reference Room located at 100 F Street, N.E., Washington, D.C. 20549. For further information, call the SEC at 1-800-SEC-0330. In addition, the SEC maintains an internet website that contains filings, reports and other information regarding issuers who, like us, file electronically with the SEC. The address of that website is http://www.sec.gov.
As a foreign private issuer, we are exempt under the Exchange Act from, among other things, the rules prescribing the furnishing and content of proxy statements, and members of our Board of Directors and Board of Executive Officers and our principal shareholders are exempt from reporting and short-swing profit recovery provisions contained in Section 16 of the Exchange Act. In addition, as a foreign private issuer, we will not be required under the Exchange Act to file periodic reports and consolidated financial statements with the SEC as frequently or as promptly as U.S. companies whose securities are registered under the Exchange Act.
We also file periodic reports and consolidated financial statements with the CVM, located at Rua Sete de Setembro, 111, Rio de Janeiro, Rio de Janeiro 20159-900, Brazil.
I. Subsidiary Information
Not applicable.
ITEM 11. QUANTITATIVE AND QUALITATIVE DISCLOSURES ABOUT MARKET RISK
The risks inherent in our market sensitive instruments are potential losses that may arise from adverse changes to interest rates and/or foreign exchange rates. We are subject to market risk resulting from changes in interest rates because such changes may affect the cost at which we obtain financing. We are subject to exchange rate risk with respect to our debt denominated in foreign currencies.
- 121 -
Table of Contents
Interest Rate Risks
Apart from loans in the total amount of R$3,219 million linked to the LIBOR rate and R$203 million linked to the BID rate, we do not have any debt that is directly linked to variable interest rates. As of December 31, 2013, we had R$21,396 million of indebtedness that was indexed to the IGP-M. Variations in interest rates may impact inflation and, accordingly, we are indirectly subject to changes in interest rates that may increase the cost of financing.
As of December 31, 2013, 65.88% of our total indebtedness of R$32,477 million denominated in reais was indexed to the IGP-M or other inflation indices. As a result, our exposure to Brazilian inflation risk was R$21,396 million as of December 31, 2013. Each 1.0% variation in the IGP-M rate or any other inflation index would have an impact of R$214 million on our net income.
Exchange Rate Risks
As of December 31, 2013, approximately 34.2% of our total consolidated indebtedness of R$32,477 was denominated in foreign currencies. Of our 2013 foreign currency denominated indebtedness, R$11,080 billion, or approximately 96.3% was denominated in U.S. dollars.
We have a foreign currency exposure affecting our assets and liabilities due to the loans we provide to Itaipu, whose consolidated financial statements are prepared in U.S. dollars. In order to protect ourselves against fluctuations in the U.S. dollar/real exchange rate, our Board of Executive Officers approved the implementation of a hedging policy in July 2007, which was designed to reduce the exposure to these foreign currency variations through the use of derivative contracts.
In 2008, we entered into short term derivative contracts, which expired in December 2008. Since January 1, 2009, we do not have any derivative contracts outstanding and we are not proposing to enter into derivative contracts providing leverage or credit protection. Our general strategy is to focus on protection from currency fluctuations. However, we are considering broadening our hedging policy to cover others market risks, such as interest rates and indices, as well as embedded derivatives.
As a result, our actual exposure to U.S. dollar exchange rate risk was R$11 billion as of December 31, 2013. Each 1.0% variation in the U.S. dollar/Brazilianreal exchange rate would have a negative impact of R$107 million on our net income.
ITEM 12. DESCRIPTION OF SECURITIES OTHER THAN EQUITY SECURITIES
| 12.D. | American Depositary Shares |
Fees payable by the holders of our ADSs
J.P. Morgan Chase Bank, N.A. serves as the depositary for both of our common and preferred ADSs. ADR holders are required to pay various fees to the depositary, and the depositary may refuse to provide any service for which a fee is assessed until the applicable fee has been paid.
ADR holders are required to pay the depositary: (i) an annual fee of U.S.$0.02 per ADS for administering the ADR program and (ii) amounts in respect of expenses incurred by the depositary or its agents on behalf of ADR holders, including expenses arising from compliance with applicable law, taxes or other governmental charges, facsimile transmission, or conversion of foreign currency into U.S. dollars. In both cases, the depositary may decide in its sole discretion to seek payment by either billing holders or by deducting the fee from one or more cash dividends or other cash distributions.
ADR holders are also required to pay additional fees for certain services provided by the depositary, as set forth in the table below:
Depositary Action | Associated fee | |
| Issuance, delivery, reduction, cancellation or surrender of ADSs | U.S.$5.00 per 100 ADSs | |
| Any cash distribution to registered ADS holders | U.S.$0.02 (or less) per ADSs | |
| Transfer rates (to the extent not prohibited by the rules of the primary stock exchange upon which the ADSs are listed) | U.S.$1.50 per ADR or ADRs | |
- 122 -
Table of Contents
Depositary reimbursements
In accordance with the deposit agreement entered between the depositary and us, the depositary reimburses us for certain expenses we incur in connection with the ADR program. From January 1 to December 31, 2013, our depositary bank reimbursed us the amount of U.S.$2.9 million.
PART II
ITEM 13. DEFAULTS, DIVIDEND ARREARAGES AND DELINQUENCIES
Not applicable.
ITEM 14. MATERIAL MODIFICATIONS TO THE RIGHTS OF SECURITY HOLDERS AND USE OF PROCEEDS
Not applicable.
ITEM 15. CONTROLS AND PROCEDURES
(a) Disclosure Controls and Procedures
We carried out an evaluation under the supervision of, and with participation of, our management, including our Chief Executive Officer and Chief Financial Officer, of the effectiveness of the design and operation of our disclosure controls and procedures, including those defined in United States Exchange Act Rule 13a-15e, as of the year ended December 31, 2013. There are inherent limitations to the effectiveness of any system of disclosure controls and procedures, including the possibility of human error and the circumvention or overriding of the controls and procedures. Accordingly, even effective controls and procedures can only provide reasonable assurance of achieving their control objectives.
As a result of this evaluation, our Chief Executive Officer and Chief Financial Officer concluded that our disclosure controls and procedures were not effective as of December 31, 2013, and that the design and operation of our disclosure controls and procedures were not effective to provide reasonable assurance that all material information relating to our company was reported as required because material weaknesses in the current operation of our internal control over financial reporting were identified as described below.
(b) Management’s Annual Report on Internal Control over Financial Reporting
Our management is responsible for establishing and maintaining adequate internal control over financial reporting as defined in Rules 13a-15(f) and 15d-15(f) under the Securities and Exchange Act of 1934. Our internal control over financial reporting is a process designed to provide reasonable assurance regarding the reliability of financial reporting and the preparation of consolidated financial statements for external purposes in accordance with generally accepted accounting principles. Our internal control over financial reporting includes those policies and procedures that (a) pertain to the maintenance of records that, in reasonable detail, accurately and fairly reflect the transactions and dispositions of our assets; (b) provide reasonable assurance that transactions are recorded as necessary to permit preparation of consolidated financial statements in accordance with generally accepted accounting principles, and that our receipts and expenditures are being made only in accordance with authorizations of our management and directors; and (c) provide reasonable assurance regarding prevention or timely detection of unauthorized acquisition, use or disposition of our assets that could have a material effect on the consolidated financial statements.
Because of its inherent limitations, internal control over financial reporting may not prevent or detect misstatements. Also, projections of any evaluation of the effectiveness of internal control to future periods are subject to the risk that controls may become inadequate because of changes in conditions, and that the degree of compliance with the policies or procedures may deteriorate.
Our management assessed the effectiveness of our internal controls over financial reporting as of December 31, 2013. In making this assessment, our management used the criteria set forth by the Committee of Sponsoring Organizations of the Treadway Commission (COSO) (1992) in “Internal Control – Integrated Framework.” Based on this assessment, our management concluded that, as of December 31, 2013, our internal control over financial reporting was not effective because material weaknesses existed. A material weakness is a control deficiency, or combination of control deficiencies, in internal control over financial reporting such that there is a reasonable possibility that a material misstatement of the annual consolidated financial statements will not be prevented or detected on a timely basis. The material weaknesses identified were:
1. We did not maintain effective internal controls over financial reporting based on the COSO criteria. In relation to our controls over financial reporting, we did not maintain an effective control environment, specifically internal control deficiencies were not remediated in a timely manner.
- 123 -
Table of Contents
2. We did not maintain effective review, monitoring and approval controls over specific enterprise resource planning, or ERP, that could lead to non authorized manual journal entries.
3. We did not maintain effective controls to ensure the completeness/accuracy of the judicial deposits and legal lawsuits, including periodic reviews/updates of them and the expected losses for accrual purposes.
4. We did not adequately design and maintain effective controls with respect to the impairment calculation of assets.
5. We did not maintain effective controls to ensure the appropriate review/monitoring related to the preparation of consolidated financial statements and related disclosures, and insufficient headcount of internal accounting personnel.
Notwithstanding management’s assessment that our disclosure controls and procedures were not effective and that there were material weaknesses as identified above, we believe that our consolidated financial statements contained in this annual report fairly present our financial position, results of operations and cash flows for the years covered thereby in all material respects.
The effectiveness of the internal control over financial reporting, as of December 31, 2013, has been audited byPricewaterhouseCoopers Auditores Independentes, an independent registered public accounting firm, as stated in their report beginning on page F-1 of the consolidated financial statements to this Form 20-F.
Remediation of Material Weakness
In 2013, we hired external consultants to assist us with the tests performed by our management, to remedy material weaknesses and to review internal controls in order to comply with Section 404a of Sarbanes-Oxley, encompassing all the companies included within the scope of the certificate. We highlight that the performance of our management’s tests is independent to that of our external auditor; as such, we have covered a set of internal controls which is broader than those reviewed by our external auditor.
The tests performed by management showed very similar results to the findings of our independent auditor, as shown by the fact that there were no new material weaknesses during the current certification process. In respect of the six material weaknesses reported in our prior Form 20-F (submitted on April, 30, 2013), some of these weaknesses have since been remedied while a part of the weaknesses remain. Despite the fact that these weaknesses relate to the same issues reported in our prior Form 20-F, there has been an improvement in the quality of our control environment relating to these weaknesses.
In order to remedy the material weakness related to a significant number of control deficiencies, Eletrobras has highlighted to its subsidiaries the importance of appointing managers to oversee internal controls in its business areas, and has established targets for the managers of such areas. We have also provided courses on corporate governance, risks and monitoring of internal controls aimed at further reducing the deficiencies and established strategic plans to remedy these deficiencies. We are undertaking plans to remedy these deficiencies.
With respect to remedies for the material weakness related to controls over the evaluation, monitoring and approval controls over specific ERP that could lead to non authorized manual journal entries, management believes that the creation of specific workflows will reduce this material weakness in relation to period end financial reporting. For the 2014 financial year, we will engage our IT department to assess the efficiency of these internal accounting controls.
Regarding the remediation of the material weakness related to the completeness and accuracy of judicial deposits and proceedings, which includes the periodic review and updating of those deposits and proceedings and related possible losses, we improved our previous target to more frequently monitor the activities of our legal and accounting department and the legal and accounting department of our subsidiaries which have shown this material weakness in order to have new indicators which will detect any potential errors in our financial statements.
Regarding the remediation of material weakness related to adequate design and operating controls with respect to the review process related to the calculation of impairment, management believes it promptly identified the necessary adjustments and strictly followed application of Law No. 12,783/13. Management has also set up a strategic plan to ensure that the revisions made to the impairment calculation of assets are implemented in Eletrobras’ financial statements as of and for the three-month period ended March 31, 2014. We are taking all necessary steps to eliminate this material weakness.
- 124 -
Table of Contents
In order to remedy the material weakness relating to the internal controls and supervision of the preparation of our IFRS consolidated financial statements and disclosures, and the lack of internal accounting staff, we will restructure the procedures relating to the preparation of our financial statements by means of reassessing the need to hire further accounting staff for the Eletrobras companies affected by this material weakness. This will also include (i) improving our operational performance, (ii) improving our human resources management and (iii) making efficient and standardized use of information technology.
During 2013, we have successfully remediated the material weakness regarding private pension plans. We have improved our monitoring and review process, which incorporated more effective and robust procedures. These controls procedures include mainly: (1) implementation of additional monitoring controls; (2) implementation of review controls of actuary reports by appointed benefits managers, on a timely basis, and; (3) implementation of standard policy and procedures manual regarding the actuarial assumptions for all group companies.
Also we remediated the material weakness relating to our internal controls system through the implementation of monitoring and review controls regulating the access to our integrated management systems (ERP). In addition, we have implemented GRC Access Control tools. We have also implemented effective corporate risk management controls, monitoring variations in materiality thresholds as well as monitoring prioritized risks. Further, we have implemented our corporate risk policy in our subsidiaries.
(c) Changes in Internal Control over Financial Reporting
Other than as set forth above, there have been no changes in our internal control over financial reporting that occurred during the year ended December 31, 2013 that have materially affected or are reasonably likely to materially affect our internal control over financial reporting as of December 31, 2013. Nevertheless, the following items were deemed material weaknesses for the year ended December 31, 2012, but they have been remediated as of December 31, 2013.
(d) Attestation Report of the Independent Registered Public Accounting Firm
For the report ofPricewaterhouseCoopers Auditores Independentes, our independent registered public accounting firm, dated April 30, 2014, on the effectiveness of the internal control over financial reporting as of December 31, 2013, see “Item 18, Financial Statements.”
ITEM 15T. CONTROLS AND PROCEDURES
Not applicable.
ITEM 16A. AUDIT COMMITTEE FINANCIAL EXPERT
Our board of directors has determined that Charles Carvalho Guedes, a member of our Fiscal Council, is an “audit committee financial expert” as defined by current SEC rules and meets the independence requirements of the SEC and the NYSE listing standards. For a discussion of the role of our Fiscal Council, see “Item 6.C, Board Practices – Fiscal Council.”
We have adopted a code of ethics that applies to all our employees, including our chief executive officer, chief financial officer, principal accounting officer and persons performing similar functions, as well as to directors and other officers. We have posted this code of ethics on our website at: [http://www.eletrobras.com/elb/data/Pages/ LUMISB877EC49ENIE.htm.] Copies of our code of ethics may be obtained by writing to us at the address set forth on the front cover of this Form 20-F. We have not granted any implicit or explicit waivers from any provision of our code of ethics since its adoption.
- 125 -
Table of Contents
ITEM 16C. PRINCIPAL ACCOUNTANT FEES AND SERVICES
The following table sets forth by category of service the total fees for services provided to Eletrobras by PricewaterhouseCoopers Auditores Independentes, during the fiscal years ended December 31, 2013, 2012 and 2011.
| 2013 | 2012 | 2011 | ||||||||||
| (R$) | ||||||||||||
Audit Fees | 10,887,340.00 | 9,356,316.00 | 7,860,000.00 | |||||||||
Audit-Related Fees | — | — | 230,000.00 | |||||||||
Tax Fees | — | — | — | |||||||||
All Other Fees | — | — | — | |||||||||
|
|
|
|
|
| |||||||
Total | 10,887,340.00 | 9,356,316.00 | 8,090,000.00 | |||||||||
|
|
|
|
|
| |||||||
Audit Fees
Audit fees consist of the aggregate fees billed by PricewaterhouseCoopers Auditores Independentes, in connection with the audit of our annual consolidated financial statements and internal controls, interim reviews of our quarterly financial information comfort letters, procedures related to the audit of income tax provisions in connection with the audit and the review of our consolidated financial statements.
Audit-Related Fees
Audit-related fees were paid to PricewaterhouseCoopers Auditores Independentes for the fiscal year ended December 31, 2011 which related to a report in connection with a certification of sustainability
Tax Fees
No tax fees were paid to PricewaterhouseCoopers Auditores Independentes for the fiscal years ended December 31, 2013, 2012 and 2011.
All Other Fees
No other fees were paid to PricewaterhouseCoopers Auditores Independentes for the fiscal years ended December 31, 2013, 2012 and 2011.
Pre-Approval Policies and Procedures
On April 27, 2005, we adopted a code of ethics that applies to all our employees, including our chief executive officer, chief financial officer, principal accounting officer and persons performing similar functions, as well as to directors and other officers. The objective of this code is: (i) to reduce the possibility of the misinterpretation of ethical principles as a result of subjective, personal interpretation; (ii) to be a formal and institutional benchmark for the professional conduct of our employees, including the ethical handling of actual or apparent conflicts of interests; (iii) to provide a standard for our internal and external relationships with our shareholders, investors, clients, employees, partners, suppliers, service providers, labor unions, competitors and society, the government and the communities in which we operate; and (iv) to ensure that daily concerns with efficiency, competitiveness and profitability do not override ethical behavior. Our code of ethics is available free of charge by requesting a copy from our Investor Relations Department at the following address: Avenida Presidente Vargas, 409, 9th Floor, Edifício Herm. Stolz, CEP 20071-003 Rio de Janeiro, RJ, Brazil; telephone: +55 21 2514 6331 or +55 21 2514 6333; fax: +55 21 2514 5964; and e-mail: invest@eletrobras.com.
We also created, in 2008, a “whistleblower channel” in order to receive “complaints,” by any person (provided such complaint is first reported to the Fiscal Council), regarding any “dishonest or unethical conduct,” “accounting, internal accounting controls, or auditing matters” and any equally confidential and anonymous submissions of “concerns” of the same type by our employees and associates. The “whistleblower channel” can be accessed through our website or by letter sent to our headquarters marked for the attention of our Fiscal Council. Since its establishment, eight issues were reported to our “whistleblower channel,” all of which related to personal conduct and therefore did not have a financial impact on our results of operations.
ITEM 16D. EXEMPTION FROM THE LISTING STANDARDS FOR AUDIT COMMITTEES
We have designated and empowered our Fiscal Council to perform the role of an audit committee pursuant to Rule 10A-3 of the Exchange Act. We are required by both the SEC and the NYSE listed company audit committee rules to comply with Rule 10A-3 of the Exchange Act, which requires that we either establish an audit committee, composed of members of our Board of Directors, that meets specified requirements or designate and empower our Fiscal Council to perform the role of the audit committee in reliance on the exemption set forth in Rule 10A-3(c)(3) of the Exchange Act. We believe that our Fiscal Council satisfies the independence and other requirements of Rule 10A-3 of the Exchange Act, which would apply in the absence of our reliance on the exemption.
- 126 -
Table of Contents
ITEM 16E. PURCHASES OF EQUITY SECURITIES BY THE ISSUER AND AFFILIATED PURCHASERS
Not applicable.
ITEM 16F. CHANGE IN REGISTRANT’S CERTIFYING ACCOUNTANT
KPMG Auditores Independentes (“KPMG”) will replace PricewaterhouseCoopers Auditores Independentes (“PwC”) as our independent public accountants and will audit our financial statements for the fiscal years starting January 1, 2014. The change in auditors is being made pursuant to a regulation of the CVM that limits the consecutive terms that certain service providers may serve. Because of the limitations set forth in this law, we did not seek to renew PwC’s contract when it expired and PwC did not attempt to stand for reelection. The replacement of PwC by KPMG was approved by our Board of Directors and Fiscal Council. PwC was engaged as our auditor until the filing of this Form 20-F with the Securities and Exchange Commission (the “Commission”) on April 30, 2014.
PwC’s reports on our consolidated financial statements for the fiscal years ended December 31, 2013 and 2012 did not contain any adverse opinion or a disclaimer of opinion, nor were those reports qualified or modified as to uncertainty, audit scope or accounting principles; however PwC did express an opinion that we did not maintain effective internal control over financial reporting as of December 31, 2013 and 2012, because of the material weaknesses in internal control over financial reporting as described below.
During our two most recent fiscal years ended December 31, 2013 and 2012 there were no disagreements with PwC on any matters of accounting principles and practices, financial statement disclosure, or auditing scope or procedure that, if not resolved to the satisfaction of PwC, would have caused it to make reference to the disagreement in connection with its reports on our financial statements.
Except for the six material weaknesses in our internal controls over financial reporting as described by us in Item 15 of the our Annual Report on Form 20-F for the year ended December 31, 2012, as filed with the Commission on May 1, 2013 (the “2012 Form 20-F”), there were no “reportable events,” as that term is defined in Item 16F(a)(1)(v) of Form 20-F. The material weaknesses in internal controls over financial reporting identified in the 2012 Form 20-F related to the following: (i) we did not adequately implement and maintain effective information technology controls, including those related to segregation of duties, security and monitoring access to our financial application programs and data segregation of duties, security and monitoring access to its financial application programs and data; (ii) lack of effective review, monitoring and approval processes relating to the recording of recurring and non-recurring journal entries; (iii) lack of effective controls to ensure the completeness/accuracy of the judicial deposits and legal lawsuits, including periodic reviews/updates of them and the expected losses for accrual purposes; (iv) lack of effective controls to ensure the completeness/accuracy or the review/monitoring of the post-retirement benefits plans (pension plans) sponsored by us; (v) lack of effective controls with respect to the impairment calculation of assets, specifically, there is no evidence of the analysis of financial information that was used for the impairment calculation of assets; and (vi) lack of effective controls to ensure the appropriate review/monitoring related to the preparation of financial statements and related disclosures, and insufficient headcount of internal accounting personnel. Because of these weaknesses, our management concluded, as reported in the 2012 Form 20-F, that we did not maintain effective internal control over financial reporting as of December 31, 2012. PwC, in its attestation report in the 2012 Form 20-F also reported that, in its opinion, we did not maintain in all material respects, effective internal controls over financial reporting as of December 31, 2012.
As indicated in our Annual Report on Form 20-F for the year ended December 31, 2013 as filed with the Commission on April 30, 2014, we remediated the material weakness relating to the lack of effective controls to ensure the completeness/accuracy or the review/monitoring of the post-retirement benefits plans (pension plans) sponsored by us. The remaining five items continued to represent material weaknesses at December 31, 2013. Because of these weaknesses, our management concluded, as reported in the 2013 Form 20-F, that we did not maintain effective internal control over financial reporting as of December 31, 2013. PwC, in its attestation report in the 2013 Form 20-F also reported that, in its opinion, we did not maintain in all material respects, effective internal control over financial reporting as of December 31, 2013. Our Board of Directors and Fiscal Council have discussed these matters with PwC, and we authorized PwC to respond fully to any inquiries by KPMG.
We have provided PwC with a copy of the foregoing disclosure, and have requested that it furnish us with a letter addressed to the Commission stating whether or not it agrees with such disclosure. We are including as Exhibit 15.2 to this Form 20-F a copy of the letter from PWC as required by Item 16F(a)(3) of Form 20-F.
During the fiscal years ended December 31, 2013 and December 31, 2012, we did not consult with KPMG regarding the application of accounting principles to a specific completed or contemplated transaction or regarding the type of audit opinion that might be rendered by KPMG on our financial statements. Further, KPMG did not provide any written or oral advice that was an important factor considered by us in reaching a decision as to any such accounting, auditing or financial reporting or any matter being the subject of disagreement or “reportable event” or any other matter as defined in Item 16F(a)(v) of Form 20-F.
ITEM 16G. CORPORATE GOVERNANCE
See “Item 9.C, Markets – Significant Differences between our Corporate Governance Practices and NYSE Corporate Governance Standards.
PART III
See “Item 18, Financial Statements.”
Please see our consolidated financial statements beginning on page F-1.
- 127 -
Table of Contents
| 2.1 | Amended and Restated Deposit Agreement dated October 18, 2002 between Centrais Elétricas Brasileiras S.A. – Eletrobras and J.P. Morgan Chase Bank, N.A., incorporated herein by reference from our Registration Statement on Form 20-F, filed July 21, 2008, File No. 001-34129. | |
| 2.2 | The total amount of long-term debt securities of our company and its subsidiaries under any one instrument does not exceed 10% of the total assets of our company and our subsidiaries on a consolidated basis. We agree to furnish copies of any or all such instruments to the SEC upon request. | |
| 3.2 | By-Laws of Centrais Elétricas Brasileiras S.A. – Eletrobras (English translation), dated December 23, 2011. | |
| 4.1 | Itaipu treaty signed by Brazil and Paraguay – Law No. 5,899 of July 5, 1973, incorporated herein by reference from our Registration Statement on Form 20-F, filed July 21, 2008, File No. 001-34129. | |
| 8.1 | List of subsidiaries. | |
| 12.1 | Rule 13a-14(a)/15d-14(a) Certification of Chief Executive Officer of Centrais Elétricas Brasileiras S.A. – Eletrobras. | |
| 12.2 | Rule 13a-14(a)/15d-14(a) Certification of Chief Financial Officer of Centrais Elétricas Brasileiras S.A. – Eletrobras. | |
| 13.1 | Section 906 Certification of Chief Executive Officer of Centrais Elétricas Brasileiras S.A. – Eletrobras. | |
| 13.2 | Section 906 Certification of Chief Financial Officer of Centrais Elétricas Brasileiras S.A. – Eletrobras. | |
| 15.2 | Auditor’s Letter Regarding Change in External Auditor. | |
- 128 -
Table of Contents
Signatures
The registrant hereby certifies that it meets all of the requirements for filing on Form 20-F and that it has duly caused and authorized the undersigned to sign this annual report on its behalf.
| CENTRAIS ELÉTRICAS BRASILEIRAS S.A. – ELETROBRAS | ||||
| By: | /s/ José da Costa Carvalho Neto | |||
| Name: | José da Costa Carvalho Neto | |||
| Title: | Chief Executive Officer | |||
| By: | /s/ Armando Casado de Araújo | |||
| Name: | Armando Casado de Araújo | |||
| Title: | Chief Financial Officer | |||
Table of Contents
CENTRAIS ELÉTRICAS BRASILEIRAS S.A. – ELETROBRAS
AND SUBSIDIARIES
CONSOLIDATED FINANCIAL STATEMENTS
As of and for the years ended December 31, 2013, 2012 and 2011
Report of Independent Registered Public Accounting Firm | F-1 | |||
Audited Consolidated Financial Statements | ||||
| F-4 | ||||
| F-6 | ||||
| F-7 | ||||
| F-9 | ||||
| F-10 |
Table of Contents
Report of independent registered
public accounting firm
To the Board of Directors and Stockholders of
Centrais Elétricas Brasileiras S.A. - Eletrobras
In our opinion, the accompanying consolidated balance sheets and the related consolidated statements of income, comprehensive income, stockholders’s equity and of cash flows present fairly, in all material respects, the financial position of Centrais Elétricas Brasileiras S.A. - Eletrobras and its subsidiaries at December 31, 2013 and 2012, and the results of their operations and their cash flows for each of the three years in the period ended December 31, 2013, in conformity with International Financial Reporting Standards (IFRS) as issued by the International Accounting Standards Board. Also, in our opinion, the Company did not maintain, in all material respects, effective internal control over financial reporting as of December 31, 2013, based on criteria established inInternal Control - Integrated Framework issued by the Committee of Sponsoring Organizations of the Treadway Commission (COSO) because material weaknesses in internal control over financial reporting existed as of that date, related to the following (i) a significant number of internal control deficiencies were not remediated in a timely manner; (ii) lack of effective monitoring and approval controls over specific ERP (Enterprise Resource Planning) transactions that could lead to non-authorized manual journal entries; (iii) lack of effective controls to ensure the completeness and accuracy of the judicial deposits and legal lawsuits, including periodic reviews and updates of them and the expected losses for accrual purposes; (iv) lack of effective controls with respect to the review process of the impairment calculation of assets,; and (v) lack of effective controls to ensure the appropriate review and monitoring related to the consolidation process related to the preparation of financial statements and related disclosures, and insufficient headcount of internal accounting personnel.
A material weakness is a deficiency, or a combination of deficiencies, in internal control over financial reporting, such that there is a reasonable possibility that a material misstatement of the annual or interim financial statements will not be prevented or detected on a timely basis. The material weaknesses referred to above are described in the accompanying “Management’s Annual Report on Internal Control over Financial Reporting”. We considered these material weaknesses in determining the nature, timing, and extent of audit tests applied in our audit of the 2013 consolidated financial statements, and our opinion regarding the effectiveness of the Company’s internal control over financial reporting does not affect our opinion on those consolidated financial statements. The Company’s management is responsible for these financial statements, for maintaining effective internal control over financial reporting and for its assessment of the effectiveness of internal control over financial reporting, included in management’s report referred to above. Our responsibility is to express opinions on these financial statements and on the Company’s internal control over financial reporting based on our integrated audits. We conducted our audits in accordance with the standards of the Public Company Accounting Oversight Board (United States). Those standards require that we plan and perform the audits to obtain reasonable assurance about whether the financial statements are free of material misstatement and whether effective internal control over financial reporting was maintained in all material respects. Our audits of the consolidated financial statements included
F-1
Table of Contents
Centrais Elétricas Brasileiras S.A. - Eletrobras
examining, on a test basis, evidence supporting the amounts and disclosures in the consolidated financial statements, assessing the accounting principles used and significant estimates made by management, and evaluating the overall consolidated financial statement presentation. Our audit of internal control over financial reporting included obtaining an understanding of internal control over financial reporting, assessing the risk that a material weakness exists, and testing and evaluating the design and operating effectiveness of internal control based on the assessed risk. Our audits also included performing such other procedures as we considered necessary in the circumstances. We believe that our audits provide a reasonable basis for our opinions.
As described in footnote 2.1, the Federal Government of Brazil has changed the laws and regulations regarding concessions of generation, distribution and transmission of electrical power. These changes impact both (i) the amount of tariffs the company can charge its customers which could impact the recoverability of certain assets, and (ii) the amount the company will be paid for certain assets under concession at the end of the concession period. As a result, the company recognized an impairment charge to reduce these assets to their estimated recoverable value. Some of the amounts to be received related to modernization of generation plants, transmission assets up to May, 2000 and assets related to thermal plants were determined by management based on its best estimates and interpretation of the legislation as described in footnote 4. Such amounts may change based on the final approval from the regulator.
As disclosed in Note 15 to the financial statements the operations of the subsidiaries of the distribution segment and the subsidiary Companhia de Geração Térmica de Energia Elétrica and the associated generation and transmission companies Norte Energia S.A., Madeira Energia S.A., Interligação Elétrica do Madeira S.A., Manaus Transmissora de Energia S.A. and Norte Brasil Transmissora de Energia S.A. depends on the financial support by the Company due to recurring losses and net capital deficiency in the case of the distribution companies and the subsidiary and in the case of the associates aforementioned it is due to the resources necessary for continuity and conclusion of the projects currently in progress. In addition, the realization of the loans receivable from CEMAT depends on the success of the judicial recovery plan and the results of the intervention, as well as negotiating new terms with creditors. Our opinion is not qualified in respect of these matters.
A company’s internal control over financial reporting is a process designed to provide reasonable assurance regarding the reliability of financial reporting and the preparation of financial statements for external purposes in accordance with generally accepted accounting principles. A company’s internal control over financial reporting includes those policies and procedures that (i) pertain to the maintenance of records that, in reasonable detail, accurately and fairly reflect the transactions and dispositions of the assets of the company; (ii) provide reasonable assurance that transactions are recorded as necessary to permit preparation of financial statements in accordance with generally accepted accounting principles, and that receipts and expenditures of the company are being made only in accordance with authorizations of management and directors of the company; and (iii) provide reasonable assurance regarding prevention or timely detection of unauthorized acquisition, use, or disposition of the company’s assets that could have a material effect on the financial statements.
F-2
Table of Contents
Centrais Elétricas Brasileiras S.A. - Eletrobras
Because of its inherent limitations, internal control over financial reporting may not prevent or detect misstatements. Also, projections of any evaluation of effectiveness to future periods are subject to the risk that controls may become inadequate because of changes in conditions, or that the degree of compliance with the policies or procedures may deteriorate. We do not express an opinion or any other form of assurance on management’s statement referring to remediation of the material weaknesses included under Management’s Annual Report on Internal Control Over Financial Reporting.
Rio de Janeiro, April 30, 2014
PricewaterhouseCoopers
Auditores Independentes
F-3
Table of Contents
CENTRAIS ELÉTRICAS BRASILEIRAS S.A - ELETROBRAS
BALANCE SHEET FOR THE YEARS ENDED DECEMBER 31, 2013 AND 2012 JANUARY 1ST, 2012
In thousand of Reais
| ASSETS | NOTE | 12/31/2013 | 12/31/2012 Restated see note 3.1 | 01/01/2012 Restated see note 3.1 | ||||||||||
CURRENT | ||||||||||||||
Cash and cash equivalents | 5 | 3,597,583 | 2,501,515 | 3,109,844 | ||||||||||
Restricted cash | 5 | 879,801 | 3,509,323 | 3,034,638 | ||||||||||
Marketable securities | 6 | 6,095,908 | 6,352,791 | 11,031,953 | ||||||||||
Accounts receivable | 7 | 3,587,282 | 4,082,695 | 4,069,402 | ||||||||||
Financial assets - Concessions and Itaipu | 17 | 1,168,002 | 318,293 | 1,271,365 | ||||||||||
Loans and financing | 9 | 2,838,503 | 2,611,830 | 2,622,304 | ||||||||||
Fuel consumption account - CCC | 25 | 1,275,334 | 1,240,811 | 1,184,936 | ||||||||||
Equity interest remuneration | 10 | 268,060 | 167,197 | 215,823 | ||||||||||
Recoverable taxes | 11 | 839,767 | 1,498,726 | 999,405 | ||||||||||
Income tax and social contribution | 11 | 1,940,005 | 1,227,005 | 898,788 | ||||||||||
Reimbursement rights | 12 | 10,910,073 | 7,302,160 | 3,498,606 | ||||||||||
Inventories | 614,607 | 446,157 | 350,572 | |||||||||||
Nuclear Fuel inventory | 13 | 343,730 | 360,751 | 388,663 | ||||||||||
Indemnifications - Law 12,783/2013 | 8 | 3,476,495 | 8,882,836 | — | ||||||||||
Derivative financial instruments | 44 | 108,339 | 249,265 | 191,919 | ||||||||||
Other receivables | 1,136,345 | 1,118,481 | 1,099,953 | |||||||||||
|
|
|
|
|
| |||||||||
TOTAL CURRENT ASSETS | 39,079,834 | 41,869,836 | 33,968,171 | |||||||||||
NON-CURRENT | ||||||||||||||
LONG TERM | ||||||||||||||
Reimbursement rights | 12 | 1,669,583 | 901,029 | 500,333 | ||||||||||
Loans and financing | 9 | 12,335,838 | 12,932,963 | 12,993,679 | ||||||||||
Accounts receivable | 7 | 1,310,821 | 1,256,685 | 1,295,180 | ||||||||||
Marketable securities | 6 | 192,580 | 400,370 | 385,966 | ||||||||||
Nuclear fuel inventory | 13 | 507,488 | 481,495 | 435,633 | ||||||||||
Recoverable taxes | 11 | 1,990,527 | 1,737,406 | 2,293,344 | ||||||||||
Income tax and social contribution | 11 | 3,010,574 | 4,854,337 | 3,059,529 | ||||||||||
Guarantees and restricted deposits | 2,877,516 | 2,691,114 | 2,105,335 | |||||||||||
Fuel consumption account - CCC | 25 | 16,275 | 521,097 | 727,136 | ||||||||||
Financial asset - Concessions and Itaipu | 17 | 23,704,037 | 22,915,696 | 26,881,123 | ||||||||||
Derivative financial instruments | 44 | 107,816 | 223,099 | 185,031 | ||||||||||
Advances for future capital increase | 14 | 490,429 | 70,423 | 4,000 | ||||||||||
Indemnifications - Law 12,783/2013 | 8 | 2,019,684 | 5,554,435 | — | ||||||||||
Other receivables | 830,309 | 647,682 | 604,731 | |||||||||||
|
|
|
|
|
| |||||||||
| 51,063,477 | 55,187,831 | 51,471,020 | ||||||||||||
INVESTMENTS | 15 | 17,414,994 | 14,677,150 | 11,124,380 | ||||||||||
FIXED ASSETS | 16 | 30,038,514 | 29,494,833 | 41,552,365 | ||||||||||
INTANGIBLE ASSETS | 18 | 788,582 | 1,204,563 | 1,287,880 | ||||||||||
|
|
|
|
|
| |||||||||
TOTAL OF NON-CURRENT ASSETS | 99,305,567 | 100,564,377 | 105,435,645 | |||||||||||
|
|
|
|
|
| |||||||||
|
|
|
|
|
| |||||||||
TOTAL ASSETS | 138,385,401 | 142,434,213 | 139,403,816 | |||||||||||
|
|
|
|
|
| |||||||||
F-4
Table of Contents
CENTRAIS ELÉTRICAS BRASILEIRAS S.A - ELETROBRAS
BALANCE SHEET FOR THE YEARS ENDED DECEMBER 31, 2013 AND 2012 AND JANUARY 1, 2012
In thousand of Reais
| LIABILITIES AND EQUITY | NOTE | 12/31/2013 | 12/31/2012 Restated see note 3.1 | 01/01/2012 Restated see note 3.1 | ||||||||||
CURRENT | ||||||||||||||
Loans and financing | 22 | 1,969,765 | 1,337,279 | 1,637,864 | ||||||||||
Debentures | 23 | 12,804 | 1,305 | — | ||||||||||
Financial liability | 17 | — | 787,115 | — | ||||||||||
Compulsory loan | 24 | 7,935 | 12,298 | 16,331 | ||||||||||
Suppliers | 20 | 7,740,578 | 6,423,074 | 5,487,947 | ||||||||||
Advances from clients | 21 | 511,582 | 469,892 | 413,041 | ||||||||||
Taxes payable | 26 | 839,426 | 814,422 | 819,776 | ||||||||||
Income tax and social contribution | 26 | 15,262 | 313,888 | 130,409 | ||||||||||
Fuel consumption account - CCC | 25 | 941,285 | 1,369,201 | 3,079,796 | ||||||||||
Shareholder’s compensation | 28 | 528,204 | 3,952,268 | 4,350,509 | ||||||||||
Accounts payable to Brazilian federal treasury | 29 | 39,494 | 131,047 | 109,050 | ||||||||||
Estimated liabilities | 1,288,713 | 1,173,678 | 772,880 | |||||||||||
Reimbursement obligations | 12 | 8,377,400 | 5,988,698 | 1,955,966 | ||||||||||
Post-employment benefits | 30 | 265,082 | 127,993 | 446,366 | ||||||||||
Provision for contingencies | 31 | 23,654 | 28,695 | 30,827 | ||||||||||
Regulatory fees | 27 | 714,862 | 654,230 | 625,069 | ||||||||||
Leasing | 22 | 181,596 | 162,929 | 142,997 | ||||||||||
Concessions payable - use of public asset | 33 | 3,567 | 1,870 | — | ||||||||||
Derivative financial instruments | 44 | 225,423 | 185,031 | 261,489 | ||||||||||
Other payables | 2,011,257 | 1,399,559 | 849,860 | |||||||||||
|
|
|
|
|
| |||||||||
TOTAL CURRENT LIABILITIES | 25,697,889 | 25,334,472 | 21,130,177 | |||||||||||
NON-CURRENT | ||||||||||||||
Loans and financing | 22 | 30,506,522 | 25,292,871 | 22,377,889 | ||||||||||
Accounts payable to Brazilian federal treasury | 29 | — | 37,072 | 155,676 | ||||||||||
Suppliers | 20 | 791,293 | — | — | ||||||||||
Debentures | 23 | 205,878 | 68,015 | — | ||||||||||
Advance from clients | 21 | 776,252 | 830,234 | 879,452 | ||||||||||
Compulsory Loan | 24 | 358,905 | 321,894 | 211,554 | ||||||||||
Asset decomission obligation | 32 | 1,136,342 | 988,490 | 408,712 | ||||||||||
Operational provision | 1,061,490 | 1,005,908 | 843,029 | |||||||||||
Fuel consumption account - CCC | 25 | 455,455 | 2,401,069 | 954,013 | ||||||||||
Provision for contingencies | 31 | 5,695,104 | 5,100,389 | 4,441,168 | ||||||||||
Post-employment benefits | 30 | 1,218,688 | 2,774,791 | 985,185 | ||||||||||
Onerous contracts | 35 | 3,244,335 | 5,155,524 | 96,204 | ||||||||||
Reimbursement obligations | 12 | 2,317,708 | 1,801,059 | 1,475,262 | ||||||||||
Leasing | 22 | 1,891,628 | 1,860,104 | 1,775,544 | ||||||||||
Stockholder’s compensation | 28 | — | — | 3,143,222 | ||||||||||
Concessions payable - use of public asset | 33 | 60,904 | 71,180 | 63,430 | ||||||||||
Advances for future capital increase | 34 | 174,570 | 161,308 | 171,135 | ||||||||||
Derivative financial instruments | 44 | 232,226 | 291,252 | 185,031 | ||||||||||
Regulatory fees | 27 | 375,982 | 428,383 | 392,134 | ||||||||||
Taxes payable | 26 | 892,950 | 620,397 | 1,081,873 | ||||||||||
Income tax and social contribution | 26 | 533,713 | 598,750 | 572,425 | ||||||||||
Other payables | 68,659 | 10,458 | 844,533 | |||||||||||
|
|
|
|
|
| |||||||||
TOTAL NON-CURRENT LIABILITIES | 51,998,604 | 49,819,148 | 41,057,471 | |||||||||||
EQUITY | ||||||||||||||
Capital stock | 37 | 31,305,331 | 31,305,331 | 31,305,331 | ||||||||||
Capital reserves | 37 | 26,048,342 | 26,048,342 | 26,048,342 | ||||||||||
Profit reserves | 37 | 4,334,565 | 11,361,225 | 19,095,822 | ||||||||||
Equity valuation adjustments | 68,368 | 208,672 | 220,915 | |||||||||||
Proposed additional dividend | 433,962 | 433,962 | 706,018 | |||||||||||
Other comprehensive income | (1,696,858 | ) | (2,273,587 | ) | (532,919 | ) | ||||||||
Non-controlling interest | 195,198 | 196,648 | 372,659 | |||||||||||
|
|
|
|
|
| |||||||||
TOTAL EQUITY | 60,688,908 | 67,280,593 | 77,216,168 | |||||||||||
|
|
|
|
|
| |||||||||
TOTAL LIABILITIES AND EQUITY | 138,385,401 | 142,434,213 | 139,403,816 | |||||||||||
|
|
|
|
|
| |||||||||
F-5
Table of Contents
CENTRAIS ELÉTRICAS BRASILEIRAS S.A. - ELETROBRAS
STATEMENT OF INCOME FOR THE YEARS ENDED DECEMBER 31, 2013 AND 2012
( in thousand of Reais )
| NOTE | 12/31/2013 | 12/31/2012 Restated see note 3.1 | 12/31/2011 * | |||||||||||
NET OPERATING REVENUE | 39 | 23,835,644 | 28,014,296 | 29,211,486 | ||||||||||
|
|
|
|
|
| |||||||||
OPERATING EXPENSES | ||||||||||||||
Personnel, supplies and services | 41 | 9,244,586 | 7,670,823 | 7,670,716 | ||||||||||
Energy purchased for resale | 42 | 5,515,206 | 4,863,288 | 3,386,289 | ||||||||||
Charges upon use of electric network | 42 | 1,560,883 | 1,586,809 | 1,420,934 | ||||||||||
Construction - Distribution | 1,013,684 | 1,345,519 | 711,740 | |||||||||||
Construction - Transmission | 1,797,324 | 1,960,474 | 3,567,868 | |||||||||||
Construction - Generation | 736,855 | — | — | |||||||||||
Fuel to produce electricity | 1,492,368 | 693,751 | 162,673 | |||||||||||
Remuneration and indemnity | 405,809 | 667,923 | 1,328,994 | |||||||||||
Depreciation | 1,285,351 | 1,528,692 | 1,549,988 | |||||||||||
Amortization | 215,189 | 160,269 | 173,897 | |||||||||||
Donations and contributions | 332,031 | 379,002 | 289,964 | |||||||||||
Operating provisions | 43 | 3,258,205 | 4,971,221 | 2,848,749 | ||||||||||
Voluntary Redundancy Plan | 30 | 256,860 | — | — | ||||||||||
Others | 2,089,704 | 1,814,116 | 2,278,090 | |||||||||||
|
|
|
|
|
| |||||||||
| 29,204,055 | 27,641,887 | 25,389,902 | ||||||||||||
OPERATING RESULT BEFORE FINANCIAL RESULT | (5,368,411 | ) | 372,409 | 3,821,584 | ||||||||||
|
|
|
|
|
| |||||||||
FINANCIAL RESULT | ||||||||||||||
Financial Revenue | ||||||||||||||
Revenue from interest, commissions and fees | 1,146,055 | 1,172,031 | 757,450 | |||||||||||
Revenue from financial investments | 556,469 | 1,565,875 | 1,664,517 | |||||||||||
Interest and penalty charges over electricity receivables | 305,404 | 230,597 | 359,208 | |||||||||||
Monetary restatements | 454,634 | 720,816 | 652,949 | |||||||||||
Exchange variation gains | 539,059 | 460,559 | 669,731 | |||||||||||
Remuneration for indemnifications - Law 12,783/13 | 441,024 | 211,532 | — | |||||||||||
Other financial revenue | 269,666 | 297,411 | 158,471 | |||||||||||
Financial Expenses | ||||||||||||||
Debt charges | (2,031,402 | ) | (1,420,938 | ) | (1,708,670 | ) | ||||||||
Lease charges | (379,771 | ) | (412,152 | ) | (350,861 | ) | ||||||||
Charges on shareholder’s funds | (189,967 | ) | (502,178 | ) | (1,178,989 | ) | ||||||||
Exchange variation loss | (238,938 | ) | — | — | ||||||||||
Other financial expenses | (606,287 | ) | (639,078 | ) | (789,353 | ) | ||||||||
|
|
|
|
|
| |||||||||
| 265,946 | 1,684,475 | 234,453 | ||||||||||||
INCOME BEFORE EQUITY | (5,102,465 | ) | 2,056,884 | 4,056,037 | ||||||||||
EQUITY RESULTS | 40 | 177,768 | 612,202 | 482,785 | ||||||||||
INCOME BEFORE EFFECTS OF LAW 12,783/2013 | (4,924,697 | ) | 2,669,086 | 4,538,822 | ||||||||||
|
|
|
|
|
| |||||||||
Effects - Law 12,783/2013 | 2 | — | (10,085,380 | ) | — | |||||||||
OPERATING RESULTS AFTER LAW 12,783/2013 | (4,924,697 | ) | (7,416,294 | ) | 4,538,822 | |||||||||
|
|
|
|
|
| |||||||||
Income Tax and Social Contribution | 26 | (60,424 | ) | (67,871 | ) | (1,196,317 | ) | |||||||
Income Tax and Social Contribution Deferred | 26 | (1,306,254 | ) | 558,513 | 419,514 | |||||||||
|
|
|
|
|
| |||||||||
NET INCOME (LOSS) FOR THE YEAR | (6,291,375 | ) | (6,925,652 | ) | 3,762,019 | |||||||||
|
|
|
|
|
| |||||||||
Amount attributed to controlling shareholders | (6,286,663 | ) | (6,878,916 | ) | 3,732,565 | |||||||||
Amount attributed to non-controlling shareholders | (4,712 | ) | (46,736 | ) | 29,454 | |||||||||
|
|
|
|
|
| |||||||||
EARNINGS (LOSS) PER SHARE | 38 | (R$ | 4.65 | ) | (R$ | 5.12 | ) | R$ | 2.60 | |||||
| * | We have not restated data for 2011 to reflect the application of IFRS 11. |
F-6
Table of Contents

CENTRAIS ELÉTRICAS BRASILEIRAS S.A – ELETROBRAS
STATEMENT OF STOCKHOLDERS’ EQUITY FOR THE YEARS ENDED IN DECEMBER 2013 AND 2012
(In thousand of Reais)
| CAPITAL | CAPITAL RESERVES | LEGAL RESERVE | STATUTORY RESERVE | ADDITIONAL DIVIDENDS | EQUITY VALUATION ADJUST- MENTS EFFECTS | RETAINED EARNINGS /ACCUMU- LATED LOSSES | OTHER COMPRE- HENSIVE INCOME | STOCK- HOLDER’S EQUITY PARENT | STOCK- HOLDER’S EQUITY NON- CONTROLLING INTEREST | CONSOLI- DATED STOCK- HOLDER’S EQUITY | ||||||||||||||||||||||||||||||||||
On January 1, 2012 | 31,305,331 | 26,048,342 | 2,233,017 | 16,862,805 | 706,018 | 220,915 | — | (532,919 | ) | 76,843,509 | 372,659 | 77,216,168 | ||||||||||||||||||||||||||||||||
|
|
|
|
|
|
|
|
|
|
|
|
|
|
|
|
|
|
|
|
|
| |||||||||||||||||||||||
Additional dividends | (706,018 | ) | (706,018 | ) | (706,018 | ) | ||||||||||||||||||||||||||||||||||||||
Accumulated conversion adjustments | 11,780 | 11,780 | 11,780 | |||||||||||||||||||||||||||||||||||||||||
Post-employment benefit adjustments | (520,677 | ) | (520,677 | ) | (520,677 | ) | ||||||||||||||||||||||||||||||||||||||
Fair value of available-for-sale financial instruments | (197,844 | ) | (197,844 | ) | (197,844 | ) | ||||||||||||||||||||||||||||||||||||||
Deferred income tax and social contribution over other comprehensive income | 896,712 | 896,712 | 896,712 | |||||||||||||||||||||||||||||||||||||||||
Adjustment of subsidiaries / associates | (1,930,639 | ) | (1,930,639 | ) | (129,276 | ) | (2,059,915 | ) | ||||||||||||||||||||||||||||||||||||
Equity valuation adjustments | (12,243 | ) | 12,243 | — | — | |||||||||||||||||||||||||||||||||||||||
Statutory reserves releases | (855,681 | ) | 855,681 | — | — | |||||||||||||||||||||||||||||||||||||||
Net income (loss) | (6,878,916 | ) | (6,878,916 | ) | (46,735 | ) | (6,925,651 | ) | ||||||||||||||||||||||||||||||||||||
Dividends proposal | (433,962 | ) | (433,962 | ) | (433,962 | ) | ||||||||||||||||||||||||||||||||||||||
Approval of additional dividend by Annual General Meeting | 433,962 | (433,962 | ) | — | — | |||||||||||||||||||||||||||||||||||||||
Statutory reserves losses | (6,878,916 | ) | 6,878,916 | — | — | |||||||||||||||||||||||||||||||||||||||
|
|
|
|
|
|
|
|
|
|
|
|
|
|
|
|
|
|
|
|
|
| |||||||||||||||||||||||
On December 31, 2012 | 31,305,331 | 26,048,342 | 2,233,017 | 9,128,208 | 433,962 | 208,672 | — | (2,273,587 | ) | 67,083,945 | 196,648 | 67,280,593 | ||||||||||||||||||||||||||||||||
|
|
|
|
|
|
|
|
|
|
|
|
|
|
|
|
|
|
|
|
|
| |||||||||||||||||||||||
Additional dividends | (433,962 | ) | (433,962 | ) | (433,962 | ) | ||||||||||||||||||||||||||||||||||||||
Accumulated conversion adjustments | 38,889 | 38,889 | 38,889 | |||||||||||||||||||||||||||||||||||||||||
Post-employment benefit adjustments | 609,151 | 609,151 | 609,151 | |||||||||||||||||||||||||||||||||||||||||
Fair value of available-for-sale financial instruments | (180,080 | ) | (180,080 | ) | (180,080 | ) | ||||||||||||||||||||||||||||||||||||||
Deferred income tax and social contribution over other comprehensive income | (277,069 | ) | (277,069 | ) | (277,069 | ) | ||||||||||||||||||||||||||||||||||||||
Adjustment of subsidiaries / associates | 398,028 | 398,028 | 3,262 | 401,290 | ||||||||||||||||||||||||||||||||||||||||
Derivative financial instruments - Hedge | (12,190 | ) | (12,190 | ) | (12,190 | ) | ||||||||||||||||||||||||||||||||||||||
Equity valuation adjustments | (140,304 | ) | 127,927 | (12,377 | ) | (12,377 | ) | |||||||||||||||||||||||||||||||||||||
Statutory reserves releases | (739,997 | ) | 739,997 | — | — | |||||||||||||||||||||||||||||||||||||||
Net income (loss) | (6,286,663 | ) | (6,286,663 | ) | (4,712 | ) | (6,291,375 | ) | ||||||||||||||||||||||||||||||||||||
Dividends proposal | (433,962 | ) | (433,962 | ) | (433,962 | ) | ||||||||||||||||||||||||||||||||||||||
Approval of additional dividend by Annual General Meeting | 433,962 | (433,962 | ) | — | — | |||||||||||||||||||||||||||||||||||||||
Statutory reserves losses | (6,286,663 | ) | 6,286,663 | — | — | |||||||||||||||||||||||||||||||||||||||
|
|
|
|
|
|
|
|
|
|
|
|
|
|
|
|
|
|
|
|
|
| |||||||||||||||||||||||
On December 31, 2013 | 31,305,331 | 26,048,342 | 2,233,017 | 2,101,548 | 433,962 | 68,368 | — | (1,696,858 | ) | 60,493,710 | 195,198 | 60,688,908 | ||||||||||||||||||||||||||||||||
|
|
|
|
|
|
|
|
|
|
|
|
|
|
|
|
|
|
|
|
|
| |||||||||||||||||||||||
F-7
Table of Contents
CENTRAIS ELÉTRICAS BRASILEIRAS S.A. – ELETROBRAS
STATEMENT OF COMPREHENSIVE INCOME FOR THE YEARS ENDED IN DECEMBER 2013 AND 2012
(In thousand of Reais)
| Year ended on | ||||||||||||
| 12/31/2013 | 31/12/2012 Restated see note 3.1 | 12/31/2011 * | ||||||||||
Net income (loss) for the year | ||||||||||||
Other comprehensive income | ||||||||||||
Accumulated conversion adjustments | 38,909 | 11,780 | 15,878 | |||||||||
Actuarial gains and losses | 1,362,551 | (2,370,677 | ) | (280,256 | ) | |||||||
Deferred income tax and social contribution | (463,267 | ) | 806,030 | 95,287 | ||||||||
Cash flow hedges | (11,987 | ) | — | — | ||||||||
Deferred income tax and social contribution | 4,076 | — | — | |||||||||
Fair value of financial instruments available for sale | (244,465 | ) | (240,662 | ) | 152,385 | |||||||
Deferred income tax and social contribution | 83,118 | 81,825 | (51,811 | ) | ||||||||
Comprehensive income of subsidiaries, associated and jointly-controlled entities | (291,211 | ) | (37,818 | ) | (472,745 | ) | ||||||
Deferred income tax and social contribution | 99,005 | 12,856 | 155,336 | |||||||||
|
|
|
|
|
| |||||||
Other comprehensive income (loss) for the year | 576,729 | (1,736,666 | ) | (385,926 | ) | |||||||
|
|
|
|
|
| |||||||
Total comprehensive income (loss) for the year | 576,729 | (1,736,666 | ) | (385,926 | ) | |||||||
|
|
|
|
|
| |||||||
Amount attributed to controlling shareholders | (5,709,934 | ) | (8,615,582 | ) | 3,346,639 | |||||||
Amount attributed to non-controlling shareholders | (4,712 | ) | (46,736 | ) | 29,453 | |||||||
|
|
|
|
|
| |||||||
| (5,714,646 | ) | (8,662,318 | ) | 3,376,092 | ||||||||
|
|
|
|
|
| |||||||
| * | We have not restated data for 2011 to reflect the application of IFRS 11. |
F-8
Table of Contents
CENTRAIS ELÉTRICAS BRASILEIRAS S.A – ELETROBRAS
STATEMENT OF CASH FLOWS
(In thousand of Reais)
| 12/31/2013 | 12/31/2012 (Restated) | 12/31/2011 * | ||||||||||
| OPERATIONAL ACTIVITIES | ||||||||||||
Income before income tax and social contribution | (4,924,697 | ) | (7,416,292 | ) | 4,538,822 | |||||||
Adjustments to reconcile net income to cash generated by operations: | ||||||||||||
Depreciation and amortization | 1,500,540 | 1,688,961 | 1,723,958 | |||||||||
Monetary / exchange variations, net | (1,674,124 | ) | (1,512,778 | ) | (1,029,289 | ) | ||||||
Financial charges | 607,438 | 366,185 | 774,140 | |||||||||
Revenue from financial assets | (552,106 | ) | (2,852,332 | ) | (2,774,166 | ) | ||||||
Income from equity interests | (177,768 | ) | (612,201 | ) | (482,785 | ) | ||||||
Effects of Law 12,783/2013 | — | 10,085,380 | — | |||||||||
Provision for unfunded liabilities | — | — | — | |||||||||
Allowance for doubtful accounts | (457,261 | ) | 781,864 | 808,487 | ||||||||
Provision for contingencies | 1,399,321 | 579,851 | 677,998 | |||||||||
Provision for impairment | 2,428,649 | 1,058,940 | 434,538 | |||||||||
Provision for onerous contract | (1,924,657 | ) | 1,636,137 | — | ||||||||
Provision for post-employment benefit plan | 256,860 | — | 172,246 | |||||||||
Provision for investment losses | 142,622 | 187,741 | 91,989 | |||||||||
Impairment of financial assets | 791,868 | — | — | |||||||||
Charges on global reversal reserve | 347,949 | 367,741 | 403,903 | |||||||||
Present value adjustment / market value | 94,000 | (162,562 | ) | 7,954 | ||||||||
Non-controlling interest | 7,139 | 70,812 | (44,627 | ) | ||||||||
Charges on stockholder’s funds | 189,967 | 502,178 | 1,178,989 | |||||||||
Derivative financial instruments | 238,938 | (103,863 | ) | 124,770 | ||||||||
Others | 559,372 | 1,083,216 | 171,488 | |||||||||
|
|
|
|
|
| |||||||
| 3,778,747 | 13,165,268 | 2,239,593 | ||||||||||
|
|
|
|
|
| |||||||
(increase) / decrease in operating assets | ||||||||||||
Accounts receivable | 413,625 | (77,127 | ) | (219,230 | ) | |||||||
Marketable securities | 404,758 | 4,664,758 | (4,106,884 | ) | ||||||||
Reimbursement rights | (4,376,467 | ) | (4,204,250 | ) | (1,507,652 | ) | ||||||
Inventories | (168,450 | ) | (95,585 | ) | 214,603 | |||||||
Nuclear fuel inventory | (8,972 | ) | (17,950 | ) | (2,367 | ) | ||||||
Financial asset - public utility concessions | 36,229 | (338,966 | ) | (946,673 | ) | |||||||
Others | (344,793 | ) | (29,041 | ) | 251,503 | |||||||
|
|
|
|
|
| |||||||
| (4,044,070 | ) | (98,161 | ) | (6,316,700 | ) | |||||||
|
|
|
|
|
| |||||||
(increase) / decrease in operating liabilities | ||||||||||||
Suppliers | 2,686,542 | 921,479 | 1,172,337 | |||||||||
Advance from clients | (50,655 | ) | (47,733 | ) | (44,466 | ) | ||||||
Leasing | 50,191 | 104,492 | 103,509 | |||||||||
Estimated liabilities | 115,035 | 400,798 | 30,793 | |||||||||
Reimbursement obligations | 2,744,474 | 4,609,446 | 1,629,649 | |||||||||
Regulatory fees | 8,231 | 65,410 | 317,452 | |||||||||
Others | 463,167 | (341,173 | ) | 111,938 | ||||||||
|
|
|
|
|
| |||||||
| 6,016,985 | 5,712,720 | 3,321,212 | ||||||||||
|
|
|
|
|
| |||||||
Cash from operating activities | 826,965 | 11,363,535 | 3,782,927 | |||||||||
|
|
|
|
|
| |||||||
Payment of financial charges | (1,305,876 | ) | (870,754 | ) | (1,368,244 | ) | ||||||
Payment of global reversal reserve charges | (228,144 | ) | (257,580 | ) | (465,318 | ) | ||||||
Amounts received from allowed annual revenue | 674,102 | 3,614,823 | 2,315,642 | |||||||||
Receivement compensation from the financial asset | 9,819,946 | — | ||||||||||
Amounts received from financial charges | 1,141,486 | 1,162,748 | 739,709 | |||||||||
Payment of income tax and social contribution | (650,161 | ) | (995,246 | ) | (1,132,758 | ) | ||||||
Amount received from remuneration of investments in equity interest | 513,607 | 632,621 | 689,370 | |||||||||
Additional pension payments | (488,016 | ) | (308,011 | ) | ||||||||
Payments of Legal contingencies | (920,002 | ) | (503,932 | ) | (274,462 | ) | ||||||
Judicial deposits | (54,552 | ) | (488,279 | ) | ||||||||
|
|
|
|
|
| |||||||
Net cash from operating activities | 9,329,355 | 13,349,926 | 4,286,866 | |||||||||
|
|
|
|
|
| |||||||
| FINANCING ACTIVITIES | ||||||||||||
Long-term loans and financing | 6,050,558 | 3,243,151 | 7,273,908 | |||||||||
Payment of loans and financing - principal | (2,480,439 | ) | (2,250,865 | ) | (2,258,040 | ) | ||||||
Payment of shareholders remuneration | (4,189,709 | ) | (4,981,948 | ) | (4,062,839 | ) | ||||||
Payment of Refinancing of taxes and contributions - principal | (98,522 | ) | (110,755 | ) | (92,375 | ) | ||||||
Compulsory loan and global reversal reserve | 485,594 | 885,457 | 1,376,452 | |||||||||
Others | 154,639 | 114,220 | 119,755 | |||||||||
|
|
|
|
|
| |||||||
Net cash from financing activities | (77,879 | ) | (3,100,740 | ) | 2,356,861 | |||||||
|
|
|
|
|
| |||||||
| INVESTING ACTIVITIES | ||||||||||||
Long-term loans and financing | (598,577 | ) | (536,879 | ) | (347,796 | ) | ||||||
Payments of loans and financing | 1,999,115 | 1,068,623 | 1,123,886 | |||||||||
Acquisition of fixed assets | (2,141,137 | ) | (3,737,167 | ) | (8,017,773 | ) | ||||||
Acquisition of intangible assets | (157,209 | ) | (121,713 | ) | (139,612 | ) | ||||||
Acquisition of concession assets | (3,413,719 | ) | (3,340,877 | ) | (3,411,497 | ) | ||||||
Acquisition / capital increase in subsidiary | (3,555,414 | ) | (4,090,940 | ) | ||||||||
Concession of advances for future capital increase | (396,467 | ) | (139,862 | ) | ||||||||
Others | 108,000 | 41,301 | (111,317 | ) | ||||||||
|
|
|
|
|
| |||||||
Net cash from investing activities | (8,155,408 | ) | (10,857,514 | ) | (10,904,109 | ) | ||||||
|
|
|
|
|
| |||||||
Increase (decrease) in cash and cash equivalents | 1,096,068 | (608,329 | ) | (4,260,382 | ) | |||||||
|
|
|
|
|
| |||||||
Cash and cash equivalents at the beginning of the year | 2,501,515 | 3,109,844 | 9,220,169 | |||||||||
Cash and cash equivalents at the end of the year | 3,597,583 | 2,501,515 | 4,959,787 | |||||||||
|
|
|
|
|
| |||||||
| 1,096,068 | (608,329 | ) | (4,260,382 | ) | ||||||||
|
|
|
|
|
| |||||||
| * | We have not restated data for 2011 to reflect the application of IFRS 11. |
F-9
Table of Contents
CENTRAIS ELÉTRICAS BRASILEIRAS S.A.
Eletrobras
(Public Company)
CNPJ 00.001.180/0001-26
Notes to the financial statements for the years ended December 31, 2013 and 2012
(In thousands of Reais)
NOTE 1 – GENERAL INFORMATION
Centrais Elétricas Brasileiras S.A. (Eletrobras or Company) is a corporation headquartered in Brasília - DF - Setor Commercial Norte, Quadra 4, Bloco B, 100, room 203 - Asa Norte, registered with the Brazilian Securities and Exchange (Comissão de Valores Mobiliários – CVM) and with the Securities and Exchange Commission – SEC, with shares traded in the stock exchanges in São Paulo (BOVESPA) – Brazil, Madrid (LATIBEX) – Spain and New York’s (NYSE) – United States of America stock markets. The company is a mixed capital company controlled by the Federal Government. Its business purpose is studying, projecting, building and operating generating power plants, electricity transmission and distribution lines, as well as conducting the trading transactions arising from these activities. Its purpose is also granting funding, providing guarantees, in Brazil and abroad, to public service electricity companies that are under its shareholding control and in favor of technical-scientific research entities; promoting and supporting research in the electricity sector, especially those connected to the activities of generation, transmission and distribution, as well as to perform studies of watersheds harnessing for multiple purposes; contributing to the education of technical staff required by the Brazilian electricity sector, as well as preparing qualified workers, through specialized courses, which may also provide assistance to schools in the country or scholarships abroad and signing contracts with entities contributing to the training of specialized technical personnel; collaborate technically and administratively with the companies in which it participates as a shareholder and with the Ministry of Mines and Energy in Brazil.
The Company operates as a holding company, managing equity interests, holding direct controlling interests in six electricity generation and/or transmission companies, as listed below:
| • | Furnas Centrais Elétricas S.A. - FURNAS; |
| • | Centrais Elétricas do Norte do Brasil S.A. - ELETRONORTE; |
| • | Companhia Hidro Elétrica do São Francisco - CHESF; |
| • | ELETROSUL Centrais Elétricas S.A.; |
| • | Eletrobras Termonuclear S.A. – ELETRONUCLEAR; and |
| • | Companhia de Geração Térmica de Energia Elétrica - CGTEE. |
F-10
Table of Contents
In addition to holding the controlling equity interest of the companies listed above, the Company holds the direct controlling equity interest of five electric power distributors:
| • | Boa Vista Energia S.A. - Boa Vista; |
| • | Companhia de Eletrecidade do Acre - ELETROACRE; |
| • | Centrais Elétricas de Rondônia S.A. - CERON; |
| • | Companhia Energetica de Alagoas - CEAL, and |
| • | Companhia Energética do Piauí – CEPISA. |
The Company, also, holds the controlling equity interest of Amazonas Energia – AmE, which is engaged in generation and distribution (See Note 15) and in Eletrobras Participações S.A. – Eletropar. In addition, it holds an equity interest in Itaipu Binacional – Itaipu (under joint control, as per the International Treaty signed by the Governments of Brazil and Paraguay), of Inambari Geração de Energia S.A. and of Centrales Hidroelectricas de Centroamerica S.A.- CHC and of Rouar S.A., in conjunction with the state-owned Uruguayan company Usinas y Transmissiones Elétricas de Uruguay - UTE.
The Company is the indirect controller or participates as a minority shareholder in several other companies in the electricity generation, transmission and distribution sectors either directly or through its controlled companies. (See Note 15)
The sale of the energy generated is conducted in two distinct market environments. The first market is the regulated market in which electricity for the distribution concessionaries is commercialized. The second market is the free market in which contracts freely negotiated. Law No. 10,848 of March 15, 2004, establishes a distinction between electricity generated by new projects and electricity generated by existing projects. For each category there is a different public bidding procedure to buy and sell this electricity.
The Company may, directly or acting through its subsidiaries or controlled companies, form business consortia or hold equity interests in companies which act in the electricity production, transmission or distribution sector. This may be done with or without capital contributions and the Company may or may not have controlling power. The companies in which the Company makes investments may be abroad or in Brazil and the Company’s interest may be held directly or indirectly.
The Company also is responsible for the management certain funds of the electricity sector, such as the Reserva Global de Reversão - RGR, Conta de Desenvolvimento Energético - CDE, Utilização de Bem Público - UBP and Fuel Consumption Account – CCC. These funds finance Federal Government programs which promote the expansion of the distribution grid and access to electricity, improve street lighting efficiency, offer incentives to alternative sources of energy, improve the conservation of electricity and fund the purchase of fossil fuels which are used in isolated systems of electricity generation. These transactions do not affect the results of the Company, except for the management fee in relation to certain Funds.
The Company also operates as an electricity trading agent for Itaipu Binacional and participates as an agent of the Programa de Incentivo às Fontes Alternativas de Energia Elétrica - Proinfa.
The Board of Directors authorized the issuance of these consolidated financial statements on March 27, 2014.
F-11
Table of Contents
The new concessions regime established by Law No. 12,783, applies to the Company’s generation and transmission concessions that were renewed. Due to this law, these concessions had their revenue streams reduced. In order to recover the ability to generate cash flow and profitability, the Directors are putting into practice an adjustment plan which consists of increasing revenues and reducing costs. In relation to increasing the Company’s revenue, the Company intends to increase the return on investments made in order to modernize the power generation plants and obtain tariff payments on investments made in existing transmission lines.
In the context of cost reduction, we highlight the Voluntary Redundancy Plan (see note 30.2) affecting 4,055 employees and the restructuring of the corporate, organizational and managerial aspects of Eletrobras’ business model. This plan, coupled with a number of new power plants and transmission lines entering into operation, especially UHE Santo Antonio, UHE Jirau, UHE Teles Pires and UHE Belo Monte and the Linhas de Transmissão do Madeira, should provide recovery of cash generation and profitability of the Company.
According to the Ministerial Notice No. 35/2014/GM-MME, the Ministry of National Integration is enabling the transfer of infrastructure for the common use of irrigated perimeters of UHE Itaparica of CHESF to Codevasf. In this sense, Codevasf is taking steps to enable the Company to take over the Operation and Maintenance of Irrigation Infrastructure in common use from June 1, 2014 (see note 35).
NOTE 2 – CONCESSIONS OF PUBLIC SERVICE OF ELECTRIC ENERGY
Eletrobras, through its subsidiaries, owns 42.987 GW of installed capacity, 64,400 km of transmission lines (not reviewed by independent auditors) and six power distributors that serve approximately 3.8 million consumers (not reviewed by independent auditors). Two of these companies, Amazonas Energia and Eletrobras Distribuição Roraima, are not connected to the national grid and therefore operate in an isolated system in the northern region of Brazil.
The Company, through its subsidiaries, has several concessions for electricity generation and transmission, as listed below:
F-12
Table of Contents
I - Grants in Framework of O&M - renewed - Law 12.783/13
| • | Electric Power Generation |
Concessions/Permissions | State | Installed Capacity (MW)* | Maturity | |||||
UHE Paulo Afonso I | BA | 180 | 12/31/2042 | |||||
UHE Paulo Afonso II | BA | 443 | 12/31/2042 | |||||
UHE Paulo Afonso III | BA | 794 | 12/31/2042 | |||||
UHE Paulo Afonso IV | BA | 2,462 | 12/31/2042 | |||||
UHE Apolônio Sales | BA | 400 | 12/31/2042 | |||||
UHE Luiz Gonzaga (Itaparica) | BA | 1,480 | 12/31/2042 | |||||
UHE Xingó | SE | 3,162 | 12/31/2042 | |||||
UHE Furnas | MG | 1,216 | 12/31/2042 | |||||
UHE Luiz Carlos Barreto de Carvalho | SP / MG | 1,050 | 12/31/2042 | |||||
UHE Marimbondo | SP / MG | 1,440 | 12/31/2042 | |||||
UHE Porto Colômbia | SP / MG | 320 | 12/31/2042 | |||||
UHE Funil | MG | 216 | 12/31/2042 | |||||
UHE Corumbá I | GO | 375 | 12/31/2042 | |||||
UHE Serra da Mesa | GO | 1,275 | 11/12/2039 | |||||
UHE Funil | BA | 30 | 12/31/2042 | |||||
UHE Pedra | BA | 20 | 12/31/2042 | |||||
UHE Boa Esperança | PI | 237 | 12/31/2042 | |||||
UHE Coaracy Nunes | AP | 78 | 12/31/2042 | |||||
| * | Unaudited |
| • | Electric Power Transmission |
Contract | Owner | Term (years) | Maturity | |||
057/2001 | Eletrosul | 30 | 12/31/2042 | |||
058/2001 | Eletronorte | 30 | 12/31/2042 | |||
061/2001 | Chesf | 30 | 12/31/2042 | |||
062/2001 | Furnas | 30 | 12/31/2042 | |||
F-13
Table of Contents
II – Main Concessions in Exploration Framework
| • | Electric Power Generation |
F-14
Table of Contents
Concessions/Permissions | State | Installed Capacity (MW)** | Maturity Year | |||
UHE Sobradinho | BA / PE | 1,050 | 2022 | |||
UTE Camaçari | BA | 347 | 2027 | |||
UHE Belo Monte * | PA | 11,233 | 2045 | |||
UHE Tucuruí | PA | 8,535 | 2024 | |||
UHE Samuel | RO | 217 | 2029 | |||
UTE Rio Madeira | RO | 119 | 2018 | |||
UTE Santana | AP | 178 | 2019 | |||
UTE Electron | AM | 121 | 2020 | |||
UHE Dardanelos* | MT | 261 | 2042 | |||
UHE Mauá* | PR | 363 | 2042 | |||
UHE Teles Pires | PA / MT | 446 | 2046 | |||
UHE Jirau* | RO | 3,750 | 2043 | |||
UTE Presidente Médici – Candiota I e II | RS | 446 | 2015 | |||
UTE Candiota III | RS | 350 | 2041 | |||
UHE Balbina | AM | 278 | 2027 | |||
UHE Aparecida | AM | 283 | 2020 | |||
UTE Mauá | AM | 738 | 2020 | |||
UTE Mauá | AM | 125 | 2020 | |||
UTE Santa Cruz | RJ | 932 | 2015 | |||
UHE Mascarenhas de Moraes | MG | 476 | 2023 | |||
UHE Itumbiara | MG / GO | 2,082 | 2020 | |||
UHE Manso* | MG | 212 | 2035 | |||
UHE Simplício/Anta | RJ / MG | 334 | 2041 | |||
UHE Peixe Angical* | TO | 452 | 2036 | |||
UHE Baguari * | MG | 140 | 2041 | |||
UHE Foz do Chapecó* | RS | 855 | 2036 | |||
UHE Foz do Chapecó* | GO | 213 | 2036 | |||
UTN Angra I*** | RJ | 640 | 2024*** | |||
UTN Angra II*** | RJ | 1,350 | 2041*** | |||
UTN Angra III*** | RJ | 1,405 | 40 anos*** | |||
UHE Santo Antônio* | RO | 1,128 | 2043 | |||
UHE Piloto | PE | 2.00 | 2015 | |||
UHE Araras | CE | 4.00 | 2015 | |||
UHE Curemas | PA | 3.52 | 2024 | |||
EOL São Pedro do Lago* | BA | 30.00 | 2046 | |||
EOL Pedra Branca* | BA | 30.00 | 2046 | |||
EOL Sete Gameleiras* | BA | 30.00 | 2046 | |||
UHE Curuá-Uma | PA | 30.30 | 2028 | |||
UTE Rio Acre | AC | 45.49 | 2018 | |||
UTE Rio Branco I | AC | 18.65 | 2020 | |||
UTE Rio Branco II | AC | 32.75 | 2020 | |||
UTE- Senador Arnon Afonso Farias | RR | 85.99 | 2024 | |||
UTE Serra do Navio* | SE | 23.30 | 2037 | |||
UTE Capivara* | SE | 29.80 | 2037 | |||
Parque Eólico Miassaba 3* | RN | 68.47 | 2045 | |||
Parque Eólico Rei dos Ventos 3* | RN | 60.12 | 2045 | |||
UHE Passo São João | RS | 77.00 | 2041 | |||
UHE São Domingos | MS | 48.00 | 2037 | |||
PCH Barra do Rio Chapéu | SC | 15.20 | 2034 | |||
PCH João Borges | SC | 19.00 | 2035 | |||
PCH Cochilha Rica | SC | 18.00 | 2042 | |||
PCH Santo Cristo | SC | 19.50 | 2042 | |||
EOL Cerro Chato I* | RS | 30.00 | 2045 | |||
EOL Cerro Chato II* | RS | 30.00 | 2045 | |||
EOL Cerro Chato III* | RS | 30.00 | 2045 | |||
EOL Cerro Chato III* | RS | 20.00 | 2015 | |||
F-15
Table of Contents
Concessions/Permissions | State | Installed Capacity (MW)** | Maturity Year | |||
UTE Nutepa | RS | 24.00 | 2015 | |||
UTE Cidade Nova | AM | 29.70 | 2015 | |||
UTE Iranduba | AM | 66.60 | 2015 | |||
UTE Distrito | AM | 51.30 | 2015 | |||
UTE São José | AM | 73.40 | 2015 | |||
UTE Roberto Silveira | GO | 30.00 | 2027 | |||
UHE Batalha | MG / GO | 52.50 | 2041 | |||
UHE Retiro Baixo* | MG | 82.00 | 2041 | |||
Serra do Facão | RS | 212.58 | 2036 | |||
Santo Antonio (Mesa) | RO | 2,440.56 | 2043 | |||
Teles Pires | PA / MT | 1,819.80 | 2046 | |||
Rei dos Ventos 1 | RN | 58.45 | 2045 | |||
Famosa 1 | RN | 22.50 | 2047 | |||
Pau Brasil | CE | 15.00 | 2047 | |||
Rosada | RN | 30.00 | 2048 | |||
São Paulo | CE | 17.50 | 2047 | |||
Goiabeira | CE | 22.50 | 2047 | |||
Horizonte | CE | 17.50 | 2047 | |||
Jandaia | CE | 30.00 | 2047 | |||
Jandaia 1 | CE | 22.50 | 2047 | |||
São Januário | CE | 22.50 | 2047 | |||
Ubatuba | CE | 12.50 | 2047 | |||
Nsa Sra de Fátima | CE | 30.00 | 2047 | |||
Pitombeira | CE | 30.00 | 2047 | |||
Santa Catarina | CE | 20.00 | 2047 | |||
UHE Jirau | RO | 3750 | 2043 | |||
UHE Sinop | PA / MT | 400 | 2049 | |||
| * | SPE/Consortium. The amounts showed on the table are regarding the installed capacity of the business, and it does not represent the company’s equity in such businesses. |
| ** | Unaudited |
| *** | Operation license given for 40 years after the operation start date. |
F-16
Table of Contents
| • | Electric Power Transmission |
Project | State | Term (years) | Maturity | |||
Transmission Line IV/Pirajá (BA), at 230 kV, in a simple circuit, with an approximate length of 45 km and Transmission Line Pituaçu /Pirajá (BA), at 230 kV, in a simple circuit with a length of approximately 5 miles. | BA | 30 | 2042 | |||
- Transmission Line Eunápolis/Teixeira de Freitas II, circuit 1 (BA), at 230 kV, with an approximate length of 144 miles and Substation Teixeira de Freitas II, 230/138 kV (BA). | BA | 30 | 2038 | |||
- Transmission Line Russas/Banabuiú C2 (EC) at 230 kV, in a simple circuit, with an approximate length of 110 km; Transmission Line Bulls/Ceará MirimII (RN), at 230 kV, in a simple circuit, with an approximate | CE / RN | 30 | 2042 | |||
- Transmission Lines Paraíso/Acu II (RN), at 230 kV, circuit 3, with an approximate length of 123 km, Acu/Mossley II (RN), at 230 kV circuit 2, with an approximate length of 69 km and John Hall/Extremoz II (RN), | RN | 30 | 2040 | |||
- Transmission Lines Paraíso/Lagoa Nova (RN), at 230 kV, in a simple circuit, with an approximate length of 65 km and Lagoa Nova Substation, 230/69 kV (RN). | RN | 30 | 2041 | |||
- Transmission Line Teresina II/III Teresina (PI), 230 kV, double circuit, with an approximate length of 26 km, and Teresina III Substation, 230 /69 kV (PI). | PI | 30 | 2041 | |||
- Transmission Line Northeastern Complex IV/Sapeaçu (BA), 500 kV, in a simple circuit, with an approximate length of 105 km. | BA | 30 | 2041 | |||
- Transmission Line Igaporã III/II Pindaí (BA), at 230 kV, in a simple circuit, with an approximate length of 46 km; Transmission line Igaporã III/II Igaporã C1 and C2 (BA), at 230 kV, in a simple circuit with a length of | BA | 30 | 2042 | |||
- Transmission Line Paraiso/Nossa Senhora do Socorro (SE), 230 kV, double circuit, with an approximatelength of 1.3 km; Transmission Line Messias/II Maceió (AL), 230 kV, double circuit, with an approximate | SE / AL / BA | 30 | 2042 | |||
- Transmission Line Morro do Chapeu/Irecê (BA), at 230 kV, in a simple circuit , with an approximate length of 65 km and Morro do Chapeu Substation, 230/69 kV (BA). | BA | 30 | 2041 | |||
- Transmission Line Paraiso/Acu II (RN), at 230 kV, with a length of 132.8 km. | RN | 30 | 2037 | |||
- Transmission LineRecife II/II Suape (PE) at 500 kV, in a simple circuit, with an approximate length of 44 km. | PE | 30 | 2041 | |||
- Transmission Line Sapeaçu/Santo Antônio de Jesus (BA), at 230 kV, in a simple circuit, with an approximate length of 32 km. | BA | 30 | 2041 | |||
- Transmission Lines Sobral III/II Acaraú (EC) at 230 kV, C2, with an approximate length of 97 km, and Acaraú II Substation, 230 kV (EC) . | CE | 30 | 2040 | |||
- Substation Arapiraca III in 230/69 kV (AL), and transmission line, double circuit, Rio Largo II/Boulder, 230 kV, with an approximate length of 44 km. | AL | 30 | 2040 | |||
- Transmission Line Eunápolis/Teixeira de Freitas II, loop 2 (BA), at 230 kV, with an approximate length of 144 km. | BA | 30 | 2039 | |||
- Transmission Line Funil/Itapebi (BA), at 230 kV, with an approximate length of 198 km. | BA | 30 | 2037 | |||
- Transmission Line Ibicoara/Brumado (BA), at 230 kV, with an approximate length of 94.5 km. | BA | 30 | 2037 | |||
- Transmission Lines Igaporã/Bom Jesus da Lapa II (BA), 230 kV, C1 , with an approximate length of 115 km, and Igaporã Substation, 230 kV (BA). | BA | 30 | 2040 | |||
- Transmission Lines Pau Ferro/Santa Rita II (PE/PB) at 230 kV, with an approximate length of 109 km. | PE / PB | 30 | 2039 | |||
- Northeastern Complex IV Substation 500 kV (BA) | BA | 30 | 2040 | |||
- Substation Ibiapina in 230/69 kV (EC). | CE | 30 | 2041 | |||
- Substation Mirueira II, 230/69 kV (PE) - and 300MVA substation Jaboatão II, 230/69 kV (PE) - 300MVA. | PE | 30 | 2042 | |||
- Suape II Substation 500 kV (PE) | PE | 30 | 2039 | |||
- Transmission Line Paraiso/Boulder (SE/AL) at 230 kV, with an approximate length of 110 km. | SE / AL | 30 | 2038 | |||
- Transmission Line Milagres/Coremas (CE/CP) at 230 kV, with a length of 119.8 km. | CE / PB | 30 | 2035 | |||
- Transmission Line Milagres/Taua (EC), at 230 kV, with a length of 208.1 km and Substation Taua (EC) at 230 kV. | CE | 30 | 2037 | |||
- Transmission Line Picos/Taua (PI/CE), at 230 kV, with an approximate length of 183 km. | PI / CE | 30 | 2037 | |||
- Transmission Line Pirapama/III Suape, extending 30.8 kilometers ; Substation and Suape III in 230/69 kv (PE) | PE | 30 | 2039 | |||
F-17
Table of Contents
Project | State | Term (years) | Maturity | |||
- Transmission Lines and Paulo Afonso III /Zebu (AL) at 230 kV, with a length of 10.8 km | BA / AL | 30 | 2039 | |||
- Ibicoara Substation 500/230 kV (PE) | BA | 30 | 2037 | |||
- Substation Pole, 230/69 kV (BA). | BA | 30 | 2040 | |||
Expanding Interconnection South - Southeast | PR/ SP | 30 | 2031 | |||
230 kV - Ribeiro Goncalves SE/SE Ferry | PI / MA | 30 | 2039 | |||
230 kV - SE São Luis II/SE São Luis III | MA | 30 | 2038 | |||
230 kV Camaquã 3 - Thursday - 163km | PR | 30 | 2042 | |||
230 kV Campos Novos - Barra Grande | SC, RS | 30 | 2032 | |||
230 kV Cascavel Oeste - Umuarama - 143km | PR | 30 | 2042 | |||
230 kV Collecting Porto Velho/Porto Velho “C” 1 - 17km | RO | 30 | 2039 | |||
230 kV Collecting Porto Velho/Porto Velho “C” 2 - 17km | RO | 30 | 2039 | |||
230 kV Monte Claro/Garibaldi 33km | RS | 30 | 2040 | |||
230 kV Nova Santa Rita - Camaquã 3 - 140km | PR | 30 | 2042 | |||
230 kV President Médice/Santa Cruz 1 - 237.4 kilometers | RS | 30 | 2038 | |||
LT 500 kv - Jorge Teixeira LT/LT Lechuga | AM | 30 | 2040 | |||
500 kV - LT Presidente Dutra - São Luis II/SE Miranda II | MA | 30 | 2039 | |||
LT 525 kV Campos Novos/360km Blumenau | SC | 30 | 2035 | |||
LT 525 kV Campos Novos/Santa Rita 260km | SC, RS | 30 | 2036 | |||
LT 525 kV Curitiba - Curitiba East - 28km | PR | 30 | 2042 | |||
LT 525 kV Ita - Nova Santa Rita - 305km | PR | 30 | 2042 | |||
LT 525 kV Ivaiporã - Londrina - 120 km | PR | 30 | 2035 | |||
LT 525 kV Ivaiporã/Cascavel D’oeste 209km west | PR | 30 | 2034 | |||
LT 525 kV Quince - Santa Vitoria dos Palmar - 52km | RS | 30 | 2042 | |||
LT 525 kV Nova Santa Rita - New People - 281km | RS | 30 | 2042 | |||
LT 525 kV Povo Novo - Quince - 154km | RS | 30 | 2042 | |||
LT 525 kV Salto Santiago - Ita - 190km | PR | 30 | 2042 | |||
LT 525 kV Salto Santiago/167km Ivaiporã | PR | 30 | 2034 | |||
LT Bom Despacho - Black Gold 2-500 kV | MG | 30 | 2039 | |||
LT Coletora Porto Velho/Porto Velho 17km | RO | 30 | 2039 | |||
Macaé - Campos C3 | RJ | 30 | 2035 | |||
LT Mascarenhas - Linhares 230 kV - CS SE Linhares - 230/138 kV | ES | 30 | 2040 | |||
LT Tijuco Preto- Itapeti - Northeast 345 kV | SP | 30 | 2036 | |||
LT Xavantes - Pyrenees, CS, 230 Kv | GO | 30 | 2041 | |||
SE - Camaquã 3 (166 MVA) | RS | 30 | 2042 | |||
SE - Caxias 6 (330 MVA) | RS | 30 | 2040 | |||
SE - East Curitiba (672 MVA) | PR | 30 | 2042 | |||
SE - Foz do Chapecó (100 MVA) | SC | 30 | 2040 | |||
SE - Ijuí 2 (300 MVA) | RS | 30 | 2040 | |||
SE - Lageado Large (83 MVA) | RS | 30 | 2040 | |||
SE - Marmeleiro (200 MVA) | RS | 30 | 2042 | |||
SE - Nova Petropolis 2 (166 MVA) | RS | 30 | 2040 | |||
SE - Novos Povos (672 MVA) | RS | 30 | 2042 | |||
SE - Santa Vitória do Palmar (75 MVA) | RS | 30 | 2042 | |||
SE - Umuarama (300 MVA) | RS | 30 | 2042 | |||
SE Camaquã 3 (83 MVA) | PR | 30 | 2042 | |||
SE Red Lake 2 | RS | 30 | 2032 | |||
SE Santa Marta | RS | 30 | 2032 | |||
SE West Zone (transformer 500/138 kV) | RJ | 30 | 2042 | |||
Natal III Substation in 230/69kV (RN) Natal Transmission Line II/III Natal, with 23 km | RN | 30 | 2039 | |||
Santa Rita II Substation in 230/69kV (PB) | PB | 30 | 2039 | |||
Zebu substation in 230/69kV (AL) | AL | 30 | 2039 | |||
SPE ETAU | SC / RS | 30 | 2032 | |||
SPE Uirapuru | PR | 30 | 2035 | |||
SPE North Brazil | RO / SP | 30 | 2039 | |||
SPE West Coast | PR | 30 | 2042 | |||
SPE Palumbo | PR | 30 | 2042 | |||
SPE TSBE | RS | 30 | 2042 | |||
SPE TSLE | RS | 30 | 2042 | |||
Basic Transmission Network | Many | 30 | 2043 | |||
Noble SE 230/138 kV | Mato Grosso | 30 | 2041 | |||
Miramar SE 230/69 kV | Amazonas e Roraima | 30 | 2041 | |||
IF Lucas do Rio Verde 230/138 kV | Mato Grosso | 30 | 2031 | |||
LT Lechuga - Jorge Teixeira, C3, 230 kV, 3x150 MVA | Amazonas | 30 | 2043 | |||
Transmission Line Porto Velho - Abuna (RO), Rio Branco (AC), with 487 km long and 230 kV | Many | 30 | 2039 | |||
Station Converting Alternating Current - AC/DC Power DC bipole No. 1 Substation Catch Porto Velho, CA at 500 kV/+ -600 kV DC, in the State of Rondônia, and Inverter DC/AC dipole No. 1 Substation Araraquara 2, + - 600 kV kV CC/500 CA, State of Sao Paulo | Many | 30 | 2039 | |||
F-18
Table of Contents
| • | Power Distribution |
Concessions/Permissions | State | Cities attended* | Maturity | |||||
Cia. de Eletricidade do Acre - Eletroacre | Estado do Acre | 22 | 2015 | |||||
Centrais Elétricas de Rondônia - Ceron | Estado de Rondônia | 52 | 2015 | |||||
Companhia Energétca de Alagoas - Ceal | Estado de Alagoas | 102 | 2015 | |||||
Companhia Energética do Piauí - Cepisa | Estado do Piauí | 224 | 2015 | |||||
Amazonas Energia | Estado do Amazonas | 62 | 2015 | |||||
Boa Vista Energia | Estado de Roraima | 1 | 2015 | |||||
| * | Unaudited |
2.1. Extension of electricity’s public service concessions
The Federal Government enacted Law No. 12,783/2013 on January 11, 2013. This Law was regulated by Decree No. 7,891, of January 23, 2013. The law regulates the concession of generation, transmission and distribution of electricity and the reduction of regulatory charges.
Under this Law, concessions due to mature in 2015, were renewed for another 30 years, subject to the conditions set out in the Law and the respective amendments to Concession Agreements.
The extension considered the acceleration of these concessions and the amendment of the Concession Agreements with the Federal Government. These amendments established new conditions for these agreements, modified certain compensation criteria, provided for the allocation of energy and quality standards set out in the Law. In addition, the law changed the terms for the compensation of assets that had not been fully amortized or depreciated. These were replaced by the new replacement value – NRV.
In addition, the Ministry of Mines and Energy - MME and the Ministry of Finance issued on November 1, 2012, Interministerial Ordinance No. 580, which determined the value of the indemnification to be paid for generation and transmission assets affected by Provisional Measure No. 579/12 as the prices published on June 2012 and October 2012 respectively. Interministerial Ordinance No. 602 adjusted these indemnification values on November 29, 2012.
The Law provides that concessions which were not renewed by means of the acceptance of the conditions presented by the Federal Government, should be auctioned in a public bid when they mature (2015 - 2017). The auction will grant concessions for up to thirty years.
On October 15, 2012, the distribution companies which have concessions that expire in 2015 could show their interest to extend the concession for an additional period of 30 years. To date, the Federal Government has not regulated the criteria for the renewal of these contracts. Therefore the revised concession agreements for distributors that have expressed interest until October 15, 2012 have not been signed yet. The signature of the renewal concession agreement will only occur when the current concession expires.
F-19
Table of Contents
There is no guarantee that the Federal Government will approve the renewal of the concession agreements in accordance with the new conditions. Assets which are not fully amortized by the end of the concession agreement may be subject to indemnification.
Impacts on the distribution business generally considered
Part A of the Extraordinary Tariff Revision had impacts as of February 1, 2013, in order to reduce the costs of electricity generation and transmission of the renewed concessions.
The following regulatory charges were eliminated from the electricity tariff: GRR - Global Reversion Reserve; CFR - Cost of Fuel Consumption and Reduction and CDE - Account for Energy Development and reasonable tariffs was reduced. This led to a reduction of approximately 20% of industry charges.
The financial statements for the year ended December 31, 2013, show the effect of the adoption of the Adjustment to the New Replacement Value – VNR as the remaining value of the assets once the concession matures. This applies to those assets which have not yet been fully amortized, and in which the Company may claim indemnification from the Federal Government. In 2013, due to the 3rd Round of Tariff Revisions conducted by ANEEL (see Note 17 b), the Company adjusted the VNR value over financial assets related to the Base Regulatory Remuneration – BRR.
The effects of these changes are set out below:
Effects on the income statement – Tariff Review – BRR
| Distribution | 2013 | 2012 | ||||||
Adjustment to New Value Replacement - VNR of indemnification assets (1) | (194,576 | ) | 359,182 | |||||
Adjustment to New Value Replacement - VNR of indemnification assets - Update | (164,606 | ) | ||||||
Consideration of the effects of tariff revision on 3rd BRR for impairment | (763,788 | ) | ||||||
|
|
|
| |||||
Total | (1,122,970 | ) | 359,182 | |||||
|
|
|
| |||||
| (1) | In 2012 this amount was accounted for separately as effects of the Law No. 12,783/2013. |
Impacts of generation and transmission business directly affected by Law No. 12,783/2013
The effects resulting of changes in Law 12,783/2013 affected the net income of 2012.
Generation | Transmission | |||
| Assets subject to indemnification and the value to be paid | Generation assets (Basic Design) not amortized by December 31, 2012, by the values defined in Ordinances No. 580 and No. 602 issued by the MME. | Transmission assets acquired after May 31, 2000 and not amortized by December 2012 (RBNI), pursuant to the values defined in Ordinance No. 580. |
F-20
Table of Contents
Generation | Transmission | |||
| The concession holders must submit the additional information to ANEEL (post-Basic Project), necessary for calculating the share of investments linked to reversible assets made up to 31 December 2012, not yet amortized or depreciated (upgrades and improvements). | Transmission companies should submit to ANEEL information relating to assets acquired before 31 May 2000 (RBSE), which have not been depreciated or amortized by December 2012. This will be used to calculate the additional indemnification by the Federal Government, which, when approved, shall be paid in 30 years. | |||
| Adjustment of Indemnity | The indemnification shall be adjusted by the Consumer Price Index - IPCA (Article 3 of Ordinance No. 580) until the date of actual payment. Payment will be made pursuant to Article 4 of Ordinance No. 580. | |||
| Acquired Assets after December 31, 2012 | New investments (increases and improvements) occurred after December 31, 2012, provided they are approved formally to be covered in future rates, being its discretion pay is not defined yet. | |||
| Changes in charges of the Sector | Reduction or elimination of the following regulatory charges: GRR - Global Reversion Reserve; CFR – CDE and Cost of Fuel Consumption CFC. | |||
| Change in business model | Amendment of the system of price for tariff, subject to periodic reviews. The tariff will be calculated based on the costs of operation and maintenance, plus 10%. Allocation of physical energy security quotas and hydroelectric electricity for the transmission concession holders of the national grid, to be determined by ANEEL, which will be allocated to the regulated market. | The tariff (new Annual Permitted Revenue - RAP) will be calculated to cover operating costs plus remuneration initially fixed at 10%. | ||
F-21
Table of Contents
In the financial statements as of December 31, 2012, presented for comparative purposes, there were significant effects derived from these changes on Law No. 12,783/2013 as follows:
| Total | ||||
Generation | (7,337,859 | ) | ||
|
| |||
Gain (loss) on indemnification of extended concessions | (1,802,402 | ) | ||
Adjustment to the New Replacement Value of indemnification assets | (2,825,060 | ) | ||
Onerous contracts | (1,591,200 | ) | ||
Non-recoverable portion of assets - impairment | (1,119,198 | ) | ||
Transmission | (3,106,703 | ) | ||
|
| |||
Gain (loss) on indemnification of extended concessions | (1,242,395 | ) | ||
Adjusting to the New Replacement Value of indemnification assets | (331,602 | ) | ||
Onerous contracts | (1,491,195 | ) | ||
Non-recoverable portion of assets - impairment | (41,511 | ) | ||
Distribution | 359,182 | |||
|
| |||
Adjusting to the New Replacement Value of indemnification assets | 359,182 | |||
|
| |||
Total | (10,085,380 | ) | ||
|
| |||
F-22
Table of Contents
Effect in Equity - 2012
| Balance on 12/31/2012 - before effect of Law 12.783/2013 | ||||||||||||||||||||||||||||||||||||
| Fixed Assets | Intangible | Financial Asset | Onerouse Contracts | Prvision/ Im pairment | Effects in 2012 - Law 12.783/2013 | Inflation adjustment of compensation | Effects of the adoption of new IFRS | Total assets (liabilities) after impacts of Law 12.783/2013 | ||||||||||||||||||||||||||||
Generation | ||||||||||||||||||||||||||||||||||||
Chesf | 15,244,200 | 77,258 | — | (711,375 | ) | — | (5,999,682 | ) | 171,485 | (3,762,841 | ) | 5,019,045 | ||||||||||||||||||||||||
Eletronorte | 10,355,757 | 47,569 | — | (21,553 | ) | (408,207 | ) | (77,552 | ) | 1,093 | (1,545,890 | ) | 8,351,217 | |||||||||||||||||||||||
Eletrosul | 5,663,283 | 71,271 | — | (959,000 | ) | (198,645 | ) | — | — | (3,075,187 | ) | 1,501,722 | ||||||||||||||||||||||||
Furnas | 18,276,844 | 1,024,012 | — | — | (1,028,266 | ) | (1,236,677 | ) | 22,841 | (9,512,191 | ) | 7,546,563 | ||||||||||||||||||||||||
Others | 1,729,606 | 1,819 | — | — | (47,600 | ) | (23,948 | ) | — | (965,945 | ) | 693,932 | ||||||||||||||||||||||||
Transmission | ||||||||||||||||||||||||||||||||||||
Chesf | — | — | 8,040,558 | — | — | (2,245,560 | ) | 31,746 | (1,615,248 | ) | 4,211,496 | |||||||||||||||||||||||||
Eletronorte | — | — | 8,169,235 | — | (28,168 | ) | (608,586 | ) | 33,647 | (1,732,715 | ) | 5,833,413 | ||||||||||||||||||||||||
Eletrosul | — | 159,577 | 4,169,939 | — | (32,115 | ) | 577,802 | 39,715 | (519,435 | ) | 4,395,483 | |||||||||||||||||||||||||
Furnas | — | 711 | 9,053,473 | — | — | (830,359 | ) | 45,677 | (1,418,009 | ) | 6,851,492 | |||||||||||||||||||||||||
Distribution | ||||||||||||||||||||||||||||||||||||
Distribuitors | 1,410,976 | 837,779 | 4,236,765 | (131,200 | ) | — | 359,182 | — | — | 6,713,502 | ||||||||||||||||||||||||||
|
|
|
|
|
|
|
|
|
|
|
|
|
|
|
|
|
| |||||||||||||||||||
Total | 52,680,666 | 2,219,996 | 33,669,970 | (1,823,128 | ) | (1,743,001 | ) | (10,085,380 | ) | 346,204 | (24,147,461 | ) | 51,117,865 | |||||||||||||||||||||||
|
|
|
|
|
|
|
|
|
|
|
|
|
|
|
|
|
| |||||||||||||||||||
For presentation purposes, the administrative assets were allocated in the generation and distribution activities.
Concessions of Assets renewed whose indemnity the Federal Government has not yet approved
The payment of indemnity relating to certain concessions are still subject to approval by the Federal Government in the following amounts:
| 12/31/2013 | 12/31/2012 | |||||||
Generation | ||||||||
Modernization and improvements | 1,483,540 | 1,483,540 | ||||||
Thermal generation | 1,205,289 | 1,684,047 | ||||||
Transmission | ||||||||
Upgrades and improvements (RBNI) | 841,814 | 841,814 | ||||||
Basic Networking - Existing services (RBSE) | 7,490,046 | 7,490,046 | ||||||
Effect on invested CTEEP - RBSE | 525,247 | 525,247 | ||||||
|
|
|
| |||||
Total | 11,545,936 | 12,024,694 | ||||||
|
|
|
| |||||
As the Federal Government has not yet issued a final approval, these amounts and the method and time of payment remain uncertain.
For purpose of calculating indemnification payments, ANEEL enacted Regulatory Resolutions 589 and 596. These resolutions define the criteria for calculating the New Replacement Value (NRV) for existing transmission assets in May 2000, which have not yet been depreciated (RBSE). The resolutions also provide the criteria and procedures for calculating the share of investments linked to reversible assets used in hydroelectric projects, which have not been amortized or depreciated, and in which have been renewed or not pursuant to Law No. 12,783. In December 2013, the directors of the Company submitted to ANEEL the schedule for development of these assets. In addition, reports throughout the year of 2014 will complete the assessments in order to obtain approval.
F-23
Table of Contents
Indemnity provided for in Law 12,783/2013
| 12/31/2013 | 12/31/2012 | |||||||
Opening Balance | 14,437,272 | — | ||||||
Constitution’s Right to Indemnity | — | 14,091,068 | ||||||
Amounts Received | (9,819,946 | ) | — | |||||
Monetary Variation | 878,853 | 346,204 | ||||||
|
|
|
| |||||
Closing Balance | 5,496,179 | 14,437,272 | ||||||
|
|
|
| |||||
CURRENT TOTAL | 3,476,495 | 8,882,836 | ||||||
NON CURRENT TOTAL | 2,019,684 | 5,554,436 | ||||||
|
|
|
| |||||
| 5,496,179 | 14,437,272 | |||||||
|
|
|
| |||||
NOTE 3 – SUMMARY OF SIGNIFICANT ACCOUNTING POLICIES
The main accounting policies applied in the preparation of these financial statements are defined below. These policies have been applied consistently in all reported years, unless otherwise stated.
3.1. Basis of preparation
The preparation of financial statements requires the use of certain critical accounting estimates and also the Company’s Management judgment on the process to apply the accounting policies of Eletrobras. Those transactions, disclosures or balances, which require a higher level of judgment and which are more complex, as well as areas in which assumptions and estimates are relevant for the consolidated financial statements, are disclosed in Note 4.
The financial statements were prepared based on the historical cost, except for certain financial instruments measured at fair value, and some assets linked to the concessions measured at the new replacement value – NRV (generators and transmission) or by the Base of Regulatory Remuneration – BRR (distributors). The historical cost is based on the fair value of consideration paid in exchange of assets.
(a) Consolidated financial statements
The consolidated financial statements have been prepared in accordance to the requirements of the International Financial Reporting Standards (IFRS) issued by the International Accounting Standards Board (IASB).
(b) changes in the accounting policies and disclosures
(b.1) New and revised rules which affect the values presented and/or disclosed in the financial statements
In the current year, the Company has applied several new and revised standards issued by the IASB, which must enter into force for accounting periods beginning on January 1, 2013.
F-24
Table of Contents
New and revised rules on consolidation, joint agreements, associates and disclosures
The financial statements for the year ended December 31, 2013 are the first annual financial statements presented in accordance with the following standards: IFRS 10, IFRS 11, IFRS 12, IAS 27 (revised 2011) and IAS 28 (revised in 2011). These rules were adopted by the Company at January 1, 2013 and were included in these annual financial statements, with their effects on the comparative periods, as required by the standard.
The main requirements of these five standards are described below:
IFRS 10 replaces parts of IAS 27 Consolidated and Separate Financial Statements that deal with consolidated financial statements and SIC-12 Consolidation - Special Purpose Entities. IFRS 10 changes the definition of control such that an investor has control over an investee when a) it has power over the investee, b) it is exposed, or has rights, to variable returns from its involvement with the investee and c) has the ability to use its power to affect its returns. Previously, control was defined as the power to govern the financial and operating policies of an entity so as to obtain benefits from its activities. Additional guidance has been included in IFRS to explain when an investor has control over an investee. Some guidance included in IFRS 10 that deals with whether or not an investor that owns less than 50% of the voting rights in an investee has control over the investee is relevant to the Group.
IFRS 11 replaces IAS 31Interests in Joint Ventures, and the guidance contained in a related interpretation, SIC-13 Jointly Controlled Entities – Non-Monetary Contributions by Venturers, has been incorporated in IAS 28 (as revised in 2011). IFRS 11 deals with how a joint arrangement of which two or more parties have joint control should be classified and accounted for. Under IFRS 11, there are only two types of joint arrangements – joint operations and joint ventures. The classification of joint arrangements under IFRS 11 is determined based on the rights and obligations of parties to the joint arrangements by considering the structure, the legal form of the arrangements, the contractual terms agreed by the parties to the arrangement, and, when relevant, other facts and circumstances. A joint operation is a joint arrangement whereby the parties that have joint control of the arrangement (i.e. joint operators) have rights to the assets, and obligations for the liabilities, relating to the arrangement. A joint venture is a joint arrangement whereby the parties that have joint control of the arrangement (i.e. joint venturers) have rights to the net assets of the arrangement. Previously, IAS 31 contemplated three types of joint arrangements – jointly controlled entities, jointly controlled operations and jointly controlled assets. The classification of joint arrangements under IAS 31 was primarily determined based on the legal form of the arrangement (e.g. a joint arrangement that was established through a separate entity was accounted for as a jointly controlled entity).
The initial and subsequent accounting of joint ventures and joint operations is different. Investments in joint ventures are accounted for using the equity method (proportionate consolidation is no longer allowed). Investments in joint operations are accounted for such that each joint operator recognises its assets (including its share of any assets jointly held), its liabilities (including its share of any liabilities incurred jointly), its revenue (including its share of revenue from the sale of the output by the joint operation) and its expenses (including its share of any expenses incurred jointly). Each joint operator accounts for the assets and liabilities, as well as revenues and expenses, relating to its interest in the joint operation in accordance with the applicable Standards.
F-25
Table of Contents
IFRS 12 is a new disclosure standard and is applicable to entities that have interests in subsidiaries, joint arrangements, associates and/or unconsolidated structured entities. In general, the application of IFRS 12 has resulted in more extensive disclosures in the consolidated financial statements.
We restated our consolidated financial statements as of and for the year ended December 31, 2012 as a result of the adoption, on January 1, 2013 (with a corresponding restatement of the opening balance as of January 1, 2012), of IFRS 11 (Joint Arrangements), or IFRS 11. We retroactively applied IFRS 11 to 2012 for comparison purposes pursuant to IAS 8 (Accounting Policies, Changes in Accounting Estimates and Errors). The adoption of this new pronouncement impacted several line items of our consolidated financial statements relating to the method of accounting for the results of joint venture entities, which are now recognized using the equity method of accounting instead of the proportional consolidation method we used prior to our adoption of IFRS 11. We applied IFRS 11 beginning with January 1, 2012, based on the issued amendments to IFRS 10, IFRS 11 and IFRS 12 revising the transition guidance to provide relief from full retrospective application. As a result of these amendments, we retroactively adjusted our consolidated financial statements for the annual period immediately preceding the date of initial application (January 1, 2013) (the “Immediately Preceding Period”). Consequently, our financial information as of and for the years ended December 31, 2013 and 2012 reflects the effects of IFRS 11 and these consolidated financial statements are fully comparable. As we were not required to, and did not, restate our consolidated financial statements as of and for the year ended December 31, 2011, these consolidated financial statements are not directly comparable to our consolidated financial statements as of and for the years ended December 31, 2013 and 2012.
Management reviewed the level of influence held in its subsidiaries and the investees in its subsidiaries. Under IFRS 11, the Company has concluded on the following companies shared/SPEs classified as joint ventures, proceeding with their respective control deconsolidation:
Furnas Investees | ||
| Baguaria Energia S.A. | Transenergia Goiás S.A. | |
| Brasventos Eolo Geradora Energia | Transenergia Renovável S/A | |
| Brasventos Missaba 3 Geradora | Transenergia São Paulo S.A. | |
| Centroeste de Minas | Companhia Transirape de Transmissão | |
| Chapecoense Geração S/A | Companhia Transleste de Transmissão | |
| Companhia Hidrelétrica Teles Pires | Companhia Transudeste de Transmissão | |
| Enerpeixe S.A. | MGE Transmissão | |
| Goiás Transmissão S.A | Rei dos Ventos 3 Geradora | |
| Inambari Geração de Energia | Retiro Baixo Energética | |
| Interligação Elétrica do Madeira S/A | Serra do Facão Energia S/A | |
| Madeira Energia S/A | ||
F-26
Table of Contents
CHESF Investees | ||
| Sistema de Transmissão Nordeste S.A. | São Pedro do Lago S.A. | |
| Integração Transmissora de Energia S.A. | Sete Gameleiras S.A. | |
| Interligação Elétrica do Madeira S.A. | Interligação Elétrica Garanhuns S.A. | |
| ESBR Participações S.A. | Usina de Energia Eólica Junco I S.A. | |
| Manaus Transmissora de Energia S.A. | Usina de Energia Eólica Junco II S.A. | |
| Manaus Contrutora Ltda. | Usina de Energia Eólica Caiçara I S.A. | |
| Transmissora Delmiro Gouveia S.A. | Usina de Energia Eólica Caiçara II S.A. | |
| Norte Energia S.A. | Extremoz Transmissora do Nordeste - ETN S.A. | |
| Pedra Branca S.A | ||
Eletronorte Investees | ||
| Amazônia Eletronorte Transmissora de Energia S.A. | Brasventos Eolo Geradora de Energia S.A. | |
| Integração Transmissora de Energia S.A. | Rei dos Ventos 3 Geradora de Energia S.A. | |
| Brasnorte Transmissora de Energia S.A. | Brasventos Miassaba 3 Geradora de Energia S.A. | |
| Transmissora Matogrossense de Energia S.A | Norte Energia S.A. | |
| Manaus Transmissora de Energia S.A. | Manaus Construtora Ltda. | |
| Norte Brasil Transmissora de Energia S.A. | Construtora Integração Ltda. | |
| Linha Verde Transmissora de Energia S.A. | Transnorte Energia S.A. | |
Eletrosul Investees | ||
| Construtora Integração Ltda. | ESBR Participações S.A. | |
| Norte Brasil Transmissora de Energia S.A. | Teles Pires Participações S.A. | |
| Costa Oeste Transmissora de Energia S.A. | Chuí Holding S.A. | |
| Transmissora Sul Brasileira de Energia S.A. | Livramento Holding S.A. | |
| Marumbi Transmissora de Energia S.A. | Santa Vitória do Palmar S.A. | |
| Transmissora Sul Litorânea de Energia S.A. | ||
Eletrobras direct investees | ||
| Inambari Geração de Energia S/A | Centrales Hidrelétricas de Centro América - CHC | |
| Itaipu Binacional | Norte Energia S.A. | |
| Eólica Mangue Seco 2 | ||
Reconciliations to previous GAAP
Below we demonstrate the impact of adopting these new standards on the balance sheet, income statement and cash flows of the Company for each period presented.
| a) | Effects of adopting the new IFRS on the consolidated balance sheet on December 31, 2012 and January 1, 2012. |
F-27
Table of Contents
| ASSETS | 12/31/2012 previously published | Effects of new pronouncements | 12/31/2012 restated | 01/01/2012 previously published | Effects of new pronouncements | |||||||||||||||
CURRENT | ||||||||||||||||||||
Cash and cash equivalents | 4,429,375 | (1,927,860 | ) | 2,501,515 | 4,959,787 | (1,849,943 | ) | |||||||||||||
Restricted cash | 3,509,323 | — | 3,509,323 | 3,034,638 | — | |||||||||||||||
Securities | 6,622,611 | (269,820 | ) | 6,352,791 | 11,252,504 | (220,551 | ) | |||||||||||||
Accounts receivable | 4,496,963 | (414,268 | ) | 4,082,695 | 4,352,024 | (282,622 | ) | |||||||||||||
Financial assets - Concessions and Itaipu | 579,295 | (261,002 | ) | 318,293 | 2,017,949 | (746,584 | ) | |||||||||||||
Loans and financing | 1,976,191 | 635,639 | 2,611,830 | 2,082,054 | 540,250 | |||||||||||||||
Fuel Consumption Account - CCC | 1,240,811 | — | 1,240,811 | 1,184,936 | — | |||||||||||||||
Compensation of equity investments | 118,790 | 48,407 | 167,197 | 197,863 | 17,960 | |||||||||||||||
Taxes recoverable | 1,391,882 | 106,844 | 1,498,726 | 1,104,322 | (104,917 | ) | ||||||||||||||
Income and Social Contribution Taxes | 1,418,252 | (191,247 | ) | 1,227,005 | 843,022 | 55,766 | ||||||||||||||
Right to compensation | 7,115,200 | 186,960 | 7,302,160 | 3,083,157 | 415,449 | |||||||||||||||
Warehouse | 454,635 | (8,478 | ) | 446,157 | 358,724 | (8,152 | ) | |||||||||||||
Supply of nuclear fuel | 360,751 | — | 360,751 | 388,663 | — | |||||||||||||||
Indemnities - Law 12.783/2013 | 8,882,836 | — | 8,882,836 | — | — | |||||||||||||||
Derivatives | 252,620 | (3,355 | ) | 249,265 | 195,536 | (3,617 | ) | |||||||||||||
Other | 1,493,009 | (374,528 | ) | 1,118,481 | 1,607,493 | (507,540 | ) | |||||||||||||
|
|
|
|
|
|
|
|
|
| |||||||||||
TOTAL CURRENT ASSETS | 44,342,544 | (2,472,708 | ) | 41,869,836 | 36,662,672 | (2,694,501 | ) | |||||||||||||
NON-CURRENT | ||||||||||||||||||||
LONG TERM | ||||||||||||||||||||
Right to compensation | 901,029 | — | 901,029 | 500,333 | — | |||||||||||||||
Loans and financing | 7,747,286 | 5,185,677 | 12,932,963 | 7,651,336 | 5,342,343 | |||||||||||||||
Accounts receivable | 1,482,946 | (226,261 | ) | 1,256,685 | 1,478,994 | (183,814 | ) | |||||||||||||
Securities | 404,337 | (3,967 | ) | 400,370 | 398,358 | (12,392 | ) | |||||||||||||
Supply of nuclear fuel | 481,495 | — | 481,495 | 435,633 | — | |||||||||||||||
Taxes recoverable | 1,934,820 | (197,414 | ) | 1,737,406 | 2,430,761 | (137,417 | ) | |||||||||||||
Income and Social Contribution Taxes | 4,996,806 | (142,469 | ) | 4,854,337 | 3,343,525 | (283,996 | ) | |||||||||||||
Escrow deposits | 2,829,912 | (138,798 | ) | 2,691,114 | 2,316,324 | (210,989 | ) | |||||||||||||
Fuel Consumption Account - CCC | 521,097 | — | 521,097 | 727,136 | — | |||||||||||||||
Financial assets - Concessions and Itaipu | 44,834,877 | (21,919,181 | ) | 22,915,696 | 46,149,379 | (19,268,256 | ) | |||||||||||||
Derivatives | 223,099 | — | 223,099 | 185,031 | — | |||||||||||||||
Advances for future capital increase | 4,000 | 66,423 | 70,423 | 4,000 | — | |||||||||||||||
Indemnities - Law 12.783/2013 | 5,554,436 | (1 | ) | 5,554,435 | — | — | ||||||||||||||
Other | 830,754 | (183,072 | ) | 647,682 | 701,763 | (97,032 | ) | |||||||||||||
|
|
|
|
|
|
|
|
|
| |||||||||||
| 72,746,894 | (17,559,063 | ) | 55,187,831 | 66,322,573 | (14,851,553 | ) | ||||||||||||||
INVESTMENTS | 5,398,299 | 9,278,851 | 14,677,150 | 5,510,192 | 5,614,188 | |||||||||||||||
FIXED ASSETS | 47,407,102 | (17,912,269 | ) | 29,494,833 | 53,214,861 | (11,662,496 | ) | |||||||||||||
INTANGIBLE | 2,300,740 | (1,096,177 | ) | 1,204,563 | 2,371,367 | (1,083,487 | ) | |||||||||||||
|
|
|
|
|
|
|
|
|
| |||||||||||
TOTAL OF NON CURRENT ASSETS | 127,853,035 | (27,288,658 | ) | 100,564,377 | 127,418,993 | (21,983,348 | ) | |||||||||||||
|
|
|
|
|
|
|
|
|
| |||||||||||
|
|
|
|
|
|
|
|
|
| |||||||||||
TOTAL OF ASSETS | 172,195,579 | (29,761,366 | ) | 142,434,213 | 164,081,665 | (24,677,849 | ) | |||||||||||||
|
|
|
|
|
|
|
|
|
| |||||||||||
F-28
Table of Contents
| LIABILITIES AND EQUITY | 12/31/2012 Previously published | Effects of new pronouncements | 12/31/2012 restated | 01/01/2012 previously published | Efeito Effect of new pronouncements | 01/01/2012 restated | ||||||||||||||||||
CURRENT | ||||||||||||||||||||||||
Loans and financing | 4,447,175 | (3,109,896 | ) | 1,337,279 | 4,005,326 | (2,367,462 | ) | 1,637,864 | ||||||||||||||||
Debentures | 316,899 | (315,594 | ) | 1,305 | 739,237 | (739,237 | ) | — | ||||||||||||||||
Financial liability | 52,862 | 734,253 | 787,115 | — | — | — | ||||||||||||||||||
Compulsory loan | 12,298 | — | 12,298 | 15,620 | 711 | 16,331 | ||||||||||||||||||
Providers | 7,490,802 | (1,067,728 | ) | 6,423,074 | 6,338,102 | (850,155 | ) | 5,487,947 | ||||||||||||||||
Advances from customers | 469,892 | — | 469,892 | 413,041 | — | 413,041 | ||||||||||||||||||
Taxes payable | 886,312 | (71,890 | ) | 814,422 | 815,236 | 4,540 | 819,776 | |||||||||||||||||
Income and Social Contribution Taxes | 370,704 | (56,816 | ) | 313,888 | 217,285 | (86,876 | ) | 130,409 | ||||||||||||||||
Fuel Consumption Account - CCC | 1,369,201 | — | 1,369,201 | 3,079,796 | — | 3,079,796 | ||||||||||||||||||
Remuneration to shareholders | 3,977,667 | (25,399 | ) | 3,952,268 | 4,373,773 | (23,264 | ) | 4,350,509 | ||||||||||||||||
Credit Treasury | 131,047 | — | 131,047 | 109,050 | — | 109,050 | ||||||||||||||||||
Estimated obligations | 1,444,992 | (271,314 | ) | 1,173,678 | 802,864 | (29,984 | ) | 772,880 | ||||||||||||||||
Reimbursement Obligations | 5,988,698 | — | 5,988,698 | 1,955,966 | — | 1,955,966 | ||||||||||||||||||
Post-employment benefit | 118,553 | 9,440 | 127,993 | 451,801 | (5,435 | ) | 446,366 | |||||||||||||||||
Provisions for contingencies | 267,940 | (239,245 | ) | 28,695 | 240,190 | (209,363 | ) | 30,827 | ||||||||||||||||
Sector Charges | 1,308,152 | (653,922 | ) | 654,230 | 1,218,768 | (593,699 | ) | 625,069 | ||||||||||||||||
Leasing | 162,929 | — | 162,929 | 142,997 | — | 142,997 | ||||||||||||||||||
Grants payable - Use of Public Asset | 40,131 | (38,261 | ) | 1,870 | 35,233 | (35,233 | ) | — | ||||||||||||||||
Derivatives | 185,031 | — | 185,031 | 269,718 | (8,229 | ) | 261,489 | |||||||||||||||||
Adjustment plans of staff | — | — | — | — | — | — | ||||||||||||||||||
Other | 1,808,362 | (408,803 | ) | 1,399,559 | 900,806 | (50,946 | ) | 849,860 | ||||||||||||||||
|
|
|
|
|
|
|
|
|
|
|
| |||||||||||||
TOTAL CURRENT LIABILITIES | 30,849,647 | (5,515,175 | ) | 25,334,472 | 26,124,809 | (4,994,632 | ) | 21,130,177 | ||||||||||||||||
NON-CURRENT | ||||||||||||||||||||||||
Loans and financing | 45,204,025 | (19,911,154 | ) | 25,292,871 | 38,408,352 | (16,030,463 | ) | 22,377,889 | ||||||||||||||||
Credit Treasury | 37,072 | — | 37,072 | 155,676 | — | 155,676 | ||||||||||||||||||
Debentures | 409,228 | (341,213 | ) | 68,015 | 279,410 | (279,410 | ) | — | ||||||||||||||||
Advances from customers | 830,234 | — | 830,234 | 879,452 | — | 879,452 | ||||||||||||||||||
Compulsory loan | 321,894 | — | 321,894 | 211,554 | — | 211,554 | ||||||||||||||||||
Obligation for asset retirement | 988,490 | — | 988,490 | 408,712 | — | 408,712 | ||||||||||||||||||
Operating provisions | 1,005,908 | — | 1,005,908 | 843,029 | — | 843,029 | ||||||||||||||||||
Fuel Consumption Account - CCC | 2,401,069 | — | 2,401,069 | 954,013 | — | 954,013 | ||||||||||||||||||
Provisions for contingencies | 5,288,394 | (188,005 | ) | 5,100,389 | 4,652,176 | (211,008 | ) | 4,441,168 | ||||||||||||||||
Post-employment benefit | 4,628,570 | (1,853,779 | ) | 2,774,791 | 2,256,132 | (1,270,947 | ) | 985,185 | ||||||||||||||||
Onerous contracts | 4,905,524 | 250,000 | 5,155,524 | 96,204 | — | 96,204 | ||||||||||||||||||
Reimbursement obligations | 1,801,059 | — | 1,801,059 | 1,475,262 | — | 1,475,262 | ||||||||||||||||||
Leasing | 1,860,104 | — | 1,860,104 | 1,775,544 | — | 1,775,544 | ||||||||||||||||||
Remuneration to shareholders | — | — | — | 3,143,222 | — | 3,143,222 | ||||||||||||||||||
Grants payable - Use of Public Asset | 1,577,908 | (1,506,728 | ) | 71,180 | 1,534,532 | (1,471,102 | ) | 63,430 | ||||||||||||||||
Advances for future capital increase | 161,308 | — | 161,308 | 148,695 | 22,440 | 171,135 | ||||||||||||||||||
Derivatives | 291,252 | — | 291,252 | 197,965 | (12,934 | ) | 185,031 | |||||||||||||||||
Sector Charges | 428,501 | (118 | ) | 428,383 | 385,724 | 6,410 | 392,134 | |||||||||||||||||
Taxes payable | 635,269 | (14,872 | ) | 620,397 | 773,500 | 308,374 | 1,081,873 | |||||||||||||||||
Income and Social Contribution Taxes | 779,615 | (180,865 | ) | 598,750 | 1,129,022 | (556,598 | ) | 572,425 | ||||||||||||||||
Adjustment plans of staff | — | — | — | — | — | — | ||||||||||||||||||
Other | 509,915 | (499,457 | ) | 10,458 | 1,046,362 | (556,598 | ) | 844,533 | ||||||||||||||||
|
|
|
|
|
|
|
|
|
| |||||||||||||||
TOTAL NON-CURRENT LIABILITIES | 74,065,339 | (24,246,191 | ) | 49,819,148 | 60,754,538 | (556,598 | ) | 41,057,471 | ||||||||||||||||
| (556,598 | ) | |||||||||||||||||||||||
EQUITY | (556,598 | ) | ||||||||||||||||||||||
Capital | 31,305,331 | — | 31,305,331 | 31,305,331 | (556,598 | ) | 31,305,331 | |||||||||||||||||
Capital reserves | 26,048,342 | — | 26,048,342 | 26,048,342 | (556,598 | ) | 26,048,342 | |||||||||||||||||
Profit reserves | 10,836,414 | 524,811 | 11,361,225 | 18,571,011 | (556,598 | ) | 19,095,822 | |||||||||||||||||
Equity valuation adjustments | — | 208,672 | 208,672 | 220,915 | (556,598 | ) | 220,915 | |||||||||||||||||
Additional Proposed Dividend | 433,962 | — | 433,962 | 706,018 | (556,598 | ) | 706,018 | |||||||||||||||||
Accumulated other comprehensive income | (1,540,104 | ) | (733,483 | ) | (2,273,587 | ) | (8,111 | ) | (556,598 | ) | (532,919 | ) | ||||||||||||
Non-controlling shareholders | 196,648 | — | 196,648 | 358,812 | 13,847 | 372,659 | ||||||||||||||||||
|
|
|
|
|
|
|
|
|
|
|
| |||||||||||||
TOTAL EQUITY | 67,280,593 | — | 67,280,593 | 77,202,318 | 13,850 | 77,216,168 | ||||||||||||||||||
|
|
|
|
|
|
|
|
|
|
|
| |||||||||||||
TOTAL LIABILITIES AND SHAREHOLDERS ‘EQUITY | 172,195,579 | (29,761,366 | ) | 142,434,213 | 164,081,665 | (24,677,849 | ) | 139,403,816 | ||||||||||||||||
|
|
|
|
|
|
|
|
|
|
|
| |||||||||||||
F-29
Table of Contents
| b) | Effects of the adoption of new IFRS on consolidated results for the year ended December 31, 2012 results: |
| 12/31/2012 Previously published | Effects of new standards | 12/31/2012 restated | ||||||||||
OPERATIONAL NET REVENUE | 34,064,477 | (6,050,181 | ) | 28,014,296 | ||||||||
|
|
|
|
|
| |||||||
OPERATIONAL EXPENSES | ||||||||||||
Personnel, Supply and Services | 8,439,302 | (768,479 | ) | 7,670,823 | ||||||||
Electricity purchased for resale | 4,573,673 | 289,615 | 4,863,288 | |||||||||
Charges for use of transmission grid | 1,763,953 | (177,144 | ) | 1,586,809 | ||||||||
Construction - Distribution | 1,345,519 | — | 1,345,519 | |||||||||
Construction - Transmission | 3,681,603 | (1,721,129 | ) | 1,960,474 | ||||||||
Fuel for power production | 708,711 | (14,960 | ) | 693,751 | ||||||||
Remuneration and reimbursement | 1,651,724 | (983,801 | ) | 667,923 | ||||||||
Depreciation | 1,658,161 | (129,469 | ) | 1,528,692 | ||||||||
Amortization | 117,053 | 43,216 | 160,269 | |||||||||
Donations and contributions | 380,101 | (1,099 | ) | 379,002 | ||||||||
Operational provisions | 5,326,991 | (355,770 | ) | 4,971,221 | ||||||||
Loss carryforward of Itaipu | 491,859 | (491,859 | ) | — | ||||||||
Others | 2,257,666 | (443,550 | ) | 1,814,116 | ||||||||
|
|
|
|
|
| |||||||
| 32,396,316 | (4,754,429 | ) | 27,641,887 | |||||||||
OPERATING INCOME BEFORE FINANCIAL RESULTS | 1,668,161 | (1,295,752 | ) | 372,409 | ||||||||
|
|
|
|
|
| |||||||
FINANCIAL RESULTS | ||||||||||||
Financial Income | ||||||||||||
Interest income, commissions and fees | 767,534 | 404,497 | 1,172,031 | |||||||||
Income from financial investments | 1,731,870 | (165,995 | ) | 1,565,875 | ||||||||
Arrears surcharges on electricity | 230,597 | — | 230,597 | |||||||||
Indexation | 858,049 | (137,233 | ) | 720,816 | ||||||||
Exchange gains | 421,013 | 39,546 | 460,559 | |||||||||
Remuneration of Indemnities - Law 12.783/13 | 326,379 | (114,847 | ) | 211,532 | ||||||||
Other financial income | — | 297,411 | 297,411 | |||||||||
Financial Expenses | ||||||||||||
Debt charges | (2,333,643 | ) | 649,856 | (1,683,787 | ) | |||||||
Leasing charges | (412,152 | ) | — | (412,152 | ) | |||||||
Charges on shareholders’ funds | (572,322 | ) | 70,144 | (502,178 | ) | |||||||
Encargos sobre Títulos e Valores Mobiliários Negociados | — | |||||||||||
Variações cambiais passivas | — | |||||||||||
Juros sobre Capital Próprio | — | |||||||||||
Other financial expenses | (384,816 | ) | 38,528 | (346,288 | ) | |||||||
|
|
|
|
|
| |||||||
| 632,509 | 1,081,907 | 1,714,416 | ||||||||||
INCOME BEFORE EQUITY RESULTS | 2,300,669 | (213,844 | ) | 2,086,825 | ||||||||
EQUITY RESULTS | 468,584 | 143,618 | 612,202 | |||||||||
INCOME BEFORE INCOME TAX AND SOCIAL CONTRIBUTION | 2,769,254 | (70,227 | ) | 2,699,027 | ||||||||
|
|
|
|
|
| |||||||
Effects - Law 12.783/2013 | (10,085,380 | ) | — | (10,085,380 | ) | |||||||
LOSS AFTER THE LAW 12.783/2013 | (7,316,126 | ) | (70,227 | ) | (7,386,353 | ) | ||||||
|
|
|
|
|
| |||||||
Income tax | 244,688 | (312,559 | ) | (67,871 | ) | |||||||
Social contribution on net income | 145,786 | 412,727 | 558,513 | |||||||||
|
|
|
|
|
| |||||||
NET INCOME (LOSS) | (6,925,652 | ) | 29,941 | (6,895,711 | ) | |||||||
|
|
|
|
|
| |||||||
Portion attributable to controlling | (6,878,915 | ) | 29,940 | (6,848,975 | ) | |||||||
Portion attributable to noncontrolling | (46,737 | ) | 1 | (46,736 | ) | |||||||
|
|
|
|
|
| |||||||
F-30
Table of Contents
| c) | Effects of the adoption of new IFRS on the statement of cash flows for the year |
| 12/31/2012 previously published | Effect of new standards | 12/31/2012 restated | ||||||||||
| OPERATING ACTIVITIES | ||||||||||||
Income before income tax and social contribution | (7,316,126 | ) | (100,166 | ) | (7,416,292 | ) | ||||||
Adjustments to reconcile net income to cash provided by operations: | ||||||||||||
Depreciation and amortization | 1,775,214 | (86,253 | ) | 1,688,961 | ||||||||
Net monetary / exchange variations | (1,166,958 | ) | (345,820 | ) | (1,512,778 | ) | ||||||
Financial charges | 526,646 | (160,462 | ) | 366,185 | ||||||||
Revenue (expenses) from financial assets | (3,148,842 | ) | 296,510 | (2,852,332 | ) | |||||||
Equity income | (468,584 | ) | (143,617 | ) | (612,201 | ) | ||||||
Effects of Law 12.783/2013 | 10,085,380 | — | 10,085,380 | |||||||||
Allowance for doubtful accounts | 724,731 | 57,133 | 781,864 | |||||||||
Provision for contingencies | 564,909 | 14,942 | 579,851 | |||||||||
Provision for impairment of assets / onerous contract | 2,666,809 | 28,268 | 2,695,077 | |||||||||
Provision for loss on investments | 187,741 | — | 187,741 | |||||||||
Charges global reversal reserve | 367,741 | — | 367,741 | |||||||||
Adjustment to present value / market value | (157,364 | ) | (5,198 | ) | (162,562 | ) | ||||||
Minority interest in results | 70,814 | (2 | ) | 70,812 | ||||||||
Charges on shareholders’ funds | 572,322 | (70,144 | ) | 502,178 | ||||||||
Asset retirement | 126,979 | (126,979 | ) | — | ||||||||
Financial instruments gain (loss) - derivatives | (143,117 | ) | 39,254 | (103,863 | ) | |||||||
Others | 1,129,149 | (45,934 | ) | 1,083,215 | ||||||||
|
|
|
|
|
| |||||||
| 13,713,570 | (548,303 | ) | 13,165,267 | |||||||||
|
|
|
|
|
| |||||||
(Increases) / decreases in operating assets | ||||||||||||
Accounts receivable | (46,612 | ) | (30,515 | ) | (77,127 | ) | ||||||
Securities | 4,623,914 | 40,844 | 4,664,758 | |||||||||
Right to compensation | (4,432,739 | ) | 228,489 | (4,204,250 | ) | |||||||
Warehouse | (95,911 | ) | 326 | (95,585 | ) | |||||||
Supply of nuclear fuel | (17,950 | ) | — | (17,950 | ) | |||||||
Financial assets - public service concessions | (434,334 | ) | 95,368 | (338,966 | ) | |||||||
Others | (91,309 | ) | 62,269 | (29,040 | ) | |||||||
|
|
|
|
|
| |||||||
| (494,941 | ) | 396,781 | (98,160 | ) | ||||||||
|
|
|
|
|
| |||||||
Increase / (decrease) in operating liabilities | ||||||||||||
Suppliers | 1,045,106 | (123,627 | ) | 921,479 | ||||||||
Advances from customers | (47,733 | ) | — | (47,733 | ) | |||||||
Leasing | (113,374 | ) | 217,866 | 104,492 | ||||||||
Estimated obligations | 653,483 | (252,685 | ) | 400,798 | ||||||||
Reimbursement obligations | 4,418,652 | 190,794 | 4,609,446 | |||||||||
Sector charges | 132,161 | (66,751 | ) | 65,410 | ||||||||
Others | 302,958 | (644,131 | ) | (341,173 | ) | |||||||
|
|
|
|
|
| |||||||
| 6,391,254 | (678,534 | ) | 5,712,720 | |||||||||
|
|
|
|
|
| |||||||
Cash from operating activities | 12,293,757 | (930,222 | ) | 11,363,535 | ||||||||
|
|
|
|
|
| |||||||
Payment of financial charges | (1,812,722 | ) | 941,967 | (870,754 | ) | |||||||
Payment of costs of global reversion reserve | (257,580 | ) | — | (257,580 | ) | |||||||
Receipt of annual allowed revenue | 3,744,154 | (129,331 | ) | 3,614,823 | ||||||||
Receiving financial charges | 723,815 | 438,933 | 1,162,748 | |||||||||
Payment of income tax and social contribution | (1,010,379 | ) | 15,133 | (995,246 | ) | |||||||
Receipt of remuneration of investments in equity Partipacoes | 636,719 | (4,098 | ) | 632,621 | ||||||||
Payment of supplementary pension | — | (308,011 | ) | (308,011 | ) | |||||||
Pay for legal contingencies | — | (503,932 | ) | (503,932 | ) | |||||||
Escrow deposits | (491,175 | ) | 2,896 | (488,279 | ) | |||||||
|
|
|
|
|
| |||||||
| Net cash from operating activities | 13,826,590 | (476,665 | ) | 13,349,926 | ||||||||
|
|
|
|
|
| |||||||
| FINANCING ACTIVITIES | ||||||||||||
Long term loans and financing | 7,623,386 | (4,380,235 | ) | 3,243,151 | ||||||||
Payment of loans and financing | (4,156,422 | ) | 1,905,557 | (2,250,865 | ) | |||||||
Payment of remuneration to shareholders | (5,032,645 | ) | 50,696 | (4,981,948 | ) | |||||||
Payment of taxes and contributions refinancing | (110,745 | ) | (10 | ) | (110,755 | ) | ||||||
Compulsory loan and global reversal reserve | 885,457 | — | 885,457 | |||||||||
Others | (110,622 | ) | 224,842 | 114,220 | ||||||||
|
|
| �� |
|
| |||||||
| Net cash from financimento activities | (901,590 | ) | (2,199,150 | ) | (3,100,740 | ) | ||||||
|
|
|
|
|
| |||||||
| INVESTING ACTIVITIES | ||||||||||||
Lending and financing | (536,879 | ) | — | (536,879 | ) | |||||||
Receipt of loans and financing | 1,834,949 | (766,326 | ) | 1,068,623 | ||||||||
Energy credits received renegotiated | 313,865 | (313,865 | ) | — | ||||||||
Acquisition of fixed assets | (10,386,236 | ) | 6,649,069 | (3,737,167 | ) | |||||||
Acquisition of intangible assets | (144,768 | ) | 23,055 | (121,713 | ) | |||||||
Acquisition of concession assets | (4,918,121 | ) | 1,577,244 | (3,340,877 | ) | |||||||
Acquisition / capital increase in subsidiary | — | (4,090,940 | ) | (4,090,940 | ) | |||||||
Grant of advance for future capital increase | — | (139,862 | ) | (139,862 | ) | |||||||
Others | 381,778 | (340,477 | ) | 41,301 | ||||||||
|
|
|
|
|
| |||||||
| Net cash from investing activities | (13,455,412 | ) | 2,597,898 | (10,857,514 | ) | |||||||
|
|
|
|
|
| |||||||
| Increase (decrease) in cash and cash equivalents | (530,412 | ) | (77,917 | ) | (608,329 | ) | ||||||
|
|
|
|
|
| |||||||
Cash and cash equivalents at beginning of year | 4,959,787 | (1,849,943 | ) | 3,109,844 | ||||||||
Cash and cash equivalents at end of year | 4,429,375 | (1,927,860 | ) | 2,501,515 | ||||||||
|
|
|
|
|
| |||||||
| (530,412 | ) | (77,917 | ) | (608,329 | ) | |||||||
|
|
|
|
|
| |||||||
F-31
Table of Contents
(c.2) New and revised rules adopted with no material effect on the consolidated financial statements
Amendments to IFRS 7 - Disclosures - Offsetting Financial Assets and Financial Liabilities
The amendments to IFRS 7 require entities to disclose information about rights to compensation and related remedies (as reported on collateral requirements) for financial instruments under a compensation agreement or similar agreement.
This standard became effective on January 1, 2013 and had no impact on the consolidated financial statements.
IFRS 13 - Fair Value Measurements
IFRS 13 establishes a single source of rules for fair value measurements and disclosure about fair value measures. The scope of IFRS 13 is broad. The requirements for fair value measurement in IFRS 13 applies to items of financial instruments and non-financial instruments items for which other IFRSs require or permit fair value measurements and disclosures about fair value measurements, except share-based payment transactions on stocks that are within the scope of IFRS 2, lease transactions that are entered within the scope of IAS 17 and measurements that have some similarities to fair value but are not fair value (for example, the net realizable value for measurement of inventories or value in use for the purposes of assessing impairment).
This rule became effective on 1 January 2013 and had no impact on the consolidated financial statements.
IAS 19 Employee Benefits (as revised in 2011)
The IAS 19 (as revised in 2011) changes the accounting for defined benefit plans and termination benefits. The most significant change relates to the accounting for changes in defined benefit obligations and plan assets. The amendments require the recognition of changes in defined benefit obligations and the fair value of plan assets when they occur and thus eliminate the “corridor approach” permitted by the previous version of IAS 19 and accelerate the recognition of past service costs. All actuarial gains and losses are recognized immediately in other comprehensive income for the asset or net liability of the pension plan recognized in the balance sheet, reflects the full value of the deficit or surplus in the plan. In addition, the interest cost and expected return on plan assets used in the previous version of IAS 19 are replaced by a return value of “net interest” in accordance with IAS 19 (as revised in 2011), which is calculated by applying the discount rate to the net value of the assets or liabilities of defined benefit. Moreover, IAS 19 (as revised in 2011) introduces certain changes in the presentation of the cost of defined benefits, including more extensive disclosures.
This standard became effective on January 1, 2013. The Company has adopted the form of recognition described above, considering it was one of the options before the revision of normative described above, thus generating no impact on the consolidated financial statements.
F-32
Table of Contents
Amendments to IAS 1 Presentation of Financial Statements (as part of the Annual Improvements cycle of IFRS’s from 2009 to 2011 issued in May 2012)
The Annual Improvements to IFRSs 2009 - 2011 have made a number of amendments to IFRSs. The amendments that are relevant to the Group are the amendments to IAS 1 regarding when a statement of financial position as at the beginning of the preceding period (third statement of financial position) and the related notes are required to be presented. The amendments specify that a third statement of financial position is required when a) an entity applies an accounting policy retrospectively, or makes a retrospective restatement or reclassification of items in its financial statements, and b) the retrospective application, restatement or reclassification has a material effect on the information in the third statement of financial position. The amendments specify that related notes are not required to accompany the third statement of financial position.
In the current year, the Company has applied IFRSs 10, 11 and 12 as described above. This has resulted in a material effect on the information presented in the balance sheet at January 1, 2012. According to the amendments to IAS 1, the Company presented the balance sheet on January 1, 2012 without the related notes, except for the disclosure requirements of IAS 8.
(c.3) New and revised standars already issued and not yet adopted.
The IASB published or changed the following pronouncements, guidelines or accounting interpretations whose adoption should be made mandatory in subsequent periods:
Applicable on or after January 1, 2014:
IAS 36 - Impairment of assets (amendment) - introduces changes and clarifications of disclosures required by this standard.
IAS 39 - Financial Instruments - Recognition and Measurement (Amendment) - clarifies that there is no need to discontinue hedge accounting if the novation of a derivative contract is linked to a hedge, provided that certain conditions are met.
IAS 32 - Financial Instruments - Disclosure (amendment) - clarifies the conditions for the submission of one or more financial instruments at their net positions.
IFRS 10 - Consolidated Financial Statements, IFRS 12 - Disclosure of Interests in Other Entities and IAS 27 - Separate Financial Statements (Amendment) - introduces changes in the rules of consolidation, dissemination and presentation of separate statements for investment companies.
IFRIC 21 - Government Exchange (new interpretation) - introduces guide for when to recognize a fee imposed by a governmental entity.
F-33
Table of Contents
Applicable on or after January 1, 2015:
IFRS 9 (new standard) - introduces new requirements for classifying and measuring financial assets.
Modified IFRS 9 and IFRS 7 - Date of mandatory adoption of IFRS 9 and Transition Disclosures.
The Company is conducting its analysis of the impacts of these new pronouncements or changes in its financial statements.
3.2 Consolidation and investments basis in subsidiaries
The following accounting policies are applied in preparing the consolidated financial statements.
(a) Subsidiaries
Subsidiaries are all entities (including structured entities) in which, Eletrobras holds control. Eletrobras controls an entity when it is exposed, or has rights to variable returns arising from its involvement with the organization and has the ability to affect those returns because of the power it exercises over the entity. Subsidiaries are fully consolidated from the date on which control is transferred to Eletrobras. They are deconsolidated from the date that Eletrobras ceases to have control.
The consolidated financial statements include the financial statements of the Company and its subsidiaries. Control is achieved when the Company is exposed to, or has rights on variable returns from its involvement with the investee and has the ability to affect those returns through its power over the investee.
The results of subsidiaries acquired or disposed of during the year are included in the consolidated statements of income and comprehensive income from the effective date of acquisition until the effective date of disposal, as applicable.
When necessary, the financial statements of the investees are adjusted to conform their accounting policies to those of the Company. All transactions, balances, income and expenses between group companies are eliminated in the consolidated financial statements.
The consolidated financial statements reflect the balances of assets and liabilities as of December 31, 2013, December 31, 2012 and January 1, 2012 (balance sheet) and December 31, 2013 and 2012 (notes to the financial statements), and operations for the years ended December 31, 2013 and 2012 of the Company, its direct and indirect subsidiaries and jointly controlled entities.
The subsidiaries and jointly controlled entities are substantially domiciled in Brazil.
The Company has the following principal consolidation practices:
a) Elimination of investments in invested companies, in return for participation and in their shareholders equity;
b) Elimination of receivables and intercompany accounts payable; and
F-34
Table of Contents
| c) | Elimination of intercompany revenues and expenses. |
The Company uses the criteria of full consolidation that include the companies in the table below. The company’s interest is given as a total of the capital of the subsidiary.
| 12/31/2013 | 12/31/2012 | |||||||||||||||
| Equity | Equity | |||||||||||||||
Subsidiary | Direct | Indirect | Direct | Indirect | ||||||||||||
Amazonas Energia | 100 | % | — | 100 | % | — | ||||||||||
Ceal | 100 | % | — | 100 | % | — | ||||||||||
Cepisa | 100 | % | — | 100 | % | — | ||||||||||
Ceron | 100 | % | — | 100 | % | — | ||||||||||
CGTEE | 100 | % | — | 100 | % | — | ||||||||||
Chesf | 100 | % | — | 100 | % | — | ||||||||||
Eletroacre | 94 | % | — | 94 | % | — | ||||||||||
Eletronorte | 99 | % | — | 99 | % | — | ||||||||||
Eletronuclear | 100 | % | — | 100 | % | — | ||||||||||
Eletropar | 84 | % | — | 84 | % | — | ||||||||||
Eletrosul | 100 | % | — | 100 | % | — | ||||||||||
Furnas | 100 | % | — | 100 | % | — | ||||||||||
Boa Vista Energia | 100 | % | — | 100 | % | — | ||||||||||
RS Energia* | — | — | — | 100 | % | |||||||||||
Porto Velho Transmissora* | — | — | — | 100 | % | |||||||||||
Estação Transmissora | — | 100 | % | — | 100 | % | ||||||||||
Artemis* | — | — | — | 100 | % | |||||||||||
Rio Branco Transmissora* | — | — | — | 100 | % | |||||||||||
Cerro Chato I* | — | — | — | 90 | % | |||||||||||
Cerro Chato II* | — | — | — | 90 | % | |||||||||||
Cerro Chato III* | — | — | — | 90 | % | |||||||||||
Uirapuru | — | 75 | % | — | 75 | % | ||||||||||
| * | Merger Entities (Note 3.2 (d)) |
The consolidated financial statements include the accounts and transactions of the exclusive funds whose only shareholders are the Company and its subsidiaries, made-up of public, private and debentures of companies with securities rating of low risk and high liquidity of the stock.
Exclusive funds regularly have their financial statements reviewed / audited. These are subject to the restricted payments for services provided by the asset manager. For this reason, there are no relevant financial obligations.
(b) Investments in associates
An associate is an entity over which the Group has significant influence. Significant influence is the power to participate in the financial and operating policy decisions of the investee but is not control or joint control over those policies.
F-35
Table of Contents
Investments in associates and jointly controlled entities are accounted for using the equity method and are initially recognized at cost and then adjusted for recognition of the Company’s profit or loss and any other comprehensive income of the associate.
Any amount that exceeds the cost of acquisition over the Company’s interest in the net fair value of the assets, liabilities and contingent liabilities of the associate at the date of acquisition is recognized as goodwill. The premium is added to the carrying amount of the investment. Any amount of the Company’s interest in the net fair value of the assets, liabilities and contingent liabilities that exceeds the cost of acquisition, after reassessment, is recognized immediately in income.
When the Company’s share in the loss of an associate is greater than the Company’s equity interest in that associate (including any long-term investment in the associate), the Company does not recognize its equity interest under additional losses. Additional losses are only recognized if the Company has incurred legal or constructive obligations or made payments on behalf of the associate.
(c) Investments in joint venture and joint operations
A joint operation is a joint arrangement whereby the parties that have joint control of the arrangement have rights to the assets, and obligations for the liabilities, relating to the arrangement. Joint control is the contractually agreed sharing of control of an arrangement, which exists only when decisions about the relevant activities require unanimous consent of the parties sharing control. The Group accounts for the assets, liabilities, revenues and expenses relating to its interest in a joint operation in accordance with the IFRSs applicable to the particular assets, liabilities, revenues and expenses.
When a subsidiary of the Company directly carries out its activities through a joint venture, the Company’s interest in the jointly controlled company and any liabilities incurred are recognized in the financial statements of its subsidiary and classified according to their nature. Liabilities and expenses incurred directly in respect of interests in jointly controlled assets are accounted for on an accrual basis. Any gain from the sale or use of the Company’s interest in income of jointly controlled assets, and its share of any expenses incurred by the joint venture are recognized when it is likely that the economic benefits associated with the transactions will flow to / from the Company and its value can be measured reliably.
The Company reports its interests in joint ventures in its consolidated financial statements using the equity method.
F-36
Table of Contents
(d) Merger of Subsidiaries
The shareholders of Eletrosul approved the incorporation to its assets during 2013, by means of merging, the following Special Purpose Entities into Eletrosul:
Specific Purpose Company Incorporated | Eletrosul Participation (%) | Date of Incorporation | ||||||
Artemis Transmissora de Energia S/A | 100,0 | % | 11.01.2013 | |||||
Empresa de Transmissão de Energia do Rio Grande do Sul S/A | 100,0 | % | 05.29.2013 | |||||
Eólica Cerro Chato I S/A | 100.0 | % | 05.29.2013 | |||||
Eólica Cerro Chato II S/A | 100,0 | % | 05.29.2013 | |||||
Eólica Cerro Chato III S/A | 100,0 | % | 05.29.2013 | |||||
Porto Velho Transmissora de Energia S/A | 100,0 | % | 05.29.2013 | |||||
As Eletrosul owned all the shares in the stock capital of the merged companies, the merger was performed without a capital increase or the issuance of new shares.
The following are the assets and liabilities of the merged companies:
| ASSETS | Artemis | RS Energia | PVTE | Cerro Chato I | Cerro Chato II | Cerro Chato I | ||||||||||||||||||
Current | 39,436 | 37,889 | 45,847 | 16,257 | 11,259 | 11,379 | ||||||||||||||||||
Cash and cash equivalents | 22,884 | 12,846 | 15,437 | 14,549 | 9,619 | 9,737 | ||||||||||||||||||
Concessionaires and licensees | 8,152 | 5,108 | 6,169 | 1,214 | 1,214 | 1,214 | ||||||||||||||||||
Other receivables | 204 | 9,855 | 2,278 | 494 | 426 | 428 | ||||||||||||||||||
Financial assets at amortized RAP | 8,196 | 10,080 | 21,963 | — | ||||||||||||||||||||
Noncurrent | 247,080 | 352,672 | 581,461 | 138,165 | 136,492 | 132,487 | ||||||||||||||||||
Linked funds | 7,815 | — | 12,774 | — | — | — | ||||||||||||||||||
Deferred tax | 2,310 | 3,390 | 2,212 | 554 | 492 | — | ||||||||||||||||||
Financial assets at amortized RAP | 169,939 | 243,695 | 394,364 | — | — | — | ||||||||||||||||||
Compensable financial asset | 67,016 | 98,693 | 149,588 | — | — | — | ||||||||||||||||||
Escrow deposits | — | 6,789 | 22,396 | — | — | — | ||||||||||||||||||
Other assets | — | — | — | 6 | 170 | — | ||||||||||||||||||
Fixed Assets | — | 105 | 127 | 137,605 | 135,830 | 132,487 | ||||||||||||||||||
TOTAL OF ASSETS | 286,516 | 390,561 | 627,308 | 154,422 | 147,751 | 143,866 | ||||||||||||||||||
| LIABILITIES AND EQUITY | Artemis | RS Energia | PVTE | Cerro Chato I | Cerro Chato II | Cerro Chato I | ||||||||||||||||||
Current | 47,194 | 23,677 | 57,335 | 9,943 | 9,861 | 10,204 | ||||||||||||||||||
Loans and financing | 14,908 | 15,836 | 3,665 | 9,452 | 9,440 | 9,440 | ||||||||||||||||||
Providers | 538 | 3,157 | 1,581 | 92 | 92 | 94 | ||||||||||||||||||
Taxes payable | 12,289 | 456 | 1,961 | 399 | 323 | 375 | ||||||||||||||||||
Dividends payable | 15,649 | — | — | — | — | 289 | ||||||||||||||||||
Regulatory fees | 2,868 | 1,020 | 1,605 | — | — | — | ||||||||||||||||||
Other provisions and payables | 942 | 3,208 | 1,523 | — | 6 | 6 | ||||||||||||||||||
Noncurrent | 70,047 | 127,752 | 265,845 | 57,654 | 57,406 | 57,412 | ||||||||||||||||||
Loans and Financing | 67,623 | 127,752 | 249,469 | 57,483 | 57,406 | 57,406 | ||||||||||||||||||
Deferred tax | 2,424 | — | 1,374 | — | — | — | ||||||||||||||||||
Advances future capital increase | — | — | 15,000 | — | — | — | ||||||||||||||||||
Other liabilities | — | — | 2 | 171 | — | 6 | ||||||||||||||||||
Net worth | 169,275 | 239,132 | 304,128 | 86,825 | 80,484 | 76,250 | ||||||||||||||||||
Social capital | 139,734 | 221,325 | 297,793 | 86,940 | 81,890 | 74,970 | ||||||||||||||||||
Legal reserves | 6,143 | 733 | — | — | — | 57 | ||||||||||||||||||
Other Profit Reserves | 22,417 | 13,914 | — | — | — | 791 | ||||||||||||||||||
Earnings / Accumulated Losses | 981 | 3,160 | 6,335 | 115 | 606 | 432 | ||||||||||||||||||
TOTAL OF LIABILITIES AND EQUITY | 286,516 | 390,561 | 627,308 | 154,422 | 147,751 | 143,866 | ||||||||||||||||||
F-37
Table of Contents
On December 30, 2013, the shareholders of Eletronorte approved at an Extraordinary General Meeting its merger with Rio Branco Transmissora de Energia S.A., a special purpose subsidiary of the Company, to simplify its legal structure and reduce administrative and tax costs, and to maximize its efficiency. As a result of this merger, the company Rio Branco Transmissora de Energia S.A was extinguished and the Company became its successor.
Below we present the net assets and liabilities of the acquired company:
RIO BRANCO TRANSMISSORA DE ENERGIA S.A.
BALANCE SHEETS AS OF DECEMBER 30, 2013
Incorporation balance sheets | ||||||||||
ASSETS | LIABILITIES | |||||||||
Current | Current | |||||||||
Cash and cash equivalents | 8,899 | Suppliers | 249 | |||||||
Reibursement Rights | 3,372 | Loans and financing | 16,336 | |||||||
Taxes payable | 285 | |||||||||
Other payables | 1,106 | |||||||||
|
|
|
| |||||||
Total current assets | 12,271 | Total current liabilities | 17,976 | |||||||
|
|
|
| |||||||
Non current | Non current | |||||||||
Financial assets | 297,558 | Loans and financing | 123,403 | |||||||
Escrow deposits | 106 | Deferred taxes | 3,918 | |||||||
Deferred taxes | 407 | Provision for contingencies | 2 | |||||||
Fixed assets | 38 | |||||||||
|
|
|
| |||||||
Total non current assets | 298,109 | Total non current liabilities | 127,323 | |||||||
|
|
|
| |||||||
EQUITY | ||||||||||
Capital stock | 156,082 | |||||||||
Reserves | 8,999 | |||||||||
|
| |||||||||
Total Equity | 165,081 | |||||||||
|
| |||||||||
Total assets | 310,380 | Total of Liabilities and Equity | 310,380 | |||||||
|
|
|
| |||||||
(e) Foreign Currency Translation
(e.1) Functional and reporting currency
The items included in the financial statements of each company of the Group are measured using the currency of main economic environment in which the company operates (“the functional currency”).
The functional currency of the jointly-controlled entity Itaipu Binacional between Brazil and Paraguay is the U.S. dollar.
F-38
Table of Contents
The functional currency of the Special Purpose Entity, which operates in the international economic environment, is generally the currency of the country where the mentioned SPE operates.
In preparing the financial statements of the individual companies, transactions in currencies other than the entity’s functional currency (foreign currencies) are recognized at the rates of exchange prevailing on the dates of the transactions. At each balance sheet date, monetary assets and liabilities that are denominated in foreign currencies are retranslated at the rates prevailing at that date. Non-monetary items carried at fair value that are denominated in foreign currencies are translated at the rates prevailing at the date when the fair value was determined. Non-monetary items that are measured in terms of historical cost in a foreign currency are not retranslated.
Exchange differences are recognized in profit or loss in the period in which they arise except for:
| • | exchange differences on foreign currency borrowings relating to assets under construction for future productive use, which are included in the cost of those assets when they are regarded as an adjustment to interest costs on those foreign currency borrowings; |
| • | exchange differences on transactions entered into to hedge certain foreign currency risks; and |
| • | exchange differences on monetary items receivable from or payable to a foreign operation for which settlement is neither planned nor likely to occur (therefore forming part of the net investment in the foreign operation), which are recognized initially in other comprehensive income and reclassified from equity to profit or loss on disposal or partial disposal of the net investment. |
For the purpose of presenting consolidated financial statements, the assets and liabilities of the group’s foreign operations are translated at exchange rates prevailing on the balance sheet date. Income and expense items are translated at the average exchange rates for the period, unless exchange rates fluctuate significantly during that period, in which case the exchange rates at the date of transactions are used. Exchange differences arising, if any, are recognized in other comprehensive income and accumulated in equity (attributed to non-controlling interests as appropriate).
The Consolidated Financial Statements are presented in reais (R$), which is the parent company’s functional and reporting currency.
3.3. Cash and cash equivalent
Cash and cash equivalents include cash, bank deposits and other short-term highly liquid investments with original maturities of three months and with insignificant risk of change in value.
F-39
Table of Contents
3.4. Customers and provision for doubtful accounts
Accounts receivable from customers (consumers and retailers) are composed of credits from the sale and supply of electricity, including those resulting from electricity traded under the Câmara de Comercialização de Energia Elétrica – CCEE, and are initially recognized at fair value and subsequently measured at amortized cost less allowance for doubtful accounts cost.
Accounts receivable are generally settled within a period of 45 days, which is why the book value represents substantially the fair value on the date of the book’s closure.
The balance also includes the power supply from distribution activities which has not yet been billed. This is measured based on estimates, taking in to consideration the historical consumption of MW/h.
If the maturity is equivalent to one year or less, the receivables are classified as current assets. Otherwise, they are presented as non-current assets (Note 7).
3.5. Fuel Consumption Account - FCA
Under Law 8,631, of March 4, 1993, the Company administers the amounts for payments made by concession holders of public electricity service to the Fuel Consumption Account – FCA. This corresponds to annual expenses to subsidize fuels for electricity generation. The amounts are recorded under current assets. Current liabilities account for the available funds, held in a bank account, and shares unsettled by concession holders. The amounts recorded as assets are fixed by the profitability of the investment and represent restricted cash and may not be used for other purposes.
Operations with FCA do not affect the Company’s results.
3.6. Guarantees and Restricted Deposits
The recorded amounts are reserved for legal and/or contractual compliance. They are measured by their acquisition cost plus interest and monetary restatement based on legal provisions and adjusted for impairment where applicable. These assets are considered loans and receivables, and their redemption is conditioned to the conclusion of legal proceedings to which these deposits are connected.
3.7. Warehouse
Warehouse materials, classified as current assets, are registered at average acquisition cost, which does not exceed their replacement costs or net realization value. The inventories costs are determined by the average cost method. The net realization value represents the estimated selling price for inventories less all estimated costs for the conclusion and necessary costs to make the sale.
3.8. Supply of nuclear fuel
Composed of uranium concentrate in stock, the corresponding services and elements of nuclear fuel used in nuclear power plants, Angra I and Angra II, are recorded at their acquisition cost.
F-40
Table of Contents
Uranium ore and the services necessary for its manufacturing are accounted for as noncurrent assets, under Nuclear Fuel Inventory. Once manufactured, the portion to be consumed in the next 12 months is classified as a current asset.
The consumption of nuclear fuel elements is proportionally recognized in the income statement, considering the monthly electricity actually generated in relation to the total energy provided for each fuel element. Inventory and evaluation of used nuclear fuel elements is carried out periodically.
3.9. Fixed assets
The Company has evaluated that part of its generation assets, including nuclear generation and certain assets of corporate use are not within the scope of IFRIC 12 – Service Concession Agreements (Note 3.10). Until December 31, 2011, these assets were accounted for at value cost, minus depreciation and impairment losses for assets which do not have their concession agreement renewed. As of December 31, 2012, supported by its concession agreements and the applicable indemnity rules pursuant to Law 12,783/2013 (see note 2.1), the Company considered the reversal of residual net assets to the Federal Government at the end of the concession. Thus, for the concession’s not renewed, the company began to estimate that these assets may be indemnified by the depreciated New Replacement Value (VNR). Calculated based on the methodology, the parameters and the basic criteria used by the Energy Research Company - EPE in the calculation of indemnification from the concession holders directly affected by Law 12,783/2013, and keeping the lower value between the net book value and the estimated NRV. For qualifying assets, borrowing costs are capitalized in accordance to the Company’s accounting policy. These fixed assets are classified in the appropriate categories of fixed assets when they are concluded and ready for their intended use. Depreciation of these assets starts when they are ready for the intended use in the same basis as other fixed assets.
Depreciation is calculated based on the estimated useful life of each asset, by the linear method, so that the cost value less its residual value, after its useful life, is fully written off (except for land and constructions in progress). The Company considers that the estimated useful life of each asset is similar to the depreciation rates established by ANEEL, which are deemed acceptable by the market as they appropriately express assets’ useful life. Additionally, in connection with the Company’s understanding of the current regulatory framework for concessions, it has been considered the indemnification at the end of the concession based on the lower value between the VNR or net book value, this factor being considered in measurement of fixed assets (see details in Note 16).
Assets held through financial leasing are depreciated by the expected useful life, as assets owned by the Company, or for a shorter period, when applicable, under the terms of the respective leasing contract.
A fixed asset item is written off after sale or when there are no future economic benefits resulting from continuous use of the asset. Any gains and losses in sales or write-off of fixed asset items are determined by the difference between the amounts received from the sale and the carrying amount and are recognized in the income statement of the year.
F-41
Table of Contents
3.9.1. Borrowing costs
Borrowing costs directly attributable to the acquisition, construction or production of qualifying assets, which are assets that necessarily take a substantial period of time to get ready for their intended use or sale, are added to the cost of those assets, until such time as the assets are substantially ready for their intended use or sale. The company considers the following criteria:
| a) | The capitalization period occurs when the qualifying asset is under construction, and interest capitalization ceases when the item is available for use; |
| b) | Interest is capitalized based on the weighted average rate of the loans and financing outstanding on the date of capitalization, or for those assets in which there are specific loans, the rates of these specific loans; |
| c) | Interest, which capitalizes on a monthly basis, does not exceed the amount of interest incurred during the capitalization period; |
| d) | Capitalized interests are depreciated using the same criteria than the estimated useful life of the item for which they have been incorporated. |
To the extent that variable rate borrowings are used to finance a qualifying asset and are hedged in an effective cash flow hedge of interest rate risk, the effective portion of the derivative is recognized in other comprehensive income and released to profit or loss when the qualifying asset impacts profit or loss. To the extent that fixed rate borrowings are used to finance a qualifying asset and are hedged in an effective fair value hedge of interest rate risk, the capitalised borrowing costs reflect the hedged interest rate.
Gains on investments arising from temporary investment of resources from specific loans and financing, not spent yet with the qualifying asset, are deducted from borrowing costs and financing eligible for capitalization, whenever the effect is material.
All other borrowing costs and financings are recognized in the income statement of the year they are incurred.
3.10. Concession contracts
The Company has concession contracts in the sectors of generation, transmission and distribution of electricity, signed with the granting power of the Brazilian federal government, for periods ranging from 20 years to 35 years, being all contracts by sector and being very similar in terms of rights and obligations of the concessionaire and of the Federal Government. The terms of the main concessions are described in Note 2, and the alterations and effects arising from Law 12,783/2013 are demonstrated in Note 2.1.
I – Tariff System
| a) | The electricity distribution tariff system is controlled by the National Electricity Regulatory Agency – ANEEL, and such tariffs are annually adjusted, and reviewed each four year period, aimed at maintaining the economical-financial balance of the concessionaire, considering conservative investments made and the cost and expense structure of the reference company. The services are charged directly to the users, based on the volume of the consumed electricity and the authorized tariff (See Note 17 b). |
F-42
Table of Contents
| b) | The electricity transmission tariff system is regulated by ANEEL and there are periodic tariff reviews being established an Annual Allowed Revenue – RAP. The RAP is updated annually by an inflation rate and subject to periodic reviews to make up for new investments and occasional issues of economic-financial balance of the concession contracts. This tariff system was modified for the concessions renewed pursuant to Law 12,783/2013 (See note 17 b). |
| c) | The electricity generation tariff system was, in general, based on a regulated tariff until 2004. After this date, in connection with the changes in regulations for this sector, it changed from tariff basis to a price system. The electricity generation companies are free to participate in electricity auctions for the regulated market. In this case, a base price and the final price are established in a competition between the participants at the auction. Additionally, electricity generation companies may enter into sale agreements with consumers qualifying in the free consumers category (definition based in demanded power in MW). This tariff system was modified for the concessions renewed pursuant to Law 12,783/2013 (See Note 2.1). |
II – Transmission and Distribution Concessions
Concession contracts regulate the activities of electricity distribution and transmission of public utilities by the Company, where:
1) Electricity distribution
a) The contract establishes which services the operator shall render and to whom (in the consumer class) the services shall be rendered;
b) The contract establishes performance standards for public utility, related to maintaining and improving service quality to the consumers. When the concession matures, the concessionaire is required to return the infrastructure in the same conditions that it had received it when it entered into these contracts. To comply with these obligations, constant investments are made during the term of the concession. Therefore, assets linked to the concession might be replaced, sometimes, until the end of the concession;
c) At the end of the concession, assets linked to infrastructure must revert to the Federal Government through the payment of an indemnity determined by Regulatory Remuneration Base – RRB depreciated (See Note 2.1)
2) Electricity transmission
a) The price (tariff) is regulated and denominated Annual Allowed Revenue (RAP). The electricity transmission company cannot negotiate prices with users. For some contracts, RAP is fixed and monetarily updated by price indexes once a year. For the remaining contracts, RAP is monetarily updated by a price index once a year, and is reviewed each five years. Generally, RAP for any electricity transmission company is subject to annual review due to increasing assets and operational expenses arising from modifications, improvements and enlargement of facilities. Tariffs level (RAP) was changed from the renewal of concessions directly affected by Law 12,783/2013 (See Note 2.1).
b) Assets are revertible at the end of the concession and are entitled to indemnification (cash) from the Federal Government on investments not yet amortized, determined by the new replacement value - VNR. There are still assets of renovated concessions, outstanding grants approval of ANEEL, and hence, pending indemnification, see details in Note 2.1.
F-43
Table of Contents
II.1 Adoption of IFRIC 12 - Services Concession Agreements, applicable to public-private concession contracts in which the public entity:
a) Controls or regulates the type of services that may be rendered, with resources to the underlying infrastructure;
b) Controls or regulates the price for the services rendered;
c) Controls/holds significant interest in the infrastructure at the end of the concession.
A public-private concession typically presents the following characteristics:
a) An infrastructure underlying to the concession, which is used to render services;
b) An agreement/contract between the Federal Government and operator;
c) The operator renders a set of services during the concession;
d) The operator receives compensation throughout the term of the concession agreement, either directly from the Federal Government, or from users of the infrastructure, or from both;
e) Infrastructures are transferred to the Federal Government at the end of the concession, usually free of charge or also by means of payment.
According to IFRIC 12, concession infrastructures qualifying in the rule are not recognized by the concessionaire as fixed assets, once the operator is not deemed to be in control of such assets. These are, therefore, accounted for using one of the following accounting models, depending on the type of compensation commitment assumed by the Federal Government within the scope of the contract:
| 1) | Financial asset model |
This model is applicable when the concessionaire has an unconditional right to receive certain monetary amounts regardless of the level of usage of the infrastructures under the concession and it results in registering a financial asset, which was classified as loans and receivables (generation or transmission) or available to sell (distribution).
| 2) | Intangible asset model |
This model is applicable when the concessionaire, within the scope of the concession, is compensated based on the degree of infrastructures usage (credit risk and demand) related to the concession, and it results in registering an intangible asset.
F-44
Table of Contents
| 3) | Mixed model |
This model is applied when the concession includes compensation guaranteed by the Federal Government and compensation depending on usage level of the concession infrastructure.
Based on the characteristics established in the electricity distribution concession contracts of the Company and its subsidiaries and in the requirements of the rule, the following assets are recognized in the electricity distribution business:
| a) | Estimated share of the net amortized or depreciated investments made until the end of the concession are classified as a financial asset, as they are an unconditional right to receive cash or other financial asset directly from the Federal Government; and |
| b) | Remaining portion of the financial asset (residual value) is classified as an intangible asset due to its recovery being subject to the use of the public service, in this case, electricity consumption by consumers. |
The infrastructure received or built for the distribution activity is recovered through two cash flows, as follows:
| a) | Partly through electricity consumption by consumers (monthly invoicing based on the measure of electricity and power consumed/sold) during the term of concession; and |
| b) | Partly as an indemnification of the reversible assets at the end of the concession, to be received directly from the Federal Government or from whom it delegates this task to. |
This indemnification shall be paid based on investments related to reversible assets, not yet amortized or depreciated, that have been made aiming at assuring the services continuity and efficiency.
The electricity distribution concessions of the Company and its subsidiaries are not onerous. Therefore, there are neither fixed financial obligations nor payments to be made to the granting authority.
For the electricity transmission activity, the Annual Allowed Revenue – RAP is received from companies that use its infrastructure through the tariff for transmission system use (TUST). This tariff results from dividing some specific values amongst transmission users; (i) the RAP of all transmission companies; (II) services rendered by the National Electric System Operator - ONS; and (III) regulatory charges.
The Federal Government has delegated to generation companies, distribution companies, free consumers, export and import companies the monthly payment of RAP, which can be granted by the transmission of the regulatory framework, constituting an unconditional contractual right to receive cash or other financial asset. For this reason, the credit risk is low.
Considering that the Company is not exposed to credit risks and the demand and revenue is earned based in the availability of transmission lines, all the infrastructure was accounted for as a financial asset.
F-45
Table of Contents
The financial asset includes the indemnification that shall be paid based on parts of investments linked to reversible assets, not yet amortized or depreciated, which have been made in order to ensure the continuity and efficiency of the services.
III. Generation Concessions
| a) | Hydraulic and thermal generation – the concessions, not directly affected by Law 12,783/2013 (See Note 2.1), are not within the scope of IFRIC 12, in view of price characteristics instead of regulated tariff. The only exception refers to generation at Amazonas Energia, which is destined exclusively to the distribution operation and which has a specific tariff mechanism. As of January 1, 2013, the concessions directly affected by Law 12,783/2013 and beyond the scope of IFRIC 12, become part of the scope of such regulations. |
| b) | Nuclear generation – It has a defined tariff system, however, it differs from other generation contracts for being a permission instead of a concession. There is no established term for the end of the permission as well as the characteristics of significant control of the assets by the Federal Government at the end of the permission period. |
IV. Itaipu Binacional
a) Itaipu Binacional is governed by a Bilateral Treaty signed in 1973 in which the tariff conditions were established, considering the basis of tariff formation as being determined exclusively to cover expenses and service the debt of this Company;
b) Tariff basis and trading terms are in force until 2023, which corresponds to a significant part of the useful life of the power plant.
The infrastructure has been classified as a financial asset taking into consideration the following aspects:
c) The financial flow was established mainly to enable payment of the debt service, with final maturity in 2023;
d) The trading of electricity from Itaipu was subrogated to the Company, however it arose from previously signed contracts with distribution companies, under previously defined payment conditions.
e) Pursuant to Law 10,438, of April 26, 2002, the commitments of acquisition and transfer to distribution concession holders of electricity services from Itaipu Binacional signed so far by Furnas and Eletrosul, subsidiaries of Eletrobras, with electricity distribution concession holders were transferred to the Company. Debt arising from trading electricity from Itaipu Binacional was renegotiated with the Company, originating financing contracts. These contracts were initially accounted for at fair value, and, subsequently, measured at amortized cost using the effective interest method.
f) The terms of the treaty guarantee the reimbursement of the Company even in the event of lack of generating capacity or operational problems with the power plant.
F-46
Table of Contents
V. Financial asset – Public Utility Concessions
The Company recognizes a receivable credit from the Federal Government (or from whom the Federal Government has granted it to) when it has an unconditional right to receive cash at the end of the concession as an indemnification for investments made by electricity distribution, transmission and generation companies and not recovered through services related to the concession. These financial assets are accounted for at fair value of the rights and are calculated based on the estimated part of investments made and not amortized or depreciated until the end of the concession. Assets related to electricity distribution are compensated based on the Weighted Average Cost of Capital - WACC (capital cost) regulatory remuneration, being this factor included in the tariff basis and assets related to electricity transmission are compensated based on the internal rate of return of the enterprise. In the case of generation, only the assets related to concessions directly affected by Law 12,783/2013 (see note 2.1) and formed from the abovementioned law, are considered financial assets to be paid in the same manner as transmission, provided that the acquisition of such assets is approved by MME and ANEEL.
These accounts receivable are classified as current and non-current considering the receiving expectation of these amounts, based on the termination date of the concessions.
3.11 Intangible Assets
The Company recognizes as an intangible asset the right to charge users for providing electricity distribution services (for the generation, the infrastructure of Amazonas Energia, which has exclusive relation with distribution activity of this same company, is also classified as intangible asset). The intangible asset is determined as the residual value of the construction revenue earned for the construction or acquisition of infrastructure made by the Company and the amount of the financial asset related to the unconditional right to receive cash in the end of the concession as an indemnification.
The asset is presented net of accumulated amortization and impairment losses, when applicable.
The amortization of the intangible asset reflects the pattern in which the future economic benefits of the asset are expected to be consumed by the Company, or the final term of the concession, whichever may occur first. The consumption pattern of the assets is related to its economic useful life considering that the assets built by the Company comprise the calculation basis for measuring the tariff for rendering the services of the concession.
The amortization of the intangible asset starts when it is available for use, in its location and in the conditions necessary to operate in the expected manner by the Company. The amortization ceases when the asset has been fully consumed or written off, no longer comprising the calculation basis of the tariff for rendering the services of the concession, whichever may occurs first.
F-47
Table of Contents
The Company performs annually the recoverability test on their assets, using the method of present value of future cash flows generated by the assets considering that there is no active market for the assets connected to the concession (See Note 19).
Intangible assets are basically comprised by usage rights of the concession, but also include goodwill on the acquisition of investments and specific expenditures associated to the acquisition of rights, plus the respective implementation costs, as may be applicable.
Intangible assets with defined a useful life acquired separately are registered at cost, deduced of accumulated amortization and impairment losses. The amortization is accounted for by the linear method based on the estimated life cycle of the assets. The estimated useful life and the amortization method are reviewed in the end of each fiscal year and the effects of any changes are accounted for in a timely manner.
Intangible assets with an indefinite useful life are registered at cost, deducted from accumulated impairment losses.
3.11.1. Concessions (Use of Public Asset – UPA)
The Company and some subsidiaries have concession contracts with the Federal Government for usage of public property for electricity generation in certain power plants.
The amounts identified in the contracts are presented at future prices and, therefore, the Company and its subsidiaries have adjusted these contracts to present value based on the discount rate calculated for the maturity date.
The liability updating due to the discount rate and monetary restatement as defined in the concession contract is being capitalized in the assets during the construction of the power plants and will be, as of the date of startup, recognized directly in the income statement.
These assets are recorded in intangible assets as corresponding entry of non-current liability.
3.11.2 Expenditures with Studies and Projects
The amounts spent on studies and projects, including feasibility studies, hydroelectric utilization and transmission lines inventories are recognized as operating expenses until the economic feasibility of their exploration or the granting of the concession or authorization are effectively proved. From the concession and/or authorization for the exploration of the electricity public utility, or the confirmation of the project’s economic feasibility, the expenses incurred are capitalized as project development costs. Currently, the Company does not have capitalized amounts referring to expenses with studies and projects.
3.12 Impairment of non-financial assets, excluding goodwill
At the end of each fiscal year, the Company evaluates if there is any evidence that its non-financial assets have suffered any impairment losses. In case there is such evidence, the recoverable amount of the asset is estimated, in order to measure the amount of this loss, if any. When it is not possible to individually estimate the recoverable amount of an asset, the Company calculates the recoverable amount of the cash-generating unit to which the asset belongs.
F-48
Table of Contents
When a reasonable and consistent allocation basis can be identified, corporate assets are also allocated to individual cash generating units or to the smallest group of cash generating units to which a reasonable and consistent allocation basis can be identified.
The recoverable amount is the highest value between fair value less sale costs or the value in use. In the evaluation of the value in use, future estimated cash flows are discounted at present value at a discount rate which reflects an updated appraisal of the money value in time and of the specific risks related to the asset for which the estimated future cash flows was not made.
If the calculated recoverable amount of an asset (or cash generating unit) is lower than its carrying amount, the book equity value of the asset (or cash generating unit) is reduced to its recoverable amount. The loss corresponding to the reduction of the recoverable value is immediately recognized in the income statement.
When the impairment loss is subsequently reversed, there is an increase in the carrying amount of the asset (or cash generating unit) due to the reviewed estimate of its recoverable amount. Such increase cannot exceed the carrying amount that would have been determined if no impairment loss was accounted for the asset (or cash generating unit) in previous fiscal years. The reversal of the impairment loss is immediately recognized in the income statement.
Due to historical operational losses on distribution companies of Eletrobras, the Company annually performs the recoverability test using the method of the present value of future cash flows generated by the assets, resulting in an amount lower than the amount recorded in distribution companies (See Notes 2.1 and 18). In addition, for the other business units are subject to the impairment test through the discounted annual cash flow method. An assessment is individually made for each generation and transmission concession contract.
3.13. Goodwill
Goodwill resulting from a business combination is presented at cost on the date of the business combination, net of the accumulated impairment loss, if applicable.
Goodwill is not amortised but is reviewed for impairment at least annually. For the purpose of impairment testing, goodwill is allocated to each of the cash generating units of the Company (or groups of cash generating units) that will benefit from the synergies arising from the combination. Cash-generating units to which goodwill has been allocated are tested for impairment annually, or more frequently when there is an indication that the unit may be impaired. If the recoverable amount of the cash-generating unit is less than the carrying amount of the unit, the impairment loss is allocated first to reduce the carrying amount of any goodwill allocated to the unit and then to the other assets of the unit pro-rata on the basis of the carrying amount of each asset in the unit. An impairment loss recognized for goodwill is not reversed in a subsequent period.
F-49
Table of Contents
Considering that the investing operations of the Company are linked to operations under concession contracts, goodwill arising from the acquisition of such entities represents the concession right with a defined life cycle, accounted for as an intangible asset of the concession. The amortization is calculated according to the concession’s term.
F-50
Table of Contents
3.14. Business combinations
In consolidated financial statements, business acquisitions are accounted for under the acquisition method. The consideration transferred in a business combination is measured at fair value. Such fair value is calculated by the sum of the fair values of the assets transferred by the Company, the liabilities assumed by the Company on the date of acquisition with the former owners of the acquiree and the equity issued by the Company in exchange for control of the acquiree. The acquisition related costs are generally recognized in the outcome, when incurred.
On the acquisition date, the identifiable acquired assets and assumed liabilities are recognized at fair value at the acquisition date, except for:
| • | assets or deferred tax liabilities and assets and liabilities related to employee benefit arrangements are recognized and measured in accordance with IAS 12 - Income Taxes and IAS 19 - Employee Benefits, respectively; |
| • | liabilities or equity instruments related to the acquiree’s share-based payment agreements or Group share-based payment arrangements concluded in place to the acquiree’s share-based payment agreements are measured in accordance with IFRS 2 - Share-Based Payment at the acquisition date; and |
| • | assets (or disposal groups) classified as kept for sale according to IFRS 5 - Non-Current Assets Kept for Sale and Discontinued Operations which are measured by this Rule. |
Goodwill is measured as the excess of the sum of the (1) consideration transferred, (2) the value of the noncontrolling interest in the acquiree and; (3) the fair value of the acquirer’s previously owned interest in the acquiree (if any) over the net values of the acquisition date of the identifiable acquired assets and assumed liabilities. If, after evaluation, the net value of identifiable acquired assets and assumed liabilities at the acquisition date are greater than the sum: (1) of the consideration transferred; (2) the value of the noncontrolling interest in the acquired; (3) and the fair value of the acquirer’s previously held interest in the acquiree (if any), the excess is immediately recognized in the outcome as a gain.
Non-controlling interests that match current interests and grant their holders the right to a proportionate share of the entity’s net assets in the event of liquidation may be initially measured at fair value. This can also be measured based on the proportionate share from non-controlling interests in the recognized amounts of the acquiree’s identifiable net assets. The selection of the measurement method to be used is made on a transaction to transaction basis. Other kinds of non-controlling interests are measured at fair value or, when applicable, as described in other IFRS.
When the consideration transferred by the Company in a business combination includes assets or liabilities resulting from a contingent consideration arrangement, the contingent consideration is measured at fair value for the acquisition. In addition, it is included in the consideration transferred in a business combination. Changes in the fair value of contingent consideration classified as measurement period adjustments are retroactively adjusted with corresponding adjustments to goodwill. The measurement period adjustments represent adjustments resulting from additional information obtained during the “measurement period” (which may not exceed one year from the date of acquisition) relating to existing facts and circumstances at the date of acquisition. The measurement period shall not exceed one year from the date of purchase.
F-51
Table of Contents
The subsequent accounting for changes in fair value of contingent consideration not classified as measurement period adjustments depends on the classification of the contingent. The contingent consideration classified as equity is not re-evaluated for the subsequent financial statements dates and its corresponding settlement is accounted for in equity. The contingent consideration classified as asset or liability is re-evaluated on a subsequent date of the financial statements in accordance with IAS 39 - Financial Instruments: Recognition and Measurement, or IAS 37 - Provisions, Contingent Liabilities and Contingent Assets, as applicable, with the corresponding gain or loss recognized in the outcome.
When a business combination is achieved in stages, the previous interest held by the Company in the acquiree is re-evaluated at fair value at the acquisition date (i.e. the date on which the Company acquires control) and the corresponding gain or loss, if any, is recognized in the outcome. Values of acquired shares before the acquisition date which have previously been recognized in “Other comprehensive income” are reclassified in to profit and loss, to the extent that such treatment is appropriate in case such interest is sold.
If the initial accounting for a business combination is incomplete at the end of the period in which the combination occurred, the Company records the provisional figures of the items for which the accounting is incomplete. Those provisional amounts are adjusted during the measurement period (see above), or additional assets and liabilities are recognized to reflect new information relating to existing facts and circumstances at the acquisition date which, if known, would have affected the amounts recognized at that date.
Business combinations that occurred until December 31, 2008 were accounted for in accordance with the CVM instruction 247/1996. Goodwill and discounts ascertained by the acquisition of non-controlling interests after January 1, 2009, date of the initial IFRS usage, are fully allocated to the concession contract and recognized as intangible assets.
3.15. Taxation
Expenses with income tax and social contribution represent the sum of current and deferred taxes. In addition, the option of calculating taxes on the Company’s result is made through the real income method.
3.15.1 Current taxes
Provision for income tax (IRPJ) and social contribution (CSLL) is based on the taxable income for the year. Taxable income differs from the net income presented in the income statement, because excludes taxable revenues or deductible expenses in other years, as well as to excluding nontaxable or non-deductible items permanently. Provisions for income tax and social contribution are individually calculated for each subsidiary of the Company. The Group’s current tax is calculated using tax rates that have been enacted or substantially enacted by the end of the reporting period.
F-52
Table of Contents
3.15.2. Deferred taxes
Deferred income tax and social contribution are recognized based on temporary differences at the end of each reporting period between the balances of assets and the liabilities recognized in the financial statements and the corresponding tax basis used in the calculation of the taxable income, including the balance of tax losses, when applicable. Deferred tax liabilities are generally recognized on all taxable temporary differences and deferred tax assets are recognized on all deductible temporary differences, only when it is likely that the company will present future taxable income in a sufficient amount to use such deductible temporary differences.
The recovery of deferred tax assets is reviewed in the end of each reporting period and, when it is no longer likely that future taxable income will be available to allow the recovery of the full asset, or part of it, the balance of the asset is adjusted by the amount expected to be recovered.
Deferred tax assets and liabilities are measured by applicable tax rates in the period in which it is expected that the liability is settled or the asset is realized, based on tax rates established by tax legislation in force in the end of each reporting period, or when a new legislation has been approved. Measurement of deferred tax assets and liabilities reflects tax consequences resulting from the manner in which the Company expects, in the end of each reporting period, to recover or settle the carrying amount of these assets and liabilities.
Current and deferred taxes are recognized in the income statement, except when they correspond to items registered in Other Comprehensive Income, or directly in shareholders’ equity, a case in which current and deferred taxes are also recognized in Other Comprehensive Income or directly in shareholders’ equity, respectively. Where the current and deferred taxes are derived from the initial accounting of a business combination, the tax effect is considered in accounting for the business combination.
3.16. Financial instruments
Financial assets and liabilities are recognized whenever an entity of the Company is part of the contractual provisions of the agreement.
Financial assets and liabilities are initially measured at fair value.
Transaction costs directly attributable to the acquisition or issuance of financial assets and liabilities (except for financial assets and liabilities accounted for at fair value in the income statement) are added to or deduced from the fair value of financial assets or liabilities, if applicable, after initial recognition. Transaction costs directly attributable to acquisition of financial assets or liabilities at fair value through profit or loss are immediately recognized in the income statement.
3.16.1. Financial assets
Financial assets are classified in the following specific categories: financial assets at fair value through result, investments held to maturity, financial assets available for sale and loans and receivables. The classification depends on the nature and purpose of the financial assets and is determined on the date of the initial recognition.
F-53
Table of Contents
| (a) | Financial assets at fair value through profit or loss |
A financial asset is classified as held for trading if:
| a) | It is purchased primarily to be sold in the short term; or |
| b) | On initial recognition it is part of a portfolio of identified financial instruments that Eletrobras jointly manages and it has a recent actual pattern of obtaining short-term profits; or |
| c) | It is a derivative that is not designated as an instrument of effective “hedge”. |
A financial asset beyond those held for negotiation can be designed at fair value through the outcome in the initial recognition if:
| a) | Such designation significantly eliminates or reduces an inconsistency or measure or recognition that would otherwise arise; or |
| b) | The financial asset is part of a group of managed assets or financial liabilities or both; and |
| c) | Its performance is evaluated based on fair value, in accordance with the documented risk management strategy or Company’s investment, and when the information about the grouping is provided internally on the same basis; or |
| d) | It is part of a contract containing one or more embedded derivatives, and the IAS 39 - Financial Instruments: Recognition and Measurement allows the combined contract (asset or liability) to be fully designated at fair value through the profit or loss. |
The financial assets are classified at fair value through the result when they are held for negotiation with sales purpose in the short term or designed at fair value through the result.
The financial assets measured at fair value through the result are accounted for at fair value and any resulting gains or losses are recognized in the outcome. Net gains and losses recognized in the result incorporate other financial income and expenses in the income statement.
| (b) | Held-to-maturity investments |
Held-to-maturity investments correspond to non-derivative financial assets with fixed or determinable payments and fixed maturity date that the Company has the positive intention and ability of keeping until maturity. After initial recognition, held-to-maturity investments are measured at amortized cost using the effective interest method, minus possible loss impairment.
| (c) | Loans and receivables |
Loans and receivables are non-derivative financial assets with fixed or determinable payments that are not quoted in an active market. Loans and receivables (including accounts receivable from clients and others, cash and cash equivalents, and others) are initially accounted for by their acquisition value, which is the fair value of the paid price, including the transactions expenses. After the initial recognition it is measured at amortized cost using the effective interest method, deduced of any impairment losses.
Interest revenue is recognized through application of the effective interest rate.
F-54
Table of Contents
| (d) | Available-for-sale financial assets |
Available-for-sale financial assets correspond to non-derivative financial assets designated as available for sale, or not, classified as:
1) Financial assets at fair value through result,
2) Investments held to maturity, or
3) Loans and receivables.
Changes in the carrying value of monetary financial assets available for sale due to fluctuation in exchange rates (see below), the interest income calculated using the effective interest method and the dividends on stock investments available for sale are recognized in the income statement. The changes in the fair value of financial assets available for sale are recognized in Other comprehensive income. When the investment is sold or presents impairment, the cumulative gain or loss previously accounted in the Other comprehensive incomes is reclassified to the income statement.
3.16.2. Impairment of financial assets
Financial assets, except those designated at fair value through profit or loss, are evaluated by impairment indexes in the end of each reporting period. Impairment losses are recognized if, and only if, there is objective evidence of impairment of the financial asset resulting from one or more events that have occurred after its initial recognition, with impact on the estimated future cash flows of this asset.
In the case of capital investments classified as available for sale, a significant or long fall in the fair value of a security below its cost is also evidence that the assets are deteriorated. If there is any evidence of this type for financial assets available for sale, the cumulative loss it will be withdrawn from the asset and recognized in the result consolidated demonstration. Such cumulative loss is measured as the difference between the acquisition cost and the current fair value, minus any impairment loss on the financial asset previously recognized in the income statement. Impairment losses recognized in the income statement in equity instruments are not reversed in the scope of the consolidated income statement. If, in a subsequent period, the fair value of a debt instrument classified as available to increase sales, and this increase can be objectively related to an event occurred after the impairment loss have been recognized in the result, the impairment loss is reverted through the income statement.
For certain categories of financial assets, such as accounts receivable, assets are collectively evaluated, even if there are no evidence that they are registered for a higher value than the recoverable one when evaluated individually. Objective evidence of impairment for a credit portfolio may include the Company’s past experience in the collection of payments and the increasing in number of late payments after the average collection period, as well as observable changes in the national or local economic conditions related to default of receivables.
For financial assets carried at amortized cost, the amount of impairment recorded is the difference between the asset’s carrying amount and the present value of estimated future cash flows, discounted at the original effective interest rate of the financial asset.
F-55
Table of Contents
For financial assets carried at cost, the amount of loss on impairment is the difference between the asset’s carrying amount and the present value of estimated future cash flows, discounted by the current rate of return for a similar financial asset. This loss on impairment is not reversed in subsequent periods.
The carrying amount of the financial asset is directly reduced by the loss on impairment for all financial assets, with the exception of accounts receivable, where the carrying amount is reduced through the use of an allowance. Subsequent recoveries of amounts previously accrued are credited to the allowance. Changes in the carrying amount of the allowance account are recognized in the income statement.
For financial assets carried at amortized cost, if in a subsequent period, the amount of loss from the impairment decreases, and the decrease can be objectively related to an event occurring after the impairment has been recognized, the previously recognized loss is reversed through the outcome, as long as, the carrying value of the investment at the date of this reversal does not exceed the possible amortized cost if the impairment had not been recognized.
3.16.3. De-recognition of financial assets
The Company derecognizes a financial asset only when the contractual rights to the cash flows from this asset expire or is transferred together with all the risks and benefits of ownership. If the Company does not transfer or does not hold substantially all risks and benefits of ownership of the financial asset, but remains controlling the transferred financial asset, the Company recognizes the interest held and the respective liability in the amounts it shall pay. If it holds substantially all risks and benefits of ownership of the transferred financial asset, the Company remains recognizing this asset, as well as a guaranteed loan for the revenue earned.
In the derecognition of a financial asset, the difference between the carrying amount of the asset and the sum of the consideration received and receivable and the accumulated gain or loss recognized in Other Comprehensive Income and accumulated in equity, is recognized in the income statement.
3.16.4. Financial liabilities and equity instruments
Instruments of debt and equity issued by an Eletrobras entity are classified as financial liabilities or equity in accordance with the nature of the contractual arrangement and the definitions of a financial liability and equity instrument. An equity instrument is a contract that evidences a residual interest in the assets of a company after deducting all its /liabilities. Equity instruments issued by Eletrobras are recognized when the resources are received, as net of direct issue costs.
Financial liabilities are classified as financial liabilities at fair value through profit or loss or other financial liabilities.
| (a) | Financial liabilities at fair value through profit or loss |
Financial liabilities are classified at fair value through profit or loss when they are held for trading in the short term or designated at fair value through profit or loss. Financial liabilities at fair value through profit or loss are stated at fair value, and the respective gains or losses are recognized in the income statement.
F-56
Table of Contents
| (b) | Other financial liabilities |
Other financial liabilities, which include loans and financing, suppliers and other accounts payable, are measured at amortized fair value using the effective interest method.
The effective interest method is used to calculate the amortized cost of a financial liability and to allocate its interest expense throughout the respective period. The effective interest rate is the rate discounting exactly the estimated future cash flows (including fees and points paid or received, constituting a part of the effective interest rate, transaction costs and other premiums or discounts) throughout the estimated life of the financial liability or, when appropriate, for a shorter period, for initial recognition of the net carrying amount.
3.16.5. Derecognition of Financial liabilities
The Company reduces financial liabilities only when the Company’s obligation is extinct or when they expire. The difference between the carrying amount of the reduced financial liability and the paid and payable consideration is recognized in the income.
3.16.6. Financial guarantee agreements
Financial guarantee agreements consist of contracts that require the issuing company to make specified payments in order to reimburse the holder for losses arising from the circumstance when the specified debtor does not pay on the maturity date, according to the initial or amended conditions of the debt instrument.
Financial guarantees are initially recognized in the financial statements at fair value in the date of issuance of the guarantee. Subsequently, liabilities related to guarantees are measured by the highest initial value minus the amortization of the recognized rates and the best estimate of the amount required to settle the guarantee.
These estimates are established based on the experience with similar transactions and on the history of past losses together with judgment by the Company’s management. The rates received are recognized based on the linear method throughout the life of the guarantee. Any increase in liabilities related to guarantees is stated, when incurred, in operating expenses. (See Note 22).
3.16.7. Derivative financial instruments
The Company has derivative financial instruments to hedge its exposure to interest rate and exchange rate risks, including exchange contracts, interest rate and currency swaps. Note 44 include detailed information regarding derivative financial instruments. Certain jointly controlled companies entered into derivative agreements, and, in some cases, the hedge accounting policy has been applied.
Initially, the derivatives are recognized at fair value on the date a derivative agreement is entered into and, subsequently, are re-measured to their fair value at the end of the fiscal year. Occasional gains or losses are immediately recognized in the result, except when the
F-57
Table of Contents
derivative has been designated as, and effectively is a cash flow hedge instrument; in this case, the moment of recognition in the income statement depends on the nature of the hedge relationship (See item 3.16.9).
3.16.8. Embedded derivatives
Embedded derivatives in non-derivative contracts are treated as a separate derivative when their risks and characteristics are not strictly related to the respective contracts and these are not measured at fair value through profit or loss.
3.16.9 Hedge Accounting
The Company has a hedge accounting policy and the financial derivative instruments designated as hedge operations are initially recognized at fair value on the date the derivative agreement is signed, being subsequently restated, also at fair value. Derivatives are presented as financial assets when the fair value of the instrument is positive and as financial liabilities when the fair value is negative.
At the beginning of the hedge ratio, the Company documents the ratio between the hedge instrument and the object item of the hedge with its risks management objectives and its strategy to assume various hedge operations. Additionally, in the beginning of the hedge and continuously, the Company records if the hedge instrument used in a hedge operation is highly effective at offsetting changes in the fair value or in the cash flow of the object item being hedged, attributable to the risk inherent to the hedge.
For hedge accounting purposes, the Company uses the following classifications:
| (a) | Fair Value Hedges |
Changes in the fair value of derivatives designated and qualified as fair value hedges are accounted for in the income statement, with any changes in the fair value of the object items being hedged attributed to protected risk. Changes in the fair value of hedge instruments and in the object item being hedged attributable to hedge risk are recognized in the income statement.
Hedge accounting is prospectively discontinued when the Company cancels the hedging relationship, the hedging instrument expires or is sold, terminated or executed, or when it no longer qualifies for hedge accounting. The adjustment to fair value of the hedged item, arising from risk hedge, is recorded in the outcome thereafter.
| (b) | Cash Flow Hedges |
The effective part of the changes in the fair value of derivatives that are designated and qualified as cash flow hedge are accounted for as other comprehensive income. Gains or losses related to the non-effective part are immediately recognized in the income statement.
The amounts previously recognized in other comprehensive outcomes and accumulated in the balance sheet are reclassified to the income statement in the year when the object item being hedged is recognized in the income statement.
F-58
Table of Contents
Hedge accounting is discontinued when the Company cancels the hedging relationship, the hedging instrument expires or is sold, terminated or executed, or when it no longer qualifies for hedge accounting. Any gains or losses recognized in other comprehensive outcomes and accumulated in equity at that time remains in equity and are recognized when the forecasted transaction is finally recognized in the income statement. When no one expects that the forecasted transaction occurs, the gains or losses accumulated and deferred in equity are recognized immediately in the income.
The Company uses derivative financial instruments for financial risk management, as described in Note 44. As of October 1, 2013, the Company adopted hedge accounting procedures under the provisions of IAS 39 aimed at reducing volatility in the financial statements generated by the marking to market of derivative financial instruments and greater transparency of activities of the Risk Management of the Company.
At the initial date, the Company designated its interest rate hedges as cash flow hedges, therefore, the effective change in fair value of hedging instruments will be blocked in the account of other comprehensive income. As the secured debt is recognized in financial income, the change in fair value in other comprehensive income blocked the hedge is recognized in financial income based on the effective interest rate. Every quarter of effectiveness tests are performed to assess whether the derivative instruments is protected and it continues to effectively protecting the linked debt. If during the effective test there is an infective portion, this value is immediately recognized in the financial result.
Each hedging relationship is documented so that the secured debt, the designated derivative, the goal, the strategy of risk management, contract terms designated for hedge accounting and the measurement methodology of prospective and retrospective effectiveness is identified and recorded.
3.17. Post-employment benefits
3.17.1. Retirement liabilities
The Company and its subsidiaries sponsor a number of pension plans, which are generally funded by contributions to these pension funds, determined by periodic actuarial calculations. The Company sponsors defined benefit and also defined and variable contribution plans. A contribution plan is a pension plan under which the Company pays defined contributions to a separate entity. Additionally there is no legal or constructive obligation to pay contributions if the fund does not possess sufficient assets to pay, to all employees, benefits related to the services rendered by the employees in the current and previous years linked to this type of plan. A defined benefit plan is different from a defined contribution plan, given that such defined benefit plans establish the value of a postemployment benefit an employee will receive upon retirement, usually depending on one or more factors, such as age, time of service and remuneration. In this type of plan, the Company has an obligation to honor the commitment made if the fund does not hold sufficient funds to pay all employees the benefits relating to services rendered in current and previous years.
The liability recognized on the Balance Sheet related to defined benefit plans is the fair value of the defined benefit liability on the date of the balance sheet, minus the fair value of the plan assets. The defined benefit liability is calculated annually, using the projected credit unit
F-59
Table of Contents
method. The present value of the defined benefit liability is determined by discounting the estimated future cash outflow. The interest rates used in this discount are consistent with market securities, which are denominated in the currency in which the benefits will be paid and that have maturities close to those of the respective pension plan liability.
Actuarial gains and losses arising from adjustments based on experience and changes in actuarial assumptions and in the income of the assets of the plan accounted for in other comprehensive outcome.
Past service costs are immediately recognized in the income statement, in the period of occurrence of a change in the plan.
Regarding the defined contribution plans, the Company pays contribution to public or private pension plans on compulsory, contractual or voluntary basis. As soon as the contributions have been made, the Company has no additional payment-related obligations. The contributions are recognized as pension plan expenses. Pre-paid contributions are recognized as a cash reimbursement assets or a reduction of future payments.
3.17.2. Other post-employment liabilities
Some subsidiaries of the Company offer post-retirement medical assistance benefits to their employees, as well as life insurance for active and inactive employees. The right to these benefits is usually conditioned to the employee’s continuity in the job until retirement age and conclusion of a minimum service time or invalidity while the employee is active.
The expected costs of these benefits are accumulated during the employment period, under the same accounting methodology used for defined benefit pension plans. Actuarial gains and losses, arising from adjustments based on experience and in changes to actuarial assumptions, are charged or credited in other comprehensive outcome in the remaining expected service period of the employees. Qualified independent auditors measure these liabilities, annually.
3.17.3. Termination Benefits
Termination benefits are payable when employment is terminated by Eletrobras before the normal retirement date, or whenever an employee accepts voluntary redundancy in exchange for these benefits. Eletrobras recognizes termination benefits on the first of the following dates: (i) when Eletrobras can no longer withdraw the offer of those benefits, and (ii) when an entity recognizes restructuring costs that are within the scope of IAS 37 and involving the payment of severance benefits. In the case of an offer made to encourage voluntary redundancy, the termination benefits are measured based on the number of employees that are expected to accept the offer. The benefits that expire after 12 months from the balance sheet date are discounted to present value.
3.18. Provisions
The provisions are recognized for present liabilities (legal or presumed) resulting from past events, for which it is possible to reasonably estimate the values in a reliable way and for which settlement is probable. The amount recognized as a provision is the best estimate of
F-60
Table of Contents
the requirements to settle a liability at the end of each reporting period, considering the risks and uncertainties related to the liability. When the provision is measured based on the estimated cash flows to settle the liability, it carries the amount corresponding to the present value of these cash flows (when the effect of time value of money is relevant).
When some or all the economic benefits required to settle a provision may be recovered from a third party, an asset is recognized if, and only if, the reimbursement is nearly certain and the value can be reliably measured.
3.18.1. Provision for asset decommission
As provided for in the pronouncement IAS 37 - Provisions, Contingent Liabilities and Contingent Assets, a provision is recorded throughout the short period between the economic useful life of a thermonuclear plant or throughout the period of the concession. The objective is to allocate to the respective operating period, the costs to be incurred with their technical-operational deactivation, at the end of the concession or their useful life. The Company is recording the provision in thirty years.
The values are appropriated to the income statement of the fiscal year at present value, based on yearly quotas fixed in U.S. dollars, at the ratio of 1/30 of the estimated expenses, immediately registered and converted at the exchange rate at the end of each period. (See Note 32).
3.18.2. Provision for legal liabilities related to legal proceedings
Provisions for legal contingencies are recorded when the loss is considered to be probable. In this case, such contingency would cause a probable outflow of resources to settle the liability and when the amounts involved are safely measurable, considering the opinion of legal counsel, nature of proceedings, similarity with previous proceedings, complexity and the court’s opinion (precedent).
3.18.3. Onerous contracts
Current liabilities resulting from onerous contracts are recognized and measured as provisions. An onerous contract exists when the unavoidable costs incurred to comply with the provisions of the contract exceed the economic benefits expected to be earned throughout the same contract.
3.19. Advances for future capital increase
Advances of proceeds received from the controlling shareholder and intended for capital investment are irrevocably granted. They are classified as non-current liabilities and are initially recognized at fair value and subsequently restated by the SELIC rate.
3.20. Share Capital
Common and preferred shares are classified as shareholders’ equity.
F-61
Table of Contents
Incremental costs attributable to the issue of new shares are stated in shareholders’ equity as a deduction of the amount received, net of taxes.
When the Company buys its own shares (treasury stock), the amount paid, including any additional costs directly attributable (net of income tax), is deducted from the capital attributable to the shareholders of the Company until these shares are cancelled or reissued. When these shares are subsequently reissued, any amount received, net of any additional transaction costs directly attributable, and of the respective effects of income tax and social contribution, is included in the capital attributable to the shareholders of the Company.
3.21. Interest on capital and dividends
The interest on capital is imputed to the dividends of the fiscal year, calculated having a percentage on the shareholders’ equity as a limit, using the Long-Term Interest Rate – TJLP, established by the Brazilian Government, as per legal requirement, limited to 50% of the fiscal year net profit or 50% of the profit reserves, before including the profit of the fiscal year itself, whichever is higher.
The amount of dividends above the minimum mandatory dividend established by Law or other legal instrument, not yet approved by the General Meeting, are stated in the Shareholders’ Equity, in a specific account referred to as additional proposed dividends.
3.22. Other comprehensive income
Other comprehensive income is comprised of revenue and expense items that are not recognized in the income statement. Components of other comprehensive income include:
| a) | Actuarial gains and losses on defined benefit pension plans; |
| b) | Gains and losses from conversion of financial statements of operations abroad; |
| c) | Equity valuation adjustment related to gains and losses in the restatement of financial assets available for sale; and |
| d) | Equity valuation adjustment related to the effective share of gains and losses from hedge instruments on cash flow hedge. |
3.23. Revenue recognition
Revenue is measured at a fair counterpart value received or receivable, minus any estimates of returns granted to the buyer and other similar deductions.
3.23.1. Sale of electricity and services
a) Generation and Distribution
Revenue is measured at a fair value of the consideration received or receivable, less taxes and occasional discounts. Revenues from sales of electricity and services is recognized when it is likely that the economic benefits associated to the transactions will flow to the Company; the value of the revenue can be accurately measured; the risks and benefits related to the sale have been transferred to the buyer; the costs incurred or to be incurred related to the
F-62
Table of Contents
transaction can be reasonably measured the Company no longer holds control or responsibility over the electricity sold. It also includes revenue from construction linked to the sector of electricity distribution and part of generation within the scope of IFRIC 12.
For generation concessions renewed pursuant to Law 12,783/2013, there was a change of regime in price to tariff, subject to periodic review in like manner already applied to transmission activity until then. The rate is calculated based on the costs of operation and maintenance, plus the rate of 10% being recorded revenue to cover the costs of operation and maintenance based on actual cost.
b) Transmission
1) Financial revenue arising from remuneration of the financial assets until the end of the period of concession earned proportionally and that takes into account the average rate of investments.
2) Revenue to cover operating and maintenance costs based on incurred costs.
3) Revenue from construction for expansions which generate additional revenue. Considering that these services are rendered by third parties, the Company does not calculate margins on constructions.
3.23.2. Dividends and interest revenues
Dividend revenue from investments in subsidiaries is recognized when the shareholder’s right to receive such dividends is established and given that it is probable that the future economic benefits shall flow to the Company and the value of the revenue can be accurately measured.
Interest revenue is recognized by the linear method based on the time and effective interest rate over the outstanding principal amount, the effective interest rate being that which discounts exactly the estimated future cash receiving during the estimated life of the financial asset related to the initial net carrying amount of this asset.
3.24. Leasing
Leasing is classified as financial expense whenever the terms of the leasing agreement transfer substantially all ownership risks and benefits to the tenant. All other leasing agreements are classified as operational expenses.
Payments related to operational leasing are recognized as expenses by the linear method throughout the period the agreement is in force, except when another basis is more representative to reflect the moment when the economic benefits of the leased asset are consumed. Contingent payments arising from operational leasing agreements are recognized as expenses in the year they are incurred.
Assets acquired through financial leasing agreements are depreciated based on the useful life of assets.
F-63
Table of Contents
3.25. Government Grants
Government grants are not recognized until there is reasonable assurance that the Company will meet the related conditions and that the grants will be received. Government grants are systematically recognized as income during the years in which the Company recognizes as expenses the related costs that the grants intended to compensate. Government grants receivable as compensation for expenses already incurred for the purpose of providing immediate financial support to the Company, without corresponding future costs, are recognized within the period in which they are received and appropriated to retained earnings, and they are not intended for distribution of dividends.
3.26. Scheduled downtimes
The costs incurred before and during the scheduled downtimes of power plants and transmission lines are accounted for in the income statement for the period they are incurred.
3.27. Net Income for the year
The income is determined by the accrual basis of accounting years.
3.28. Basic earnings and diluted earnings
Basic earnings per share are calculated by dividing the income attributable to the shareholders of the Company by the weighted average number of outstanding shares (total shares less treasury stock). Diluted earnings per share are calculated adjusting the weighted average number of outstanding shares, to presume the conversion of all shares potentially diluted, according to IAS 33.
3.29. Presentation of business sector reports
Operational sectors are defined as business activities where it is possible to earn revenues and incur in expenses, which operating reports are provided to the main operational decision maker. The main operational decision maker, responsible for allocating resources and for appraising the performance of operational sectors is the Board of Directors, which is also responsible for the Company’s strategic decision making, which is made up of the following sectors:
| (I) | Generation; |
| (II) | Transmission; |
| (III) | Distribution; and |
| (IV) | Management. |
The results from trading activities are stated together with the generation sector.
F-64
Table of Contents
NOTE 4 – ACCOUNTING ESTIMATES AND JUDGMENTS
In applying the accounting policies, the Company’s management shall make judgments and make estimates about the carrying amounts of revenues, expenses, assets and liabilities and the disclosure in the notes to the date of the financial statements, for which are easily obtained from other sources. The estimates and associated assumptions are based on historical experience and other factors considered relevant. The estimates and underlying assumptions are reviewed continuously. The effects of revisions to accounting estimates are recognized in the period in which the estimate is revised if the revision affects only that period, or also in subsequent periods if the revision affects both this period and future periods.
Although these estimates and assumptions are continually monitored and reviewed by the Company’s management and its subsidiaries, the materialization of the book value of revenues, expenses, assets and liabilities is inherently uncertain because it requires the use of judgment.
The following are the key assumptions of accounting estimates assessed as most critical by the Company’s management and its subsidiaries concerning the future and other key sources of uncertainty that can lead to significant adjustments to the carrying amounts of assets and liabilities within the next periods:
| I. | Deferred tax assets and liabilities |
The estimates of taxable income, the basis for the analysis of realization of net deferred tax assets are based on annual budgets and strategic plan, both reviewed periodically. However, future taxable income may be higher or lower than estimates made by management when the need to register or not the deferred tax asset amount was defined (See Note 11).
| II. | Provision for impairment of long-lived assets |
Management of the Company adopts variables and assumptions in determining the recovery of long-lived assets in order to determine the recoverable value of assets and recognition of impairment when necessary. Management established judgments based on historical experience related to the asset, the group of assets or of the cash-generating unit that are applied. Such judgments may eventually not be materialized in the future, including the estimates. Also, the useful life adopted by the Company is in accordance with the practices determined by ANEEL as applicable on assets linked to the concession of power, which may vary due to the periodic review of the economic useful life of assets, in force. Additionally, the useful life is limited to the concession term only for the operations based on IFRIC 12.
Also the variables and assumptions used by the Management of the Company and its subsidiaries in the determining the discounted cash flows, for recognition of impairment of long-lived assets, may vary by inherently uncertain events. Among these events we highlight: maintenance of levels of energy consumption; the growth rate of economic activity in the country; availability of water resources; and the determination of the value of its reversion at the end of the concession period. Regarding the identification, we have considered that will be based on the new replacement value (VNR), for generation and transmission, and by the base value of regulatory compensation (BRR) for distribution. These are the values of indemnity at the end of the term of the concessions generation, transmission and distribution of electricity (See accounting policy Note 3.11 and changes in provisions made during the year in Note 19). Another significant variable is the discount rate used to discount cash flows.
F-65
Table of Contents
| III. | Basis of determination of indemnification by the Federal Government on concessions |
Law 12,783/2013, enacted on January 11, 2013, defined the new replacement value (VNR) as the identification basis for public service concessions. The Company adopts, for the concessions not yet renewed, the assumption that the assets are reversible at the end of the concession contracts, with the right to receive indemnity from Federal Government on investments not yet amortized at the lower net book value and the new estimated replacement value. Following this assumption, for the concessions already renewed we have maintained the receivables with the Federal Government relating to the Rede Básica do Sistema Existente – RBSE, the investments made after the basic design of power plants and transmission lines (modernization and improvements), and the thermal generation assets. Such values are subject to approval by ANEEL (as disclosed in Note 2.1). The Company has defined the new replacement value (NRV) as a way of measuring the amount to be indemnified by the Federal Government for the share of generation and transmission assets not fully depreciated by the end of the concession. For transmission assets this was defined by the Regulatory Asset Base - RAB.
| IV. | Useful life of fixed assets |
The Management of the Company adopts the criteria defined in ANEEL Resolution 367 of June 2, 2009, in determining the estimated useful life of fixed assets, limited to the concession term for the operations that are based on IFRIC 12, pursuant to the understanding that they fairly represent such lifespan (See Note 15).
| V. | Provision for asset decommission |
The Company recognizes provisions for decommissioning liabilities for the assets related to their thermonuclear power plants. In order to calculate the amount of the provision, assumptions and estimates are made regarding the discount rates, the expected decommissioning cost and removal of the entire power plant from the location and the expected period of the referred costs (See Note 32). The cost estimate is based on legal and environmental requirements for decommission and removal of the entire plant, as well as the prices of goods and services to be used at the end of the useful life.
| VI. | Actuarial liabilities |
Actuarial liabilities are determined by actuarial calculations prepared by independent accountants based on the life expectancy of the participant (board AT-2000), average retirement age and inflation. However, the actual future results of the accounting estimates used in this financial information may be different from those existing and registered in the accounting book (See Note 30).
| VII. | Provision for labor, tax and civil risks |
Provisions for labor, tax and civil risks, when applicable, are made for contingent tax, labor and civil risks expected as probable loss based, on the evaluation of Management and legal counsel inside and outside the Company. The accrued amounts are recorded based on the estimated cost of the outcomes of the referred contingencies. Contingent risks with the expectation of possible loss are disclosed by the Management, not being constituted a
F-66
Table of Contents
provision. This assessment is supported by the judgment of management, along with its legal counsel, considering case law, decisions in the courts, the history of any agreements and decisions, the experience of management and legal counsel, as well as other relevant aspects. (See Note 31).
VIII.Allowance for doubtful accounts
The Company records provisions on receivable accounts that the administration understands to be uncertain over their receipt. This provision is calculated based on the assumptions set out and described in Note 7.
IX.Evaluation of financial instruments
As described in Note 44, the Management of the Company uses valuation techniques that include information that are not based on observable market data to estimate the fair value of certain types of financial instruments. The Note 44 presents information on key assumptions used in determining the fair value of financial instruments, as well as the sensitivity analysis of these assumptions. The Management of the Company and its subsidiaries believe that the selected valuation techniques and assumptions used are appropriate for determining the fair value of financial instruments.
X.Onerous contracts
The Company and its subsidiaries use the assumptions related to economic costs and benefits of each contract to determine the existence or not of an onerous contract. In the case of long term commitments as sale and purchase of energy, the estimate in determining the amount of provision for the future sale of the contract is the historical average PLD approved by Management of the Company as a basis for the calculation of the provision for onerous contracts exclusively for accounting, as well as the discount rate applied to the cash flows. The actual values of the PLD over the years may be higher or lower to the assumptions used by the Company. In addition, the Company may have onerous contracts on concessions where the current expected cost for operation and maintenance is not fully covered by the revenues (See Note 35).
F-67
Table of Contents
NOTE 5 – CASH, CASH EQUIVALENTS AND RESTRICTED CASH
| 12/31/2013 | 12/31/2012 | |||||||
I - Cash and Cash Equivalents: | ||||||||
Cash and Banks | 393,541 | 278,595 | ||||||
Short-term securities | 3,204,042 | 2,222,920 | ||||||
|
|
|
| |||||
| 3,597,583 | 2,501,515 | |||||||
II - Restricted Cash: | ||||||||
CCC Resources | 194,708 | 2,099,394 | ||||||
Marketing - Itaipu | 7,534 | 619,206 | ||||||
Marketing - PROINFA | 677,559 | 790,723 | ||||||
|
|
|
| |||||
| 879,801 | 3,509,323 | |||||||
|
|
|
| |||||
| 4,477,384 | 6,010,838 | |||||||
|
|
|
| |||||
Cash and cash equivalents are held with Banco do Brasil S.A., according to specific laws for mixed capital corporations under federal government control, enacted by Decree-law No. 1.290, of December 3, 1973, and amendments from Resolution 4,034 of November 30, 2001 of the Brazilian Central Bank, which set forth new mechanisms for companies under indirect federal administration.
The highly liquid financial investments are extra-market investment funds, whose yield is based on the average SELIC interest rate.
Cash classified as restricted is restricted in its use and may only be used to fund the operations of CCC, Itaipu and PROINFA
Resources of Fuel Consumption Account (CCC) - are funds raised by the fund CCC by the concession holders of the public electricity service. The reduction of R$ 1,904,686 is due to the Law 12.783, which extinguished the mandatory contribution of this charge by the concessionaries of the public electricity service.
NOTE 6 – MARKETABLE SECURITIES
The Company and its subsidiaries invest resources in long-term securities, as held to maturity. The Company has also short-term investment program indicating the need of adopting these resources before maturity. The classification as current and non-current considers the fact that short-term securities are held for active and frequent trading, with immediate liquidity and intention to be applied in the Company’s investments plan.
The CFT-E1 securities and investment certificates deriving from FINOR (Northeast Investment Fund) and FINAM (Amazon Investment Fund) tax incentives are adjusted by provisions for losses upon their realization, therefore, they are stated net.
F-68
Table of Contents
The breakdown of marketable securities is as follows:
| CURRENT | ||||||||||||||
Securities | Custodian Financial Agent | Maturity | Index | 12/31/2013 | 12/31/2012 | |||||||||
LFT | Banco do Brasil | Up to 90 days | SELIC | 2,376,766 | 1,231,179 | |||||||||
LTN | Banco do Brasil | Up to 90 days | Pre-fixed | 2,312,351 | 3,066,198 | |||||||||
NTN- B | Banco do Brasil | Up to 90 days | IPCA | 811,931 | 51,869 | |||||||||
NTN- F | Banco do Brasil | Up to 90 days | Pre-fixed | 555,873 | 1,486,130 | |||||||||
Others | — | — | — | 38,987 | 517,415 | |||||||||
|
|
|
|
|
|
| ||||||||
TOTAL CURRENT | — | — | — | 6,095,908 | 6,352,791 | |||||||||
|
|
|
|
|
|
| ||||||||
| NON CURRENT | ||||||||||||||
Securities | Custodian Financial Agent | Maturity | Index | 12/31/2013 | 12/31/2012 | |||||||||
LFT | Banco do Brasil | Pre-fixado | — | — | ||||||||||
NTN- B | Banco do Brasil | — | IPCA | 298 | 199 | |||||||||
NTN- P | Banco do Brasil | 28/12/15 | TR | 357 | 630 | |||||||||
FINOR/FINAM | — | — | — | 1,195 | 1,602 | |||||||||
INCOME FROM PARTNERSHIPS | — | — | — | — | 146,728 | |||||||||
BENEFICIAL OWNERS | — | — | — | 186,972 | 246,888 | |||||||||
Others | — | — | — | 3,758 | 4,323 | |||||||||
|
|
|
|
|
|
| ||||||||
TOTAL NON- CURRENT | — | — | — | 192,580 | 400,370 | |||||||||
|
|
|
|
|
|
| ||||||||
a) INCOME FROM PARTNERSHIPS - Refers to income from an investment in partnership (Tangara Energia), corresponding to an average income equivalent to the IGP-M plus interest of 12% per annum on the investment. On December 31, 2013, the Company decided to constitute a provision on the total amount, due to the risk of going concern presented in the Financial Statements of that company.
b) BENEFICIAL OWNERS - Securities acquired as a result of the restructuring of the Company’s investment in subsidiary INVESTCO S.A. These assets guarantee equivalent to 10% of the profit of the companies listed below as annual income, together with the dividends paid, and will be redeemed at maturity in October 2032 through its conversion into preferred shares of the capital stock of such firms, as shown below:
| 12/31/2013 | 12/31/2012 | |||||||
Lajeado Energia | 451,375 | 451,375 | ||||||
Paulista Lajeado | 49,975 | 49,975 | ||||||
Ceb Lajeado | 151,225 | 151,225 | ||||||
|
|
|
| |||||
Face Value | 652,575 | 652,575 | ||||||
|
|
|
| |||||
Present Value Adjustment | (465,603 | ) | (405,687 | ) | ||||
|
|
|
| |||||
Present Value | 186,972 | 246,888 | ||||||
|
|
|
| |||||
c) FINOR / FINAM - Mainly refer to certificates of investments from tax incentives to projects in the areas of operation of subsidiaries Chesf and Eletronorte. The Company maintains an allowance for loss on realization, determined based on market value, in the amount of R$ 247,332 (December 31, 2012 - R$ 246,924), being presented as a reduction of the related asset.
F-69
Table of Contents
NOTE 7 – ACCOUNTS RECEIVABLE
| 12/31/2013 | 12/31/2012 | |||||||||||||||||||||||
| Past due | ||||||||||||||||||||||||
| Become Due | Up to 90 days | More than 90 days | Restructured loans | Total | Total | |||||||||||||||||||
CURRENT | ||||||||||||||||||||||||
AES ELETROPAULO | 35,301 | 969 | — | — | 36,270 | 102,690 | ||||||||||||||||||
AES SUL | 18,198 | 672 | — | — | 18,870 | 28,179 | ||||||||||||||||||
AMPLA | 18,976 | — | — | — | 18,976 | 43,146 | ||||||||||||||||||
CEA | — | — | — | 266,383 | 266,383 | 440,473 | ||||||||||||||||||
CEB | 5,849 | — | — | — | 5,849 | 13,020 | ||||||||||||||||||
CEEE | 26,246 | 268 | — | — | 26,514 | 38,585 | ||||||||||||||||||
CELESC | 33,866 | — | — | — | 33,866 | 50,445 | ||||||||||||||||||
CELG | 28,181 | 2,977 | 16,219 | 145,411 | 192,788 | 33,773 | ||||||||||||||||||
CELPA | 21,002 | 2,100 | 9,168 | 24,858 | 57,128 | 82,816 | ||||||||||||||||||
CELPE | 21,951 | 1,149 | 56 | — | 23,156 | 44,941 | ||||||||||||||||||
CEMAR | 16,292 | 38 | — | — | 16,330 | 35,932 | ||||||||||||||||||
CEMIG | 37,761 | 868 | 44 | — | 38,673 | 81,550 | ||||||||||||||||||
COELBA | 26,530 | 1,166 | 3,979 | — | 31,675 | 73,712 | ||||||||||||||||||
COELCE | 21,016 | 721 | 503 | — | 22,240 | 42,513 | ||||||||||||||||||
COPEL | 56,742 | 674 | — | — | 57,416 | 111,758 | ||||||||||||||||||
CPFL | 27,318 | 1,180 | 284 | — | 28,782 | 32,036 | ||||||||||||||||||
EBE | 5,665 | 344 | — | — | 6,009 | 15,957 | ||||||||||||||||||
ELEKTRO | 29,496 | 651 | — | — | 30,147 | 55,733 | ||||||||||||||||||
ENERGISA | 12,335 | 538 | 829 | — | 13,702 | 69,292 | ||||||||||||||||||
ENERSUL | 11,366 | 688 | 912 | — | 12,966 | 16,333 | ||||||||||||||||||
ESCELSA | 12,954 | 419 | 60 | — | 13,433 | 22,211 | ||||||||||||||||||
LIGHT | 37,873 | 345 | 607 | — | 38,825 | 85,494 | ||||||||||||||||||
RGE | 10,575 | 167 | 550 | — | 11,292 | 6,816 | ||||||||||||||||||
Debt Rollover | — | — | — | 111,864 | 111,864 | 112,427 | ||||||||||||||||||
CCEE Commercialization | 248,861 | 7,188 | 2,297 | — | 258,346 | 39,611 | ||||||||||||||||||
Electric Power Usage | 198,455 | 3,318 | 66,621 | — | 268,394 | 565,237 | ||||||||||||||||||
PROINFA | 338,550 | 18,584 | 92,318 | — | 449,452 | 477,104 | ||||||||||||||||||
Unbilled | — | — | — | 27,574 | 27,574 | 30,141 | ||||||||||||||||||
Consumers | 623,998 | 273,830 | 361,987 | 163,266 | 1,423,081 | 1,628,734 | ||||||||||||||||||
Public Power | 82,404 | 56,798 | 217,198 | 150,394 | 506,794 | 716,714 | ||||||||||||||||||
Others | 325,208 | 1,666 | 254,913 | 198,204 | 779,991 | 848,893 | ||||||||||||||||||
(–) Allowance for doubtful accounts | — | — | (725,401 | ) | (514,103 | ) | (1,239,504 | ) | (1,863,570 | ) | ||||||||||||||
|
|
|
|
|
|
|
|
|
|
|
| |||||||||||||
| 2,332,969 | 377,318 | 303,144 | 573,851 | 3,587,282 | 4,082,695 | |||||||||||||||||||
|
|
|
|
|
|
|
|
|
|
|
| |||||||||||||
NON CURRENT | ||||||||||||||||||||||||
CELG | — | — | — | 83,431 | 83,431 | 161,313 | ||||||||||||||||||
CELPA | — | — | — | 56,158 | 56,158 | 70,669 | ||||||||||||||||||
CEA | — | — | — | 150,451 | 150,451 | 399,302 | ||||||||||||||||||
CCEE Commercialization | — | — | 293,560 | — | 293,560 | 293,560 | ||||||||||||||||||
Debt Rollover | — | — | 12,493 | 1,042,562 | 1,055,055 | 1,029,718 | ||||||||||||||||||
Consumers | — | — | — | 323,021 | 323,021 | 259,321 | ||||||||||||||||||
Others | — | — | 20,387 | 6,062 | 26,449 | 116,289 | ||||||||||||||||||
(–) Allowance for doubtful accounts | — | — | (326,440 | ) | (350,864 | ) | (677,304 | ) | (1,073,487 | ) | ||||||||||||||
|
|
|
|
|
|
|
|
|
|
|
| |||||||||||||
| — | — | — | 1,310,821 | 1,310,821 | 1,256,685 | |||||||||||||||||||
|
|
|
|
|
|
|
|
|
|
|
| |||||||||||||
|
|
|
|
|
|
|
|
|
|
|
| |||||||||||||
| 2,332,969 | 377,318 | 303,144 | 1,884,672 | 4,898,103 | 5,339,380 | |||||||||||||||||||
|
|
|
|
|
|
|
|
|
|
|
| |||||||||||||
I – Electricity trading – PROINFA
The electricity trading operations under the Incentive Program for Alternative Sources of Energy – PROINFA, generated a positive net result for the year 2013 of R$ 42,598 (December 31, 2012 - negative R$ 60,122), not producing an effect on net income of the Company, and this amount is included under the Reimbursement Obligations. The balance of retailers consumers is recorded in the amount of R$ 449,452 of Proinfa related operations to the Parent Company (December 31, 2012 - R$ 477,104).
F-70
Table of Contents
II – Operations at the Electricity Trading Chamber – CCEE
The amounts related to the operations practiced within the scope of CCEE are recorded based on information made available by the referred Chamber.
The subsidiary Furnas maintains credits in the amount of R$ 293,560, related to electricity trading within the scope of the extinguished MAE (former Electricity Trading Chamber), referring to the period from September 2000 to September 2002, whose financial settlement is suspended due to restraining orders granted in lawsuits filed by electricity distribution concession holders against ANEEL and MAE, currently known as CCEE. Given the uncertainty of its realization, the subsidiary Furnas maintains Allowances for Doubtful Accounts, in an amount equivalent to the total credit, established in 2007.
According to the rules established in the Electricity Sector General Agreement, the resolution of these disputes would imply a new calculation, which would have the purpose of settlement between the parties without CCEE’s intervention. In this regard, the Management plans to maintain negotiations, with ANEEL’s and CCEE’s participation, aiming at leveling credits, so as to enable a negotiated solution for its settlement.
III – Debt rollover with states – Law 8.727/1993
The amount receivable from the debt rollover with states is R$ 1,166.919 (R$1,142,145 on December 31, of 2012).
IV – Allowance for doubtful accounts – PCLD
The Subsidiaries record and maintain provisions, adopting the criteria of ANEEL rules, based on the analysis of the amounts of past due accounts receivable and losses, the amount of which is deemed by the management as sufficient to cover eventual losses on the realization of these assets. The balance is composed as follows:
| 12/31/2013 | 12/31/2012 | |||||||
Consumers | 473,400 | 868,525 | ||||||
Resellers | 1,149,848 | 1,031,219 | ||||||
CEA | — | 743,753 | ||||||
CCEE - Short-Term Energy | 293,560 | 293,560 | ||||||
|
|
|
| |||||
| 1,916,808 | 2,937,057 | |||||||
|
|
|
| |||||
Balance at December 31, 2012 | 2,937,057 | |||
|
| |||
(+) Addition | 338,313 | |||
(–) Reversal | (1,131,184 | ) | ||
(–) Write- off | (227,378 | ) | ||
|
| |||
Balance at December 31, 2013 | 1,916,808 | |||
|
| |||
F-71
Table of Contents
On June 2013, the Companhia de Eletrecidade do Amapá S.A. (CEA) paid R$319,233 directly to Eletrobras, in respect of debt restructuring agreement between the subsidiary Eletronorte and CEA entered into the previous year. Considering this fact, the Directors of the Company reversed the allowance for doubtful accounts with this client in the amount of R$ 743,753. For equalization of the transaction, the subsidiary Eletronorte held accounts with low balance financing and loans from Eletrobras. The amount of pending receipt has estimated discharge into two parts: a portion of R$267,619 in January 2014 (actually received) and another in the amount of R$152,287 in January 2015, according to the release negotiations credit between ECA, Government of Amapá and the Federal Government with the intervention of Caixa Economica Federal - CEF. See more information on CEA in Note 15.4 IV a.
The conclusion of a shareholders’ agreement between Eletrobras and the government of the state of Roraima, where Eletrobras took over management of CERR, provided that CERR obtain financing by the CEF, whose goal is to pay off its debts. See further information on CERR in Note 15.4 IV b.
Receiving invoices and overdue installments of R$ 81,049 by CERR by the EDE Roraima, a company of Eletrobras, led to the reversal of the allowance for loan losses of R$ 81,911.
Recording and reversions of the PCLD were stated in the income statement as Operating Provisions (Note 43). The amounts recognized as PCLD are registered as definitive loss when there is no expectation to recover these funds. The reversal that occurred in 2013 basically refers to negotiation before CEA and CFRR.
The main constitution provision in the period occurred in Furnas of R$ 74,615 and on Amazonas in the amount of R$ 52,914.
For tax purposes, the surplus provision established in relation to the provisions of Law No. 9.430/1996 has been added to the taxable income for the purposes of Income Tax - IRPJ and also the calculation basis for the Social Contribution on the Net Income - CSLL.
NOTE 8 – Indemnifications – Law 12,783/2013
The subsidiaries Chesf, Eletronorte and Eletrosul chose to receive 50% in an upfront cash payment and the remainder in installments. Furnas chose to receive much of the indemnification amount in installments, pursuant to Interministerial Decree 580/MME/MF, November 1, 2012.
As required by law, the amount in installments will be paid in monthly installments until the date of closure of the original grant, as adjusted by the IPCA rate, plus remuneration by the weighted average cost of capital (WACC) of 5.59% real per annum. The indemnification values will be restated as of December 4, 2012 when the amendment to the concession contract was signed
The amount related to compensation receivable from the Federal Government in accordance with changes of Law 12,783/2013 is stated in below.
F-72
Table of Contents
The Company is fully engaged in the process and working towards obtaining a settlement; however, as of December 31, 2013, the Federal Government had not yet issued a final approval.
| 12/31/2013 | 12/31/2012 | |||||||
Opening Balance | 14,437,272 | — | ||||||
Constitution’s Right to Indemnity | — | 14,091,068 | ||||||
Amounts Received | (9,819,946 | ) | — | |||||
Monetary Variation | 878,853 | 346,204 | ||||||
|
|
|
| |||||
Closing Balance | 5,496,179 | 14,437,272 | ||||||
|
|
|
| |||||
CURRENT TOTAL | 3,476,495 | 8,882,836 | ||||||
NON CURRENT TOTAL | 2,019,684 | 5,554,436 | ||||||
|
|
|
| |||||
| 5,496,179 | 14,437,272 | |||||||
|
|
|
| |||||
NOTE 9 – LOANS AND FINANCING
| 12/31/2013 | ||||||||||||||
| CHARGES | PRINCIPAL | |||||||||||||
| Average rate | CURRENT | CURRENT | NON- CURRENT | |||||||||||
ITAIPU | 7.11 | — | 1,605,271 | 10,282,335 | ||||||||||
CEMIG | 5.07 | 1,783 | 76,362 | 264,361 | ||||||||||
COPEL | 6.39 | 1,095 | 51,947 | 132,029 | ||||||||||
CEEE | 5.00 | 417 | 6,882 | 48,947 | ||||||||||
AES ELETROPAULO | 9.44 | 335,642 | 11,515 | 440 | ||||||||||
CELPE | 5.00 | 164 | 10,096 | 22,209 | ||||||||||
CEMAT | 5.00 | 49,692 | 333,377 | — | ||||||||||
CELTINS | 5.00 | 23,431 | 116,558 | — | ||||||||||
ENERSUL | 5.17 | 4,867 | 22,835 | 52,727 | ||||||||||
CELPA | 5.00 | 71,060 | 158,518 | 327,086 | ||||||||||
CEMAR | 2.92 | 1,728 | 66,030 | 318,517 | ||||||||||
CESP | 5.09 | 175 | 5,603 | 25,362 | ||||||||||
COELCE | 5.00 | 408 | 11,581 | 68,931 | ||||||||||
COSERN | 5.00 | 45 | 2,289 | 6,692 | ||||||||||
COELBA | 5.00 | 846 | 28,521 | 139,615 | ||||||||||
CER | 8.76 | 1 | — | — | ||||||||||
CELG | 6.64 | 594 | 11,859 | 82,302 | ||||||||||
ESCELSA | 5.00 | 331 | 13,099 | 53,146 | ||||||||||
GLOBAL | 5.00 | 72,327 | 44,100 | — | ||||||||||
CELESC DIST. | 5.00 | 1,137 | 44,552 | 136,147 | ||||||||||
Others | 6.44 | 50,531 | 95,579 | 374,993 | ||||||||||
(–) PCLD | (204,899 | ) | (289,446 | ) | — | |||||||||
|
|
|
|
|
| |||||||||
| 411,375 | 2,427,128 | 12,335,838 | ||||||||||||
|
|
|
|
|
| |||||||||
F-73
Table of Contents
| 12/31/2012 | ||||||||||||||
| CHARGES | PRINCIPAL | |||||||||||||
| Average rate | CURRENT | CURRENT | NON- CURRENT | |||||||||||
ITAIPU | 7.45 | — | 1,271,281 | 10,371,354 | ||||||||||
CEMIG | 7.12 | 2,134 | 85,068 | 315,893 | ||||||||||
COPEL | 8.39 | 1,399 | 51,431 | 180,383 | ||||||||||
CEEE | 6.57 | 341 | 5,821 | 42,745 | ||||||||||
AES ELETROPAULO | 10.39 | 324,055 | 108,978 | 1,321 | ||||||||||
CELPE | 6.13 | 211 | 9,911 | 31,048 | ||||||||||
CEMAT | 6.27 | 21,953 | 344,384 | — | ||||||||||
CELTINS | 6.26 | 9,885 | 112,212 | — | ||||||||||
ENERSUL | 6.17 | 508 | 12,786 | 64,421 | ||||||||||
CELPA | 6.68 | 52,374 | 51,288 | 411,820 | ||||||||||
CEMAR | 5.89 | 2,247 | 77,605 | 396,921 | ||||||||||
CESP | 9.36 | 12 | 47,008 | 110,681 | ||||||||||
COELCE | 6.08 | 460 | 13,939 | 75,577 | ||||||||||
COSERN | 6.00 | 60 | 3,080 | 8,852 | ||||||||||
COELBA | 6.00 | 920 | 24,241 | 155,929 | ||||||||||
CER | 8.76 | 3,848 | 13,873 | 10,491 | ||||||||||
CELG | 5.71 | 542 | 7,178 | 93,657 | ||||||||||
ESCELSA | 6.01 | 395 | 13,202 | 65,668 | ||||||||||
GLOBAL | 6.00 | 61,330 | 44,100 | — | ||||||||||
CELESC DIST. | 7.41 | 1,242 | 41,201 | 146,806 | ||||||||||
Others | 6.36 | 50,679 | 126,763 | 449,396 | ||||||||||
(–) PCLD | (140,086 | ) | (248,027 | ) | — | |||||||||
|
|
|
|
|
| |||||||||
| 394,509 | 2,217,323 | 12,932,963 | ||||||||||||
|
|
|
|
|
| |||||||||
The financing and loans granted included the Company’s own funds, in addition to sector funds, as well as foreign funds raised by means of international development agencies, financial institutions, and those arising from the offering of securities on the international financial market.
All financing and loans are supported by formal contracts executed with borrowers. The amounts receivable are mostly repayable in monthly installments, within a ten-(10) year average term, and the average interest rate weighed by the portfolio balance is 6.44% p.a.
The financing and loans granted with a currency adjustment clause, account for nearly 43% of the total portfolio (43% on December 31, 2012). Those providing for adjustment based on indexes that represent domestic price-levels account for 57% of the portfolio balance (57% on December 31, 2012).
The market values of these assets are equivalent to their carrying amount, since these are specific operations of the sector and are partly funded with resources from Sector Funds, and which do not find similar conditions as valuation parameter.
F-74
Table of Contents
The long-term amount of loans and financing granted with ordinary and sectorial funds, including transfers, based on the cash flow established contractually, mature in variable installments, as shown below:
| 2015 | 2016 | 2017 | 2018 | 2019 | After 2019 | Total | ||||||||||||||||||||||
Consolidated | 857,457 | 857,909 | 851,688 | 841,282 | 847,112 | 8,080,391 | 12,335,838 | |||||||||||||||||||||
I – AES Eletropaulo/CTEEP – Lawsuit
In December 1988, AES Eletropaulo and CTEEP became parties to a lawsuit concerning the payment obligation of a Credit Facility Agreement ECF 1.046/1986 entered by the parties with Eletrobras. The proceedings were still in motion at December 31, 2013.
Once the legal liquidation procedure of award ends, and after verifying the amounts to be paid by AES Eletropaulo and CTEEP, Eletrobras will restart the enforcement action against the party obliged to pay.
In the event of unfavorable final decision to AES Eletropaulo and/or CTEEP, the Company will have a credit of R$1,898.067, (R$1.750.868 on December 31, 2012). R$ 347,597 (R$ 434,354 on December 31, 2012) was already recognized in assets, under loans and financing, which represents the amount considered as undisputed by the Company.
On March 18, 2013 the Company received R$ 97,463 relating to a portion of the undisputed amount due from Eletropaulo.
II – Allowance for Doubtful Accounts – PCLD
The Company recognizes allowances for doubtful accounts in the amount of R$ 494,345 (December 31, 2012 - R$ 388,113) corresponding to the principal and the servicing of the debt of defaulting debtors.
The amount of the provision is deemed sufficient by the Company’s Management to cover losses with these assets, based on the portfolio trend analysis.
In the composition of the provision, it is recognized the allowance for credits with Celpa, Rede Energia’s subsidiary, in the amount of R$ 21,228 (R$ 37,704 on December 31, 2012). This provision was deemed necessary considering the recovery process of judicial Celpa.
In addition, the Company recognized in 2011 an allowance for credits with Cemat and Celtins, also Rede Energia’s subsidiaries, in the amount of R$ 57,872 and R$ 13,646 (R$ 74,626 and R$ 20,527 on December 31, 2012). These allowances were necessary considering the scenario of both entities, which have been going through significant economic and financial hardship (See Note 15).
Changes in the allowance for doubtful accounts on financing and loans granted by the Company are as follows:
Balance at December 31, 2011 | 525,608 | |||
|
| |||
(+) Addition | 166,048 | |||
(–) Reversal / Write-off | (303,543 | ) | ||
|
| |||
Balance at December 31, 2012 | 388,113 | |||
|
| |||
(+) Addition | 146,710 | |||
(–) Reversal / Write-off | (40,478 | ) | ||
|
| |||
Balance at December 31, 2013 | 494,345 | |||
|
|
F-75
Table of Contents
The recording and the write-off of the PCLD were accounted in the income statement as Operating Provisions (See Note 43). The amounts recognized as PCLD are those which raise doubts as to their realization, when there is no expectation to recover the funds, are recognized as definite loss.
NOTE 10 – SHAREHOLDER’S REMUNERATION
The amounts below refer to dividends and interest on shares, net of withholding tax, where applicable, obtained from permanent investments held by the Company.
| 12/31/2013 | 12/31/2012 | |||||||
Eletrosul | — | — | ||||||
Eletronorte | — | — | ||||||
Eletropar | — | — | ||||||
CGTEE | — | — | ||||||
Itaipu | 2,343 | 8,164 | ||||||
CEMAR | 12,542 | 25,491 | ||||||
CELPA | — | 27,513 | ||||||
CTEEP | 70,460 | — | ||||||
Lajeado Energia | 54,505 | 46,381 | ||||||
Enerpeixe | 25,960 | 29,640 | ||||||
Baguari | 1,837 | 9,729 | ||||||
Serra do Facão | 2,289 | — | ||||||
Transenergia Renovável | 9,904 | — | ||||||
Transenergia São Paulo | 5,441 | 566 | ||||||
Goiás Transmissão | 20,051 | 300 | ||||||
Chapecoense | 17,054 | — | ||||||
IE Madeira | 7,556 | — | ||||||
Manaus Construtora | 9,377 | 2,970 | ||||||
EAPSA | 3,379 | 3,090 | ||||||
Others | 25,362 | 13,355 | ||||||
|
|
|
| |||||
| 268,059 | 167,197 | |||||||
|
|
|
| |||||
F-76
Table of Contents
NOTE 11 – RECOVERABLE TAXES AND INCOME TAX AND SOCIAL CONTRIBUTIONS – ASSETS
I. Recoverable Taxes
| 12/31/2013 | 12/31/2012 | |||||||
Current assets: | ||||||||
Withholding taxes | 640,509 | 1,050,394 | ||||||
PIS/PASEP/COFINS to offset | 126,207 | 79,054 | ||||||
ICMS credit | 25,078 | 19,986 | ||||||
Others | 47,972 | 349,292 | ||||||
|
|
|
| |||||
| 839,766 | 1,498,726 | |||||||
|
|
|
| |||||
Non current assets: | ||||||||
ICMS credit | 1,578,385 | 1,451,314 | ||||||
PIS/COFINS credit | 398,010 | 273,583 | ||||||
Others | 14,132 | 12,509 | ||||||
|
|
|
| |||||
| 1,990,527 | 1,737,406 | |||||||
|
|
|
| |||||
II. Income Tax and Social Contribution
| 12/31/2013 | 12/31/2012 | |||||||
Current assets: | ||||||||
|
|
|
| |||||
Prepayments / negative balance of income tax and social contribution | 1,940,005 | 1,227,005 | ||||||
|
|
|
| |||||
Noncurrent assets: | ||||||||
|
|
|
| |||||
Income Tax / Social Contribution Deferred | 3,010,574 | 4,854,337 | ||||||
|
|
|
| |||||
Noncurrent liabilities: | ||||||||
|
|
|
| |||||
Income Tax / Social Contribution Deferred | 533,713 | 598,750 | ||||||
|
|
|
| |||||
|
|
|
| |||||
Deferred Tax Assets (Liabilities) | 2,476,861 | 4,255,587 | ||||||
|
|
|
| |||||
F-77
Table of Contents
III. Income Tax Composition and Deferred Social Contribution
| 12/31/2013 | 12/31/2012 | |||||||
Deferred tax assets: | ||||||||
Passive Foreign Exchange | 22,434 | 386,223 | ||||||
Provision for interest on capital | 38,257 | 147,547 | ||||||
Provision for Contingencies | 661,139 | 1,072,323 | ||||||
Provision for doubtful accounts | 245,371 | 406,972 | ||||||
Provision / adjustment to market value | 22,981 | 148,289 | ||||||
Operating Reserves | 275,462 | 366,276 | ||||||
Adjustment Law 11.638/2007- RTT (IFRS) | 1,165,061 | 2,025,855 | ||||||
Cred. S Tax / Tax loss carryforwards | 373,576 | — | ||||||
Other | 206,293 | 300,853 | ||||||
|
|
|
| |||||
Total Assets | 3,010,574 | 4,854,338 | ||||||
|
|
|
| |||||
Deferred tax liabilities: | ||||||||
Defined benefit obligations | 65,015 | — | ||||||
Available for sale financial instruments | 274,201 | 335,428 | ||||||
Adjustment Law 11.638/2007- RTT (IFRS) | 177,206 | 239,927 | ||||||
Others | 17,291 | 23,396 | ||||||
|
|
|
| |||||
Total Liabilities | 533,713 | 598,751 | ||||||
|
|
|
| |||||
|
|
|
| |||||
| 2,476,861 | 4,255,587 | |||||||
|
|
|
| |||||
F-78
Table of Contents
IV. Income Tax and Social Contribution recognized in Other Comprehensive Income:
| 12/31/2013 | 12/31/2012 | 12/31/2011 * | ||||||||||
Deferred tax | ||||||||||||
Resulting from income and expense recognized in other comprehensive income: | ||||||||||||
Remeasurement of the fair value of hedge instruments contracted to hedge cash flow | 4,145 | — | — | |||||||||
Remeasurement of the fair value of financial instruments available for sale | (24,018 | ) | 81,825 | 51,811 | ||||||||
Remeasurements of defined benefit plans | (424,126 | ) | 806,030 | (95,287 | ) | |||||||
Participation in comprehensive income of subsidiaries, associates and jointly controlled companies | 154,915 | 12,858 | (155,335 | ) | ||||||||
|
|
|
|
|
| |||||||
Total income tax and social contribution recognized in other comprehensive income | (289,084 | ) | 900,713 | (198,811 | ) | |||||||
|
|
|
|
|
| |||||||
| * | We have not restated data for 2011 to reflect the application of IFRS 11. |
Deferred Tax Assets arise due to the conclusion of the events that prompted the deferral. The recognition of these assets is based on the ability of asset realization, taking into account the past profitability of the Company as well as the expectation of generating taxable income in coming years. This is identified from analysis of future trends, based on a technical study prepared based on assumptions and macroeconomic, trade and fiscal scenarios, which may change in the future.
The current expectation of future tax results indicates that the Company may benefit, from a tax perspective, from the differences between the applicable tax rates for assets and liabilities and their accounting value. In 2013, R$ 1,690,848 was written down for the Consolidated Companies as a result of these temporary differences.
This expectation is resulted from the decrease in financial income, the main taxable item in the Company’s results. The Company has converted receivables due from subsidiaries into investments, which lead to a decrease in finance income from interest receivable, as well as a decrease in cash.
Accordingly, and pursuant to IAS 12 - Income Taxes, the Company has recorded R $ 299,117 in its noncurrent assets under the heading “Income Tax and Social Contribution”. This amount reflects temporary differences between the tax and accounting calculations, tax losses and the negative total of social contribution. The expected realization of these assets is as follows:
Realization Period | 12/31/2013 | |||
2014 | 182,134 | |||
2015 | 102,203 | |||
2016 | 14,780 | |||
|
| |||
Total recognized in the balance sheet | 299,117 | |||
|
| |||
F-79
Table of Contents
| V. | ICMS, PIS/PASEP and COFINS on Fuel Acquisition |
The PIS/COFINS and ICMS recoverable are recorded in non-current assets under the heading of tax credits.
The Company expects to realize these claims, since the taxes and contributions shall be reimbursed to the CCC pursuant to § 8 of Law 12.111/2009. Therefore, a liability of R$ 1,449,361 has been shown under the heading Reimbursement Obligations (See Note 12).
| VI. | Unconstitutionality of PIS/COFINS and PASEP |
The Supreme Federal Court - SFC declared the unconstitutionality of paragraph 1 of Article 3 of Law 9,718/98, which had expanded the base of the PIS/COFINS and PASEP and had provided a new concept of sales. This concept was expanded to include all revenue earned by legal entities, regardless of the type of activity performed and the accounting classification adopted. However, the concept was judged to be incompatible with the constitution.
Based on the National Tax Code - NTC, Eletrobras companies are seeking recognition of their right to a refund of the excess tax paid under the unconstitutional provisions. As of the completion of these financial statements, there had been no final ruling on the issue.
Eletrobras companies therefore have a tax credit potential in respect of PIS/COFINS and PASEP, which are currently being determined and are therefore not recognized as credits in these financial statements, since the declaration of unconstitutionality only benefits the claimants in the cases at present.
| VII. | Provisional Measure 627/2013 |
Provisional Measure (MP) 627 was enacted on November 11, 2013. This Provisional Measure repealed the Transitional Tax Regime - RTT and provided for other measures, including: (i) changes in Decree - Law No. 1.598/77 dealing with the corporate income tax as well as amending the relevant social contribution on net income legislation, (ii) the amendment or adoption of accounting methods and criteria through administrative acts issued pursuant to trade law, which are subsequent to the publication of the MP, and which will govern the calculation of federal taxes until a new tax law becomes effective, (iii) specific treatment on potential taxation of profits or dividends, (iv) provisions on the calculation of interest on equity, and consideration of investments valued at equity method.
F-80
Table of Contents
The provisions of the MP are effective as of 2015. Early adoption in 2014 can eliminate potential tax effects, especially related to payment of dividends and interest on capital actually paid up to the date of publication of the MP as well as equity earnings. The Company is evaluating the possible effects that could result from implementation of this new standard and based on what is currently in effect, expects that its adoption will not result in material adjustments to the financial statements. The administration awaits developments and negotiations regarding amendments to the Provisional Measure so that the Company can decide whether it will implement it early.
Our evaluations are based on the current text of the Provisional Measure. It is possible that when the Provisional Measure is converted into law, its text will change. For this reason, our assessments and conclusions may be revised in the light of the final text.
NOTE 12 – REIMBURSEMENT RIGHTS AND OBLIGATIONS
| 12/31/2013 | 12/31/2012 | |||||||
Rights of redress | ||||||||
a. CCC Isolated Systems | 12,069,553 | 7,622,094 | ||||||
b. nuclear energy | 510,103 | 581,095 | ||||||
|
|
|
| |||||
| 12,579,656 | 8,203,189 | |||||||
|
|
|
| |||||
Current assets | 10,910,073 | 7,302,160 | ||||||
Noncurrent assets | 1,669,583 | 901,029 | ||||||
|
|
|
| |||||
| 12,579,656 | 8,203,189 | |||||||
|
|
|
| |||||
Reimbursement obligations | ||||||||
a. CCC Isolated Systems | 10,695,108 | 7,789,757 | ||||||
|
|
|
| |||||
| 10,695,108 | 7,789,757 | |||||||
|
|
|
| |||||
Current liabilities | 8,377,400 | 5,988,698 | ||||||
Non-current liabilities | 2,317,708 | 1,801,059 | ||||||
|
|
|
| |||||
| 10,695,108 | 7,789,757 | |||||||
|
|
|
| |||||
a) Fuel Consumption Account (CCC) for isolated systems
It relates to subsidy of fuel and other generation costs incurred primarily by the distribution companies located in the north area of Brazil.
The systematic subsidization of energy generation in isolated systems was altered with the enactment of Law 12.111/2009 and Decree 7,246/2010. Prior to the aforementioned law only fuel costs were received and, now the reimbursement includes the difference between the total cost of generating the electricity and the valuation of the electricity at the average cost of electricity sold in the Regulated - ACR, the National Interconnected System - SIN.
F-81
Table of Contents
The total cost of electricity generation in isolated systems includes:
i. procurement of electricity;
ii. own generation to enable the electricity distribution;
iii. charges and taxes, and
iv. investments.
It also includes the other costs associated with the provision of electricity to remote regions of the isolated systems, characterized by a large dispersion of consumers and lack of economies of scale.
These subsidies have been received and recorded as advances considering that the final amounts have not yet been approved by the regulator. Due to this fact the Company maintains an asset in the amount of R$ 12,069,553 (R$ 7,622,094 on December 31, 2012) and a liability of R$ 10,695,108 (R$ 7,789,757 on December 31, 2012) of reimbursement obligations to be offset against the related assets once that approval is obtained from the regulator. Due the need to obtain the approval from the regulator and to finalize the reconciliation process related to the advances received the Company understands that at this moment it does not have a legally enforceable right to set off the recognised amounts.
b) Nuclear Energy
Pursuant to paragraph 4 of article 12 of Law 12.111/2009, and article 2 of Ratification ANEEL Resolution No. 1,406, of December 21, 2012, the cost difference for the period beginning 2005, between the tariffs charged by Eletronuclear to Furnas will be will be paid by the distribution companies. Accordingly, the Company has a right to reimbursement of R$ 510,103 ( R$ 581,095 on December 31, 2012).
According to the provisions of paragraph 1 of ANEEL Resolution No. 1.406/2012, that amount will be paid on monthly basis to Furnas in the years 2013 to 2015. The amount of R$ 177,659 was received in 2013.
F-82
Table of Contents
NOTE 13 – NUCLEAR FUEL INVENTORY
A breakdown of the long-term nuclear fuel inventory for the operations of the UTN Angra I and UTN Angra II thermonuclear power plants is shown below:
| 12/31/2013 | 12/31/2012 | |||||||
| CURRENT | ||||||||
Finished inventory | 343,730 | 360,751 | ||||||
|
|
|
| |||||
| 343,730 | 360,751 | |||||||
| NON-CURRENT | ||||||||
Ready elements | 216,856 | 109,153 | ||||||
Uranium concentrate | 85,025 | 143,116 | ||||||
In progress - nuclear fuel | 205,607 | 229,226 | ||||||
|
|
|
| |||||
| 507,488 | 481,495 | |||||||
|
|
|
| |||||
| 851,218 | 842,246 | |||||||
|
|
|
| |||||
Inventories are stated at cost or net realization amount, whichever is the shortest, calculated as follows:
a) Uranium concentrate and works in progress (to transform uranium concentrate into nuclear fuel elements) are recorded at their acquisition costs;
b) Nuclear fuel elements – these are available in the reactor core and inventories of Spent Fuel Pool – SFP, and appropriated to income for the year in view of its utilization in the electricity generation process;
c) Warehouse, classified in current assets and recorded at the average acquisition cost, which must not exceed the market value.
NOTE 14 – ADVANCES FOR FUTURE CAPITAL INCREASE
The Company states in non-current assets, the amounts corresponding to advances for future capital increase in the following investments:
| Subsidiaries | 31/12/2013 | 31/12/2012 | ||||||
Chesf | 277,800 | 34,525 | ||||||
Eletrosul | 208,629 | 31,898 | ||||||
|
|
|
| |||||
| 486,429 | 66,423 | |||||||
|
|
|
| |||||
Other Investments | 4,000 | 4,000 | ||||||
|
|
|
| |||||
| 490,429 | 70,423 | |||||||
|
|
|
| |||||
F-83
Table of Contents
NOTE 15 – INVESTMENTS
| 12/31/2013 | 12/31/2012 | |||||||
Evaluated by Equity Method | ||||||||
a) Associates and jointly controlled ventures | ||||||||
Itaipu | 117,130 | 102,175 | ||||||
Mangue Seco II | 17,058 | 17,006 | ||||||
CHC | 29,119 | 28,584 | ||||||
Norte Energia | 2,104,536 | 1,365,096 | ||||||
Inambari | 9,148 | 15,890 | ||||||
CEEE-GT | 544,711 | 738,009 | ||||||
Emae | 153,960 | 261,499 | ||||||
CTEEP | 931,580 | 753,512 | ||||||
Cemar | 463,394 | 411,463 | ||||||
Lajeado Energia | 232,907 | 540,819 | ||||||
Ceb Lajeado | 83,644 | 79,672 | ||||||
CEEE-D | 146,649 | 343,875 | ||||||
Paulista Lajeado | 27,669 | 27,425 | ||||||
Rouar | 18,427 | — | ||||||
Celpa | — | 94,673 | ||||||
Cemat | 334,294 | 507,251 | ||||||
Madeira Energia S.A. | 2,506,082 | 1,870,691 | ||||||
ESBR Participações S.A. | 2,752,140 | 1,879,649 | ||||||
Enerpeixe S.A. | 525,379 | 514,735 | ||||||
Interligação Elétrica do Madeira S.A. | 685,927 | 514,112 | ||||||
Manaus Transmissora de Energia S.A. | 525,558 | 476,619 | ||||||
Teles Pires Participações | 525,582 | 92,988 | ||||||
Norte Brasil Transmissora de Energia S.A. | 462,170 | 388,108 | ||||||
Chapecoense Geração S.A. | 345,387 | 303,627 | ||||||
Goiás Transmissão | 131,579 | 101,646 | ||||||
STN - Sistema de Transmissão Nordeste S.A. | 195,154 | 188,861 | ||||||
Santa Vitória do Palmar Holding S.A. | 185,970 | 97,060 | ||||||
Transmissora Sul Brasileira de Energia S.A. | 167,403 | 6,301 | ||||||
Integração Transmissora de Energia S.A. | 160,151 | 147,902 | ||||||
Retiro Baixo Energia S.A. | 113,181 | 110,078 | ||||||
MGE Transmissão | 106,371 | 63,431 | ||||||
Brasnorte Transmissora de Energia S.A. | 105,921 | 109,609 | ||||||
Interligação Elétrica Garanhuns S.A. | 98,659 | 14,956 | ||||||
Livramento Holding S.A. | 97,348 | 35,280 | ||||||
Energética Águas da Pedra S.A. | 189,062 | 176,503 | ||||||
Cia. Hidrelétrica Teles Pires | — | 89,816 | ||||||
Baguari Energia S.A. | 92,437 | 89,239 | ||||||
Transenergia Renovável S.A. | 78,241 | 107,865 | ||||||
Transmissora Matogrossense de Energia S.A. | 75,656 | 63,037 | ||||||
Chuí Holding S.A | 75,210 | 33,606 | ||||||
Serra do Facão Energia S.A. | 60,742 | 104,098 | ||||||
TDG - Transmissora Delmiro Gouveia S.A. | 49,829 | 45,183 | ||||||
Others | 791,203 | 534,064 | ||||||
|
|
|
| |||||
| 16,316,568 | 13,446,013 | |||||||
|
|
|
| |||||
SUBTOTAL | 16,316,568 | 13,446,013 | ||||||
|
|
|
| |||||
F-84
Table of Contents
Held at Fair Value | ||||||||
Celpa | 17,435 | — | ||||||
Celesc | 82,901 | 112,012 | ||||||
Cesp | 148,568 | 124,380 | ||||||
Coelce | 210,589 | 232,140 | ||||||
AES Tietê | 577,435 | 713,398 | ||||||
Energisa | 84,906 | 82,070 | ||||||
CELPE | 21,149 | 24,159 | ||||||
CGEEP | 27,371 | 30,201 | ||||||
COPEL | 34,136 | 38,575 | ||||||
CEB | 6,703 | 6,206 | ||||||
AES Eletropaulo | 19,615 | 35,207 | ||||||
Energias do Brasil | 16,861 | 18,556 | ||||||
Tangara | 21,738 | 21,738 | ||||||
CPFL Energia | 32,522 | 36,457 | ||||||
Others | 139,938 | (35,313 | ) | |||||
|
|
|
| |||||
| 1,441,867 | 1,439,786 | |||||||
|
|
|
| |||||
SUBTOTAL | 17,758,436 | 14,885,799 | ||||||
|
|
|
| |||||
Allowance for losses on investments | (343,442 | ) | (208,649 | ) | ||||
|
|
|
| |||||
TOTAL | 17,414,994 | 14,677,150 | ||||||
|
|
|
| |||||
15.1 – Provisions for investments losses
| 12/31/2013 | 12/31/2012 | |||||||
CELPA | — | 122,185 | ||||||
INAMBARI | 9,148 | — | ||||||
CEMAT | 334,294 | 86,464 | ||||||
|
|
|
| |||||
| 343,442 | 208,649 | |||||||
|
|
|
| |||||
15.2 – Accounting policies adjustments in associates
| 12/31/2013 | 12/31/2012 | |||||||
CTEEP | 816,980 | 1,047,648 | ||||||
EMAE | 149,692 | — | ||||||
CEEE-GT | 19,902 | — | ||||||
CEEE-D | 19,997 | — | ||||||
|
|
|
| |||||
| 1,006,571 | 1,047,648 | |||||||
|
|
|
| |||||
When preparing the consolidated financial statements, the Company made adjustments in its subsidiaries results in order to standardize the accounting policies adopted by the subsidiaries with those adopted by the Company. The adjustments made relate mainly to accounting policies relating to provision for loan losses and obligations related to post-employment benefits.
F-85
Table of Contents
15.3 Changes in the Company’s most significant investments
Subsidiaries and affiliates | Balance on 31/12/2012 | Payment of capital | Other Comprehensive Income | Gain / Loss Capital | Redução de Capital | Dividends and Interest on Equity | Equity | Balance 12/31/2013 | ||||||||||||||||||||||||
CHANGING OF INVESTMENTS | ||||||||||||||||||||||||||||||||
ITAIPU BINACIONAL | 102,175 | — | 14,955 | — | — | — | 117,130 | |||||||||||||||||||||||||
CELPA | 94,673 | (94,673 | ) | — | — | — | — | — | 0 | |||||||||||||||||||||||
CEEE-GT | 738,009 | — | (118,263 | ) | — | — | — | (75,034 | ) | 544,712 | ||||||||||||||||||||||
CEMAT | 507,251 | — | (3,975 | ) | — | — | — | (168,982 | ) | 334,294 | ||||||||||||||||||||||
EMAE | 261,499 | — | 35,274 | — | — | (575 | ) | (142,237 | ) | 153,961 | ||||||||||||||||||||||
CTEEP | 753,512 | — | — | — | — | (71,770 | ) | 249,838 | 931,580 | |||||||||||||||||||||||
CEMAR | 411,463 | — | — | — | — | (12,606 | ) | 64,537 | 463,394 | |||||||||||||||||||||||
REDE LAJEADO | 540,819 | — | 89 | — | (180,394 | ) | (70,098 | ) | (57,510 | ) | 232,906 | |||||||||||||||||||||
CEB LAJEADO | 79,672 | — | 24 | — | — | (11,232 | ) | 15,180 | 83,644 | |||||||||||||||||||||||
PAULISTA LAJEADO | 27,425 | — | — | — | — | (6,136 | ) | 6,381 | 27,669 | |||||||||||||||||||||||
CEEE-D | 343,875 | — | (101,928 | ) | — | — | — | (95,298 | ) | 146,649 | ||||||||||||||||||||||
INAMBARI | 15,890 | 1,402 | 54 | (6,126 | ) | — | — | (2,071 | ) | 9,148 | ||||||||||||||||||||||
CHC | 28,584 | — | 4,540 | — | — | — | (4,004 | ) | 29,119 | |||||||||||||||||||||||
EÓLICA MANGUE SECO | 17,006 | — | — | — | — | — | 52 | 17,058 | ||||||||||||||||||||||||
NORTE ENERGIA (BELO MONTE) | 1,365,096 | 759,696 | — | — | — | — | (20,255 | ) | 2,104,537 | |||||||||||||||||||||||
ROUAR | — | 17,788 | 1,071 | — | — | — | (433 | ) | 18,427 | |||||||||||||||||||||||
MADEIRA ENERGIA S.A. | 1,870,691 | 654,069 | — | — | — | (18,678 | ) | 2,506,082 | ||||||||||||||||||||||||
ESBR PARTICIPAÇÕES S.A. | 1,879,649 | 950,000 | 133 | — | — | — | (77,642 | ) | 2,752,140 | |||||||||||||||||||||||
ENERPEIXE S.A. | 514,735 | — | — | — | — | (85,960 | ) | 96,604 | 525,379 | |||||||||||||||||||||||
INTERLIGAÇÃO ELÉTRICA DO MADEIRA S.A. | 514,112 | 139,651 | — | — | — | (7,556 | ) | 39,720 | 685,927 | |||||||||||||||||||||||
MANAUS TRANSMISSORA DE ENERGIA S.A. | 476,619 | 21,318 | — | — | — | — | 27,621 | 525,558 | ||||||||||||||||||||||||
TELES PIRES PARTICIPAÇÕES | 92,988 | 439,396 | — | — | — | — | (6,802 | ) | 525,582 | |||||||||||||||||||||||
NORTE BRASIL TRANSMISSORA DE ENERGIA S.A. | 388,108 | 61,250 | — | — | — | 805 | 12,007 | 462,170 | ||||||||||||||||||||||||
CHAPECOENSE GERAÇÃO S.A. | 303,627 | — | — | — | — | (48,808 | ) | 90,568 | 345,387 | |||||||||||||||||||||||
GOIÁS TRANSMISSÃO | 101,646 | 51,499 | — | — | — | (19,751 | ) | (1,815 | ) | 131,579 | ||||||||||||||||||||||
STN - SISTEMA DE TRANSMISSÃO NORDESTE S.A. | 188,861 | — | — | — | — | (31,789 | ) | 38,082 | 195,154 | |||||||||||||||||||||||
SANTA VITÓRIA DO PALMAR HOLDING S.A. | 97,060 | 88,772 | — | — | — | — | 138 | 185,970 | ||||||||||||||||||||||||
TRANSMISSORA SUL BRASILEIRA DE ENERGIA S.A. | 6,301 | 157,754 | — | — | — | (1,440 | ) | 4,788 | 167,403 | |||||||||||||||||||||||
INTEGRAÇÃO TRANSMISSORA DE ENERGIA S.A. | 147,902 | — | — | — | — | (4,837 | ) | 17,086 | 160,151 | |||||||||||||||||||||||
RETIRO BAIXO ENERGIA S.A. | 110,078 | — | — | — | — | — | 3,103 | 113,181 | ||||||||||||||||||||||||
MGE TRANSMISSÃO | 63,431 | 45,570 | — | — | — | 201 | (2,831 | ) | 106,371 | |||||||||||||||||||||||
BRASNORTE TRANSMISSORA DE ENERGIA S.A. | 109,609 | — | — | — | — | — | (3,688 | ) | 105,921 | |||||||||||||||||||||||
INTERLIGAÇÃO ELÉTRICA GARANHUNS S.A. | 14,956 | 80,850 | — | — | — | — | 2,853 | 98,659 | ||||||||||||||||||||||||
LIVRAMENTO HOLDING S.A. | 35,280 | 73,031 | — | — | — | — | (10,963 | ) | 97,348 | |||||||||||||||||||||||
ENERGÉTICA ÁGUAS DA PEDRA S.A. | 176,503 | — | — | — | — | (14,483 | ) | 27,042 | 189,062 | |||||||||||||||||||||||
CIA. HIDRELÉTRICA TELES PIRES | 89,816 | (89,816 | ) | — | — | — | — | — | — | |||||||||||||||||||||||
BAGUARI ENERGIA S.A. | 89,239 | — | — | — | — | (1,837 | ) | 5,035 | 92,437 | |||||||||||||||||||||||
TRANSENERGIA RENOVÁVEL S.A. | 107,865 | 1,960 | — | — | — | (9,904 | ) | (21,680 | ) | 78,241 | ||||||||||||||||||||||
TRANSMISSORA MATOGROSSENSE DE ENERGIA S.A. | 63,037 | — | — | — | — | — | 12,619 | 75,656 | ||||||||||||||||||||||||
CHUÍ HOLDING S.A | 33,606 | 41,797 | — | — | — | — | (193 | ) | 75,210 | |||||||||||||||||||||||
SERRA DO FACÃO ENERGIA S.A. | 104,098 | — | — | — | — | (16,812 | ) | (26,544 | ) | 60,742 | ||||||||||||||||||||||
TDG - TRANSMISSORA DELMIRO GOUVEIA S.A. | 45,183 | — | — | — | — | (2,152 | ) | 6,798 | 49,829 | |||||||||||||||||||||||
Others | 534,064 | — | — | — | — | 257,139 | 791,203 | |||||||||||||||||||||||||
|
|
|
|
|
|
|
|
|
|
|
|
|
|
|
| |||||||||||||||||
TOTAL OF INVESTMENTS | 13,446,013 | 3,401,315 | (168,026 | ) | (6,126 | ) | (180,394 | ) | (416,741 | ) | 240,530 | 16,316,571 | ||||||||||||||||||||
|
|
|
|
|
|
|
|
|
|
|
|
|
|
|
| |||||||||||||||||
Subsidiaries and affiliates | Balance on 01/01/2012 | Payment of capital | Other Comprehensive Income | Gain /Loss Capital | Reduction of Capital | Dividends and Interest on Equity | Equity | Balance on 12/31/2012 | ||||||||||||||||||||||||
CHANGING OF INVESTMENTS | ||||||||||||||||||||||||||||||||
ITAIPU BINACIONAL | 93,790 | — | 8,385 | — | — | — | 102,175 | |||||||||||||||||||||||||
CELPA | 171,370 | — | — | — | — | — | (76,697 | ) | 94,673 | |||||||||||||||||||||||
CEEE-GT | 701,628 | — | 51,370 | — | — | 13,562 | (28,551 | ) | 738,009 | |||||||||||||||||||||||
CEMAT | 522,614 | — | — | — | — | 6,275 | (21,638 | ) | 507,251 | |||||||||||||||||||||||
EMAE | 312,150 | — | — | — | — | — | (50,651 | ) | 261,499 | |||||||||||||||||||||||
CTEEP | 641,618 | — | — | — | — | (108,026 | ) | 219,920 | 753,512 | |||||||||||||||||||||||
CEMAR | 323,433 | — | — | — | — | (41,197 | ) | 129,227 | 411,463 | |||||||||||||||||||||||
REDE LAJEADO | 532,459 | — | (24 | ) | — | — | (65,292 | ) | 73,676 | 540,819 | ||||||||||||||||||||||
CEB LAJEADO | 76,155 | — | (20 | ) | — | — | (10,651 | ) | 14,188 | 79,672 | ||||||||||||||||||||||
PAULISTA LAJEADO | 27,654 | — | — | — | — | (7,455 | ) | 7,227 | 27,425 | |||||||||||||||||||||||
CEEE-D | 391,988 | — | 44,947 | — | — | — | (93,060 | ) | 343,875 | |||||||||||||||||||||||
INAMBARI | 16,675 | 1,132 | 185 | — | — | — | (2,102 | ) | 15,890 | |||||||||||||||||||||||
CHC | 19,090 | 10,029 | 1,886 | — | — | — | (2,421 | ) | 28,584 | |||||||||||||||||||||||
EÓLICA MANGUE SECO | 17,166 | — | — | — | — | — | (159 | ) | 17,006 | |||||||||||||||||||||||
NORTE ENERGIA (BELO MONTE) | 724,746 | 659,736 | — | — | — | — | (19,387 | ) | 1,365,096 | |||||||||||||||||||||||
MADEIRA ENERGIA S.A. | 645,738 | 1,126,504 | — | — | — | — | 98,449 | 1,870,691 | ||||||||||||||||||||||||
ESBR PARTICIPAÇÕES S.A. | 1,108,816 | 780,001 | (463 | ) | — | — | — | (8,705 | ) | 1,879,649 | ||||||||||||||||||||||
ENERPEIXE S.A. | 536,652 | — | — | — | — | (98,440 | ) | 76,523 | 514,735 | |||||||||||||||||||||||
INTERLIGAÇÃO ELÉTRICA DO MADEIRA S.A. | 359,756 | 135,240 | — | — | — | — | 19,116 | 514,112 | ||||||||||||||||||||||||
MANAUS TRANSMISSORA DE ENERGIA S.A. | 310,354 | 180,085 | — | — | — | — | (13,820 | ) | 476,619 | |||||||||||||||||||||||
NORTE BRASIL TRANSMISSORA DE ENERGIA S.A. | 35,595 | 332,220 | 8,536 | — | — | (554 | ) | 12,311 | 388,108 | |||||||||||||||||||||||
CHAPECOENSE GERAÇÃO S.A. | 276,365 | — | — | — | — | (5,501 | ) | 32,763 | 303,627 | |||||||||||||||||||||||
GOIÁS TRANSMISSÃO | 40,540 | 56,840 | — | — | — | (300 | ) | 4,566 | 101,646 | |||||||||||||||||||||||
STN - SISTEMA DE TRANSMISSÃO NORDESTE S.A. | 195,267 | — | — | — | — | (24,021 | ) | 17,615 | 188,861 | |||||||||||||||||||||||
SANTA VITÓRIA DO PALMAR HOLDING S.A. | — | 97,551 | — | — | — | — | (491 | ) | 97,060 | |||||||||||||||||||||||
INTEGRAÇÃO TRANSMISSORA DE ENERGIA S.A. | 131,287 | — | — | — | — | (153 | ) | 16,768 | 147,902 | |||||||||||||||||||||||
RETIRO BAIXO ENERGIA S.A. | 106,068 | — | — | — | — | — | 4,010 | 110,078 | ||||||||||||||||||||||||
MGE TRANSMISSÃO | 34,217 | 27,440 | — | — | — | (201 | ) | 1,975 | 63,431 | |||||||||||||||||||||||
BRASNORTE TRANSMISSORA DE ENERGIA S.A. | 105,661 | — | — | — | — | — | 3,948 | 109,609 | ||||||||||||||||||||||||
ENERGÉTICA ÁGUAS DA PEDRA S.A. | 157,112 | — | — | — | — | (8,073 | ) | 27,464 | 176,503 | |||||||||||||||||||||||
CIA. HIDRELÉTRICA TELES PIRES | 93,550 | — | — | — | — | — | (3,734 | ) | 89,816 | |||||||||||||||||||||||
BAGUARI ENERGIA S.A. | 90,346 | — | — | — | — | (9,730 | ) | 8,623 | 89,239 | |||||||||||||||||||||||
TRANSENERGIA RENOVÁVEL S.A. | 70,821 | 32,830 | — | — | — | — | 4,214 | 107,865 | ||||||||||||||||||||||||
TRANSMISSORA MATOGROSSENSE DE ENERGIA S.A. | 47,047 | 4,799 | — | — | — | — | 11,191 | 63,037 | ||||||||||||||||||||||||
CHUÍ HOLDING S.A | — | 33,887 | — | — | — | — | (281 | ) | 33,606 | |||||||||||||||||||||||
SERRA DO FACÃO ENERGIA S.A. | 145,463 | — | — | — | — | (1,005 | ) | (40,360 | ) | 104,098 | ||||||||||||||||||||||
TDG - TRANSMISSORA DELMIRO GOUVEIA S.A. | 15,235 | 34,300 | — | — | — | — | (4,352 | ) | 45,183 | |||||||||||||||||||||||
AMAPARI ENERGIA S.A. | 34,105 | — | — | — | — | (2,269 | ) | 7,354 | 39,190 | |||||||||||||||||||||||
Others | 405,604 | — | — | — | — | — | 238,797 | 644,401 | ||||||||||||||||||||||||
|
|
|
|
|
|
|
|
|
|
|
|
|
|
|
| |||||||||||||||||
TOTAL OF INVESTMENTS | 9,518,134 | 3,512,594 | 114,802 | — | — | (363,032 | ) | 424,718 | 13,446,013 | |||||||||||||||||||||||
|
|
|
|
|
|
|
|
|
|
|
|
|
|
|
| |||||||||||||||||
F-86
Table of Contents
15.4 Information about market value and investee’s revenue
| Market Value (*) | ||||||||||||||
Listed Entities | Evaluation Method | Equity | 12/31/2013 | 12/31/2012 | ||||||||||
CEEE-D | Equity | 32.59 | % | 189,631 | 244,628 | |||||||||
CEEE-GT | Equity | 32.59 | % | 202,250 | 268,884 | |||||||||
CEMAR | Equity | 33.55 | % | 837,264 | 534,769 | |||||||||
CEMAT | Equity | 40.92 | % | 232,872 | 206,254 | |||||||||
CTEEP | Equity | 35.23 | % | 1,561,602 | 1,846,752 | |||||||||
EMAE | Equity | 39.02 | % | 82,894 | 106,681 | |||||||||
CELPA | Market Value | 1.15 | % | 17,435 | 23,613 | |||||||||
CELESC | Market Value | 10.75 | % | 82,901 | 141,779 | |||||||||
CESP | Market Value | 2.05 | % | 148,568 | 153,571 | |||||||||
COELCE | Market Value | 7.06 | % | 210,589 | 226,711 | |||||||||
AES Tiete | Market Value | 7.94 | % | 577,435 | 713,399 | |||||||||
CGEEP - DUKE | Market Value | 0.47 | % | 27,371 | 30,162 | |||||||||
ENERGISA S.A | Market Value | 3.29 | % | 84,906 | 77,740 | |||||||||
CELGPAR | Market Value | 0.07 | % | 345 | 391 | |||||||||
CELPE | Market Value | 1.56 | % | 21,149 | 35,212 | |||||||||
COPEL | Market Value | 0.56 | % | 34,136 | 37,856 | |||||||||
CEB | Market Value | 3.29 | % | 6,703 | 6,000 | |||||||||
AES Eletropaulo | Market Value | 1.25 | % | 35,368 | 35,206 | |||||||||
CPFL Energia | Market Value | 0.18 | % | Not disclosed | 36,456 | |||||||||
Energias do Brasil | Market Value | 0.31 | % | 19,385 | 18,556 | |||||||||
| (*) | Based on the price of shares on the base date. |
| Market Value | ||||||||||||||
Non listed Entities | Evaluation Method | Equity | 12/31/2013 | 12/31/2012 | ||||||||||
Guascor | Market Value | 4.41 | % | Not disclosed | Not disclosed | |||||||||
TANGARÁ | Market Value | 25.47 | % | 19,932 | 19,932 | |||||||||
CDSA | Market Value | 0.13 | % | 368 | 367 | |||||||||
Ceb Lajeado | Equity | 40.07 | % | 58,364 | 58,364 | |||||||||
Lajeado Energia | Equity | 40.07 | % | 303,276 | 303,276 | |||||||||
Paulista Lajeado | Equity | 40.07 | % | 22,532 | 22,532 | |||||||||
Amapari Energia S.A. | Equity | 40.07 | % | 109,563 | 79,980 | |||||||||
Amazônia Eletronorte Transmissora de Energia S.A. | Equity | 49.00 | % | 81,638 | 79,273 | |||||||||
Baguari Energia S.A. | Equity | 30.61 | % | 301,961 | 291,514 | |||||||||
Bom Jesus | Equity | 49.00 | % | 190 | Not disclosed | |||||||||
Brasnorte Transmissora de Energia S.A. | Equity | 49.71 | % | 213,072 | 220,497 | |||||||||
Brasventos Eolo Geradora de Energia S.A. | Equity | 49.00 | % | 92,340 | 28,208 | |||||||||
Brasventos Miassaba 3 Geradora de Energia S.A. | Equity | 49.00 | % | 127,069 | 38,771 | |||||||||
Cachoeira | Equity | 49.00 | % | 131 | Not disclosed | |||||||||
Caldas Novas | Equity | 49.90 | % | 21,311 | 12,960 | |||||||||
Carnaúba I | Equity | 49.00 | % | 231 | Not disclosed | |||||||||
Carnaúba II | Equity | 49.00 | % | 190 | Not disclosed | |||||||||
Carnaúba III | Equity | 49.00 | % | 169 | Not disclosed | |||||||||
Carnaúba V | Equity | 49.00 | % | 251 | Not disclosed | |||||||||
Central Eólica Famosa I S.A. | Equity | 49.00 | % | 14,822 | Not disclosed | |||||||||
Central Eólica Pau Brasil S.A. | Equity | 49.00 | % | 9,878 | Not disclosed | |||||||||
Central Eólica Rosada S.A. | Equity | 49.00 | % | 18,543 | Not disclosed | |||||||||
Central Eólica São Paulo S.A. | Equity | 49.00 | % | 11,122 | Not disclosed | |||||||||
Cervantes I | Equity | 49.00 | % | 169 | Not disclosed | |||||||||
Cervantes II | Equity | 49.00 | % | 131 | Not disclosed | |||||||||
Chapecoense Geração S.A. | Equity | 40.00 | % | 863,468 | 759,068 | |||||||||
Chuí | Equity | 49.00 | % | 153,490 | 68,584 | |||||||||
Companhia de Transmissão Centroeste de Minas | Equity | 49.00 | % | 35,980 | 48,561 | |||||||||
Companhia Hidrelétrica Teles Pires | Equity | 24.50 | % | Not disclosed | 366,596 | |||||||||
Construtora Integração Ltda | Equity | 49.00 | % | 91,649 | 82,265 | |||||||||
Costa Oeste | Equity | 49.00 | % | 8,733 | 2,322 | |||||||||
Energética Águas da Pedra S.A. | Equity | 49.00 | % | 378,947 | 353,906 | |||||||||
Energia dos Ventos I S.A. | Equity | 49.00 | % | 10,963 | 341 | |||||||||
Energia dos Ventos II S.A. | Equity | 49.00 | % | 6,684 | 251 | |||||||||
Energia dos Ventos III S.A. | Equity | 49.00 | % | 9,880 | 310 | |||||||||
Energia dos Ventos IV S.A. | Equity | 49.00 | % | 14,327 | 441 | |||||||||
Energia dos Ventos IX S.A. | Equity | 49.00 | % | 11,731 | 341 | |||||||||
Energia dos Ventos V S.A. | Equity | 49.00 | % | 11,504 | 320 | |||||||||
Energia dos Ventos VI S.A. | Equity | 49.00 | % | 15,849 | 420 | |||||||||
Energia dos Ventos VII S.A. | Equity | 49.00 | % | 16,000 | 441 | |||||||||
Energia dos Ventos VIII S.A. | Equity | 49.00 | % | 11,463 | 320 | |||||||||
Energia dos Ventos X S.A. | Equity | 49.00 | % | 8,792 | 280 | |||||||||
Enerpeixe | Equity | 40.00 | % | 1,313,448 | 1,286,838 | |||||||||
ESBR Participações S.A. | Equity | 40.00 | % | 6,880,352 | 4,699,124 | |||||||||
Etau | Equity | 27.40 | % | 88,318 | 86,482 | |||||||||
Extremoz Transmissora do Nordeste ETN S.A. | Equity | 49.00 | % | 3,071 | 108 | |||||||||
F-87
Table of Contents
| Market Value | ||||||||||||||
Non listed Entities | Evaluation Method | Equity | 12/31/2013 | 12/31/2012 | ||||||||||
Fronteira Oeste | Equity | 51.00 | % | 10 | Not disclosed | |||||||||
Goiás Transmissão S.A. | Equity | 49.00 | % | 460,188 | 207,441 | |||||||||
Inambari Geração de Energia | Equity | 19.60 | % | 31,255 | 33,878 | |||||||||
Integração Transmissora de Energia S.A. | Equity | 49.00 | % | 317,932 | 297,048 | |||||||||
Interligação Elétrica do Madeira S.A. | Equity | 49.00 | % | 1,514,466 | 1,119,863 | |||||||||
Interligação Elétrica Garanhuns S.A. | Equity | 49.00 | % | 201,342 | 30,521 | |||||||||
Linha Verde Transmissora de Energia S.A. | Equity | 49.00 | % | 47,463 | 55,169 | |||||||||
Livramento | Equity | 49.00 | % | 198,669 | 72,000 | |||||||||
Luziânia - Niquelândia Transmissora S.A. | Equity | 49.00 | % | 11,500 | 1,900 | |||||||||
Madeira Energia S.A. | Equity | 39.00 | % | 6,425,851 | 4,796,644 | |||||||||
Manaus Construtora Ltda. | Equity | 49.50 | % | 18,116 | 79,024 | |||||||||
Manaus Transmissora de Energia S.A. | Equity | 49.50 | % | 1,061,735 | 962,864 | |||||||||
Marumbi | Equity | 20.00 | % | 5,755 | 2,850 | |||||||||
MGE Transmissão S.A. | Equity | 49.00 | % | 217,084 | 129,451 | |||||||||
Norte Brasil Transmissora de Energia S.A. | Equity | 49.00 | % | 943,204 | 792,059 | |||||||||
Norte Energia S.A. | Equity | 34.98 | % | 4,212,159 | 2,732,162 | |||||||||
Paranaíba | Equity | 24.50 | % | 72,657 | Not disclosed | |||||||||
Pedra Branca S.A. | Equity | 49.00 | % | 28,768 | 27,560 | |||||||||
Pitimbu | Equity | 49.00 | % | 190 | Not disclosed | |||||||||
Punaú I | Equity | 49.00 | % | 251 | Not disclosed | |||||||||
Rei dos Ventos 3 Geradora de Energia S.A. | Equity | 49.00 | % | 83,460 | 36,384 | |||||||||
Retiro Baixo Energética S.A. | Equity | 49.00 | % | 230,982 | 224,649 | |||||||||
Santa Vitória do Palmar | Equity | 49.00 | % | 379,531 | 198,080 | |||||||||
São Caetano | Equity | 49.00 | % | 269 | Not disclosed | |||||||||
São Caetano I | Equity | 49.00 | % | 190 | Not disclosed | |||||||||
São Galvão | Equity | 49.00 | % | 251 | Not disclosed | |||||||||
São Pedro do Lago S.A. | Equity | 49.00 | % | 30,852 | 28,770 | |||||||||
Serra do Facão Energia S.A. | Equity | 49.47 | % | 123,040 | 210,411 | |||||||||
Sete Gameleiras S.A. | Equity | 49.00 | % | 41,312 | 40,430 | |||||||||
STN - Sistema de Transmissão Nordeste S.A. | Equity | 49.00 | % | 398,274 | 385,431 | |||||||||
TDG - Transmissora Delmiro Gouveia S.A. | Equity | 49.00 | % | 101,690 | 92,209 | |||||||||
Teles Pires Participações S.A. | Equity | 49.42 | % | 1,064,632 | 363,628 | |||||||||
Transenergia Goiás S.A. | Equity | 49.00 | % | 5,022 | 5,127 | |||||||||
Transenergia Renovável S.A. | Equity | 49.00 | % | 159,676 | 220,133 | |||||||||
Transenergia São Paulo S.A. | Equity | 49.00 | % | 101,290 | 63,908 | |||||||||
Transirapé | Equity | 24.50 | % | 57,347 | 46,367 | |||||||||
Transleste | Equity | 24.00 | % | 113,279 | 107,029 | |||||||||
Transmissora Matogrossense de Energia S.A. | Equity | 49.00 | % | 154,399 | 128,647 | |||||||||
Transnorte Energia S.A. | Equity | 49.00 | % | 76,698 | 53,467 | |||||||||
Transudeste | Equity | 25.00 | % | 56,028 | 55,484 | |||||||||
Triângulo Mineiro | Equity | 49.00 | % | 21,357 | Not disclosed | |||||||||
TSBE | Equity | 80.00 | % | 209,254 | 7,876 | |||||||||
TSLE | Equity | 51.00 | % | 33,139 | 32,904 | |||||||||
Usina Energia Eólica Caiçara I S.A. | Equity | 49.00 | % | 10,778 | 233 | |||||||||
Usina Energia Eólica Caiçara II S.A. | Equity | 49.00 | % | 6,937 | 136 | |||||||||
Usina Energia Eólica Junco I S.A. | Equity | 49.00 | % | 10,599 | 217 | |||||||||
Usina Energia Eólica Junco II S.A. | Equity | 49.00 | % | 10,788 | 227 | |||||||||
Vale do São Bartolomeu | Equity | 39.00 | % | 1,700 | Not disclosed | |||||||||
Ventos de Santa Joana IX Energias Renováveis S.A. | Equity | 49.00 | % | 9,017 | Not disclosed | |||||||||
Ventos de Santa Joana X Energias Renováveis S.A. | Equity | 49.00 | % | 9,017 | Not disclosed | |||||||||
Ventos de Santa Joana XI Energias Renováveis S.A. | Equity | 49.00 | % | 9,017 | Not disclosed | |||||||||
Ventos de Santa Joana XII Energias Renováveis S.A. | Equity | 49.00 | % | 9,017 | Not disclosed | |||||||||
Ventos de Santa Joana XIII Energias Renováveis S.A. | Equity | 49.00 | % | 9,017 | Not disclosed | |||||||||
Ventos de Santa Joana XV Energias Renováveis S.A. | Equity | 49.00 | % | 9,017 | Not disclosed | |||||||||
Ventos de Santa Joana XVI Energias Renováveis S.A. | Equity | 49.00 | % | 9,017 | Not disclosed | |||||||||
F-88
Table of Contents
15.5 Summary of information of jointly controlled entities and associates
I – Assets and Liabilities
| 12/31/2013 | ||||||||||||||||||||||||
Jointly controlled entities and associates | Equity | Financial, intangible and fixed assets | Other assets | Loans and financing | Other liabilities | Equity | ||||||||||||||||||
AES Eletropaulo | 1.25 | % | — | — | — | — | — | |||||||||||||||||
AES Tietê S.A | 7.94 | % | — | — | — | — | — | |||||||||||||||||
Brasnorte Transmissora de Energia S.A. | 49.00 | % | 259,646 | 12,622 | 27,888 | 31,308 | 213,072 | |||||||||||||||||
CEEE-D | 32.59 | % | 1,566,376 | 1,431,206 | 451,072 | 2,035,169 | 511,341 | |||||||||||||||||
CEEE-GT | 32.59 | % | 468,606 | 2,734,020 | 234,429 | 1,235,724 | 1,732,473 | |||||||||||||||||
Chapecoense Geração S.A. | 40.00 | % | 3,209,220 | 232,821 | 1,795,563 | 783,010 | 863,468 | |||||||||||||||||
Cia Hidrelétrica Teles Pires | 49.00 | % | 3,137,772 | 839,665 | 2,659,699 | 255,366 | 1,062,372 | |||||||||||||||||
CPFL Energia | 0.18 | % | ||||||||||||||||||||||
CTEEP | 35.23 | % | 24,565 | 6,575,996 | 229,350 | 1,458,764 | 4,912,447 | |||||||||||||||||
CESP | 2.05 | % | — | — | — | — | — | |||||||||||||||||
Energética Aguas da Pedra S.A | 49.00 | % | 750,921 | 144,460 | 442,144 | 43,390 | 409,847 | |||||||||||||||||
Enerpeixe S.A. | 40.00 | % | 1,696,814 | 186,286 | 238,093 | 331,560 | 1,313,447 | |||||||||||||||||
ESBR Participações S.A. | 40.00 | % | 16,808,946 | 1,342,317 | 10,179,844 | 933,548 | 7,037,871 | |||||||||||||||||
Inambari Geração de Energia | 49.00 | % | 26,136 | 5,047 | — | 104 | 31,079 | |||||||||||||||||
Integração Trasmissora de Energia S.A | 49.00 | % | 624,947 | 20,725 | 212,154 | 115,586 | 317,932 | |||||||||||||||||
Interligação Elétrica do Madeira S.A | 49.00 | % | 4,039,559 | 79,230 | 2,431,411 | 432,143 | 1,255,235 | |||||||||||||||||
Itaipu | 50.00 | % | 37,786,710 | 2,303,927 | 32,432,831 | 7,423,546 | 234,260 | |||||||||||||||||
Madeira Energia S.A | 39.00 | % | 18,827,952 | 1,695,658 | 11,893,204 | 2,204,556 | 6,425,850 | |||||||||||||||||
Manaus Transmissora de Energia S.A. | 49.50 | % | 2,076,820 | 177,653 | 876,820 | 315,918 | 1,061,735 | |||||||||||||||||
Norte Brasil Transmissora de Energia S.A. | 49.00 | % | 2,440,038 | 105,802 | 1,097,930 | 507,405 | 940,505 | |||||||||||||||||
Norte Energia S.A | 50.00 | % | 12,757,333 | 1,180,925 | 8,745,145 | 980,954 | 4,212,159 | |||||||||||||||||
Serra do Facão Energia S.A | 49.47 | % | 1,999,780 | 74,698 | 516,965 | 1,434,737 | 122,776 | |||||||||||||||||
Sistema de Transmissão Nordeste S.A | 49.00 | % | 674,032 | 31,820 | 201,814 | 105,764 | 398,274 | |||||||||||||||||
Others | 13,203,554 | 5,017,068 | 5,068,726 | 4,365,799 | 8,786,097 | |||||||||||||||||||
II – Income Statement
| 12/31/2013 | ||||||||||||||||||||||||
Jointly controlled entities and associates | Net operating revenue | financial income | financial expense | Taxes on income | Net income (loss) | Depreciation and amortization | ||||||||||||||||||
Brasnorte Transmissora de Energia S.A. | 4,050 | 200 | (861 | ) | (353 | ) | 1,780 | (557 | ) | |||||||||||||||
CEEE-D | 2,263,719 | 136,400 | (76,275 | ) | 3,278 | (228,571 | ) | (4,795 | ) | |||||||||||||||
CEEE-GT | 735,508 | 161,302 | (22,970 | ) | 27,290 | (191,336 | ) | (41,062 | ) | |||||||||||||||
Chapecoense Geração S.A. | 567,286 | 15,792 | (140,980 | ) | (79,433 | ) | 161,601 | (64,365 | ) | |||||||||||||||
Cia Hidrelétrica Teles Pires | 112 | — | (925 | ) | — | (15,898 | ) | — | ||||||||||||||||
CTEEP | 822,235 | 302,321 | (212,243 | ) | 181,951 | 31,921 | 7,339 | |||||||||||||||||
Energética Aguas da Pedra S.A | 118,849 | 3,619 | (22,432 | ) | 181,951 | 31,452 | (12,650 | ) | ||||||||||||||||
Enerpeixe S.A. | 424,737 | 12,195 | (53,551 | ) | 181,951 | 219,218 | (49,398 | ) | ||||||||||||||||
ESBR Participações S.A. | 126,857 | 3,219 | (5,704 | ) | 181,951 | (194,439 | ) | (5,661 | ) | |||||||||||||||
Inambari Geração de Energia | — | 55 | — | 181,951 | (33,579 | ) | (24 | ) | ||||||||||||||||
Integração Trasmissora de Energia S.A | 71,428 | 1,349 | (20,153 | ) | 181,951 | 33,999 | (3 | ) | ||||||||||||||||
Interligação Elétrica do Madeira S.A | 784,981 | 9,691 | (153,651 | ) | 181,951 | 11,092 | — | |||||||||||||||||
Itaipu | 8,199,764 | 54,459 | (1,665,907 | ) | 181,951 | 2,565,210 | — | |||||||||||||||||
Madeira Energia S.A | 1,300,586 | 18,115 | (323,895 | ) | 181,951 | (47,738 | ) | (230,612 | ) | |||||||||||||||
Manaus Transmissora de Energia S.A. | 311,705 | 5,937 | (75,372 | ) | 181,951 | 63,601 | — | |||||||||||||||||
Norte Brasil Transmissora de Energia S.A. | 546,395 | 9,936 | (56,224 | ) | 181,951 | 14,441 | — | |||||||||||||||||
Norte Energia S.A | — | 85,047 | (85,615 | ) | 18,394 | (37,078 | ) | (3,190 | ) | |||||||||||||||
Serra do Facão Energia S.A | 252,057 | 4,278 | (38,728 | ) | (10,932 | ) | (74,009 | ) | (24,361 | ) | ||||||||||||||
Sistema de Transmissão Nordeste S.A | 138,203 | 2,390 | (29,923 | ) | (18,872 | ) | 77,719 | (114 | ) | |||||||||||||||
Others | 4,210,026 | 1,077,463 | (577,747 | ) | (152,657 | ) | 481,226 | (34,304 | ) | |||||||||||||||
I – Distribution Companies:
a) Distribution Alagoas - holds the concession for the distribution of electricity in all the municipalities of the State of Alagoas by the Concession Agreement 07/2001- ANEEL and its amendments, respectively, on May 15, 2005 and on June 08, 2009, maturing on July 7, 2015. Its main objective is to design, build and operate the utility distribution to final consumers of electricity. The subsidiary has negative working capital of R$ 219,360 (December 31, 2012 - R$ 39,531), accumulated losses of R$ 583,356 (December 31, 2012 - R$ 374,151) and unsecured liabilities of R$ 21,400 (equity net of R$ 4,118 on December 31, 2012) and depends on the financial support of the Company.
F-89
Table of Contents
b) Distribution Rondônia - holds the concession to distribute electricity in all municipalities in the State of Rondônia by the Concession Agreement 05/2001- ANEEL and its amendments, respectively, February 12, 2001 and November 11, 2005 maturing on July 7, 2015. Its main objective is to design, build and operate the utility distribution to final consumers of electricity. The subsidiary has negative working capital of R$ 311,403 (December 31, 2012 - R$ 24,541), accumulated losses of R$ 1,513,778 (December 31, 2012 - R$ 1,190,628) and a deficit of R$ 188,654 (December 31, 2012 - R$ 72,768) and depends on the financial support of the Company.
c) Distribution Piauí - holds the concession to distribute electricity in all municipalities in the state of Piaui, through the Concession Agreement 04/2001 – ANEEL, 12 February 2001, maturing on July 7, 2015. The main activity is the distribution of electricity. The subsidiary has negative working capital of R$ 176,070 (December 31, 2012-54248), accumulated losses of R$ 1,441,479 (December 31, 2012 - R$ 999,171) and unsecured liabilities of R$ 219,477 (31 December 2012 - R $ 223,506) and depends on the financial support of the Company.
d) Amazonas Energia – has as main activities the generation, distribution and sale of electricity in the State of Amazonas. Amazonas Energia’s own generation (2203.9 MW) reduces its need to buy electricity from independent producers. The subsidiary has negative working capital of R$ 2,950,392 (December 31, 2012 - R$ 1,949,330) accumulated losses of R$ 6,586,399 (December 31, 2012 - R$ 5,445,438) and a passive deficit of R$ 2,492,502 (December 31, 2012 - R$ 1,128,019) and depends on the financial support of the Company. This subsidiary may be restructured in 2014; the Company is considering transferring generation to a new company to be created under Eletrobras.
e) Distribution Roraima - holds the concession to distribute electricity in Boa Vista – PR, through Concession Agreement 21/2001 – ANEEL and its amendments, respectively, March 21, 2001 and October 14, 2005 maturing on July 7, 2015. The subsidiary has negative working capital of R$ 33,611 (December 31, 2012 - R$ 41,725), accumulated losses of R$ 674,534 (December 31, 2012 - R$ 715,355) and equity of R$ 8,294 (capital deficit of R$ 35,239 at December 31, 2012) and depends on the financial support of the Company.
f) Distribution Acre - holds the concession to distribute and sell electricity in the state of Acre, through Concession Agreement 06/ 2001 – ANEEL, February 12, 2001 maturing on July 7, 2015. The electricity supply to the capital, Rio Branco, and six localities is made by Eletronorte. Since 1999, the remainder of the state is supplied through a lease contract arrangement with GUASCOR Brazil Ltda. in the form of Independent Power Producer, IPP, through Isolated Generation Systems. It should be emphasized that the supply of electricity to the entire state, is through diesel power stations (100%). The subsidiary has negative working capital of R$ 19,921 (December 31, 2012 - R$ 39,422), accumulated losses of R$ 458,987 (December 31, 2012 - R$ 306,761) and unsecured liabilities of R$ 209,552 (31 December 2012 - R$ 57,325) and depends on the financial support of the Company.
II - Generation and Transmission Companies:
a) Thermonuclear Eletrobras SA - wholly owned subsidiary of the Company, is primarily engaged in the construction and operation of nuclear facilities, and the implementation of
F-90
Table of Contents
related engineering services, and these activities are regulated and supervised by ANEEL. The Company is engaged in operating Angra 1 and Angra 2, with nominal power of 1,990 MW, and is engaged in the construction of Angra 3. The electricity generated by the Company has been provided exclusively for the subsidiary Furnas, under a purchase and sale of electricity contract maturing on December 31, 2012. As of January 1, 2013, electricity was divided among all concession holders authorized for public distribution service in the National Interconnected System - SIN, according to the methodology established in the Normative Resolution No. 530, issued on 21 December 2012, ANEEL, for calculating the annual quota-shares relating to energy generation plants of Angra 1 and Angra 2 and the conditions for the sale of this electricity pursuant to article 11 of Law No. 12.111/2009.
b) Eletrosul Central Electric SA - has as main objective the transmission and generation of electricity directly or through participation in special purpose entities. The Company carries out studies, projects, construction, operation and maintenance of the transmission and power generation systems, and these activities are regulated. The Company controls the Uirapuru As NE 3.2 (d), Artemis, RS Energy, Porto Velho Transmitter and Cerro Chato I, II and III which were merged on May 29, 2013.
c) Itaipú - Binacional is an entity created and governed, with equal rights and obligations under international treaty signed on April 26, 1973, between the Federative Republic of Brazil and the Republic of Paraguay, with its capital belonging equally to Eletrobras and Administración Nacional de Electricidad - ANDE.
The goal is the utilization of the water resources of the Paraná River, belonging to the two countries in an area from Salto de Guaíra to the outfall of the Iguaçu River, through the construction and operation of the Hydro Power Plant, with a total available capacity of 14 million MW. In 2013 Itaipú produced a total of 98.6 million MWh, breaking its own world record for energy production.
d) Hydroelectric Company of San Francisco - CHESF - public utility electric power which aims to generate, transmit and sell electricity. Generation focuses on hydrothermal systems, with a predominance of hydroelectric plants, which account for over 97% of total production. CHESF has 14 hydroelectric plants and one thermoelectric plant, for a total installed capacity of 10,615 MW, and the activity of the transmission system consists of 11 substations and 19,344 km of high voltage lines.
e) Centrais Elétricas do Norte do Brasil S.A. - Eletronorte - public utility electricity entity, controlled by the Company, with predominant activity in the states of Acre, Amapá, Amazonas, Maranhão, Mato Grosso, Pará, Rondônia, Roraima and Tocantins. Its electricity generation operations consist of four hydroelectric plants with an installed capacity of 8860.05 MW and 6 thermal power plants with a capacity of 479.97 MW, for a total installed capacity of 9340.02 MW. Power transmission is effected by a system composed of 9287.13 km of transmission lines, 45 substations in the National Interconnected System - SIN 695.89 Km of transmission lines, 10 substations in the isolated system, a total of 9,983, 02 km of transmission lines and 55 substations.
It has a controlling stake in its subsidiary Transco Station Energia SA, and corporate participation in various special purpose entities involved in the generation and transmission of electricity. On December 30, 2013, the wholly owned subsidiary of Rio Branco Transco Energy S.A., was incorporated (Note 3.2 d).
F-91
Table of Contents
f) Furnas Centrais Eletricas S.A. – Furnas - controlled by the Company, engaged in the generation, transmission and trading predominantly in the region of the Federal District and the states of São Paulo, Minas Gerais, Rio de Janeiro, Paraná, Espírito Santo, Goiás, Mato Grosso, Pará, Tocantins, Rondônia, Rio Grande do Sul, Santa Catarina, Rio Grande do Norte, Ceará and Bahia, as well as participating in special purpose entities. The system of electricity production operated by Furnas has 9 wholly owned hydroelectric plants, two in partnership with the private sector with an installed capacity of 8,996 MW and two 962 MW power plants with capacity totaling 9,958 MW.
g) Compania de Geração Térmica de Energia Elétrica - CGTEE - is primarily engaged in performing studies of, designing, constructing and operating the transmission facilities and power generation systems, for which it is regulated. The Company has transferred to it the following power generation plants: Usina Presidente Medici, Phases A and B, located in the municipality of Candiota; Plant St. Jerome, in the municipality of St. Jerome, and NUTEPA Plant, located in the municipality of Porto Alegre, all in the state of Rio Grande do Sul. The subsidiary has negative working capital of R$ 359,585 (December 31, 2012 - R$ 316,197).
CGTEE showed a loss of R$ 472,043 on December 31, 2013, compared to a loss of R$ 418,013 on December 31, 2012, resulting in a deficit of R$ 97,728 (equity of R$ 210,210 on December 31, 2012). Given the current situation, the company is in talks with Eletrobras in order to secure its technical and financial recovery. CGTEE also needs the financial support of Eletrobras for operational maintenance and for the implementation of future investments.
III – Other Companies
a) Companhia Energetica do Maranhao - CEMAR - public service concessionaire of electricity, with the objective to design, build and operate systems for the sub-transmission, transformation, distribution and sale of electricity.
The Company holds the concession to distribute electricity to 217 municipalities in the State of Maranhão, regulated by the Concession Agreement No. 60 of August 28, 2000, signed with ANEEL, which will mature in August 2030. This concession agreement may be renewed for a further period of 30 years.
b) Eletrobras Participações S.A. - subsidiary of the Company, engaged in the participation in the capital of other companies.
c) Companhia Estadual de Geração e Transmissão de Energia Elétrica – CEEE-GT - traded corporation with its controlling shareholder being the state of Rio Grande do Sul through the Companhia Estadual de Energia Elétrica Participações - CEEE-Par, which holds 65% of the company and 92% of its total capital. The entity’s purpose is to explore the production and transmission of electric power systems.
d) Companhia Estadual de Distribuição de Energia Elétrica – CEEE-D publicly traded corporation with its controlling shareholder being the state of Rio Grande do Sul through the Companhia Estadual de Energia Elétrica Participações - CEEE-Par, which holds 65.92% of its total capital. The CEEE-D is engaged in the distribution of electricity in 72 districts of Rio Grande do Sul, serving approximately 4 million consumer units.
F-92
Table of Contents
e) Companhia Transmissão de Energia Elétrica Paulista - CTEEP – publicly traded corporation, authorized to operate as a public utility electric power entity, with its main activities being the planning, construction and operation of transmission systems of electricity.
f) Centrais Elétricas do Pará S.A. – CELPA - publicly traded company under the controlling ownership of Equatorial Energia S.A. (Equatorial), which operates in the generation and distribution of electricity in the State of Pará, serving consumers in 143 municipalities, according to the Concession Agreement 182/1998, entered into on July 28, 1998. The concession is for 30 years and is due to mature on July 28, 2028. In addition to the distribution agreement, the CELPA has Generation Concession 181/98 Agreement 34 for thermoelectric power plants, with 11 private and 23 outsourced, for the operation of electricity generation. The term is for 30 years and matures on July 28 2028. This agreement may be renewed for another 30 year period. In December 2013, CELPA had a net working capital of R$ 94,439 (December 31, 2012 - negative R$ 33,510).
All existing claims against the subsidiary until the date of filing of its bankruptcy, even though not due, subject to the legal exceptions, shall be paid pursuant to the judicial recovery plan, approved on September 1, 2012 at the General Meeting creditors.
g) Empresa Metropolitana de Águas e Energia S.A. - EMAE - the concessionaire of a hydroelectric complex located in the Alto Tietê, centered on Henry Borden hydroelectric plant. EMAE further operates UHE Rasgão and UHE Porto Góes, both in Rio Tietê. Also, EMAE operates UHE Isabel in the city of Pindamonhangaba in the Paraíba Valley, although this site is currently out of operation. The subsidiary had positive net working capital as of December 31, 2013 of R$138,019 (December 31, 2012 R$ 140,244).
h) Lajeado Energia S.A, - privately held company, a subsidiary of EDP Energias do Brazil S.A., is primarily engaged in the generation and sale of electricity. The Company holds 73% of the total capital of Investco S.A., whose main purpose is the exploration of UHE Luís Eduardo Magalhães and its transmission system in the State of Tocantins, pursuant to the terms of the Concession Contract for Use of Public Property 05/97 - ANEEL, effective until 2033.
i) Centrais Elétricas Matogrossenses S.A. - CEMAT stock company traded under the ownership control of Rede Energia S.A., under federal control, working in the area of electric power distribution. It generates electricity through its thermal power plants and serves the isolated systems in its concession area, which covers the state of Mato Grosso, serving consumers in 141 municipalities. Under the Concession Agreement of 03/1997 signed on December 11, 1997, the concession period is 30 years and it expires on December 11, 2027, but is renewable for another 30 year period. In addition to the distribution agreement, the Company has Generation Concession 04/1997 Contract, for 3 thermal power plants with their associated substations, maturing on December 10, 2027. The subsidiary had negative working capital as of December 31, 2013 of R$ 925,515 (December 31, 2012 - R$ 438,922). The subsidiary has had difficulties in attracting and renewing its loans and financing which has resulted in difficulties settling its debts and other operational commitments in the short term.
ANEEL, through Authorization Resolution No. 3,647 of August 31, 2012, began provisional administrative intervention in CEMAT for a period of one (1) year from the publication of the resolution, unless renewed. By means of Resolution no. 4,282 of August 20, 2013, ANEEL renewed for a period of two (2) years the administrative intervention in CEMAT, leaving the previous provisions unchanged. Additionally, the Company announced to the market on
F-93
Table of Contents
December 19, 2012 the postponement of the payment of interest on capital declared at the Annual General Meeting held on April 30, 2012. This payment is suspended until the financial strength of the Company improves.
The judicial reorganization plans were submitted to the court within the statutory period on 03/15/2013, to be submitted for approval at the general meetings of creditors of the companies, which must be conducted within 150 (one hundred fifty) days, from the date of the order relating to the recovery (art. 56, § 1, of the Recovery Act). These plans, which were disclosed to shareholders and the market in accordance with applicable regulations, are subject to changes that may be proposed by creditors and resolved at a general meeting of creditors, subject to the legal quorum and approval of their own entities (Art. 56, § 3, the Recovery Act).
On December 17, 2013, ANEEL approved by order No. 4.463/2013 the judicial recovery plan of CEMAT presented by Grupo Rede Energia which was updated by Grupo Energisa. The Company recorded a provision for loss on investment in CEMAT because of CEMAT’s bankruptcy protection.
j) Norte Energia S.A. - special purpose company, privately held, for the purpose of conducting all necessary actions for the implementation, operation and maintenance of the hydroelectric plant of Belo Monte (UHE Belo Monte), with activities on the Xingu River, in the state of Pará and transmission facilities relating to the generating plant. The Company holds 49.98% of the share capital of Norte Energia. This subsidiary has invested heavily in organizational costs, development and pre-operation, which, according to the estimates and projections, should be absorbed by income from future operations. The subsidiary has a need for financial backing from its shareholders and third parties for a significant amount of resources for the completion of its hydroelectric plant. On December 31, 2013, the subsidiary had positive working capital of R$ 1,208,687 (December 31, 2012 - negative net equity of R$ 1,191,908).
k) Madeira Energia S.A. - a privately held corporation, incorporated on August 27, 2007 is engaged in the construction and operation of the Santo Antônio hydroelectric plant located in a portion of the Madeira River, in the city of Porto Velho, State of Rondônia, and its Associated Transmission System. The Company holds 39% of the capital of Madeira Energia. The subsidiary is incurring constitution expenses related to the development project for the construction of Santo Antônio hydroelectric plant, which, according to the financial projections prepared by its management, should be absorbed by future revenue from operations. On December 31, 2013, the subsidiary had negative working capital of R $ 199,510 (December 31, 2012 - R$ 1,166,329).
IV – Companies under Management
a) Companhia de Eletricidade do Amapá - CEA - The Company signed on November 12, 2012, a memorandum of understanding, in order to participate in the process of financial restructuring of the Companhia de Eletricidade do Amapá - CEA. This process provides that the Company will take a controlling stake in the CEA.
The Company and the State of Amapá signed on September 12, 2013, the Shareholders’ Agreement and a Management Agreement, aiming to secure the economic and financial recovery of the that after implementation of all its terms, provides a purchase option, by the Company, of the controlling interest in that company. For this, the Company assumes the
F-94
Table of Contents
executive management of the CEA, through its majority representation on the Board of Directors and appointment of members of the Executive Board of the CEA, which will later be replaced by professionals hired from the industry.
In this process the Government of the State of Amapá has received funding from the Federal Government, in order to discharge the debts of the CEA by Eletrobras and other vendors, and prepare a Contingency Plan to be submitted for approval by ANEEL.
b) Companhia Energética de Roraima - CERR - signed on November 26, 2012, a memorandum of understanding, in order to participate in the process of the financial restructuring of the Companhia Energetica de Roraima - CERR. This process provides that the Company may acquire control of CERR.
The Company and the Government of the State of Roraima signed, initially, a Shareholders’ Agreement and a Management Agreement, subject to the necessary approvals, aiming to secure the economic and financial recovery of CERR that, after the implementation of all its terms, provides a purchase option, by the Company, of the controlling interest in that company. For this, the Company assumes the executive management of CERR, through its majority representation on the Board of Directors and appointment of members of the Executive Board of CERR, which will later be replaced by professionals hired from the industry.
In this process the Government of the State of Roraima obtained funding, in order to discharge the debts of CERR by Eletrobras and other vendors, and prepare a Contingency Plan to be submitted for approval by ANEEL.
c) Celg Distribuição – CELG-D - On April 24, 2012 the Shareholders’ Agreement and Management Agreement between Eletrobras and the Government of the State of Goiás were signed with the Celgpar, in order to allow Eletrobras to assume the management of Celg Distribuição S.A. (Celg D) through its majority representation on the Board of Directors of the distributor, in order to promote the financial recovery CELD D, as well as introduce best practices of corporate governance, by introducing systems for the Management and Audit Committee and giving the means to comply with regulations of ANEEL in respect of its concession area.
However, through the Shareholders’ Agreement and Management Agreement cited above, and in accordance with the Law 12.688/12, Eletrobras may in the future, if such action proves economically feasible before the restructuring of its debts and corporate governance, acquire a controlling stake of CELG D, by acquiring 51% of the voting capital.
However, the divestiture process above is conditional upon the fulfillment of certain other conditions and obligations by the parties involved, including for example:
| • | Approval by the General Shareholders’ Meeting of Eletrobras; |
| • | Setting the price and terms of the transaction in accordance with an independent valuation report of the company; |
| • | Completion of due diligence by Eletrobras; |
| • | Negotiation of the draft Purchase and Sale Agreement; |
| • | Approval of the Department of Coordination and Governance of State Owned Enterprises under Article 6, IV, in Annex I to Decree number 7,675 of 01/20/2012, and the National Electric Energy Agency. |
F-95
Table of Contents
On January 29, 2014, Eletrobras, Celgpar and the State of Goiás signed a memorandum of understanding in order to reaffirm the following conditions for business continuity:
| • | The shares to be purchased by Eletrobras will be up to 51% of the common shares of GELG D. |
| • | The State and Celgpar undertake to facilitate the injection of funds by the amount of R$ 1.9 billion in CELG D, concurrently with the completion of the transfer of control to Eletrobras; |
| • | As a condition to the acquisition of the shares by Eletrobras, these contributions should be sufficient to make a positive equity market for CELG D; |
| • | The Parties undertake to endeavor to facilitate the completion of the evaluations of CELG D, according to the agreed terms; |
| • | The State, Celgpar and CELG D undertake to provide Eletrobras all documents requested by it, necessary for the completion of its review. |
Thus, Eletrobras has, on this date, only a 0.07% participation in the capital of Celgpar, and on December 31, 2013 we do not believe the necessary conditions for the control of CELG D are satisfied. Pursuant to provisions of IAS 27R, we do not believe CELG D has been transferred to Eletrobras and therefore the conditions set out in IFRS 3 for the consolidation of the financial statements of Eletrobras and CELG D for the year ended December 31, 2013 have not been satisfied.
V – Specific Purpose Entities
Throughout recent years, the companies of Eletrobras signed partnership projects with private companies, where the Company is a non-controlling shareholder, holding preferential shares. These enterprises have the objective to operate in the electricity generation and transmission sectors, and their values are classified as Assets – Investments.
In the same manner, and considering the need to expand investments in the Electricity Segment, companies controlled by the Company participate, also as minority shareholders, with common shares, in companies with concessions of electricity public utility services, which are also classified as Assets – Investments. The relevant investments with Company participation and its controlled companies with their specific purpose are as follows:
1 – Sistema de Transmissão Nordeste – STN
Partners – 1 – Chesf 49%; 2 – Alusa 51%
Purpose – LT 500 Hv, 546 vKm – Teresina/Fortaleza – in operation
2 – Empresa Transmissora do Alto Uruguai – ETAU
Partners – 1 – Eletrosul 27,4%; 2 – Transmissora Aliança 52,6%; 3 – DME Energética 10%; 4 – CEEE-GT 10%
Purpose – LT 230 Kv, 187 Km – Campos Novos /Santa Marte – in operation.
F-96
Table of Contents
3 – Enerpeixe S.A.
Partners – 1 – Furnas 40%; 2 – EDP 60%
Purpose – UHE Peixe Angical 452 MW – in operation.
4 – Manaus Construtora Ltda.
Partners – 1 – Eletronorte 30,0%; 2 – Chesf 19,5; 3 - Abengoa Holding 50,5%
Purpose – LT 500KV Oriximá/Cariri, SE Itacoatiara 500/138KV e SE 500/230KV – in operation.
5 – Uirapuru Transmissora de Energia
Partners – 1 – Eletrosul 75%; 2 – Elos 25%
Purpose – LT 525KV, Ivaiorã/Londrina – in operation.
6 – Energia Sustentável do Brasil
Partners – 1 – Chesf 20%; 2 – Eletrosul 20%; 2 - GDF Suez Energy Latin America Ltda – 60%.
Purpose – UHE Jirau, com 3.750 MW – in operation.
7 – Norte Brasil Transmissora de Energia
Partners – 1 – Eletrosul – 24,5%; 2 – Eletronorte 24,5%; 3 –Abengoa Concessões Brasil Holding S.A. – 51%
Purpose – LT Porto Velho/Araraquara, portion 2, 600KV – in pre operational phase.
8 – Estação Transmissora de Energia
Partners – Eletronorte 100%
Purpose – rectifying station – continuous current/alternate current – inversing station – 600/500 KV - 2950 MW – in operation.
9 – Amazônia Eletronorte Transmissora de Energia
Partners – 1 – Eletronorte 49%; 2 – Bimetal 26,99%; 3 – Alubar 10,76%; 4 – Linear 13,25%
Purpose - 2 transmission lines in 230 KV, Coxipó/Cuiabá, with a length of 25 km and Cuiabá / Rondonópolis, with a length of 168 km – in operation.
10 – Intesa - Integração Transmissora de Energia
Partners – 1 – Chesf 12%; 2 – Eletronorte 37%; 3 – FIP 51%
Purpose - LT 500kV, Colinas/Serra da Mesa 2, third circuit – in operation.
11 – Energética Águas da Pedra
Partners – 1 – Chesf 24,5%; 2 – Eletronorte 24,5%; 3 – Neoenergia S.A. 51%
Purpose – UHE Rio Aripuanã 261KW – in operation.
12 – Amapari Energia
Partners – 1 – Eletronorte 49%; 2 – MPX Energia 51%
Purpose – UTE Serra do Navio 23,33MW
13 – Brasnorte Transmissora de Energia
Partners - 1 – Eletronorte 49,71%; 2 – Terna Participações 38,70%; 3 – Bimetal Ind. e Com. de Produtos Metalúrgicos LTDA 11,62%
Purpose – LT Juba/Jauru 230 KV, with a length of 129 Km; LT Maggi/Nova Mutum 230 KV, with a length of 273 Km; SE Juba, 230/130 KV e SE Maggi, 230/138 KV – in operation.
F-97
Table of Contents
14 – Manaus Transmissora de Energia
Partners – 1 – Eletronorte 30%; 2 – Chesf 19,50%; 3- Abengoa Concessões Brasil Holding 50,50%
Purpose - LT Oriximiná/Itacoatiara, double circuit, 500KV, with a length of 374 KM, LT Itacoatiara/Cariri, double circuit 500KV, with a length of 212 Km, Subestação Itacoatiara em 500/230 KV, 1.800MVA – in operation.
15 – Transleste
Partners – 1 - Furnas 24%; 2 – Alusa 41%; 3 – Cemig 25%; 4 – EATE 10%
Purpose LT Montes Claros/Irapé, 345 kV – in operation.
16 – Transudeste
Partners – 1 – Furnas 25%; 2 – Alusa 41%; 3 – Cemig 24%; 4 – EATE 10%
Purpose - LT Itutinga/ Juiz de Fora, 345 kV – in operation.
17 – Transirapé
Partners – 1 – Furnas 24,50%; 2 – Alusa 41%; 3 – Cemig 24,50%; 4 – EATE 10%
Purpose - LT Irapé / Araçuaí, 230 kV – in operation.
18 – Chapecoense
Partners – 1 – Furnas 40%; 2 - CPFL 51%; 3 - CEEE-GT 9%
Purpose – UHE Foz do Chapecó, Rio Uruguai, 855MW – in operation.
19 – Serra do Facão Energia
Partners - 1 – Furnas 49,47%; 2 - Alcoa Alumínio S.A. 34,97%, 3 - DME Energética S.A 10,09% e 4 - Camargo Corrêa Energia S.A. 5,46%.
Purpose - UHE Serra do Facão, 212,58 MW – in operation.
20 – Retiro Baixo
Partners – 1 - Furnas 49%; 2 – Orteng 25,5%; 3 - Arcadis Logos 25,5%
Purpose - UHE Retiro Baixo, 82 MW – in operation.
21 – Baguari Energia
Partners – 1 – Furnas 30,61%; 2- Cemig 69,39%
Purpose - UHE Baguari, 140 MW – in operation.
22 – Centroeste de Minas
Partners – 1 – Furnas 49%; 2 – Cemig 51%
Purpose - LT Furnas/Pimenta (MG), 345 kV – in operation.
23 – Santo Antonio Energia
Partners – 1 - Furnas 39%; 2 - Odebrecht Investimentos 17,6%; 3 - Andrade Gutierrez Participações 12,4%; 4 – Cemig 10%; 5 - Fundos de Investimentos e Participações da Amazônia 20%; 6 - Construtora Norberto Odebrecht (1%).
Purpose - UHE Santo Antônio – in operation.
F-98
Table of Contents
24 – IE Madeira
Partners – 1 – Furnas 24,50%; 2 – Chesf 24,50%; 3 – CTEEP 31%
Purpose - LT Coletora Porto Velho/Araraquara, first portion, with a length of 2.950 Km – in operation.
25 – Inambari
Partners – 1 – Furnas 19,60%; 2 – Eletrobras 29,40%; 3 – OAS 51%
Purpose – Construction of UHE Inambari (Peru), and of the system of Transmission of exclusive use, connecting Peru and Brasil, as well as importation, exportation of goods – in pre operational stage.
26 – Transenergia
Partners – 1 – Furnas 49%; 2 –J. Malucelli 51%
Purpose - construction, deployment, operation and maintenance of transmission line of electricity the basic network of National Interconnected System Lot C.
27 – Norte Energia S.A.
Partners – 1 – Eletrobras 15,00%; 2 – Chesf 15%; 3 - Eletronorte 19,98%; 4 - Petros 10%; 5 - Outros 40,02%
Purpose – UHE Belo Monte, in Xingu river – in pre operational stage.
28 – Eólicas Junco I, Junco II, Caiçara I e Caiçara II
Partners - 1 - Chesf: 49%; 2 - Empresa francesa Votalia: 51%.
Purpose - purchase of energy from new wind generation projects. The plants Junco I and II of 30 MW each, will be built in the city of Jijoca de Jericoacoara, and power plants Caiçara I and II of 30 MW and 21 MW, respectively, will be built in the municipality of Cruz in the State of Ceará and will total 111 MW of installed power - pre-operational stage.
29 – Extremoz Transmissora do Nordeste – ETN S.A
Partners: 1 - Chesf 49%; 2 - CTEEP: Companhia de Transmissão de Energia Elétrica Paulista: 51%.
Purpose: construction, installation, operation and maintenance of transmission facilities of electricity of the Rede Básica do Sistema Interligado Nacional, specifically the LT Ceará Mirim – João Câmara II, CS, 500 kV, with a length of 64 km; LT Ceará Mirim – Campina Grande III, CS, 500 kV, with a length of 201 km; LT Ceará Mirim – Extremoz II, CS, 230 kV, with a length of 26 km; LT Campina Grande III – Campina Grande II, CS, 230 kV, with a length of 8,5 km; LT Secc. J. Camara II/Extremoz/SE Ceará Mirim, CS, 230 kV, with a length of 6 km; LT Secc. C. Grande II/Extremoz II, C1 and C2, CS, 230 kV, with a length of 12,5 km; SE João Câmara II, 500 kV; SE Campina Grande III, 500/230 kV; SE Ceará Mirim, 500/230 kV – pre-operational stage.
30 –TDG – Transmissora Delmiro Gouveia S.A
Partners -1 - Chesf: 49%; 2 - ATP Engenharia Ltda.: 51%.
Purpose - construction, implementation, operation and maintenance of transmission facilities of the electricity transmission line São Luiz II, 230 Kv, with a length of 156 Km – Maranhão, the substations Pecém III in 500/230 Kv (3.600 MVA), and Aquiraz II, in 230/69 kV (450 MVA)- Ceará - pre-operational stage.
31 – Pedra Branca, São Pedro do Lago e Sete Gameleiras
Partners - 1 - Chesf: 49%; 2 - Brennand Energia 51%.
Purpose - hiring, in the regulated environment, alternative sources of energy generation, in the form of energy availability, capacity to generate 30.0 MW each, in pre-operational stage.
F-99
Table of Contents
32 – Interligação Elétrica Garanhuns S.A
Partners - 1 - Chesf: 49%; 2 - CTEEP: Companhia de Transmissão de Energia Elétrica Paulista 51%.
Purpose - construction, installation, operation and maintenance of facilities for electricity transmission, LT Luis Gonzaga – Garanhuns, 500 kV, with a length of 224 km; LT Garanhuns – Campina Grande III, 500 kV, with a length of 190 km; LT Garanhuns – Pau Ferro, 500 kV, with a length of 239 km; LT Garanhuns – Angelim I, 230 kV, with a length of 13 Km; SE Garanhuns, 500/230 kV; SE Pau Ferro, 500/230 kV, in pre-operational stage.
33 – Chuí
Partners - 1 - Eletrosul: 49%; 2 - Rio Bravo Investimentos: 51%.
Purpose - windpower, in pre-operational stage.
34 – Livramento
Partners - 1 - Eletrosul: 49%; 2 - Rio Bravo Investimentos: 41%; 3 - Fundação Elos: 10%.
Purpose - windpower, in pre-operational stage.
35 – Santa Vitória do Palmar
Partners - 1 - Eletrosul: 49%; 2 - Rio Bravo Investimentos: 51%.
Purpose - windpower, in pre-operational stage.
36 – TSBE
Partners - 1 - Eletrosul: 80%; 2 - Copel: 20%.
Purpose - LT 230 Kv- Nova Santa Rita- Camaquã 3- LT 230 Kv Camaquã 3- Quinta; LT 525 Kv Salto Santiago- Itá; LT 525 Kv Itá- Nova Santa Rita, in pre-operational stage.
37 – TSLE
Partners - 1 - Eletrosul: 51%; 2 - CEEE: 49%.
Purpose - LT 525 Kv Nova Santa Rita – Povo Novo; LT 525 Kv Povo Nova- Marmeleiro; LT 525 Kv Marmeleiro- Santa Vitória do Palmar. Section of LT 230 Kv Camaquã 3. In pre-operational stage.
38 – Marumbi
Partners - 1 - Eletrosul: 20%; 2 - Copel: 80%.
Purpose - LT 525 Kv Curitiba – Curitiba Leste (PR). In pre-operational stage.
39 – Costa Oeste
Partners - 1 - Eletrosul: 49%; 2 - Copel: 51%.
Purpose - LT 230 Kv Cascavel Oeste- Umuarama(PR). In pre-operational stage.
40 – Teles Pires Participações
Partners - 1 - Eletrosul: 24,70%; 2 - Neoenergia: 50,60%; 3- Furnas: 24,70%.
Purpose - hydraulic generation, UHE Teles Pires, in pre-operational stage.
41 – Linha Verde Transmissora de Energia
Parceiro - 1 - Eletronorte: 49%; 2 - Abengoa Concessões Brasil Holding S.A.: 51%.
Purpose - LT Porto Velho - Samuel - Ariquemes - Ji-Paraná - Pimenta Bueno - Vilhena (RO), Jaurú (MT), with an extension of 987 Km, 230 kV – in pre operation stage.
F-100
Table of Contents
42 – Transmissora Matogrossense
Partners - 1 - Eletronorte: 49%; 2 - Alupar Investimentos S.A. - 46%; 3 - Mavi Engenharia e Construções Ltda. - 5%
Purpose - LT Jaurú - Cuiabá (MT), with extension of 348 Km and SE Jaurú, with 500 kV in operation.
43 – Construtora Integração
Partners - 1 - Eletronorte: 24,50%; 2 - Eletrosul: 24,50%; 3 - Abengoa Concessões Brasil Holding S.A.: 51%
Purpose - Company formed for the construction of the project Norte Brasil Transmissora de Energia S.A. - in operation.
44 – Transorte
Partners - 1 - Eletronorte: 49%; 2 - Alupar Investimento S.A.: 51%.
Purpose - LT Lechuga (AM) - Equador - Boa Vista (RR), with 500 kV in pre operational stage.
45 – Brasventos Eolo Geradora Energia
Partners - 1 - Eletronorte: 24,50%; 2 - Furnas: 24,50%; 3 - J. Malucelli: 51%.
Purpose - Parque Eólico Rei dos Ventos 1 with 48,6 MW of installed capacity, located in the municipality of Galinhos, Rio Grande do Norte - in pre operational stage.
46 – Brasventos Miassaba 3 Geradora
Partners - 1 - Eletronorte: 24,50%; 2 - Furnas: 24,50%; 3 - J. Malucelli: 51%.
Purpose - Parque Eólico Miassaba 3, with 50 MW of capacity installed, located at the municipality of Macau, in Rio Grande do Norte - in pre operational stage.
47 – Rei dos Ventos 3 Geradora
Partners - 1 - Eletronorte: 24,50%; 2 - Furnas: 24,50%; 3 - J. Malucelli: 51%.
Purpose - Parque Eólico Rei dos Ventos 3, with 48,6 MW of capacity installed, located at the municipality of Galinhos, in Rio Grande do Norte - in pre operational stage.
48 – Luziana – Niquelândia Transmissora
Partners - 1 - Furnas: 49%; 2 - State Grid Corporation of China: 51%.
Purpose - Transmission facilities composed by Niquelândia substation with transformation 230/69 kV - (3+1) x 10 MVA, and by Subestação Luziânia, with transformation 500/138 kV - (3+1) x 75 MVA in pre operational stage.
49 – Energia dos Ventos I a X
Partners - 1 - Furnas: 49%; 2 - Alupar 50,99%; 3 - Companies holding the rights of the studies: 0,01%.
Purpose - Concession for construction and exploitation of 10 Windpower Generating Power Plants and its transmission facilities. Windpower Generating Power Plants, totaling 230 MW installed, in the municipalities of Fortim and Aracatí - Ceará.
50 – Caldas Novas
Partners - 1 - Furnas: 49,90%; 2 - Desenvix: 25,5%; 3 - Santa Rita: 12,525%; CEL Engenharia: 12,525%.
Purpose - Transmission Facilities of the basic network, composed by Substation Corumbá, in 345/138 kV – 150 MVA- Caldas Novas – GO.
F-101
Table of Contents
51– Goiás Transmissão
Partners - 1 - Furnas: 49%; 2 - Desenvix: 25,5%; 3 - J. Malucelli Energia: 25,5%.
Purpose - construction, installation, operation and maintenance of the transmission lines Rio Verde Norte – Trindade; Trindade - Xavantes; Trindade - Região Centro Oeste.
52 – Madeira Energia S.A
Partners - 1 - Furnas: 39%; 2 - Odebrecht Energia: 18,6%; 3 - Andrade Gutierrez Participações S.A.: 12,4%; 4- CEMIG: 10%; 5- FIP: 20%.
Purpose - construction and operation of the UHE Santo Antônio- Porto Velho- RO.
53 – MGE Transmissão
Partners - 1 - Furnas: 49%; 2 - Desenvix: 25,5%; 3 - J. Malucelli Energia: 25,5%.
Purpose - construction, installation, operation and maintenance of the LTs Mesquita – Viana 2- Viana 2- Viana e da SE Viana 2.
54 – Triangulo Mineiro
Partners: 1 - Furnas: 49 %, 2 - FIP Caixa Milan: 51 %.
Purpose: Building, installation, operation and maintenance of LT Hornet II - Assis.
55 – Paranaíba
Partners: 1 - Furnas: 24.50%; 2 - Copel: 24.50%; 3 - State Grid: 51 %.
Purpose: Building, installation, operation and maintenance of transmission lines Barriers II - Rio das Mares - Luziania - Pirapora.
56 – Central Famous Windmill I
Partners: 1 - Furnas: 49 %, 2 - PF Participações Ltda: 51 %.
Object: Famous I, with 22.5 MW installed capacity wind farm, located in the municipality of Tibau, Rio Grande do Norte.
57 – Central Wind Pau Brazil
Partners: 1 - Furnas: 49 %, 2 - PF Participações Ltda: 51 %.
Purpose: Park Pau Brazil, with 15 MW of installed capacity located in the municipality of Icapui, Ceará.
58 – Central Wind Rosada
Partners: 1 - Furnas: 49 %, 2 - PF Participações Ltda: 51 %.
Purpose: Rosada Park, with 30 MW of installed capacity located in the municipality of Tibau, Rio Grande do Norte.
59 – Windmill Central Sao Paulo
Partners: 1 - Furnas: 49 %, 2 - PF Participações Ltda: 51 %.
Purpose: Rosada Park, with 17.5 MW of installed capacity located in the municipality of Icapui, Ceará.
60 – Valley of Saint Bartholomew
Partners: 1 - Furnas: 39%, 2 - Milan FIP Box: 51 %, 3 - CELG DT: 10 %.
Purpose: Building, installation, operation and maintenance of transmission lines Luziania - Brasilia East; Fern - South Brasilia - Brasilia General.
F-102
Table of Contents
61 – I Punaú
Partners: 1 - Furnas: 49 %, 2 - FIP Caixa Milan: 51 %.
Purpose: 7 wind farms in the state of Rio Grande do Norte, totaling 132 MW.
62 – I Carnauba
Partners: 1 - Furnas: 49 %, 2 - FIP Caixa Milan: 51 %.
63 – Carnauba II
Partners: 1 - Furnas: 49 %, 2 - FIP Caixa Milan: 51 %.
64 – Carnauba III
Partners: 1 - Furnas: 49 %, 2 - FIP Caixa Milan: 51 %.
65 – Carnauba V
Partners: 1 - Furnas: 49 %, 2 - FIP Caixa Milan: 51 %.
66 – I Cervantes
Partners: 1 - Furnas: 49 %, 2 - FIP Caixa Milan: 51 %.
67 – Cervantes II
Partners: 1 - Furnas: 49 %, 2 - FIP Caixa Milan: 51 %.
68 – Bom Jesus
Partners: 1 - Furnas: 49 %, 2 - FIP Caixa Milan: 51 %.
69 – Waterfall
Partners: 1 - Furnas: 49 %, 2 - FIP Caixa Milan: 51 %.
70 – Pitimbu
Partners: 1 - Furnas: 49 %, 2 - FIP Caixa Milan: 51 %.
71 – Sao Caetano I
Partners: 1 - Furnas: 49 %, 2 - FIP Caixa Milan: 51 %.
72 – Sao Caetano
Partners: 1 - Furnas: 49 %, 2 - FIP Caixa Milan: 51 %.
73 – Saint Galvão
Partners: 1 - Furnas: 49 %, 2 - FIP Caixa Milan: 51 %.
74 – Sinop Energy Company SA
Partners: 1 - Eletronorte: 24.50%; 2 - Other: 75.50 %.
Purpose: Construction, operation, maintenance and commercial operation of HPP SINOP - start of operations planned for 2018.
75 – Rouar S.A.
Purpose: 1 - Eletrobras: 50 %, 2 - UTE: 50 %
Object: 1 Wind Farm in Cologne - Uruguay
F-103
Table of Contents
15.6 – Restricted Investments
Considering that the Company is a defendant in several lawsuits (see Note 31), the Company have made a provision in respect of the lawsuits of 19.02% of assets (9,02% in December 2012) of its total investment portfolio, as stated below:
12/31/2013 | ||||||||||||
CORPORATE PARTICIPATION | VALUE OF INVESTMENT | PERCENTUAL LOCKED | RESTRICTED INVESTMENT | |||||||||
CTEEP | 913,440 | 99.60 | % | 909,786 | ||||||||
EMAE | 148,553 | 100.00 | % | 148,553 | ||||||||
CESP | 148,568 | 99.44 | % | 147,736 | ||||||||
CEB | 6,703 | 100.00 | % | 6,703 | ||||||||
AES TIETE | 577,435 | 100.00 | % | 577,435 | ||||||||
COELCE | 210,589 | 99.98 | % | 210,547 | ||||||||
CGEEP | 27,371 | 100.00 | % | 27,371 | ||||||||
CEMAT | 334,294 | 100.00 | % | 334,294 | ||||||||
CELPA | 17,435 | 100.00 | % | 17,435 | ||||||||
CELPE | 21,149 | 100.00 | % | 21,149 | ||||||||
CEEE - GT | 544,711 | 28.61 | % | 155,842 | ||||||||
CEEE - D | 146,649 | 100.00 | % | 146,649 | ||||||||
CELESC | 82,901 | 99.97 | % | 82,876 | ||||||||
ENERGISA | 84,906 | 90.61 | % | 76,933 | ||||||||
CEMAR | 463,394 | 97.06 | % | 449,770 | ||||||||
|
|
|
| |||||||||
SUBTOTAL | 3,728,098 | 3,313,079 | ||||||||||
|
|
|
| |||||||||
OTHER INVESTMENTs | 13,686,896 | — | ||||||||||
|
|
|
| |||||||||
TOTAL | 17,414,994 | 19.02 | % | 3,313,079 | ||||||||
|
|
|
| |||||||||
F-104
Table of Contents
NOTE 16 – FIXED ASSETS
Fixed assets mainly refer to the infrastructure for electricity generation concessions not renewed pursuant to Law 12,783/13.
The assets that comprise the fixed assets of the Company, and identified as assets relating to a public service concession, cannot be sold nor given as guarantee to third parties.
Special obligations (obligations linked to concessions) match funds received from consumers in order to contribute to expansion projects needed to meet electricity demand; the special obligations are allocated to the related projects. The assets acquired with these funds are recorded in the Company’s assets as provisions established by ANEEL. Due to their nature these contributions do not represent actual financial obligations, since they are not returned to consumers.
| 12/31/2013 | ||||||||||||||||||||
| Gross Amount | Accumulated Depreciation | Liabilities linked to the concession | Impairment | Net Amount | ||||||||||||||||
In service | ||||||||||||||||||||
Generation | 42,951,596 | (18,396,555 | ) | (488,501 | ) | (2,699,425 | ) | 21,367,115 | ||||||||||||
Administration | 2,112,331 | (1,179,851 | ) | — | — | 932,480 | ||||||||||||||
|
|
|
|
|
|
|
|
|
| |||||||||||
| 45,063,926 | (19,576,405 | ) | (488,501 | ) | (2,699,425 | ) | 22,299,595 | |||||||||||||
|
|
|
|
|
|
|
|
|
| |||||||||||
In progress | ||||||||||||||||||||
Generation | 7,059,539 | — | — | — | 7,059,539 | |||||||||||||||
Administration | 679,380 | — | — | — | 679,380 | |||||||||||||||
|
|
|
|
|
|
|
|
|
| |||||||||||
| 7,738,919 | — | — | — | 7,738,919 | ||||||||||||||||
|
|
|
|
|
|
|
|
|
| |||||||||||
| 52,802,846 | (19,576,405 | ) | (488,501 | ) | (2,699,425 | ) | 30,038,514 | |||||||||||||
|
|
|
|
|
|
|
|
|
| |||||||||||
Changes in Fixed Assets
| Balance on 12/31/2012 | Additions | Transfer in progress/service | Disposals | Impairment | Depreciation | Balance on 12/31/2013 | ||||||||||||||||||||||
Generation / Marketing | ||||||||||||||||||||||||||||
in service | 37,524,420 | 224,330 | 4,121,201 | (37,127 | ) | — | — | 41,832,824 | ||||||||||||||||||||
accumulated depreciation | (17,156,637 | ) | — | — | — | — | (1,239,918 | ) | (18,396,555 | ) | ||||||||||||||||||
in progress | 8,808,361 | 2,490,820 | (4,158,791 | ) | (80,851 | ) | — | — | 7,059,539 | |||||||||||||||||||
leasing | 1,118,772 | — | — | — | — | — | 1,118,772 | |||||||||||||||||||||
Provision / value recovery assets (impairment) | (1,803,142 | ) | — | — | — | (896,283 | ) | — | (2,699,425 | ) | ||||||||||||||||||
|
|
|
|
|
|
|
|
|
|
|
|
|
| |||||||||||||||
| 28,491,774 | 2,715,150 | (37,590 | ) | (117,978 | ) | (896,283 | ) | (1,239,918 | ) | 28,915,155 | ||||||||||||||||||
|
|
|
|
|
|
|
|
|
|
|
|
|
| |||||||||||||||
Administration | ||||||||||||||||||||||||||||
in service | 2,139,463 | 18,580 | 76,702 | (122,415 | ) | — | — | 2,112,331 | ||||||||||||||||||||
accumulated depreciation | (1,130,055 | ) | — | — | — | — | (49,796 | ) | (1,179,851 | ) | ||||||||||||||||||
in progress | 486,352 | 302,497 | (102,026 | ) | (7,443 | ) | — | — | 679,380 | |||||||||||||||||||
|
|
|
|
|
|
|
|
|
|
|
|
|
| |||||||||||||||
| 1,495,761 | 321,077 | (25,324 | ) | (129,858 | ) | — | (49,796 | ) | 1,611,860 | |||||||||||||||||||
|
|
|
|
|
|
|
|
|
|
|
|
|
| |||||||||||||||
(–) Special Obligations linked to the granting | ||||||||||||||||||||||||||||
Acumulated Reintegration | 19,697 | — | — | — | — | — | 19,697 | |||||||||||||||||||||
Federal Government Participation | (177,802 | ) | — | — | 2,835 | — | — | (174,967 | ) | |||||||||||||||||||
Federal Government, States and Municipality Particip | (19,389 | ) | — | — | — | — | — | (19,389 | ) | |||||||||||||||||||
Amortization Reserves | (81,998 | ) | — | — | — | — | — | (81,998 | ) | |||||||||||||||||||
Others | (233,210 | ) | (2,997 | ) | — | — | — | 4,363 | (231,844 | ) | ||||||||||||||||||
|
|
|
|
|
|
|
|
|
|
|
|
|
| |||||||||||||||
| (492,702 | ) | (2,997 | ) | — | 2,835 | — | 4,363 | (488,501 | ) | |||||||||||||||||||
|
|
|
|
|
|
|
|
|
|
|
|
|
| |||||||||||||||
|
|
|
|
|
|
|
|
|
|
|
|
|
| |||||||||||||||
TOTAL | 29,494,833 | 3,033,230 | (62,914 | ) | (245,001 | ) | (896,283 | ) | (1,285,351 | ) | 30,038,514 | |||||||||||||||||
|
|
|
|
|
|
|
|
|
|
|
|
|
| |||||||||||||||
F-105
Table of Contents
| Saldo em 01/01/2012 | Adições | Transferência curso/serviço | Baixas | Impairment | Depreciação | Efeitos da Lei nº 12.783/13 | Saldo em 31/12/2012 | |||||||||||||||||||||||||
Geração / Comercialização | ||||||||||||||||||||||||||||||||
Em serviço | 55,890,685 | 1,392,992 | 1,672,909 | (605,671 | ) | — | (368,592 | ) | (20,457,903 | ) | 37,524,420 | |||||||||||||||||||||
Depreciação acumulada | (24,518,240 | ) | (347,564 | ) | (278,884 | ) | 70,022 | — | (1,026,227 | ) | 8,944,256 | (17,156,637 | ) | |||||||||||||||||||
Em curso | 8,727,409 | 2,699,966 | (1,374,750 | ) | (86,122 | ) | — | — | (439,649 | ) | 9,526,854 | |||||||||||||||||||||
Arrendamento Mercantil | 1,165,388 | — | — | — | — | (46,616 | ) | — | 1,118,772 | |||||||||||||||||||||||
Provisão p/ ajustes valor recuperação ativos - impairment | (836,208 | ) | — | — | — | (566,799 | ) | — | (400,135 | ) | (1,803,142 | ) | ||||||||||||||||||||
|
|
|
|
|
|
|
|
|
|
|
|
|
|
|
| |||||||||||||||||
| 40,429,034 | 3,745,394 | 19,275 | (621,771 | ) | (566,799 | ) | (1,441,435 | ) | (12,353,431 | ) | 29,210,267 | |||||||||||||||||||||
|
|
|
|
|
|
|
|
|
|
|
|
|
|
|
| |||||||||||||||||
Administração | ||||||||||||||||||||||||||||||||
Em serviço | 2,349,747 | 35,959 | (138,157 | ) | (108,085 | ) | — | — | — | 2,139,463 | ||||||||||||||||||||||
Depreciação acumulada | (1,326,834 | ) | (20,255 | ) | 273,556 | 38,505 | — | (95,026 | ) | — | (1,130,055 | ) | ||||||||||||||||||||
Em curso | 486,352 | — | — | — | — | — | (718,493 | ) | (232,141 | ) | ||||||||||||||||||||||
|
|
|
|
|
|
|
|
|
|
|
|
|
|
|
| |||||||||||||||||
| 1,509,264 | 15,704 | 135,399 | (69,580 | ) | — | (95,026 | ) | (718,493 | ) | 777,268 | ||||||||||||||||||||||
|
|
|
|
|
|
|
|
|
|
|
|
|
|
|
| |||||||||||||||||
(–) Obrigações Especiais Vinculadas à concessão | ||||||||||||||||||||||||||||||||
Reintegração Acumulada | 16,872 | — | — | — | — | 2,825 | — | 19,697 | ||||||||||||||||||||||||
Participação da União Federal | (177,829 | ) | — | — | — | — | 27 | — | (177,802 | ) | ||||||||||||||||||||||
Participação da União, estados e Municípios | (19,389 | ) | — | — | — | — | — | — | (19,389 | ) | ||||||||||||||||||||||
Reservas para Amortização | (81,998 | ) | — | — | — | — | — | — | (81,998 | ) | ||||||||||||||||||||||
Outros | (123,594 | ) | (23,930 | ) | — | 22,441 | — | 4,917 | (113,044 | ) | (233,210 | ) | ||||||||||||||||||||
|
|
|
|
|
|
|
|
|
|
|
|
|
|
|
| |||||||||||||||||
| (385,938 | ) | (23,930 | ) | — | 22,441 | — | 7,769 | (113,044 | ) | (492,702 | ) | |||||||||||||||||||||
|
|
|
|
|
|
|
|
|
|
|
|
|
|
|
| |||||||||||||||||
|
|
|
|
|
|
|
|
|
|
|
|
|
|
|
| |||||||||||||||||
TOTAL | 41,552,360 | 3,737,168 | 154,674 | (668,910 | ) | (566,799 | ) | (1,528,692 | ) | (13,184,968 | ) | 29,494,833 | ||||||||||||||||||||
|
|
|
|
|
|
|
|
|
|
|
|
|
|
|
| |||||||||||||||||
F-106
Table of Contents
Average depreciation and accumulated depreciation rate:
| 12/31/2013 | 12/31/2012 | |||||||||||||||
| Average rate of depreciation | Accumulated depreciation | Average rate of depreciation | Accumulated depreciation | |||||||||||||
Generation | ||||||||||||||||
Hydraulics | 2.46 | % | 12,445,776 | 2.51 | % | 11,923,482 | ||||||||||
Nuclear | 0.08 | % | 3,356,493 | 0.08 | % | 3,080,265 | ||||||||||
Thermal | 2.43 | % | 2,493,879 | 3.08 | % | 2,076,971 | ||||||||||
Wind | 4.00 | % | 42,989 | 4.00 | % | 21,749 | ||||||||||
Commercialization | 3.15 | % | 57,417 | 2.29 | % | 54,170 | ||||||||||
|
|
|
| |||||||||||||
| 18,396,554 | 17,156,637 | |||||||||||||||
Administration | 7.28 | % | 1,179,851 | 6.76 | % | 1,130,055 | ||||||||||
|
|
|
| |||||||||||||
| 1,179,851 | 1,130,055 | |||||||||||||||
|
|
|
| |||||||||||||
Total | 19,576,405 | 18,286,691 | ||||||||||||||
|
|
|
| |||||||||||||
NOTE 17 – FINANCIAL ASSETS
| 12/31/2013 | 12/31/2012 | |||||||
Transmission Concessions | ||||||||
Financial Assets Annual Revenue | 8,245,051 | 7,154,941 | ||||||
Financial Assets - Concessions Indemnified | 6,476,898 | 7,184,041 | ||||||
|
|
|
| |||||
| 14,721,949 | 14,338,982 | |||||||
Grants Distribution | ||||||||
Financial Assets - Concessions Indemnified | 5,247,686 | 4,595,947 | ||||||
|
|
|
| |||||
| 5,247,686 | 4,595,947 | |||||||
Generation Concessions | ||||||||
Financial Assets - Concessions Indemnified | 1,483,539 | 1,483,540 | ||||||
|
|
|
| |||||
| 1,483,539 | 1,483,540 | |||||||
|
|
|
| |||||
| 21,453,174 | 20,418,469 | |||||||
|
|
|
| |||||
Itaipu Financial Assets (Item I) | 3,418,865 | 2,028,405 | ||||||
|
|
|
| |||||
| 3,418,865 | 2,028,405 | |||||||
|
|
|
| |||||
|
|
|
| |||||
Total financial assets | 24,872,039 | 22,446,874 | ||||||
|
|
|
| |||||
Financial assets - current | 1,168,002 | 318,293 | ||||||
Financial Liabilities - current | — | (787,115 | ) | |||||
Financial Assets - non-current | 23,704,037 | 22,915,696 | ||||||
|
|
|
| |||||
Total financial assets (liabilities) | 24,872,039 | 22,446,874 | ||||||
|
|
|
| |||||
F-107
Table of Contents
I – Financial Assets of Itaipu
| 12/31/2013 | 12/31/2012 | |||||||
Accounts Receivable | 2,369,637 | 1,459,221 | ||||||
Right to Reimbursement | 984,210 | 849,724 | ||||||
Energy Suppliers - Itaipu | (1,457,677 | ) | (1,468,505 | ) | ||||
Reimbursement obligations | (1,136,737 | ) | (1,627,555 | ) | ||||
Outros | ||||||||
|
|
|
| |||||
Total current assets (liabilities) | 759,433 | (787,115 | ) | |||||
|
|
|
| |||||
Accounts Receivable | 790,448 | 894,847 | ||||||
Right to Reimbursement | 4,977,321 | 4,919,758 | ||||||
Reimbursement obligations | (3,108,337 | ) | (2,999,085 | ) | ||||
|
|
|
| |||||
Total non-current assets (liabilities) | 2,659,432 | 2,815,520 | ||||||
|
|
|
| |||||
Itaipu’s financial assets are listed above and points to note are detailed below:
a – Amounts arising from Electricity Trading of Itaipu Binacional
a.1 – Adjustment Factor
According to the Law No. 11,480/2007, the adjustment factor of loan agreements signed with Itaipu Binacional, and credit assignment agreements signed with the National Treasury, was removed with effect from 2007, assuring the Company full preservation of its flow of receivables.
Consequently, the Decree No. 6,265 of November 22, 2007 was issued, regulating the trade of electricity from Itaipu Binacional, defining the difference to be applied in the transfer tariff, creating an asset related to the partial annual difference calculated, equivalent to the annual adjustment factor removed from financing, to be annually included in the transfer tariff, as of 2008, practiced by Eletrobras, preserving the flow of resources originally established.
Therefore, as of 2008, the difference arising from the removal of the annual readjustment factor, whose values are annually defined by a joint ministerial ordinance from the Ministries of Treasury and Mines and Energy, started to be included in the tariff for the transfer of power from Itaipu Binacional. This transfer tariff in force in 2011 includes the amount equivalent to US$214,989, which will be received by the Company through charges to distributors, granted by Ordinance MME/MF 398/2008.
The balance deriving from the adjustment factor by Itaipu Binacional, represented by the item Reimbursement Rights, stated in Non-Current Assets, amounts to R$ 4,977,321 on December 31, 2013, equivalent to US$ 2,125,244 (December 31, 2012 - R$ 4,919,758 equivalent to US$ 2,407,516), of which R$ 3,108,337, equivalent to US$ 1,318,209 will be transferred to the National Treasury until 2023 represented by reimbursement obligations, as a result of credit assigned between the Company and the National Treasury, in 1999.
F-108
Table of Contents
These amounts will be realized through their inclusion in the transfer tariff to be charged until 2023.
a.2 – Electricity trading
The Law No. 10.438 of April 26, 2002, attributed to ELETROBRAS the responsibility for the acquisition of all electricity generated by ITAIPU to be consumed in Brazil, and for trading this electricity.
Therefore, in 2013, the equivalent of 134,839 GWh was sold, the electricity supply tariff (purchase) of Itaipu Binacional was US$22.60/kW and the transfer tariff (sale) was US$26.08/kW.
The profits or losses from the trading of Itaipu’s electricity, in accordance with Decree No. 4.550 of December 27, 2002, observing the amendments introduced by Decree No. 6.265 of November 22, 2007, will be allocated as follows:
1) if positive, the profits will be allocated to consumers, by means of prorating to the individual consumer, through a bonus credit in the consumers’ electricity bills of the Brazilian Interconnected Electric System, for residential and rural consumers with monthly consumption lower than 350 kWh.
2) if negative, losses will be incorporated by ANEEL in the calculation of the transfer tariff of electricity contracted in the year subsequent to the losses.
This trading operation does not affect the Company’s results, and under the current regulation, losses represent an unconditional receivable right and an effective obligation.
In 2013, the activity had a surplus of R$ 85,649 (R$ 280,029 deficit on December 31, 2011), and the resulting obligation is included as a financial asset.
b – Periodic Tariff Review
The distributors controlled by Eletrobras undertook the Third-Tariff Review Cycle 3RTP (3rd Cycle) process in 2013.
The tariff review process aims to review and replace tariffs to ensure a return on prudent investments. To calculate the rate adjustment, ANEEL analyses: the efficient operating costs based on operating costs in the last cycle, prudent investments which comprise the Regulatory Asset Base, the level of regulatory losses to be passed on to consumers and uncontrollable costs.
F-109
Table of Contents
As a result of this review the total value of the Regulatory Asset Base - RAB for purposes of the 3rd Tariff Review Cycle for the distributors of the Company according to ANEEL were as follows:
| Amazonas | Ceron | Cepisa | Eletroacre | Ceal | Boa Vista | |||||||||||||||||||
Base net salary | 1,461,655 | 374,753 | 317,736 | 218,033 | 443,837 | 142,272 | ||||||||||||||||||
Depreciation rate (per year) | 3.31 | % | 3.75 | % | 3.99 | % | 3.75 | % | 3.97 | % | 3.98 | % | ||||||||||||
The Company recognized an impairment of R$ (1,089,746) as a result of the analysis and reconciliation of the amounts determined by ANEEL with book values. (See Notes 19 and 43).
II – Financial Assets – Grant of public electricity service
A financial asset entry - grant in the amount of R$ 21,453,174 (December 31, 2012 - R$ 20,418,469) - refers to the financial asset held by Eletrobras System companies, and in distribution concessions, calculated by applying the mixed model, and grants of generation and transmission calculated by applying the financial model, both provided for in IFRIC 12.
NOTE 18 – INTANGIBLE ASSETS
| Balance on 12/31/2012 | Additions | Disposals | Impairment | Amortization | Transfer in progress/service | Balance on 12/31/2013 | ||||||||||||||||||||||
Linked to Concession - Generation | 669,007 | 29,256 | (749 | ) | — | (147,061 | ) | (377,676 | ) | 172,777 | ||||||||||||||||||
|
|
|
|
|
|
|
|
|
|
|
|
|
| |||||||||||||||
In Service | 567,706 | 11,457 | (749 | ) | — | (147,061 | ) | (361,967 | ) | 69,386 | ||||||||||||||||||
|
|
|
|
|
|
|
|
|
|
|
|
|
| |||||||||||||||
Intangible Assets | 841,268 | 11,457 | (749 | ) | — | — | (361,771 | ) | 490,205 | |||||||||||||||||||
Accumulated amortization | (217,156 | ) | — | — | — | (147,061 | ) | — | (364,217 | ) | ||||||||||||||||||
Special obligations | (56,406 | ) | — | — | — | — | (196 | ) | (56,602 | ) | ||||||||||||||||||
|
|
|
|
|
|
|
|
|
|
|
|
|
| |||||||||||||||
In Progress | 101,301 | 17,799 | — | — | — | (15,709 | ) | 103,391 | ||||||||||||||||||||
|
|
|
|
|
|
|
|
|
|
|
|
|
| |||||||||||||||
Intangible Assets | 116,053 | 17,904 | — | — | — | (15,871 | ) | 118,086 | ||||||||||||||||||||
Special obligations | (14,752 | ) | (105 | ) | — | — | — | 162 | (14,695 | ) | ||||||||||||||||||
|
|
|
|
|
|
|
|
|
|
|
|
|
| |||||||||||||||
Linked to concession - Distribution | 190,555 | 42,576 | (61,051 | ) | 256,210 | (33,138 | ) | (175,075 | ) | 220,077 | ||||||||||||||||||
|
|
|
|
|
|
|
|
|
|
|
|
|
| |||||||||||||||
In Service | 134,022 | (92 | ) | (61,051 | ) | 174,694 | (34,131 | ) | (122,558 | ) | 90,884 | |||||||||||||||||
|
|
|
|
|
|
|
|
|
|
|
|
|
| |||||||||||||||
Intangible Assets | 1,761,894 | 61 | (162,901 | ) | — | — | (131,329 | ) | 1,467,725 | |||||||||||||||||||
Accumulated Amortization | (1,033,561 | ) | — | — | — | (34,131 | ) | — | (1,067,692 | ) | ||||||||||||||||||
| (387,669 | ) | (153 | ) | 101,850 | — | — | 5,567 | (280,405 | ) | |||||||||||||||||||
Impairment | (206,642 | ) | — | — | 174,694 | — | 3,204 | (28,744 | ) | |||||||||||||||||||
|
|
|
|
|
|
|
|
|
|
|
|
|
| |||||||||||||||
In Progress | 56,533 | 42,668 | — | 81,516 | 993 | (52,517 | ) | 129,193 | ||||||||||||||||||||
|
|
|
|
|
|
|
|
|
|
|
|
|
| |||||||||||||||
Intangible Assets | 165,912 | 44,460 | — | — | — | (56,076 | ) | 154,296 | ||||||||||||||||||||
Special Obligations | (25,453 | ) | (1,792 | ) | — | — | 993 | 3,559 | (22,693 | ) | ||||||||||||||||||
Impairment | (83,926 | ) | — | 81,516 | — | — | (2,410 | ) | ||||||||||||||||||||
|
|
|
|
|
|
|
|
|
|
|
|
|
| |||||||||||||||
Linked to Concession - Transmission | — | 8,113 | (454 | ) | — | (300 | ) | — | 7,359 | |||||||||||||||||||
|
|
|
|
|
|
|
|
|
|
|
|
|
| |||||||||||||||
In Service | — | — | (454 | ) | — | (300 | ) | 3,006 | 2,252 | |||||||||||||||||||
|
|
|
|
|
|
|
|
|
|
|
|
|
| |||||||||||||||
Intangible Assets | — | — | (454 | ) | — | — | 3,006 | 2,552 | ||||||||||||||||||||
Accumulated amortization | — | — | — | — | (300 | ) | — | (300 | ) | |||||||||||||||||||
|
|
|
|
|
|
|
|
|
|
|
|
|
| |||||||||||||||
In Progress | — | 8,113 | — | — | — | (3,006 | ) | 5,107 | ||||||||||||||||||||
|
|
|
|
|
|
|
|
|
|
|
|
|
| |||||||||||||||
Intangible Assets | — | 8,113 | — | — | — | (3,006 | ) | 5,107 | ||||||||||||||||||||
|
|
|
|
|
|
|
|
|
|
|
|
|
| |||||||||||||||
Not linked to concession - (other assets) | 345,001 | 77,264 | (316 | ) | — | (34,690 | ) | 1,108 | 388,369 | |||||||||||||||||||
|
|
|
|
|
|
|
|
|
|
|
|
|
| |||||||||||||||
Administration | ||||||||||||||||||||||||||||
In Service | 597,655 | 21,530 | (322 | ) | — | — | 19,110 | 637,973 | ||||||||||||||||||||
Accumulated Amortization | (287,628 | ) | — | — | — | (34,690 | ) | — | (322,318 | ) | ||||||||||||||||||
In Progress | 68,818 | 55,734 | — | — | — | (18,002 | ) | 106,550 | ||||||||||||||||||||
Other | (33,844 | ) | — | 6 | — | — | — | (33,836 | ) | |||||||||||||||||||
|
|
|
|
|
|
|
|
|
|
|
|
|
| |||||||||||||||
Total | 1,204,563 | 157,209 | (62,570 | ) | 256,210 | (215,189 | ) | (551,643 | ) | 788,582 | ||||||||||||||||||
|
|
|
|
|
|
|
|
|
|
|
|
|
| |||||||||||||||
The balances in the transfer column refers mainly to generation and distribution concessions and were substantially transferred to financial assets as required by IFRIC 12.
F-110
Table of Contents
| Balance on 01/01/2012 | Additions | Disposals | Impairment | Amortization | Transfer in progress/service | Balance on 12/31/2012 | ||||||||||||||||||||||
Linked to Concession - Generation | 79,774 | 7,341 | (35 | ) | — | (216,090 | ) | 798,017 | 669,007 | |||||||||||||||||||
|
|
|
|
|
|
|
|
|
|
|
|
|
| |||||||||||||||
In service | 29,744 | 4,436 | (35 | ) | — | (216,090 | ) | 749,651 | 567,706 | |||||||||||||||||||
|
|
|
|
|
|
|
|
|
|
|
|
|
| |||||||||||||||
Intangible Assets | 30,810 | 4,436 | (35 | ) | — | — | 806,057 | 841,268 | ||||||||||||||||||||
Accumulated amortization | (1,066 | ) | — | — | — | (216,090 | ) | — | (217,156 | ) | ||||||||||||||||||
Special obligations | — | — | — | — | — | (56,406 | ) | (56,406 | ) | |||||||||||||||||||
|
|
|
|
|
|
|
|
|
|
|
|
|
| |||||||||||||||
In progress | 50,030 | 2,905 | — | — | — | 48,366 | 101,301 | |||||||||||||||||||||
|
|
|
|
|
|
|
|
|
|
|
|
|
| |||||||||||||||
Intangible Assets | 50,030 | 2,905 | — | — | — | 63,118 | 116,053 | |||||||||||||||||||||
Special obligations | — | — | — | — | — | (14,752 | ) | (14,752 | ) | |||||||||||||||||||
|
|
|
|
|
|
|
|
|
|
|
|
|
| |||||||||||||||
Linked to Concession - Distribution | 800,135 | 166,446 | (104,699 | ) | 522 | 96,495 | (768,344 | ) | 190,555 | |||||||||||||||||||
|
|
|
|
|
|
|
|
|
|
|
|
|
| |||||||||||||||
In service | 725,997 | 94,314 | (102,778 | ) | 522 | 96,495 | (680,528 | ) | 134,022 | |||||||||||||||||||
|
|
|
|
|
|
|
|
|
|
|
|
|
| |||||||||||||||
Intangible Assets | 2,470,122 | 94,621 | (122,321 | ) | — | — | (680,528 | ) | 1,761,894 | |||||||||||||||||||
Accumulated amortization | (1,123,564 | ) | — | — | — | 90,003 | — | (1,033,561 | ) | |||||||||||||||||||
Special obligations | (413,397 | ) | (307 | ) | 19,543 | — | 6,492 | — | (387,669 | ) | ||||||||||||||||||
Impairment | (207,164 | ) | — | — | 522 | — | — | (206,642 | ) | |||||||||||||||||||
|
|
|
|
|
|
|
|
|
|
|
|
|
| |||||||||||||||
Ongoing | 74,138 | 72,132 | (1,921 | ) | — | — | (87,816 | ) | 56,533 | |||||||||||||||||||
|
|
|
|
|
|
|
|
|
|
|
|
|
| |||||||||||||||
Intangible Assets | 250,813 | 94,068 | (7,517 | ) | — | — | (171,452 | ) | 165,912 | |||||||||||||||||||
Special obligations | (112,349 | ) | (4,746 | ) | 5,596 | — | — | 86,046 | (25,453 | ) | ||||||||||||||||||
Impairment | (64,326 | ) | — | — | — | — | (19,600 | ) | (83,926 | ) | ||||||||||||||||||
Consideration of concession agreement | — | (17,190 | ) | — | — | — | 17,190 | — | ||||||||||||||||||||
|
|
|
|
|
|
|
|
|
|
|
|
|
| |||||||||||||||
Linked to Concession - Transmission | — | — | — | — | — | — | ||||||||||||||||||||||
|
|
|
|
|
|
|
|
|
|
|
|
|
| |||||||||||||||
In service | — | — | — | — | — | — | ||||||||||||||||||||||
|
|
|
|
|
|
|
|
|
|
|
|
|
| |||||||||||||||
Intangible Assets | — | — | — | — | — | — | ||||||||||||||||||||||
Accumulated amortization | — | — | — | — | — | — | ||||||||||||||||||||||
Special obligations | — | — | — | — | — | — | ||||||||||||||||||||||
Impairment | — | — | — | — | — | — | ||||||||||||||||||||||
|
|
|
|
|
|
|
|
|
|
|
|
|
| |||||||||||||||
In service | — | — | — | — | — | — | ||||||||||||||||||||||
|
|
|
|
|
|
|
|
|
|
|
|
|
| |||||||||||||||
Intangible Assets | — | — | — | — | — | — | ||||||||||||||||||||||
Special obligations | — | — | — | — | — | — | ||||||||||||||||||||||
Impairment | — | — | — | — | — | — | ||||||||||||||||||||||
|
|
|
|
|
|
|
|
|
|
|
|
|
| |||||||||||||||
Not linked to concession (Other Intangibles) | 407,971 | 64,378 | (73,129 | ) | — | (40,674 | ) | (13,546 | ) | 345,001 | ||||||||||||||||||
|
|
|
|
|
|
|
|
|
|
|
|
|
| |||||||||||||||
Administration | ||||||||||||||||||||||||||||
In service | 619,151 | 24,917 | (70,779 | ) | — | — | 24,366 | 597,655 | ||||||||||||||||||||
Accumulated amortization | (246,954 | ) | — | — | — | (40,674 | ) | — | (287,628 | ) | ||||||||||||||||||
In progress | 69,621 | 39,459 | (2,350 | ) | — | — | (37,912 | ) | 68,818 | |||||||||||||||||||
Other | (33,847 | ) | 2 | — | — | — | — | (33,844 | ) | |||||||||||||||||||
|
|
|
|
|
|
|
|
|
|
|
|
|
| |||||||||||||||
Total | 1,287,880 | 238,165 | (177,863 | ) | 522 | (160,269 | ) | 16,127 | 1,204,563 | |||||||||||||||||||
|
|
|
|
|
|
|
|
|
|
|
|
|
| |||||||||||||||
The intangible asset is appropriated during its concession term.
NOTE 19 – IMPAIRMENT OF LONG-LIVED ASSETS
The Company defined the recoverable value of its long-term assets based on the value in use, as there is no active market for the infrastructure linked to the concession. The value in use is calculated based on the present valuation of the estimated future cash flow.
The amounts of the assumptions represent the views of the Management of the Company on future trends of the electric sector and are based not only on external sources of information but also on historical data. The cash flow was projected based on the Company’s operating results and projections until the end of the concession. Depreciation of long-term assets is recognized in the income statement under the heading Operating Reserves.
a) Organic growth reflects historic data and the growth prospects of the Brazilian economy;
b) Discount rate (after taxes) specific to each segment 6.80% for generation, 6.45% for transmission and 6.61% for distribution (4.98% for generation 4.73% for transmission and 4.61% distribution in 2012) calculated by a methodology usually applied by the market, taking into account the weighted average cost of capital;
c) For the Angra 3 plant due to its special characteristics of funding the discount rate used was 5.60%;
d) The Company’s endeavours were all treated as independent cash generating units.
F-111
Table of Contents
The analysis established that a provision for losses was necessary in the following projects in the year 2013:
a) Eletrosul – The Company recognized an impairment in 2013 of R$ 247,578 (R$ 149,672, in 2012).
b) Amazonas Energia (distribution segment) - The reconciliation of values of BRR and the subsequent evaluation of recoverability of intangible assets showed impairment losses on assets in the amount of R$ 332,871 in 2013.
c) Furnas – The Company recognized impairment over UHE Batalha, UHE Simplício and UHE Santa Cruz in the amount of R$ 1,060,332 (December 31, 2012 – R$ 1,028,266), over assets recovery, being that R$ 32,067 in this year (2012 – R$ 334,931) in view of increased costs of the structure due to delay in the construction of the hydroelectric power plants of Batalha and Simplício. It is important to note the entry into operation of UHE Simplicio on May 1, 2013, so the impact in 2013 is mainly related to UHE Batalha.
d) Eletronorte – an additional provision was recognized of R$ 165,334 (R$482,334 in 2012) consisting of: R$ 102,131 (R$ 344,104 in 2012) on fixed asset generation of UHE Samuel, R$ 45,720 (R$ 27,389 in 2012) for the fixed assets of the UTE Balbina and R$ 17,483 on other fixed assets (R$ 110,841 in 2012).
e) Electronuclear - an impairment related to plant Angra 3 in the amount of R$ 532,509 was recognized largely due to the delay in the construction schedule. The discount rate for Angra 3 pursuant to the special characteristics of financing was 5.60% per year.
f) CGTEE - an impairment was recognized in the amount of R$ 74,012 in respect of fixed assets of Candiota II (Phase B) at a discount rate of 6.80 % per year.
g) CHESF - During the year, the Company performed an impairment test for its cash-generating units, using a criteria of cash flow discounted at a rate of 6.45% per year. From this test, the Company recognized a provision for loss related to the value of non-recoverable of transmission assets in the amount of R$ 638,206.
h) Eletroacre - The reconciliation of values of BRR and the subsequent evaluation of recoverability of intangible assets showed impairment losses on assets in the amount of R$ 64,899 in 2013.
i) Cepisa - The reconciliation of values of BRR and the subsequent evaluation of recoverability of intangible assets showed impairment losses on assets in the amount of R$ 233,477 in 2013.
j) Ceron - The reconciliation of values of BRR and the subsequent evaluation of recoverability of intangible assets showed impairment losses on assets in the amount of R$ 196,720 in 2013.
F-112
Table of Contents
Balance at December 31, 2011 | 1,422,712 | |||
|
| |||
(+) Additions | 1,059,462 | |||
(–) Reversal | (522 | ) | ||
|
| |||
Balance at December 31, 2012 | 2,481,652 | |||
|
| |||
(+) Additions | 3,389,721 | |||
(–) Reversal | (927,848 | ) | ||
|
| |||
Balance at December 31, 2013 | 4,943,525 | |||
|
|
Impairment losses by category are as follows:
| 12/31/2013 | ||||||||||||||||
| Generation | Transmission | Distribution | Total | |||||||||||||
Fixed assets | 896,284 | — | — | 896,284 | ||||||||||||
Intangible | — | — | (256,210 | ) | (256,210 | ) | ||||||||||
Financial assets | (201,282 | ) | 775,490 | 1,324,252 | 1,898,460 | |||||||||||
Onerous contract | — | — | 15,867 | 15,867 | ||||||||||||
Tax credit | — | — | (92,528 | ) | (92,528 | ) | ||||||||||
|
|
|
|
|
|
|
| |||||||||
Total | 695,002 | 775,490 | 991,381 | 2,461,873 | ||||||||||||
|
|
|
|
|
|
|
| |||||||||
NOTE 20 – SUPPLIERS
| 12/31/2013 | 12/31/2012 | |||||||
CURRENT | ||||||||
Goods, Materials and Services | 6,572,112 | 4,102,270 | ||||||
Energy Purchased for Resale | 960,503 | 2,164,593 | ||||||
CCEE - Short-term energy | 207,963 | 156,211 | ||||||
|
|
|
| |||||
| 7,740,578 | 6,423,074 | |||||||
NON-CURRENT | ||||||||
Goods, Materials and Services | 185,235 | — | ||||||
Energy Purchased for Resale | 606,058 | — | ||||||
|
|
|
| |||||
| 791,293 | — | |||||||
|
|
|
| |||||
| 8,531,871 | 6,423,074 | |||||||
|
|
|
| |||||
In 2013, the increase in the balance of the subsidiary suppliers Amazonas Energia (2013 - R$ 5,234,092 and R$ 3,287,747 in 2012) refers mainly to the open invoices of Petrobras and Cigás.
F-113
Table of Contents
NOTE 21 – ADVANCES FROM CLIENTS
| 12/31/2013 | 12/31/2012 | |||||||
CURRENT | ||||||||
Advanced electricity sale - ALBRAS | 48,910 | 45,583 | ||||||
Advances from clients - PROINFA | 462,672 | 424,309 | ||||||
|
|
|
| |||||
| 511,582 | 469,892 | |||||||
|
|
|
| |||||
NON CURRENT | ||||||||
Advanced electricity sale - ALBRAS | 776,252 | 830,234 | ||||||
|
|
|
| |||||
| 776,252 | 830,234 | |||||||
|
|
|
| |||||
|
|
|
| |||||
TOTAL | 1,287,834 | 1,300,126 | ||||||
|
|
|
| |||||
I – ALBRÁS
The subsidiary Eletronorte agreed the sale of electricity with ALBRÁS, in 2004, for a 20-year supply period, at an average of 750 MW/month until December 2006 and 800 MW/month between January 2007 and December 2024, setting the UHE Tucuruí break-even tariff as a parameter, plus a premium calculated according to the aluminum price on the London Metal Exchange (LME) - England. This price setting constitutes an embedded derivative (See Note 44).
Based on these conditions, ALBRÁS made an electricity pre-purchase offering with advance payment, comprising electricity credits which will be amortized during the supply period in fixed monthly installments in average MW, according to the tariff effective in the billing month, as detailed below:
II – PROINFA
PROINFA, enacted by Law No. 10.438/2002, and amendments, aims at diversifying the Brazilian electricity mix with the utilization of renewable energy sources, by means of economic use of available sources and applicable technologies.
The Company ensures the purchase of electricity generated for a period of 20 years, as of 2006, and transfers this electricity to distribution concession holders, free consumers and self-producers, excluding low-income consumers proportionally to consumption.
The transmission and distribution concession holders pay to the Company the amount of electricity in quotas, equivalent to the cost corresponding to captive customers, free consumers and self-producers connected to its facilities, in twelve monthly installments, in the month before the reference date of electricity consumption.
The operations related to PROINFA’s sale and purchase of electricity do not affect the Company’s results.
F-114
Table of Contents
NOTE 22 – LOANS AND FINANCING
I – Contracts obtained by the Company in 2013 – Financial Institutions.
On June 24, 2013, a R$ 2,500,000 credit agreement was signed with the National Bank for Economic and Social Development (BNDES), the proceeds of which will be allocated to cover the working capital for the year 2013. This contract has the Union guarantee, the Selic interest rate plus a spread of 2.5% per year and a repayment term of 5 years (with a grace period of 1 year).
II – Global Reversal Reserve (RGR)
The Company is authorized to withdraw RGR resources, while not used for their designated purposes, for the financing of the expansion of the Brazilian electricity sector, improvement of the service and implementation of federal government programs.
Thus, the Company withdraws funds from RGR, recognizing a debt with this Fund and invests in specific investment projects, financed by the Company, with the purpose of:
a) expansion of electricity distribution services;
b) incentives to alternative electricity sources;
c) inventory and feasibility studies for the development of hydroelectric projects;
d) implementation of power generation units of up to 5,000 kW, exclusively for public use in communities served by an isolated electric system;
e) efficient public lighting;
f) electricity conservation by means of improved quality of products and services;
g) universal access to electricity;
The remuneration resources withdrawn from RGR for loans to the Brazilian electricity sector have an annual interest rate of 5% per year. On December 31, 2013, the balance withdrawn from the Fund amounted to R$ 8,401,863 (December 31, 2012 – R$ 8,870,838), which is reflected in the Company’s liabilities under loans and financing.
The funds of RGR are not an integral part of these financial statements, as RGR is a separate entity from the Company.
F-115
Table of Contents
| 12/31/2013 | ||||||||||||||||
| CURRENT CHARGES | PRINCIPAL | |||||||||||||||
| Avg. Rate | Value | CURRENT | NON CURRENT | |||||||||||||
Foreign Currency | ||||||||||||||||
Financial Institutions | ||||||||||||||||
Interamericano Development Bank - IDB | 4.40 | % | 2,222 | 43,586 | 395,070 | |||||||||||
Corporación Andino de Fomento - CAF | 2.51 | % | 10,280 | 526,593 | 1,608,550 | |||||||||||
Kreditanstalt fur Wiederaufbau - KFW | 3.86 | % | 15 | — | 191,143 | |||||||||||
Eximbank | 2.15 | % | 1,040 | 49,016 | 171,550 | |||||||||||
BNP Paribas | 1.53 | % | 251 | 81,128 | 601,680 | |||||||||||
Others | 652 | 3,553 | 106,813 | |||||||||||||
|
|
|
|
|
| |||||||||||
| 14,460 | 703,876 | 3,074,806 | ||||||||||||||
|
|
|
|
|
| |||||||||||
Bonus | ||||||||||||||||
Maturity 11/30/2015 | 7.75 | % | 5,360 | — | 702,780 | |||||||||||
Maturity 07/30/2019 | 6.87 | % | 78,740 | — | 2,342,600 | |||||||||||
Maturity 27/10/2021 | 5.75 | % | 48,641 | — | 4,099,550 | |||||||||||
|
|
|
|
|
| |||||||||||
| 132,741 | — | 7,144,930 | ||||||||||||||
|
|
|
|
|
| |||||||||||
Other | ||||||||||||||||
National Treasure - Itaipu | 8 | 464 | — | |||||||||||||
MORGAN | 428 | 400 | 7,163 | |||||||||||||
LLOYDS | — | 22 | 1,115 | |||||||||||||
|
|
|
|
|
| |||||||||||
| 436 | 886 | 8,278 | ||||||||||||||
|
|
|
|
|
| |||||||||||
| 147,637 | 704,762 | 10,228,014 | ||||||||||||||
|
|
|
|
|
| |||||||||||
National Currency | ||||||||||||||||
Global Reversion Reserve | — | — | 8,401,683 | |||||||||||||
Other Financial Institutions | 13,251 | 100,170 | 1,078,525 | |||||||||||||
Banco do Brasil | 19,797 | 24,883 | 1,904,708 | |||||||||||||
Caixa Econômica Federal | 42,655 | 205,298 | 2,185,315 | |||||||||||||
BNDES | 118,286 | 593,027 | 6,708,276 | |||||||||||||
|
|
|
|
|
| |||||||||||
| 193,989 | 923,378 | 20,278,507 | ||||||||||||||
|
|
|
|
|
| |||||||||||
| 341,626 | 1,628,140 | 30,506,521 | ||||||||||||||
|
|
|
|
|
| |||||||||||
F-116
Table of Contents
| 12/31/2012 | ||||||||||||||||
| CURRENT CHARGES | PRINCIPAL | |||||||||||||||
| Avg. Rate | Value | CURRENT | NON CURRENT | |||||||||||||
Foreign Currency | ||||||||||||||||
Financial Institutions | ||||||||||||||||
Interamericano Development Bank - IDB | 4.40 | % | 2,194 | 38,021 | 301,977 | |||||||||||
Corporación Andino de Fomento - CAF | 2.51 | % | 12,978 | 330,237 | 1,862,530 | |||||||||||
Kreditanstalt fur Wiederaufbau - KFW | 3.86 | % | 2 | — | 35,832 | |||||||||||
Eximbank | 2.15 | % | 1,346 | 52,067 | 234,296 | |||||||||||
BNP Paribas | 1.53 | % | 330 | 70,769 | 595,628 | |||||||||||
Others | 672 | 6,379 | 33,970 | |||||||||||||
|
|
|
|
|
| |||||||||||
| 17,522 | 497,473 | 3,064,233 | ||||||||||||||
|
|
|
|
|
| |||||||||||
Bonus | ||||||||||||||||
Maturity 11/30/2015 | 7.75 | % | 4,675 | — | 613,050 | |||||||||||
Maturity 07/30/2019 | 6.87 | % | 68,687 | 251 | 2,043,538 | |||||||||||
Maturity 27/10/2021 | 5.75 | % | 42,431 | — | 3,576,125 | |||||||||||
|
|
|
|
|
| |||||||||||
| 115,793 | 251 | 6,232,713 | ||||||||||||||
|
|
|
|
|
| |||||||||||
Other | ||||||||||||||||
National Treasure - Itaipu | 20 | 810 | 405 | |||||||||||||
CAJUBI - Fundação Prev ITAIPU PY | — | — | — | |||||||||||||
MORGAN | — | — | — | |||||||||||||
LLOYDS | — | 38 | 991 | |||||||||||||
|
|
|
|
|
| |||||||||||
| 20 | 848 | 1,396 | ||||||||||||||
|
|
|
|
|
| |||||||||||
| 133,335 | 498,572 | 9,298,342 | ||||||||||||||
|
|
|
|
|
| |||||||||||
Local Currency | ||||||||||||||||
Local Currency | ||||||||||||||||
Global Reversion Reserve | — | — | 8,870,838 | |||||||||||||
Fundo de Investimento em Direitos Creditórios | — | — | — | |||||||||||||
Other Financial Institutions | 22,119 | 253,142 | 827,740 | |||||||||||||
Banco do Brasil | 8,071 | 21,220 | 961,334 | |||||||||||||
Caixa Econômica Federal | 23,342 | — | 823,202 | |||||||||||||
BNDES | 36,568 | 340,910 | 4,511,415 | |||||||||||||
|
|
|
|
|
| |||||||||||
| 90,100 | 615,272 | 15,994,529 | ||||||||||||||
|
|
|
|
|
| |||||||||||
| 223,435 | 1,113,844 | 25,292,871 | ||||||||||||||
|
|
|
|
|
| |||||||||||
a) The debts are guaranteed by the Union and/or by Eletrobras.
b) The total amount due on foreign currency, including applicable charges, on December 31, 2013 is R$ 11,080,413 (R$ 9,930,249 at December 31, 2012), equivalent to US$ 4,729,964 (US$ 4,859,432 at December 31, 2012). The percentage distribution by currency is as follows:
US$ | EURO | YEN | ||||||||
| 96.27 | % | 1.73 | % | 2.00 | % | |||||
c) Loans and financing are subject to charges. The average rate in 2013 is 5.91% per year and in 2012 was 5.04%.
F-117
Table of Contents
d) On September 30, 2013, bridge loan No 0418.626-06/2013 between Caixa Econômica Federal and Eletronuclear, guaranteed by Eletrobras, in the amount of R$ 1 billion for the acquisition of materials, imported equipment and foreign services for the construction of Angra 3, had R$ 200,000 outstanding on December 31, 2013.
e) CHESF agreed a loan with Banco do Brazil in the amount of R$ 500,000, with interest of 9.77 % pa, used exclusively to ensure funding of current accounts. It is guaranteed by Bank Letter of Credit issued against Eletrobras.
II – Financial lease operation:
The nominal value used in the calculation of assets and liabilities of financial lease contracts is found by reference to the value set for the contracted monthly power multiplied by installed capacity (60 to 65 MW) and the number of months of the contract.
The reconciliation between the total of future minimum payments under financial leases of the Company and their present value, this shown in the table below:
| 12/31/2013 | 12/31/2012 | |||||||
Less than a year | 321,758 | 298,231 | ||||||
More than one year and less than five years | 1,608,784 | 1,491,157 | ||||||
Over five years | 1,742,850 | 1,913,652 | ||||||
Charges for future funding on finance leases | 209,509 | 299,932 | ||||||
|
|
|
| |||||
Gross finance lease liabilities - minimum lease payments | 3,882,901 | 4,002,972 | ||||||
Adjustment to present value | (1,809,677 | ) | (1,979,939 | ) | ||||
|
|
|
| |||||
Total minimum financial lease payments | 2,073,224 | 2,023,033 | ||||||
|
|
|
| |||||
Less than a year | 181,596 | 162,929 | ||||||
More than one year and less than five years | 907,981 | 814,644 | ||||||
Over five years | 983,647 | 1,045,460 | ||||||
|
|
|
| |||||
Present value of payments | 2,073,224 | 2,023,033 | ||||||
|
|
|
| |||||
F-118
Table of Contents
III – GUARANTEES
The Company is a guarantor of several projects, of which the guaranteed amounts, projections and paid amounts are set forth in the table below.
| Financing’s | Balance due at | Guarantor | Projection of balance - At year end | Balance Payable | Guarantee | |||||||||||||||||||||||||||||||||||
Associate | Financial Bank | Modality | Participation | Amount | 12/31/2013 | Balance | 2014 | 2015 | 2016 | After 2016 | Maturity | |||||||||||||||||||||||||||||
Norte Energia | BNDES | SPE | 15.00 | % | 2,025,000 | 924,721 | 9,247 | 987,781 | 1,055,193 | 1,127,262 | — | 01/15/2042 | ||||||||||||||||||||||||||||
Norte Energia | CEF | SPE | 15.00 | % | 1,050,000 | 482,277 | 4,823 | 519,171 | 558,888 | 601,642 | — | 01/15/2042 | ||||||||||||||||||||||||||||
Norte Energia | BTG Pactual | SPE | 15.00 | % | 300,000 | 137,793 | 1,378 | 148,335 | 159,682 | 171,898 | — | 01/15/2042 | ||||||||||||||||||||||||||||
Norte Energia | Fiel Cumprimento | SPE | 15.00 | % | 156,915 | 156,915 | 1,569 | 109,841 | 109,841 | 109,841 | — | 04/30/2019 | ||||||||||||||||||||||||||||
ESBR | BNDES | SPE | 20.00 | % | 1,909,000 | 2,053,885 | 20,539 | 2,006,972 | 1,953,728 | 1,897,122 | — | 01/15/2034 | ||||||||||||||||||||||||||||
Cerro Chato I, II e III | Banco do Brasil | SPE | 100.00 | % | 223,419 | 184,274 | 1,843 | 156,302 | 128,308 | 100,313 | — | 07/15/2020 | ||||||||||||||||||||||||||||
RS Energia | BNDES | SPE | 100.00 | % | 126,221 | 88,699 | 887 | 76,889 | 65,060 | 53,231 | — | 06/15/2021 | ||||||||||||||||||||||||||||
Artemis Transmissora de Energia | BNDES | SPE | 100.00 | % | 170,029 | 69,575 | 696 | 54,779 | 39,968 | 25,156 | — | 10/15/2018 | ||||||||||||||||||||||||||||
Norte Brasil Transmissora | BNDES | SPE | 24.50 | % | 257,250 | 270,656 | 2,707 | 327,166 | 315,773 | 228,792 | — | 01/15/2029 | ||||||||||||||||||||||||||||
Norte Brasil Transmissora | Debentures | SPE | 24.50 | % | 49,000 | 50,874 | 509 | 59,866 | 62,853 | 75,171 | — | 01/15/2029 | ||||||||||||||||||||||||||||
Porto Velho Transmissora de Energia | BNDES | SPE | 100.00 | % | 283,411 | 283,902 | 2,839 | 264,666 | 245,447 | 226,226 | — | 08/15/2028 | ||||||||||||||||||||||||||||
UHE Mauá | BNDES | SPE | 49.00 | % | 182,417 | 172,786 | 1,728 | 160,546 | 148,275 | 136,004 | — | 01/15/2028 | ||||||||||||||||||||||||||||
UHE Mauá | BNDES/Banco do Brasil | SPE | 49.00 | % | 182,417 | 172,841 | 1,728 | 160,599 | 148,323 | 136,048 | — | 01/15/2028 | ||||||||||||||||||||||||||||
UHE Passo de São João | BNDES | Corporate | 100.00 | % | 183,330 | 164,786 | 1,648 | 151,718 | 138,620 | 125,522 | — | 07/15/2026 | ||||||||||||||||||||||||||||
SC Energia | BNDES/Banco do Brasil | Corporate | 100.00 | % | 50,000 | 23,995 | 240 | 19,570 | 15,159 | 10,740 | — | 05/15/2019 | ||||||||||||||||||||||||||||
SC Energia | BNDES/BDRE | Corporate | 100.00 | % | 50,000 | 23,950 | 240 | 19,533 | 15,111 | 10,688 | — | 05/15/2019 | ||||||||||||||||||||||||||||
SC Energia | BNDES | Corporate | 100.00 | % | 103,180 | 48,415 | 484 | 39,486 | 30,546 | 21,606 | — | 05/15/2019 | ||||||||||||||||||||||||||||
SC Energia | BNDES | Corporate | 100.00 | % | 67,017 | 41,180 | 412 | 35,507 | 29,826 | 24,145 | — | 03/15/2021 | ||||||||||||||||||||||||||||
UHE São Domingos | BNDES | Corporate | 100.00 | % | 207,000 | 214,552 | 2,146 | 199,793 | 184,993 | 170,194 | — | 06/15/2028 | ||||||||||||||||||||||||||||
RS Energia | BNDES | SPE | 100.00 | % | 41,898 | 36,650 | 367 | 33,891 | 31,124 | 28,358 | — | 03/15/2027 | ||||||||||||||||||||||||||||
RS Energia | BNDES | SPE | 100.00 | % | 9,413 | 9,647 | 96 | 8,943 | 8,237 | 7,531 | — | 08/15/2027 | ||||||||||||||||||||||||||||
UHE Passo de São João | BNDES | Corporate | 100.00 | % | 14,750 | 13,619 | 136 | 12,539 | 11,456 | 10,374 | — | 07/15/2026 | ||||||||||||||||||||||||||||
Projetos Corporativos | Banco do Brasil | Corporate | 100.00 | % | 250,000 | 250,852 | 2,509 | 250,852 | 222,980 | 195,107 | — | 11/15/2023 | ||||||||||||||||||||||||||||
UHE Teles Pires | BNDES LP | SPE | 24.50 | % | 296,940 | 235,655 | 2,357 | — | — | — | — | 02/15/2036 | ||||||||||||||||||||||||||||
UHE Teles Pires | BNDES/ BB | SPE | 24.50 | % | 294,000 | 235,232 | 2,352 | — | — | — | — | 02/15/2036 | ||||||||||||||||||||||||||||
UHE Teles Pires | FI-FGTS | SPE | 24.50 | % | 160,680 | 183,174 | 1,832 | — | — | — | — | 05/31/2032 | ||||||||||||||||||||||||||||
Livramento Holding | BNDES | SPE | 24.50 | % | 91,943 | 76,013 | 760 | 69,426 | 62,285 | 54,852 | — | 06/15/2030 | ||||||||||||||||||||||||||||
Transmissora Sul Brasileira de Energia S.A. | Debentures | SPE | 80.00 | % | 120,000 | 123,068 | 1,231 | 123,068 | — | — | — | 09/22/2014 | ||||||||||||||||||||||||||||
Costa Oeste Transmissora de Energia S.A. | BNDES | SPE | 49.00 | % | 17,846 | 17,846 | 178 | 19,121 | 17,054 | 14,987 | — | 11/01/2022 | ||||||||||||||||||||||||||||
Santa Vitória do Palmar Holding S.A. | BNDES | SPE | 49.00 | % | 197,950 | 112,828 | 1,128 | 198,444 | 185,526 | 165,676 | — | 04/15/2016 | ||||||||||||||||||||||||||||
São Luis II e III | BNDES | Corporate | 100.00 | % | 13,653 | 10,646 | 106 | 9,671 | 8,695 | 7,720 | 975 | 11/15/2024 | ||||||||||||||||||||||||||||
Miranda II | BNDES | Corporate | 100.00 | % | 47,531 | 31,099 | 311 | 27,320 | 23,541 | 19,762 | 3,779 | 11/15/2024 | ||||||||||||||||||||||||||||
Ribeiro Gonç./Balsas | BNB | Corporate | 100.00 | % | 70,000 | 68,056 | 681 | 64,167 | 60,278 | 56,389 | 3,889 | 06/03/2013 | ||||||||||||||||||||||||||||
Lechuga/J. Teixeira | BASA | Corporate | 100.00 | % | 25,720 | 24,416 | 244 | 22,798 | 21,179 | 19,560 | 1,619 | 01/10/2029 | ||||||||||||||||||||||||||||
UHE Tucuruí | BNDES | Corporate | 100.00 | % | 931,000 | 306,187 | 3,062 | 279,783 | 178,043 | 76,337 | 76,337 | 09/15/2016 | ||||||||||||||||||||||||||||
Norte Brasil Transmissora | BNDES | SPE | 24.50 | % | 257,250 | 270,656 | 2,707 | 327,166 | 315,773 | 228,792 | — | 01/15/2029 | ||||||||||||||||||||||||||||
Norte Brasil Transmissora | Debentures | SPE | 24.50 | % | 49,000 | 50,874 | 509 | 59,866 | 62,853 | 75,171 | — | 01/15/2029 | ||||||||||||||||||||||||||||
Linha Verde Transmissora | BTG Pactual | SPE | 49.00 | % | 110,250 | 113,321 | 1,133 | — | — | — | — | 01/31/2014 | ||||||||||||||||||||||||||||
Linha Verde Transmissora | BASA | SPE | 49.00 | % | 90,650 | 70,348 | 703 | 105,315 | 96,336 | 87,357 | — | 11/10/2032 | ||||||||||||||||||||||||||||
Manaus Transmissora | BASA | SPE | 30.00 | % | 75,000 | 88,230 | 882 | 101,236 | 108,604 | 93,207 | — | 07/10/2030 | ||||||||||||||||||||||||||||
Manaus Transmissora | BASA | SPE | 30.00 | % | 45,000 | 52,938 | 529 | 48,626 | 48,557 | 41,673 | — | 06/15/2032 | ||||||||||||||||||||||||||||
Manaus Transmissora | BNDES | SPE | 30.00 | % | 120,000 | 122,198 | 1,222 | 111,043 | 101,634 | 87,225 | — | 12/31/2026 | ||||||||||||||||||||||||||||
Estação Transmissora de Energia | BNDES | SPE | 100.00 | % | 505,477 | 508,103 | 5,081 | 467,124 | 433,158 | 399,193 | — | 11/30/2028 | ||||||||||||||||||||||||||||
Estação Transmissora de Energia | BASA | SPE | 100.00 | % | 221,789 | 245,408 | 2,454 | 239,597 | 225,050 | 210,502 | — | 07/30/2031 | ||||||||||||||||||||||||||||
Estação Transmissora de Energia | BASA | SPE | 100.00 | % | 221,789 | 222,112 | 2,221 | 223,151 | 223,344 | 222,577 | — | 10/15/2030 | ||||||||||||||||||||||||||||
Rio Branco Transmissora | BNDES | SPE | 100.00 | % | 138,000 | 138,894 | 1,389 | 128,412 | 117,929 | 107,446 | — | 03/15/2027 | ||||||||||||||||||||||||||||
Transmissora Matogrossense Energia | BASA | SPE | 49.00 | % | 39,200 | 39,819 | 398 | 39,819 | 39,819 | 36,975 | — | 02/01/2029 | ||||||||||||||||||||||||||||
Transmissora Matogrossense Energia | BNDES | SPE | 49.00 | % | 42,777 | 37,952 | 380 | 35,012 | 31,945 | 28,878 | — | 05/15/2026 | ||||||||||||||||||||||||||||
Norte Energia | BNDES | SPE | 19.98 | % | 2,697,300 | 1,231,729 | 12,317 | 1,315,724 | 1,405,517 | 1,501,513 | — | 01/15/2042 | ||||||||||||||||||||||||||||
Norte Energia | CEF | SPE | 19.98 | % | 1,398,600 | 642,393 | 6,424 | 691,536 | 744,438 | 801,388 | — | 01/15/2042 | ||||||||||||||||||||||||||||
Norte Energia | BTG Pactual | SPE | 19.98 | % | 399,600 | 183,541 | 1,835 | 197,582 | 212,697 | 228,968 | — | 01/15/2042 | ||||||||||||||||||||||||||||
Rei dos Ventos 1 Eolo | Votorantin | SPE | 24.50 | % | 30,851 | 32,312 | 323 | 30,270 | 28,229 | 26,188 | — | 10/30/2014 | ||||||||||||||||||||||||||||
Brasventos Miassaba 3 | Votorantin | SPE | 24.50 | % | 30,984 | 32,532 | 325 | 30,476 | 28,422 | 26,367 | — | 10/30/2014 | ||||||||||||||||||||||||||||
Rei dos Ventos 3 | Votorantin | SPE | 24.50 | % | 32,533 | 34,053 | 341 | 31,901 | 29,751 | 27,600 | — | 10/30/2014 | ||||||||||||||||||||||||||||
Angra III | BNDES | Corporate | 100.00 | % | 6,146,256 | 1,941,027 | 19,410 | 4,525,482 | 6,859,075 | 6,998,143 | — | 06/15/2036 | ||||||||||||||||||||||||||||
Angra III | CX. ECONÔMICA | Corporate | 100.00 | % | 1,000,000 | 201,192 | 2,012 | — | — | — | — | 05/30/2014 | ||||||||||||||||||||||||||||
ESBR | BNDES | SPE | 20.00 | % | 1,909,000 | 2,053,885 | 20,539 | 2,006,972 | 1,953,728 | 1,897,122 | — | 01/15/2034 | ||||||||||||||||||||||||||||
Manaus Transmissora | BASA | SPE | 19.50 | % | 48,750 | 57,350 | 573 | 65,804 | 70,593 | 60,585 | — | 07/10/2030 | ||||||||||||||||||||||||||||
Manaus Transmissora | BASA | SPE | 19.50 | % | 29,250 | 34,410 | 344 | 31,607 | 31,562 | 27,087 | — | 06/15/2032 | ||||||||||||||||||||||||||||
Manaus Transmissora | BNDES | SPE | 19.50 | % | 78,000 | 79,429 | 794 | 72,178 | 66,062 | 56,696 | — | 12/31/2026 | ||||||||||||||||||||||||||||
Norte Energia | BNDES | SPE | 15.00 | % | 2,025,000 | 924,721 | 9,247 | 987,781 | 1,055,193 | 1,127,262 | — | 01/15/2042 | ||||||||||||||||||||||||||||
Norte Energia | CEF | SPE | 15.00 | % | 1,050,000 | 482,277 | 4,823 | 519,171 | 558,888 | 601,642 | — | 01/15/2042 | ||||||||||||||||||||||||||||
Norte Energia | BTG Pactual | SPE | 15.00 | % | 300,000 | 137,793 | 1,378 | 148,335 | 159,682 | 171,898 | — | 01/15/2042 | ||||||||||||||||||||||||||||
IE Madeira | BASA FNO | SPE | 24.50 | % | 65,415 | 69,277 | 693 | 72,310 | 75,897 | 77,193 | — | 06/30/2016 | ||||||||||||||||||||||||||||
IE Madeira | BNDES | SPE | 24.50 | % | 455,504 | 438,224 | 4,382 | 423,419 | 391,633 | 359,847 | — | 06/30/2016 | ||||||||||||||||||||||||||||
IE Madeira | Debentures | SPE | 24.50 | % | 85,750 | 92,843 | 928 | 98,974 | 105,195 | 105,824 | — | 03/18/2025 | ||||||||||||||||||||||||||||
TDG | BNB | SPE | 49.90 | % | 29,764 | 29,290 | 293 | 29,879 | 28,997 | 27,821 | — | 03/01/2031 | ||||||||||||||||||||||||||||
TDG | BNB | SPE | 49.90 | % | 58,346 | 46,282 | 463 | 45,798 | 45,042 | 44,198 | — | 10/01/2032 | ||||||||||||||||||||||||||||
Corporate Projects | Banco Do Brasil | Corporate | 100.00 | % | 500,000 | 501,918 | 5,019 | 500,000 | 375,000 | 250,000 | — | 01/15/2034 | ||||||||||||||||||||||||||||
IE Garanhuns s/a | BNDES | SPE | 49.90 | % | 175,146 | — | — | 183,105 | 178,121 | 162,048 | — | 12/15/2028 | ||||||||||||||||||||||||||||
UHE Batalha | BNDES | Corporate | 100.00 | % | 224,000 | 197,541 | 1,975 | 181,118 | 164,653 | 148,187 | — | 12/15/2025 | ||||||||||||||||||||||||||||
UHE Simplício | BNDES | Corporate | 100.00 | % | 1,034,410 | 834,842 | 8,348 | 768,640 | 702,282 | 635,925 | — | 07/15/2026 | ||||||||||||||||||||||||||||
UHE Baguari | BNDES | Corporate | 15.00 | % | 60,153 | 47,295 | 473 | 43,436 | 39,567 | 35,699 | — | 07/15/2026 | ||||||||||||||||||||||||||||
OTHER | BRASIL | Corporate | 100.00 | % | 750,000 | 755,982 | 7,560 | 755,977 | 756,277 | 756,277 | — | 10/31/2018 | ||||||||||||||||||||||||||||
Rolagem BASA 2008 | BRASIL | Corporate | 100.00 | % | 208,312 | 216,519 | 2,165 | 217,228 | 216,963 | 216,963 | — | 10/07/2018 | ||||||||||||||||||||||||||||
Inovation Project | BRASIL | Corporate | 100.00 | % | 268,503 | 163,480 | 1,635 | 229,145 | 256,775 | 250,734 | — | 11/15/2023 | ||||||||||||||||||||||||||||
UHE Santo Antônio | BNDES | SPE | 39.00 | % | 1,206,109 | 1,592,901 | 15,929 | 1,605,159 | 1,557,191 | 1,494,887 | — | 03/15/2034 | ||||||||||||||||||||||||||||
UHE Santo Antônio | BNDES Transfer | SPE | 39.00 | % | 1,186,609 | 1,653,209 | 16,532 | 1,667,378 | 1,617,134 | 1,551,331 | — | 03/15/2034 | ||||||||||||||||||||||||||||
UHE Santo Antônio | FNO | SPE | 39.00 | % | 196,334 | 235,509 | 2,355 | 244,057 | 243,841 | 234,471 | — | 12/15/2030 | ||||||||||||||||||||||||||||
UHE Santo Antônio | 2ª Issuing of Debentures | SPE | 39.00 | % | 163,800 | 173,483 | 1,735 | 286,516 | 303,380 | 320,853 | — | 01/24/2023 | ||||||||||||||||||||||||||||
UHE Santo Antônio | BNDES Additional | SPE | 39.00 | % | 388,050 | 157,413 | 1,574 | 168,995 | 181,602 | 195,188 | — | 03/15/2034 | ||||||||||||||||||||||||||||
UHE Santo Antônio | BNDES Additional Transfer | SPE | 39.00 | % | 388,050 | 157,658 | 1,577 | 170,729 | 185,004 | 200,518 | — | 03/15/2034 | ||||||||||||||||||||||||||||
UHE Foz do chapecó | BNDES | SPE | 40.00 | % | 435,508 | 474,465 | 4,745 | 440,047 | 404,234 | 369,831 | — | 09/15/2027 | ||||||||||||||||||||||||||||
UHE Foz do chapecó | BNDES Transfer | SPE | 40.00 | % | 217,754 | 240,155 | 2,402 | 222,736 | 204,570 | 187,160 | — | 09/15/2027 | ||||||||||||||||||||||||||||
UHE Foz do chapecó | BNDES Transfer | SPE | 40.00 | % | �� | 4,009 | 3,606 | 36 | 3,344 | 3,072 | 2,811 | — | 09/15/2027 | |||||||||||||||||||||||||||
Centroeste de Minas | BNDES | SPE | 49.00 | % | 13,982 | 11,618 | 116 | 9,890 | 8,738 | 7,586 | — | 04/15/2023 | ||||||||||||||||||||||||||||
Serra do Facão | BNDES | SPE | 49.47 | % | 257,357 | 255,761 | 2,558 | 237,058 | 218,158 | 199,257 | — | 06/15/2027 | ||||||||||||||||||||||||||||
Goiás Transmissão | Brasil - FCO | SPE | 49.00 | % | 49,000 | 49,385 | 494 | 49,385 | 49,385 | 49,385 | — | 12/01/2031 | ||||||||||||||||||||||||||||
Goiás Transmissão | BNDES | SPE | 49.00 | % | 48,020 | 49,864 | 499 | 46,202 | 42,531 | 38,859 | — | 01/15/2027 | ||||||||||||||||||||||||||||
MGE | BNDES | SPE | 49.00 | % | 58,359 | 55,456 | 555 | 51,227 | 46,988 | 42,748 | — | 01/01/2027 | ||||||||||||||||||||||||||||
Transenergia São Paulo | BNDES | SPE | 49.00 | % | 18,963 | 18,109 | 181 | 16,630 | 15,205 | 13,779 | — | 08/15/2026 | ||||||||||||||||||||||||||||
Transenergia Renovável | BNDES | SPE | 49.00 | % | 77,910 | 73,516 | 735 | 68,164 | 62,440 | 56,716 | — | 11/15/2026 | ||||||||||||||||||||||||||||
Rei dos Ventos 1 Eolo | BNDES | SPE | 24.50 | % | 30,851 | 32,312 | 323 | 30,270 | 28,229 | 26,188 | — | 10/30/2014 | ||||||||||||||||||||||||||||
UEE Miassaba 3 | BNDES | SPE | 24.50 | % | 30,984 | 32,532 | 325 | 30,476 | 28,422 | 26,367 | — | 10/30/2014 | ||||||||||||||||||||||||||||
UEE Rei dos Ventos 3 | BNDES | SPE | 24.50 | % | 32,533 | 34,053 | 341 | 31,901 | 29,751 | 27,600 | — | 10/30/2014 | ||||||||||||||||||||||||||||
IE Madeira | BASA FNO | SPE | 24.50 | % | 65,415 | 69,277 | 693 | 72,310 | 75,897 | 77,193 | — | 06/30/2016 | ||||||||||||||||||||||||||||
IE Madeira | BNDES | SPE | 24.50 | % | 455,504 | 438,224 | 4,382 | 423,419 | 391,633 | 359,847 | — | 06/30/2016 | ||||||||||||||||||||||||||||
IE Madeira | Debentures | SPE | 24.50 | % | 85,750 | 92,843 | 928 | 98,974 | 105,195 | 105,824 | — | 03/18/2025 | ||||||||||||||||||||||||||||
UHE Teles Pires | BNDES LP | SPE | 24.50 | % | 296,940 | 235,655 | 2,357 | — | — | — | — | 02/15/2036 | ||||||||||||||||||||||||||||
UHE Teles Pires | BNDES/ BB | SPE | 24.50 | % | 294,000 | 235,232 | 2,352 | — | — | — | — | 05/31/2032 | ||||||||||||||||||||||||||||
UHE Teles Pires | FI-FGTS | SPE | 24.50 | % | 160,680 | 183,174 | 1,832 | — | — | — | — | 05/31/2032 | ||||||||||||||||||||||||||||
|
|
|
|
|
|
|
|
|
|
|
|
|
| |||||||||||||||||||||||||||
Total | 39,329,009 | 27,279,470 | 272,795 | 28,683,617 | 30,383,835 | 29,738,823 | 86,599 | |||||||||||||||||||||||||||||||||
|
|
|
|
|
|
|
|
|
|
|
|
|
| |||||||||||||||||||||||||||
F-119
Table of Contents
The fair value of the amounts guaranteed by the Company on resources already provided by the financing banks are shown in non-current liabilities under the provisions heading. The provisions are based on the fair value of Eletrobras, as set forth below:
| Provisioned Amount | ||||
Warranty due on 12/31/2011 | 160,228 | |||
Changes in 2012 | 28,885 | |||
|
| |||
Warranty due in 12/31/2012 | 189,113 | |||
Changes in 2013 | 83,682 | |||
|
| |||
Warranty due in 12/31/2013 | 272,795 | |||
a) UHE Simplício - Project of the Furnas subsidiary, with an installed capacity to generate 333.7 MW. 100% of the project interest is held by Furnas. Therefore, the Company guarantees 100% of its financing.
b) UHE Mauá - Project with installed capacity of 361 MW, in partnership with parent company Eletrosul (49%) and Copel (51%). This hydroelectric power plant (Usina Hidrelétrica de Energia, UHE) has two agreements with BNDES, one direct and one indirect, the Company being a guarantor of 49% in both agreements.
c) UHE Jirau - SPEEnergia Sustentável do Brasil, established by subsidiaries Eletrosul, CHESF, GDF Suez Energy and Camargo Corrêa, with installed capacity of 3,750MW. For this project, two financing agreements were signed with BNDES, one direct and one indirect, through lending banks, to be paid over 240 months. The Company is guarantor of the amount held by each of its subsidiaries - Eletrosul (20%) and CHESF (20%).
d) UHE Santo Antônio - SPE Santo Antônio Energia, established by Furnas, CEMIG, Fundo de Investimentos em Participação Amazônica Energia – FIP, Construtora Norberto Odebrecht S/A, Odebrecht Investimentos em Infraestrutura Ltda. And Andrade Gutierrez Participações S/A, with installed capacity of 3,568,80 MW. The Company is a party in loans with BNDES and Banco da Amazônia, limited to Furnas’ interest (39%).
e) UHE Foz do Chapecó – SPE Foz do Chapecó Energia, whose power plant has an installed capacity of 855MW, has the Company as guarantor of contracts with BNDES, which replace previous bank guarantees and are limited to Furnas’ interest in the SPE (40%).
f) UHE Baguari – Corporate project of Furnas, with installed capacity of 140MW. The Company is the guarantor of 15% of the BNDES loan agreement.
g) UHE Serra do Facão – SPE Serra do Facão, established by Furnas (49.47%), Alcoa Alumínio S.A. (34.97%), DME Energética (10.09%) and Camargo Corrêa Energia S.A (5.47%), with installed capacity of 212.58MW. The guarantee provided by the Company on the loan agreement with BNDES solely covers the participation of Furnas in the project.
h) Norte Brasil Transmissora de Energia – SPE, with interest of Eletronorte (24.5%) and Eletrosul (24.5%), aimed at implementing, operating and maintaining the transmission line LT Porto Velho/Araraquara, with a length of 2,412 km.
F-120
Table of Contents
i) Manaus Transmissora de Energia – SPE, with the participation of Eletronorte (30%) and Chesf (19.5%) that has the objective of operating 4 substations and one transmission line of 586km (LT Oriximiná/Itacoatiara/Cariri). The Company is the guarantor in two loan agreements in this project (BASA and BNDES).
j) Mangue Seco 2 – SPE with a 49% participation by Eletrobras and 51% participation by Petrobras for the construction and operation of three wind power plants in Guararé, in the state of Rio Grande do Norte. In this project, the guarantee is provided by the Company, proportional to its participation in the long-term loan agreement with BNB.
k) UHE Batalha – Corporate project of Furnas with the capacity of generating 52.5MW, that has a loan agreement with BNDES. The Company has the role of guarantor of this contract.
l) IE Madeira - SPE Interligação Elétrica do Madeira, with equity interest of Furnas (24.5%) and Chesf (24.5%). In this project, there is a counter-guarantee tendered by Eletrobras in the Financial Guarantee Contracts, as collateral for the short-term loan with BNDES, limited to the equity interest of its subsidiaries. There is also a short-term loan with BNDES, to which the Company is a party, proportional to its subsidiaries.
m) UHE Belo Monte – SPE Norte Energia, with installed capacity of 11,233 MW, of Chesf (15%), Eletronorte (19.98%) and Eletrobras (15%), in addition to other partners. Guarantee provided by the Company on behalf of the SPE for the liabilities, with JMALUCELLI insurance company, within the scope of surety insurance contract. The Company is also a party to a short-term loan contract signed with BNDES.
n) Angra III – The Company is guarantor in the financing of Eletronuclear by BNDES, for the construction of the UTN Angra III corporate project.
NOTE 23 – DEBENTURES
Non-convertible debentures issued by the subsidiary Eletronorte of R$218,682 (R$ 69,320 on December 31, 2012), pay interest at the TJLP plus 0.15% per annum and mature on July 10, 2031.
NOTE 24 – COMPULSORY LOAN
The Compulsory Loan over the consumption of electricity, enacted by Law number 4,156/1962 with the objective of generating resources for the expansion of the Brazilian electricity sector, was repealed by Law number 7,181, of December 20, 1983, which established December 31, 1993 as the final deadline for collection.
In the first phase of such Compulsory Loan, terminated by Decree-Law 1,512/1976, the collection of taxes included several classes of electricity consumers, and taxpayers credits were represented by Bearer Bonds issued by the Company.
F-121
Table of Contents
Subsequently, pursuant to the Decree-Law, such Compulsory Loan was charged solely from industries with monthly electricity consumption exceeding 2,000 kwh, and taxpayers’ credits were no longer represented by the bonds, but rather in book-entry form by the Company.
The remaining balance of the Compulsory Loan, after the 4th conversion into shares, which happened on April 30, 2008, concerning credits constituted from 1988 to 2004, is recorded in the current and non-current liabilities, maturing as of 2008, and accruing an interest rate of 6% per year, plus monetary adjustment based on the IPCA-E variance, and corresponding, on December 31, 2013, to R$ 366,840 (December 31, 2012 – R$ 334,192), of which R$ 358,905 is non-current (December 31, 2012 – R$ 321,894).
I – Bearer Bonds Issued by the Company
The Bearer Bonds, issued as a result of the Compulsory Loan, are not marketable securities, are not negotiable in stock markets, are not quoted and are unenforceable.
The issuing of such bonds was a legal imposition and not a corporate decision by the Company. In the same manner, acceptance thereof by the bondholders was not the result of an act of will, but a legal requirement pursuant to Law number 4,156/1962.
CVM, in a decision by its Collegiate body, published in the administrative decision CVM RJ 2005/7230, filed by the holders of such bonds, states that “the bonds issued by the Company as a result from Law number 4,156/1962 cannot be deemed as securities”.
It is also the understanding of the CMV that there is no irregularity in the procedures adopted by the Company in its Financial Statements, in the matter of the above-mentioned bonds, nor in the disclosure of the existence of lawsuits.
The unenforceability of such Bearer Bonds was reinforced by decisions of the Supreme Court of Justice, which confirmed the understanding that such bonds are expired and cannot provide guarantee for tax foreclosures.
Therefore, the Bearer Bonds issued during the first phase of such compulsory loan, per decision of the CVM, cannot be considered as debentures. In addition, pursuant to section 4, paragraph 11 of Law number 4,156/1962 and section 1 of Decree 20,910/1932, they are unenforceable, as confirmed in the Informational Bulletin 344 of the Supreme Court of Justice (Superior Tribunal de Justiça, STJ), where it is stated that such Bonds cannot be used as guarantees for tax foreclosures, since they have no net value and are not debentures.
F-122
Table of Contents
In this manner, the liability relating to the Compulsory Loan refers to residual credits, constituted between 1988 and 1994, from industrial consumers with consumption exceeding 2,000 kW/h, regarding the second phase of such Compulsory Loan, as well as unclaimed interests relating to such credits, as set forth below:
| 12/31/2013 | 12/31/2012 | |||||||
CURRENT | ||||||||
Interest Payable | 7,935 | 12,298 | ||||||
|
|
|
| |||||
| 7,935 | 12,298 | |||||||
NON-CURRENT | ||||||||
Collected Credits | 358,905 | 321,894 | ||||||
|
|
|
| |||||
TOTAL | 366,840 | 334,192 | ||||||
|
|
|
| |||||
NOTE 25 – FUEL CONSUMPTION ACCOUNT (CONTA DE CONSUMO DE COMBUSTÍVEL, CCC)
The Fuel Consumption Account (CCC), created by Decree number 73,102, from November 7, 1973, groups the allocation of costs related to the consumption of fuel for the generation of thermoelectric energy, particularly in the Northern Region of the country.
Pursuant to Law No. 8,631 of March 04, 1993, the Company manages the amounts relating to tax payments made by the electricity public utility concession holders, for credit in the Fuel Consumption Account – CCC, corresponding to annual quotas allocated to expenditures with fuel for electricity generation. The amounts recorded in the current assets against current liabilities, correspond to the availability of resources, maintained in restricted cash, and to the quotas not paid by the concession holders.
Fuel Consumption Account – FCA
| 12/31/2013 | 12/31/2012 | |||||||
Current Assets | 1,275,334 | 1,240,811 | ||||||
Non-current Assets | 16,275 | 521,097 | ||||||
|
|
|
| |||||
Total | 1,291,609 | 1,761,908 | ||||||
|
|
|
| |||||
Liabilities | 941,285 | 1,369,201 | ||||||
Non-current Liabilities | 455,455 | 2,401,069 | ||||||
|
|
|
| |||||
Total | 1,396,740 | 3,770,270 | ||||||
|
|
|
| |||||
The reduction in the Fuel Consumption Account - FCC is due to the enactment of 12,783/2013 that abolished the compulsory charge to concession holders of the public electricity service.
F-123
Table of Contents
NOTE 26 – TAXES PAYABLE AND INCOME TAX AND SOCIAL CONTRIBUTION – LIABILITIES
| a) | Taxes payable: |
| 12/31/2013 | 12/31/2012 | |||||||
Current liabilities: | ||||||||
Taxes withheld at source (IRRF and CSRF) | 120,871 | 109,729 | ||||||
PASEP and COFINS | 174,842 | 125,021 | ||||||
ICMS | 117,685 | 140,676 | ||||||
PAES / Refis | 163,218 | 139,116 | ||||||
INSS / FGTS | 113,483 | 100,549 | ||||||
Other | 149,327 | 199,331 | ||||||
|
|
|
| |||||
Total | 839,426 | 814,422 | ||||||
|
|
|
| |||||
| 12/31/2013 | 12/31/2012 | |||||||
Non-current liabilities: | ||||||||
Taxes withheld at source (IRRF and CSRF) | — | — | ||||||
PASEP and COFINS | 30,131 | 23,798 | ||||||
ICMS | 14,575 | 16,567 | ||||||
PAES / Refis | 825,472 | 565,917 | ||||||
INSS / FGTS | 18,656 | 14,115 | ||||||
Other | 4,116 | — | ||||||
|
|
|
| |||||
Total | 892,950 | 620,397 | ||||||
|
|
|
| |||||
| b) | Tax and social security contribution |
| 12/31/2013 | 12/31/2012 | |||||||
Current liabilities: | ||||||||
Current Income Tax | 11,457 | 238,747 | ||||||
Current Social Contribution | 3,805 | 75,141 | ||||||
|
|
|
| |||||
| 15,262 | 313,888 | |||||||
|
|
|
| |||||
Non-current liabilities: | ||||||||
|
|
|
| |||||
Income tax / social contribution taxes | 533,713 | 598,750 | ||||||
|
|
|
| |||||
F-124
Table of Contents
| c) | Conciliation of expenses with taxes and social security contributions |
| 12/31/2013 | 12/31/2012 | |||||||||||||||
| IRPJ | CSLL | IRPJ | CSLL | |||||||||||||
Income (loss) before income tax and social contribution | (4,924,697 | ) | (4,924,697 | ) | (7,416,294 | ) | (7,416,294 | ) | ||||||||
|
|
|
|
|
|
|
| |||||||||
Tax losses unrecognized | — | — | — | — | ||||||||||||
|
|
|
|
|
|
|
| |||||||||
Adjusted basis | (4,924,697 | ) | (4,924,697 | ) | (7,416,294 | ) | (7,416,294 | ) | ||||||||
Total income tax and social contribution calculated at the rates of 25% and 9%, respectively | 1,231,174 | 443,223 | 1,854,074 | 667,466 | ||||||||||||
Effects of additions and (exclusions: | ||||||||||||||||
Dividend Income | 25,319 | 9,115 | 28,005 | 10,082 | ||||||||||||
Equity | 44,442 | 15,999 | 153,051 | 55,098 | ||||||||||||
Provision of JCP | ||||||||||||||||
Provision / Decrease in Market Value | (612,907 | ) | (220,647 | ) | (284,815 | ) | (102,533 | ) | ||||||||
Unrecognized deferred tax / written off | (1,476,396 | ) | (531,502 | ) | (1,076,772 | ) | (387,650 | ) | ||||||||
Other | (227,812 | ) | (66,686 | ) | (361,549 | ) | (63,815 | ) | ||||||||
|
|
|
|
|
|
|
| |||||||||
|
|
|
|
|
|
|
| |||||||||
Total income (expense) income tax and social contribution | (1,016,179 | ) | (350,499 | ) | 311,994 | 178,648 | ||||||||||
|
|
|
|
|
|
|
| |||||||||
Effective rate | 20.63 | % | 7.12 | % | 4.21 | % | 2.41 | % | ||||||||
|
|
|
|
|
|
|
| |||||||||
| d) | Tax Incentive – SUDENE |
Provisional Measure number 2,199-14, from August 24, 2001, amended by Law number 11,196, of November 21, 2005, allows companies that are located in the Northeast Region and have projects in the infrastructure sector, considered a priority for the regional development by act of the Executive branch, to reduce the amount of income tax for the purpose of investment in installation, expansion, modernization or diversification projects.
Over concession contracts number 006/2004 of generation and number 061/2001 of transmission (both signed by CHESF), the reduction incentive of 75% of taxes includes the years 2008 to 2017. For transmission contracts number 008/2005 and 007/2005 the reduction incentive was granted for the period of 2011 to 2020. For contracts with a tax incentive, the 25% income tax rate is reduced to 6.25%. In the year ended on December 31, 2013, these benefits have not been available to CHESF.
In the year 2012, CHESF did not use the 75% reduction in income tax incentive, due to not having a tax profit. In 2011, the tax incentive mentioned above totalized R$ 317,812, recorded in the income statement for the fiscal year as a reduction of income tax, in accordance with Technical Pronouncement IAS 20.
| e) | Special Installment Program – PAES |
Subsidiaries Furnas, Eletrosul, Eletronorte, Amazonas Energia and Distribuição Alagoas chose to refinance tax debt. The term of the financing is limited to 180 months and the outstanding balance is set by the Long Term Interest Rate – TJLP and SELIC.
F-125
Table of Contents
| f) | Tax Recovery Program (REFIS) – Law 12,865/2013 |
Furnas, on December 30, 2013, opted for the Refis program, and included the processes PASEP / COFINS in the amount of R$ 420,197.
NOTE 27 – REGULATORY FEES
| 12/31/2013 | 12/31/2012 | |||||||
CURRENT LIABILITIES | ||||||||
Share RGR | 273,705 | 124,401 | ||||||
Quota CCC | — | 30,695 | ||||||
Share CDE | 1,661 | 11,152 | ||||||
Share PROINFA | 22,181 | 23,012 | ||||||
Compensation for the Use of Water Resources | 78,494 | 85,950 | ||||||
Inspection Fee Services Electric Power | 3,789 | 6,088 | ||||||
Research and Development - R & D | 297,131 | 329,591 | ||||||
Energy Efficiency Program - EEP | 32,900 | 37,967 | ||||||
Other | 5,001 | 5,374 | ||||||
|
|
|
| |||||
| 714,862 | 654,230 | |||||||
|
|
|
| |||||
NON-CURRENT LIABILITIES | ||||||||
Share RGR | 32,376 | 32,177 | ||||||
Research and Development - R & D | 300,586 | 368,908 | ||||||
Energy Efficiency Program - EEP | 43,020 | 27,298 | ||||||
|
|
|
| |||||
| 375,982 | 428,383 | |||||||
|
|
|
| |||||
|
|
|
| |||||
TOTAL | 1,090,844 | 1,082,613 | ||||||
|
|
|
| |||||
a) Global Reversal Reserve (Reserva global de Reversão, RGR)
The contribution to establish the RGR is responsibility of the Electricity Public Utility Companies, based on a quota called Reversal and Expropriation of Electricity Services, of up to 2.5% of the value of investments of concession holders and licensees, limited to 3% of the annual revenue. The value of the quota is calculated as a service cost component for the concession holders.
Concession holders pay their annual quotas to the Fund, which are not controlled by the Company, into an escrow bank account managed by the Company, which operates the account within the limits set forth in Law number 5,655/1971 and all amendments thereto, also not reflected in the Company’s Financial Statements, since it is a separate entity from the Company.
With the amendment of Law 12,783/2013, as of January 1, 2013, the following are no longer obligated to collect the annual RGR quotas:
I - concession holders and licensees of electricity distribution public utility companies;
II - concession holders of electricity transmission public utility companies contracted as of September 12, 2012; and
III - concession holders of electricity transmission and generation public utility companies prorogated or contracted under the terms of Law number 12,783/2013.
F-126
Table of Contents
b) Fuel Consumption Account – CCC
The Sectorial fund, which was created in the 1970s and amended by Law number 12.111/2009, has the purpose of reimbursing part of the total generation cost to produce electricity in the Isolated Systems, maintaining the coverage for subrogated projects.
This total cost of generation of electricity to meet the Isolated Systems includes costs related to the price of electricity and the related power contracted by distribution agents, to own generation of such agents, including the rental of equipment, electricity imports and related power, including the cost of transmission. It also includes the charges and taxes not recovered, investments made in own generation, the price of electricity services provided in remote regions, including the installation, operation and maintenance of decentralized generation systems with associated networks, and, in addition, the contracting of capacity reserve to ensure the supply of electricity.
Of the verified cost, the CCC will reimburse the difference relating to the average cost of power and electricity traded in the Environment of Regulated Contracting (Ambiente de Contratação Regulada, ACR) of the National Interconnected System (Sistema Interligado Nacional, SIN).
The resources of the CCC derive from the collection of quotas by distribution companies, licensees and transmission companies in the entire country, at the proportion and amounts determined by ANEEL. As of the enactment of Law No. 12.783/12, there is no longer an estimated date for the termination of activities by this Sectorial fund, and its management does not affect the results of the Company.
Following the enactment of Law No. 12,783, Eletrobras has no further obligation to make contributions to the CCC Account. Nevertheless, the CCC Account was not closed. The available balances continue to be distributed to the generation and distribution companies that incur additional costs due to the use of thermal power plants in the event of unfavorable hydrological conditions. To ensure the continued viability of the CCC Account, Law No. 12,783 allows transfers to be made between the Energy Development Account (“CDE”) and CCC Account.
c) Energy Development Account (Conta de Desenvolvimento Energético, CDE)
The Energy Development Account (CDE) is designed to promote the energy development of Brazilian states electricity services universalization projects, a subsidy program for low-income consumers and expansion of the natural gas network to serve states without a pipe network.
Created on April 26, 2002, the CDE has a 25-year duration and is managed by the Company, in compliance with schedule defined by the Ministry of Mines and Energy, not affecting the Company’s results.
F-127
Table of Contents
The CDE is also used to ensure competitiveness of the electricity produced from alternative sources (wind, small hydroelectric power plants and biomass) and domestic coal.
As of the 2013 fiscal year, as a method of lowering electricity bills, this contribution was reduced to 25% of the current rate.
d) PROINFA
Federal Government Program for the development of projects to diversify the Brazilian electricity system and promote alternative sources of electricity, enacted by Law number 10,438 of April, 2002. It is managed by the Company and seeks regional solutions for the use of renewable energy sources.
PROIFA predicts the operation of 144 plants, totalizing 3,299.40 MW of installed capacity. The program’s power plants are responsible for the generation of approximately 12,000 GWh/year – a quantity capable of supplying for approximately 6,9 million households and equivalent to 3.2% of the country’s total annual consumption. The contracted 3,299.40 MW are divided into 1,191.24 MW from 63 Small Water Plants (Pequenas Centrais Hidrelétricas, PCHs), 1,422.92 MW from 54 wind power plants, and 685.24 MW from 27 biomass-based plants. This energy has a guaranteed contract of 20 years with the Company. The operations within the scope of PROINFA do not affect the Company’s result (being the Company responsible for the payment).
e) Financial compensation through the utilization of water resources
The Financial Compensation through the Utilization of Water Resources for the purpose of generating electricity was enacted by the 1988 Federal Constitution and it is a percentage the hydroelectric power concession holders pay for the utilization of water resources. ANEEL manages the collection and distribution of resources among beneficiaries: States, Municipalities and agencies directly managed by the Federal Government.
As per the set forth in Law 8,001, of March 13, 1990, with amendments issued by Laws number 9,433/1997, 9,984/2000 and 9,993/2000, 45% of funds are allocated to the Municipalities encompassed by UHEs reservoirs, while the States are entitled to another 45%. The federal government receives 10% of the total. Generation companies characterized as Small Hydroelectric Power Plants (PCHs), are exempted from paying financial compensation.
The concession holders pay 6.75% of the value of the electricity produced for the purpose of Financial Compensation.
f) Electricity Services Inspection Fee
The Electricity Services Inspection Fee was created by Law number 9,427 of December 26, 1996, and regulated by Decree 2,410 of November 28, 1997, with the purpose of creating revenue for the National Electricity Regulatory Agency to cover its administrative and operational expenses.
F-128
Table of Contents
The TFSEE is equivalent to 0.5% of the economic value added by the concessionaire, licensee or authorized company, including the case of independent production and self-production, in the exploration of electricity services and facilities.
The TFSEE has been due as of January 1, 1997, being annually set by ANEEL and paid in twelve monthly quotas.
NOTE 28 – SHAREHOLDERS’ COMPENSATION
| 12/31/2013 | 12/31/2012 | |||||||
Current | ||||||||
JCP year | 433,960 | 433,962 | ||||||
Unclaimed dividends | 85,522 | 100,826 | ||||||
Dividends Retained previous years | 5,981 | 3,416,545 | ||||||
|
|
|
| |||||
| 525,463 | 3,951,333 | |||||||
I – Relating to the Fiscal Year
The Company’s Bylaws establish as minimum mandatory dividend, 25% of the net income, adjusted in the terms of Brazilian Corporation law, observing the minimum compensation for preferred classes of shares A and B, of 8% and 6%, respectively, of the face value related to these types and classes of shares, including the possibility of an interest payment in respect of the capital.
Based in the doctrinal understanding of the topic, management believes that: (1) due to the existence of reserves of profits that exceeds the absorption of losses for the year, the Company should make the payment of the minimum dividend provided for in Article 8 of the Bylaws relating to shares preferred class “A” and “B” and (2) still maintaining revenue reserves after payment is preferred, provided payment can also be made to the common shares and, therefore, the Company proposes the allocation of dividends to holders of common shares. Management recorded a provision for the obligation associated with dividends on the preferred shares on December 31, 2013.
The Company provided compensation to shareholders in the amount of R$ 433,962 (R$ 433,962 in 2012) in dividends of the fiscal year, according to the statutory dispositions, of which the compensation per share is as follows:
| 12/31/2013 | 12/31/2012 | |||||||||||
Common Shares | 1,72% of Capital | (2012 - 1,72%) | 0.399 | 0.399 | ||||||||
Preferred A | 9,41% of Capital | (2012 - 9,41%) | 2.178 | 2.178 | ||||||||
Preferred B | 7,06% of Capital | (2012 - 7,06%) | 1.634 | 1.634 | ||||||||
Remuneration to shareholders of common shares will be held in the form of JCP in the amount of R$ 433,962 (R$ 433,962 in 2012), attributed to dividends for the year reflected in equity.
According to the current tax legislation, there is Income Tax Withholding (IRRF) over the amount of the compensation proposed to shareholders, for purpose of JCP.
F-129
Table of Contents
There is monetary restatement over the proposed compensation as of January 1, 2014 until the date of the effective commencement of the payment, a date which shall be deliberated by the Annual General meeting, which will examine the Financial Statements and the proposal for the allocation of profits for this fiscal year. There is withholding of income tax over the proportion relating to the monetary correction by the SELIC rate, according to current legislation.
II – Withheld Dividends from Previous Fiscal Years
The Company’s Board of Directors opted, in January 2010, to pay the balance from the Special Reserve of Non-Distributed Dividends, in four annual installments, commencing in the 2010 fiscal year.
The individuals and companies that were part of the Shareholders of the Company on January 29, 2010 were entitled to receive the withheld dividends. In June 2013, they were paid R$ 3,529,932, which constituted the final payment of the retained dividends.
The credits were compensated by the variation of the SELIC Rate, up to the date of the effective payment of each installment, and income taxes are withheld from this compensation, according to current legislation.
III – Expired Dividends
The balance of shareholders’ compensation, set forth in the current liability, contains the installment of R$ 85,522 (R$ 100,826 on December 31, 2012), which concerns unclaimed compensations from the 2010, 2011 and 2012 fiscal years. Compensation relating to the 2009 and earlier fiscal years is expired, according to the terms of the Company’s Bylaws.
NOTE 29 – ACCOUNTS PAYABLE TO BRAZILIAN FEDERAL TREASURY
| CURRENT | NON CURRENT | |||||||||||||||
| 12/31/2013 | 12/31/2012 | 12/31/2013 | 12/31/2012 | |||||||||||||
Acquisition of shares of CEEE-GT and CEEE-D | 34,867 | 122,905 | — | 33,105 | ||||||||||||
Other | 4,627 | 8,142 | — | 3,967 | ||||||||||||
|
|
|
|
|
|
|
| |||||||||
| 39,494 | 131,047 | — | 37,072 | |||||||||||||
|
|
|
|
|
|
|
| |||||||||
NOTE 30 – POST-EMPLOYMENT BENEFITS
30.1 Post-employment benefits
Companies from the Eletrobras System sponsor pension plans for their employees, as well as post-employment life insurance and health care plans in certain cases. Such benefits are classified as defined benefits (BD) and of defined contribution (CD).
F-130
Table of Contents
Due to the decentralized structure of the Eletrobras System, each segment sponsors their own employee benefit package. Overall, the Group offers benefits such as pension, health care and post-employment life insurance to its current and future retirees and their dependents, as set forth in the table below:
Types of post - employment benefits sponsored by the Eletrobras System | ||||||||||
Pension benefits plan | Other post-employment benefits | |||||||||
Company | BD Plan | Saldado Plan | CD Plan | Life Insurance | Health Insurance | |||||
| Eletrobras | X | X | X | |||||||
| Amazonas | X | X | ||||||||
| Boa Vista | X | X | X | |||||||
| Ceal | X | X | X | |||||||
| Cepisa | X | X | ||||||||
| Ceron | X | |||||||||
| CGTEE | X | |||||||||
| Chesf | X | X | X | X | ||||||
| Eletroacre | X | |||||||||
| Eletronorte | X | X | X | X | ||||||
| Eletronuclear | X | X | ||||||||
| Eletrosul | X | X | X | |||||||
| Furnas | X | X | X | X | ||||||
The pension benefit plan typically exposes the Group to actuarial risks, such as investment risk, interest rate risk, longevity risk and earnings risk.
| Investment risk | The present value of the liabilities of the defined benefit plan pension is calculated using a discount rate determined by virtue of the remuneration of corporate bonds of high quality; if the return on plan assets is below this rate, there will be a deficit. Currently, the plan has a relatively balanced investment in shares, debt instruments and real estate. Due to the long-term nature of the liabilities of the plan, the board of the pension fund considers it appropriate that a reasonable portion of plan assets must be invested in stocks and real estate to leverage the return generated by the fund. | |
| Interest rate risk | A reduction in the interest rate of the bonds will increase the liability of the plan. However, this will be partially offset by an increase in the return of assets. | |
| Longevity risk | The present value of the liability for defined benefit plans is calculated by reference to the best estimate of mortality of plan participants during and after their stay at work. An increase in life expectancy of plan participants increases the liability of the plan. | |
| The risk of earnings | The present value of the liability for defined benefit plans is calculated by reference to the future wages of plan participants. Therefore, an increase in the salary of plan participants increases the liability of the plan. | |
F-131
Table of Contents
The following tables present a reconciliation of the present value of the defined benefit obligations and the fair value of the assets with the amounts recorded in the balance sheet for pension benefits and other post-employment benefit amounts. The table below shows the consolidated results of the Eletrobras group. The latest actuarial valuation of the plan and the gift of the defined benefit obligation asset value was held on December 31, 2013.
a) Reconciliation of liabilities of pension plans and other benefits
| Defined benefit pension plans - Amounts recognized in the balance sheet and statement of income | 2013 | 2012 | 2011 * | |||||||||
Present value of partially or entirely covered actuarial liability | 17,196,047 | 21,950,348 | 21,094,165 | |||||||||
Fair value of plan assets (–) | (17,830,733 | ) | (19,719,242 | ) | (22,091,512 | ) | ||||||
Compensation of quotas - CD Plan | — | — | 283,863 | |||||||||
|
|
|
|
|
| |||||||
Liabilities / (assets) | (634,686 | ) | 2,231,106 | (713,484 | ) | |||||||
Restrictive effect over the asset | 1,241,668 | 99,690 | — | |||||||||
Actuarial debt contracted between sponsor and plan | 949,797 | 564,766 | 815,598 | |||||||||
Financial debt contracted between sponsor and plan | 85,903 | 118,759 | 111,006 | |||||||||
|
|
|
|
|
| |||||||
Value of liabilities / (assets) post-employment benefits | 1,123,599 | 2,469,089 | 1,838,409 | |||||||||
|
|
|
|
|
| |||||||
Current service cost | 85,557 | 46,520 | (82,182 | ) | ||||||||
Cost of interest | 195,397 | (164,519 | ) | (328,099 | ) | |||||||
|
|
|
|
|
| |||||||
Actuarial expense / (income) recognized in the fiscal year | 280,954 | (117,999 | ) | (410,281 | ) | |||||||
|
|
|
|
|
| |||||||
| * | We have not restated data for 2011 to reflect the application of IFRS 11. |
| Other post-employment benefits - Amounts recognized in the balance sheet and statement of income | 2013 | 2012 | 2011 * | |||||||||
Present value of partially or entirely covered actuarial liability | 360,173 | 433,695 | 869,525 | |||||||||
Fair value of plan assets (–) | — | — | — | |||||||||
|
|
|
|
|
| |||||||
Liabilities / (assets) | 360,173 | 433,695 | 869,525 | |||||||||
|
|
|
|
|
| |||||||
Value of liabilities / (assets) other post-employment benefits | 360,173 | 433,695 | 869,525 | |||||||||
|
|
|
|
|
| |||||||
Current service cost | — | 2,188 | 64,433 | |||||||||
Cost of interest | 36,383 | 32,177 | 65,865 | |||||||||
|
|
|
|
|
| |||||||
Actuarial expense / (income) recognized in the fiscal year | 36,383 | 34,365 | 130,298 | |||||||||
|
|
|
|
|
| |||||||
| * | We have not restated data for 2011 to reflect the application of IFRS 11. |
F-132
Table of Contents
b) Disclosure of Defined Benefit Pension
Consolidated results of defined benefit pension - Reconciliation of present value of defined benefit obligations:
| Table b.1 - defined benefit pension plans - Change in the present value of actuarial liabilities | 2013 | 2012 | 2011 * | |||||||||
Value of actuarial liabilities at beginning of year | 21,950,348 | 15,157,883 | 18,435,641 | |||||||||
Current service cost | 202,756 | 139,748 | 235,694 | |||||||||
Interest on actuarial liabilities | 1,853,540 | 1,488,976 | 1,788,036 | |||||||||
Benefits paid during the year (–) | (1,064,025 | ) | (975,276 | ) | (1,025,614 | ) | ||||||
Compensation of quotas - CD Plan | — | — | 602,934 | |||||||||
(Gain) / loss on actuarial liabilities arising from remeasurement | (5,746,572 | ) | 6,139,017 | 1,057,474 | ||||||||
Actuarial (gains) losses arising from changes in demographic assumptions | — | |||||||||||
Actuarial (gains) losses arising from changes in financial assumptions | (6,425,397 | ) | ||||||||||
Actuarial (gains) losses arising from experience adjustments | 678,825 | |||||||||||
|
|
|
|
|
| |||||||
Present value of actuarial liabilities at year end | 17,196,047 | 21,950,348 | 21,094,165 | |||||||||
|
|
|
|
|
| |||||||
| * | We have not restated data for 2011 to reflect the application of IFRS 11. |
Consolidated results of defined benefit pension - Reconciliation of fair value of plan assets:
| Table b.2 - defined benefit pension plans - Moving and composition of the fair value of assets | 2013 | 2012 | 2011 * | |||||||||
Fair value of assets at beginning of year | 19,719,242 | 16,445,066 | 20,382,068 | |||||||||
Benefits paid during the year (–) | (1,064,025 | ) | (975,276 | ) | (1,025,614 | ) | ||||||
Participant contribution paid during the year | 124,186 | 120,955 | 303,565 | |||||||||
Employer contribution paid during the year | 169,033 | 205,632 | 360,790 | |||||||||
Compensation of quotas - CD Plan | — | — | 230,205 | |||||||||
Expected return on assets in the year | 1,666,501 | 1,653,495 | 2,114,589 | |||||||||
Gain / (loss) over the plan assets (excluding interest income) | (2,784,204 | ) | 2,269,370 | (274,092 | ) | |||||||
|
|
|
|
|
| |||||||
Fair value of assets at end of year | 17,830,733 | 19,719,242 | 22,091,511 | |||||||||
|
|
|
|
|
| |||||||
|
|
|
|
|
| |||||||
Actual return on assets in the year | (1,117,703 | ) | 3,922,865 | 1,842,043 | ||||||||
|
|
|
|
|
| |||||||
| * | We have not restated data for 2011 to reflect the application of IFRS 11. |
Consolidated results of defined pension benefits - Amounts recognized in Other Comprehensive Income:
| 2013 | 2012 | 2011 * | ||||||||||
Other Comprehensive Income (OCI) Accumulated Pension Benefits Plan | 646,897 | 2,620,423 | 1,373,860 | |||||||||
| 2013 | 2012 | 2011 | ||||||||||
Gains (losses) recognized in OCI for the year - Pension Benefits Plan | 811,935 | (1,472,750 | ) | (702,021 | ) | |||||||
| * | We have not restated data for 2011 to reflect the application of IFRS 11. |
F-133
Table of Contents
c) Disclosure of Other Post-Employment Benefits
Consolidated results of other post-employment benefits - reconciliation of the present value of defined benefit obligations:
| Table C.1 - Other post-employment benefits - Changes in the present value of actuarial liabilities | 2013 | 2012 | 2011 * | |||||||||
Value of actuarial liabilities at beginning of year | 433,695 | 306,866 | 741,116 | |||||||||
Current service cost | — | 2,188 | 64,433 | |||||||||
Interest on actuarial liabilities | 36,383 | 32,177 | 65,865 | |||||||||
Benefits paid during the year | (10,197 | ) | (10,424 | ) | (58,226 | ) | ||||||
(Gain) / loss on actuarial liabilities arising from remeasurement | (99,708 | ) | 102,888 | 56,337 | ||||||||
Actuarial (gains) losses arising from changes in demographic assumptions | — | |||||||||||
Actuarial (gains) losses arising from changes in financial assumptions | (179,178 | ) | ||||||||||
Actuarial (gains) losses arising from experience adjustments | 79,470 | |||||||||||
|
|
|
|
|
| |||||||
Present value of actuarial liabilities at year end | 360,173 | 433,695 | 869,525 | |||||||||
|
|
|
|
|
| |||||||
| * | We have not restated data for 2011 to reflect the application of IFRS 11. |
F-134
Table of Contents
Consolidated results of other post-employment benefits - Amounts recognized in Other Comprehensive Income:
| 2013 | 2012 | 2011 * | ||||||||||
Other Comprehensive Income (OCI) - accumulated Other post-employment benefits plan | 218,196 | 317,904 | 672,177 | |||||||||
| 2013 | 2012 | 2012 | ||||||||||
Gains (losses) recognized in OCI for the year - Other post-employment benefits plan | 99,708 | (91,717 | ) | (56,337 | ) | |||||||
| * | We have not restated data for 2011 to reflect the application of IFRS 11. |
d) Actuarial Assumptions
The actuarial assumptions presented below were used in determining the defined benefit obligation and expense.
Economic assumptions | ||||||
| 2013 | 2012 | 2011 | ||||
Interest rate of annual actuarial discount (i) | 11.98% to 12.11% | 8.24% to 8.79% | 10.12% to 10.36% | |||
Real interest rate of annual actuarial discount | 6.34% to 6.47% | 3.20% to 3.72% | 5.38% to 5.61% | |||
Projected average increase in wages | 7.41% | 6.99% | 6.50% | |||
Projected average increase in benefits | 5.30% | 4.89% | 4.50% | |||
Annual real rate of evolution medical costs | 3.50% | 3.50% | 3.50% | |||
Average annual inflation rate | 5.30% | 4.89% | 4.50% | |||
Expected return on plan assets (ii) | 11.98% a 12.11% | 8.24% to 8.79% | 10.1% to 10.4% | |||
Demographic Hypotheses | ||||||
| 2013 | 2012 | 2011 | ||||
Turnover rate | 0.00% | 0.00% | 0.00% | |||
Mortality rate of assets and liabilities | AT-2000 | AT-2000 | AT-2000 | |||
Mortality rate of disabled people | AT-83 | AT-83 | AT-83 | |||
Disabled rate | Light weak | Light weak | Light weak | |||
% Married on the date of retirement | 95% | 95% | 95% | |||
Age difference between men and women | 4 years | 4 years | 4 years | |||
(i) Long term interest rate
(ii) Represents the maximum and minimum rates of return over plan assets.
The definition of this rate took into consideration the market practice for Federal Government bonds, according to the criteria recommended by national and international regulations, for terms similar to those of the flow of liabilities in the benefit program, in what is known as the Duration concept. In 2013, there was an increase of approximately 44% in the discount rate used by the Company, resulting in a significant decrease in the actuarial obligation.
The expected global return rate corresponds to the average calculated based on the expected return from the several asset categories of the plan. The assessment of expected return performed by the Company Management is based on historical trends of returns and forecasts by market analysts for the assets, during the existence of such obligation. The current return over assets of the BD plan was R$ (1,117,703) (R$ 3,922,865 in 2012).
F-135
Table of Contents
e) Employer contributions
On December 31, 2013, the contributions made by the Company, to establish mathematical provisions of benefits for the CD Plan, reached R$ 178,594 (12.31.2012 - R$ 172,006).
On December 31, 2013, the contributions made by the Company, to establish mathematical provisions of benefits for the BD Plan, reached R$ 169,033 (12.31.2012 - R$ 205,632).
The Company expects to contribute with R$ 182,232 for the defined benefit plan during the next fiscal year.
The weighted average duration of the defined benefit obligation and health benefit bonds is 7.84 years.
Analysis of expected maturities of undiscounted benefits of defined benefits plans:
| As of december 31, 2013 | Less than 1 year | Between 1-2 years | Between 2-5 years | More than 5 years | Total | |||||||||||||||
Benefits Plan | 1,367,068 | 1,404,173 | 4,248,376 | 30,964,183 | 36,538,631 | |||||||||||||||
f) The significant actuarial assumptions to determine the defined obligation are: discount rate, medical cost, expected salary increase cost and mortality. The sensitivity analyzis below have been determined based on reasonably possible changes of their factors at the end of the reporting period, keeping all other assumptions.
| • | If the discount rate was 0.25% higher (lower), the defined benefit obligation would decrease by R$ 398,210 (increase by R$ 413,379). |
| • | If the medical costs were 0.25 higher (lower), the defined benefit obligation would increase by R$ 55,562 (decrease by R$ 45,311). |
| • | If life expectancy increases (decreases) in one year for men and women, the defined benefit obligation would increase by R$ 294,232 (decrease by R$ 313,104). |
The sensitivity analysis presented may not be representative of the actual change in the defined benefit obligation, since it is unlikely that the change would occur in isolated factors, considering that some of the assumptions may be correlated.
In addition, the present value of the defined benefit obligation used in the sensitivity analysis was calculated by the projected unit credit method at the end of the reporting period, which is the same method used in calculating the liabilities of the defined benefit obligation in the balance sheet.
There was no change from previous years in the methods and assumptions used in preparing the sensitivity analysis.
F-136
Table of Contents
g) The amounts included in the fair value of plan assets
Category of Assets | 2013 | 2012 | ||||||
Deposits of Private Credit | 399,664 | — | ||||||
Investments in Government Securities | 2,960,634 | 3,315,115 | ||||||
Investments in Fixed Income | 9,053,898 | 734,718 | ||||||
Investments in Equities | 2,694,357 | 11,938,100 | ||||||
Investing in Stocks | 237,840 | 612,075 | ||||||
Investing in Funds | 1,648,393 | 1,912,338 | ||||||
Real Estate Investments | 626,974 | 623,351 | ||||||
Structured investments | 61,751 | — | ||||||
Loans and Financing | 591,676 | 577,672 | ||||||
Other | 622,179 | 76,182 | ||||||
Resources to receive Sponsor | (93,809 | ) | 2,907 | |||||
(–) Pension Liabilities | (317,779 | ) | (71,870 | ) | ||||
(–) Contingent Liabilities | (436,778 | ) | — | |||||
(–) Administrative Fund | (140,153 | ) | — | |||||
(–) Investment Funds | (78,114 | ) | (1,347 | ) | ||||
|
|
|
| |||||
| 17,830,733 | 19,719,242 | |||||||
|
|
|
| |||||
The fair value of equity instruments and debt securities are determined based on quoted market prices in active markets but investment property fair values are not based on quoted market prices in active markets.
30.2 Voluntary Redundancy Plan (PID)
In June 2013, the Company (except Electronuclear), implemented the Voluntary Redundancy Plan, due to the restructuring of the corporate, organizational, governance and management of Eletrobras System’s business model. Permanent employees who have at least 20 years of effective employment, and INSS retirees regardless of time of employment, are eligible for the Voluntary Redundancy Plan.
The application process for the Voluntary Redundancy Plan was open from June 10 to July 31, 2013; 4,055 applications were received. The plan is divided into two stages: a) step 1 - redundancies between July 2013 and December 2013, and b) step 2 – redundancies between January 2014 and November 2014.
Expenses for the Voluntary Redundancy Plan include financial incentives and a health plan, for a maximum of sixty (60) months for redundancies in 2013, and twelve (12) months for redundancies in 2014, from the date of their dismissal.
In connection with the stated above, the Company recorded an expense provision in the year in the amount of R$ 1,725,570.
F-137
Table of Contents
Results with P I D - December 2013 | ||||||||||||
Company | Personnel expenses (Off) | PID Provision (Assets) | Total | |||||||||
Eletrobras | 88,036 | 12,674 | 100,710 | |||||||||
Furnas | 267,702 | 20,454 | 288,155 | |||||||||
Chesf | 630,841 | 168,049 | 798,890 | |||||||||
Eletrosul | 60,548 | 13,147 | 73,695 | |||||||||
Eletronorte | 194,512 | 19,510 | 214,022 | |||||||||
CGTEE | 27,413 | 5,025 | 32,438 | |||||||||
ED Alagoas | 70,140 | 4,392 | 74,532 | |||||||||
ED Rondônia | 17,875 | 5,945 | 23,820 | |||||||||
ED Piauí | 69,440 | 4,296 | 73,736 | |||||||||
ED Acre | 14,600 | — | 14,600 | |||||||||
ED Roraima | 5,078 | — | 5,078 | |||||||||
Amazonas Energia | 22,525 | 3,369 | 25,894 | |||||||||
|
|
|
|
|
| |||||||
| 1,468,710 | 256,860 | 1,725,570 | ||||||||||
The value of the Voluntary Redundancy Plan is shown under the heading of personnel see note 41.
NOTE 31 – PROVISION FOR CONTINGENCIES
The Company and its subsidiaries are parties involved in several ongoing cases in the court system, especially labor and civil, which are in several different stages of the legal process.
The Company’s Management adopted the procedure that classifies the lawsuits filed against the Company according to the risk of loss, based on the opinion of its legal consultants, as follows:
| • | For cases in which a unfavorable ruling against the Company is considered probable, provisions are established; |
| • | For cases in which a unfavorable ruling against the Company is considered possible, no provisions are established and corresponding information is released in Explanatory Notes, when relevant; and |
| • | For cases in which a unfavorable ruling against the Company is considered unlikely, no provisions are established and only information which, at the discretion of the Management, is deemed relevant for the full understanding of the Financial Statements, shall be released in Explanatory Notes. |
Therefore, to face occasional losses, provisions are made for contingencies, judged by the administration of the Company and its subsidiaries, supported by its legal consultants, in the amounts deemed as sufficient to cover occasional losses in lawsuits.
F-138
Table of Contents
As of the date of this Financial Statement, the Company has the following contingencies for liabilities, by nature, considered by management as being a probable future disbursement:
| 12/31/2013 | 12/31/2012 | |||||||
CURRENT | ||||||||
Labor | 8,786 | 2,652 | ||||||
Tax | — | — | ||||||
Civil | 14,868 | 26,043 | ||||||
|
|
|
| |||||
| 23,654 | 28,695 | |||||||
|
|
|
| |||||
NON CURRENT | ||||||||
Labor | 912,564 | 1,026,545 | ||||||
Tax | 295,494 | 465,100 | ||||||
Civil | 4,487,045 | 3,608,744 | ||||||
|
|
|
| |||||
| 5,695,103 | 5,100,389 | |||||||
|
|
|
| |||||
|
|
|
| |||||
| 5,718,757 | 5,129,084 | |||||||
|
|
|
| |||||
These provisions have been subject to the following changes in this fiscal year:
Balance at 12/31/2012 | 5,129,084 | |||
|
| |||
Provisions of the additions | 2,833,263 | |||
Reversal of provisions | (1,072,820 | ) | ||
Losses | (250,767 | ) | ||
Payments | (920,003 | ) | ||
|
| |||
Balance at 12/31/2013 | 5,718,757 | |||
|
| |||
The most significant reversals of provisions in the period were:
| i. | R$ 322,826 related to two assessment notices from the IRS due to REFIS, R$ 175,005 related to the reversal of civil proceedings and other changes due to the likely outcome. |
| ii. | R$ 87,000 related civil action resulting from right to resettlement of rural workers affected by the construction of HPP Itaparica. |
a) Major lawsuits filed against the Company and its subsidiaries with high probability of loss:
a.1) Civil lawsuits
Civil lawsuits against the parent company have the objective of applying monetary correction criteria over Compulsory Loan book-entry credits, established as of 1978.
The plaintiffs have the objective of challenging the system of calculation of monetary correction determined by the legislation that governs the Compulsory Loan and is applied by the Company. The credits have been fully settled by the Company by means of conversion into shares, using the current legislation as a basis for correction.
F-139
Table of Contents
In the year 2013 the Company reassessed its discretionary amount of provisions for the lawsuits in respect of the Compulsory Loan and therefore this exercise complemented the provision of R$ 750,000.00.
Currently there are 2,357 lawsuits relating to this matter in several court levels. The Company maintains a provision for these civil contingencies, in the parent company, in the amount of R$ 2,367,947 (December 31, 2012 - R$ 1,085,127) for such claims.
These lawsuits are not to be mistaken for the filings, which intend to redeem the Bearer Bonds, currently unenforceable, issued as a result of the Compulsory Loan.
2) The Company is the plaintiff in a lawsuit in which it requests the partial annulment of an amendment (relating to the K Factor of the analytical price correction) to the contract of construction of Hydroelectric Power Plant Xingó, signed with the Consortium, formed by Companhia Brasileira de Projetos e Obras – CBPO, CONSTRAN S.A. – Construções e Comércio e Mendes Júnior Engenharia S.A., and the return of payments made for K Factor in the approximate amount of R$ 700 milhões (amounts of the time converted into reais).
The court of the State of Pernambuco judged the claim filed by the Company as groundless and the response presented by the defendants as grounded.
The Company and the Federal Government, the Company’s assistant in this lawsuit, filed special and extraordinary appeals to the Supreme Court of Justice. The high court, in August 2010, accepted one of these appeals by the Company, reducing the value of the lawsuit, which creates a substantial reduction in fees paid in the principal action. The same STJ denied the remaining appeals filed by the Company and the federal government, maintaining, therefore, the decision by the court of the State of Pernambuco, who ruled groundless the action filed by the Company and ruled grounded the response presented by the defendants, which led to the presentation by the Company of motion to clarify. The motion to clarify began hearings in December 2012 and concluded in December 2013, with the case being dismissed (on 12/31/2013, the judgment was still pending publication to the parties).
In parallel, and since the completion of the procedure in the lower courts, the defendants are taking, before the lower courts of the Judiciary of the State of Pernambuco, several actions to obtain the amount pleaded in the counterclaim.
In August 2013 the defendants commenced an action before the 12th Civil Court of Recife - PE to obtain provisional amounts ??that, according to the defendant’s own calculations, correspond to the updated amount approved in their favor by TJPE. In this case, CHESF was ordered to repay the amounts, but presented an “exception for pre-execution” (pointing out, as stated in case law of the Supreme Court, several procedural irregularities at the outset - without prejudice to other topics of dispute including the calculations of the as pronounced by TJPE - the continuation of this provisional enforceable claim): after presentation of the defendant’s answer and reply, CHESF on 12/31/2013 awaits judgment in respect of the said “exception”.
F-140
Table of Contents
The Management, based on the opinion of its legal consultants and on calculations that took into consideration the suspension of the payment of installments related to K Factor and its respective monetary adjustments, maintains a provision, in the Non-Current Liability, of R$ 786,515 as of December 31, 2013 (December 31, 2012 – R$ 723,256), in order to face occasional losses resulting from this matter.
3) Claim for Indemnification for 14,400 acres of land in the Aldeia Farm, filed with the court circuit of Sento Sé (BA), by the Estate of Anderson Moura de Souza and his wife. The judgment in the first court ruled the claim grounded, ordering CHESF to pay the amount of R$50,000, corresponding to the principal plus interest and monetary restatement. CHESF appealed to the Court of the State of Bahia and the process has been transferred to the Federal Justice due to intervention of the federal government in the assistant capacity. As of December 31, 2013, there has been no relevant change in the process, with the rescissory action still pending judgment. CHESF’s Management, based on the opinion of its legal consultants, understands the loss is probable in this case and therefore has recorded in its non-current liabilities a provision in the amount of R$ 100,000 (December 31, 2012 – R$ 100,000).
4) Compensation action promoted by Indústrias Reunidas Raimundo of Fonte S/A (Vitivinicola Santa Maria S.A.), due to damage caused by the flood in 1992 of the San Francisco River. The judgment, res judicata, determined the provisional settlement, leaving to the experts the definition of the damages and loss of profits. It just appointed an agronomist expert, which had jurisdiction for calculating damages, but not profit. The award was contested by CHESF, which asked the 1st Civil Court to order an accounting audit in order to reach an amount, even if approximate, of loss and profits, considering the activity developed by the judgment creditor. The application was refused, and an interlocutory appeal was filed, which upheld the first refusal. A special appeal (which had its processing denied by TJPE) and an Interlocutory Appeal (AREsp 377 209 - PE), 12/31 / 2013 was still pending in consideration of the admissibility of the Minister rapporteur. CHESF has a provision of R$ 57,651, to cover possible losses arising from the issue, noting that the actual damages have already been paid and the lawsuit is restricted solely to the ability of the expert to determine the loss of profits.
5) Several civil actions for indemnification of financial losses, due to delays in payments to suppliers and expropriations of areas flooded by reservoirs of Hydroelectric Power Plants. The Management of Eletronorte, based on the opinion of its legal consultants, has recorded in its non-current liabilities a provision in the amount of R$ 470,986 (December 31, 2012 – R$ 608,320) for the claims in which the loss is considered probable. In the first quarter of 2013 there was no payment of the civil provision regarding the finalization of the process of Sondotécnica, in the amount of R$ 164,000.
a.2) Labor
1) Several cases filed, in which the claim is for hazard pay, in the understanding that the total and not proportional percentage must be paid to all employees who perform roles in activities subject to electricity risk. The Management of Furnas, based on the opinion of its legal consultants, has recorded in its non-current liabilities a provision in the amount of R$ 344,481 (December 31, 2012 – R$ 231,054) for the processes in which the loss is considered probable.
F-141
Table of Contents
2) Several labor lawsuits, the majority of which derive from lawsuits relating to hazard pay, the Bresser Plan, overtime pay, calculations of FGTS severance pay and alignment of the wage curve. The amount estimated for probable loss is of R$ 69,117 (December 31, 2012 – R$ 312,953). In April 2013, the amount of R$ 240,000 was transferred to the accounts of other liabilities of Electronorte, referring to the completion of the process of the wage curve, pursuant the Eletronorte agreement between the workers union regarding payment during the year. Of this amount, Eletronorte made ??a payment of R$ 203,337 to date, leaving the balance of R$ 36,663 payable in the following year.
3) The Alagoas State Urban Industries Workers Union, in its representative role , filed a labor claim for the Company’s employees, seeking the payment of supposed salary discrepancies resulting from the implementation of the said “Bresser Plan” (Decree-Law number 2,335/87).
The claim was supported by the Illustrious Second Board of Conciliation and Judgment of Maceió-AL, a decision which has been confirmed by the Regional Labor Court of the 19th District, and has been held final.
However, at the time of judgment, the understanding of the 2nd Labor Court of Maceió was that there should be no limitations to the reference date of the category, which would constitute an extraordinary burden.
Therefore the risk of loss is considered probable as to the assessment of loss limited to the reference date, since the judgment of the limitations to the date of the category shall not affect the original judgment’s finding of liability.
According to OJ/TST (SDI i) Number 262, there is no reference to “the matter under judgment, the limitation of the reference date for the category, for the judgment for payment of salary discrepancies resulting from economic plans”.
The payment of salary discrepancies was limited to the reference date through Pronouncement 322 of the TST, which sets forth that wage adjustments resulting from the so called “triggers” and URPs, legally predicted as advances, are due only up to the reference date of each category.
It important to highlight that among applicable judicial actions, embargos to the execution have been filed, which would allow the evaluation of the limitation of calculations to the reference date of the category, a procedure also adopted by the Federal Attorney’s Office.
In addition, the union has joined the process in the capacity of assistant, which reinforces the Company’s defense in the quest to obtain the limitation of the reference date, as well as the decision dated March 15, 2011 by the TRT of the 19th District, process number 251900.68.5.19.1989.0002, of the Water Supply and Sanitation Company of Alagoas (Companhia de Abastecimento de Águas e Saneamento de Alagoas, CASAL), in which there was limitation of the reference date. CEAL has recorded provisions for contingencies relating to this matter in the amount of R$ 4,502 (December 31 of 2012 – R$ 3.583).
F-142
Table of Contents
The lawsuit is in its first phase of execution, with official approval of the calculations by the first degree court in the amount of R$ 722,000. The calculations have been challenged by Ceal with the presentation of two options: one restricted to the date and the other contesting the amounts presented by the Union, without the limitation of the date.
4) Lawsuits involving The Company are composed mostly of actions related to dangerousness; overtime, supplemental retirement; salary equalization, functional framework and severance payments resulting from defaults by subcontractors. The Company has a provision for contingencies in relation to this matter in the amount of R$ 162,783 (December 31, 2012 - R$ 127,521).
a.3) Tax
1) The main lawsuit filed refers to the notices of deficiency issued against Furnas on May 3, 2001, relating to Finsocial, Cofins and Pasep, deriving from exclusions in the calculations, especially the transfer and transportation of electricity from Itaipu, for a period of ten years. Based on the latest decisions of the Federal Revenue Service is on December 31, 2012, provision for tax has been made in the amount of R$ 246,204.
The company filed a special appeal against the judgment which upheld the launches, but which has a remote chance of success at the administrative level in light of recent decisions on the subject.
In view of the recent decisions on the subject, in December 2013, the subsidiary reclassified the provision for taxes recoverable, with a current total of R$ 322,826, due to its entry into the Tax Recovery Program - Refis (Law No. 12,865/2013) for the discharge of debt in 180 months.
b) Lawsuits filed against the Company and its subsidiaries considered of possible loss, not provisioned.
For all major processes described below, administrations of those Subsidiaries and the Company, based on the opinion of its legal advisors consider that the probability of loss is possible without the need for recording provision.
b.1) Civil
The value of possible cases against the parent company is substantially comprised by those relating to the Compulsory Loan, of which claims are not contained in the judicial decision from August of 2009. The description of the nature of the Compulsory Loan is found in Note 24. In December 2013 the value of the possible causes relating to compulsory loan was R$ 5,904,864 (December 31, 2012 - R$ 6,594,327).
F-143
Table of Contents
1) Indemnification lawsuit filed by the Consortium formed by the companies CBPO, CONSTRAN and Mendes Júnior, in which it is requested the company be ordered to pay additional financial compensation, due to the delay in the payment of invoices of the contract relating to the Xingó Hydroelectric Plant. The claim has been found grounded, and The Company has been ordered to pay the plaintiffs the amount of R$ 23,766, at prices of September 2004 (R$ 51,568, according to the calculations of The Company, as of March 31, 2010). The Company has appealed the decision, to be judged in the Pernambuco Court of Justice, but due to intervention by the federal government, the process has been forwarded to the Federal Justice, where it currently remains.
2) Public Civil case filed against the Company by the Community Association of the Cabeço Village and Adjacencies, in the State of Sergipe, in the amount of R$ 368,548 with the object of obtaining financial compensation due to alleged environmental damages caused to fishermen by the construction of UHE Xingó. A hearing was held on 11/27/2013 in which the work plans of the teams performing the expert report were approved, and which also set a monthly deposit to paid by The Company to pay expenses of the teams in the amount R$ 100, starting in December 2013 and ending in May 2015. It was also recorded that both processes will remain active until the final investigation report is submitted (position as of 31/12/2013). Supported by the The Company’s lawyers, the Management expects that the loss of these lawsuits is possible.
3) Lawsuit filed by AES Sul Distribuidora Gaúcha de Energia, seeking the liquidation of the amount of R$ 110,000 by ANEEL for market transactions, related to profit verified due to non-option of relief (insurance) made in December 2000. The Company has joined the process in the capacity of necessary liable co-plaintiff and has contested the case.
4) Declaratory action with claim for indemnification by Carbomil Química S.A., seeking indemnification for the installation of an electricity transmission line in the area of the Lajedo do Mel mine, located in the municipalities of Jaguaruana and Quixeré, in the State of Ceará, and Baraúna, in the state of Rio Grande do Norte. The estimated amount for such is of R$ 70,000. On 15/10/2013, the judgment of the 15th VF/EC issued a favorable ruling to The Company and ordered Carbomil Química S.A. to pay attorney fees to the order of 10% on the amount in dispute. The plaintiff appealed, which was answered by The Company and the claim was remitted to TRF 5th Region (31/12/2013).
5) Civil Action filed by the Public Ministry of Pernambuco, resulting from the resettlement of rural workers affected by the construction of the Itaparica HPP (HPP Luiz Gonzaga). The plaintiff claims the agreement signed by the Union of Rural Workers on December 6, 1986 is void for lack of legitimacy, and has requested the difference of sums of temporary maintenance paid during the period, giving the issue the updated value of approximately R$ 87,000. The case is in Superior Court of Justice - STJ.
On 11/10/2013, a judgment was delivered upholding the RESP, due to the statute of limitations. An Appeal was filed on 10/23/2013 by the MPF, and as of 31/12/2013, was still pending decision.
Indemnity action brought by Hidroservice, which is being heard in 2nd VF -PE, with the objective of the cancellation of the securitization agreement, with compensation for the electricity sector discount on trading securities received in bank interest. The value assigned to the case was R$ 250,000 (historical), being estimated at R$ 598,500. On appeal, the
F-144
Table of Contents
action was dismissed. A Motion for Clarification was heard on 11/26/2013 in respect of a clerical error pointed out by The Company and dismissed both the parties’ claims. A presentation of the RESP and RE Hidroservice resources was made. As of 31/12/2013, The Company was awaiting a summons to provide a counter argument to this presentation.
6) Indemnity action: reimbursement of amounts paid to the company Albrás Aluminum Brasileiro S.A. by virtue of obligations under insurance contracts with these companies, amounting to R$ 217,066 (2012 - R$ 214,376).
7) Indemnity action brought by Tibagiana Mining Ltda. in which Consórcio Energético Cruzeiro do Sul is a party to the action. The Company holds 49% interest in the amount of R$ 677,042, or R$ 331,751.
b.2) Tax
1) Case No. 16682.720.517/2011-98 at the administrative level, referring to the tax assessment notice issued by the Federal Revenue of Brazil (RFB) pursuant to tax procedure to check the calculation of income tax and social contribution in the calendar year 2007, particularly with respect the values considered in respect of: reduction of net revenue; depreciation expenses, and other operating expenses. Value at December 31, 2013: R$ 1,010,335 thousand.
2) Case No. 16682.720.516/2011-43 at the administrative level, referring to the tax assessment notice issued by the RFB pursuant to tax procedure to check for possible failure of payment or statement of contributions to PIS/COFINS and Pasep during the period Oct 2006 to Dec 2009. Value at December 31, 2013: R$ 953,985 thousand.
3) Case No. 16682.720.878/2013-04 at the administrative level, referring to the tax assessment notice issued by the RFB pursuant to tax procedure that verified the use of spending taken in 2000 (due to the assumption of debt of the Royal Greatness Foundation) as losses recorded in fiscal 2009 and therefore compensated for the calendar years 2009, 2010 and 2011. The Tax Office states that this record was made in the wrong way, considering that such expenditure should have been accounted for in the period of its jurisdiction in 2000 rather than being deducted in the calendar year 2011. Value at December 31, 2013: R$ 593,014 thousand.
4) Process Action No. 16682.720.331/2012-10 at the administrative level, referring to the tax assessment notice issued by the RFB in relation to the negative balances of income tax and social contribution calculated at the end of the calendar year 2009, by an offsetting procedure considered irregular by the Supervisory Auditor since Furnas did not contact the IRS to enforce the DCOMP compensation. Value at December 31, 2013: R$ 437,884 thousand.
F-145
Table of Contents
5) Lawsuits against The Company are mainly tax cases at the administrative level, especially among the main Secretariat of Finance of the Amazon State - SEFAZ with eight lawsuits, totaling R$ 1,360,636 by the value of ICMS credits granted by the company over several years, whose actual cost was not supported by the Company, by reason of the subsidies received from the CCC, and other ICMS credits no longer reversed by the Company, because of technical and commercial losses in the distribution of electricity. A significant reduction in potential tax cases was due to several actions that were classified as possible, with the most relevant values totaling approximately R$ 2,057,409, which had their final judgments in favor of the Company (the actions were dismissed and therefore archived). Moreover, two similar cases to those which had been judged in favor of the dealership, in the amount of R$ 1,069,814 related to ICMS processes, which have not yet been tried, were reclassified from “possible” to “remote”.
c) Procedures for risk of remote disbursement not provided
1) An ongoing lawsuit was filed by Construtora Mendes Júnior S.A., hired for the construction of Itaparica Hydroelectric Power Plant, for alleged financial losses resulting in the delay in payments of invoices by the Company. The action is considered by the Company’s management, supported by its legal consultants, as an unlikely loss.
In this case, Construtora Mendes Júnior S.A. obtained judgment from the 4th Civil Court, subsequently overturned, which ordered The Company to pay the amount which, including legal fees and monetary correction up to the month of August 1996, calculated through criteria determined by the court, would be of approximately R$ 7,000,000, and the amount has not been updated since then. The Federal Prosecution Office filed a request to void the entire process and requested the action to be ruled groundless, including the merits. Construtora Mendes Junior S.A appealed to the Supreme Court of Justice – ARESP, and on December 31, 2012, the Federal Prosecution Office issued an opinion denying the appeals. The case is awaiting judgment of the STJ.
NOTE 32 – ASSET DECOMMISSION OBLIGATION
The Company recognizes liabilities for the decommissioning of the thermonuclear power plants, which comprise the program of activities required by the Brazilian Commission of Nuclear Energy (Comissão Nacional de Energia Nuclear, CNEN), to safely dismantle the nuclear facilities with minimum impact on the environment, at the end of their operating cycle.
Given the specific operation and maintenance characteristics of the thermonuclear power plants, whenever there are changes in the estimated cost for decommissioning, resulting from new studies due to technological advances, the decommissioning quotas must be altered, so as to adjust the liability balance to the new reality.
F-146
Table of Contents
The liability balance, recorded at present value as of December 31, 2013 is of R$ 1,136,342 (December 31, 2012 - R$ 988,490).
Balance liability, present value on 12/31/2012 | 988,490 | |||
Adjusted Present Value / Exchange Variation in the period | 147,852 | |||
|
| |||
Balance liabilities, present value, on 31/12/2013 | 1,136,342 | |||
|
|
NOTE 33 – CONCESSIONS PAYABLE – USE OF PUBLIC ASSET
The Company has entered into onerous concession contracts with the federal government for the use of public assets for the generation of electricity, substantially in projects through Special Purpose Entities (Sociedades de Propósito Específico, SPEs). The characteristics of the business and contracts demonstrate the ability and intentions of the parties to execute them in full.
Seeking to adequately reflect, in the balance sheet, the onerous concession granted and the respective obligations to the federal government, the hydroelectric power plants concessions have been recorded in intangible assets against liabilities.
The values set forth in concession contracts are at future prices and, therefore, the Company has adjusted these liabilities at the present value.
The update of liability due to the discount rate and monetary variation has been capitalized in the assets during the construction of the power plants and, as of the date the operation commenced, is directly recognized in the results.
The Company adopts, as an accounting policy, the recognition of the liability on the date the environmental license for installation (LI) was granted.
UBP payments are made in monthly installments as of the commencement of commercial operation until the end of the concession term, and are composed as set forth below:
| Current | ||||||||
| 12/31/2013 | 12/31/2012 | |||||||
Passo São João | 302 | 285 | ||||||
São Domingos | 771 | 731 | ||||||
Mauá | 904 | 854 | ||||||
Batalha e Simplicio | 1,590 | — | ||||||
|
|
|
| |||||
Total | 3,567 | 1,870 | ||||||
|
|
|
| |||||
| Non Current | ||||||||
| 12/31/2013 | 12/31/2012 | |||||||
Passo São João | 3,538 | 4,122 | ||||||
Mauá | 10,739 | 12,547 | ||||||
São Domingos | 8,537 | 9,838 | ||||||
Batalha e Simplicio | 38,090 | 44,673 | ||||||
|
|
|
| |||||
Total | 60,904 | 71,180 | ||||||
|
|
|
| |||||
F-147
Table of Contents
| Original Nominal Values | Updated Values | |||||||||||||||||||
| UHE | Years | Annual Payment | Total Payment | Annual Payment | Total Payment | |||||||||||||||
Passo São João | 29 | 200 | 5,867 | 301 | 8,831 | |||||||||||||||
Mauá | 30 | 618 | 18,386 | 904 | 26,758 | |||||||||||||||
São Domingos | 26 | 260 | 6,717 | 771 | 19,816 | |||||||||||||||
Batalha | 35 | 249 | 6,751 | 320 | 8,847 | |||||||||||||||
Simplício | 35 | 972 | 26,743 | 1,135 | 31,222 | |||||||||||||||
|
|
|
|
|
|
|
| |||||||||||||
| 2,299 | 64,464 | 3,431 | 95,474 | |||||||||||||||||
|
|
|
|
|
|
|
| |||||||||||||
NOTE 34 – ADVANCES FOR FUTURE CAPITAL INCREASE
The funds from the National Treasury are being allocated to the following projects:
| 12/31/2013 | 12/31/2012 | |||||||
Acquisition of equity interest CEEE / CGTEE | 156,460 | 144,574 | ||||||
Transmission line Banabuí - Fortaleza | 2,641 | 2,441 | ||||||
UHE Xingó | 7,421 | 6,857 | ||||||
Transmission line in the State of Bahia | 1,162 | 1,073 | ||||||
Federal Electrification Fund - Law 5,073/66 | 6,886 | 6,363 | ||||||
|
|
|
| |||||
| 174,570 | 161,308 | |||||||
|
|
|
| |||||
F-148
Table of Contents
NOTE 35 – ONEROUS CONTRACTS
| 12/31/2013 | 12/31/2012 | |||||||
Transmission | ||||||||
Contract 061/2001 | — | 84,139 | ||||||
Contract 062/2001 | 905,316 | 1,407,057 | ||||||
|
|
|
| |||||
| 905,316 | 1,491,196 | |||||||
Generation | ||||||||
Itaparica | 863,146 | 1,018,534 | ||||||
Jirau | 711,881 | 1,607,869 | ||||||
Camaçari | 267,117 | 357,043 | ||||||
Termonorte II | — | 131,200 | ||||||
Funnel | 95,903 | 83,158 | ||||||
Maua - Klabin | 19,853 | 33,833 | ||||||
Paulo Afonso Complex | — | 34,107 | ||||||
Coaracy Nunes | 85,860 | 20,834 | ||||||
Other | 295,259 | 377,750 | ||||||
|
|
|
| |||||
| 2,339,019 | 3,664,328 | |||||||
|
|
|
| |||||
TOTAL | 3,244,335 | 5,155,524 | ||||||
|
|
|
| |||||
The amount provisioned for costly contracts maintained in December 31, 2013 was R$ 2,426,741 (R$ 3,361,788 on December 31, 2012), which is derived from renewed concession contracts according to Law number 12,783/13, due to the fact that the determined rate is not balanced with current costs. Therefore, the liability of such agreement for each contract has been recognized and measured as a provision, and may be amended due to adjustments of the costs reduction program and/or tariff review.
Contract No 062/2001 – Transmission
In 2013, a partial reversal of a provision for onerous contract losses of R$ 537,040 was made due to increased RAP - Annual Revenue – of approximately R$ 45,000 per year, to be confirmed in the cycle update for July 2013 to June 2014, according to ANEEL Resolution No. 1,559, of June 27, 2013. With regard to costs, the calculation included updated forecast expenses as planned by the Subsidiary.
UHE Jirau
The variation recorded in the provision for UHE Jirau between December 31, 2012 and 2013, refers to variation in the average historical PLD R$ 67.00/MWh to R$ 109.78/MWh and also by changing the discount rate of 4.98% adopted in 2012 to 6.80% in 2013.
UHE Itaparica Reallocation Program
From the construction of the Hydroelectric Power Plant of Itaparica and due to the formation of the Itaparica lake, 10,500 families were moved, of which 6,100 were small farming families and 200 indigenous families from the Tuxá tribe. This resulted in the creation of the Itaparica Reallocation Program, that has the objective of reallocating the families moved from the area flooded by the power plant’s reservoir, which is named Luiz Gonzaga and is located between the States of Pernambuco and Bahia.
F-149
Table of Contents
In extraordinary meeting on January 30, 2013, the Federal Court of Auditors (Tribunal de Contas da União, TCU) issued Ruling number 101/2013-TCU-Plenary, in which it ruled that the Civil House, the entity responsible for the coordination and integration of Government actions between the Ministries of Mines and Energy and National Integration, together with CHESF and Codevasf, supported by section 43, paragraph I of Law number 8,443/1992, combined with section 250, paragraph II of the TCU’s Internal Regiment must, collectively, within a period of 180 (one hundred and eighty) days, elaborate and submit to the Court a plan for the execution of the Itaparica Reallocation Program, including activities, deadlines and responsible individuals, focused on the implementation of necessary measures of immediate and progressive transfer of the public assets in the irrigated public areas in Itaparica for Codevasf and the management of such areas for those who have been reallocated, including the implementation of necessary measures for the regularization of actions filed with the Municipal Government of Santa Maria da Boa Vista, Tacaratu and Belém do São Francisco, in Pernambuco, and of Curaçá, Rodelas and Glória, in Bahia, so that such municipalities assume the public utilities in their authority.
Therefore, the provision for the costly contract related to UHE Itaparica may be reviewed once such plan is implemented.
NOTE 36 – LONG-TERM OPERATING COMMITMENTS
The Company’s long-term commitments, related mainly to purchase agreements for electricity and fuel, are as follows:
1. Purchase of Electricity
Companies | 2015 | 2016 | 2017 | 2018 | 2019 | After 2019 | ||||||||||||||||||
Amazonas | 614,514 | 642,989 | 694,668 | 721,386 | 774,822 | 30,482,103 | ||||||||||||||||||
Chesf | 304,310 | 246,880 | 235,050 | 223,890 | 223,890 | 2,321,057 | ||||||||||||||||||
Distribuidora Alagoas | 538,914 | 601,006 | 614,124 | 774,432 | 774,432 | 774,432 | ||||||||||||||||||
Distribuidora Piauí | 514 | 15,305 | — | — | — | — | ||||||||||||||||||
Distribuidora Rondônia | 712,549 | — | — | — | — | — | ||||||||||||||||||
Distribuidora Acre | 102,996 | 146,929 | 167,136 | 167,281 | 3,518,639 | 3,518,639 | ||||||||||||||||||
Eletronorte | 88,946 | 35,807 | 36,245 | 150,603 | 150,603 | 150,603 | ||||||||||||||||||
Furnas | 33,220 | 33,311 | 33,220 | 33,220 | 33,220 | 33,220 | ||||||||||||||||||
|
|
|
|
|
|
|
|
|
|
|
| |||||||||||||
Total | 2,395,963 | 1,722,227 | 1,780,443 | 2,070,812 | 5,475,606 | 37,280,055 | ||||||||||||||||||
|
|
|
|
|
|
|
|
|
|
|
| |||||||||||||
2. Nuclear Fuel (Eletronuclear)
Companies | 2014 | 2015 | 2016 | After 2016 | ||||||||||||
Eletronuclear | 214,842 | 279,166 | 233,203 | 6,232,631 | ||||||||||||
Contracts signed with Indústrias Nucleares Brasileiras – INB for acquisition of Nuclear Fuel for the production of electricity, destined to reload the UTN Angra I and UTN Angra II thermonuclear power plants, as well as the initial loading and future reloadings of UTN Angra III.
F-150
Table of Contents
3. Purchase of Energy from Independent Producers - Proinfa
The Company supports the development of projects for the diversification of the Brazilian electricity system, through the program of incentives for alternative sources of electricity, enacted by Law number 10,438 from April of 2002, which seeks local solutions for the use of renewable energy and encourages the growth of the domestic industry.
PROFINA predicts the operation of 144 power plants, totalizing 3,299.40 MW of installed capacity. The program power plants will be responsible for generating approximately 12,000GWh/year, equivalent to 3.2% of the total annual consumption in the country. The contracted 3,299.40 MW are divided in 1,191.24 MV from 63 Small Hydroelectric Power Plants (PCH’s), 1,422.92 MW from 54 wind power plants and 685.24 MW from 27 biomass based power plants. In 2006, the Company agreed to purchase electricity produced by PROINFA for a period of 20 years and transfer such electricity to the transmission and distribution concession holders, who, in turn, transfer the electricity to free consumers and self-producers, excluding lower income consumers, proportionate to their consumption. Each of the transmission and distribution concession holders pays the Company the total annual cost of electricity supplied to its captive consumers, free consumers, and self-producers connected to their facilities, in twelve monthly payments, each in advance for the month during which the electricity should be consumed.
4. Sale of Power
Companies | 2015 | 2016 | 2017 | 2018 | 2019 | After 2019 | ||||||||||||||||||
Chesf | 567,430 | 200,030 | 199,490 | — | — | — | ||||||||||||||||||
Eletronorte | 3,437,867 | 2,436,281 | 1,323,984 | 2,095,828 | 2,095,828 | 2,095,828 | ||||||||||||||||||
Eletronuclear | 4,205,216 | 4,205,216 | 4,205,216 | 4,205,216 | 2,102,608 | — | ||||||||||||||||||
Furnas | 1,588,551 | 1,595,284 | 1,266,295 | 1,266,295 | 1,266,295 | 1,266,295 | ||||||||||||||||||
|
|
|
|
|
|
|
|
|
|
|
| |||||||||||||
Total | 9,799,064 | 8,436,811 | 6,994,985 | 7,567,339 | 5,464,731 | 3,362,123 | ||||||||||||||||||
|
|
|
|
|
|
|
|
|
|
|
| |||||||||||||
Contracts entered into by the above-listed companies and other companies of the electricity sector for the supply/sale of electricity. In case the Company does not have sufficient quantities of electricity for a given period, it can resort to the purchase of electricity from the Electricity Trading Chamber (CCEE) to honor the electricity supply agreement. However, in such case, the company is susceptible to period value of the Difference Liquidation Price (PLD), which may be higher than the amounts set forth in the contracts above, subjecting the Company to financial losses in such operations.
5. Social and environmental commitments
Companies | 2015 | 2016 | After 2016 | |||||||||
Eletronorte | 56,638 | 56,638 | 56,638 | |||||||||
Eletronuclear | 71,505 | 84,283 | 155,789 | |||||||||
|
|
|
|
|
| |||||||
Total | 128,143 | 140,921 | 212,427 | |||||||||
|
|
|
|
|
| |||||||
F-151
Table of Contents
A) Angra III
Commitments have been made to the municipalities of Angra dos Reis, Rio Claro and Paraty, in which Eletronuclear undertakes to conclude specific agreements related to environmental issues at UTN Angra III, with the aim of implementing programs and projects in line with the conditions set by IBAMA.
B) CGTEE – Presidente Médici Thermoelectric Power Plant
On April 13, 2011, the Conduct Adjustment Agreement (Termo de Ajustamento de Conduta, TAC) was signed by CGTEE, IBAMA, Eletrobras, Ministry of Mines and Energy, Ministry of Environment and the federal government, through the Federal Attorney’s Office, for the environmental regulation of Phases A and B of the Presidente Médici Power Plant, located in Candiota - RS. The TAC sets forth several obligations for the CGTEE up to August 31, 2014 including an estimated investment by the company in the amount of R$ 241,835. After termination of the TAC, IBAMA is expected to renew the operational permit for the Presidente Médici Thermoelectric Power Plant.
CGTEE has assumed several commitments, such as: an international open bidding process for the implementation of the [SO2 and Particulate Matter Abatement System] in Phase B, the restoration of 1,000 acres of riparian forests and/or degraded areas, located in the watershed areas of the Jaguarão and Arroio Candiota rivers, as well as re-vegetation of the permanent preservation area in the Barragem’s storage basin.
C) Plan for Regional Integration – Tucuri
Due to legal requirements related to the expansion works at the Hydroelectric Tucuruí site and the elevation of its reservoir quota from 72 to 74 meters, it was necessary to carry out the process of licensing the venture with the State Department of Environment (Sema), Pará State, as a condition for release of the Installation License (LI), under which Eletronorte implemented various programs of mitigation and environmental compensation.
D) Environmental Permits
The socio-environmental actions to provide for contingencies of environmental risks in business units of Eletrosul, ensure emissions Environmental Permits and authorization for cutting vegetation can be achieved with the support of the Public Ministry that oversees the building of these investments.
6. Acquisition of Fixed and Intangible Assets
Companies | 2015 | 2016 | 2017 | 2018 | 2019 | After 2019 | ||||||||||||||||||
Eletronorte | 13,633 | 299 | 135 | 25 | 10 | 10 | ||||||||||||||||||
Eletronuclear | 1,990,837 | 2,483,842 | 1,704,245 | 1,704,245 | 1,704,245 | 1,704,245 | ||||||||||||||||||
|
|
|
|
|
|
|
|
|
|
|
| |||||||||||||
Total | 2,004,470 | 2,484,141 | 1,704,380 | 1,704,270 | 1,704,255 | 1,704,255 | ||||||||||||||||||
|
|
|
|
|
|
|
|
|
|
|
| |||||||||||||
F-152
Table of Contents
Signed contracts with several suppliers for the purchase of equipment to replace the fixed assets, mainly from plants Angra I and Angra II Angra III, are required for operational maintenance of these assets.
7. Public Asset Use
Companies | 2015 | 2016 | 2017 | 2018 | 2019 | After 2019 | ||||||||||||||||||
Eletronorte | 2,626 | 2,642 | 2,427 | 2,230 | 22,595 | 22,595 | ||||||||||||||||||
|
|
|
|
|
|
|
|
|
|
|
| |||||||||||||
Total | 2,626 | 2,642 | 2,427 | 2,230 | 22,595 | 22,595 | ||||||||||||||||||
|
|
|
|
|
|
|
|
|
|
|
| |||||||||||||
8. Fuel Suppliers
Companies | 2015 | 2016 | 2017 | 2018 | 2019 | After 2019 | ||||||||||||||||||
Eletronorte | 49,067 | — | — | — | — | — | ||||||||||||||||||
Eletronuclear | 279,166 | 233,203 | 6,232,631 | 6,232,631 | 6,232,631 | 6,232,631 | ||||||||||||||||||
|
|
|
|
|
|
|
|
|
|
|
| |||||||||||||
Total | 328,233 | 233,203 | 6,232,631 | 6,232,631 | 6,232,631 | 6,232,631 | ||||||||||||||||||
|
|
|
|
|
|
|
|
|
|
|
| |||||||||||||
NOTE 37 – SHAREHOLDERS’ EQUITY
I – Capital Stock
The Company’s capital stock on December 31, 2013 is of R$ 31,305,331 (December 31, 2012 - R$ 31,305,331) and its shares have no par value. Preference shares do not have the right to vote and cannot be converted into common shares, however, they have priority in the reimbursement of capital and distribution of dividends at the annual rates of 8% for class “A” shares (subscribed until June 23, 1969) and 6% for class “B” shares (subscribed as of June 24, 1969), calculated over the capital corresponding to each share class.
The capital stock is represented by 1,352,634.100 book-entry shares and is distributed, by main shareholders and by classes of share, on December 31, 2013, as set forth in the table below:
| COMMON | PREFERRED | TOTAL CAPITAL | ||||||||||||||||||||||||||
SHAREHOLDER | QUANTITY | % | A Serie | B Serie | % | QUANTITY | % | |||||||||||||||||||||
União | 591,968,382 | 54.46 | — | 2,252 | — | 591,970,634 | 43.76 | |||||||||||||||||||||
BNDESPAR | 141,757,951 | 13.04 | — | 18,691,102 | 7.04 | 160,449,053 | 11.86 | |||||||||||||||||||||
BNDES | 74,545,264 | 6.86 | — | 18,262,671 | 6.88 | 92,807,935 | 6.86 | |||||||||||||||||||||
FND | 45,621,589 | 4.20 | — | — | — | 45,621,589 | 3.37 | |||||||||||||||||||||
FGHAB | 1,000,000 | 0.09 | — | — | — | 1,000,000 | 0.07 | |||||||||||||||||||||
FGI | — | — | — | 8,750,000 | 3.30 | 8,750,000 | 0.65 | |||||||||||||||||||||
Others | 232,157,111 | 21.36 | 146,920 | 219,730,858 | 82.60 | 452,034,889 | 33.42 | |||||||||||||||||||||
|
|
|
|
|
|
|
|
|
|
|
|
|
| |||||||||||||||
| 1,087,050,297 | 100.00 | 146,920 | 265,436,883 | 99.82 | 1,352,634,100 | 100.00 | ||||||||||||||||||||||
|
|
|
|
|
|
|
|
|
|
|
|
|
| |||||||||||||||
F-153
Table of Contents
From the total of 443,333,198 shares (after deducting the 127 common shares held by Company Directors and Members of the Board of Eletrobras) held by non-controlling shareholders, 258,067,370 shares, that is, 58,21% are owned by non-resident investors, of which 152,914,851 are common shares, 28 are Class A Preferred shares and 105,152,491 are Class B preferred shares.
Out of total participation of shareholders resident abroad, 65,800,425 are common shares and 21,072,812 are Class B preferred shares, held under custody in the American Depository Receipts Program – ADRs.
II – Capital Reserves
| 12/31/2013 | 12/31/2012 | |||||||
Compensation insufficient remuneration - CRC | 18,961,102 | 18,961,102 | ||||||
Premium on issue of shares | 3,384,310 | 3,384,310 | ||||||
Special - Decree-Law 54.936/1964 | 387,419 | 387,419 | ||||||
Restatement of the opening balance 1978 | 309,655 | 309,655 | ||||||
Restatement of the Compulsory Loan - 1987 | 2,708,432 | 2,708,432 | ||||||
Donations and grants - Finor FINAM and other | 297,424 | 297,424 | ||||||
|
|
|
| |||||
| 26,048,342 | 26,048,342 | |||||||
III – Revenue Reserves
The Company’s Bylaws provide for the allocation of 50% of net income for the year to create an Investment Reserve and 1% for the Studies and Projects Reserve, limited to 75% and 2% of the capital stock.
| 12/31/2013 | 12/31/2012 | |||||||
Legal (art. 193 - Lei 6.404/1976) | 2,233,017 | 2,233,017 | ||||||
Bylaws (art. 194 – Lei 6.404/1976) | 2,101,548 | 9,128,208 | ||||||
|
|
|
| |||||
| 4,334,565 | 11,361,225 | |||||||
IV – Interest on Equity
On April 30, 2013, through the 53rd Ordinary General Assembly, the payment of interest on capital (IOC) for 2012 to shareholders registered on the database on April 30, 2013 was approved. JCP were paid in the amount of R$ 916,171 in the year.
Below are the values given to each share, updated pursuant to the Selic rate, according to Bylaws and current legislation:
Shares: Type/Class | Gross Amount on 12/31/2013 | Gross Amount on 12/31/2012 | ||||||
Common | 0,399210837 | 0,421402082 | ||||||
Preferred A | 2,178,256,561 | 2,299341032 | ||||||
Preferred B | 1,63369244 | 1,724,505,778 | ||||||
F-154
Table of Contents
These values are affected by 15% withholding tax, except for those exempt shareholders under applicable law, and the rate of 20% on the portion of remuneration equivalent to the updated Selic rate.
NOTE 38 – EARNINGS (LOSS) PER SHARE
(a) Basic
The basic earnings per share are calculated by dividing the net income attributable to the Company Shareholders, by the weighted average quantity of common shares issued during the fiscal year, excluding common shares acquired by the Company and held as treasury shares.
12/31/2013 | ||||||||||||||||
| Numerator | Common | Preferred A | Preferred B | Total | ||||||||||||
Net profit / loss attributable to each class of shares | (5,052,303 | ) | (683 | ) | (1,233,677 | ) | (6,286,663 | ) | ||||||||
|
|
|
|
|
|
|
| |||||||||
| (5,052,303 | ) | (683 | ) | (1,233,677 | ) | (6,286,663 | ) | |||||||||
| Denominator | Ordinárias | Preferencial A | Preferencial B | Total | ||||||||||||
Weighted average number of shares in thousands | 1,087,050 | 147 | 265,437 | 1,352,634 | ||||||||||||
% Of shares in relation to the total | 80.37 | % | 0.01 | % | 19.62 | % | 100.00 | % | ||||||||
Basic earnings per share (R$) | (4.65 | ) | (4.65 | ) | (4.65 | ) | ||||||||||
12/31/2012 | ||||||||||||||||
| Numerator | Common | Preferred A | Preferred B | Total | ||||||||||||
Net profit / loss attributable to each class of shares | (5,528,270 | ) | (748 | ) | (1,349,899 | ) | (6,878,916 | ) | ||||||||
|
|
|
|
|
|
|
| |||||||||
| (5,528,270 | ) | (748 | ) | (1,349,899 | ) | (6,878,916 | ) | |||||||||
| Denominator | Common | Preferred A | Preferred B | Total | ||||||||||||
Weighted average number of shares | 1,087,050 | 147 | 265,437 | 1,352,634 | ||||||||||||
% Of shares in relation to the total | 80 | % | 0.01 | % | 20 | % | 100 | % | ||||||||
Basic earnings per share (R$) | (5.09 | ) | (5.09 | ) | (5.09 | ) | ||||||||||
F-155
Table of Contents
12/31/2011 | ||||||||||||||||
| Numerator | Common | Preferred A | Preferred B | Total | ||||||||||||
Net profit / loss attributable to each class of shares | 2,831,333 | 383 | 691,358 | 3,523,074 | ||||||||||||
|
|
|
|
|
|
|
| |||||||||
| 2,831,333 | 383 | 691,358 | 3,523,074 | |||||||||||||
| Denominator | Common | Preferred A | Preferred B | Total | ||||||||||||
Weighted average number of shares | 1,087,050 | 147 | 265,437 | 1,352,634 | ||||||||||||
% Of shares in relation to the total | 80.37 | % | 0.01 | % | 19.62 | % | 100 | % | ||||||||
Basic earnings per share (R$) | 2.60 | 2.60 | 2.60 | |||||||||||||
F-156
Table of Contents
NOTE 39 – NET OPERATING REVENUE
| 12/31/2013 | 12/31/2012 | 12/31/2011 * | ||||||||||
OPERATING REVENUE | ||||||||||||
Generation | ||||||||||||
Supply (sale) of Electricity | 8,066,674 | 13,080,819 | 15,976,884 | |||||||||
Supply of Electricity | 3,774,404 | 3,659,984 | 2,449,928 | |||||||||
Short-Term Electricity | 2,395,732 | 1,640,241 | — | |||||||||
Revenue Operations and Maintenance Line Renewed | 2,198,235 | — | — | |||||||||
Construction Revenue Lines Renewed | 736,854 | — | — | |||||||||
Financial Effect of Itaipu | 67,961 | 502,067 | 836,488 | |||||||||
|
|
|
|
|
| |||||||
| 17,239,860 | 18,883,111 | 19,263,300 | ||||||||||
|
|
|
|
|
| |||||||
Transmission | ||||||||||||
Revenue Operations and Maintenance Line Renewed | 2,037,399 | — | — | |||||||||
Revenue Operations and Maintenance | 118,382 | 2,544,791 | 1,978,618 | |||||||||
Construction Revenue | 1,797,324 | 1,960,474 | 3,603,492 | |||||||||
Financial - Return on Investment | 552,106 | 2,852,332 | 2,774,166 | |||||||||
|
|
|
|
|
| |||||||
| 4,505,211 | 7,357,597 | 8,356,276 | ||||||||||
|
|
|
|
|
| |||||||
Distribution | ||||||||||||
Supply of Electricity | 4,419,444 | 5,099,414 | 4,712,716 | |||||||||
Construction Revenue | 1,013,684 | 1,345,519 | 729,064 | |||||||||
|
|
|
|
|
| |||||||
| 5,433,128 | 6,444,933 | 5,441,780 | ||||||||||
|
|
|
|
|
| |||||||
|
|
|
|
|
| |||||||
Other revenue | 1,008,200 | 962,425 | 1,187,136 | |||||||||
|
|
|
|
|
| |||||||
|
|
|
|
|
| |||||||
| 28,186,399 | 33,648,066 | 34,248,492 | ||||||||||
|
|
|
|
|
| |||||||
(–) Deductions from Operating Revenue | ||||||||||||
(–) ICMS | (1,231,306 | ) | (1,368,957 | ) | (1,086,209 | ) | ||||||
(–) PASEP and COFINS | (2,238,363 | ) | (2,516,696 | ) | (1,901,838 | ) | ||||||
(–) Sector charges | (870,490 | ) | (1,723,889 | ) | (1,712,669 | ) | ||||||
(–) Other deductions (including ISS) | (10,596 | ) | (24,228 | ) | (15,031 | ) | ||||||
|
|
|
|
|
| |||||||
| (4,350,755 | ) | (5,633,770 | ) | (4,715,747 | ) | |||||||
|
|
|
|
|
| |||||||
Net operating revenue | 23,835,644 | 28,014,296 | 29,532,744 | |||||||||
|
|
|
|
|
| |||||||
| * | We have not restated data for 2011 to reflect the application of IFRS 11. |
The decrease in revenue was substantially affected by Law 12,783/2013, and financial asset Itaipu was affected by the exchange rate for the year.
F-157
Table of Contents
NOTE 40 – EQUITY RESULTS
| 12/31/2013 | 12/31/2012 | 12/31/2011 * | ||||||||||
Investments in associates | ||||||||||||
Interest on capital | 98,236 | — | — | |||||||||
Equity | (104,393 | ) | 415,168 | 290,693 | ||||||||
|
|
|
|
|
| |||||||
| (6,157 | ) | 415,168 | 290,693 | |||||||||
|
|
|
|
|
| |||||||
Other investments | ||||||||||||
Interest on capital | 14,282 | 23,520 | 19,243 | |||||||||
Dividends | 101,275 | 112,018 | 139,728 | |||||||||
Remuneration of investments in partnerships | 20,707 | 17,684 | (3,516 | ) | ||||||||
Capital income - Itaipu | 47,661 | 43,812 | 36,637 | |||||||||
|
|
|
|
|
| |||||||
| 183,925 | 197,034 | 192,092 | ||||||||||
|
|
|
|
|
| |||||||
| 177,768 | 612,202 | 482,785 | ||||||||||
|
|
|
|
|
| |||||||
| * | We have not restated data for 2011 to reflect the application of IFRS 11. |
NOTE 41 – PERSONNEL, SUPPLIES AND SERVICES
| 12/31/2013 | 12/31/2012 | 12/31/2011 * | ||||||||||
Personnel | 6,650,154 | 5,112,213 | 5,233,826 | |||||||||
Supply | 295,442 | 302,186 | 303,347 | |||||||||
Services | 2,298,990 | 2,256,424 | 2,133,543 | |||||||||
|
|
|
|
|
| |||||||
| 9,244,586 | 7,670,823 | 7,670,716 | ||||||||||
|
|
|
|
|
| |||||||
| * | We have not restated data for 2011 to reflect the application of IFRS 11. |
F-158
Table of Contents
NOTE 42 – ENERGY PURCHASED FOR RESALE AND USE OF ELECTRIC NETWORK
| 12/31/2013 | 12/31/2012 | 12/31/2011 * | ||||||||||
Charges for Use of Network | 1,560,883 | 1,586,809 | 1,420,934 | |||||||||
|
|
|
|
|
| |||||||
Electricity purchased for resale | ||||||||||||
Supply | 2,142,924 | 2,011,954 | 1,281,766 | |||||||||
Marketing at CCEE | 555,752 | 532,017 | 128,979 | |||||||||
Proinfa | 2,783,694 | 2,292,995 | 1,955,328 | |||||||||
Other | 32,836 | 26,323 | 20,217 | |||||||||
|
|
|
|
|
| |||||||
| 5,515,206 | 4,863,289 | |||||||||||
|
|
|
|
|
| |||||||
| 7,076,089 | 6,450,098 | 4,807,223 | ||||||||||
|
|
|
|
|
| |||||||
| * | We have not restated data for 2011 to reflect the application of IFRS 11. |
F-159
Table of Contents
NOTE 43 – OPERATING PROVISIONS
| 12/31/2013 | 12/31/2012 | 12/31/2011 * | ||||||||||
Guarantees | 83,681 | 28,885 | 70,596 | |||||||||
Contingencies | 1,399,321 | 579,851 | 691,042 | |||||||||
PCLD - Consumers and Retailers | (792,871 | ) | 919,359 | 511,356 | ||||||||
PCLD - Financing and Loans | 106,232 | (137,495 | ) | 297,131 | ||||||||
Costly Contracts | (1,924,657 | ) | 1,636,137 | 96,204 | ||||||||
Loss in Investments | 142,622 | 187,741 | 9,183 | |||||||||
Impairment | 1,338,903 | 1,058,940 | 434,538 | |||||||||
Adjusted to market value | 408 | (144,661 | ) | 5,956 | ||||||||
Provision for Loss of Financial Assets | 791,868 | — | — | |||||||||
BRR Impairment | 1,122,970 | — | — | |||||||||
Others | 989,728 | 842,465 | 732,743 | |||||||||
|
|
|
|
|
| |||||||
Total | 3,258,205 | 4,971,221 | 2,848,749 | |||||||||
|
|
|
|
|
| |||||||
| * | We have not restated data for 2011 to reflect the application of IFRS 11. |
The variation recorded under Onerous Contracts refers to the increase in the value of the PLD historical average and the discount rate used in 2013 (see note 38).
NOTE 44 – FINANCIAL INSTRUMENTS AND RISK MANAGEMENT
1 – Capital Risk Management
The Company’s objectives in the management of its capital are to safeguard its capability to continually offer returns to the shareholders and benefits to other stakeholders, in addition to pursuing an ideal capital structure to decrease costs. Acquisitions and sales of financial assets are recognized on the date of trade.
In order to maintain or adjust the capital structure, the Company may review the dividend payment policy, return capital to shareholders, issue new shares or sell assets to reduce, for example, its level of debt.
F-160
Table of Contents
Consistent with other companies in the sector, the Company monitors its capital based on the financial leverage index. Such index corresponds to net debt divided by total capital. In this case, net debt corresponds to total loans (including short and long-term loans, as presented in the consolidated balance sheet), minus the amount of cash and cash equivalents. Total capital is calculated through a sum of net assets, as shown in the consolidated balance sheet, with net debt.
| 12/31/2013 | 12/31/2012 | |||||||
Total Loans | 32,476,287 | 26,630,150 | ||||||
(–) Cash and Cash Equivalents | 3,597,583 | 2,501,515 | ||||||
|
|
|
| |||||
net debt | 28,878,704 | 24,128,635 | ||||||
(+) Total Equity | 60,688,908 | 67,280,593 | ||||||
|
|
|
| |||||
Total Capital | 89,567,612 | 91,409,228 | ||||||
|
|
|
| |||||
Financial Leverage Index | 32 | % | 26 | % | ||||
2 – Classification of Financial Instruments by Category
The Company’s financial instruments are classified in categories of financial assets and liabilities, which also include derivative instruments, as follows:
| FINANCIAL ASSETS (Current / Noncurrent) | 12/31/2013 | 12/31/2012 | ||||||
Loans and Receivables | 57,772,632 | 61,375,560 | ||||||
|
|
|
| |||||
Customers | 4,898,103 | 5,339,380 | ||||||
Loans and financing | 15,174,341 | 15,544,793 | ||||||
Rights of Refund | 12,579,656 | 8,203,189 | ||||||
Financial Assets - Concessions generation / transmission | 19,624,353 | 17,850,927 | ||||||
Indemnities - Law 12.783/2013 | 5,496,179 | 14,437,271 | ||||||
Held-to-Maturity | 190,730 | 251,211 | ||||||
|
|
|
| |||||
Securities | 190,730 | 251,211 | ||||||
Measured at fair value through profit | 9,911,496 | 9,475,829 | ||||||
|
|
|
| |||||
Cash and cash equivalents | 3,597,583 | 2,501,515 | ||||||
Securities | 6,097,758 | 6,501,950 | ||||||
Derivatives | 216,155 | 472,364 | ||||||
Available for sale | 6,689,554 | 6,035,733 | ||||||
|
|
|
| |||||
Investments (Shareholdings) | 1,441,867 | 1,439,786 | ||||||
Financial Assets - Concessions distribution | 5,247,686 | 4,595,947 | ||||||
FINANCIAL LIABILITIES (Current / Noncurrent) | ||||||||
Measured at amortized cost | 54,059,643 | 43,008,384 | ||||||
|
|
|
| |||||
Providers | 8,531,871 | 6,423,074 | ||||||
Loans and financing | 32,476,287 | 26,630,150 | ||||||
Debentures | 218,682 | 69,320 | ||||||
Reimbursement Obligations | 10,695,108 | 7,789,757 | ||||||
Leasing | 2,073,224 | 2,023,033 | ||||||
Concessions Payable UBP | 64,471 | 73,050 | ||||||
Measured at fair value through profit | 420,801 | 476,283 | ||||||
|
|
|
| |||||
Derivatives | 420,801 | 476,283 | ||||||
Measured at fair value through profit | 36,848 | — | ||||||
|
|
|
| |||||
Derivative Financial Instruments - Flow Hedge | 36,848 | — | ||||||
F-161
Table of Contents
2.1 – Financial Assets
| a) | Cash and cash equivalents: held for short-term transactions and measured at fair value, being directly reflected in the income statement. |
| b) | Marketable Securities – Short and Long Term – usually held for trading and designated in the initial recognition at fair value, being directly reflected in the income statement. |
| c) | Consumers and Resellers: recorded by their face value, similar to fair value and probable realization value. Renegotiated credits are recorded assuming the intention of maintaining them until maturity, by its probable realization value, similar to fair value. |
| d) | Granted financings and loans: financial assets with fixed or determinable income, their value being measure at the amortized cost, based on the utilization of the effective interest rate method. |
Granted financings are restricted to electricity public utility concession holders and, therefore, the market rate (or opportunity cost of the Company’s capital) is defined by taking into consideration the risk premium compatible with the activities of this sector. If it is not possible to seek alternatives other than the electricity sector itself, the current value of these loans is assessed in accordance with their book value.
By the end of this fiscal year, the consolidated portfolio of granted loans and financings totalized R$ 15,174,342 (R$ 15,554,795 on December 31, 2012), as set forth below:
| 12/31/2013 | 12/31/2012 | |||||||||||||||||||||||
Currency | Equivalent USD | % | R$ | Equivalent USD | % | R$ | ||||||||||||||||||
USD | 5,074,535 | 78.34 | % | 11,887,606 | 5,697,399 | 74.90 | % | 11,642,635 | ||||||||||||||||
BRL | 1,403,029 | 21.66 | % | 3,286,736 | 1,909,548 | 25.10 | % | 3,902,160 | ||||||||||||||||
|
|
|
|
|
|
|
|
|
|
|
| |||||||||||||
| 6,477,564 | 100.00 | % | 15,174,342 | 7,606,947 | 100.00 | % | 15,544,795 | |||||||||||||||||
|
|
|
|
|
|
|
|
|
|
|
| |||||||||||||
| e) | Concession financial assets: financial assets that represent the unconditional right to receive a certain amount at the end of the concession term. They are classified as loans and receivables in the case of assets related to generation and transmission, and as available for sale in the case of distribution. |
| f) | Derivatives: are measured at the fair value and reflected in the income statement when not designated asHedges or in the Net Assets when classified as hedge of cash flow, according to the IAS 39. |
2.2 – Financial Liabilities – classified in the following categories:
| a) | Suppliers: measured at known or calculable value, with added corresponding charges, monetary corrections and/or exchange rate variation incurred until the date of the balance sheet, when applicable, and their accounting value is approximately the same as the fair value. |
F-162
Table of Contents
Loans and financings: measured at amortized cost, using the effective interest rate method. In this category of financial liability we show loans and financings obtained from financial institutions, particularly abroad, and to fund b – Periodical Tariff Reviews.
| b) | Values of loans and financing obtained are similar to their book values. |
Obtained financings are comprised of financings contracted from multilateral international agencies (BID, BIRD, CAF), and it is not possible to discount them at a rate different from that established in the debt agreement. All remaining loans are captured at market rates, making their accounting value approximately the same as their current value.
The Company ended the 2013 fiscal year with liability contracts, among loans, financings and bonus, which totalized R$ 32,476,287 (R$ 26,630,1500 on December 31, 2012), as set forth in the table below:
| 12/31/2013 | 12/31/2012 | |||||||||||||||||||||||
Moeda | Equivalent USD | % | R$ | Equivalent USD | % | R$ | ||||||||||||||||||
US$ | 4,553,765 | 32.85 | % | 10,667,649 | 4,701,104 | 36.07 | % | 9,606,706 | ||||||||||||||||
REAL | 9,133,388 | 65.88 | % | 21,395,874 | 8,172,205 | 62.71 | % | 16,699,901 | ||||||||||||||||
YEN | 94,598 | 0.68 | % | 221,606 | 140,792 | 1.08 | % | 287,709 | ||||||||||||||||
EURO | 81,601 | 0.59 | % | 191,158 | 17,536 | 0.13 | % | 35,834 | ||||||||||||||||
|
|
|
|
|
|
|
|
|
|
|
| |||||||||||||
| 13,863,351 | 100.00 | % | 32,476,287 | 13,031,637 | 100.00 | % | 26,630,150 | |||||||||||||||||
|
|
|
|
|
|
|
|
|
|
|
| |||||||||||||
| c) | Compulsory Loan: extinguished by Law number 7,181 from December 20, 1993, its deadline for collection was December 31, 1993. Currently, the Company manages the residual amount of the collected Compulsory Loan, restating it based on the IPCA-E and remunerating it at a rate of 6% per year, with a defined deadline for redemption. |
| d) | Remaining financial liabilities: are measured by the amortized cost, using the effective interest rate method, and its fair value is similar to the accounting value. |
3 – Financial Risk Management:
In its operation, the Company is impacted by events and risks that may compromise its strategic objectives. The main objective of risk management is to anticipate and minimize the adverse effects of such events in the financial results of the Company.
For the management of financial risks, the Company established operational and financial policies and strategies, approved by internal committees and by the Management, with the purpose of granting liquidity, security and profitability to its assets, as well as maintaining the levels of indebtedness and the profile of the debt required for the economical-financial flow.
F-163
Table of Contents
The main identified financial liabilities in the process of risk management are:
3.1 – Foreign Exchange Rate Risk
This risk derives from the possibility of the Company having its financial statements affected by fluctuations in the foreign exchange rate. The Company is subject to financial risks that cause volatility in its results, as well as its cash flow. The Company is significantly subject to exposure between assets and liabilities indexed by the foreign currency, particularly the American dollar. Such exposure is especially true for the financing contracts with Itaipu Binacional. In addition, there is the exposure to the Libor interest rate, related to external capture contracts.
In this context, the Company’s Financial Hedge Policy was approved. The objective of such policy is to monitor and mitigate the exposure to market variables that affect assets and liabilities of the Parent Company and its subsidiaries, thus reducing the effect of undesired fluctuation of these variables in the Consolidated Financial Statements.
In this manner, the above-mentioned policy has the objective of assisting Company results to faithfully reflect its real operational performance and the cash flow to present less volatility.
Along with this policy, the creation of a Financial Hedge Committee within the Financial Management, was approved. The main function of such committee is to define which hedge strategies and instruments should be presented to the Company’s Board of Executive Officers.
Taking into consideration the different forms to perform the hedge of discrepancies presented by the Company, the approved policy employs a priority scale. The first priority is a structural solution and, only in remaining cases, operations with derivative financial instruments are adopted.
The operations with financial derivatives, whenever performed, will follow the Company’s hedge policy and cannot involve financial leverage or the granting of credits to third parties.
3.2 Interest rate risk
This risk is associated with the ability of the Company to account for losses due to fluctuations in market interest rates, impacting the financial statements by higher financial expenses relating to external funding contracts referenced to Libor. The Company monitors its exposure to Libor and contracts derivative transactions to minimize this exposure, as mentioned above.
3.2.1 Contracts Interest rate swap
According to the contracts Interest rate swap, the Company agrees to exchange the difference between the values of fixed interest rates and fixed and floating calculated from the agreed notional amount. Such contracts enable the Company to mitigate the risk of changes in interest rates on the fair value of fixed interest rate debt and the cash flow exposures of variable interest rate debt. The fair value of interest rate swaps at year end is determined by discounting future cash flows using the curves at year end and the credit risk inherent to this type of contract, and is shown below. The average interest rate is based on payables outstanding at year-end.
F-164
Table of Contents
The following table shows the principal amount and the remaining terms of interest rate swap contracts outstanding at the end of the reporting period:
| Fair Values | ||||||||||||||||||
Transaction | Contract amounts (notional) | Rates used | Maturity | 12/31/2013 | 12/31/2012 | |||||||||||||
01/2011 | 20,192 | 2.4400 | % | 25/11/2015 | (660 | ) | (1,139 | ) | ||||||||||
02/2011 | 20,192 | 2.4900 | % | 25/11/2015 | (677 | ) | (1,169 | ) | ||||||||||
03/2011 | 50,000 | 3.2780 | % | 10/08/2020 | (6,137 | ) | (8,929 | ) | ||||||||||
04/2011 | 100,000 | 3.3240 | % | 10/08/2020 | (12,586 | ) | (18,694 | ) | ||||||||||
05/2011 | 50,000 | 2.1490 | % | 10/08/2015 | (1,424 | ) | (2,357 | ) | ||||||||||
06/2011 | 100,000 | 2.2725 | % | 10/08/2015 | (3,053 | ) | (5,088 | ) | ||||||||||
07/2011 | 100,000 | 2.1790 | % | 10/08/2015 | (2,897 | ) | (4,836 | ) | ||||||||||
08/2011 | 100,000 | 2.1500 | % | 10/08/2015 | (2,849 | ) | (4,683 | ) | ||||||||||
09/2012 | 25,000 | 1.6795 | % | 27/11/2020 | (47 | ) | (1,459 | ) | ||||||||||
10/2012 | 25,000 | 1.6295 | % | 27/11/2020 | 62 | (1,360 | ) | |||||||||||
11/2012 | 75,000 | 1.6285 | % | 27/11/2020 | 191 | (4,074 | ) | |||||||||||
12/2012 | 75,000 | 1.2195 | % | 29/11/2017 | (1,365 | ) | (2,607 | ) | ||||||||||
13/2012 | 75,000 | 1.2090 | % | 29/11/2017 | (1,320 | ) | (3,009 | ) | ||||||||||
14/2012 | 50,000 | 1.2245 | % | 29/11/2017 | (924 | ) | (2,060 | ) | ||||||||||
15/2012 | 50,000 | 1.1670 | % | 29/11/2017 | (1,109 | ) | (1,920 | ) | ||||||||||
16/2012 | 50,000 | 1.1910 | % | 29/11/2017 | (829 | ) | (2,003 | ) | ||||||||||
17/2012 | 50,000 | 1.2105 | % | 29/11/2017 | (884 | ) | (2,070 | ) | ||||||||||
18/2012 | 25,000 | 1.1380 | % | 29/11/2017 | (340 | ) | (695 | ) | ||||||||||
|
|
|
|
|
| |||||||||||||
TOTAL | 1,040,384 | (36,848 | ) | (68,152 | ) | |||||||||||||
|
|
|
|
|
| |||||||||||||
Transactions classified as cash flow hedges for the year generated a negative comprehensive income of R$ 8,046. On December 31, 2012 there were no transactions in this category.
Since the swaps to hedge accounting within the 3 month period ended December 31, 2013, the Company received financial income of R$ 6,152 related to swaps. In the same period, the Company recorded financial expenses of R$ 63,000 relating to the ineffective portion of swaps.
The Company’s exposure to interest rates on financial assets and financial liabilities are detailed in the sensitivity analysis of this Note item.
3.3 – Risk of commodities
a) Eletronorte
The subsidiary Eletronorte entered, in 2004, long-term contracts for the supply of electric power to three of its key customers. These long-term contracts are linked to the international price of aluminum quoted on the London Metal Exchange (LME), as an underlying asset for the purposes of defining the values of monthly contracts.
F-165
Table of Contents
Details of the contracts are as follows:
| Contract dates | ||||||||
Client | Start | Maturity | Average megawatts volume | |||||
Albrás | 07/01/2014 | 12/31/2024 | 750 MW - until 12/31/2006 and 800 MW - after 01/01/2007 | |||||
Alcoa | 07/01/2014 | 12/31/2024 | 304,92 MW to 328 MW | |||||
BHP | 07/01/2014 | 12/31/2024 | 353,08 MW to 492 MW | |||||
These contracts include the cap and floor band concept, related to the price of aluminum quoted on the LME. The maximum and minimum price limits of the LME is set at US$ 2,773.21/ton and US$ 1,450.00/ton, respectively.
The calculation of these contracts includes the concept of cap and floor band, related to the price of aluminum quoted on the LME. The maximum and minimum price of LME is limited to US$ 2,773.21/ton and US$ 1,450, respectively.
To assign the fair value of the hybrid contract is necessary to identify the key components that quantify the amount billed monthly. The main variables of the contract is the amount of electricity sold (MWh), assigned to the LME price and the value of the billed exchange period.
It is possible to assign the fair value of these contracts using the commodity price of aluminum on the LME. The value of aluminum on the LME closed December 2013 priced at US$ 1,784.3/ton, representing a decrease of 14.95% compared to the figure recorded in December 2012, when the price of the commodity reached US$ 2,098.00/ton.
Moreover, the termination of the contract with Alcoa subsidiary Eletronorte in late March 2013, contributed to the decrease in the expected value. Following the conclusion of the 4th addendum, the contract is now billed at a fixed price, without further embedded derivatives for Alcoa.
On the other hand, in the same period of analysis, there was a devaluation of the Real against the U.S. dollar, with the quotation from R$ 2.04 to R$ 2.34, or a 14.64 % variation. This variation, although positive for the price premium, was not sufficient to increase the expected fair value of the derivatives.
The loss on derivative transactions in 2013 is US$ 178,994 (2012 - gain of R$ 133,804).
3.4 – Credit risk
This risk derives from the possibility that the Company and its subsidiaries may incur losses resulting from difficulties to collect their receivables from customers, as well as from defaults by financial institutions acting as counterparties in operations.
The Company, through its subsidiaries, operates in the markets of electricity generation and transmission, supported by agreements signed in regulated framework. The Company seeks to minimize its credit risks by means of sureties mechanisms involving receivables from their customers and, when applicable, bank guarantees. In the distribution segment, the Company, through its subsidiaries, monitors default levels through analysis of its customers. Additionally, there are negotiations to enable the Company to receive past due credits.
F-166
Table of Contents
Available cash is held in an exclusive extra-market fund, pursuant to specific regulation by the Central Bank of Brazil. The fund is fully backed by public bonds indexed by Selic, with no exposure to counterparty risk.
In its occasional dealings with financial institutions, the Company has a policy of solely dealing with institutions evaluated as low-risk by rating agencies, which are also in compliance with equity requirements previously defined and formalized. Additionally, credit limits are defined and periodically reviewed.
Derivative transactions carried out in the OTC market contain counterparty risk that, given the problems presented by financial institutions in 2008 and 2009, are relevant. In order to mitigate this risk, the Company established a standard of accreditation of financial institutions with which the Company was considering entering into derivative transactions. This standard sets criteria regarding size, rating and expertise in the derivatives market. Currently, the Company semiannually selects the top 20 financial institutions based on the criteria mentioned. In addition, the company has developed control methodology of exposure to accredited institutions that defines limits to the volume of operations to be performed with each of them.
The Company monitors the credit risk of its swap operations, under IFRS 13, but does not account for this risk of default (non-performance) in the balance of fair value of each derivative because, based on net exposure credit risk, the Company accounts for its portfolio of swaps as an orderly transaction between the parties at the valuation date. The Company considers the risk of default only in respect of the analysis and retrospective testing of each relationship designated for Hedge Accounting.
3.5 – Liquidity risk
The Company’s liquidity needs are responsibility of the areas of treasury and funding, which operate together, permanently monitoring the short, medium and long-term cash flows, forecasted and realized, seeking to prevent possible discrepancies and consequent financial losses and ensuring the liquidity requirements for operational needs.
F-167
Table of Contents
The due dates of derivative financial instruments are disclosed in item 3.2.1 of this explanatory note. The table below analyses non-derivative financial liabilities of the Eletrobras System by maturity, corresponding to the remaining period in the balance sheet until the contractual maturity date. The amounts disclosed in the table are the non-discounted contracted cash flows. The tables include cash flow of the principal and interest to incur. As interest cash flows are post-fixed, the non-discounted value was obtained based on the interest curve at the end of the fiscal year. The contractual maturity date is based on the most recent date on which the Eletrobras System must liquidate the respective liabilities.
| 12/31/2013 | ||||||||||||||||||||
| Up to 1 year | From 1 to 2 years | From 2 to 5 years | More than 5 years | Total | ||||||||||||||||
FINANCIAL LIABILITIES (Current/Non Curent) | ||||||||||||||||||||
Measured at amortized cost | 18,285,710 | 4,868,442 | 2,646,712 | 28,258,779 | 54,059,643 | |||||||||||||||
|
|
|
|
|
|
|
|
|
| |||||||||||
Suppliers | 7,740,578 | 791,293 | — | — | 8,531,871 | |||||||||||||||
Loans and Financing | 1,969,765 | 1,368,261 | 2,051,702 | 27,086,559 | 32,476,287 | |||||||||||||||
Debentures | 12,804 | 24,769 | 41,217 | 139,892 | 218,682 | |||||||||||||||
Reimbursement Obligations | 8,377,400 | 2,317,708 | — | — | 10,695,108 | |||||||||||||||
Leasing | 181,596 | 363,192 | 544,789 | 983,647 | 2,073,224 | |||||||||||||||
Concessions Payable UBP | 3,567 | 3,219 | 9,004 | 48,681 | 64,471 | |||||||||||||||
Measured at fair value through profit | 225,423 | 206,938 | 6,771 | 18,517 | 457,649 | |||||||||||||||
|
|
|
|
|
|
|
|
|
| |||||||||||
Derivatives | 225,423 | 206,938 | 6,771 | 18,517 | 457,649 | |||||||||||||||
| 12/31/2012 | ||||||||||||||||||||
| Up to 1 year | From 1 to 2 years | From 2 to 5 years | More than 5 years | Total | ||||||||||||||||
FINANCIAL LIABILITIES (Current/Non Curent) | ||||||||||||||||||||
Measured at amortized cost | 13,915,155 | 4,046,705 | 6,475,826 | 18,570,698 | 43,008,384 | |||||||||||||||
|
|
|
|
|
|
|
|
|
| |||||||||||
Suppliers | 6,423,074 | — | — | — | 6,423,074 | |||||||||||||||
Loans and Financing | 1,337,279 | 1,912,889 | 5,923,679 | 17,456,303 | 26,630,150 | |||||||||||||||
Debentures | 1,305 | 5,229 | 15,456 | 47,330 | 69,320 | |||||||||||||||
Reimbursement Obligations | 5,988,698 | 1,801,059 | — | — | 7,789,757 | |||||||||||||||
Leasing | 162,929 | 325,858 | 488,786 | 1,045,460 | 2,023,033 | |||||||||||||||
Concessions Payable UBP | 1,870 | 1,670 | 47,905 | 21,605 | 73,050 | |||||||||||||||
Measured at fair value through profit | 185,031 | 267,984 | 6,230 | 17,038 | 476,283 | |||||||||||||||
|
|
|
|
|
|
|
|
|
| |||||||||||
Derivatives | 185,031 | 267,984 | 6,230 | 17,038 | 476,283 | |||||||||||||||
4 – Sensitivity Analysis of Financial Instruments
In the following charts, scenarios for indexes and rates were considered with their respective impacts on the Company’s results. For the sensitivity analysis, forecasts and/or estimates used as a likely scenario for the end of 2013 are fundamentally based on macroeconomic estimates from the Focus Report, disclosed by the Central Bank and Economic Outlook 86, published by the OECD.
4.1 – Granted Loans
The sensitivity analysis of the loan and financing contracts granted was carried out from four different perspectives: two scenarios with the increase of indexing currencies of the outstanding balance, and two scenarios with the decrease of such indexing currencies. The analysis was limited to granted contracts that show exposure to the foreign exchange rate and prices index.
F-168
Table of Contents
4.1.1 – Index Depreciation – Granted Loans (in cents and percentages)
Contracts Granted - Var. Negative - Q4 2013 | Index | Balance R$ thousand | ||||||||||||||||||||||||||||||
Currency (Risk) | Balance in Foreign Currency | Balance US$ thousand | Balance R$ thousand | Probable 2013 | Scenario I (-25%) | Scenario II (-50%) | Scenario I (-25%) | Scenario II (-50%) | ||||||||||||||||||||||||
Dollar | 5,074,535 | 5,074,535 | 11,887,605 | 2.300 | 1.725 | 1.150 | 8,753,572 | 5,835,715 | ||||||||||||||||||||||||
IGP-M | 3,286,736 | 1,403,029 | 3,286,736 | 3.49 | % | 2.61 | % | 1.74 | % | 85,917 | 57,278 | |||||||||||||||||||||
|
|
|
|
|
|
|
|
|
|
|
|
|
|
|
| |||||||||||||||||
TOTAL | 6,477,564 | 15,174,341 | 8,839,490 | 5,892,993 | ||||||||||||||||||||||||||||
|
|
|
|
|
|
|
|
|
|
|
|
|
|
|
| |||||||||||||||||
Contracts Granted - Var. Negative - Q4 2012 | Index | Balance R$ thousand | ||||||||||||||||||||||||||||||
Currency (Risk) | Balance in Foreign Currency | Balance US$ thousand | Balance R$ thousand | Probable 2013 | Scenario I (-25%) | Scenario II (-50%) | Scenario I (-25%) | Scenario II (-50%) | ||||||||||||||||||||||||
Dollar | 4,969,963 | 5,220,913 | 11,642,635 | 2.080 | 1.560 | 1.040 | 8,144,624 | 5,429,749 | ||||||||||||||||||||||||
IGP-M | 3,902,158 | 1,749,847 | 3,902,158 | 5.31 | % | 3.98 | % | 2.66 | % | 69,688 | 46,458 | |||||||||||||||||||||
|
|
|
|
|
|
|
|
|
|
|
|
|
|
|
| |||||||||||||||||
TOTAL | 6,970,759 | 15,544,793 | 8,214,311 | 5,476,207 | ||||||||||||||||||||||||||||
|
|
|
|
|
|
|
|
|
|
|
|
|
|
|
| |||||||||||||||||
4.1.2 – Index Appreciation – Granted Loans (in cents and percentages)
Contracts Granted - Var. Positive - Q4 2013 | Index | Balance R$ thousand | ||||||||||||||||||||||||||||||
Currency (Risk) | Balance in Foreign Currency | Balance US$ thousand | Balance R$ thousand | Probable 2013 | Scenario I (+25%) | Scenario II (+50%) | Scenario I (+25%) | Scenario II (+50%) | ||||||||||||||||||||||||
Dollar | 5,074,535 | 5,074,535 | 11,887,605 | 2.300 | 2.875 | 3.450 | 14,589,287 | 17,507,145 | ||||||||||||||||||||||||
IGP-M | 3,286,736 | 1,403,029 | 3,286,736 | 3.49 | % | 4.36 | % | 5.23 | % | 143,195 | 171,834 | |||||||||||||||||||||
|
|
|
|
|
|
|
|
|
|
|
|
|
|
|
| |||||||||||||||||
TOTAL | 6,477,564 | 15,174,341 | 14,732,483 | 17,678,979 | ||||||||||||||||||||||||||||
|
|
|
|
|
|
|
|
|
|
|
|
|
|
|
| |||||||||||||||||
Contracts Granted - Var. Positive - Q4 2012 | Index | Balance R$ thousand | ||||||||||||||||||||||||||||||
Currency (Risk) | Balance in Foreign Currency | Balance US$ thousand | Balance R$ thousand | Probable 2013 | Scenario I (+25%) | Scenario II (+50%) | Scenario I (+25%) | Scenario II (+50%) | ||||||||||||||||||||||||
Dollar | 4,969,963 | 5,220,913 | 11,642,635 | 2.080 | 2.600 | 3.120 | 13,574,373 | 16,289,247 | ||||||||||||||||||||||||
IGP-M | 3,902,158 | 1,749,847 | 3,902,158 | 5.31 | % | 6.64 | % | 8.30 | % | 116,146 | 145,183 | |||||||||||||||||||||
|
|
|
|
|
|
|
|
|
|
|
|
|
|
|
| |||||||||||||||||
TOTAL | 6,970,759 | 15,544,793 | 13,690,519 | 16,434,430 | ||||||||||||||||||||||||||||
|
|
|
|
|
|
|
|
|
|
|
|
|
|
|
| |||||||||||||||||
4.2 – Obtained Loans
The sensitivity analysis of the loan and financing contracts obtained was carried out from four different perspectives: two scenarios with the increase of indexing currencies of the outstanding balance, and two scenarios with the decrease of such indexing currencies. The analysis were limited to contracts obtained that show exposure to the foreign exchange rate and prices index.
4.2.1 – Index Depreciation – Obtained Loans (in cents and percentages)
Contracts obtained - Var. Negative - Q4 2013 | Index | Balance R$ thousand | ||||||||||||||||||||||||||||||
Currency (Risk) | Balance in Foreign Currency | Balance US$ thousand | Balance R$ thousand | Probable 2013 | Scenario I (-25%) | Scenario II (-50%) | Scenario I (-25%) | Scenario II (-50%) | ||||||||||||||||||||||||
Dollar | 4,553,765 | 4,553,765 | 10,667,649 | 2.300 | 1.725 | 1.150 | 2,812,405 | 5,430,820 | ||||||||||||||||||||||||
IGP-M | 21,395,874 | 9,133,388 | 21,395,874 | 3.49 | % | 2.61 | % | 1.74 | % | (559,301 | ) | (372,867 | ) | |||||||||||||||||||
EURO | 59,246 | 81,601 | 191,158 | 3.030 | 2.273 | 1.515 | 56,507 | 101,391 | ||||||||||||||||||||||||
IENE | 9,924,138 | 94,598 | 221,606 | 0.024 | 0.018 | 0.012 | 43,282 | 102,723 | ||||||||||||||||||||||||
|
|
|
|
|
|
|
|
|
|
|
|
|
|
|
| |||||||||||||||||
TOTAL | 13,863,350 | 32,476,287 | 2,352,893 | 5,262,066 | ||||||||||||||||||||||||||||
|
|
|
|
|
|
|
|
|
|
|
|
|
|
|
| |||||||||||||||||
Contracts obtained - Var. Negative - Q4 2012 | Index | Balance R$ thousand | ||||||||||||||||||||||||||||||
Currency (Risk) | Balance in Foreign Currency | Balance US$ thousand | Balance R$ thousand | Probable 2013 | Scenario I (-25%) | Scenario II (-50%) | Scenario I (-25%) | Scenario II (-50%) | ||||||||||||||||||||||||
Dollar | 4,100,873 | 4,307,940 | 9,606,706 | 2.080 | 1.560 | 1.040 | 3,209,344 | 5,341,798 | ||||||||||||||||||||||||
IGP-M | 16,699,901 | 7,488,745 | 16,699,901 | 5.31 | % | 3.98 | % | 2.66 | % | (665,074 | ) | (443,382 | ) | |||||||||||||||||||
EURO | 11,106 | 16,069 | 35,834 | 2.643 | 1.982 | 1.321 | 13,819 | 21,158 | ||||||||||||||||||||||||
IENE | 12,884,416 | 129,017 | 287,709 | 0.026 | 0.020 | 0.013 | 34,564 | 118,946 | ||||||||||||||||||||||||
|
|
|
|
|
|
|
|
|
|
|
|
|
|
|
| |||||||||||||||||
TOTAL | 11,941,771 | 26,630,150 | 2,592,654 | 5,038,519 | ||||||||||||||||||||||||||||
|
|
|
|
|
|
|
|
|
|
|
|
|
|
|
| |||||||||||||||||
F-169
Table of Contents
4.2.2 – Index Appreciation – Obtained Loans (in cents and percentages)
Contracts Granted - Var. Positive - Q4 2013 | Index | Balance R$ thousand | ||||||||||||||||||||||||||||||
Currency (Risk) | Balance in Foreign Currency | Balance US$ thousand | Balance R$ thousand | Provável 2013 | Scenario I (+25%) | Scenario II (+50%) | Scenario I (+25%) | Scenario II (+50%) | ||||||||||||||||||||||||
Dollar | 4,553,765 | 4,553,765 | 10,667,649 | 2.300 | 2.875 | 3.450 | (2,424,424 | ) | (5,042,839 | ) | ||||||||||||||||||||||
IGP-M | 21,395,874 | 9,133,388 | 21,395,874 | 3.49 | % | 4.36 | % | 5.23 | % | (932,168 | ) | (1,118,602 | ) | |||||||||||||||||||
EURO | 59,246 | 81,601 | 191,158 | 3.030 | 3.788 | 4.545 | (33,260 | ) | (78,143 | ) | ||||||||||||||||||||||
IENE | 9,924,138 | 94,598 | 221,606 | 0.024 | 0.030 | 0.036 | (75,601 | ) | (135,043 | ) | ||||||||||||||||||||||
|
|
|
|
|
|
|
|
|
|
|
|
|
|
|
| |||||||||||||||||
TOTAL | 13,863,351 | 32,476,287 | (3,465,453 | ) | (6,374,627 | ) | ||||||||||||||||||||||||||
|
|
|
|
|
|
|
|
|
|
|
|
|
|
|
| |||||||||||||||||
Contracts Granted - Var. Positive - Q4 2012 | Index | Balance R$ thousand | ||||||||||||||||||||||||||||||
Currency (Risk) | Balance in Foreign Currency | Balance US$ thousand | Balance R$ thousand | Probable 2013 | Scenario I (+25%) | Scenario II (+50%) | Scenario I (+25%) | Scenario II (+50%) | ||||||||||||||||||||||||
Dollar | 4,100,873 | 4,307,940 | 9,606,706 | 2.080 | 2.600 | 3.120 | (1,055,565 | ) | (3,188,019 | ) | ||||||||||||||||||||||
IGP-M | 16,699,901 | 7,488,745 | 16,699,901 | 5.31 | % | 6.64 | % | 7.97 | % | (1,108,456 | ) | (1,330,147 | ) | |||||||||||||||||||
EURO | 11,106 | 16,069 | 35,834 | 2.643 | 3.304 | 3.964 | (857 | ) | (8,195 | ) | ||||||||||||||||||||||
IENE | 12,884,416 | 129,017 | 287,709 | 0.026 | 0.033 | 0.039 | (134,199 | ) | (218,580 | ) | ||||||||||||||||||||||
|
|
|
|
|
|
|
|
|
|
|
|
|
|
|
| |||||||||||||||||
TOTAL | 11,941,771 | 26,630,150 | (2,299,077 | ) | (4,744,942 | ) | ||||||||||||||||||||||||||
|
|
|
|
|
|
|
|
|
|
|
|
|
|
|
| |||||||||||||||||
4.3 – Itaipu Binacional Financial Asset
Sensitivity analysis of the regulatory assets deriving from the trading of electricity by Itaipu Binacional were carried out. The analysis was limited to the variation in thereal – dollar exchange rate, including two scenarios in which there is currency appreciation of 25% and 50% and two scenarios in which there is currency depreciation of 25% and 50%.
4.3.1 – Depreciation of Indexes of Itaipu Binacional Financial Asset:
Itaipu Financial Asset - Var. Negative - Q4 2013 | Index | Balance R$ thousand | ||||||||||||||||||||||||||||||
Currency (Risk) | Balance in Foreign Currency | Balance US$ thousand | Balance R$ thousand | Probable 2013 | Scenario I (-25%) | Scenario II (-50%) | Scenario I (-25%) | Scenario II (-50%) | ||||||||||||||||||||||||
Dollar | 1,459,432 | 1,459,432 | 3,418,865 | 2.300 | 1.725 | 1.150 | 901,345 | 1,740,519 | ||||||||||||||||||||||||
Itaipu Financial Asset - Var. Negative - Q4 2012 | Index | Balance R$ thousand | ||||||||||||||||||||||||||||||
Currency (Risk) | Balance in Foreign Currency | Balance US$ thousand | Balance R$ thousand | Probable 2013 | Scenario I (-25%) | Scenario II (-50%) | Scenario I (-25%) | Scenario II (-50%) | ||||||||||||||||||||||||
Dollar | 865,878 | 909,599 | 2,028,406 | 2.080 | 1.560 | 1.040 | 677,636 | 1,127,893 | ||||||||||||||||||||||||
4.3.2 – Appreciation of Indexes of Itaipu Binacional Financial Asset:
Itaipu Financial Asset - Var. Positive - Q4 2013 | Index | Balance R$ thousand | ||||||||||||||||||||||||||||||
Currency (Risk) | Balance in Foreign Currency | Balance US$ thousand | Balance R$ thousand | Probable 2013 | Scenario I (+25%) | Scenario II (+50%) | Scenario I (+25%) | Scenario II (+50%) | ||||||||||||||||||||||||
Dollar | 1,459,432 | 1,459,432 | 3,418,865 | 2.300 | 2.875 | 3.450 | (777,002 | ) | (1,616,175 | ) | ||||||||||||||||||||||
Itaipu Financial Asset - Var. Positive - Q4 2012 | Index | Balance R$ thousand | ||||||||||||||||||||||||||||||
Currency (Risk) | Balance in Foreign Currency | Balance US$ thousand | Balance R$ thousand | Probable 2013 | Scenario I (+25%) | Scenario II (+50%) | Scenario I (+25%) | Scenario II (+50%) | ||||||||||||||||||||||||
Dollar | 865,878 | 909,599 | 2,028,406 | 2.080 | 2.600 | 3.120 | (222,877 | ) | (673,133 | ) | ||||||||||||||||||||||
4.4 – Embedded derivatives indexed by the price of Aluminum
Sensitivity analysis was conducted for contracts of electricity supply for high-use consumers Albras and Alumar, subdivided into Alcoa and BHP, due to contractual clause referring to the variation in the price of aluminum in the international market (see item 3.3 – Commodity Risks in the explanatory note above).
F-170
Table of Contents
Therefore, a variation of the price of aluminum was considered for these hybrid agreements, as seen in the table below. The volatility components of aluminum are essentially: the price of primary aluminum at LME, foreign exchange rate and CDI. Below, it is possible to see the impact of each scenario on the company’s results.
| Balance on 12/31/2013 | Scenario I (-25%) Prices and Rates | Scenario II (-50%) Prices and Rates | Scenario III (+25%) Prices and Rates | Scenario IV (+50%) Prices and Rates | ||||||||||||||
| 216,155 | — | — | 587,693 | 1,067,039 | ||||||||||||||
For scenario II (50% decrease) the expected price of aluminum per ton offered by the LME is below the minimum price range for the contractual premium (US$ 1,450.00), therefore, the value is zero, impacting the value at embedded derivative market.
As for the variation obtained in scenarios III and IV (25% and 50% increases), the large variation shown reflects the effect of the increases on the values of foreign exchange, aluminum price and CDI.
The sensitivity analyses were expanded pursuant to CVM Rule No. 475/2008, with the objective of measuring the impact of the changes in the market variables on each of the Company’s financial instruments. The projections are based on the assessment of macroeconomic scenarios, meaning that the transactions will not have the values presented in the considered analysis term.
4.5 Interest Swap linked to Libor
The Company considers that the most relevant factor in the Libor swap risk is the variance of the future yield curve. The Company used the market information from December 31, 2013 and varied the future Libor curve as described in the table below:
| Libor increase | Libor decrease | |||||||||||||||
Fair value balance 12/31/2013 | Scenario I (+25%) | Scenario II (+50%) | Scenario III (-25%) | Scenario IV (-50%) | ||||||||||||
| Fair value balance | ||||||||||||||||
(36,500) | (23,644 | ) | (10,777 | ) | (49,436 | ) | (62,181 | ) | ||||||||
The Company analyzes the market risk in isolation, i.e., analyzes only the relevant market risk without considering other macroeconomic effects.
5 – Fair Value Estimate
It is assumed that the balances of accounts receivable from customers and accounts payable to suppliers at carrying amount, less PCLD, are close to their fair values. The fair value of financial liabilities is estimated by discounting the future contractual cash flows by the current market interest rate, available for the Company for similar financial instruments.
F-171
Table of Contents
The Company uses the following hierarchy to determine the fair value of financial instruments by the evaluation technique:
| 12/31/2013 | ||||||||||||||||
| LEVEL 1 | LEVEL 2 | LEVEL 3 | TOTAL | |||||||||||||
FINANCIAL ASSETS (Current / Noncurrent) | ||||||||||||||||
|
|
|
|
|
|
|
| |||||||||
Available for sale | 1,441,867 | 5,247,686 | — | 6,689,554 | ||||||||||||
|
|
|
|
|
|
|
| |||||||||
Investments (Shareholdings) | 1,441,867 | — | — | 1,441,867 | ||||||||||||
Financial Assets - Concessions distribution | — | 5,247,686 | — | 5,247,686 | ||||||||||||
|
|
|
|
|
|
|
| |||||||||
Measured at fair value through profit | 9,695,341 | 216,155 | — | 9,911,496 | ||||||||||||
|
|
|
|
|
|
|
| |||||||||
Cash and cash equivalents | 3,597,583 | — | — | 3,597,583 | ||||||||||||
Securities | 6,097,758 | — | — | 6,097,758 | ||||||||||||
Derivatives | — | 216,155 | — | 216,155 | ||||||||||||
FINANCIAL LIABILITIES (Current / Noncurrent) | ||||||||||||||||
|
|
|
|
|
|
|
| |||||||||
Measured at fair value through profit | — | 420,801 | — | 420,801 | ||||||||||||
|
|
|
|
|
|
|
| |||||||||
Derivatives | — | 420,801 | — | 420,801 | ||||||||||||
| 12/31/2012 | ||||||||||||||||
| LEVEL 1 | LEVEL 2 | LEVEL 3 | TOTAL | |||||||||||||
FINANCIAL ASSETS (Current / Noncurrent) | ||||||||||||||||
|
|
|
|
|
|
|
| |||||||||
Available for sale | 1,439,786 | 4,595,947 | — | 6,035,733 | ||||||||||||
|
|
|
|
|
|
|
| |||||||||
Investments (Shareholdings) | 1,439,786 | — | — | 1,439,786 | ||||||||||||
Financial Assets - Concessions distribution | — | 4,595,947 | — | 4,595,947 | ||||||||||||
|
|
|
|
|
|
|
| |||||||||
Measured at fair value through profit | 9,003,465 | 472,364 | — | 9,475,829 | ||||||||||||
|
|
|
|
|
|
|
| |||||||||
Cash and cash equivalents | 2,501,515 | — | — | 2,501,515 | ||||||||||||
Securities | 6,501,950 | — | — | 6,501,950 | ||||||||||||
Derivatives | — | 472,364 | — | 472,364 | ||||||||||||
FINANCIAL LIABILITIES (Current / Noncurrent) | ||||||||||||||||
|
|
|
|
|
|
|
| |||||||||
Measured at fair value through profit | — | 476,283 | — | 476,283 | ||||||||||||
|
|
|
|
|
|
|
| |||||||||
Derivatives | — | 476,283 | — | 476,283 | ||||||||||||
Financial assets and liabilities recorded at fair value were classified according to the following levels:
Level 1 – quoted prices (non-adjusted) in active markets, liquid and visible for identical assets and liabilities accessible on the date of measurement;
Level 2 – quoted prices (may or may not be adjusted) for similar assets or liabilities in active markets, other entries not observable in level 1, directly or indirectly, in the category of the asset or liability; and
F-172
Table of Contents
Level 3 – assets and liabilities for which prices do not exist or for which these prices or valuation techniques are supported by a small or non-existing market, not observable or liquid. At this level, the fair value estimate becomes highly subjective.
The fair value of financial instruments negotiated in active markets (such as securities held for trading and available for sale) is based on market prices, quoted on the balance sheet date. A market is seen as active if the quoted prices are readily and regularly available from a Stock Exchange, a distribution company, a broker, an industry group, a pricing service or regulatory agency, and such prices represent real market transactions that occur regularly on a purely commercial basis.
The market price quoted used for financial assets maintained by the Company is the current market price. These instruments are included in Level 1. Instruments included in that level include, mainly, equity investments of FTSE 100 companies classified as negotiable securities or available for sale.
The fair value of financial instruments not negotiated in active markets (for example, OTC derivatives) is determined by valuation techniques. These techniques maximize the use of data adopted by the market where it is available and trust as least as possible in the entity’s specific estimates. If all relevant information required for the fair value of an instrument is adopted by the market, the instrument will be included in Level 2.
If one or more relevant types of information is not based on data adopted by the market, the instrument will be included in level 3.
Specific valuation techniques used to value financial instruments include:
| • | Market prices quoted or quotations from financial institutions or brokers for similar instruments. |
| • | The fair value of interest rate swaps is calculated by the present value of the estimated future cash flows based on the yield curves adopted by the market. |
| • | The fair value of future foreign exchange contracts is determined based on future foreign exchange rates on the date of the balance sheet, with the resulting value discounted at present value. |
| • | Other techniques, such as analysis of discounted cash flows, which are used to determine the fair value for the remaining financial instruments. |
NOTE 45 – BUSINESS SEGMENT INFORMATION
Operational segments are defined as business activities from which it is possible to obtain revenues and incur expenses, on which operational decisions are made. The main operational decision making body, responsible for allocating resources and for appraising the performance of operational segments, is the Board of Directors, which is also responsible for the Company’s strategic decision making. The operating segments of the Company are Management, Generation, Transmission and Distribution, which are considered separately.
The Board of Directors assesses the performance of operational segments based on the measurement of net income.
F-173
Table of Contents
For the year ended December 31, 2013, management changed the reportable segments to better portray the operations of each segment and to better reflect how the business is managed. Under the new reportable segment structure, core segments will continue to be the Brazilian generation, transmission, and distribution markets; however, inter-segment balances will no longer eliminate. This is a change from prior years, where segment balances were presented net of inter-segment eliminations.
Business segment information, corresponding to the fiscal year ended on December 31, 2013 and 2012, are as follows:
| 12/31/2013 | ||||||||||||||||||||||||||||||||
| Generation | Transmission | |||||||||||||||||||||||||||||||
| Administration | Exploration Method | O&M Method | Exploration Framework | O&M Method | Distribution | Eliminations | Total | |||||||||||||||||||||||||
Net Operating Revenue | 71,772 | 14,633,670 | 2,054,657 | 1,349,213 | 2,854,102 | 4,498,837 | (1,626,607 | ) | 23,835,644 | |||||||||||||||||||||||
Operational expenses | (7,161,257 | ) | (11,407,123 | ) | (2,041,034 | ) | (2,485,406 | ) | (3,914,835 | ) | (6,610,401 | ) | 4,416,001 | (29,204,055 | ) | |||||||||||||||||
|
|
|
|
|
|
|
|
|
|
|
|
|
|
|
| |||||||||||||||||
Operating Profit. Before financial result | (7,089,485 | ) | 3,226,547 | 13,623 | (1,136,193 | ) | (1,060,733 | ) | (2,111,564 | ) | 2,789,394 | (5,368,411 | ) | |||||||||||||||||||
|
|
|
|
|
|
|
|
|
|
|
|
|
|
|
| |||||||||||||||||
Financial Results | 2,125,578 | (1,466,380 | ) | 217,828 | (292,168 | ) | (88,706 | ) | (282,540 | ) | 52,334 | 265,946 | ||||||||||||||||||||
Results of Shareholdings | (519,762 | ) | — | — | — | — | — | 697,530 | 177,768 | |||||||||||||||||||||||
Income tax and social contribution | (1,326,082 | ) | (242,139 | ) | (204,989 | ) | 194,458 | 212,490 | (416 | ) | — | (1,366,678 | ) | |||||||||||||||||||
|
|
|
|
|
|
|
|
|
|
|
|
|
|
|
| |||||||||||||||||
Net income (loss) | (6,809,751 | ) | 1,518,028 | 26,462 | (1,233,903 | ) | (936,949 | ) | (2,394,520 | ) | 3,539,258 | (6,291,375 | ) | |||||||||||||||||||
|
|
|
|
|
|
|
|
|
|
|
|
|
|
|
| |||||||||||||||||
| 12/31/2012 | ||||||||||||||||||||||||||||||||
| Generation | Transmission | |||||||||||||||||||||||||||||||
| Administration | Exploration Method | O&M Method | Exploration Framework | O&M Method | Distribution | Eliminations | Total | |||||||||||||||||||||||||
Net Operating Revenue | 69,259 | 19,185,060 | — | 6,741,198 | — | 4,675,664 | (2,656,885 | ) | 28,014,296 | |||||||||||||||||||||||
Operational expenses | (2,571,528 | ) | (17,868,099 | ) | — | (5,556,712 | ) | — | (5,421,152 | ) | 3,775,605 | (27,641,887 | ) | |||||||||||||||||||
|
|
|
|
|
|
|
|
|
|
|
|
|
|
|
| |||||||||||||||||
Operating Profit. Before financial result | (2,502,269 | ) | 1,316,961 | — | 1,184,486 | — | (745,488 | ) | 1,118,720 | 372,409 | ||||||||||||||||||||||
|
|
|
|
|
|
|
|
|
|
|
|
|
|
|
| |||||||||||||||||
Financial Results | 3,170,259 | (626,322 | ) | — | (612,840 | ) | — | (139,868 | ) | (106,754 | ) | 1,684,475 | ||||||||||||||||||||
Effect of Law 12.783/13 | — | (7,226,581 | ) | — | (3,134,874 | ) | — | 276,075 | — | (10,085,380 | ) | |||||||||||||||||||||
Results of Shareholdings | (7,533,116 | ) | — | — | — | — | 8,145,317 | 612,202 | ||||||||||||||||||||||||
Income tax and social contribution | (644,209 | ) | 817,719 | — | 342,594 | — | (25,462 | ) | — | 490,642 | ||||||||||||||||||||||
|
|
|
|
|
|
|
|
|
|
|
|
|
|
|
| |||||||||||||||||
Net income (loss) | (7,509,336 | ) | (5,718,223 | ) | — | (2,220,634 | ) | — | (634,743 | ) | 9,157,283 | (6,925,652 | ) | |||||||||||||||||||
|
|
|
|
|
|
|
|
|
|
|
|
|
|
|
| |||||||||||||||||
| 12/31/2011 * | ||||||||||||||||||||
| Administration | Generation | Transmission | Distribution | Total | ||||||||||||||||
Net Operating Revenue | 192,963 | 19,093,367 | 7,778,698 | 2,467,716 | 29,532,744 | |||||||||||||||
Operational expenses | (2,094,716 | ) | (13,690,743 | ) | (7,071,445 | ) | (2,532,998 | ) | — | |||||||||||
|
|
|
|
|
|
|
|
|
| |||||||||||
Operating Profit. Before financial result | (1,901,753 | ) | 5,402,624 | 707,253 | (65,282 | ) | 4,142,842 | |||||||||||||
|
|
|
|
|
|
|
|
|
| |||||||||||
Financial Results | 1,909,379 | (1,218,314 | ) | (436,152 | ) | (20,460 | ) | 234,453 | ||||||||||||
Results of Investments in Subsidiaries | 482,785 | — | — | — | 482,785 | |||||||||||||||
Income tax and social contribution | (189,200 | ) | (696,752 | ) | (198,294 | ) | (13,815 | ) | (1,098,061 | ) | ||||||||||
Non-controlling Interest | (29,454 | ) | — | — | — | (29,454 | ) | |||||||||||||
|
|
|
|
|
|
|
|
|
| |||||||||||
Net Profit (loss) in the Fiscal Year | 271,757 | 3,487,558 | 72,807 | (99,557 | ) | 3,732,565 | ||||||||||||||
|
|
|
|
|
|
|
|
|
| |||||||||||
| * | We have not restated data for 2011 to reflect the application of IFRS 11. |
F-174
Table of Contents
NOTE 46 – RELATED-PARTY TRANSACTIONS
The parent company of Eletrobras is the federal government, who holds 54.46% of the Company’s common and preferred shares (See Note 37).
The Company’s transactions with its subsidiaries, controlled companies and special purpose entities are carried out at prices and conditions comparable with those in the market. Among the main related-party transactions, we highlight loans and financing granted under the same conditions as those in the market and/or according to matter-specific legislation. All other transactions were also established under normal market conditions.
| 12/31/2013 | 12/31/2012 | |||||||||||||||||||||||||
COMPANIES | NATURE OF THE TRANSACTION | ASSET | LIABILITY | RESULT | ASSET | LIABILITY | RESULT | |||||||||||||||||||
PODER PÚBLICO FEDERAL | Consumers and resellers | — | — | — | 13,539 | — | — | |||||||||||||||||||
Accounts receivable | 16,716 | — | — | 3,008 | — | — | ||||||||||||||||||||
Other receivables | — | — | — | — | — | — | ||||||||||||||||||||
Supply of electricity | — | — | — | — | — | — | ||||||||||||||||||||
Other expenses | — | — | 13,231 | — | — | — | ||||||||||||||||||||
Other revenue | — | — | 62,848 | — | — | 81,975 | ||||||||||||||||||||
|
|
|
|
|
|
|
|
|
|
|
| |||||||||||||||
| 16,716 | — | 76,079 | 16,547 | — | 81,975 | |||||||||||||||||||||
| BNDES | Loans and financing payable | — | — | — | — | 4,888,893 | — | |||||||||||||||||||
|
|
|
|
|
|
|
|
|
|
|
| |||||||||||||||
| — | — | — | — | 4,888,893 | — | |||||||||||||||||||||
| REAL GRANDEZA | Accounts receivable | — | — | — | 5,411 | — | — | |||||||||||||||||||
Social security contributions | — | — | — | — | 5,138 | — | ||||||||||||||||||||
Providers | — | — | — | — | 80 | — | ||||||||||||||||||||
Accounts payable | — | (202,598 | ) | — | — | (267,534 | ) | — | ||||||||||||||||||
Other Obligations | — | — | — | — | — | — | ||||||||||||||||||||
Contracts actuarial debt | — | — | — | — | 24,374 | — | ||||||||||||||||||||
Other liabilities | — | 5,943 | — | — | 197,440 | — | ||||||||||||||||||||
Cost of debt / monetary variation | — | — | — | — | — | — | ||||||||||||||||||||
Normal contributions maintainer | — | — | — | — | — | (16,198 | ) | |||||||||||||||||||
financial income | — | — | 757 | — | — | 279 | ||||||||||||||||||||
Actuarial assets - low and actuarial provision | — | — | — | — | — | (19,812 | ) | |||||||||||||||||||
financial expenses | — | — | — | — | — | 4 | ||||||||||||||||||||
actuarial costs | — | — | — | — | — | — | ||||||||||||||||||||
Other expenses | — | — | (40,593 | ) | — | — | (79,464 | ) | ||||||||||||||||||
Other Revenues | — | — | 15,915 | |||||||||||||||||||||||
Actuarial provision | — | — | — | — | — | — | ||||||||||||||||||||
Contributions administrative desp | — | — | — | — | — | — | ||||||||||||||||||||
Reversal of contributions | — | — | — | — | — | 19,914 | ||||||||||||||||||||
|
|
|
|
|
|
|
|
|
|
|
| |||||||||||||||
| — | (196,655 | ) | (23,921 | ) | 5,411 | (40,502 | ) | (95,277 | ) | |||||||||||||||||
| NUCLEOS | Other assets | — | — | — | — | — | — | |||||||||||||||||||
social security contributions | — | — | — | — | 2,942 | — | ||||||||||||||||||||
Reversal of contributions | — | — | — | — | — | 20,733 | ||||||||||||||||||||
actuarial provision | — | — | — | — | — | — | ||||||||||||||||||||
Normal contributions maintainer | — | — | — | — | — | (20,733 | ) | |||||||||||||||||||
Other expenses | — | — | — | — | — | — | ||||||||||||||||||||
|
|
|
|
|
|
|
|
|
|
|
| |||||||||||||||
| — | — | — | — | 2,942 | — | |||||||||||||||||||||
| SC ENERGIA | Accounts receivable | — | — | — | — | — | — | |||||||||||||||||||
JCP / Dividends receivable | — | — | — | — | — | — | ||||||||||||||||||||
AFAC | — | — | — | — | — | — | ||||||||||||||||||||
Equity investment | — | — | — | — | — | — | ||||||||||||||||||||
Income from equity | — | — | — | — | — | — | ||||||||||||||||||||
Accumulated equity | — | — | — | — | — | — | ||||||||||||||||||||
Revenue from services | — | — | — | — | — | — | ||||||||||||||||||||
Other revenue | — | — | — | — | — | — | ||||||||||||||||||||
|
|
|
|
|
|
|
|
|
|
|
| |||||||||||||||
| — | — | — | — | — | ||||||||||||||||||||||
| RS ENERGIA | Accounts receivable | — | — | — | 1 | — | — | |||||||||||||||||||
JCP / Dividends receivable | — | — | — | 2,332 | — | — | ||||||||||||||||||||
AFAC | — | — | — | — | — | — | ||||||||||||||||||||
Equity investment | — | — | — | 221,325 | — | — | ||||||||||||||||||||
Other liabilities | — | — | — | — | — | |||||||||||||||||||||
Income from equity | — | — | 4,882 | — | — | 8,182 | ||||||||||||||||||||
Accumulated equity | — | — | — | 10,594 | — | — | ||||||||||||||||||||
Other assets | — | — | — | 1 | — | — | ||||||||||||||||||||
Revenue from services | — | — | — | — | — | 1,330 | ||||||||||||||||||||
Revenues from grid | — | — | — | — | — | 4 | ||||||||||||||||||||
Other revenue | — | — | — | — | — | 15 | ||||||||||||||||||||
|
|
|
|
|
|
|
|
|
|
|
| |||||||||||||||
| — | — | 4,882 | 234,253 | — | 9,531 | |||||||||||||||||||||
F-175
Table of Contents
| 12/31/2013 | 12/31/2012 | |||||||||||||||||||||||||
COMPANIES | NATURE OF THE TRANSACTION | ASSET | LIABILITY | RESULT | ASSET | LIABILITY | RESULT | |||||||||||||||||||
| UIRAPURU | Accounts receivable | — | — | — | 1 | — | — | |||||||||||||||||||
JCP / Dividends receivable | 1,736 | — | — | 1,908 | — | — | ||||||||||||||||||||
Other assets | 5,304 | — | — | |||||||||||||||||||||||
Equity investment | 40,600 | — | — | 33,111 | — | — | ||||||||||||||||||||
Providers | — | 2 | — | |||||||||||||||||||||||
Other liabilities | — | — | — | — | — | — | ||||||||||||||||||||
Accumulated equity | — | — | — | 7,271 | — | — | ||||||||||||||||||||
Income from equity | — | — | 7,433 | — | — | 7,935 | ||||||||||||||||||||
Revenues from grid | — | — | — | — | — | 2 | ||||||||||||||||||||
Revenue from services | — | — | 2,430 | — | — | 2,289 | ||||||||||||||||||||
Other revenue | — | — | 20 | — | — | 16 | ||||||||||||||||||||
Charges for use of transmission grid | — | — | (21 | ) | — | — | — | |||||||||||||||||||
|
|
|
|
|
|
|
|
|
|
|
| |||||||||||||||
| 47,640 | 2 | 9,862 | 42,291 | — | 10,242 | |||||||||||||||||||||
| ARTEMIS | Accounts receivable | — | — | — | 2 | — | — | |||||||||||||||||||
JCP / Dividends receivable | — | — | — | 15,945 | — | — | ||||||||||||||||||||
Equity investment | — | — | — | 148,578 | — | — | ||||||||||||||||||||
Accumulated equity | — | — | — | 16,809 | — | — | ||||||||||||||||||||
Income from equity | — | — | 3,592 | — | — | 26,989 | ||||||||||||||||||||
Other assets | — | — | — | 537 | — | — | ||||||||||||||||||||
Revenue from services | — | — | — | — | — | 5,606 | ||||||||||||||||||||
Revenues from grid | — | — | — | — | — | 9 | ||||||||||||||||||||
Other revenue | — | — | — | — | — | — | ||||||||||||||||||||
|
|
|
|
|
|
|
|
|
|
|
| |||||||||||||||
| — | — | 3,592 | 181,871 | — | 32,604 | |||||||||||||||||||||
| PORTO VELHO | Accounts receivable | — | — | — | 2 | — | — | |||||||||||||||||||
JCP / Dividends receivable | — | — | — | 1,351 | — | — | ||||||||||||||||||||
Equity investment | — | — | — | 297,793 | — | — | ||||||||||||||||||||
AFAC | — | — | — | — | — | — | ||||||||||||||||||||
Accumulated equity | — | — | — | 3,238 | — | — | ||||||||||||||||||||
Other liabilities | — | — | — | — | — | — | ||||||||||||||||||||
Other revenue | — | — | — | — | — | 60 | ||||||||||||||||||||
Costs of equity | — | — | — | — | — | — | ||||||||||||||||||||
Income from equity | — | — | 1,746 | — | — | 2,685 | ||||||||||||||||||||
Revenues from grid | — | — | — | — | — | — | ||||||||||||||||||||
Revenue from services | — | — | — | — | — | — | ||||||||||||||||||||
|
|
|
|
|
|
|
|
|
|
|
| |||||||||||||||
| — | — | 1,746 | 302,384 | — | 2,745 | |||||||||||||||||||||
| NORTE BRASIL | Equity investment | 231,446 | — | — | 189,640 | — | — | |||||||||||||||||||
Accounts receivable | — | — | — | — | — | — | ||||||||||||||||||||
JCP / Dividends receivable | — | — | — | 805 | — | — | ||||||||||||||||||||
Accumulated equity | — | — | — | 3,984 | — | — | ||||||||||||||||||||
Other assets | 68 | — | — | — | — | — | ||||||||||||||||||||
Income from equity | — | — | 237,116 | — | — | 3,414 | ||||||||||||||||||||
Revenue from services | — | — | 204 | — | — | — | ||||||||||||||||||||
|
|
|
|
|
|
|
|
|
|
|
| |||||||||||||||
| 231,514 | — | 237,320 | 194,429 | — | 3,414 | |||||||||||||||||||||
| ETAU | Accounts receivable | — | — | — | — | — | — | |||||||||||||||||||
JCP / Dividends receivable | 58 | — | — | 535 | — | — | ||||||||||||||||||||
Equity investment | 24,199 | — | — | 9,567 | — | — | ||||||||||||||||||||
Accumulated equity | — | — | — | 14,129 | — | — | ||||||||||||||||||||
Income from equity | — | — | 3,844 | — | — | 4,793 | ||||||||||||||||||||
Other assets | 62 | — | — | 16 | — | — | ||||||||||||||||||||
Providers | — | 3 | — | — | — | — | ||||||||||||||||||||
Revenues from grid | — | — | — | — | — | 1 | ||||||||||||||||||||
Revenue from services | — | — | 752 | — | — | 219 | ||||||||||||||||||||
Other revenue | — | — | 8 | — | — | 2 | ||||||||||||||||||||
Costs of equity | — | — | — | — | — | — | ||||||||||||||||||||
Charges for use of transmission grid | — | — | (25 | ) | — | — | — | |||||||||||||||||||
|
|
|
|
|
|
|
|
|
|
|
| |||||||||||||||
| 24,319 | 3 | 4,579 | 24,247 | — | 5,015 | |||||||||||||||||||||
| ESBR | Equity investment | 2,752,140 | — | — | 952,342 | — | — | |||||||||||||||||||
Other liabilities | — | — | — | (12,518 | ) | — | — | |||||||||||||||||||
Other Comprehensive Income | — | 133 | — | — | — | — | ||||||||||||||||||||
Costs of equity | — | — | (77,777 | ) | — | — | (4,352 | ) | ||||||||||||||||||
|
|
|
|
|
|
|
|
|
|
|
| |||||||||||||||
| 2,752,140 | 133 | (77,777 | ) | 939,824 | — | (4,352 | ) | |||||||||||||||||||
| CERRO CHATO I | Accounts receivable | — | — | — | 5 | — | — | |||||||||||||||||||
AFAC | — | — | — | — | — | — | ||||||||||||||||||||
Equity investment | — | — | — | 86,940 | — | — | ||||||||||||||||||||
Accumulated equity | — | — | — | 440 | — | — | ||||||||||||||||||||
Other Assets | — | — | — | — | — | — | ||||||||||||||||||||
Revenue from services | — | — | — | 1 | — | — | ||||||||||||||||||||
Income from equity | — | — | 325 | — | — | — | ||||||||||||||||||||
Revenues from grid | — | — | — | — | — | 57 | ||||||||||||||||||||
Costs of equity | — | — | — | — | — | (261 | ) | |||||||||||||||||||
Other revenue | — | — | — | — | — | 9 | ||||||||||||||||||||
|
|
|
|
|
|
|
|
|
|
|
| |||||||||||||||
| — | — | 325 | 86,506 | — | (195 | ) | ||||||||||||||||||||
| CERRO CHATO II | Accounts receivable | — | — | — | 5 | — | — | |||||||||||||||||||
AFAC | — | — | — | — | — | — | ||||||||||||||||||||
Equity investment | — | — | — | 81,090 | — | — | ||||||||||||||||||||
Accumulated equity | — | — | — | 1,084 | — | — | ||||||||||||||||||||
Other assets | — | — | — | 1 | — | — | ||||||||||||||||||||
Income from equity | — | — | 478 | — | — | — | ||||||||||||||||||||
Costs of equity | — | — | — | — | — | (904 | ) | |||||||||||||||||||
Revenues from grid | — | — | — | — | — | 57 | ||||||||||||||||||||
Other revenue | — | — | — | — | — | 9 | ||||||||||||||||||||
|
|
|
|
|
|
|
|
|
|
|
| |||||||||||||||
| — | — | 478 | 80,012 | — | (838 | ) | ||||||||||||||||||||
| CERRO CHATO III | Accounts receivable | — | — | — | 5 | — | — | |||||||||||||||||||
JCP / Dividends receivable | — | — | — | 176 | — | — | ||||||||||||||||||||
Equity investment | — | — | — | 74,970 | — | — | ||||||||||||||||||||
Accumulated equity | — | — | — | 850 | — | — | ||||||||||||||||||||
AFAC | — | — | — | — | — | — | ||||||||||||||||||||
Income from equity | — | — | 543 | — | — | — | ||||||||||||||||||||
Costs of equity | — | — | — | — | — | (1,721 | ) | |||||||||||||||||||
Revenues from grid | — | — | — | — | — | 57 | ||||||||||||||||||||
Other revenue | — | — | — | — | — | 8 | ||||||||||||||||||||
|
|
|
|
|
|
|
|
|
|
|
| |||||||||||||||
| — | — | 543 | 76,001 | — | (1,656 | ) | ||||||||||||||||||||
F-176
Table of Contents
| 12/31/2013 | 12/31/2012 | |||||||||||||||||||||||||
COMPANIES | NATURE OF THE TRANSACTION | ASSET | LIABILITY | RESULT | ASSET | LIABILITY | RESULT | |||||||||||||||||||
TELES PIRES | AFAC | — | — | — | — | — | — | |||||||||||||||||||
Equity investment | 262,964 | — | — | 184,194 | — | — | ||||||||||||||||||||
Accumulated equity | — | — | — | — | — | — | ||||||||||||||||||||
Other receivables | — | — | — | — | — | — | ||||||||||||||||||||
Income from equity | — | — | — | (3,734 | ) | |||||||||||||||||||||
Revenue from services | — | — | 9,605 | — | — | 196 | ||||||||||||||||||||
Costs of equity | — | — | (6,800 | ) | — | — | (3,734 | ) | ||||||||||||||||||
Other revenue | — | — | 111 | — | — | — | ||||||||||||||||||||
|
|
|
|
|
|
|
|
|
|
|
| |||||||||||||||
| 262,964 | — | 2,916 | 184,194 | — | (7,272 | ) | ||||||||||||||||||||
INTEGRAÇÃO | Equity investment | 22,455 | — | — | — | — | — | |||||||||||||||||||
JCP / Dividends receivable | — | — | — | — | — | — | ||||||||||||||||||||
Accumulated equity | — | — | — | 20,155 | — | — | ||||||||||||||||||||
Income from equity | — | — | 11,342 | — | — | 9,197 | ||||||||||||||||||||
Costs of equity | — | — | — | — | — | — | ||||||||||||||||||||
|
|
|
|
|
|
|
|
|
|
|
| |||||||||||||||
| 22,455 | — | 11,342 | 20,155 | — | 9,197 | |||||||||||||||||||||
COSTA OESTE | JCP / Dividends receivable | 458 | — | — | — | — | — | |||||||||||||||||||
AFAC | 15,104 | — | — | — | — | — | ||||||||||||||||||||
Equity investment | 4,278 | — | — | 1,390 | — | — | ||||||||||||||||||||
Accumulated equity | — | — | — | 252 | — | — | ||||||||||||||||||||
Costs of equity | — | — | — | — | — | (252 | ) | |||||||||||||||||||
Income from equity | — | — | 3,599 | — | — | — | ||||||||||||||||||||
|
|
|
|
|
|
|
|
|
|
|
| |||||||||||||||
| 19,840 | — | 3,599 | 1,138 | — | (252 | ) | ||||||||||||||||||||
TSBE | Accounts receivable | — | — | — | — | — | — | |||||||||||||||||||
JCP / Dividends receivable | 1,440 | — | — | — | — | — | ||||||||||||||||||||
AFAC | 86,400 | — | — | — | — | — | ||||||||||||||||||||
Investments in equity interests | — | — | — | — | — | — | ||||||||||||||||||||
Equity investment | 167,403 | — | — | 6,408 | — | — | ||||||||||||||||||||
Other assets | 208 | — | — | — | ||||||||||||||||||||||
Accumulated equity | — | — | — | (107 | ) | — | — | |||||||||||||||||||
Income from equity | — | — | 4,789 | — | — | — | ||||||||||||||||||||
Revenue from services | — | — | — | — | — | 105 | ||||||||||||||||||||
Other Revenues | — | — | 2,595 | — | — | |||||||||||||||||||||
Costs of equity | — | — | — | — | — | (106 | ) | |||||||||||||||||||
|
|
|
|
|
|
|
|
|
|
|
| |||||||||||||||
| 255,451 | — | 7,384 | 6,301 | — | (1 | ) | ||||||||||||||||||||
LIVRAMENTO | Accounts receivable | — | — | — | — | — | — | |||||||||||||||||||
Investments in equity interests | — | — | — | — | — | — | ||||||||||||||||||||
AFAC | — | — | — | — | — | — | ||||||||||||||||||||
Equity investment | 97,348 | — | — | 36,055 | �� | — | — | |||||||||||||||||||
Other assets | 112 | — | — | — | — | — | ||||||||||||||||||||
Accumulated equity | — | — | — | (775 | ) | — | — | |||||||||||||||||||
Other Revenues | — | — | 125 | — | ||||||||||||||||||||||
Revenue from services | — | — | — | — | — | 119 | ||||||||||||||||||||
Costs of equity | — | — | (10,963 | ) | — | — | (775 | ) | ||||||||||||||||||
|
|
|
|
|
|
|
|
|
|
|
| |||||||||||||||
| 97,460 | — | (10,838 | ) | 35,280 | — | (656 | ) | |||||||||||||||||||
SANTA VITÓRIA | Accounts receivable | — | — | — | — | — | — | |||||||||||||||||||
Investments in equity interests | — | — | — | — | — | — | ||||||||||||||||||||
AFAC | — | — | — | — | — | — | ||||||||||||||||||||
Equity investment | 185,970 | — | — | 97,551 | — | — | ||||||||||||||||||||
Accumulated equity | — | — | — | (492 | ) | — | — | |||||||||||||||||||
Income from equity | — | — | 138 | — | — | — | ||||||||||||||||||||
Costs of equity | — | — | — | — | — | (492 | ) | |||||||||||||||||||
Other revenue | — | — | — | — | — | 119 | ||||||||||||||||||||
Revenue from services | — | — | — | — | — | — | ||||||||||||||||||||
|
|
|
|
|
|
|
|
|
|
|
| |||||||||||||||
| 185,970 | — | 138 | 97,059 | — | (373 | ) | ||||||||||||||||||||
MARUMBI | AFAC | 4,505 | — | — | — | — | — | |||||||||||||||||||
JCP / Dividends receivable | 101 | — | — | — | — | — | ||||||||||||||||||||
Equity investment | 1,151 | — | — | 622 | — | — | ||||||||||||||||||||
Accumulated equity | — | — | — | (52 | ) | — | — | |||||||||||||||||||
Costs of equity | — | — | — | — | — | (52 | ) | |||||||||||||||||||
Income from equity | — | — | 682 | — | — | — | ||||||||||||||||||||
|
|
|
|
|
|
|
|
|
|
|
| |||||||||||||||
| 5,757 | — | 682 | 570 | — | (52 | ) | ||||||||||||||||||||
CHUI | Investments in equity interests | — | — | — | — | — | — | |||||||||||||||||||
Equity investment | 75,210 | — | — | 33,887 | — | — | ||||||||||||||||||||
Accumulated equity | — | — | — | (281 | ) | — | — | |||||||||||||||||||
Costs of equity | — | — | (193 | ) | — | — | (281 | ) | ||||||||||||||||||
|
|
|
|
|
|
|
|
|
|
|
| |||||||||||||||
| 75,210 | — | (193 | ) | 33,606 | — | (281 | ) | |||||||||||||||||||
AMAPARI ENERGIA | Equity investment | — | — | — | 39,191 | — | — | |||||||||||||||||||
Income from equity | — | — | — | — | — | 7,355 | ||||||||||||||||||||
|
|
|
|
|
|
|
|
|
|
|
| |||||||||||||||
| — | — | — | 39,191 | — | 7,355 | |||||||||||||||||||||
FACHESF | Providers | — | 302 | — | — | 2,160 | — | |||||||||||||||||||
social security contributions | — | 14,238 | — | — | — | — | ||||||||||||||||||||
Contracts actuarial debt | — | — | — | — | 2,523 | — | ||||||||||||||||||||
normal contribution | — | — | — | — | 11,001 | — | ||||||||||||||||||||
Actuarial costs | — | — | (110,199 | ) | — | — | (30,650 | ) | ||||||||||||||||||
financial expenses | — | — | (60 | ) | — | — | (31,363 | ) | ||||||||||||||||||
operational expenses | — | — | — | — | — | (18,581 | ) | |||||||||||||||||||
Other expenses | — | — | (17,732 | ) | — | — | — | |||||||||||||||||||
|
|
|
|
|
|
|
|
|
|
|
| |||||||||||||||
| — | 14,540 | (127,992 | ) | — | 15,684 | (80,594 | ) | |||||||||||||||||||
TDG | Equity investment | 49,829 | — | — | 45,183 | — | — | |||||||||||||||||||
Dividends / JCP Receivables | 2,152 | — | — | — | — | — | ||||||||||||||||||||
AFAC | 86,000 | — | — | — | — | — | ||||||||||||||||||||
Other assets | — | — | — | — | — | — | ||||||||||||||||||||
Accounts receivable | — | — | — | — | — | — | ||||||||||||||||||||
Accounts payable | — | 125 | — | — | — | |||||||||||||||||||||
Income from equity | — | — | 6,798 | — | — | — | ||||||||||||||||||||
Revenue from services | — | — | 57 | — | — | 875 | ||||||||||||||||||||
Income from equity | — | — | — | — | — | — | ||||||||||||||||||||
Costs of equity | — | — | — | — | — | (4,352 | ) | |||||||||||||||||||
|
|
|
|
|
|
|
|
|
|
|
| |||||||||||||||
| 137,981 | 125 | 6,855 | 45,183 | — | (3,477 | ) | ||||||||||||||||||||
MANAUS TRANSMISSÃO | Equity investment | 207,038 | — | — | 187,758 | — | — | |||||||||||||||||||
AFAC | 13,650 | — | — | — | ||||||||||||||||||||||
Other assets | 1,338 | — | — | — | — | — | ||||||||||||||||||||
Other liabilities | — | 491 | — | — | — | — | ||||||||||||||||||||
Other comprehensive income | — | — | — | — | — | — | ||||||||||||||||||||
Income from equity | — | — | 329,402 | — | — | — | ||||||||||||||||||||
Charges for use of transmission grid | — | — | (7,003 | ) | — | — | — | |||||||||||||||||||
Costs of equity | — | — | — | — | — | (5,452 | ) | |||||||||||||||||||
|
|
|
|
|
|
|
|
|
|
|
| |||||||||||||||
| 222,026 | 491 | 322,399 | 187,758 | — | (5,452 | ) | ||||||||||||||||||||
F-177
Table of Contents
| 12/31/2013 | 12/31/2012 | |||||||||||||||||||||||||
COMPANIES | NATURE OF THE TRANSACTION | ASSET | LIABILITY | RESULT | ASSET | LIABILITY | RESULT | |||||||||||||||||||
IEMADEIRA | Equity investment | 674,902 | — | — | 514,112 | — | — | |||||||||||||||||||
Dividends / JCP Receivables | 311,414 | — | — | — | — | — | ||||||||||||||||||||
Other assets | — | — | — | — | — | — | ||||||||||||||||||||
AFAC | 11,025 | — | — | — | — | — | ||||||||||||||||||||
Providers | — | 1,624 | — | — | — | — | ||||||||||||||||||||
Accounts payable | — | (805 | ) | — | — | — | — | |||||||||||||||||||
Other comprehensive income | — | — | — | — | — | — | ||||||||||||||||||||
Revenue from services | — | — | 10,251 | — | — | — | ||||||||||||||||||||
Other Receivables | — | — | 7,350 | — | — | — | ||||||||||||||||||||
Income from equity | — | — | 39,720 | — | — | 19,116 | ||||||||||||||||||||
Charges for use of transmission grid | — | — | (4,556 | ) | — | — | — | |||||||||||||||||||
Other Expenses | — | — | — | — | — | — | ||||||||||||||||||||
|
|
|
|
|
|
|
|
|
|
|
| |||||||||||||||
| 997,341 | 819 | 52,765 | 514,112 | — | 19,116 | |||||||||||||||||||||
MANAUS CONSTRUÇÃO | JCP / Dividends receivable | 9,377 | — | — | 2,970 | — | — | |||||||||||||||||||
Equity investment | 3,533 | — | — | 15,410 | — | — | ||||||||||||||||||||
Income from equity | — | — | 20,340 | — | — | 3,556 | ||||||||||||||||||||
|
|
|
|
|
|
|
|
|
|
|
| |||||||||||||||
| 12,910 | — | 20,340 | 18,380 | — | 3,556 | |||||||||||||||||||||
STN | Accounts receivable | — | — | — | 177 | — | — | |||||||||||||||||||
Other receivables | 191 | — | — | — | — | — | ||||||||||||||||||||
Dividends / JCP Receivables | 1,292 | — | — | — | — | — | ||||||||||||||||||||
Equity investment | 195,154 | — | — | 188,861 | — | — | ||||||||||||||||||||
Providers | — | 1,439 | — | — | 1,226 | — | ||||||||||||||||||||
Income from equity | — | — | 38,082 | — | — | 17,615 | ||||||||||||||||||||
Income from Equity / Dividends | — | — | — | — | — | 7,494 | ||||||||||||||||||||
Revenue from services | — | — | 2,297 | — | — | 2,134 | ||||||||||||||||||||
Financial Income | — | — | — | — | — | — | ||||||||||||||||||||
Charges for use of transmission grid | — | — | (14,740 | ) | — | — | 11,321 | |||||||||||||||||||
|
|
|
|
|
|
|
|
|
|
|
| |||||||||||||||
| 196,637 | 1,439 | 25,639 | 189,038 | 1,226 | 15,922 | |||||||||||||||||||||
INTESA | JCP / Dividends receivable | 1,334 | — | — | 762 | — | — | |||||||||||||||||||
Equity investment | 38,152 | — | — | 35,646 | — | — | ||||||||||||||||||||
Providers | — | 1,108 | — | — | 924 | — | ||||||||||||||||||||
Income from equity | — | — | 3,660 | — | — | 4,107 | ||||||||||||||||||||
Income from Equity / Dividends | — | — | 720 | — | — | — | ||||||||||||||||||||
Charges for use of transmission grid | — | — | (11,347 | ) | — | — | (8,696 | ) | ||||||||||||||||||
|
|
|
|
|
|
|
|
|
|
|
| |||||||||||||||
| 39,486 | 1,108 | (6,967 | ) | 36,408 | 924 | (4,589 | ) | |||||||||||||||||||
EAPSA | customers | 131 | — | — | — | — | — | |||||||||||||||||||
Consumers and resellers | — | — | — | 242 | — | — | ||||||||||||||||||||
JCP / Dividends receivable | 3,379 | — | — | 3,090 | — | — | ||||||||||||||||||||
Equity investment | 92,842 | — | — | 261,301 | — | — | ||||||||||||||||||||
Income from equity | — | — | 13,521 | — | — | 40,404 | ||||||||||||||||||||
Costs of equity | — | — | — | — | — | — | ||||||||||||||||||||
|
|
|
|
|
|
|
|
|
|
|
| |||||||||||||||
| 96,352 | — | 13,521 | 264,633 | — | 40,404 | |||||||||||||||||||||
SETE GAMELEIRAS | Accounts receivable | 5 | — | — | 15 | — | — | |||||||||||||||||||
Other receivables | — | — | — | — | — | — | ||||||||||||||||||||
Equity investment | 20,243 | — | — | 19,810 | — | — | ||||||||||||||||||||
Revenue from services | — | — | 25 | — | — | 56 | ||||||||||||||||||||
Costs of equity | — | — | (743 | ) | — | — | (88 | ) | ||||||||||||||||||
|
|
|
|
|
|
|
|
|
|
|
| |||||||||||||||
| 20,248 | — | (718 | ) | 19,825 | — | (32 | ) | |||||||||||||||||||
S. PEDRO DO LAGO | Equity investment | 15,118 | — | — | 14,098 | — | — | |||||||||||||||||||
Accounts receivable | 5 | — | — | 15 | — | — | ||||||||||||||||||||
Other receivables | — | — | — | — | — | — | ||||||||||||||||||||
Revenue from services | — | — | 25 | — | — | 56 | ||||||||||||||||||||
Costs of equity | — | — | (58 | ) | — | — | (117 | ) | ||||||||||||||||||
|
|
|
|
|
|
|
|
|
|
|
| |||||||||||||||
| 15,123 | — | (33 | ) | 14,113 | — | (61 | ) | |||||||||||||||||||
PEDRA BRANCA | Equity investment | 14,096 | — | — | 13,504 | — | — | |||||||||||||||||||
Accounts receivable | 5 | — | — | — | — | — | ||||||||||||||||||||
Other receivables | 25 | — | — | — | — | — | ||||||||||||||||||||
Consumers and resellers | — | — | — | 15 | — | — | ||||||||||||||||||||
Revenue from services | — | — | 329 | — | — | 56 | ||||||||||||||||||||
Costs of equity | — | — | (735 | ) | — | — | (118 | ) | ||||||||||||||||||
|
|
|
|
|
|
|
|
|
|
|
| |||||||||||||||
| 14,126 | — | (406 | ) | 13,519 | — | (62 | ) | |||||||||||||||||||
AMAPARI | AFAC | — | — | — | — | — | — | |||||||||||||||||||
Equity investment | — | — | — | — | — | — | ||||||||||||||||||||
Income from equity | — | — | 41,623 | — | — | — | ||||||||||||||||||||
|
|
|
|
|
|
|
|
|
|
|
| |||||||||||||||
| — | — | 41,623 | — | — | — | |||||||||||||||||||||
BRASVENTO MIASSABA | customers | 68 | — | — | — | |||||||||||||||||||||
AFAC | 22,885 | — | — | 22,885 | — | — | ||||||||||||||||||||
Equity investment | 8,247 | — | — | 9,534 | — | — | ||||||||||||||||||||
Other assets | — | — | — | — | — | — | ||||||||||||||||||||
Revenue from services | — | — | 113 | — | — | — | ||||||||||||||||||||
Income from equity | — | — | 31,131 | — | — | (799 | ) | |||||||||||||||||||
Revenues from grid | — | — | — | — | — | — | ||||||||||||||||||||
Remuneration of the financial asset | — | — | 270 | — | — | — | ||||||||||||||||||||
Costs of equity | — | — | (1,288 | ) | — | — | — | |||||||||||||||||||
|
|
|
|
|
|
|
|
|
|
|
| |||||||||||||||
| 31,200 | — | 30,226 | 32,419 | — | (799 | ) | ||||||||||||||||||||
BRASVENTO EOLO | AFAC | 16,691 | — | — | 16,691 | — | — | |||||||||||||||||||
Equity investment | 5,870 | — | — | 6,938 | — | — | ||||||||||||||||||||
customers | 58 | — | — | — | — | — | ||||||||||||||||||||
Other assets | — | — | — | — | — | — | ||||||||||||||||||||
Revenue from services | — | — | 210 | — | — | — | ||||||||||||||||||||
Income from equity | — | — | 22,306 | — | — | (623 | ) | |||||||||||||||||||
Remuneration of the financial asset | — | — | 135 | — | — | — | ||||||||||||||||||||
Costs of equity | — | — | (1,068 | ) | — | — | — | |||||||||||||||||||
|
|
|
|
|
|
|
|
|
|
|
| |||||||||||||||
| 22,619 | — | 21,583 | 23,629 | — | (623 | ) | ||||||||||||||||||||
PREVINORTE | social security contributions | — | — | — | — | — | — | |||||||||||||||||||
Actuarial costs | — | — | — | — | — | — | ||||||||||||||||||||
|
|
|
|
|
|
|
|
|
|
|
| |||||||||||||||
| — | — | — | — | — | — | |||||||||||||||||||||
F-178
Table of Contents
| 12/31/2013 | 12/31/2012 | |||||||||||||||||||||||||
COMPANIES | NATURE OF THE TRANSACTION | ASSET | LIABILITY | RESULT | ASSET | LIABILITY | RESULT | |||||||||||||||||||
ANDE | customers | — | — | — | 63,659 | — | — | |||||||||||||||||||
Other assets | — | — | — | 23,791 | — | — | ||||||||||||||||||||
Other Obligations | — | — | — | — | (38,078 | ) | — | |||||||||||||||||||
Revenue from services | — | — | — | — | — | 239,834 | ||||||||||||||||||||
financial income | — | — | — | — | — | 479 | ||||||||||||||||||||
financial expenses | — | — | — | — | — | 622 | ||||||||||||||||||||
Other expenses | — | — | — | — | — | (42,932 | ) | |||||||||||||||||||
|
|
|
|
|
|
|
|
|
|
|
| |||||||||||||||
| — | — | — | 87,451 | (38,078 | ) | 198,002 | ||||||||||||||||||||
FIBRA | Accounts payable | — | — | — | — | (42,610 | ) | — | ||||||||||||||||||
social security contributions | — | — | — | — | (2,888 | ) | — | |||||||||||||||||||
financial expenses | — | — | — | — | — | (4,800 | ) | |||||||||||||||||||
social security contributions | — | — | — | — | — | (20,434 | ) | |||||||||||||||||||
|
|
|
|
|
|
|
|
|
|
|
| |||||||||||||||
| — | — | — | — | (45,499 | ) | (25,234 | ) | |||||||||||||||||||
CAJUBI | Accounts payable | — | — | — | — | (47,187 | ) | — | ||||||||||||||||||
social security contributions | — | — | — | — | (6,190 | ) | — | |||||||||||||||||||
Other liabilities | — | — | — | — | 887,445 | — | ||||||||||||||||||||
financial expenses | — | — | — | — | — | (622 | ) | |||||||||||||||||||
Actuarial costs | — | — | — | — | — | (90,708 | ) | |||||||||||||||||||
social security contributions | — | — | — | — | — | (27,269 | ) | |||||||||||||||||||
|
|
|
|
|
|
|
|
|
|
|
| |||||||||||||||
| — | — | — | — | 834,068 | (118,599 | ) | ||||||||||||||||||||
ENERPEIXE | Accounts receivable | 240 | — | — | 536 | — | — | |||||||||||||||||||
| �� | Consumers and resellers | — | — | — | — | — | — | |||||||||||||||||||
JCP / Dividends receivable | 25,960 | — | — | 29,640 | — | — | ||||||||||||||||||||
Equity investment | 525,378 | — | — | 514,735 | — | — | ||||||||||||||||||||
Other assets | 2 | — | — | — | — | — | ||||||||||||||||||||
Income from equity | — | — | 96,604 | — | — | 76,524 | ||||||||||||||||||||
Revenue from services | — | — | 86 | — | — | 3,046 | ||||||||||||||||||||
Remuneration of the financial asset | — | — | 2,414 | — | — | — | ||||||||||||||||||||
Revenues from grid | — | — | — | — | — | 4,914 | ||||||||||||||||||||
|
|
|
|
|
|
|
|
|
|
|
| |||||||||||||||
| 551,580 | — | 99,104 | 544,911 | — | 84,484 | |||||||||||||||||||||
TRANSLESTE | JCP / Dividends receivable | — | — | — | (1,652 | ) | — | — | ||||||||||||||||||
Equity investment | 27,187 | — | — | 25,687 | — | — | ||||||||||||||||||||
Other assets | — | — | — | — | — | — | ||||||||||||||||||||
Providers | — | (160 | ) | — | — | (126 | ) | — | ||||||||||||||||||
Revenue from services | — | — | — | — | — | — | ||||||||||||||||||||
Income from equity | — | — | 6,840 | — | — | 4,041 | ||||||||||||||||||||
Charges for use of transmission grid | — | — | (1,631 | ) | — | — | (1,193 | ) | ||||||||||||||||||
|
|
|
|
|
|
|
|
|
|
|
| |||||||||||||||
| 27,187 | (160 | ) | 5,209 | 24,035 | (126 | ) | 2,848 | |||||||||||||||||||
TRANSUDESTE | JCP / Dividends receivable | — | — | — | (379 | ) | — | — | ||||||||||||||||||
Accounts receivable | — | — | — | 23 | — | — | ||||||||||||||||||||
Equity investment | 14,007 | — | — | 13,871 | — | — | ||||||||||||||||||||
Other assets | 25 | — | — | — | — | — | ||||||||||||||||||||
Providers | — | (99 | ) | — | — | (79 | ) | — | ||||||||||||||||||
Other revenue | — | — | 147 | — | — | — | ||||||||||||||||||||
Revenue from services | — | — | 139 | — | — | 132 | ||||||||||||||||||||
Income from equity | — | — | 3,909 | — | — | 2,035 | ||||||||||||||||||||
Other expenses | — | — | — | — | — | 138 | ||||||||||||||||||||
Charges for use of transmission grid | — | — | (996 | ) | — | — | (734 | ) | ||||||||||||||||||
|
|
|
|
|
|
|
|
|
|
|
| |||||||||||||||
| 14,032 | (99 | ) | 3,199 | 13,515 | (79 | ) | 1,571 | |||||||||||||||||||
TRANSIRAPÉ | JCP / Dividends receivable | — | — | — | (460 | ) | — | — | ||||||||||||||||||
Equity investment | 14,050 | — | — | 11,360 | — | — | ||||||||||||||||||||
Other assets | — | — | — | — | — | — | ||||||||||||||||||||
Providers | — | (68 | ) | — | — | (45 | ) | — | ||||||||||||||||||
Income from equity | — | — | 3,745 | — | — | 1,969 | ||||||||||||||||||||
Charges for use of transmission grid | — | — | (698 | ) | — | — | (501 | ) | ||||||||||||||||||
|
|
|
|
|
|
|
|
|
|
|
| |||||||||||||||
| 14,050 | (68 | ) | 3,047 | 10,900 | (45 | ) | 1,468 | |||||||||||||||||||
CENTROESTE | AFAC | — | — | — | 3,527 | — | — | |||||||||||||||||||
Accounts receivable | — | — | — | 52 | — | — | ||||||||||||||||||||
Equity investment | 17,630 | — | — | 20,268 | — | — | ||||||||||||||||||||
JCP / Dividends receivable | — | — | — | — | — | — | ||||||||||||||||||||
Other assets | 59 | — | — | — | — | — | ||||||||||||||||||||
Providers | — | (68 | ) | — | — | (54 | ) | — | ||||||||||||||||||
Other revenue | — | — | 79 | — | — | — | ||||||||||||||||||||
Revenue from services | — | — | 729 | — | — | 542 | ||||||||||||||||||||
Income from equity | — | — | 3,746 | — | — | 3,963 | ||||||||||||||||||||
Costs of equity | — | — | — | — | ||||||||||||||||||||||
Other expenses | — | — | — | — | — | 74 | ||||||||||||||||||||
Charges for use of transmission grid | — | — | (689 | ) | — | — | (506 | ) | ||||||||||||||||||
|
|
|
|
|
|
|
|
|
|
|
| |||||||||||||||
| 17,689 | (68 | ) | 3,865 | 23,847 | (54 | ) | 4,073 | |||||||||||||||||||
BAGUARI | customers | 15 | — | — | 40 | — | — | |||||||||||||||||||
AFAC | 82,632 | — | — | 82,632 | — | — | ||||||||||||||||||||
Equity investment | 9,805 | — | — | 6,608 | — | — | ||||||||||||||||||||
Other assets | — | — | — | — | — | — | ||||||||||||||||||||
JCP / Dividends receivable | 1,837 | — | — | 9,729 | — | — | ||||||||||||||||||||
Income from equity | — | — | 5,035 | — | — | 8,623 | ||||||||||||||||||||
Remuneration of the financial asset | — | — | 190 | — | — | |||||||||||||||||||||
Revenues from grid | — | — | — | — | — | 382 | ||||||||||||||||||||
|
|
|
|
|
|
|
|
|
|
|
| |||||||||||||||
| 94,289 | — | 5,225 | 99,009 | — | 9,005 | |||||||||||||||||||||
RETIRO BAIXO | Accounts receivable | — | — | — | 11 | — | — | |||||||||||||||||||
Loans and financing | — | — | — | 2,550 | — | — | ||||||||||||||||||||
AFAC | 58 | — | — | 58 | — | — | ||||||||||||||||||||
Equity investment | 113,123 | —�� | — | 110,020 | — | — | ||||||||||||||||||||
Other assets | — | — | — | — | — | — | ||||||||||||||||||||
financial income | — | — | — | — | — | — | ||||||||||||||||||||
Income from equity | — | — | 3,103 | — | — | 4,010 | ||||||||||||||||||||
financial income | — | — | 3,138 | — | — | 1,524 | ||||||||||||||||||||
financial expenses | — | — | (41 | ) | — | — | — | |||||||||||||||||||
|
|
|
|
|
|
|
|
|
|
|
| |||||||||||||||
| 113,181 | — | 6,200 | 112,639 | — | 5,534 | |||||||||||||||||||||
SERRA FACÃO ENERGIA | Dividends / JCP Receivables | 2,289 | — | — | — | — | — | |||||||||||||||||||
Equity investment | 60,742 | — | — | — | — | — | ||||||||||||||||||||
Accounts receivable | — | — | — | — | — | — | ||||||||||||||||||||
Other assets | — | — | — | — | — | — | ||||||||||||||||||||
Revenue from services | — | — | 298 | — | — | — | ||||||||||||||||||||
Costs of equity | — | — | (26,544 | ) | — | — | — | |||||||||||||||||||
financial expenses | — | — | — | — | — | (3,885 | ) | |||||||||||||||||||
Power purchase | — | — | — | — | — | — | ||||||||||||||||||||
Other expenses | — | — | — | — | — | 34 | ||||||||||||||||||||
|
|
|
|
|
|
|
|
|
|
|
| |||||||||||||||
| 63,031 | — | (26,246 | ) | — | — | (3,851 | ) | |||||||||||||||||||
CHAPECOENSE | JCP / Dividends receivable | 17,054 | — | — | (2,773 | ) | — | — | ||||||||||||||||||
customers | 448 | — | — | 794 | — | — | ||||||||||||||||||||
Other receivables | — | — | — | 1,113 | — | — | ||||||||||||||||||||
Consumers and resellers | — | — | �� | — | — | — | — | |||||||||||||||||||
Equity investment | 345,387 | — | — | 303,627 | — | — | ||||||||||||||||||||
Other assets | 751 | — | — | — | — | — | ||||||||||||||||||||
Income from equity | — | — | 90,568 | — | — | 32,762 | ||||||||||||||||||||
financial expenses | — | — | — | — | — | — | ||||||||||||||||||||
Revenues from grid | — | — | — | — | — | 7,227 | ||||||||||||||||||||
Remuneration of financial asset | — | — | 4,273 | |||||||||||||||||||||||
Revenue from services | — | — | 309 | — | — | 5,943 | ||||||||||||||||||||
|
|
|
|
|
|
|
|
|
|
|
| |||||||||||||||
| 363,640 | — | 95,150 | 302,761 | — | 45,932 | |||||||||||||||||||||
F-179
Table of Contents
| 12/31/2013 | 12/31/2012 | |||||||||||||||||||||||||
COMPANIES | NATURE OF THE TRANSACTION | ASSET | LIABILITY | RESULT | ASSET | LIABILITY | RESULT | |||||||||||||||||||
MADEIRA ENERGIA | customers | 2,011 | — | — | — | — | — | |||||||||||||||||||
AFAC | 89,700 | — | — | — | — | — | ||||||||||||||||||||
Equity investment | 2,416,382 | — | — | 1,669,041 | — | — | ||||||||||||||||||||
Accounts receivable | — | — | — | 3,073 | — | — | ||||||||||||||||||||
Other receivables | — | — | — | 1,903 | — | — | ||||||||||||||||||||
Other assets | 163 | — | — | — | — | — | ||||||||||||||||||||
Providers | — | — | — | — | — | — | ||||||||||||||||||||
Costs of equity | — | — | (18,678 | ) | — | — | (100,459 | ) | ||||||||||||||||||
Revenues from grid | — | — | — | — | — | 15,191 | ||||||||||||||||||||
Revenue from services | — | — | 22,771 | — | — | 25,406 | ||||||||||||||||||||
Remuneration of financial asset | — | — | 19,793 | — | — | — | ||||||||||||||||||||
Other revenue | — | — | 1,607 | — | — | — | ||||||||||||||||||||
Other expenses | — | — | — | — | — | — | ||||||||||||||||||||
|
|
|
|
|
|
|
|
|
|
|
| |||||||||||||||
| 2,508,256 | — | 25,493 | 1,674,017 | — | (59,862 | ) | ||||||||||||||||||||
INAMBARI | Other assets | — | — | — | — | — | — | |||||||||||||||||||
Costs of equity | — | — | (1,088 | ) | 6,640 | — | — | |||||||||||||||||||
Other expenses | — | — | (6,126 | ) | — | — | (919 | ) | ||||||||||||||||||
|
|
|
|
|
|
|
|
|
|
|
| |||||||||||||||
| — | — | (7,214 | ) | 6,640 | — | (919 | ) | |||||||||||||||||||
TRANSENERGIA RENOVÁVEL | JCP / Dividends receivable | 9,904 | — | — | — | — | — | |||||||||||||||||||
AFAC | — | — | — | 24,556 | — | — | ||||||||||||||||||||
Accounts receivable | — | — | — | 17 | — | — | ||||||||||||||||||||
Equity investment | 78,241 | — | — | 83,308 | — | — | ||||||||||||||||||||
Providers | — | (79 | ) | — | — | 8 | — | |||||||||||||||||||
Accounts payable | — | — | — | — | — | — | ||||||||||||||||||||
Costs of equity | — | — | (21,680 | ) | — | — | 4,214 | |||||||||||||||||||
Other assets | 17 | — | — | — | — | — | ||||||||||||||||||||
Revenue from services | — | — | — | — | — | 8 | ||||||||||||||||||||
Other Operating Expenses | — | — | — | — | — | — | ||||||||||||||||||||
Charges for use of transmission grid | — | — | (654 | ) | — | — | 106 | |||||||||||||||||||
|
|
|
|
|
|
|
|
|
|
|
| |||||||||||||||
| 88,162 | (79 | ) | (22,334 | ) | 107,881 | 8 | 4,100 | |||||||||||||||||||
MGE TRANSMISSÃO | Equity investment | 60,802 | — | — | 35,991 | — | — | |||||||||||||||||||
JCP / Dividends receivable | — | — | — | 201 | — | — | ||||||||||||||||||||
AFAC | 45,570 | — | — | 27,440 | — | — | ||||||||||||||||||||
Other receivables | — | — | — | 257 | — | — | ||||||||||||||||||||
Other assets | — | — | — | — | — | — | ||||||||||||||||||||
Other expenses | — | — | — | — | — | (74 | ) | |||||||||||||||||||
Income from equity | — | — | — | — | — | 1,975 | ||||||||||||||||||||
Costs of equity | — | — | (2,831 | ) | — | — | — | |||||||||||||||||||
Revenue from services | — | — | 1,855 | — | — | 2,042 | ||||||||||||||||||||
|
|
|
|
|
|
|
|
|
|
|
| |||||||||||||||
| 106,372 | — | (976 | ) | 63,889 | — | 3,943 | ||||||||||||||||||||
GOIÁS TRANSMISSÃO | Equity investment | 80,080 | — | — | 44,806 | — | — | |||||||||||||||||||
AFAC | 51,499 | — | — | 56,840 | — | — | ||||||||||||||||||||
JCP / Dividends receivable | 20,051 | — | — | 300 | — | — | ||||||||||||||||||||
Other receivables | — | — | — | 38 | — | — | ||||||||||||||||||||
Other assets | 359 | — | — | — | — | — | ||||||||||||||||||||
Providers | — | (207 | ) | — | — | — | — | |||||||||||||||||||
Costs of equity | — | — | (1,815 | ) | — | — | 4,567 | |||||||||||||||||||
Revenue from services | — | — | 2,290 | — | — | 870 | ||||||||||||||||||||
|
|
|
|
|
|
|
|
|
|
|
| |||||||||||||||
| 151,989 | (207 | ) | 475 | 101,984 | — | 5,437 | ||||||||||||||||||||
customers | 60 | — | — | — | — | — | ||||||||||||||||||||
AFAC | 12,894 | — | — | 12,894 | — | — | ||||||||||||||||||||
Equity investment | 7,553 | — | — | 8,914 | — | — | ||||||||||||||||||||
Other assets | — | — | — | — | — | — | ||||||||||||||||||||
REI DOS VENTOS | Revenue from services | — | — | — | — | — | — | |||||||||||||||||||
Revenues from grid | — | — | 79 | — | — | — | ||||||||||||||||||||
Income from equity | — | — | 20,447 | — | — | (775 | ) | |||||||||||||||||||
Remuneration of the financial asset | — | — | 187 | — | — | — | ||||||||||||||||||||
Costs of equity | — | — | (1,359 | ) | — | — | — | |||||||||||||||||||
|
|
|
|
|
|
|
|
|
|
|
| |||||||||||||||
| 20,507 | — | 19,354 | 21,808 | — | (775 | ) | ||||||||||||||||||||
SEFAC ENERGIA PARTICIPAÇÕES | JCP / Dividends receivable | — | — | — | — | — | — | |||||||||||||||||||
Equity investment | — | — | — | 104,098 | — | — | ||||||||||||||||||||
Accounts receivable | — | — | — | — | — | — | ||||||||||||||||||||
Other assets | — | — | — | — | — | — | ||||||||||||||||||||
Providers | — | — | — | — | — | — | ||||||||||||||||||||
Income from equity | — | — | — | — | — | (40,360 | ) | |||||||||||||||||||
Revenue from services | — | — | — | — | — | 91 | ||||||||||||||||||||
financial expenses | — | — | — | — | — | — | ||||||||||||||||||||
Power purchase | — | — | — | — | — | — | ||||||||||||||||||||
|
|
|
|
|
|
|
|
|
|
|
| |||||||||||||||
| — | — | — | 104,098 | — | (40,269 | ) | ||||||||||||||||||||
TRANS SÃO PAULO | AFAC | 13,132 | �� | — | — | 7,987 | — | — | ||||||||||||||||||
Equity investment | 36,500 | — | — | 23,328 | — | — | ||||||||||||||||||||
JCP / Dividends receivable | 5,441 | — | — | 566 | — | — | ||||||||||||||||||||
Other receivables | — | — | — | 333 | — | — | ||||||||||||||||||||
Other assets | 71 | — | — | — | — | — | ||||||||||||||||||||
Providers | — | (20 | ) | — | — | — | — | |||||||||||||||||||
Revenue from services | — | — | 1,013 | — | — | 755 | ||||||||||||||||||||
Income from equity | — | — | 15,107 | — | — | 2,378 | ||||||||||||||||||||
Other Revenues | — | — | 229 | — | — | — | ||||||||||||||||||||
Charges for use of transmission grid | — | — | (293 | ) | — | — | (24 | ) | ||||||||||||||||||
Other Expenses | — | — | — | — | — | — | ||||||||||||||||||||
|
|
|
|
|
|
|
|
|
|
|
| |||||||||||||||
| 55,144 | (20 | ) | 16,056 | 32,214 | — | 3,109 | ||||||||||||||||||||
F-180
Table of Contents
| 12/31/2013 | 12/31/2012 | |||||||||||||||||||||||||
COMPANIES | NATURE OF THE TRANSACTION | ASSET | LIABILITY | RESULT | ASSET | LIABILITY | RESULT | |||||||||||||||||||
TRANS GOIÁS | AFAC | 93 | — | — | — | — | — | |||||||||||||||||||
Equity investment | 2,369 | — | — | 2,513 | — | — | ||||||||||||||||||||
Revenue from services | — | — | — | — | — | — | ||||||||||||||||||||
Income from equity | — | — | — | — | — | (273 | ) | |||||||||||||||||||
Costs of equity | — | — | (487 | ) | — | — | — | |||||||||||||||||||
| — | — | — | — | — | — | |||||||||||||||||||||
|
|
|
|
|
|
|
|
|
|
|
| |||||||||||||||
| 2,462 | — | (487 | )�� | 2,513 | — | (273 | ) | |||||||||||||||||||
CALDAS NOVAS | AFAC | — | — | — | 6,417 | — | — | |||||||||||||||||||
Other receivables | — | — | — | 98 | — | — | ||||||||||||||||||||
Providers | — | — | — | — | — | — | ||||||||||||||||||||
Equity investment | 10,634 | — | — | 50 | — | — | ||||||||||||||||||||
Other assets | 176 | — | — | — | — | — | ||||||||||||||||||||
Other revenue | 404 | — | — | — | — | — | ||||||||||||||||||||
Charges for use of transmission grid | — | — | (11 | ) | — | — | — | |||||||||||||||||||
Other expenses | — | — | — | — | — | 684 | ||||||||||||||||||||
Revenue from services | — | — | 170 | — | — | — | ||||||||||||||||||||
Income from equity | — | — | 1,578 | — | — | — | ||||||||||||||||||||
|
|
|
|
|
|
|
|
|
|
|
| |||||||||||||||
| 11,214 | — | 1,737 | 6,565 | — | 684 | |||||||||||||||||||||
IE GARANHUS | Equity investment | 98,659 | — | — | 14,956 | — | — | |||||||||||||||||||
Income from equity | — | — | 2,853 | — | — | 255 | ||||||||||||||||||||
|
|
|
|
|
|
|
|
|
|
|
| |||||||||||||||
| 98,659 | — | 2,853 | 14,956 | — | 255 | |||||||||||||||||||||
LUZIÂNIA NIQUELÂNDIA TRANSMISSORA | AFAC | 2,728 | — | — | — | — | — | |||||||||||||||||||
Equity investment | 2,907 | — | — | 931 | — | — | ||||||||||||||||||||
Other assets | 94 | — | — | — | — | — | ||||||||||||||||||||
Providers | — | — | — | — | — | — | ||||||||||||||||||||
Income from equity | — | — | — | — | — | — | ||||||||||||||||||||
Revenue from services | — | — | 537 | — | — | — | ||||||||||||||||||||
Financial Income | — | — | 5 | — | — | — | ||||||||||||||||||||
Other Revenues | — | — | 810 | — | — | — | ||||||||||||||||||||
Costs of equity | — | — | (131 | ) | — | — | — | |||||||||||||||||||
Other expenses | — | — | — | — | — | — | ||||||||||||||||||||
|
|
|
|
|
|
|
|
|
|
|
| |||||||||||||||
| 5,729 | — | 1,221 | 931 | — | — | |||||||||||||||||||||
TSLE | Accounts receivable | — | — | — | — | — | — | |||||||||||||||||||
AFAC | 102,620 | — | — | — | — | — | ||||||||||||||||||||
Equity investment | 16,901 | — | — | 5,100 | — | — | ||||||||||||||||||||
Other assets | 474 | — | — | — | — | — | ||||||||||||||||||||
Accumulated equity | — | — | — | 5,100 | — | — | ||||||||||||||||||||
Other liabilities | — | 5 | — | — | — | — | ||||||||||||||||||||
Income from equity | — | — | 120 | — | — | (564 | ) | |||||||||||||||||||
Other Revenues | — | — | 8,236 | — | — | — | ||||||||||||||||||||
Costs of equity | — | — | — | — | — | — | ||||||||||||||||||||
Revenue from services | — | — | — | — | — | 52 | ||||||||||||||||||||
|
|
|
|
|
|
|
|
|
|
|
| |||||||||||||||
| 119,995 | 5 | 8,356 | — | — | (512 | ) | ||||||||||||||||||||
Energia dos | AFAC | 5,175 | — | — | — | — | — | |||||||||||||||||||
Equity investment | 198 | — | — | 167 | — | — | ||||||||||||||||||||
Costs of equity | — | — | (23 | ) | — | — | — | |||||||||||||||||||
Income from equity | — | — | — | — | — | — | ||||||||||||||||||||
|
|
|
|
|
|
|
|
|
|
|
| |||||||||||||||
| 5,373 | — | (23 | ) | 167 | — | — | ||||||||||||||||||||
Energia dos | AFAC | 3,121 | — | — | — | — | — | |||||||||||||||||||
Equity investment | 154 | — | — | 123 | — | — | ||||||||||||||||||||
Costs of equity | — | — | (23 | ) | — | — | — | |||||||||||||||||||
Income from equity | — | — | — | — | — | — | ||||||||||||||||||||
|
|
|
|
|
|
|
|
|
|
|
| |||||||||||||||
| 3,275 | — | (23 | ) | 123 | — | — | ||||||||||||||||||||
Energia dos | AFAC | 4,655 | — | — | — | — | — | |||||||||||||||||||
Equity investment | 186 | — | — | 152 | — | — | ||||||||||||||||||||
Costs of equity | — | — | (25 | ) | — | — | — | |||||||||||||||||||
Other Revenues | — | — | 61 | — | — | — | ||||||||||||||||||||
Income from equity | — | — | — | — | — | — | ||||||||||||||||||||
|
|
|
|
|
|
|
|
|
|
|
| |||||||||||||||
| 4,841 | — | 36 | 152 | — | — | |||||||||||||||||||||
Energia dos | AFAC | 6,811 | — | — | — | — | — | |||||||||||||||||||
Equity investment | 210 | — | — | 216 | — | — | ||||||||||||||||||||
Costs of equity | — | — | (26 | ) | — | — | — | |||||||||||||||||||
Income from equity | — | — | — | — | — | — | ||||||||||||||||||||
|
|
|
|
|
|
|
|
|
|
|
| |||||||||||||||
| 7,021 | — | (26 | ) | 216 | — | — | ||||||||||||||||||||
Energia dos | AFAC | 5,454 | — | — | — | — | — | |||||||||||||||||||
Equity investment | 183 | — | — | 157 | — | — | ||||||||||||||||||||
Costs of equity | — | — | (23 | ) | — | — | — | |||||||||||||||||||
Income from equity | — | — | — | — | — | — | ||||||||||||||||||||
|
|
|
|
|
|
|
|
|
|
|
| |||||||||||||||
| 5,637 | — | (23 | ) | 157 | — | — | ||||||||||||||||||||
Energia dos | AFAC | 7,585 | — | — | — | — | — | |||||||||||||||||||
Equity investment | 181 | — | — | 206 | — | — | ||||||||||||||||||||
Costs of equity | — | — | (25 | ) | — | — | — | |||||||||||||||||||
Income from equity | — | — | — | — | — | — | ||||||||||||||||||||
|
|
|
|
|
|
|
|
|
|
|
| |||||||||||||||
| 7,766 | — | (25 | ) | 206 | — | — | ||||||||||||||||||||
Energia dos | AFAC | 7,634 | — | — | — | — | — | |||||||||||||||||||
Equity investment | 205 | — | — | 216 | — | — | ||||||||||||||||||||
Costs of equity | — | — | (25 | ) | — | — | — | |||||||||||||||||||
Income from equity | — | — | — | — | — | — | ||||||||||||||||||||
|
|
|
|
|
|
|
|
|
|
|
| |||||||||||||||
| 7,839 | — | (25 | ) | 216 | — | — | ||||||||||||||||||||
F-181
Table of Contents
| 12/31/2013 | 12/31/2012 | |||||||||||||||||||||||||
COMPANIES | NATURE OF THE TRANSACTION | ASSET | LIABILITY | RESULT | ASSET | LIABILITY | RESULT | |||||||||||||||||||
Energia dos Ventos VIII | AFAC | 5,454 | — | — | — | — | — | |||||||||||||||||||
Equity investment | 164 | — | — | 157 | — | — | ||||||||||||||||||||
Costs of equity | — | — | (22 | ) | — | — | — | |||||||||||||||||||
Other Revenues | — | — | 10 | — | — | — | ||||||||||||||||||||
Income from equity | — | — | — | — | — | — | ||||||||||||||||||||
|
|
|
|
|
|
|
|
|
|
|
| |||||||||||||||
| 5,618 | — | (12 | ) | 157 | — | — | ||||||||||||||||||||
Energia dos Ventos IX | AFAC | 5,562 | — | — | — | — | — | |||||||||||||||||||
Equity investment | 186 | — | — | 167 | — | — | ||||||||||||||||||||
Costs of equity | — | — | (24 | ) | — | — | — | |||||||||||||||||||
Income from equity | — | — | — | — | — | — | ||||||||||||||||||||
|
|
|
|
|
|
|
|
|
|
|
| |||||||||||||||
| 5,748 | — | (24 | ) | 167 | — | — | ||||||||||||||||||||
Energia dos Ventos X | AFAC | 4,131 | — | — | — | — | — | |||||||||||||||||||
Equity investment | 178 | — | — | 137 | — | — | ||||||||||||||||||||
Costs of equity | — | — | (23 | ) | — | — | — | |||||||||||||||||||
Income from equity | — | — | — | — | — | — | ||||||||||||||||||||
|
|
|
|
|
|
|
|
|
|
|
| |||||||||||||||
| 4,309 | — | (23 | ) | 137 | — | — | ||||||||||||||||||||
JUNCO I | Equity investment | 5,193 | — | — | 106 | — | — | |||||||||||||||||||
Costs of equity | — | — | (148 | ) | — | — | (38 | ) | ||||||||||||||||||
|
|
|
|
|
|
|
|
|
|
|
| |||||||||||||||
| 5,193 | — | (148 | ) | 106 | — | (38 | ) | |||||||||||||||||||
JUNCO II | Equity investment | 5,285 | — | — | 111 | — | — | |||||||||||||||||||
Costs of equity | — | — | (61 | ) | — | — | (33 | ) | ||||||||||||||||||
|
|
|
|
|
|
|
|
|
|
|
| |||||||||||||||
| 5,285 | — | (61 | ) | 111 | — | (33 | ) | |||||||||||||||||||
CAIÇARA I | Equity investment | 5,280 | — | — | 114 | — | — | |||||||||||||||||||
Costs of equity | — | — | (69 | ) | — | — | (30 | ) | ||||||||||||||||||
|
|
|
|
|
|
|
|
|
|
|
| |||||||||||||||
| 5,280 | — | (69 | ) | 114 | — | (30 | ) | |||||||||||||||||||
CAIÇARA II | Equity investment | 3,399 | — | — | 67 | — | — | |||||||||||||||||||
Costs of equity | — | — | (56 | ) | — | — | (29 | ) | ||||||||||||||||||
|
|
|
|
|
|
|
|
|
|
|
| |||||||||||||||
| 3,399 | — | (56 | ) | 67 | — | (29 | ) | |||||||||||||||||||
EXTREMOZ | Equity investment | 1,505 | — | — | 53 | — | — | |||||||||||||||||||
AFAC | 178,150 | — | — | 34,525 | — | — | ||||||||||||||||||||
Other assets | — | — | — | — | — | — | ||||||||||||||||||||
Income from equity | — | — | 1,452 | — | — | 53 | ||||||||||||||||||||
Costs of equity | — | — | — | — | — | — | ||||||||||||||||||||
|
|
|
|
|
|
|
|
|
|
|
| |||||||||||||||
| 179,655 | — | 1,452 | 34,578 | — | 53 | |||||||||||||||||||||
NORTE ENERGIA | Other assets | 35 | — | — | — | — | — | |||||||||||||||||||
Equity investment | 631,824 | — | — | — | — | — | ||||||||||||||||||||
Income from equity | — | — | 841,589 | — | — | — | ||||||||||||||||||||
Costs of equity | — | — | (6,000 | ) | — | — | — | |||||||||||||||||||
|
|
|
|
|
|
|
|
|
|
|
| |||||||||||||||
| 631,859 | — | 835,589 | — | — | — | |||||||||||||||||||||
AETE | Other liabilities | — | — | — | — | — | — | |||||||||||||||||||
Income from equity | — | — | 39,235 | — | — | — | ||||||||||||||||||||
Revenue from services | — | — | 2,022 | — | — | — | ||||||||||||||||||||
Charges for use of transmission grid | — | — | (2,831 | ) | — | — | — | |||||||||||||||||||
|
|
|
|
|
|
|
|
|
|
|
| |||||||||||||||
| — | — | 38,426 | — | — | ||||||||||||||||||||||
BRASNORTE | Other assets | — | — | — | — | — | — | |||||||||||||||||||
Other liabilities | — | 139 | — | — | — | — | ||||||||||||||||||||
Income from equity | — | — | 105,921 | — | — | — | ||||||||||||||||||||
Revenue from services | — | 4,747 | — | — | — | — | ||||||||||||||||||||
Charges for use of transmission grid | — | — | (1,643 | ) | — | — | — | |||||||||||||||||||
|
|
|
|
|
|
|
|
|
|
|
| |||||||||||||||
| — | 4,886 | 104,278 | — | — | ||||||||||||||||||||||
AGUAS DA PEDRA | Other assets | — | — | — | — | — | — | |||||||||||||||||||
Revenues from grid | — | — | — | — | — | — | ||||||||||||||||||||
Income from equity | — | — | 96,220 | — | — | — | ||||||||||||||||||||
Revenue from services | — | — | 690 | — | — | — | ||||||||||||||||||||
Costs of equity | — | — | — | — | — | — | ||||||||||||||||||||
|
|
|
|
|
|
|
|
|
|
|
| |||||||||||||||
| — | — | 96,910 | — | — | — | |||||||||||||||||||||
F-182
Table of Contents
| 12/31/2013 | 12/31/2012 | |||||||||||||||||||||||||
COMPANIES | NATURE OF THE TRANSACTION | ASSET | LIABILITY | RESULT | ASSET | LIABILITY | RESULT | |||||||||||||||||||
ESTAÇÃO TRANSM | Loans and financing | — | — | — | — | — | — | |||||||||||||||||||
Loans and financing | — | — | — | — | — | — | ||||||||||||||||||||
Other liabilities ( specify , if relevant) | 1,646 | — | — | — | — | — | ||||||||||||||||||||
Income from equity | — | — | 743,762 | — | — | — | ||||||||||||||||||||
Revenue from services | — | — | 40 | — | — | — | ||||||||||||||||||||
Other income ( specify , if relevant) | — | — | — | — | — | — | ||||||||||||||||||||
Financial Income | — | — | — | — | — | — | ||||||||||||||||||||
Charges for use of transmission grid | — | — | (10,934 | ) | — | — | — | |||||||||||||||||||
|
|
|
|
|
|
|
|
|
|
|
| |||||||||||||||
| 1,646 | — | 732,868 | — | — | — | |||||||||||||||||||||
INTEGRAÇÃO TRANS. | Other assets | 272 | — | — | — | — | — | |||||||||||||||||||
Other liabilities | — | — | — | — | — | — | ||||||||||||||||||||
Income from equity | — | — | 121,999 | — | — | — | ||||||||||||||||||||
Revenue from services | — | — | 3,386 | — | — | — | ||||||||||||||||||||
Charges for use of transmission grid | — | — | (8,264 | ) | — | — | — | |||||||||||||||||||
|
|
|
|
|
|
|
|
|
|
|
| |||||||||||||||
| 272 | — | 117,121 | — | — | — | |||||||||||||||||||||
LINHA VERDE | Other assets | — | — | — | — | — | — | |||||||||||||||||||
Income from equity | — | — | 23,257 | — | — | — | ||||||||||||||||||||
Costs of equity | — | — | — | — | — | — | ||||||||||||||||||||
|
|
|
|
|
|
|
|
|
|
|
| |||||||||||||||
| — | — | 23,257 | — | — | — | |||||||||||||||||||||
RIO BRANCO | Other assets | 152 | — | — | — | — | — | |||||||||||||||||||
Other liabilities | — | 176 | — | — | — | — | ||||||||||||||||||||
Income from equity | — | — | — | — | — | — | ||||||||||||||||||||
Revenue from services | — | — | — | — | — | — | ||||||||||||||||||||
Charges for use of transmission grid | — | — | — | — | — | — | ||||||||||||||||||||
|
|
|
|
|
|
|
|
|
|
|
| |||||||||||||||
| 152 | 176 | — | — | — | — | |||||||||||||||||||||
CONSTRUTORA INTEG | Income from equity | — | — | 24,638 | — | — | — | |||||||||||||||||||
|
|
|
|
|
|
|
|
|
|
|
| |||||||||||||||
| — | — | 24,638 | — | — | — | |||||||||||||||||||||
TRANSM MOTOG | Income from equity | — | — | — | — | — | — | |||||||||||||||||||
Revenue from services | — | — | — | — | — | — | ||||||||||||||||||||
Charges for use of transmission grid | — | — | — | — | — | — | ||||||||||||||||||||
|
|
|
|
|
|
|
|
|
|
|
| |||||||||||||||
| — | — | — | — | — | — | |||||||||||||||||||||
TRANSNORTE | Income from equity | — | — | 42,584 | — | — | — | |||||||||||||||||||
|
|
|
|
|
|
|
|
|
|
|
| |||||||||||||||
| — | — | 42,584 | — | — | — | |||||||||||||||||||||
CELG | Providers | — | — | — | — | — | — | |||||||||||||||||||
|
|
|
|
|
|
|
|
|
|
|
| |||||||||||||||
| — | — | — | — | — | — | |||||||||||||||||||||
DEMAIS | financial expenses | — | — | — | — | — | — | |||||||||||||||||||
|
|
|
|
|
|
|
|
|
|
|
| |||||||||||||||
| — | — | — | — | — | — | |||||||||||||||||||||
CTEEP | JCP / Dividends receivable | 1,114 | — | — | — | — | — | |||||||||||||||||||
Equity investment | 18,140 | — | — | — | — | — | ||||||||||||||||||||
Income from equity | — | — | 5,673 | — | — | — | ||||||||||||||||||||
|
|
|
|
|
|
|
|
|
|
|
| |||||||||||||||
| 19,254 | — | 5,673 | — | — | — | |||||||||||||||||||||
EMAE | Equity investment | 5,407 | — | — | — | — | — | |||||||||||||||||||
Income from equity | — | — | (4,994 | ) | — | — | — | |||||||||||||||||||
|
|
|
|
|
|
|
|
|
|
|
| |||||||||||||||
| 5,407 | — | (4,994 | ) | — | — | — | ||||||||||||||||||||
Triângulo Mineiro Trans. S.A. | Advance for future capital increase | 10,908 | — | — | — | — | — | |||||||||||||||||||
Equity investment | 443 | — | — | — | — | — | ||||||||||||||||||||
Revenue from services | — | — | 146 | — | — | — | ||||||||||||||||||||
Other Revenues | — | — | 302 | — | — | — | ||||||||||||||||||||
Costs of equity | — | — | (443 | ) | — | — | — | |||||||||||||||||||
|
|
|
|
|
| |||||||||||||||||||||
| 11,351 | — | 5 | — | — | — | |||||||||||||||||||||
| — | — | |||||||||||||||||||||||||
CEPEL | Other expenses (operating expenses) | — | — | (10,924 | ) | — | — | — | ||||||||||||||||||
|
|
|
|
|
|
|
|
|
|
|
| |||||||||||||||
| — | — | (10,924 | ) | — | — | — | ||||||||||||||||||||
TME | Other liabilities | — | 294 | — | — | — | — | |||||||||||||||||||
Income from equity | — | — | 75,656 | — | — | — | ||||||||||||||||||||
Charges for use of transmission grid | — | — | (2,902 | ) | — | — | — | |||||||||||||||||||
|
|
|
|
|
|
|
|
|
|
|
| |||||||||||||||
| — | 294 | 72,754 | — | — | — | |||||||||||||||||||||
Paranaíba Transmissora de Energia S.A. | Equity investment | 17,801 | — | — | — | — | — | |||||||||||||||||||
Income from equity | — | — | 161 | — | — | — | ||||||||||||||||||||
Revenue from services | — | — | 208 | — | — | — | ||||||||||||||||||||
|
|
|
|
|
|
|
|
|
|
|
| |||||||||||||||
| 17,801 | — | 369 | — | — | — | |||||||||||||||||||||
F-183
Table of Contents
| 12/31/2013 | 12/31/2012 | |||||||||||||||||||||||||
COMPANIES | NATURE OF THE TRANSACTION | ASSET | LIABILITY | RESULT | ASSET | LIABILITY | RESULT | |||||||||||||||||||
Centrais Eolica Famosa I S.A. | Advance for future capital increase | 3,807 | — | — | — | — | — | |||||||||||||||||||
Equity investment | 3,455 | — | — | — | — | — | ||||||||||||||||||||
Costs of equity | — | — | (305 | ) | — | — | — | |||||||||||||||||||
Income from equity | — | — | — | — | — | — | ||||||||||||||||||||
|
|
|
|
|
|
|
|
|
|
|
| |||||||||||||||
| 7,262 | — | (305 | ) | — | — | — | ||||||||||||||||||||
Centrais Eolica Pau Brasil S.A. | Advance for future capital increase | 2,538 | — | — | — | — | — | |||||||||||||||||||
Equity investment | 2,302 | — | — | — | — | — | ||||||||||||||||||||
Costs of equity | — | — | (225 | ) | — | — | — | |||||||||||||||||||
Income from equity | — | — | — | — | — | — | ||||||||||||||||||||
|
|
|
|
|
|
|
|
|
|
|
| |||||||||||||||
| 4,840 | — | (225 | ) | — | — | — | ||||||||||||||||||||
Centrais Eolica São Paulo S.A. | Advance for future capital increase | 2,856 | — | — | — | — | — | |||||||||||||||||||
Equity investment | 2,594 | — | — | — | — | — | ||||||||||||||||||||
Costs of equity | — | — | (241 | ) | — | — | — | |||||||||||||||||||
Income from equity | — | — | — | — | — | — | ||||||||||||||||||||
|
|
|
|
|
|
|
|
|
|
|
| |||||||||||||||
| 5,450 | — | (241 | ) | — | — | — | ||||||||||||||||||||
Centrais Eolica Rosada S.A. | Advance for future capital increase | 4,759 | — | — | — | — | — | |||||||||||||||||||
Equity investment | 4,326 | — | — | — | — | — | ||||||||||||||||||||
Costs of equity | — | — | (347 | ) | — | — | — | |||||||||||||||||||
Income from equity | — | — | — | — | — | — | ||||||||||||||||||||
|
|
|
|
|
|
|
|
|
|
|
| |||||||||||||||
| 9,085 | — | (347 | ) | — | — | — | ||||||||||||||||||||
ESBR Part. | Equity investment | — | — | — | 939,825 | — | — | |||||||||||||||||||
Other comprehensive income | — | — | — | — | (231 | ) | — | |||||||||||||||||||
Costs of equity | — | — | — | — | — | (4,352 | ) | |||||||||||||||||||
|
|
|
|
|
|
|
|
|
|
|
| |||||||||||||||
| — | — | — | 939,825 | (231 | ) | (4,352 | ) | |||||||||||||||||||
FOTE | Equity investment | 5 | — | — | — | — | — | |||||||||||||||||||
|
|
|
|
|
|
|
|
|
|
|
| |||||||||||||||
| 5 | — | — | — | — | — | |||||||||||||||||||||
Vale do São Bartolomeu Transmissora de Energia S.A. | Other Revenues | — | — | 16 | — | — | — | |||||||||||||||||||
Equity investment | 663 | — | — | — | — | — | ||||||||||||||||||||
|
|
|
|
|
|
|
|
|
|
|
| |||||||||||||||
| 663 | — | 16 | — | — | — | |||||||||||||||||||||
PUNAÚ I EÓLICA S.A | Equity investment | 123 | — | — | — | — | — | |||||||||||||||||||
|
|
|
|
|
|
|
|
|
|
|
| |||||||||||||||
| 123 | — | — | — | — | — | |||||||||||||||||||||
CARNAÚBA I EÓLICA S.A. | Equity investment | 113 | — | — | — | — | — | |||||||||||||||||||
|
|
|
|
|
|
|
|
|
|
|
| |||||||||||||||
| 113 | — | — | — | — | — | |||||||||||||||||||||
CARNAÚBA II EÓLICA S.A. | Equity investment | 93 | — | — | — | — | — | |||||||||||||||||||
|
|
|
|
|
|
|
|
|
|
|
| |||||||||||||||
| 93 | — | — | — | — | — | |||||||||||||||||||||
CARNAÚBA III EÓLICA S.A. | Equity investment | 83 | — | — | — | — | — | |||||||||||||||||||
|
|
|
|
|
|
|
|
|
|
|
| |||||||||||||||
| 83 | — | — | — | — | — | |||||||||||||||||||||
CARNAÚBA V EÓLICA S.A. | Equity investment | 123 | — | — | — | — | — | |||||||||||||||||||
|
|
|
|
|
|
|
|
|
|
|
| |||||||||||||||
| 123 | — | — | — | — | — | |||||||||||||||||||||
CERVANTES I EÓLICA S.A. | Equity investment | 83 | — | — | — | — | — | |||||||||||||||||||
|
|
|
|
|
|
|
|
|
|
|
| |||||||||||||||
| 83 | — | — | — | — | — | |||||||||||||||||||||
CERVANTES II EÓLICA S.A. | Equity investment | 64 | — | — | — | — | — | |||||||||||||||||||
|
|
|
|
|
|
|
|
|
|
|
| |||||||||||||||
| 64 | — | — | — | — | — | |||||||||||||||||||||
BOM JESUS EÓLICA S.A. | Equity investment | 93 | — | — | — | — | — | |||||||||||||||||||
|
|
|
|
|
|
|
|
|
|
|
| |||||||||||||||
| 93 | — | — | — | — | — | |||||||||||||||||||||
CACHOEIRA EÓLICA S.A | Equity investment | 64 | — | — | — | — | — | |||||||||||||||||||
|
|
|
|
|
|
|
|
|
|
|
| |||||||||||||||
| 64 | — | — | — | — | — | |||||||||||||||||||||
PITIMBU EÓLICA S.A | Equity investment | 93 | — | — | — | — | — | |||||||||||||||||||
|
|
|
|
|
|
|
|
|
|
|
| |||||||||||||||
| 93 | — | — | — | — | — | |||||||||||||||||||||
SÃO CAETANO EÓLICA S.A | Equity investment | 132 | — | — | — | — | — | |||||||||||||||||||
|
|
|
|
|
|
|
|
|
|
|
| |||||||||||||||
| 132 | — | — | — | — | — | |||||||||||||||||||||
F-184
Table of Contents
| 12/31/2013 | 12/31/2012 | |||||||||||||||||||||||||
COMPANIES | NATURE OF THE TRANSACTION | ASSET | LIABILITY | RESULT | ASSET | LIABILITY | RESULT | |||||||||||||||||||
SÃO CAETANO I EÓLICA S.A | Equity investment | 93 | — | — | — | — | — | |||||||||||||||||||
|
|
|
|
|
|
|
|
|
|
|
| |||||||||||||||
| 93 | — | — | — | — | — | |||||||||||||||||||||
SÃO GALVÃO EÓLICA S.A. | Equity investment | 122 | — | — | — | — | — | |||||||||||||||||||
|
|
|
|
|
|
|
|
|
|
|
| |||||||||||||||
| 122 | — | — | — | — | — | |||||||||||||||||||||
SINOP | Income from equity | — | — | 1 | — | — | — | |||||||||||||||||||
|
|
|
|
|
|
|
|
|
|
|
| |||||||||||||||
| — | — | 1 | — | — | — | |||||||||||||||||||||
Ventos de Santa Joana IX | Equity investment | 7,690 | — | — | — | — | — | |||||||||||||||||||
|
|
|
|
|
|
|
|
|
|
|
| |||||||||||||||
| 7,690 | — | — | — | — | — | |||||||||||||||||||||
Ventos de Santa Joana X | Equity investment | 7,690 | — | — | — | — | — | |||||||||||||||||||
|
|
|
|
|
|
|
|
|
|
|
| |||||||||||||||
| 7,690 | — | — | — | — | — | |||||||||||||||||||||
Ventos de Santa Joana XI | Equity investment | 7,690 | — | — | — | — | — | |||||||||||||||||||
|
|
|
|
|
|
|
|
|
|
|
| |||||||||||||||
| 7,690 | — | — | — | — | — | |||||||||||||||||||||
Ventos de Santa Joana XII | Equity investment | 7,690 | — | — | — | — | — | |||||||||||||||||||
|
|
|
|
|
|
|
|
|
|
|
| |||||||||||||||
| 7,690 | — | — | — | — | — | |||||||||||||||||||||
Ventos de Santa Joana XIII | Equity investment | 7,690 | — | — | — | — | — | |||||||||||||||||||
|
|
|
|
|
|
|
|
|
|
|
| |||||||||||||||
| 7,690 | — | — | — | — | — | |||||||||||||||||||||
Ventos de Santa Joana XV | Equity investment | 7,690 | — | — | — | — | — | |||||||||||||||||||
|
|
|
|
|
|
|
|
|
|
|
| |||||||||||||||
| 7,690 | — | — | — | — | — | |||||||||||||||||||||
Ventos de Santa Joana XVI | Equity investment | 7,690 | — | — | — | — | — | |||||||||||||||||||
|
|
|
|
|
|
|
|
|
|
|
| |||||||||||||||
| 7,690 | — | — | — | — | — | |||||||||||||||||||||
NOTE 47 – REMUNERATION OF KEY PERSONNEL
The remuneration of the Company’s key personnel (officers and directors) is as follows:
| 12/31/2013 | 12/31/2012 | 12/31/2011 * | ||||||||||
Remuneration of Directors and Advisors | 25,548 | 22,432 | 30,457 | |||||||||
Salaries and social charges | 5,698 | 5,046 | 6,371 | |||||||||
other | 2,617 | 3,029 | 4,146 | |||||||||
|
|
|
|
|
| |||||||
| 33,863 | 30,507 | 40,974 | ||||||||||
|
|
|
|
|
| |||||||
| * | We have not restated data for 2011 to reflect the application of IFRS 11. |
NOTE 48 – SUBSEQUENT EVENTS
48.1 Transmission Auction of the Belo Monte Hydroelectric Complex
On February 7, 2014, the consortium formed by Furnas (24.5%) , Eletronorte (24.5%) and Chinese company State Grid Brasil Holding (51%) successfully bid in the auction Transmission No. 11 /2013 ANEEL held at the Bovespa in São Paulo, for the transmission system Hydroelectric Complex (CHE) Belo Monte, under construction on the Xingu River. This includes the construction, installation, operation and maintenance of the project, and was won with a bid of R$ 434,647, representing 38% discount on the Maximum Annual Revenue (approximately R$ 701,040). The investment is estimated at R$ 5 billion.
F-185
Table of Contents
The transmission system will allow the flow of electricity from the Belo Monte Hydroelectric Complex of the National Interconnected System through a transmission system on an extra-high voltage direct current of ± 800 kV, unprecedented in the country. The circuit consists of two converter stations from 500 kV AC to DC ± 800 kV. The first will be capable of converting 4,000 MW and will be built on the Xingu substation (500 kV), located 17 km from the plant, which connects the Manaus interconnection to Tucuruí, and the latter will be capable of converting 3,850 MW and will be built adjoining the Strait substation in the Minas Gerais area.
The Transmission Line from Strait to Xingu (± 800kV) will connect the two stations and will have a length of 2092 km, crossing the states of Pará, Tocantins, Goiás and Minas Gerais. The scheduled completion of the transmission system is January 2018 and the concession period is 30 years.
48.2 Contract of Acknowledgement of Debt – Amazonas Energia
The Board of Amazonas Distribuidora de Energia S.A. resolved to approve and submit to the Board of Directors, and subsequently forward to Eletrobras, the signing of the Confession of Debt (CCD), with installments, with Petrobras Distribuidora S.A. in the amount of R$ 1,112,806, as of 31/12/2013, payable in 85 monthly installments of R$ 13,092, adjusted by the Selic rate at the date of payment of each installment. This transaction yielded no effect on net income in 2013.
48.3 Acquisition of shareholding – Eletronorte
The Board approved on October 2, 2013, the acquisition of the shareholding of Abengoa Concessões Brasil Holding S.A., by the Special Purpose Company, the Linha Verde Transmissora de Energia S.A., involving the acquisition by Eletronorte of the entire stake in the investment.
The Board of Directors of Eletrobras approved the transaction in February 2014. However, the transaction is subject to approval from the National Electric Energy Agency - ANEEL and the Administrative Council for Economic Defense - CADE, and Banco da Amazonia as the latter is responsible for the financing obtained from the Linha Verde Transmissora de Energia S.A.
48.4 Succession Plan Program Employee – Electronuclear
The Company established, in February 2014, the Employees Succession Plan Program - ESPP, as approved at the 282nd meeting of the Board of Directors of Eletronuclear on 19/12/2012, with a start date of March 2014 and the beginning of disbursements in August 2014, taking into account the cash flow of the Company in the second half of 2014. Pursuant to corporate law, once the amounts under the ESPP are fully recognized, there may be a significant effect on the company’s results for the years 2014 and possibly 2015.
48.5 Generation Auction 009 / 2013 – Eletrosul
On January 28, 2014, the subsidiary Eletrosul became one of the new Special Purpose Entities (SPE), as shown below, formed as a result of the auction 009/2013-ANEEL generation.
F-186
Table of Contents
SPE | Parque Eólico | % Part. | Shareholder | % | Nominal Potential (MW) | Physical Guarantee (MWm) | ||||||||||||||
Eólica Hermengildo I S.A. | Verace 24 | 99.99 | % | Renobrax | 0.01 | % | 18.7 | 9.2 | ||||||||||||
| Verace 25 | 6.8 | 3.3 | ||||||||||||||||||
| Verace 26 | 13.6 | 7 | ||||||||||||||||||
| Verace 27 | 15.3 | 7.9 | ||||||||||||||||||
Eólica Hermengildo II S.A. | Verace 28 | 99.99 | % | Renobrax | 0.01 | % | 11.9 | 5.9 | ||||||||||||
| Verace 29 | 17 | 8.3 | ||||||||||||||||||
| Verace 30 | 17 | 8.2 | ||||||||||||||||||
| Verace 31 | 8.5 | 4.2 | ||||||||||||||||||
Eólica Hermengildo III S.A. | Verace 34 | 99.99 | % | Renobrax | 0.01 | % | 13.6 | 6.7 | ||||||||||||
| Verace 35 | 11.9 | 5.8 | ||||||||||||||||||
| Verace 36 | 20.4 | 9.7 | ||||||||||||||||||
Eólica Coxilha Seca S.A. | Capão Inglês | 99.99 | % | Renobrax | 0.01 | % | 10 | 3.9 | ||||||||||||
| Colhilha Seca | 30 | 11.8 | ||||||||||||||||||
| Galpões | 8 | 3 | ||||||||||||||||||
Eólica Chuí IX S.A. | Chuí 09 | 99.99 | % | Renobrax | 0.01 | % | 17 | 7.8 | ||||||||||||
48.6 UTEs Rio Branco I and Rio Branco II
ANEEL, pursuant to their duties, recommended to the Ministry of Mines and Energy (MME) the dissolution of the released public entities of Thermal Power Plants (TPPs) Rio Branco I and Rio Branco II, granted to the Company by DNAEE Ordinance No. 156/1990, in addition to ruling not to attempt the termination of the authorization to compensate for unrecovered investment.
The balances of these TPPs on December 31, 2013, are fully provisioned in Eletronorte.
48.7 CELG Distribution
On January 29, 2014, the Memorandum of Understanding was signed between Eletrobras, the state of Goiás, CELG Company Holdings - Celgpar and CELG Distribution SA - CELG D, aiming to continue negotiations for the purchase of up to 51 % (fifty one percent) of common shares of CELG D by Eletrobras, under legal agreements previously concluded.
48.8 Recovery Plan – Energy Network (CEMAT)
Through the Authorizing Resolution No. 4,510, of January 28, 2014, ANEEL consented to the transfer of corporate control of Grupo Rede Energia to Energisa S.A. The resolution also approved the plan submitted by Rede Energia Group and detailed by Energisa Group for the recovery and correction of faults and transgressions which gave rise to intervention in the group’s distribution network. The transfer of control of the Network Group is also subject to the fulfillment of other conditions precedent set forth in the Commitment Investment, Purchase and Sale of Shares and Other Covenants, entered into between Energisa and the controlling shareholder of the Network Group.
F-187
Table of Contents
48.9 UHE Itaparica – Transfer of infrastructure for the common use of irrigated perimeters of Itaparica of CHESF to Codevasf
According to the Ministerial Notice No. 35/2014/GM-MME, the Ministry of National Integration is enabling the transfer of infrastructure for the common use of irrigated perimeters of Itaparica of CHESF to Codevasf. In this sense, Codevasf is taking steps to enable the Company to take over the Operation and Maintenance of Irrigation Infrastructure in common use from June 1, 2014 (see note 35).
| José da Costa Carvalho Neto | Armando Casado de Araújo | |
| President | CFO and Investor Relations | |
| Valter Luiz Cardeal de Souza | Manoel Aguinaldo Guimarães | |
| Director of Generation | Director of Administration - Interim | |
| Luis Hiroshi Sakamoto | José Antônio Muniz Lopes | |
| Director of Distribution - interim | Director of Transmission | |
Rodrigo Vilella Ruiz
Accountant
CRC 088488/9 O - DF
F-188