SECURITIES AND EXCHANGE COMMISSION
Washington, D.C. 20549
FORM 6-K
Report of Foreign Private Issuer
Pursuant to Rule 13a-16 or 15d-16 of the
Securities Exchange Act of 1934
For the month of November, 2022
Commission File Number 1-34129
CENTRAIS ELÉTRICAS BRASILEIRAS S.A. - ELETROBRÁS
(Exact name of registrant as specified in its charter)
BRAZILIAN ELECTRIC POWER COMPANY
(Translation of Registrant's name into English)
Rua da Quitanda, 196 – 24th floor,
Centro, CEP 20091-005,
Rio de Janeiro, RJ, Brazil
(Address of principal executive office)
Indicate by check mark whether the registrant files or will file annual reports under cover Form 20-F or Form 40-F.
Form 20-F ___X___ Form 40-F _______
Indicate by check mark whether the registrant by furnishing the information contained in this Form is also thereby furnishing the information to the Commission pursuant to Rule 12g3-2(b) under the Securities Exchange Act of 1934.
Yes _______ No___X____

 | |
Marketletter 3Q22 |
INTRODUCTION
Rio de Janeiro, November 09, 2022
A Eletrobras (Centrais Elétricas Brasileiras S.A.)
[B3: ELET3 e ELET6 – NYSE: EBR and EBR-B – LATIBEX: XELTO e XELTB]
Eletrobras, the largest company in the electricity sector in Latin America, operating in the generation, transmission and commercialization segment, direct controller of 4 operating subsidiaries and a holding company – Eletropar –, a research center – Cepel and direct and indirect participation in 75 Special Purpose Entities, announces, on this date, its results for the period referring to the third quarter of 2022.
3rd QUARTER OF 2022
Eletrobras presented, in the third quarter of 2022 (3Q22), a net loss of BRL 88 thousand, 100% lower than the net income of BRL 965 million obtained in the third quarter of 2021 (3Q21).
The 3Q22 result was negatively impacted by the deflation that occurred in the period, which resulted in a reduction of R$1,941 million in transmission revenues, which are adjusted by IPCA index and IGPM index. In addition, there was a R$937 million decrease in the financial result, in particular, due to the R$1,041 million increase in financial expenses with debt charges, as a result of the consolidation of SPE Santo Antônio Energia 9Saesa) (+R$300 million) and the impact of BRL 490 million in Charges (IPCA + WACC/rate) of obligations with the CDE (WACC of 7.31%) and projects for the revitalization of the river basins and Amazônia Legal (rate of 5.67%), resulting from the new generation concession contracts signed in the privatization process. The 3Q22 result was also impacted by the recording of operating provisions for allowance for loan losses, which totaled R$533 million, mainly influenced by the delinquency of the distributor Amazonas Energia of R$478.5 million, and by provisions for contingencies of R$874 million, highlighting the risk reclassification of a lawsuit filed against Chesf, claiming losses and damages due to delays in transmission lines in the amount of R$588 million. The R$497 million increase in depreciation and amortization expenses also impacted the result, of which R$267 million related to the amortization of new generation contracts (Itumbiara, Tucuruí, Sobradinho, Mascarenhas and Curua-Una), resulting from privatization, and R$203 million for the consolidation of SPE Santo Antônio Energia.
Net Operating Revenue went from R$9,210 million in 3Q21 to R$8,033 million in 3Q22, a decrease of 13%, influenced by the deflation of the period (drop in IPCA and IGPM), worsening transmission revenue in a very relevant way, which was partially mitigated by the tariff review of the 22/23 cycle of 17 transmission contracts, totaling R$362 million, and by the R$1,005 million increase in generation revenue, impacted by the consolidation of SPE Santo's revenue Antônio Energia (+R$ 1,220 million). IFRS EBITDA, in the amount of R$ 5,234 million in 3Q21, increased to an amount of R$ 2,419 million in 3Q22, mainly due to the reduction in Transmission revenue as mentioned above and the increase in PMSO by 27%, as a result of the Agreement Collective Work 22/23 of 12% and consolidation of PMSO Saesa of R$ 90 million. Adjusted Net Operating Revenue decreased by 12%, from R$9,196 million in 3Q21 to R$8,033 million in 3Q22, influenced by the aforementioned drop in transmission revenue. Adjusted Ebitda decreased by 36%, from R$4,988 million in 3Q21 to R$3,197 million in 3Q22, influenced by the decrease in revenue and the increase in adjusted PMSO of R$427 million.
MARKETLETTER 3Q2022 | 3 |
Disclaimer: This material contains calculations that may not produce an accurate sum or result due to rounding. |
| | |
Marketletter 3Q22 |
 | Table 01: MAIN INDICATORS (R$ MILLION) |
| 2022 | 2021 | % | 3Q22 | 3Q21 | % | |
| 95 | 96.3 | -0,1% | Energy Sold - Generation GWh (1) | 33.3 | 32.6 | 2,0% |
| 30,234 | 28,762 | 5% | Gross Revenue | 9,901 | 10,812 | -8% |
| 30,162 | 28,731 | 5% | Recurring Gross Revenue | 9,901 | 10,798 | -8% |
| 25,065 | 24,125 | 4% | Net operating revenue | 8,033 | 9,210 | -13% |
| 25,000 | 24,094 | 4% | Recurring Net Operating Revenue | 8,033 | 9,196 | -13% |
| 9,978 | 11,817 | -16% | EBITDA | 2,419 | 5,234 | -54% |
| 12,997 | 14,047 | -7% | Recurring EBITDA | 3,197 | 4,988 | -36% |
| 40% | 49% | -9,2 | Ebitda Margin | 30% | 57% | -26,7 |
| 0,5 | 0,6 | -631% | Recurring Ebitda Margin | 0,4 | 0,5 | -1445% |
| 54,501 | 48,152 | 13% | Gross debt without third party RGR | 54,501 | 48,152 | 13% |
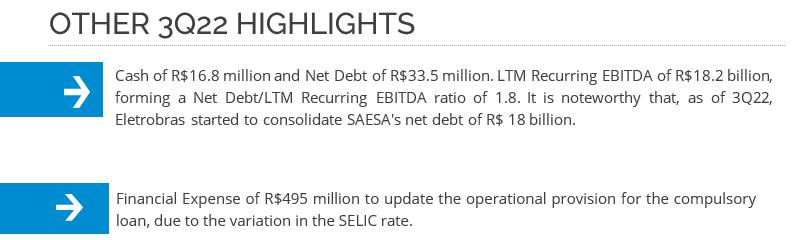
| 33,522 | 19,106 | 75% | Recurring Net Debt | 33,522 | 19,106 | 75% |
| 1,8 | 0,9 | 91% | Recurring Net Debt / Recurring LTM EBITDA | 1,8 | 0,9 | 91% |
| 4,117 | 5,104 | -19% | Net Profit | -0,09 | 965 | -100% |
| 3,575 | 2,527 | 59% | Investments | 991 | 1,024 | -3% |
| 10,476 | 12,182 | -14% | Employees | 10,476 | 12,182 | -14% |
(1) Does not consider Eletronuclear and Itapu; (2), (3) and (4) Adjustments detailed in the consolidated analysis presented below.
MARKETLETTER 3Q2022 | 4 |
Disclaimer: This material contains calculations that may not produce an accurate sum or result due to rounding. |
| | |
Marketletter 3Q22 |
1 ANALYSIS OF THE
CONSOLIDATED RESULT(R$ MILLION)
| | TABLE 02: CONSOLIDATED RESULTS |
| 2022 | 2021 | DRE | 3Q22 | 3Q21 |
| 17,355 | 15,841 | Generation Revenue | 6,754 | 5,749 |
| 12,143 | 12,370 | Transmission Revenue | 2,924 | 4,864 |
| 736 | 550 | Others Revenue | 224 | 199 |
| 30,234 | 28,762 | Gross Revenue | 9,901 | 10,812 |
| -5,169 | -4,637 | Deductions from Revenue | -1,868 | -1,602 |
| 25,065 | 24,125 | Net Operating Revenue | 8,033 | 9,210 |
| -6,601 | -2,617 | Operational costs | -2,801 | 691 |
| -5,984 | -5,352 | Personnel, Material, Services and Others | -2,235 | -1,746 |
| -1,811 | -922 | Depreciation and amortization | -812 | -315 |
| -5,794 | -11,374 | Operating Provisions | -1,529 | -9,376 |
| 4,876 | 3,859 | 656 | -1,536 | |
| 1,668 | 1,451 | Shareholding | 555 | 850 |
| 362 | 4,859 | Regulatory Remeasurements - Transmission Contracts | 362 | 4,859 |
| 274 | 772 | Others Revenues and Expenses | 32 | 772 |
| 7,181 | 10,940 | 1,606 | 4,944 | |
| -2,696 | -710 | Financial Result | -1,819 | -882 |
| 4,485 | 10,231 | Income before tax | -213 | 4,062 |
| -1,355 | -5,081 | Income tax and social contribution | 213 | -3,072 |
| 3,130 | 5,150 | NET INCOME from Continuing Operations | -0.09 | 990 |
| 987 | -46 | Net Income From Discontinued Operations | 0 | -26 |
| 4,117 | 5,104 | NET INCOME FOR THE PERIOD | -0.09 | 965 |
MARKETLETTER 3Q2022 | 5 |
Disclaimer: This material contains calculations that may not produce an accurate sum or result due to rounding. |
| | |
Marketletter 3Q22 |
| TABLE 03: RECURRING CONSOLIDATED RESULT |
| 2022 | 2021 | Recurring Financial Statement * | 3Q22 | 3Q21 |
| 17,283 | 15,802 | Generation Revenue Recurring | 6,754 | 5,735 |
| 12,143 | 12,370 | Transmission Revenue Recurring | 2,924 | 4,864 |
| 736 | 558 | Others Revenue Recurring | 224 | 199 |
| 30,162 | 28,731 | Gross Revenue Recurring | 9,901 | 10,798 |
| -5,162 | -4,637 | Deductions from Revenue Recurrent | -1,868 | -1,602 |
| 25,000 | 24,094 | Net Operating Revenue Recurring | 8,033 | 9,196 |
| -6,593 | -6,453 | Operational costs Recurring | -2,801 | -3,183 |
| -5,639 | -4,847 | Personnel, Material, Services and Others Recurring | -2,026 | -1,600 |
| -1,811 | -922 | Depreciation and amortization Recurring | -812 | -315 |
| -1,439 | -198 | Operating Provisions Recurring | -564 | -275 |
| 9,518 | 11,674 | 1,829 | 3,823 | |
| 1,668 | 1,451 | Shareholdings Recurring | 555 | 850 |
| 11,186 | 13,125 | Adjusted Result before Financial Result | 2,385 | 4,673 |
| -2,130 | -193 | Financial Result Recurring | -1,458 | -721 |
| 9,056 | 12,931 | Income before tax Recurring | 927 | 3,952 |
| -1,653 | -2,456 | Income tax and social contribution Recurring | 213 | -585 |
| 7,403 | 10,475 | Net Income for the year Recurring | 1,139 | 3,367 |
* Non-recurring adjustments mentioned in the Highlights.
MARKETLETTER 3Q2022 | 6 |
Disclaimer: This material contains calculations that may not produce an accurate sum or result due to rounding. |
| | |
Marketletter 3Q22 |
1.1 MAIN VARIATIONS OF FINANCIAL STATEMENTS
Highlights in the Analysis 3Q22 X 3Q21
Below are the main highlights of 3Q22. For more details on the companies' results, see annex 2 of the Investor Report.
OPERATING INCOME
TABLE 04: GENERATION REVENUE
| Operating Revenue - Generation | 3Q22 | 3Q21 | % | 2022 | 2021 | % |
| Generation Revenue | ||||||
| Energy supply to distribution companies | 4,252 | 3,160 | 0 | 9,934 | 8,508 | 0 |
| Supply | 1,041 | 884 | 18% | 2,948 | 2,412 | 22% |
| CCEE | 202 | 523 | -61% | 1,018 | 1,631 | -38% |
| Operation and Maintenance Revenue | 1,255 | 1,084 | 16% | 3,434 | 3,136 | 9% |
| Construction Revenue | 0 | 14 | -100% | 7 | 39 | -81% |
| Itaipu Transfer | 5 | 84 | -94% | 13 | 115 | -88% |
| Generation Revenue | 6,754 | 5,749 | 17% | 17,355 | 15,841 | 10% |
| Non-recurring events | ||||||
| (-) Reversal of Penalties for Unavailability - CCEAR - CGT Eletrosul | 0 | 0 | - | -65 | 0 | 0% |
| (-) Construction Generation | 0 | -14 | -100% | -7 | -39 | -81% |
| Adjusted Generation Revenue | 6,754 | 5,735 | 18% | 17,283 | 15,802 | 9% |
VARIATION ANALYSIS 3Q22 X 3Q21
ENERGY SUPPLY TO DISTRIBUTION COMPANIES: Revenue obtained from a customer that is not a final consumer, such as generators, traders and distributors.
| · | In Furnas (+R$1,054 million): (i) consolidation, as of 3Q22, of Madeira Energia S.A, impacting by R$1,185 million, corresponding to 7,720 average MW, referring to billings made to energy resellers, with the balance composed of customers of ACL 30% (Free Contracts Environment) and ACR 70% (Regulated Contracts Environment). Contracts are updated annually by the IPCA; (ii) Price adjustment based on the IPCA of ACR contracts (+R$ 26 million), partially offset by (iii) a 12% reduction in energy traded on the ACL (1,928 GWh in 3Q21 to 1,835 GWh in 3Q22, representing a decrease of R$ 23 million; and (iv) the fact that the Santa Cruz thermal plant, in 3Q22, was not dispatched by the ONS, given the increase in GSF due to the improvement in reservoirs, while in 3Q21 it generated 322 GWh, resulting in an impact of -R$ 136 million in variable revenue. |
| · | • At CGT Eletrosul (+R$191 million): (i)increase in ACR revenue of R$59.2 million, mainly due to: (a) 10% increase in average sales prices (R$286/MWh vs. R$259/MWh) as a result of the adjustment by the IPCA, resulting in an increase of R$25.7 million; (ii) an average increase of 4 MW in the quantity sold, increasing revenue by R$2.4 million; and (iii) factors related to TPP Candiota III, such as: lower reimbursement for insufficient generation and variable revenues, totaling approximately +R$ 31.1 million; (ii) In the ACL, the increase of R$132.1 million in revenue stems from: (i) R$96.1 million in revenue from the contract signed for the export of energy from TPP Candiota III; and (ii) an increase of R$ 36 million in revenue due to the increase in the quantity sold (398 average MW in 3Q22 compared to 339 average MW in 3Q21). |
MARKETLETTER 3Q2022 | 7 |
Disclaimer: This material contains calculations that may not produce an accurate sum or result due to rounding. |
| | |
Marketletter 3Q22 |
Partially offset by:
| · | At Eletronorte (-R$109 million): (i) At ACL: (a) the R$ 136 million reduction in sales at UHE Tucuruí (3Q21 R$ 719 million X 3Q22 R$ 583 million), due to the reduction of 26% in the price of energy sold (3Q21 R$193.76/MWh X 3Q22 R$142.47/MWh); (b) the R$4 million increase in revenue from the sale of UHE Samuel (3Q21 R$45 million X 3Q22 R$49 million) due to a 12% increase in Contract Prices (3Q21 R$247.23/MWh X 3Q22 R$277.61/MWh); (ii) In the ACR: (a) the R$ 35 million increase in revenue from the sale of PIEs from the capital (3Q21 R$ 629 million X 3Q22 R$ 664 million), to the distributor Amazonas Energia, due to an increase 6% of the Contract Prices linked to the IGPM (3Q21 R$877.99/MWh X 3Q22 R$921.07/MWh); (b) the R$ 1 million increase in revenue from the sale of PIEs from the interior (3Q21 R$ 22 million X 3Q22 R$ 23 million), to the distributor Amazonas Energia, due to the increase in the amount of energy sold in 10 % (3Q21 7.26 MWm X 3Q22 7.96 MWm); (c) the R$ 1 million increase in UHE Balbina sales (3Q21 R$ 121 million X 3Q22 R$ 122 million), as a result of the 1% increase in contractual prices (3Q21 R$ 345.45/MWh X 3Q22 R $349.69/MWh); (d) the R$ 13 million reduction in sales of UTE Mauá and UTE Aparecida (3Q21 R$ 406.5 million X 3Q22 R$ 393.5 million), as a result of the reduction in the volume of energy sold by 27% (3Q21 782.94 MWm X 3Q22 572.93 MWm), due to the thermal dispatch of the plants only in the inflexibility. |
| · | Chesf (-R$39 million): (i) Reduction of 59 average MW sold in the ACL in Sep/22, equivalent to approximately R$42 million, due to a change in strategy compared to Sep/21. This effect was partially offset by (ii) suspension of payment of reimbursements for wind availability contracts in 2022, due to the delay in implementing the constrained-off compensation methodology for wind generators, defined by ANEEL through REN ANEEL 927/2021 estimated at R$ 6 million. |
SUPPLY FOR END CONSUMERS: Revenue obtained from a customer who is a final consumer
| · | Chesf (+R$72 million): (i) increase in 3Q22, of around 84 MW, in the average consumption of industrial customers at UHE Sobradinho, reached by Law 13,182/2015 by around R$35 million; |
| · | In Furnas (+R$57 million): (i) consolidation of R$34 million from SAESA in 3Q22, equivalent to 111,138 MWh, referring to the monthly billing of energy consumers of the ACL (Free Contract Environment), whose contracts are updated annually (IPCA), and also due to the seasonality and flexibility of the ACL contracts; (ii) readjustments in the unit prices of the supply contracts linked to UHE Itumbiara (Law 13,182), of approximately 9%, resulting in an increase of R$ 24 million in the period; (iii) Start of new supply contracts, started in 2022, representing an increase of R$ 3 million. On the other hand; (iv) the R$ -4 million difference is due to the fluctuation of the ICMS amount applied between the two periods, which varies according to the tax rate and attribution of billing to consumer units. |
| · | At Eletronorte (+R$28 million): (i) the R$27.2 million increase in Albras' revenue, due to the readjustment of the base price and the variations of the parameters, defined in the contract, used to calculate the final price sales: Aluminum price, Dollar and Sectorial Charges. (a) update of the base price by the IGP-M of 15%, in May/22, from R$177.92/MWh to R$204.00/MWh; (b) 2% drop in average aluminum prices (US$ 2,501.31 3Q21 X US$ 2,471.84 3Q22); (c) positive variation of 0.4% in the average dollar conversion rates (3Q21 R$5.22/US$ X 3Q22 R$5.25/US$). (ii) positive variation of R$500,000 due to the 9% readjustment in the price of the other sales contracts at UHE Tucuruí (3Q21 R$220.78/MWh X 3Q22 R$241.21/MWh). |
MARKETLETTER 3Q2022 | 8 |
Disclaimer: This material contains calculations that may not produce an accurate sum or result due to rounding. |
| | |
Marketletter 3Q22 |
CCEE
| · | At holding (-R$296 million): (i) improvement of the country's hydrological conditions, significantly reducing the need to import electricity from the Oriental Republic of Uruguay. |
| · | At Chesf (-R$71 million): (i) PLD variation from R$579.38/MWh in 3Q21 to R$66.43/MWh in 3Q22; and (ii) the variation in the GSF from 51.21% (in 3Q21) to 75.04% (in 3Q22). |
| · | At Eletronorte (-R$48 million): mainly in relation to the Tucuruí, Samuel and Curuá-Una Hydraulic Plants, due to: (i) a 12% increase in energy sold through bilateral contracts (3Q21 2,672 MWavg X 3Q22 2,990 MWmed); (ii) 89% reduction in PLD (3Q21 R$516.95/MWh X 3Q22 R$57.17/MWh); even with (iii) the 23% increase in seasonal physical guarantee post GSF (3Q21 2,525MWavg X 3Q22 3,100MWavg). |
| · | At CGT Eletrosul (-R$15 million): 89% reduction in PLD (from R$582/MWh in 3Q21 to R$67/MWh in 3Q22), corresponding to a negative variation of R$15.8 million; slightly offset by the increase in energy settled in 3Q22 compared to 3Q21, corresponding to an increase of R$ 0.7 million. |
Partially offset by:
| · | In Furnas (+R$109 million): (i) variation in GSF between the periods, which increased by approximately 24 p.p. (51% in 2021 and 75% in 2022), generated a greater amount of energy to be settled compared to the previous period and consequent higher result in the MCP, which ended up offsetting the drop in the average PLD (from R$ 581.71 in 2021 to BRL 73.36 in 2022). |
OPERATION AND MAINTENANCE REVENUE - PLANTS RENEWED BY LAW 12.783/2013
| · | Annual RAG adjustment of around 14%, in accordance with Aneel Homologatory Resolution No. 3,068/2022, with emphasis on Chesf (R$82 million) and Furnas (+R$55 million), in addition to the increase in CFURH in 3Q22, compared to 3Q21, of around R$23 million at Chesf, and consequently the associated taxes. |
CONSTRUCTION REVENUE
| · | In Furnas (-R$14 million): (i) with the enactment of Law 14,182/21, the treatment for quota plants was changed and, as of Jun/22, there will no longer be accounting for the financial asset generation in construction revenue, therefore it is not possible to compare 3Q21 and 3Q22. |
ITAIPU TRANSFER
| · | In Holding (-R$ 78 million): the reduction observed reflects the drop in the value of the balance of regulatory assets. As a result, the effect of US inflation on the balance tends to be smaller and smaller in nominal terms. |
ANALYSIS OF VARIATION 2022X2021
| · | Revenue from the Power Generation segment grew by 18% in the 9-month period of 2022 (9M22) compared to the 9-month period of 2021 (9M21). This growth was mainly influenced by the higher revenue from Electricity Supply and Supply, which had increases in volumes (especially the consolidation of SPE Santo Antônio Energia as of 3Q22) and by the annual adjustment of contracts. |
MARKETLETTER 3Q2022 | 9 |
Disclaimer: This material contains calculations that may not produce an accurate sum or result due to rounding. |
| | |
Marketletter 3Q22 |
| TABLE 05: TRANSMISSION REVENUE |
| Operating Transmission Revenue | 3Q22 | 3Q21 | % | 2022 | 2021 | % |
| Transmission Revenue | 2,924 | 4,864 | -40% | 12,143 | 12,370 | -2% |
| O&M Revenue - Renewed Lines | 1,361 | 1,492 | 0 | 3,876 | 3,483 | 0 |
| O&M Revenue | 294 | 97 | 203% | 889 | 814 | 9% |
| Construction Revenue | 626 | 742 | -16% | 1,035 | 1,064 | -3% |
| Contractual Revenue - Transmission | 643 | 2,533 | -75% | 6,343 | 7,009 | -10% |
| Adjustment - Non-recurring events | ||||||
| Recurring Transmission Adjusted | 2,924 | 4,864 | -40% | 12,143 | 12,370 | -2% |
ANALYSIS OF VARIATION 3Q22 X 3Q21
O&M REVENUE - RENEWED LINES LAW 12.783/13
| · | Chesf (+R$169 million): publication of Aneel ratifying Resolution 3,067/2022, effective as of July/2022, which includes, among other aspects, the tariff readjustment of the 22/23 cycle, as well as the recognition of RAP's for reinforcement of small size; |
| · | At Eletronorte (+R$77 million): (i) Increase of R$139.2 million in billed revenue (2022 R$555.1 million x 2021 R$415.9 million) mainly due to the 22% readjustment in RAP of contract 058/2001 by the aforementioned Ratifying Resolution 3067/2022; (ii) Reduction of R$62.5 million due to the increase in amortization due to the 2022 tariff adjustment (R$239.1 million in 2021 x R$301.6 million in 2022) of the same Ratifying Resolution 3067/2022. |
| · | In Furnas (+R$31 million): (i) readjustment of 11.7% from the 22/23 cycle, in accordance with Aneel Resolution 3067/2022. |
O&M REVENUE - EXPLORATION REGIME
| · | At CGT Eletrosul (+R$21 million): (i) increases in Revenues (RAP) for the 2022/2023 tariff cycle, under the effect of the IGP-M (10.7%) and IPCA (11.7%) index; and (ii) Other variables with a lower impact, such as the Anticipation Apportionment, Variable Installment and Adjustment Installments. |
| · | Chesf (+R$7 million): (i) publication of Aneel Resolution 3,067/2022, which includes, among other aspects, the effects of the periodic tariff review of 10 concession contracts of the Company, namely: 010/2007, 012/2007 , 009/2011, 010/2011, 017/2011, 005/2012, 017/2012, 018/2012, 019/2012, 008/2011. RTP resulted in an increase in RAP of R$ 18.7 million per cycle, which represents something around 19.97% in the increase in RAP; Additionally, (ii) the effects of the tariff readjustment of the 22/23 cycle for the other unreviewed tendered contracts occurred, as well as the recognition of RAP's of small reinforcements, without previously established revenue, which caused an increase in revenue in the amount of BRL 12.8 million for the 2022/2023 cycle; |
| · | In Furnas (+R$5 million): (i) exchange of tariff cycles, based on the current regulation (REH No. 3067/22), which, in its annexes, details the readjustments of the Transmitters' RAPs. Highlight for the annual contractual adjustment by the IPCA index, 11.73%, or IGP-M, 10.72% depending on the Concession Agreement. |
Partially compensated by:
MARKETLETTER 3Q2022 | 10 |
Disclaimer: This material contains calculations that may not produce an accurate sum or result due to rounding. |
| | |
Marketletter 3Q22 |
| · | At Eletronorte (-R$25 million): (i) Reduction of R$13.8 million in billed revenue; (ii) Reduction of R$ 11.5 million due to the increase in amortization due to tariff readjustments of Aneel Resolution 3067/2022 (73.7 million in 2021 vs. 85.2 million in 2022). |
CONSTRUCTION REVENUE – TRANSMISSION
| · | In Furnas (-R$359 million): (i) review due to the change in the tariff cycle (ReH No. 3067/2022), where the amount of revenue from the construction of contract 062/01 in 3Q21 totaled 575 million (in July : R$ 35 million, in August: R$ 20 million, and in September: R$ 520 million) and in 3Q22 the amount was R$ 209 million (in July: R$ 7 million, in August: R$ 67 million , and in September: R$ 135 million). Additionally, (ii) in the other contracts, the amount of construction revenue totaled R$ -4.94 million in 3Q21 (in July: R$ 1.15 million, in August: R$ 190 thousand, and in September: R$ - 6.28 million) and R$ 2.07 million in 3Q22 (in July: R$ 72 thousand, in August: R$ 10.5 million, and in September: R$ -8.5 million), both restated at a average build margin of 1.006%. |
Partially compensated by:
| · | Chesf (+R$105 million): (i) investments made (appropriated and allocated) in transmission projects in progress, associated with concession contracts: 061/2001, 021/2010, 019/2010, 012/2007, 004/ 2010, 013/2010, 020/2010, 018/2012, 010/2007, 008/2011, 007/2010, 008/2005, 018/2009, 014/2008, 010/2011, 019/2012, 009/2011, 017/2012, 005/2008, 005/2012, 007/2005, 017/2009, 006/2009, 017/2011 and 014/2010. Investments, in general, are linked to Aneel's authorizing resolutions. |
| · | At Eletronorte (+R$88 million): (i) R$103.3 million increase in Construction Revenue as a result of the annual adjustment of the Tariff Readjustment for the 2022/23 cycle being significantly higher than the previous cycle (increase of R$ 67.3 million in 2022 x reduction of R$ 36.0 million in 2021); (ii) a reduction of R$14.8 million as a result of lower construction revenue (R$26.0 million in 2022 x R$40.8 million in 2021) mainly due to: (a) a reduction of R$19, 5 million in revenue from the construction of contracts 007/2008 (R$10.1 million), 058/2001 (R$4.3 million), 001/2009 (R$3.6 million) and 012/2009 (R$ 1.5 million); and (b) increase of R$4.7 million in revenue from contracts 004/2011 (R$3.3 million), 010/2009 (R$1.0 million) and 021/2009 (R$0.4 million ). |
| · | CGT Eletrosul (+R$49 million): (i) Annual adjustment of contractual assets in 3Q22 (R$ -63 million), which compares investments made in transmission with the future cash flow to which the company is entitled. In 3Q21, the annual assessment resulted in (R$ -75 million). Additionally, construction revenues, excluding the adjustment, were (R$ +78 million) in 3Q22 and (R$ +41 million) in 3Q21. |
CONTRACTUAL REVENUE – TRANSMISSION
| · | The reduction is mainly due to IPCA deflation in the period, -0.36%: In Furnas (-R$793 million); At Chesf (-R$636 million); at Eletronorte (-R$318 million); CGT Eletrosul (-R$59 million). |
VARIATION ANALYSIS 2022X2021
| · | Transmission revenues decreased by 2%, from R$12,370 million in 3Q21 to R$12,143 million in 3Q22, mainly impacted by the evolution of the IPCA in the period, which especially impacted contractual revenue. |
| TABLE 06: OTHER OPERATING REVENUE |
| Operating Income | 3Q22 | 3Q21 | % | 2022 | 2021 | % | ||||
| Others Revenues | 224 | 199 | 12% | 736 | 550 | 34% | ||||
| Non-recurring events | ||||||||||
| Revenue reversal energy interconnection among Brazil and Uruguay | 0 | 0 | 100% | 0 | 8 | 100% | ||||
| Other recurring income | 224 | 199 | 12% | 736 | 558 | 32% | ||||
MARKETLETTER 3Q2022 | 11 |
Disclaimer: This material contains calculations that may not produce an accurate sum or result due to rounding. |
| | |
Marketletter 3Q22 |
OTHERS REVENUES
VARIATION ANALYSIS 3Q21 X 3Q22
| · | At Eletronorte (+R$15 million): The variation is mainly due to: (i) an increase of R$45.1 million in the following accounts: (a) R$26.9 million in CDE; (b) R$16 million in Proinfa; (c) R$2.2 million in Others. On the other hand, (ii) reduction of R$29.8 million in the following accounts: (a) R$23.8 million in O&M Services (R$28 million reduction in Eletronorte's O&M contract); (b) R$2.7 million in Telecom; (c) R$ 2.1 million in Disposal resulting from reclassification; (d) R$1.2 million in Rental Leases. |
| · | At Chesf (+R$5 million): (i) R$3.7 million increase in revenues from telecommunications services; (ii) increase in miscellaneous income R$ 0.7 million; (iii) R$ 0.7 million increase in revenue from engineering services; and (iv) R$ 0.3 million increase in service fees. |
OPERATING COSTS AND EXPENSES
| Tabela 07: OPERATIONAL COSTS AND EXPENSES |
| Operational costs | 3Q22 | 3Q21 | % | 2022 | 2021 | % |
| Energy purchased for resale | -1,102 | 2,360 | -147% | -2,142 | 1,354 | -258% |
| Charges on use of the electricity grid | -833 | -778 | 7% | -1,982 | -1,665 | 19% |
| Fuel for production electric power | -444 | -533 | -17% | -1,542 | -1,537 | 0% |
| Construction | -422 | -359 | 18% | -935 | -769 | 22% |
| Personnel, Material, Services and Others | -2,235 | -1,746 | 28% | -5,984 | -5,352 | 12% |
| Depreciation and amortization | -812 | -315 | 158% | -1,811 | -922 | 96% |
| Operating Provisions | -1,529 | -9,376 | -84% | -5,794 | -11,374 | -49% |
| Total Operating Costs and Expenses | -7,377 | -10,746 | -31% | -20,189 | -20,266 | 0% |
| Non-recurring events | ||||||
| (-) Non-recurring PMSO events | 209 | 146 | 43% | 345 | 505 | -32% |
| (-) Non-recurring provisions | 964 | 9,101 | -89% | 4,354 | 11,176 | -61% |
| (-) Generation Construction | 0 | 14 | -100% | 7 | 39 | -81% |
| (-) Transfer of coal from the Material heading | 0 | 0 | - | 0 | 13 | -100% |
| Renegotiation of the hydrological risk, arising from resolution No. 2,932/21 | 0 | -4,266 | -100% | 0 | -4,266 | -100% |
| Record of GSF expenses for adhering to the hydrological risk renegotiation | 0 | 378 | -100% | 0 | 378 | -100% |
| Total Recurring Operating Costs and Expenses | -6,204 | -5,373 | 15% | -15,482 | -12,420 | 25% |
VARIATION ANALYSIS 3Q22 X 3Q21
ENERGY PURCHASED FOR RESALE
| · | Positive recording, in 3Q21, of a credit of around R$ 4,266 million, as a reduction in the expense of energy purchased for resale, as a result of the hydrological risk renegotiation that took place in 3Q21, established by Aneel Resolutions 2,932/21 and 2,919/2021, which ratified the term of extension of the hydroelectric plants, and by recording the expense with GSF for the adhesion to the renegotiation of the hydrological risk, in the amount of -R$378 million, totaling a net impact of R$3,888 million. As this event was non-recurring in 3Q21, it significantly increases expenses when compared to 3Q22, where there was no such credit in the cost recovery account. The positive effects, in the cost recovery account, in 3Q21, occurred at Eletronorte (R$ 3.03 billion) and Furnas (R$ 864 million). |
MARKETLETTER 3Q2022 | 12 |
Disclaimer: This material contains calculations that may not produce an accurate sum or result due to rounding. |
| | |
Marketletter 3Q22 |
| · | In Furnas: (i) R$ -236.5 million from SAESA in 3Q22 referring to the impacts of the Company's commercial strategy adopted to mitigate the energy and financial exposure resulting from the hydrological risk (GSF). The amount for 2022 comprises purchases of electricity for resale, with bilateral contracts (R$ - 233 million), and the result of the CCEE settlement (R$ - 3.5 million). (ii) Variation of R$149 million due to: a) Price readjustment of current purchase agreements, representing an increase of approximately R$36 million; partially offset by (b) higher number of purchases made in 3Q21, taking advantage of market opportunities, which had an expense of R$172 million higher when compared to 3Q22; c) reduction of Pis/Cofins in the amount of R$ 13 million. There was no occurrence of negative exposure in the MCP in both analyzed periods. |
Partially compensated by:
| · | At Eletronorte: (i) reduction of exposure to the short-term market (MCP) of R$ 186 million, as a result of the 46% reduction in the GSF (3Q21 0.51 and 3Q22 0.75); (ii) R$54.1 million increase in tax credits (PIS, COFINS and PASEP) and leasing recoverable, which are recorded as rectifiers in the expense accounts; (iii) R$ 46.2 million increase in costs with energy purchase agreements with the Pies for resale to the distributor Amazonas Energia, resulting from the contractual adjustment based on the IGP-M; (iv) start of the term of the energy purchase agreement of the trading company Tempo, totaling R$ 5 million. |
| · | In the holding (-R$262 million): improvement of the country's hydrological conditions, significantly reducing the need to import electricity from the Oriental Republic of Uruguay. |
FUEL FOR ELECTRIC POWER PRODUCTION
| · | In Furnas (-R$101 million): (i) The Santa Cruz TPP was not dispatched in 3Q22, while in the same period of 2021 it had a generation of 322 GWh (in 3Q21, was the 3 months dispatched?), adding the 3 months of generation in 3Q21. |
Partially compensated by:
| · | At Eletronorte (+R$0.5 million): There was an increase in fuel expenses in the period by R$47 million, however, this increase was also offset by the increase in the expense recovery reduction account in the same amount of approximately R$ 47 million. The increase in fuel costs is explained by (i) an increase of R$140.9 million referring to ancillary expenses for natural gas as a result of the effect of the adjustment in the price of natural gas for the period, as well as the increase in the volume of natural gas that was no longer consumed as a result of the -22.83% reduction in the consumption of natural gas at the TPPs. Thus, the natural gas that was no longer consumed for the production of electricity generated an overpayment obligation for Ship or Pay; (ii) increase of R$ 111.8 million referring to tax credits (PIS/COFINS) of HPP Tucuruí in the period, incorrectly classified, with no counterpart in 2022. partially offset by (iii) reduction of R$ 161.4 million referring to expenses with the purchase of Fuel for the production of electricity (Natural Gas), which in 3Q22 were lower than expenses in 3Q21 by -21.42 %, mainly due to the -28.25 % reduction in energy generation at UTEs that consume natural gas imposed by the ONS as a result of the increase in the reservoirs of the Hydroelectric Plants (HPP) of the North Region Submarket, causing the dispatches of the North Subsystem HPPs to be prioritized in comparison with the thermal plants that have inflexibility in their contracts and use fuel in their operation. In 3Q22, the reduction of ICMS in the total cost of natural gas was noticed in compliance with State Decree No. 56,973/2022, causing the price of natural gas to be reduced by an average of -7.0%, but considering the annual adjustment of the contractual price, the price difference between 3Q21 and 3Q22 was 1.34%. The ship or pay expense mentioned above is not affected by the ICMS reduction, as it is not characterized as a circulation of goods but as a contractual financial obligation; and (ii) a R$44.5 million reduction in the ICMS refund on sales of energy produced by UTE Mauá 3, due to the consumption of natural gas. The reversal occurs due to the fact that the sale is outside the state of AM and is exempt from ICMS. In turn, the increase in the recovery of expenses (+R$47 million) was due to: (i) higher revenue from the CCC of 4.46% as a result of the effect of the readjustment of the price of natural gas for the period, which was readjusted on average by 9.21%, as well as the reimbursement of larger volumes of natural gas for ancillary expenses (Ship or Pay of Carriage and Margin) incurred in that period. |
MARKETLETTER 3Q2022 | 13 |
Disclaimer: This material contains calculations that may not produce an accurate sum or result due to rounding. |
| | |
Marketletter 3Q22 |
| · | At CGT Eletrosul (+R$13 million): There was a R$20 million increase in fuel expenses in the period, however, this increase was partially offset by the increase in the expense recovery reduction account in the amount of about BRL 7 million. The increase in fuel costs was due to: (i) price correction in coal supply contracts, varying between 11.9% and 15.9%, depending on the supplier; and (ii) lower use of old coal inventories with lower prices when compared to 3Q21. These effects represented an increase of 36% in the cost of coal, representing R$ 16.7 million of the variation; and (iii) consumption of R$ 1.2 million of diesel and fuel oil used in the plant's restart process, which occurred only in 3Q22. The recovery of expenses – subsidy (+R$7 million) increased, in turn, due to: (i) reimbursement of fuel oil and diesel of R$1.04 million in 3Q22, given that the use of this input is only necessary to power plant restart events; (ii) a 15.9% increase in the price of reimbursable coal from R$112.16 per ton in 3Q21 to R$130.01 in 3Q22; and (iii) due to the stoppage of UTE Candiota in the second half of 2020 - caused by operational problems - all the reimbursed coal was not used that year. Thus, in 2021, the amount of coal reimbursed was lower, offsetting the surplus from 2020. In this way, the amount reimbursed in 2022 is 25% higher than the previous year. |
NETWORK USE CHARGES
| · | Furnas (+R$201 million): (i) R$192 million from the consolidation of SAESA (ii) In 3Q21, the EUST was under the Ratification Res 2,896-aNEEL of 07/13/2021 and, in 3Q22, the EUST was under the validity of the Homologatory Res 3.066-ANEEL of 06/12/2022. The latter readjusted tariffs in order to produce an increase of around 15% in relation to the previous tariff cycle, with emphasis on the readjustment of tariffs for the use of LIGHT's distribution system (+10%). |
| · | Increase in the tariff for the use of the transmission and distribution system by Eletronorte (+R$35 million) and Chesf (+R$35 million). |
CONSTRUCTION
| · | At Chesf (+R$45 million): (i) The construction cost in the periods is directly related to the expenses incurred (appropriated and allocated) in the transmission investment events in progress, associated with the concession contracts. |
| · | At CGT Eletrosul (+R$37 million): (i) increase in the volume of transmission projects being built by the company between the periods, jumping from R$48.7 million in 3Q2021 to R$87.3 million in the same period in 2022 These investments are linked to Aneel's authorizing resolutions and improvements to the existing system. |
Partially compensated by:
MARKETLETTER 3Q2022 | 14 |
Disclaimer: This material contains calculations that may not produce an accurate sum or result due to rounding. |
| | |
Marketletter 3Q22 |
| · | Furnas (-R$24 million): mainly due to investments made in the periods observed: (i) In transmission, investments in the quarters were: (a) in contract 062/01, R$ -53, 2 million in 3Q22 and the amount in 2021 was R$ -61.43 million; and (b) The variation in the other contracts was R$ 228 thousand in 2022 and R$ -1.66 million in 2021; (ii) In generation, the value in 3Q21 was R$ -13.75 million, however with Law 14,182/21, the treatment for quota holder plants was changed and, as of Jun/22, there will be no more accounting of the financial asset generation in construction expense. |
VARIATION ANALYSIS 2022X2021
| · | The sum of the costs of Energy purchased for resale, Charges on use of the electricity grid, Fuel for electricity production and construction, in 9M22, increased by 152%, mainly impacted by: (i) The increase in the cost of energy purchased for resale, due to the registration, in 3Q21, of a credit of approximately R$ 4,266 million, as a reduction in the expense of energy purchased for resale, as a result of the hydrological risk renegotiation in 3Q21 established by Aneel Resolutions 2,932/21 and 2,919/2021 , which ratified the extension term of the hydroelectric plants, and the recording of the GSF expense for joining the hydrological risk renegotiation, in the amount of -R$378 million, totaling a net impact of R$3,888 million, an event that did not occur in 3Q22; (ii) the increase in network usage charges, which grew by 19% in relation to the same period of the previous year, mainly caused by the TUST readjustment; (iii) R$ 192 million increase in expenses due to the consolidation of SAESA as of 3Q22; and (iv) the increase in construction costs, which are directly related to the expenses incurred in the generation and transmission investment events in progress. |
TABLE 08: PERSONNEL, MATERIAL, SERVICES AND OTHER
| Personnel, Material, Services and Others | 3T22 | 3T21 | % | 2022 | 2021 | % |
| Personnel | -1,139 | -935 | 21,9% | -3,292 | -2,971 | 10,8% |
| Material | -73 | -51 | 42% | -177 | -153 | 16% |
| Services | -494 | -395 | 25% | -1,277 | -1,043 | 22% |
| Others | -529 | -365 | 45% | -1,238 | -1,186 | 4% |
| PMSO total | -2,235 | -1,746 | 28% | -5,984 | -5,352 | 12% |
| Non-Recurring Items | ||||||
| Termination costs | 0 | 1 | 0% | 1 | 80 | 1% |
| Indemnity Allowance Health Plan | 0 | 0 | - | 32 | 0 | 0% |
| Labor Claims | 0 | 21 | 0% | 39 | 69 | 57% |
| Payment of Historical Hours Bank 25% | 0 | 44 | 0% | 0 | 1 | 0% |
| Coal transfer from 1Q21 to Fuel account | 0 | 0 | - | 0 | -13 | 0% |
| PIS/COFINS credit - inputs from UTE Candiota III previous periods | 0 | 0 | - | 0 | -3,8 | 0,0% |
| FEE Consent Capitalization | 0 | 0 | - | 16 | 0 | 0% |
| Recovery of expenses (Commissions and Debentures) | 0 | 0 | - | 0 | -8 | 0% |
| Loss with CCC corresponding to the inspection of Boa Vista | 0 | 58 | 0 | 58 | ||
| Indemnities, losses and damages: CAEFE (2022) Furnas | 0 | 0 | - | 46 | 0 | 0% |
| IR not collected from conviction paid in 2015 | 0 | 0 | - | 0 | 42 | 0% |
| IR resulting from AmGT Transfer | 0 | 0 | - | 0 | 40 | 0% |
| Legal costs and fees holding and Furnas | 0 | 3 | 0% | 2 | 48 | 4% |
| Labor Costs | 0 | 0 | - | 0 | 13 | 0% |
| Indemnities - Losses and Damages | 0 | 0 | - | 0 | 38 | 0% |
| Decrease SPE FOTE | 0 | 13 | 0% | 0 | 20 | 0% |
| Generator set rental (emergency assistance to Amapá) | 0 | 6 | 0% | 0 | 57 | 0% |
| Sale of Transmission Assets to Energisa | 0 | 0 | - | 0 | -3 | 0% |
| Reimbursement of Transmission Assets to Energisa | 0 | 0 | - | 0 | 2 | 0% |
| Problem of accounting for previous years | 0 | 0 | - | 0 | -7 | 0% |
| Indemnities, losses and damages - Engevix, CIEN and contractors CONVAP 2022 | 92 | 0 | 0% | 92 | 45 | 204% |
| Transfer of the energy trading activity from Itaipu to ENBPar | 137 | 0 | 0% | 137 | 0 | 0% |
| Reversal of provisions that occurred at the end of the construction of the Passo São João, São Domingos and Barra do Rio Chapéu HPPs | -20 | 0 | 0% | -20 | 0 | 0% |
| Asset Write-off (Energisa Acre) | 0 | 0 | - | 0 | 29 | 0% |
| Adjusted PMSO | -2,026 | -1,600 | 27% | -5,639 | -4,847 | 16% |
SAESA IMPACT
| Personnel, Material, Services and Others | 3Q22 | 2022 |
| Personnel | 25 | 25 |
| Material | 8 | 8 |
| Services | 57 | 57 |
| Others | 0 | 0 |
| PMSO total | 90 | 90 |
VARIATION ANALYSIS 3Q22 X 3Q21
PeRSONNEL
| · | Collective Bargaining Agreement – ACT22/23, which had an adjustment of 12.13% (IPCA), with an estimated impact of R$178 million in the quarter. It is important to note that, at Chesf, the variation in the account reflects the readjustment of collective bargaining agreements - 2-year ACTs, since the 2021/22 ACT 6.76% only took effect from January 2022 (retroactive to May 2021), and this impact, at Chesf, is added to that of ACT22/23. In addition, the 2022 salary progression also stands out, with impacts on salaries, benefits, 13th salary, among others. |
| · | Chesf: (i) In 3Q21, there was a R$ 62 million reversal of profit sharing, which reduced expenses in 3Q21, without comparison in 3Q22; |
| · | Consolidation of R$ 25 million of SAESA, as of 3Q22, which did not occur in 3Q21, in which Saesa was brought in by the equivalence account |
Material
| · | At Eletronorte (+R$ 10 million), highlighting the increase of R$ 7.3 million in the direct acquisition of operational maintenance material. |
MARKETLETTER 3Q2022 | 15 |
Disclaimer: This material contains calculations that may not produce an accurate sum or result due to rounding. |
| | |
Marketletter 3Q22 |
ServiCES
| · | In Furnas: (i) consolidation of expenses of R$57 million from SAESA, as of 3Q22, composed mainly of maintenance and operation services (R$ -39 million) and increase in benefits in the amount of R$7 million. |
| · | At Eletronorte (+R$ 23 million), with emphasis on the maintenance of operating assets, of R$ 15.3 million, at UTE Aparecida and UTE Mauá 3. |
OTHERS
| · | In Furnas (+R$97 million): (i) Indemnities, losses and damages of R$91.6 million, with emphasis on R$90 million from the CONVAP process. |
| · | At Eletronorte (+R$ 27 million): (i) increase of R$ 35.6 million in operating expenses, resulting from adjustments made to the service agreement by Eletronorte; offset by (ii) a R$5.7 million reduction in insurance for facilities, equipment and inventories; (iii) a R$3 million reduction in the rental of generator sets. |
Partially compensated by:
| · | At CGT Eletrosul (-R$25 million): (i) In 3Q22, recoveries of expenses, which are balance-reducing items, were R$10.9 million higher than in 3Q21, accounting for the positive balance of the item; (ii) In 3Q22, the gain from disposal of assets/rights was R$18.7 million higher than in 3Q21, with emphasis on the assignment of the Company's payroll, generating revenue of R$6 million, while in 3Q21 there were losses , due to the recognition of a loss on the acquisition of SPE FOTE; (iii) Insurance expenses were R$2.6 million higher in 3Q22, and (iv) the rest of the variation is explained by sundry expenses that were R$1.2 million higher in 3Q22. |
VARIATION ANALYSIS 2022X2021
| · | Personnel, material, services and other costs and expenses presented, in 9M22, a variation of 12% in relation to the same period of the previous year, mainly reflecting: (i) in the personnel account, the collective bargaining agreement - the ACT22 /23, which had an adjustment of 12.13% (IPCA) and the indemnity allowance of R$32 million; (ii) consolidation of SAESA, as of 3Q22, adding an expense of R$90 million to the consolidated. |
DEPRECIATION AND AMORTIZATION
| Table 09: Depreciation and Amortization |
| Depreciation and amortization | 3Q22 | 3Q21 | % | 2022 | 2021 | % |
| Depreciation and amortization | -812 | -315 | 158% | -1,811 | -922 | 96% |
| Non-recurring items - Adjustments | ||||||
| Depreciation referring to previous periods | ||||||
| Adjusted Depreciation and Amortization | -812 | -315 | 158% | -1.811 | -922 | 96% |
| · | Amortization expense of R$ 277 million of new concession assets resulting from the privatization of Eletrobras: Sobradinho (-7 million); Tucurui (-R$213 million), Curuá-Una (-R$1 million); Itumbiara (-R$25 million); and Mascarenhas de Moraes (-R$21 million). The amortization of the new contracts arising from the plants that will be dequotized will only start in 2023, on a non-linear basis, according to the dequotization. |
MARKETLETTER 3Q2022 | 16 |
Disclaimer: This material contains calculations that may not produce an accurate sum or result due to rounding. |
| | |
Marketletter 3Q22 |
| New Generation Assets | 3rd Quarter of 2022 - In R$ thousand | |||
| Chesf | Eletronorte | Furnas | Totais | |
| Amortization expenses - Law 14,182/2021 | - 7,288 | - 214,189 | - 45,284 | - 266,761 |
| · | Consolidation of SAESA, as of 3Q22, increased amortization expense by R$203 million.. |
OPERATING PROVISIONS
Table 10: OPERATING PROVISIONS
| Operating Provisions | 3Q22 | 3Q21 | % | 2022 | 2021 | % |
| Operational provisions / reversals | -1,529 | -9,376 | -84% | -5,794 | -11,374 | -49% |
| Non-recurring provisions/reversals | ||||||
| Provision for Disputes | -874 | -9,481 | -91% | -2,237 | -11,511 | -81% |
| Allowance for PCLD Prospective credit loss estimate (CPC 48)/ losses from clients- Chesf | 0 | 0 | - | -1,307 | 118 | -1211% |
| Onerous contracts | -47 | -23 | 103% | 244 | -23 | -1151% |
| Estimated losses on investments | 80 | -103 | -177% | -826 | -111 | 641% |
| RAP adjustment portion | 0 | 0 | - | 0 | 0 | - |
| Estimated loss due to impairment of assets (Impairment) | -92 | 555 | -117% | -158 | 454 | -135% |
| Provision for Implementation of Shares - Compulsory Loan | -30 | -47 | -35% | -71 | -93 | -23% |
| TPP Candiota III – Coal | 0 | -2 | -100% | 0 | -9 | -100% |
| Recurring Provisions/Reversals | ||||||
| Guarantees | 4 | 5 | -17% | -26 | 24 | -205% |
| PCLD (excluding PCLD Prospective Estimate of Prospective Credit Loss (CPC 48) and losses of clients-Chesf | -533 | -244 | 119% | -1,181 | -208 | 466% |
| GAG Improvement | 8 | 1 | 413% | -127 | -51 | 152% |
| Others | -43 | -37 | 16% | -105 | 37 | -385% |
| Recurring provisions / reversals | -564 | -275 | 106% | -1,439 | -198 | 628% |
The positive values in the table above mean reversal of provision.
VARIATION ANALYSIS 3Q21 X 3Q22
The variation is mainly explained by:
| · | Provision for Litigation of R$ 1,529 million in 3Q22: (i) At Chesf, record a provision of R$ 587.5 million referring to the lawsuit filed by Energia Potiguar, for payment of indemnification due to the losses caused by the alleged delay in delivery the 230 kV transmission line Extremoz II – João Câmara II, part of the Concession Agreement No. 019/2010; (ii) In the Holding, provision for litigation of R$108 million of compulsory loan arising from punctual adjustments in lawsuits for unfavorable decisions; and (iii) At Eletronorte, an increase of R$87 million in monetary restatement and review of the amount in accordance with the Cetenco process; and an increase of R$ 34.9 million related to the risk assumption of SPE Amapari's lawsuits; |
MARKETLETTER 3Q2022 | 17 |
Disclaimer: This material contains calculations that may not produce an accurate sum or result due to rounding. |
| | |
Marketletter 3Q22 |
| · | • At Eletronorte, provision for allowance for loan losses, in the total amount of R$ 478.5 million, with emphasis on: a) Provision of R$ 397.5 million referring to bills overdue in 1Q22 for current energy supply to Amazonas Energia, and who completed 180 days; b) Provision of R$ 88.6 million referring to the adjustment of debts already renegotiated by Amazonas Energia (ICDs), but not paid. |
REGULATORY REVIEWS - TRANSMISSION CONTRACTS
| 3Q22 | 3Q21 | % | 2022 | 2021 | % | |
| Regulatory Remeasurements - Transmission Agreements | 362 | 4,859 | -93% | 362 | 4,859 | -93% |
| · | In the third quarter of 2021, the recording in this item resulted from the remeasurement of the RBSE asset, originated by the reprofiling of the financial component and the complementary recognition of the cost of equity (KE). (ii) In the third quarter of 2022, the impact resulted from the Periodic Tariff Review - RTP ANEEL for the RAPs of concession contracts 014/2011 and 016/2011. |
SHAREHOLDINGS
| Table 12: Shareholdings | |||||
| Shareholdings | 3Q22 | 3Q21 | % | 2022 | 2021 | % |
| Shareholdings | 555 | 850 | -35% | 1,668 | 1,451 | 15% |
VARIATION ANALYSIS 3Q22 X 3Q21
SHAREHOLDINGS
| · | Among the main variations in the equity interest account are: (i) Norte Energia, with an equity result in 3Q22 R$160 million lower than in 3Q21, mainly due to the registration of the concession extension in September 2021 according to the approval resolution of the ANEEL No. 2932/2021 in the amount of R$307 million; (ii) CTEEP (-R$89 million), due to lower remuneration of concession assets. |
FINANCIAL RESULT
FINANCIAL RESULT:
Table 13: FINANCIAL INCOME AND EXPENSES
| Financial Result | 3Q22 | 3Q21 | % | 2022 | 2021 | % |
| Financial Income | ||||||
| Interest, commission and fee income | 178 | 234 | -24% | 710 | 723 | -2% |
| Income from financial investments | 688 | 204 | 237% | 1,574 | 379 | 315% |
| Moratorium addition on electricity | 161 | 74 | 119% | 397 | 206 | 93% |
| Interest income on dividends | 68 | 26 | 158% | 68 | 209 | -68% |
| Other financial income | 203 | 118 | 72% | 323 | 282 | 15% |
| (-) Taxes on financial income | -59 | -73 | -18% | -271 | -231 | 17% |
| Financial expenses | ||||||
| Debt charges(1) | -2,016 | -972 | 107% | -3,817 | -2,334 | 64% |
| Other financial expenses | -295 | -171 | 73% | -749 | -472 | 59% |
| Financial items net | ||||||
| Monetary Variations | -267 | 40 | -773% | -585 | 105 | -659% |
| Exchange Variations | -192 | -610 | -68% | 232 | -261 | -189% |
| Derivatives | -287 | 247 | -216% | -576 | 685 | -184% |
| Financial Result | -1,819 | -882 | 106% | -2,696 | -710 | 280% |
| Adjustments | ||||||
| (-) Revenue from loans owed by privatized distributors | -235 | -82 | 185% | -594 | -236 | 152% |
| (-) Bonus Award + FIDC Commission | 0 | 0 | - | 0 | 91 | -100% |
| (-)Regularization of credits tax process / Fine and Notices of Infraction | 0 | 0 | - | 0 | 81 | -100% |
| (-) RPCs Chesf | 0 | 0 | - | 0 | 118 | -100% |
| (-) Monet update. company compulsory | 495 | 194 | 155% | 1,334 | 413 | 223% |
| (-) Monetary restatement of the addition of 14 months of economic and energy inefficiency | 0 | -151 | 0 | -151 | ||
(-) Chesf: update of lawsuits due to from Benner's go live | 0 | -231 | -100% | 0 | -231 | -100% |
| (-) Financial expense corresponding to the exchange of the fee Selic by IPCA according to CNPE Resolution No. 15/2021 | 0 | 432 | -100% | 0 | 432 | -100% |
| (-)Interest and exchange variation on ITAIPU Sale Transaction to ENBPar | 0 | 0 | - | -242 | 0 | - |
| (-)Reversal of Penalties for Unavailability - CCEAR - CGT Eletrosul | 0 | 0 | - | -34 | 0 | - |
| (-) Tax installment payment indemnification of reversible assets UHE Tucuruí and UHE Curua-Uma | 101 | 0 | - | 101 | 0 | - |
| Adjusted Financial Result | -1,458 | -721 | 102% | -2,130 | -193 | 1002% |
VARIATION ANALYSIS 3Q22 X 3Q21
In 3Q22, the financial result presented a negative variation, having presented a negative result of R$882 million in 3Q21 and a negative result of R$1,819 million in 3Q22. The main variations were:
| · | Furnas (i) increase in the debt charge due to the consolidation of the amount of R$ 341 million of SAESA in 3Q22, comprising the adjustment of the IPCA Debt (R$ 259 million) and updates of the IPCA debentures (R$ 83 million) and funding of 3 new loan agreements in 2Q22 (impact of approximately R$95 million increase on 3Q22 results compared to 3Q21). |
| · | Charges (IPCA + WACC/rate) of obligations with the CDE (WACC of 7.31%) and projects for the revitalization of hydrographic basins and Legal Amazon (rate of 5.67%), of R$ 490 million, arising from the new generation concession contracts signed in the privatization process. |
| Charges with the CDE and Projects - Law 14.182/2021 | 3rd Quarter of 2022 - In BRL thousand | |||
| Chesf | Eletronorte | Furnas | TotaL | |
| Debt charges - Obligations with the CDE | - 233,188 | - 166,315 | -161,458 | -560,961 |
| Debt charges - Revitalization of watersheds | -37,257 | -31,402 | -24,483 | -93,142 |
| Passive monetary restatement - Obligations with the CDE | 45,831 | 32,254 | 40,821 | 118,906 |
| Passive monetary restatement - Revitalization of hydrographic basins | 18,022 | 15,190 | 11,843 | 45,055 |
| Total charges with CDE and Projects - Law 14,182/2021 | -206,592 | -150,273 | -133,277 | -490,142 |
MARKETLETTER 3Q2022 | 18 |
Disclaimer: This material contains calculations that may not produce an accurate sum or result due to rounding. |
| | |
Marketletter 3Q22 |
| · | Negative net monetary variation of R$267 million in 3Q22, compared to a positive net monetary variation of R$40 million in 3Q21, impacted by the registration of monetary restatement of R$478 million in compulsory loan lawsuits, especially due to the variation in the Selic rate applied on the portion of principal and interest, in 3Q22, against a monetary variation of the lawsuits of R$162 million in 3Q21; |
• At Eletronorte, negative net result associated with derivatives in the amount of -R$ 287 million, in 3Q22, against a positive net result of R$ 247 million in 3Q21, representing a reduction of R$ 533 million, with derivatives, due to the variation of the LME - London Metal Exchange in the period. The contract with Albras provides for an energy sale price plus the payment of a premium, which varies according to the aluminum price on the LME, quoted in US dollars. In 2022, the LME reached the maximum price stipulated in the contract and, due to the negative variation of the dollar, losses with derivatives were recorded.
Partially offset by:
| · | The net exchange variation, which went from a negative net variation of R$610 million in 3Q21 to a negative net exchange variation of R$193 million in 3Q22, mainly due to the exposure of dollar-denominated debt and dollar variation in the respective periods. |
2022 X 2021 VARIATION ANALYSIS
| · | Financial Result presented, in 9M22, a negative variation of 281% in relation to the same period of the previous year, mainly reflecting: (i) Gains and losses with Derivatives (-R$1,261 million), with emphasis on the subsidiary Eletronorte, in reason for the pricing of the asset as provided for in the energy sales contract entered into with Albras, which is mainly linked to the LME (Aluminium) and US dollar quotations; partially offset by (ii) Worsening result from net monetary restatements (-R$689 million), impacted by the increase in passive monetary restatements related to the compulsory loan, which went from R$219 million in 9M21 to R$1,334 million in 9M22, due to mainly from the Selic variation and the increase in the accumulated provision stock, due to the change in parameters in the provisioning criteria as of 3Q21; (iii) expenses with CDE financial charges and revitalization projects - Law 14,182/2021, of R$490 million; (iv) expense of R$300 million due to the consolidation of SAESA. |
3Q22X3Q21 VARIATION ANALYSIS
OTHER INCOME AND EXPENSES
| Other Income and Expenses | 3Q22 | 3Q21 | % | 2022 | 2021 | % |
| Reimbursement of Fixed Assets in Progress - AIC | 0 | 0 | - | 121 | 0 | - |
| Gain from the Sale of CEEE-T1 Shares | 0 | 0 | - | 454 | 0 | - |
| Effects of Law 14.182/20212 | 0 | 0 | - | -355 | 0 | - |
| Other Income and Expenses | 32 | 772 | - | 55 | 772 | - |
| TOTAL OTHER INCOME AND EXPENSES | 32 | 772 | -96% | 274 | 772 | -64% |
¹ Eletrobras sold its entire equity interest in CEEE-T to CPFL de Energia Cone Sul Ltda, in April 2022, see note 2.3.
² The residual values of the new concessions were written off against the result for the period due to the irrecoverability determined by the CNPE, for further details see note 1.1.5.
MARKETLETTER 3Q2022 | 19 |
Disclaimer: This material contains calculations that may not produce an accurate sum or result due to rounding. |
| | |
Marketletter 3Q22 |
INCOME TAX
| Income tax | 3Q22 | 3Q21 | % | 2022 | 2021 | % |
| Current income tax and social contribution | -383 | 6 | -6720% | -1,729 | -1,412 | 22% |
| Deferred income tax and social contribution | 595 | -3,078 | -119% | 375 | -3,669 | -110% |
| Total income tax and social contribution | 213 | -3,072 | -107% | -1,355 | -5,081 | -73% |
| Adjustment | ||||||
| (-) Eletrosul Adjustments/Chesf PCLD/IR Estimate Furnas SAESA | 0 | 2,487 | -298 | 2,625 | -111% | |
| Adjusted income tax and social contribution | 213 | -585 | -136% | -1,653 | -2,456 | -33% |
DISCONTINUED OPERATIONS
| 3Q22 | 3Q21 | % | 2022 | 2021 | % | |
| Discontinued Operations | 0 | -26 | -100% | 987 | -46 | -2248% |
As provided in Law No. 14,182/2021, Eletrobras' capitalization was conditioned to the corporate restructuring to keep Eletronuclear and Itaipu Binacional under the direct or indirect control of the Federal Government, through the transfer of control to ENBpar. The effect on results as well as the comparison were disclosed in 2Q22 in accordance with accounting pronouncement CPC 31/IFRS 5, to present the transactions of the aforementioned segments separately from continuing operations. Thus, after the capitalization, Eletrobras' shareholding in Eletronuclear's total capital went from 99.95% to 67.95%, Eletrobras no longer has the majority of common shares and no longer has it´s control. In this sense, since 2Q22 Eletronuclear is no longer a subsidiary and became and affiliated company.
MARKETLETTER 3Q2022 | 20 |
Disclaimer: This material contains calculations that may not produce an accurate sum or result due to rounding. |
| | |
Marketletter 3Q22 |
1.2 EBITDA Consolidado
Tabela 14: EBITDA DETAIL
| EBITDA | 2022 | 2021 | % | 3Q22 | 3Q21 | % |
| Result of the period | 4,117 | 5,104 | -19% | -0.09 | 965 | -100% |
| + Income Tax and Social Contribution Provision | 1,355 | 5,081 | -73% | -213 | 3,072 | -107% |
| + Financial Result | 2,696 | 710 | 280% | 1,819 | 882 | 106% |
| + Depreciation and Amortization | 1,811 | 922 | 96% | 812 | 315 | 158% |
| = EBITDA | 9,978 | 11,817 | -16% | 2,419 | 5,234 | -54% |
| ADJUSTMENTS | ||||||
| Result of discontinued operation | -987 | 46 | -2247,8% | 0 | 26 | -100,0% |
| Other revenues and expenses | -274 | -772 | -64% | -32 | -772 | -96% |
| Regulatory remeasurement – transmission contracts | -362 | -4,859 | -93% | -362 | -4,859 | -93% |
| Renegotiation of the hydrological risk -resolution No. 2,932/21 | 0 | -4,266 | -100% | 0 | -4,266 | -100% |
| Record of GSF expenses for adhering to the hydrological risk renegotiation | 0 | 378 | -100% | 0 | 378 | -100% |
| Revenue reversal energy interconnection between Brazil and Uruguay | 0 | 8 | -100% | 0 | 0 | - |
| Reversal of Penalties for Unavailability - CCEAR | -65 | 0 | - | 0 | 0 | - |
| Reversal of deductions for penalties | 8 | 0 | - | 0 | 0 | - |
| Transfer of coal from the Material heading | 0 | 13 | -100% | 0 | 0 | - |
| Termination costs | 1 | 80 | -99% | 0 | 1 | -100% |
| Indemnity Allowance Health Plan | 32 | 0 | - | 0 | 0 | - |
| Reversal of provisions that occurred at the end of the construction of the Passo São João, São Domingos and Barra do Rio Chapéu HPPs | -20 | 0 | - | -20 | 0 | - |
| Labor Claims | 39 | 69 | -43% | 0 | 21 | -100% |
| Payment of Historical Hours Bank 25% | 0 | 1 | -100% | 0 | 44 | -100% |
| Transfer of coal to Fuel account | 0 | -13 | -100% | 0 | 0 | - |
| PIS/COFINS credit - retroactive UTE Candiota III inputs | 0 | -4 | -100% | 0 | 0 | - |
| FEE Consent Capitalization | 16 | 0 | - | 0 | 0 | - |
| Recovery of expenses (Commissions Debentures transferred to Liabilities) | 0 | -8 | -100% | 0 | 0 | - |
| Loss with CCC corresponding to the inspection of Boa Vista | 0 | 58 | -100% | 0 | 58 | -100% |
| Indemnities, losses and damages: CAEFE (2022) Furnas | 46 | 0 | - | 0 | 0 | - |
| IR not collected from conviction paid in 2015 | 0 | 42 | -100% | 0 | 0 | - |
| IR resulting from Action - AmGT Transfer | 0 | 40 | -100% | 0 | 0 | - |
| Legal costs and fees holding and Furnas | 2 | 48 | -96% | 0 | 3 | -100% |
| Labor Costs | 0 | 13 | -100% | 0 | 0 | - |
| Indemnities - Losses and Damages | 0 | 38 | -100% | 0 | 0 | - |
| Transfer of the energy trading activity from Itaipu to ENBPar | 137 | 0 | - | 137 | 0 | - |
| Decrease SPE FOTE | 0 | 20 | -100% | 0 | 13 | -100% |
| Generator set rental (emergency assistance to Amapá) | 0 | 57 | -100% | 0 | 6 | -100% |
| Write-off of Assets (Energisa Acre) | 0 | -3 | -100% | 0 | 0 | - |
| Reimbursement of Transmission Assets to Energisa | 0 | 2 | -100% | 0 | 0 | - |
| Problem of accounting for previous years | 0 | -7 | -100% | 0 | 0 | - |
| Indemnities, losses and damages - Engevix, CIEN and contractors CONVAP 2022 | 92 | 45 | 104% | 92 | 0 | - |
| Asset Write-off (Energisa Acre) | 0 | 29 | -100% | 0 | 0 | - |
| SAESA shareholding | 0 | 0 | 0 | 0 | ||
| Provision for Disputes (a) | 1,587 | 10,476 | -85% | 766 | 422 | 82% |
| Compulsory Loan | 650 | 1,035 | -37% | 108 | 9,059 | -99% |
| Allowance for Credit Loss Estimate (CPC 48)/Reversal Allowance for Allowance for CIEN/write-ff clients - Chesf | 1,307 | -118 | -1211% | 0 | 0 | - |
| Onerous contracts | -244 | 23 | -1151% | 47 | 23 | 103% |
| Estimated losses on investments | 826 | 111 | 641% | -80 | 103 | -177% |
| RAP adjustment portion | 0 | 0 | - | 0 | 0 | - |
| Estimated loss due to impairment of assets (Impairment) | 158 | -454 | -135% | 92 | -555 | -117% |
| Provision for Implementation of Shares - Compulsory Loan | 71 | 93 | -23% | 30 | 47 | -35% |
| Candiota III Plant - Coal | 0 | 9 | -100% | 0 | 2 | -100% |
| = EBITDA Adjusted | 12,997 | 14,047 | -7% | 3,197 | 4,988 | -36% |
Note: As of 2019, the Company started to consider, in its adjusted EBITDA, the RBSE revenue from the extended concessions in light of Law 12,783/2013, in order to maintain a protocol similar to the debenture covenants issued in 2019. In addition, considering the privatization of the distributors was concluded in April 2019, and these operations are no longer part of its core business, the company treated as unadjusted the material effects of financial income, expenses, equity reversals and prospective allowance for loan losses (CPC 48) of loans contracted with them before or as a result of the privatization process, although revenues and eventual provisions deriving from contracted loans may continue to affect the company's accounting results until their complete depletion. However, they were treated as adjusted allowances for outstanding outstanding debt of distributors, as well as debts related to energy supply, with the exception, therefore, of provisions for prospective allowances (CPC 48) for energy supply.
MARKETLETTER 3Q2022 | 21 |
Disclaimer: This material contains calculations that may not produce an accurate sum or result due to rounding. |
| | |
Marketletter 3Q22 |
Recurring Cash Generation with Adjustment of Regulatory Transmission RAP
| 3Q22 | 3Q21 | |
| 1. EBITDA Recurrent | 3,197 | 4,988 |
| Revenue from Transmission | 2,924 | 4,864 |
| O&M Revenue - renewed | 1,361 | 1,492 |
| Unrenewed O&M Revenue | 294 | 97 |
| Construction Revenue | 626 | 742 |
| Contractual Revenue Transmission | 643 | 2,533 |
| 3. (+) Total Payment of Allowed Annual Revenue | 3,953 | 3,526 |
| Revenue of RAP and indemnities | 3,953 | 3,526 |
| 4 = 1 - 2 + 3 : Approximate Cash Generation | 4,227 | 3,650 |
* Disclosure of 3Q21 disregarding Eletronuclear's impacts
MARKETLETTER 3Q2022 | 22 |
Disclaimer: This material contains calculations that may not produce an accurate sum or result due to rounding. |
| | |
Marketletter 3Q22 |
1.3 Consolidated Results by Continued Operations segment:
| Table 15: FINANCIAL STATEMENT BY SEGMENT – R$ THOUSAND |
| 2022 | |||||
Finacial Statement by Segment | Administration | Generation | Transmission | Eliminations | Total |
| Net Operating Revenue | 139,499 | 15,243,420 | 10,090,637 | (408,601) | 25,064,955 |
| Operating Costs | (16,605) | (8,816,794) | (2,454,368) | 387,000 | (10,900,767) |
| Operating Expenses | (2,359,435) | (3,814,861) | (3,135,502) | 21,601 | (9,288,197) |
| Regulatory Remeasurements - Transmission Contracts | - | - | 362,392 | - | 362,392 |
| Operating Income Before Financial Result | (2,236,541) | 2,611,765 | 4,863,159 | - | 5,238,383 |
| Financial Result | (2,695,516) | ||||
| Result of Equity Interests | 1,667,870 | ||||
| Other income and expenses | 274,366 | ||||
| Income tax and social contribution | (1,354,883) | ||||
| Net Income from Continuing Operations | 3,130,220 | ||||
| Net Income from Discontinued Operations | 986,785 | ||||
| Net Income | 4,117,005 | ||||
| 2021 | |||||
Finacial Statement by Segment | Administration | Generation | Transmission | Eliminations | Total |
| Net Operating Revenue | 472,619 | 15,031,011 | 8,978,539 | (357,217) | 24,124,952 |
| Operating Costs | (427,859) | (3,525,743) | (2,058,172) | 345,452 | (5,666,322) |
| Operating Expenses | (11,633,193) | (1,673,520) | (1,304,378) | 11,765 | (14,599,326) |
| Regulatory Remeasurements - Transmission Contracts | - | - | 4,858,744 | - | 4,858,744 |
| Operating Income Before Financial Result | (11,588,433) | 9,831,748 | 10,474,733 | - | 8,718,048 |
| Financial Result | (709,694) | ||||
| Result of Equity Interests | 1,450,562 | ||||
| Other income and expenses | 771,758 | ||||
| Income tax and social contribution | (5,081,107) | ||||
| Net Income from Continuing Operations | 5,149,567 | ||||
| Net Income from Discontinued Operations | (45,943) | ||||
| Net Income | 5,103,624 | ||||
MARKETLETTER 3Q2022 | 23 |
Disclaimer: This material contains calculations that may not produce an accurate sum or result due to rounding. |
| | |
Marketletter 3Q22 |
1.3.1. INDEBTEDNESS AND RECEIVABLES
| Table 16: GROSS DEBT AND NET DEBT |
| 09/30/2022 | |
| Gross Debt - R$ million | 54,501 |
| (-) (Cash and cash equivalents + marketable securities) | 16,756 |
| (-) Financing Receivable | 3,950 |
| (-) Net balance of Itaipu Financial Assets1 | 273 |
| Net debt | 33,522 |
| 1See Explanatory Note 18b to the Financial Statements. Highlight: In 3ITR22, Eletrobras' debt was substantially affected by the consolidation of SAESA's gross debt of approximately R$19.8 billion, in which Furnas now holds a 72% interest. |
 | Total Consolidated Gross Debt without RGR with Debentures – R$ billion |
| Gross Parent Debt without RGR – R$ billion |
| 2022 | 2023 | 2024 | 2025 | 2026 | 2027 | After 2027 | Total (R$ bilion) | |
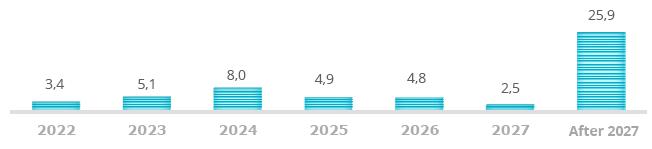
| Annual Amortization with Debentures (without RGR) | 2.1 | 2.1 | 4.2 | 3.1 | 2.5 | 0.3 | 6.3 | 20.7 |
| |
Table 17: Exchange Exposure |
| Asset | US$ mil | % |
| Itaipu Loans Receivables | 41,187 | 45% |
| Itaipu Financial Asset | 50,499 | 55% |
| TOTAL | 91,687 | 100% |
| Liabilities * | US$ mil | % |
| Bônus 2030 - Eletrobras | 742,209 | 52% |
| Bônus 2025 - Eletrobras | 499,828 | 35% |
| Others | 196,129 | 14% |
| TOTAL | 1,438,166 | 100% |
MARKETLETTER 3Q2022 | 24 |
Disclaimer: This material contains calculations that may not produce an accurate sum or result due to rounding. |
| | |
Marketletter 3Q22 |
| 2022 | 2023 | 2024 | 2025 | 2026 | 2027 | After 2027 | TOTAL | |
| Asset (US$ million) | 48.75 | 40.58 | 2.36 | 0.00 | 0.00 | 0.00 | 0.00 | 91,69 |
| Liabilities (US$ million) | 15.15 | 45.57 | 19.01 | 517.22 | 19.01 | 19.01 | 803.20 | 1,438,17 |
| Foreign Exchange Exposure | 33.60 | -4.99 | -16.65 | -517.22 | -19.01 | -19.01 | -803.20 | -1,346,48 |
Due to the atypical scenario and potentially unpredictable characteristics, it is not possible to accurately predict the scenarios that may materialize in the coming months in the company's operations.
*In the balance of the 2030 and 2025 Bonds, there is an accounting effect on the deferral of expenses with the repurchase of the 2021 bond due to the operation carried out in February.
Ratings
| Table 18: Ratings |
| Agency | National Classification / Perspective | Last Report |
| Moody’s Escala Global | “Ba2”: / Stable | 07/15/2022 |
| Moody’s SACP | “Ba2”: / Stable | 07/15/2022 |
| Fitch - Issuer Default Ratings (Foreign Currency) | “BB-”: / Stable | 06/15/2022 |
| Fitch - Issuer Default Ratings (Local Currency) | AA(bra) / Stable | 06/15/2022 |
| Fitch - SACP | “bb-” | 06/15/2022 |
| S&P (Foreign Currency) | BB-/ Stable | 06/15/2022 |
| S&P SACP | bb- | 06/15/2022 |
| S&P Escala Nacional (Local Currency) | brAAA/brA-1+ Stable | 06/15/2022 |
*CreditWatch
FINANCING AND LOANS GRANTED (RECEIVABLES)
| Total Consolidated Loans and Financing Receivables – R$ billion |

Does not include: receivable from Itaipu's financial assets of R$ 273 million and allowance for loan losses of R$ 1,818 million and current charges.
MARKETLETTER 3Q2022 | 25 |
Disclaimer: This material contains calculations that may not produce an accurate sum or result due to rounding. |
| | |
Marketletter 3Q22 |
| Company and Financing receivable Parent company - R$ billion |
| Receivables Projection | 2022 | 2023 | 2024 | 2025 | 2026 | 2027 | after 2027 | TOTAL |
| Parent Company | 0.5 | 1.8 | 1.4 | 0.9 | 0.7 | 0.5 | 3.0 | 8.7 |
Does not include charges and PCLD.
In the process of privatization of distributors, CCC credits were assigned, which depended on Aneel's analysis and inspection. These credits are recorded in the Company's Financial Statements, in two accounts, namely Right of Reimbursement and Financing receivable, as per Notes 9 and 14 of 3Q22.
RBSE REPROFILING
|
| · | Considering the extension of the transmission line concession contracts, in 2012, of its subsidiaries (CHESF, CGT Eletrosul, Eletronorte and Furnas), it was granted the right to receive the amounts due for the RBSE assets recognized by the legislation (Law No. 12,783/ 2013), which was regulated by REN 762/2017-ANEEL, based on Ordinance 120/2016 MME. In the 21/22 cycle, the RBSE values were reprofiled, according to the values shown below. In June 2022, ANEEL issued Technical Note No. 85/2022-SGT, which analyzed the reconsideration requests filed in connection with the payment of the financial component and reprofiling of the RBSE. In a monocratic decision, the reporting director of the process partially accepted the requests. This decision is suspended due to injunctions filed by transmission companies, including the Eletrobras companies. The content of the monocratic decision of the reporting officer, which provisionally suspended the effectiveness of REH No. 2258/2017, is the subject of a judgment by the ANEEL Board not yet concluded. The Company is following the issue |
| Table 21: RBSE reprofiling R$ million |
| Financial Component reprofiled with sectoral charges | ||||||
| 22-23 | 23-24 | 24-25 | 25-26 | 26-27 | 27-28 | |
| Chesf | 988 | 1,839 | 1,839 | 1,839 | 1,839 | 1,839 |
| Eletronorte | 439 | 858 | 858 | 858 | 858 | 858 |
| CGT Eletrosul | 238 | 398 | 398 | 398 | 398 | 398 |
| Furnas | 1,332 | 2,927 | 2,927 | 2,927 | 2,927 | 2,927 |
| Total | 2,997 | 6,022 | 6,022 | 6,022 | 6,022 | 6,022 |
| Economic Component reprofiled with sectoral charges | ||||||
| 22-23 | 23-24 | 24-25 | 25-26 | 26-27 | 27-28 | |
| Chesf | 1,217 | 730 | 730 | 730 | 730 | 730 |
| Eletronorte | 628 | 270 | 270 | 270 | 270 | 270 |
| CGT Eletrosul | 207 | 77 | 77 | 77 | 77 | 77 |
| Furnas | 1,982 | 1,262 | 1,262 | 1,262 | 1,262 | 1,262 |
| Total | 4,035 | 2,339 | 2,339 | 2,339 | 2,339 | 2,339 |
| TOTAL | 22-23 | 23-24 | 24-25 | 25-26 | 26-27 | 27-28 |
| Chesf | 2,206 | 2,569 | 2,569 | 2,569 | 2,569 | 2,569 |
| Eletronorte | 1,067 | 1,128 | 1,128 | 1,128 | 1,128 | 1,128 |
| CGT Eletrosul | 445 | 475 | 475 | 475 | 475 | 475 |
| Furnas | 3,314 | 4,188 | 4,188 | 4,188 | 4,188 | 4,188 |
| Total | 7,032 | 8,361 | 8,361 | 8,361 | 8,361 | 8,361 |
MARKETLETTER 3Q2022 | 26 |
Disclaimer: This material contains calculations that may not produce an accurate sum or result due to rounding. |
| | |
Marketletter 3Q22 |
The above amounts include TFSEE (Electric Energy Services Inspection Fee) charges and resources for R&D and Energy Efficiency, and do not include PIS and Cofins. Furthermore, the data refer to the tariff cycle (July to July of each year) and not to the calendar year (January to December). The values approved in the reprofiling were updated by the IPCA.
Amortizations RBSE 2022- R$ million
| Chesf | CGT Eletrosul | Eletronorte | Furnas | Total |
| 1,416 | 285 | 687 | 2,124 | 4,512 |
Note: TFSEE and R&D values are included. PIS and COFINS are not included.
MARKETLETTER 3Q2022 | 27 |
Disclaimer: This material contains calculations that may not produce an accurate sum or result due to rounding. |
| | |
Marketletter 3Q22 |
1.4. Investment
| Table 22: INVESTMENTS BY SEGMENT - R$ million |
| Investment (Corporate + Partnerships) | Realized 3Q22 | Realized 9M 2022 | Budgeted PDNG 9M 2022 | % 9M 2022 |
| Generation - corporate | 311 | 540 | 967 | 56% |
| Implementation / Expansion | 75 | 157 | 519 | 30% |
| Maintenance | 236 | 383 | 448 | 86% |
| Transmission Corporate | 534 | 1,152 | 1,327 | 87% |
| Ampliation | 79 | 158 | 147 | 108% |
| Improvements and Reinforcements | 220 | 418 | 648 | 64% |
| Maintenance | 235 | 576 | 533 | 108% |
| Infraestructura and others* | 102 | 223 | 307 | 73% |
| SPES | 44 | 1,661 | 540 | 308% |
| Generation - Contributions | 31 | 1,648 | 459 | 359% |
| Transmission - Contributions | 13 | 13 | 69 | 18% |
| SPES Others (Furnas) | - | - | 11 | 0% |
| Total | 991 | 3,575 | 3,140 | 114% |
| Eletronuclear | - | 465 | 243 | 192% |
| Total c/ Nuclear | 991 | 4,040 | 3,383 | 119% |
Others: Research, Infrastructure, Environmental Quality
* For further details on investments, by subsidiary or by project, see attachment 3 to this Investor Information, to be released shortly.
IN 2022, R$ 4,040 MILLION WAS INVESTED, OF WHICH R$ 991 MILLION OCCURRED IN 3Q22.
In Generation, investment totaled R$311 million in 3Q22. In implementation, investments of R$ 44 million in CGT Eletrosul in Coxilha Negra and R$ 18 million in Furnas at UTE Santa Cruz related to the implementation of the combined cycle and technical adaptations stand out. In terms of maintenance, BRL 155 million was paid at Chesf related to the replacement of machinery at the Paulo Afonso IV and Sobradinho plants and anticipation of supplies, exceeding the BRL 67 million planned. At Eletronorte, there was an investment of R$ 73 million related to the recovery of delayed contracts in Aparecida and Mauá, exceeding the R$ 27 million planned.
MARKETLETTER 3Q2022 | 28 |
Disclaimer: This material contains calculations that may not produce an accurate sum or result due to rounding. |
| | |
Marketletter 3Q22 |
In transmission, the total investment was R$ 534 million, with emphasis on R$ 220 million in reinforcements and improvements, of which R$ 166 million in Furnas and Chesf related to various reinforcements in SE Campos and SE Cachoeira Dourada in Furnas, and video surveillance works and implementation of tele-assistance at Chesf substations. At CGT and Eletornorte, there was a total of R$ 54 million related to works in the Salto de Santiago SE at CGT Eletrosul and Coxipó and Tucuruí at Eletronorte. In maintenance, a total investment of R$ 235 million stands out, of which R$ 211 million in CGT Eletrosul, Eletronorte and Chesf are related, respectively, to the maintenance of damaged towers, various works and anticipation of improvements. CGT Eletrosul invested R$ 57 million in expansion, with emphasis on works at the Caxias substation, Siderópolis substation and rehabilitating lines. At Chesf, there was an investment of R$ 19 million in the LT Paraiso/Açu II - this expansion was scheduled for 2021, however, due to problems with the contracted company, it was carried out in 2022.
In SPES, R$44 million were invested in 3Q22, of which R$31 million in the Holding, related to the contribution for reimbursement for energy not generated in Chapada do Piauí of the Holding and R$13 million in Eletronorte related to the termination of public civil action in the SPE TNE .
INVESTMENT FRUSTRATIONS
In corporate generation, although investments were exceeded for the reasons explained above, there was a total frustration of BRL 94 million, of which BRL 45 million at Eletronorte for not participating in the UTE Rio Negro auction and BRL 49 million at Chesf in Friar Damião (wind power).
In transmission, there was a total frustration of BRL 99 million, with emphasis on BRL 79 million at Chesf related to delays in supply with contractual terminations in reinforcements and improvements and frustration of BRL 34 million at Furnas due to failed bids and delays in hiring reinforcements and improvements.
In SPES, there was a total frustration of R$ 120 million in Furnas related to SPE Brasil Ventos due to the purchase of wind turbines having been postponed to 2023 in order to optimize hiring and improve prices.
1.5. COMMERCIALIZATION
1.5.1. ENERGY SOLD IN 3Q22 – GENERATORS – TWh
In terms of energy market evolution, the Eletrobras Companies, in 3Q22, sold 33.3 TWh of energy, against 32.6 TWh traded in the same period of the previous year, which represents an increase of 1.9%. These volumes include the energy sold from the plants under the quota regime, renewed by Law 12,783/2013, as well as by the plants under the exploration regime (ACL and ACR). With the advent of capitalization, the energies of Itaipu and Eletronuclear were excluded from 3Q22 and referring to 2021 for comparative purposes. Saesa information is not included.
MARKETLETTER 3Q2022 | 29 |
Disclaimer: This material contains calculations that may not produce an accurate sum or result due to rounding. |
| | |
Marketletter 3Q22 |

Sales: includes developments under Law 13,182/15
NOTE: Average ACR Prices in the chart do not include O&M. In Eletronorte's values, Amazonas-GT is included. And the Average ACR Prices in the chart do not include PIEs contracts and thermal plants contracts due to unavailability
1.5.2. ENERGETIC BALANCE
| Table 23: Energy Balance |
| Energetic Balance (MWavg) | 2022 | 2023 | 2024 | 2025 | 2026 | |
| Resources with no impact on the balance (1) | 1,419 | 1,419 | 1,419 | 1,192 | 1,192 | |
| Ballast | 8,006 | 9,076 | 10,351 | 11,592 | 12,772 | |
| Own resources (2) (3) (4) (5) | 7,093 | 8,274 | 9,541 | 10,810 | 12,079 | |
| Energy purchased | 7,093 | 8,274 | 9,541 | 10,810 | 12,079 | |
| Sales | 6,761 | 5,973 | 4,136 | 2,676 | 1,598 | |
| ACL – bilateral contracts + MCP realized | 6,032 | 5,190 | 3,353 | 1,944 | 866 | |
| ACR – Exceto cotas | 729 | 783 | 783 | 733 | 733 | |
| Avg prices | ||||||
| Sale avg price R$/MWh | 206.08 | 202.41 | 205.82 | 209.09 | 242.05 | |
| Purchase avg price R$/MWh | 262.47 | 252.52 | 232.25 | 233.94 | 238.30 | |
| Balance (ballast – solds) | 1,245 | 3,103 | 6,216 | 8,916 | 11,174 | |
| Unhired energy* | 13% | 30% | 53% | 70% | 80% | |
* The uncontracted portion includes energy reserved for the company's hedge, strategically defined according to the GSF estimate for the period.
MARKETLETTER 3Q2022 | 30 |
Disclaimer: This material contains calculations that may not produce an accurate sum or result due to rounding. |
| | |
Marketletter 3Q22 |
| Contracts entered into until 09/30/2022. | ||||||
| 1- Not included in the balance sheet, whether in resources, requirements (sales) or average prices, the PIEs contracts arising from the de-verticalization process of Amazonas Distribuidora, the contracts of thermal plants by availability and the Physical Guarantee Quotas. These resources are presented in order to compose the total resources considered. | ||||||
| 2- In Own Resources are included the Devestization plants (new PIEs) and the New Grants (Sobradinho, Itumbiara, Tucuruí, Curuá-Una and Mascarenhas de Moraes). For hydroelectric projects, an estimate of GFIS2 was considered, that is, the Physical Guarantee considering the Adjustment Factors as a function of Internal Losses, Losses in the Basic Grid and Availability. | ||||||
| 3- The plants with new concession grants are considered, in 2022, with their current Physical Guarantees. | ||||||
| 4- In the dequotization, the plants currently under quota regime start to have a new concession under the Independent Energy Producer - PIE regime, occurring gradually over a period of 5 years from 2023. The Physical Guarantee amounts were defined in Ordinance GM/MME No. 544/21. | ||||||
5- Considering the new concession grants as of 2023 for the Sobradinho, Itumbiara, Tucuruí, Curuá-Una and Mascarenhas de Moraes plants, whose Physical Guarantee values were defined in Ordinance GM/MME No. 544/21.
Regardin contracts in the ACL, there were reductions in the amounts contracted under the aegis of Law 13,182/2015 (UHE Itumbiara), pursuant to §§ 12, 12-A and 12-B of art. 10 of the aforementioned ordinance, transcribed in Clause 6 of the contracts, which take effect from the years 2023 and 2024. The amounts presented consider, on the one hand, these reductions, but also the volumes of new contracts signed. | ||||||
| Physical and Nuclear Energy Guarantee Quotas (MWmed) | 2022 | 2023 | 2024 | 2025 | 2026 | |
| Physical Guarantee Quotas (6) (7) | 7,464 | 5,327 | 3,995 | 2,663 | 1,332 | |
| 6- Total Physical Guarantee of the projects, with their current values in 2022. The concession under provisional administration of HPP Jaguari was considered, remaining until 2022. | ||||||
2.
Result Analysis of
Parent Company
In 3Q22, Eletrobras Holding recorded a net loss of R$15 million, a reduction of 102% compared to the net income of R$924 million in 3Q21. The 3Q22 result was decisively influenced by: (i) Equity Equity Income, in the amount of R$751 million in 3Q22, while in 3Q21 it was 10,789 million, a decrease of R$10,038 million, mainly influenced by events , non-recurring, occurred in 3Q21, such as: (a) renegotiation of the Hydrological Risk, in the net amount of R$ 3,888 million, recorded as recovery of expenses arising from Aneel Resolution No. extension of the concession of hydroelectric plants of the Eletrobras group; and (b) a significant increase in the transmission contractual asset, mainly due to the remeasurement of the concession asset related to the RBSE as a result of the reprofiling of R$ 3,759 million, net of taxes, while in 3Q22 there was a decrease in transmission revenue of shares by deflation; (ii) registration of Other Income in R$772 million, which refers, first, to the recognition of R$622 million due to the 14-month increase (May 2016 to June 2017) to the period covered by Law No. 14,182/2021 , which regulates the CCC reimbursement credit related to economic and energy "inefficiency" and, secondly, the reimbursement credit of R$ 150 million related to the AIC (fixed assets in progress) to be paid by the privatized distributors to Eletrobras. Such events did not occur in 3Q22, contributing to the relevant difference in results between periods.
MARKETLETTER 3Q2022 | 31 |
Disclaimer: This material contains calculations that may not produce an accurate sum or result due to rounding. |
| | |
Marketletter 3Q22 |
The effect of such non-recurring events was partially offset by: (iii) lower provisioning, with emphasis on compulsory loan lawsuits in which, in 3Q22, the amount was R$ 108.5 million, against the provision of R$ of R$ $9,059 million in 3Q21; (iv) improvement in the negative financial result of R$ 530 million between the compared quarters, with R$ -403.3 million in 3Q22 against R$ -933.7 million in 3Q21, mainly due to the reduction in the passive exchange rate variation.
| | Evolution of the Parent Company's Result in the Third Quarter - R$ million 3Q22 |
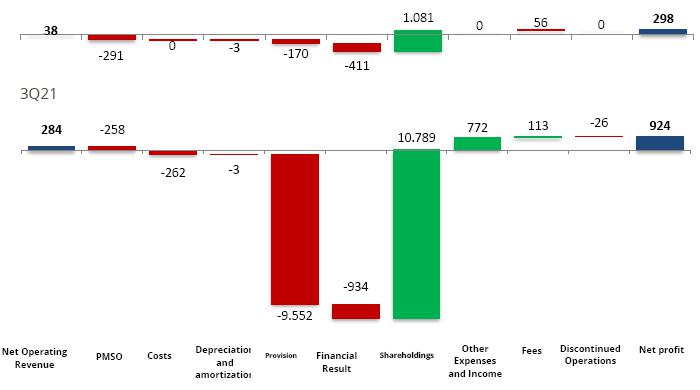
Note: The analysis of the results of each subsidiary can be found in Appendix II of the Investor Report.
2.1 Shareholdings in the Parent Company
In 3Q22, the result from Equity Investments had a positive impact on the Parent Company's result by R$ 751 million, resulting from the Equity Income from investments in subsidiaries and affiliates, while the result in 3Q21 was R$10,789 million.
Highlight for the worsening in the results of Eletronorte (-R$ 4,299 million), Chesf (-R$ 3,380 million) and Furnas (-R$ 2,303 million), partially offset by the improvement in the result at CGT Eletrosul (+R$ 76 million)
2.2 Operating Provisions of Parent Company
In 3Q22, Operating Provisions negatively impacted the Parent Company's result by R$170 million, compared to a provision of R$ 9,552 million in 3Q21. This variation is mainly explained by: (i) negative effect on provisions for Litigation, with emphasis on compulsory loan lawsuits in the amount of R$108.5 million in 3Q22, compared to a provision of R$9,059 million in 3Q21. The expressive amount provisioned for compulsory loans in 3Q21 was based on the jurisprudential development of cases related to Legal Proceedings for compulsory loan, the Company revisited its estimates of compulsory loan provisioning, which generated an increase observed in 3Q21.
MARKETLETTER 3Q2022 | 32 |
Disclaimer: This material contains calculations that may not produce an accurate sum or result due to rounding. |
| | |
Marketletter 3Q22 |
| Table 24: Operating Provisions (R$ million) |
| Operating Provisions | 3Q22 | 3Q21 |
| Guarantees | -4 | -5 |
| Provision for Disputes | 108 | 9.139 |
| PCLD - Financing and Loans | 4 | 10 |
| PECLD - Fuel consumption account | 0 | 340 |
| Investment Losses | 0 | 15 |
| Provision for Implantation of Shares - Compulsory Loan | 30 | 47 |
| Others | 32 | 5 |
| TOTAL | 170 | 9,552 |
2.3 Parent Company Financial Result
The financial result showed an improvement of the negative result of R$ 530 million, mainly due to: (i) reduction in the passive exchange variation, which changed from R$ -503 million in net form, in 3Q21, to R$ -185 million in 3Q22 due to the 9.5% variation in the US dollar in 3Q21 and -1.7% in 3Q22; (ii) the R$ 261 million increase in Income from financial investments between the compared periods, due to the significant improvement in the profitability of FAE 2 and Fundo Referenciado DI; This was partially offset by (iii) a reduction of R$ -108 million in active monetary restatements, especially due to the variation in deflation in the quarter of investments indexed to the IPCA.
| Table 25: Financial Result (R$ million) |
| FINANCIAL RESULT | 3Q22 | 3Q21 |
| Financial income | ||
| Interest, commission and fee income | 252 | 227 |
| Income from financial investments | 378 | 118 |
| Additional moratorium on electricity | 0 | 11 |
| Interest income on dividends | 72 | 26 |
| Other financial income | 173 | 25 |
| (-) Taxes on financial income | -34 | -59 |
| Financial expenses | ||
| Debt charges | -484 | -394 |
| Leasing charges | -1 | -1 |
| Remuneration for Thermonuclear Plant Decommissioning Fund | - | - |
| Charges on shareholder resources | -3 | -1 |
| Other financial expenses | -178 | -96 |
| Financial items, net | ||
| Monetary variations | -397 | -289 |
| Exchange variations | -185 | -503 |
| Financial Result | -403 | -934 |
MARKETLETTER 3Q2022 | 33 |
Disclaimer: This material contains calculations that may not produce an accurate sum or result due to rounding. |
| | |
Marketletter 3Q22 |
3.
General Information
Corporate Structure on 09/30/2022

MARKETLETTER 3Q2022 | 34 |
Disclaimer: This material contains calculations that may not produce an accurate sum or result due to rounding. |
| | |
Marketletter 3Q22 |
| Table 26: Structure of the Capital Stock |
| Eletrobras Social Capital | ||||||
| Shareholding position on 09/30/2022 | % Capital | |||||
| Shareholders | Quantity of Shares | Value (R$) | Species/Class | Total | ||
| COMMON | 2,021,139,464 | 62,841,166,980,2 | 100.00% | 87.83% | ||
| Government | 667,888,884 | 20,765,967,728,2 | 33.05% | 29.02% | ||
| BNDES | 74,545,264 | 2,317,757,614,5 | 3.69% | 3.24% | ||
| BNDESPAR | 71,956,435 | 2,237,265,872,9 | 3.56% | 3.13% | ||
| Citibank | 62,308,218 | 1,937,283,993,2 | 3.08% | 2.71% | ||
| FND | 45,621,589 | 1,418,464,160,1 | 2.26% | 1.98% | ||
| 3G Radar Backgrounds | 963,132 | 29,945,651,9 | 0.05% | 0.04% | ||
| Banco do Nordeste | 1,420,900 | 44,178,551,6 | 0.07% | 0.06% | ||
| FGHAB | 1,000,000 | 31,091,949,9 | 0.05% | 0.04% | ||
| Iberclear - Latibex | 301,350 | 9,369,559,1 | 0.01% | 0.01% | ||
| Board of Executive Officers | 20,000 | 621,839,0 | 0.00% | 0.00% | ||
| Board of Directors | 1 | 31,1 | 0.00% | 0.00% | ||
| Others | 1,095,113,691 | 34,049,220,028,7 | 54.18% | 47.59% | ||
| PREF. A | 146,920 | 3,657,455,1 | 100.00% | 0.01% | ||
| Victor Adler | 52,200 | 1,299,477,0 | 35.53% | 0.00% | ||
| Shareholders to be identified | 42,451 | 1,056,783,5 | 28.89% | 0.00% | ||
| Others | 52,269 | 1,301,194,7 | 35.58% | 0.00% | ||
| PREF. B | 279,941,393 | 6,968,915,542,3 | 100.00% | 12.16% | ||
| 3G Radar Backgrounds | 30,451,076 | 758,055,014,8 | 10.88% | 1.32% | ||
| BNDESPAR | 18,691,102 | 465,299,932,4 | 6.68% | 0.81% | ||
| BNDES | 18,262,671 | 454,634,487,6 | 6.52% | 0.79% | ||
| Board of Directors | 4,364,579 | 108,652,679,4 | 1.56% | 0.19% | ||
| Citibank | 4,354,221 | 108,394,825,3 | 1.56% | 0.19% | ||
| Shareholders to be identified | 2,005,404 | 49,922,917,6 | 0.72% | 0.09% | ||
| Iberclear - Latibex | 125,653 | 3,128,030,2 | 0.04% | 0.01% | ||
| Board of Executive Officers | 50,000 | 1,244,709,7 | 0.02% | 0.00% | ||
| Government | 493 | 12,272,8 | 0.00% | 0.00% | ||
| Others | 201,636,194 | 5,019,570,672,3 | 72.03% | 8.76% | ||
| PREF. C - GOLDEN SHARE UNIÃO | 1 | 24,9 | 100.00% | 0.00% | ||
| TOTAL | 2,301,227,778 | 69,813,740,002,5 | - | 100.00% | ||
MARKETLETTER 3Q2022 | 35 |
Disclaimer: This material contains calculations that may not produce an accurate sum or result due to rounding. |
| | |
Marketletter 3Q22 |
Asset Behavior Analysis
Shares
| Table 27: B3, ELET3 and ELET6 |
| (R$) | (R$) | (pts.) | (pts.) | |
| Price and Volume | ELET3 | ELET6 | IBOV | IEE |
| (Shares ON) | (Shares PN) | (Índice) | (Índice) | |
| Closing Price on 09/30/2022 | 42.97 | 45.15 | 110.037 | 78.488 |
| Maximum in the quarter | 49.60 | 51.20 | 114.070 | 86.101 |
| Average in the quarter | 45.66 | 47.15 | 106.736 | 81.159 |
| Minimum in the quarter | 42.25 | 43.42 | 96.121 | 76.939 |
| Variation in 3Q22 | -7.0% | -3.3% | 11.7% | -0.4% |
| Change in the last 12 months | 13.7% | 21.2% | -0.8% | 0.2% |
| Average Daily Traded Volume 3Q22 (R$ million) | 463.49 | 137.64 | - | - |
| Book Value per Share (R$) | 48.59 | 48.59 | - | - |
| Price / Profit (P/E) (1) | 19.75 | 20.75 | - | - |
| Price / Shareholders' Equity (P/B) (2) | 0.88 | 0.93 | - | - |
| (1) | Closing price of preferred and common shares at the end of the period / Net income per share. For the calculation, the accumulated net profit of the last 12 months was considered; |
| (2) | Closing price of preferred and common shares at the end of the period / Book Value per share at the end of the period. |
MARKETLETTER 3Q2022 | 36 |
Disclaimer: This material contains calculations that may not produce an accurate sum or result due to rounding. |
| | |
Marketletter 3Q22 |
| Evolution of Shares Traded at B3 |

Source: AE Broadcast
Index number 09/30/2021 = 100 and ex-dividend values.
ADR Programs
| Table 28: NYSE, EBRN and EBRB |
| Price and Volume | (US$) NYSE | (US$) NYSE |
| EBRN | EBRB | |
| Closing Price on 09/30/2022 | 8.03 | 8.48 |
| Maximum in the quarter | 9.66 | 10.11 |
| Average in the quarter | 8.76 | 9.08 |
| Minimum in the quarter | 7.91 | 8.09 |
| Variation in 3Q22 | -9.5% | -4.6% |
| Change in the last 12 months | 15.4% | 17.5% |
| Average Daily Trading Volume 3Q22 (US$ thousand) | 14.957 | 444 |
MARKETLETTER 3Q2022 | 37 |
Disclaimer: This material contains calculations that may not produce an accurate sum or result due to rounding. |
| | |
Marketletter 3Q22 |
| Evolution of Shares Traded in ADR |
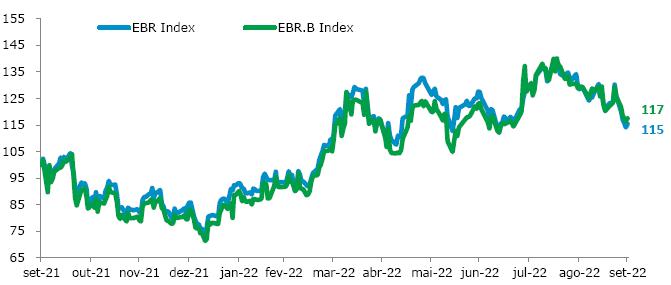
Source: AE Broadcast
Index number 09/30/2021 = 100 and ex-dividend values.
MARKETLETTER 3Q2022 | 38 |
Disclaimer: This material contains calculations that may not produce an accurate sum or result due to rounding. |
| | |
Marketletter 3Q22 |
Latibex - MADRID MARKET
| Table 29: LATIBEX, XELTO and XELTB |
| Price and Volume | (€) LATIBEX | (€) LATIBEX |
| XELTO | XELTB | |
| Closing Price on 09/30/2022 | 8.10 | 8.60 |
| Maximum in the quarter | 8.70 | 9.50 |
| Average in the quarter | 8.39 | 8.61 |
| Minimum in the quarter | 8.10 | 8.00 |
| Variation in 3Q22 | 4.5% | 8.2% |
| Change in the last 12 months | 31.7% | 41.0% |
| Average Daily Traded Volume 3Q22 (thousands of Euros) | 9.7 | 2.8 |
| Evolution of Foreign Currencies |

Index number 09/30/2021 = 100.
Source: Banco Central
MARKETLETTER 3Q2022 | 39 |
Disclaimer: This material contains calculations that may not produce an accurate sum or result due to rounding. |
| | |
Marketletter 3Q22 |
Nº of Employees
PARENT COMPANY
With the conclusion of the privatization of Eletrobras on June 17, 2022, 280 employees assigned to other bodies, as permitted by Decree 10835/2021, returned to the Eletrobras companies, 59 of which in Eletrobras Holding. The table below reflects the return of these employees in addition to other changes in the quarter.
| Table 30: Employees by Working Time |
| Working time in the company (years) | 1Q22 | 2Q22 | 3Q22 |
| Up until 5 | 23 | 18 | 17 |
| 6 to 10 | 31 | 45 | 47 |
| 11 to 15 | 390 | 434 | 397 |
| 16 to 20 | 148 | 149 | 182 |
| 21 to 25 | 18 | 17 | 17 |
| More than 25 | 60 | 62 | 61 |
| Total | 670 | 725 | 721 |
| Table 31: Employees by Federation State |
| Federation State | 1Q22 | 2Q22 | 3Q22 |
| Rio de Janeiro | 653 | 708 | 704 |
| Brasília | 15 | 15 | 15 |
| São Paulo | 1 | 1 | 1 |
| Expatriado | 1 | 1 | 1 |
| Total | 670 | 725 | 721 |
MARKETLETTER 3Q2022 | 40 |
Disclaimer: This material contains calculations that may not produce an accurate sum or result due to rounding. |
| | |
Marketletter 3Q22 |
Balance Sheet
| (R$ thousand) |
| Ativo | Parent Company | Consolidated | ||
| 09/30/2022 | 09/30/2021 | 09/30/2022 | 09/30/2021 | |
| CURRENT | ||||
| Cash and cash equivalents | 1,640,956 | 7,384 | 4,118,346 | 192,659 |
| Restricted cash | 2,642,581 | 2,544,594 | 2,642,581 | 2,544,594 |
| Marketable securities | 8,300,290 | 6,026,365 | 12,637,380 | 15,640,776 |
| Customers | 537,760 | 719,906 | 5,046,692 | 5,094,976 |
| Asset contractual transmission | 0 | 0 | 9,077,098 | 7,356,356 |
| Loans and financing | 2,395,034 | 2,275,301 | 1,564,649 | 1,251,766 |
| Remuneration of equity interests | 2,573,667 | 5,028,731 | 199,806 | 443,142 |
| Taxes to recover | 633,395 | 456,725 | 1,100,833 | 755,906 |
| Income tax and social contribution | 613,146 | 640,191 | 1,792,783 | 1,487,777 |
| Reimbursement rights | 792,655 | 741,255 | 824,242 | 768,848 |
| Warehouse | 256 | 293 | 486,742 | 627,573 |
| Nuclear fuel stock | 0 | 0 | 0 | 487,895 |
| Derivative financial instruments | 0 | 0 | 383,457 | 690,333 |
| Hydrological risk | 0 | 0 | 0 | 0 |
| Others | 1,409,158 | 685,320 | 2,944,669 | 2,014,705 |
| Asset held for sale | 369,725 | 289,331 | 460,486 | 387,690 |
| 22,145,571 | 19,415,396 | 43,516,712 | 39,744,996 | |
| NON CURRENT | ||||
| LONG-TERM REALIZABLE | ||||
| Reimbursement rights | 2,234,330 | 5,529,316 | 2,316,503 | 5,627,386 |
| Loans and financing | 4,767,958 | 8,180,605 | 2,385,373 | 4,591,761 |
| Customers | 0 | 0 | 711,431 | 993,080 |
| Marketable Securities | 412,074 | 398,280 | 1,562,416 | 1,093,476 |
| Amounts Receivable - ENBPAR | 1,233,683 | 0 | 1,233,683 | 0 |
| Nuclear fuel stock | 0 | 0 | 0 | 1,490,820 |
| Taxes to recover | 3,365 | 3,365 | 420,928 | 449,258 |
| Current Income Tax and Social Contribution | 0 | 0 | 3,229,450 | 1,500,987 |
| Escrow deposits | 6,583,505 | 6,393,647 | 8,811,858 | 8,247,485 |
| Transmission contractual asset | 0 | 0 | 52,247,908 | 52,158,612 |
| Financial assets - Concessions and Itaipu | 36,080 | 428,865 | 36,080 | 2,601,027 |
| Derivative financial instruments | 0 | 0 | 383,489 | 653,022 |
| Advances for future capital increase | 20,596,028 | 3,932,463 | 0 | 0 |
| Hydrological risk | 0 | 0 | 0 | 0 |
| Decommissioning Fund | 0 | 2,055,713 | 0 | 2,055,713 |
| Others | 1,804,391 | 2,024,412 | 1,144,071 | 1,087,508 |
| 37,671,414 | 28,946,666 | 74,483,190 | 82,550,135 | |
| INVESTMENT | 106,263,301 | 88,740,622 | 33,865,177 | 27,647,781 |
| Fixed assets net | 233,890 | 235,453 | 34,397,553 | 33,367,981 |
| INTANGIBLE | 66,035 | 61,387 | 80,243,497 | 4,992,176 |
| TOTAL NON-CURRENT ASSETS | 144,234,640 | 117,984,128 | 222,989,417 | 148,558,073 |
| TOTAL ASSETS | 166,380,211 | 137,399,524 | 266,506,129 | 188,303,069 |
MARKETLETTER 3Q2022 | 41 |
Disclaimer: This material contains calculations that may not produce an accurate sum or result due to rounding. |
| | |
Marketletter 3Q22 |
| (R$ thousand)) |
| Passivo | Parent Company | Consolidated | ||
| 09/30/2022 | 09/30/2021 | 09/30/2022 | 09/30/2021 | |
| CURRENT | ||||
| Loans and financing and Debentures | 3,747,872 | 5,310,178 | 7,031,920 | 8,234,753 |
| Compulsory loan | 1,345,583 | 1,216,335 | 1,345,583 | 1,216,335 |
| Suppliers | 730,471 | 773,858 | 3,101,127 | 4,031,532 |
| Advances from customers | 1,648,149 | 1,370,946 | 1,840,014 | 1,460,455 |
| Taxes payable | 63,246 | 259,336 | 512,315 | 804,485 |
| Income tax and social contribution | 0 | 0 | 116,982 | 19,624 |
| Remuneration to shareholders | 49,655 | 1,381,111 | 57,614 | 1,406,891 |
| Financial liabilities - Concessions and Itaipu | 0 | 578,626 | 0 | 578,626 |
| Estimated liabilities | 164,485 | 153,568 | 1,496,136 | 1,602,947 |
| Reimbursement Obligations | 2,035,128 | 836,744 | 2,035,128 | 859,003 |
| Provisions for contingencies | 0 | 0 | 239,691 | 233,304 |
| Provisões para litígios | 2,508,825 | 2,267,649 | 3,329,741 | 2,267,649 |
| Regulatory charges | 0 | 0 | 1,047,357 | 542,913 |
| Obligations arising from Law 14.182/2021 | 0 | 0 | 1,445,911 | 0 |
| Lease | 8,169 | 7,773 | 203,403 | 209,774 |
| Others | 84,056 | 64,061 | 725,207 | 246,700 |
| 12,385,639 | 14,220,185 | 24,528,129 | 23,714,991 | |
| Liabilities associated with assets held for sale | 0 | 0 | 171,227 | 168,381 |
| 12,385,639 | 14,220,185 | 24,699,356 | 23,883,372 | |
| NON-CURRENT | ||||
| Loans and financing and Debentures | 16,950,577 | 19,294,960 | 47,468,708 | 35,780,892 |
| Suppliers | 0 | 0 | 0 | 16,555 |
| Advances from customers | 0 | 0 | 250,819 | 186,348 |
| Obligation for asset retirement | 0 | 0 | 0 | 3,268,301 |
| Provisions for contingencies | 23,647,844 | 23,666,275 | 32,048,827 | 31,142,222 |
| Post-employment benefits | 855,306 | 885,455 | 4,939,333 | 5,851,502 |
| Obligations arising from Law 14.182/2021 | 0 | 0 | 34,325,336 | 0 |
| Provision for unsecured liabilities | 0 | 0 | 0 | 708,516 |
| Onerous contracts | 0 | 0 | 194,810 | 428,164 |
| Lease | 34,362 | 40,560 | 566,079 | 693,710 |
| Concessions payable - Use of public goods | 0 | 0 | 375,135 | 81,655 |
| Advances for future capital increase | 84,225 | 77,336 | 84,225 | 77,336 |
| Sector Charges | 0 | 0 | 469,117 | 649,341 |
| Tributos a recolher | 0 | 0 | 747,450 | 260,612 |
| Deferred income tax and social contribution | 433,712 | 569,816 | 6,576,193 | 7,244,737 |
| Others | 493,523 | 2,523,733 | 1,915,296 | 1,613,042 |
| 42,499,549 | 47,058,135 | 129,961,328 | 88,002,933 | |
| EQUITY | ||||
| Share capital | 69,705,554 | 39,057,271 | 69,705,554 | 39,057,271 |
| Capital reserves | 13,867,170 | 13,867,170 | 13,867,170 | 13,867,170 |
| Profit reserves | 30,890,165 | 30,890,165 | 30,890,165 | 30,890,165 |
| Other comprehensive cumulative results | -7,640,574 | -7,693,402 | -7,640,574 | -7,693,402 |
| Non controlling shareholdins | 0 | 0 | 350,422 | 295,560 |
| Retained earnings | 4,672,708 | 0 | 4,672,708 | 0 |
| TOTAL SHAREHOLDERS' EQUITY | 111,495,023 | 76,121,204 | 111,845,445 | 76,416,764 |
| TOTAL LIABILITIES AND SHAREHOLDERS' EQUITY | 166,380,211 | 137,399,524 | 266,506,129 | 188,303,069 |
MARKETLETTER 3Q2022 | 42 |
Disclaimer: This material contains calculations that may not produce an accurate sum or result due to rounding. |
| | |
Marketletter 3Q22 |
Income Statement
| Parent Company | Consolidated | |||
| 09/30/2022 | 09/30/2021 | 09/30/2022 | 09/30/2021 | |
| NET OPERATING REVENUE | 139,207 | 472,345 | 25,064,955 | 24,124,952 |
| Operating costs | ||||
| Personnel, Material and Services | 0 | 0 | -2,526,440 | -2,047,101 |
| Energy purchased for resale | -16,605 | -418,856 | -2,142,138 | 1,353,914 |
| Charges upon use of electric network | 0 | 0 | -1,981,952 | -1,665,212 |
| Fuel for electricity production | 0 | 0 | -1,541,826 | -1,536,977 |
| Construction | 0 | 0 | -934,772 | -769,016 |
| Depreciation | 0 | 0 | -926,776 | -781,668 |
| Amortization | 0 | 0 | -727,537 | -34,733 |
| Operating Provisions /Reversals net | 0 | 0 | 0 | -9,472 |
| Others Costs | 0 | 0 | -119,326 | -176,057 |
| GROSS RESULT | 122,602 | 53,489 | 14,164,188 | 18,458,630 |
| Operating expenses | ||||
| Personnel, Supllies and Services | -426,846 | -400,505 | -2,220,028 | -2,119,354 |
| Depreciation | -8,373 | -8,995 | -129,655 | -85,132 |
| Amortization | -8 | -8 | -26,654 | -20,649 |
| Donations and contributions | -97,296 | -65,830 | -141,671 | -115,176 |
| Operating Provisions /Reversals net | -1,629,576 | -10,864,969 | -5,793,684 | -11,364,571 |
| Others | -193,536 | -288,703 | -976,505 | -894,444 |
| -2,355,635 | -11,629,010 | -9,288,197 | -14,599,326 | |
| Regulatory Remeasurements - Transmission Contracts | 0 | 0 | 362,392 | 4,858,744 |
| OPERATING INCOME BEFORE FINANCIAL RESULT | -2,233,033 | -11,575,521 | 5,238,383 | 8,718,048 |
| Financial result | -189,062 | -665,289 | -2,695,516 | -709,694 |
| INCOME BEFORE EQUITY | -2,422,095 | -12,240,810 | 2,542,867 | 8,008,354 |
| RESULTS OF EQUITY | 5,223,640 | 16,558,591 | 1,667,870 | 1,450,562 |
| OTHER INCOME AND EXPENSES | 574,658 | 771,758 | 274,366 | 771,758 |
| OPERATING RESULT BEFORE TAXES | 3,376,203 | 5,089,539 | 4,485,103 | 10,230,674 |
| Current Income Tax and Social Contribution | -271,638 | 0 | -1,729,398 | -1,412,203 |
| Deferred Income Tax and Social Contribution | 0 | 0 | 374,515 | -3,668,904 |
| NET INCOME FROM CONTINUING OPERATIONS | 3,104,565 | 5,089,539 | 3,130,220 | 5,149,567 |
| NET INCOME (LOSS) FROM THE DISCONTINUED OPERATION | 986,785 | -45,755 | 986,785 | -45,943 |
| NET INCOME FOR THE PERIOD | 4,091,350 | 5,043,784 | 4,117,005 | 5,103,624 |
MARKETLETTER 3Q2022 | 43 |
Disclaimer: This material contains calculations that may not produce an accurate sum or result due to rounding. |
| | |
Marketletter 3Q22 |
Cash Flow Statement
| (R$ thousand) |
| Parent Company | Consolidated | |||
| 30.09.22 | 30.09.21 | 30.09.22 | 30.09.21 | |
| Operating Activities | 3,376,203 | 5,089,539 | 4,485,103 | 10,230,674 |
| Income before income tax and social contribution | ||||
| Depreciation and amortization | 8,380 | 9,003 | 1,810,620 | 922,182 |
| Net foreign exchange rate variations | 508,415 | 316,519 | 352,552 | 170,934 |
| Financial charges | 105,856 | 144,836 | 3,039,872 | 1,401,191 |
| Equivalence equity results | -5,223,640 | -16,558,591 | -1,667,870 | -1,450,562 |
| Other Income and Expenses | -574,658 | -771,758 | -274,366 | -771,758 |
| Revenue from the contractual asset - transmission | 0 | 0 | -12,142,930 | -12,370,303 |
| Construction Revenue Generation | 0 | 0 | -7,324 | -38,650 |
| Contractual revenue - Transmission | 0 | 0 | 927,448 | 769,016 |
| Regulatory Remeasurements - Transmission Contracts | 0 | 0 | -362,392 | -4,858,744 |
| Operating provisions (reversals) | 1,629,576 | 10,864,969 | 5,793,684 | 11,374,043 |
| Participation of non-controlling shareholders | 0 | 0 | -49,403 | -90,643 |
| GSF reimbursement | 0 | 0 | 0 | -4,265,889 |
| Financial instruments - derivatives | 0 | 0 | 576,408 | -684,564 |
| Others | 9,019 | -92,966 | -371,005 | 553,985 |
| -3,537,052 | -6,087,988 | -2,374,706 | -9,339,762 | |
| (Increases) / decreases in operating assets | ||||
| Customers | 0 | 1 | -510,004 | 1,002,547 |
| Marketable securities | -2,273,925 | -720,347 | 2,075,384 | -4,661,177 |
| Reimbursement rights | 337,087 | 51,040 | 348,990 | -66,188 |
| Warehouse | 37 | 24 | -51,431 | 115,600 |
| Nuclear fuel stock | 0 | 0 | 0 | -116,863 |
| Financial assets - Itaipu | -422,789 | 1,568,820 | -422,789 | 1,568,820 |
| Assets held for sale | -80,394 | 0 | -72,796 | -99,879 |
| Hydrological risk | 0 | 0 | 0 | 520,785 |
| Credits with subsidiaries - CCD | 0 | 0 | 0 | 0 |
| Others | 1,202,287 | 110,536 | 812,412 | 138,912 |
| -1,237,697 | 1,010,074 | 2,179,766 | -1,597,443 | |
| Increase / (decrease) in operating liabilities | ||||
| Suppliers | 12,552 | -254,687 | 254,073 | -295,864 |
| Advances | 0 | 0 | 166,827 | -67,232 |
| Lease | -5,802 | -5,725 | 14,394 | 274,473 |
| Estimated liabilities | 10,917 | 15,577 | 9,327 | -69,388 |
| Indemnification obligations | 0 | 0 | 0 | 99,003 |
| Sectorial charges | 0 | 0 | 221,323 | -137,040 |
| Liabilities associated with assets held for sale | 0 | 0 | 2,846 | 0 |
MARKETLETTER 3Q2022 | 44 |
Disclaimer: This material contains calculations that may not produce an accurate sum or result due to rounding. |
| | |
Marketletter 3Q22 |
| Others | -150,593 | -733,239 | -828,458 | -797,023 |
| -132,926 | -978,074 | -159,668 | -993,071 | |
| Payment of financial charges | -1,008,362 | -848,801 | -2,147,718 | -1,223,467 |
| Payment of financial charges - leases | 0 | 0 | -2,882 | -95,053 |
| Revenue of RAP and indemnities | 0 | 0 | 10,716,047 | 11,807,432 |
| Revenue of financial charges | 531,789 | 643,814 | 257,973 | 455,579 |
| Payment of income tax and social contribution | -219,126 | -155,989 | -2,451,751 | -1,905,401 |
| Revenue of remuneration for investments in equity interests | 2,896,572 | 5,528,150 | 1,092,659 | 1,523,912 |
| Supplementary pension payment | -30,149 | -11,002 | -331,908 | -238,017 |
| Payment of legal contingencies | -1,851,531 | -1,886,445 | -2,013,742 | -4,148,606 |
| Bonds and related deposits | -426,442 | -1,574,390 | -888,159 | -1,514,022 |
| Net cash from (used in) operating activities of continuing operations | -1,638,720 | 728,889 | 8,361,014 | 2,962,755 |
| Net cash from (used in) operating activities of discontinued operations | 0 | 0 | -2,908,844 | 153,526 |
| Net cash from (used in) operating activities | -1,638,720 | 728,889 | 5,452,170 | 3,116,281 |
| Financing activities | ||||
| Loans and financing obtained and debentures obtained | 44,746 | 2,700,000 | 2,544,746 | 4,736,770 |
| Payment of loans and financing and debentures - principal | -3,540,193 | -2,860,468 | -5,358,847 | -4,083,507 |
| Payment of remuneration to shareholders | -916,031 | -2,922,438 | -811,700 | -2,840,202 |
| Receipt of advance for future capital increase | 0 | 0 | 0 | 0 |
| Payment of finance leases | 0 | 0 | -540,369 | -265,895 |
| Others | 0 | 0 | 0 | 266 |
| Net cash from (used in) continuing operations financing activities | -4,411,478 | -3,082,907 | -4,166,170 | -2,452,568 |
| Net cash from (used in) the financing activities of discontinued operations | 0 | 0 | -174,814 | 775,470 |
| Net cash from (used in) financing activities | -4,411,478 | -3,082,907 | -4,340,984 | -1,677,098 |
| Investing activities | ||||
| Receipt of loans and financing | 2,557,193 | 5,076,238 | 1,711,612 | 3,663,636 |
| Payment of share capital | 30,749,280 | 0 | 30,749,280 | 0 |
| Acquisition of fixed assets | -6,892 | -2,621 | -916,120 | -459,351 |
| Aquisição de ativo intangível | -4,656 | -13,964 | -31,950,441 | -122,178 |
| Acquisition of intangible assets | -188,367 | -9 | -235,789 | -117,921 |
| Acquisition / capital investment in equity | -26,526,187 | -1,022,319 | 0 | -1,030,000 |
| Acquisition of contractual asset | 1,103,398 | 188 | 1,103,398 | 188 |
| Advance concession for future capital increase | 0 | 0 | -934,772 | -769,016 |
| Net cash in the business combination | 0 | 0 | 180,203 | 0 |
| Others | 0 | 0 | 23,472 | -81,025 |
| Cash and cash equivalents at the beginning of the year of continuing operations | 7,683,770 | 4,037,514 | -269,157 | 1,084,333 |
| Cash and cash equivalents at the end of the year from continuing operations | 0 | 0 | 3,079,754 | -928,026 |
| Net cash from (used in) investing activities | 7,683,770 | 4,037,514 | 2,810,597 | 156,307 |
MARKETLETTER 3Q2022 | 45 |
Disclaimer: This material contains calculations that may not produce an accurate sum or result due to rounding. |
| | |
Marketletter 3Q22 |
| Increase (decrease) in cash and cash equivalents | 1,633,572 | 1,683,496 | 3,921,783 | 1,595,490 |
| Cash and cash equivalents at the beginning of the year of continuing operations | 7,384 | 21,630 | 192,659 | 286,607 |
| Cash and cash equivalents at the end of the year from continuing operations | 1,640,956 | 1,705,126 | 4,118,346 | 1,881,127 |
| 1,633,572 | 1,683,496 | 3,921,783 | 1,595,490 |
MARKETLETTER 3Q2022 | 46 |
Disclaimer: This material contains calculations that may not produce an accurate sum or result due to rounding. |
SIGNATURE
Pursuant to the requirements of the Securities Exchange Act of 1934, the registrant has duly caused this report to be signed on its behalf by the undersigned, thereunto duly authorized.
Date: November 10, 2022
| CENTRAIS ELÉTRICAS BRASILEIRAS S.A. - ELETROBRÁS | ||
| By: | /S/ Elvira Baracuhy Cavalcanti Presta | |
Elvira Baracuhy Cavalcanti Presta CFO and Investor Relations Officer | ||
FORWARD-LOOKING STATEMENTS
This press release may contain forward-looking statements. These statements are statements that are not historical facts, and are based on management's current view and estimates offuture economic circumstances, industry conditions, company performance and financial results. The words "anticipates", "believes", "estimates", "expects", "plans" and similar expressions, as they relate to the company, are intended to identify forward-looking statements. Statements regarding the declaration or payment of dividends, the implementation of principal operating and financing strategies and capital expenditure plans, the direction of future operations and the factors or trends affecting financial condition, liquidity or results of operations are examples of forward-looking statements. Such statements reflect the current views of management and are subject to a number of risks and uncertainties. There is no guarantee that the expected events, trends or results will actually occur. The statements are based on many assumptions and factors, including general economic and market conditions, industry conditions, and operating factors. Any changes in such assumptions or factors could cause actual results to differ materially from current expectations.