UNITED STATES
SECURITIES AND EXCHANGE COMMISSION
Washington, D.C. 20549
FORM N-CSR
Certified Shareholder Report of
Registered Management Investment Companies
Investment Company Act File Number: 811-22215
International Growth and Income Fund
(Exact Name of Registrant as Specified in Charter)
6455 Irvine Center Drive
Irvine, California 92618
(Address of Principal Executive Offices)
Registrant's telephone number, including area code: (213) 486-9200
Date of fiscal year end: June 30
Date of reporting period: December 31, 2017
Michael W. Stockton
International Growth and Income Fund
333 South Hope Street
Los Angeles, California 90071
(Name and Address of Agent for Service)
ITEM 1 – Reports to Stockholders
 | International Growth and Income FundSM Semi-annual report for the six months ended December 31, 2017 |

Pursues growth and
income opportunities
across international
markets
International Growth and Income Fund seeks to provide you with long-term growth of capital while providing current income.
This fund is one of more than 40 offered by one of the nation’s largest mutual fund families, American Funds, from Capital Group. For more than 85 years, Capital has invested with a long-term focus based on thorough research and attention to risk.
Fund results shown in this report, unless otherwise indicated, are for Class A shares at net asset value. If a sales charge (maximum 5.75%) had been deducted, the results would have been lower. Results are for past periods and are not predictive of results for future periods. Current and future results may be lower or higher than those shown. Share prices and returns will vary, so investors may lose money. Investing for short periods makes losses more likely. For current information and month-end results, visit americanfunds.com.
Here are the average annual total returns on a $1,000 investment with all distributions reinvested for periods ended December 31, 2017:
| Class A shares | 1 year | 5 years | Lifetime (since 10/1/08) | |||
| Reflecting 5.75% maximum sales charge | 18.82% | 4.95% | 7.11% |
For other share class results, visit americanfunds.com and americanfundsretirement.com.
The total annual fund operating expense ratio was 0.93% for Class A shares as of the prospectus dated September 1, 2017. The expense ratio is restated to reflect current fees.
Investment results assume all distributions are reinvested and reflect applicable fees and expenses. When applicable, investment results reflect fee waivers, without which results would have been lower. Visit americanfunds.com for more information.
The fund’s 30-day yield for Class A shares as of January 31, 2018, reflecting the 5.75% maximum sales charge and calculated in accordance with the U.S. Securities and Exchange Commission formula, was 1.97%.
Investing outside the United States may be subject to risks, such as currency fluctuations, periods of illiquidity and price volatility. These risks may be heightened in connection with investments in developing countries. Refer to the fund prospectus and the Risk Factors section of this report for more information on these and other risks associated with investing in the fund.
Investments are not FDIC-insured, nor are they deposits of or guaranteed by a bank or any other entity, so they may lose value.
Fellow investors:
An improving global economy, better-than-expected corporate earnings and political developments in major markets provided a favorable backdrop for international equity markets during the first half of the fund’s fiscal year. Strengthening currencies relative to the U.S. dollar further bolstered returns in some markets.
For the six months ended December 31, 2017, International Growth and Income Fund generated a 9.98% total return. This result includes dividend payments totaling 25 cents a share for the period.
The fund trailed its primary benchmark, the MSCI ACWI (All Country World Index) ex USA, which advanced 11.48%. The index, which reflects the returns of more than 40 developed-and developing-country stock markets, is unmanaged and, therefore, has no expenses. The fund’s result was in line with the 9.90% total return of the Lipper International Funds Index, a peer group measure. We firmly believe that the fund’s focus on established, dividend-paying companies will prove rewarding to investors over the long term. As the table below shows, the fund has outpaced both indexes over its lifetime.
The economic and market environment
Stocks steadily rose throughout the first half of the fiscal year as investors were encouraged by improving economic fundamentals, most notably in Europe and some emerging markets. Equity markets were further bolstered by stronger corporate earnings as companies across a number of sectors benefited from an uptick in consumer spending, expanding trade activity and a low interest rate environment. Political events also helped propel markets higher as a $1.5 trillion tax cut in the U.S. and the re-election of Prime Minister Shinzō Abe in Japan were welcomed by investors. The market rally continued throughout the period, and several major market indexes traded near multi-year highs.
Results at a glance
For periods ended December 31, 2017, with all distributions reinvested
| Cumulative total returns | Average annual total returns | |||||||||||||||
| 6 months | 1 year | 5 years | Lifetime (since 10/1/08) | |||||||||||||
| International Growth and Income Fund (Class A shares) | 9.98 | % | 26.08 | % | 6.20 | % | 7.80 | % | ||||||||
| MSCI ACWI (All Country World Index) ex USA* | 11.48 | 27.19 | 6.80 | 5.90 | ||||||||||||
| Lipper International Funds Index† | 9.90 | 26.70 | 8.10 | 6.51 | ||||||||||||
| * | The market index is unmanaged and therefore has no expenses. Investors cannot invest directly in an index. |
| † | Lipper indexes track the largest mutual funds (no more than 30), represented by one share class per fund, in the corresponding category. |
| International Growth and Income Fund | 1 |
European stocks advanced amid signs of improving economic activity, accelerating corporate earnings growth and a monetary stimulus boost from the European Central Bank (ECB). At their October meeting, ECB officials said the bank will likely continue buying European government bonds through September 2018, but will reduce the amount purchased from the current €60 billion a month to €30 billion a month and likely keep short-term interest rates in negative territory well into 2018. The euro zone’s GDP growth rate rose to a 2.6% annualized rate in the third quarter, outpacing the United States. Political disputes continued to make headlines during the period. Following an uneasy election victory in September for Chancellor Angela Merkel’s conservative party, German leaders failed to form a coalition government. Talks were ongoing at the close of the period. Gains for European stocks moderated toward the close of the period, influenced by year-end tax-related selling and some disappointing corporate earnings reports. The euro appreciated against the dollar, giving a further boost to returns for U.S.-based investors. For the 6 months ended December 31, 2017, the MSCI Europe Index gained 8.80%.*
Meanwhile, the Bank of England raised interest rates in November amid signs of higher inflation and a strengthening U.K. economy. In December Brexit negotiators agreed on terms for the U.K.’s departure from the European Union, opening a path for trade discussions to move forward. The U.K. stock market rose 11.18% in U.S. dollar terms.
In Japan, equities rose 12.80% amid improving economic growth and Prime Minister Abe’s success in October’s snap election, a victory that gives him a better opportunity to enact his pro-defense and pro-growth plans. Japan’s economy grew for the seventh consecutive quarter, its longest streak in nearly two decades. Gross domestic product increased an annualized 2.5% in the third quarter.
| * | Unless otherwise noted, country stock returns are based on MSCI indexes, expressed in U.S. dollars, and assume the reinvestment of dividends. Results reflect dividends net of withholding taxes. |
Largest equity holdings
(as of December 31, 2017)
| Company | Country of domicile | Percent of net assets | |||
| TSMC | Taiwan | 3.4 | % | ||
| Royal Dutch Shell | United Kingdom | 2.5 | |||
| British American Tobacco | United Kingdom | 2.3 | |||
| Prudential | United Kingdom | 1.9 | |||
| AstraZeneca | United Kingdom | 1.6 | |||
| AXA | France | 1.6 | |||
| Sony | Japan | 1.5 | |||
| Nestlé | Switzerland | 1.5 | |||
| Enbridge | Canada | 1.4 | |||
| AIA Group | Hong Kong | 1.4 | |||
| 2 | International Growth and Income Fund |
Emerging markets notched some of the strongest gains of the period for U.S. investors, aided by signs of more robust growth in China, a weaker dollar, improved corporate earnings and rising prices for key commodities. Chinese stocks rose 23.39%, as its second-quarter gross domestic product of 6.9% exceeded expectations. Shares of several technology companies soared on encouraging earnings news. Elsewhere in developing markets, Indian shares advanced 15.12% as economic growth accelerated.
Brazilian shares (+20.50%) advanced on investor optimism that fiscal reforms could be enacted after lawmakers voted against requiring President Michel Temer to stand trial on corruption charges. Russian stocks soared 22.58%, supported by rising oil prices.
All market sectors recorded positive results for the period. Economically sensitive stocks generally provided stronger returns than defensive sectors. Energy, materials and information technology stocks led markets higher, the latter supported by investor enthusiasm for Apple’s new iPhone and other consumer tech products. Financial stocks also advanced on expectations for rising global interest rates. Health care, utilities and telecommunications stocks lagged the overall market.
What helped and hurt
The fund’s overall result was supported by solid positive contributions from holdings in every market sector. Basic materials stocks generated some of the best returns of the period, supported by higher prices for copper, nickel and iron ore. Shares of Glencore (+40.65%) and Rio Tinto (+24.99%) rallied as the mining giants benefited from rising global demand, particularly from China, India and other emerging markets. Solid investment selection among utilities companies also bolstered the fund’s results. While the health care and telecommunications sectors trailed the broader market return, favorable stock selection in these areas helped support the fund’s overall positive result. Investments in Russian telecommunications company Mobile TeleSystems (+21.60%) and European utilities Rubis (+24.74%) and Enel (+14.65%) generated solid gains. Pharmaceutical companies Hypermarcas (+29.33%) and AstraZeneca (+2.60%), the fund’s fifth-largest position, both advanced, but the latter trailed the broader market.
Investments in financials companies also proved to be an area of strength for the fund. Insurance companies Prudential (+12.09%), AIA group (+16.71%) and AXA (+8.35%), all top-10 holdings, rose during the period, as did Dutch bank ABN AMRO Group (+21.38%). Shares of B3, which operates the São Paulo Stock Exchange in Brazil, advanced 15.20%, bolstered by robust second-quarter results.
Select holdings of companies in the industrials sector detracted from the fund’s overall result. Aerospace and defense company BAE Systems (–6.78%) and Swiss companies Flughafen Zurich (–6.85%) and Geberit (–5.65%) all lost ground during the period.
| International Growth and Income Fund | 3 |
Where the fund’s assets were invested
Percent of net assets by country of domicile as of 12/31/17
| International Growth and Income Fund | MSCI ACWI ex USA1,2 | |||||||
| Europe | ||||||||
| Euro zone3 | 23.4 | % | 22.4 | % | ||||
| United Kingdom | 17.3 | 12.2 | ||||||
| Switzerland | 4.8 | 5.5 | ||||||
| Denmark | 2.6 | 1.3 | ||||||
| Russian Federation | 2.0 | .8 | ||||||
| Sweden | 1.4 | 1.8 | ||||||
| Other Europe | .1 | 1.2 | ||||||
| 51.6 | 45.3 | |||||||
| Asia/Pacific | ||||||||
| Japan | 6.7 | 16.5 | ||||||
| Hong Kong | 6.4 | 2.5 | ||||||
| Taiwan | 5.4 | 2.8 | ||||||
| India | 3.6 | 2.2 | ||||||
| China | 2.9 | 7.3 | ||||||
| Australia | 1.4 | 4.8 | ||||||
| Other Asia/Pacific | 3.9 | 6.8 | ||||||
| 30.3 | 42.8 | |||||||
| The Americas | ||||||||
| Canada | 4.2 | 6.6 | ||||||
| Brazil | 3.5 | 1.7 | ||||||
| United States | 2.9 | — | ||||||
| Mexico | .5 | .7 | ||||||
| Other Americas | — | .5 | ||||||
| 11.1 | 9.5 | |||||||
| Other | ||||||||
| South Africa | .6 | 1.8 | ||||||
| Other countries | — | .6 | ||||||
| .6 | 2.4 | |||||||
| Bonds, notes & other debt instruments, short-term securities & other assets less liabilities | 6.4 | — | ||||||
| Total | 100.0 | % | 100.0 | % | ||||
| 1 | Totals may not add to 100% due to rounding. |
| 2 | The MSCI ACWI (All Country World Index) ex USA is weighted by market capitalization. |
| 3 | Countries using the euro as a common currency: Austria, Belgium, Cyprus, Estonia, Finland, France, Germany, Greece, Ireland, Italy, Latvia, Lithuania, Luxembourg, Malta, the Netherlands, Portugal, Slovakia, Slovenia and Spain. |
| 4 | International Growth and Income Fund |
Results for positions in information technology were generally positive but proved to be a drag on the fund’s overall return relative to the market. Semiconductor maker TSMC, the fund’s top holding, rose 12.11% after the company beat earnings forecasts and revenue jumped in part due to new mobile product launches and strong overall demand for components. However, Japanese electronic components maker Murata Manufacturing slid 11.93% after the company lowered its full-year earnings forecasts, citing a substantial increase in production costs amid delays as well as technical and market challenges. Results in the energy sector were also mixed. Royal Dutch Shell, the fund’s second-largest investment, rose 25.57%, but no. 9 holding Enbridge fell 1.83%.
Elsewhere among the fund’s top 10 holdings, gaming and electronics manufacturer Sony Corporation rose 17.88% after earnings and revenue rose on robust sales of PlayStation gaming consoles, televisions and image sensors. Third-largest holding British American Tobacco (–1.00%) and Swiss food and beverage maker Nestlé (–1.26%), the fund’s eighth-largest position, both posted modest declines.
Looking forward
The economic landscape has brightened considerably over the past year, with most major economies gaining strength. We believe this synchronized global expansion can continue well into 2018. Europe appears particularly compelling as the recovery spreads across the continent. The U.S., supported by the recent passage of business-friendly tax reforms, and Japan, bolstered by the re-election of Prime Minister Abe, also continue to gain strength. Developing countries are benefiting from rising commodities prices and a healthy demand for technology-related components and services.
With regard to markets, equity valuations have risen across most markets, but valuations outside the U.S., particularly in emerging markets and some areas of Europe, still remain relatively attractive. Given the generally elevated level of valuations, however, we are mindful to guard against complacency while taking care not to overreact to inevitable bouts of market volatility. Much of the market leadership in recent months has been concentrated largely on growth-oriented technology and consumer discretionary firms. Inevitably market leadership will shift. We remain confident that the fund’s value orientation and focus on established dividend-paying companies can generate superior returns over the long term.
We thank you for your continued support and look forward to reporting back to you at the end of the fiscal year.
Cordially,
 |  | |
| Steven T. Watson Vice Chairman of the Board | Andrew B. Suzman President |
February 9, 2018
For current information about the fund, visit americanfunds.com.
| International Growth and Income Fund | 5 |
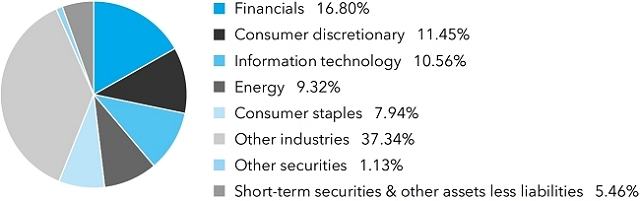
| Summary investment portfolio December 31, 2017 | unaudited |
| Industry sector diversification | Percent of net assets |
| Country diversification by domicile | Percent of net assets | |||
| Euro zone* | 23.39 | % | ||
| United Kingdom | 17.28 | |||
| Japan | 6.72 | |||
| Hong Kong | 6.41 | |||
| Taiwan | 5.40 | |||
| Switzerland | 4.75 | |||
| Canada | 4.19 | |||
| India | 3.61 | |||
| Brazil | 3.51 | |||
| Other countries | 18.37 | |||
| Bonds, notes & other debt instruments, short-term securities & other assets less liabilities | 6.37 | |||
| * | Countries using the euro as a common currency; those represented in the fund’s portfolio are Finland, France, Germany, Greece, Ireland, Italy, the Netherlands, Portugal and Spain. |
| Common stocks 93.41% | Shares | Value (000) | ||||||
| Financials 16.80% | ||||||||
| Prudential PLC1 | 10,199,572 | $ | 262,233 | |||||
| AXA SA1 | 7,426,800 | 220,119 | ||||||
| AIA Group Ltd.1 | 23,543,600 | 200,787 | ||||||
| Banco Santander, SA1 | 24,724,725 | 162,129 | ||||||
| Société Générale1 | 3,075,400 | 158,560 | ||||||
| BM&FBOVESPA SA - Bolsa de Valores, Mercadorias e Futuros, ordinary nominative | 20,725,000 | 142,328 | ||||||
| HDFC Bank Ltd.1 | 2,396,694 | 70,874 | ||||||
| HDFC Bank Ltd. (ADR) | 498,707 | 50,704 | ||||||
| BNP Paribas SA1 | 1,501,000 | 111,935 | ||||||
| ABN AMRO Group NV, depository receipts1 | 3,213,437 | 103,402 | ||||||
| Svenska Handelsbanken AB, Class A1 | 6,307,000 | 86,094 | ||||||
| Other securities | 807,664 | |||||||
| 2,376,829 | ||||||||
| 6 | International Growth and Income Fund |
| Shares | Value (000) | |||||||
| Consumer discretionary 11.45% | ||||||||
| Sony Corp.1 | 4,870,000 | $ | 218,756 | |||||
| MGM China Holdings, Ltd.1 | 60,772,800 | 183,829 | ||||||
| Wynn Macau, Ltd.1 | 42,474,000 | 133,819 | ||||||
| Other securities | 1,083,653 | |||||||
| 1,620,057 | ||||||||
| Information technology 10.56% | ||||||||
| Taiwan Semiconductor Manufacturing Co., Ltd.1 | 63,370,506 | 486,943 | ||||||
| Nintendo Co., Ltd.1 | 471,800 | 171,760 | ||||||
| Vanguard International Semiconductor Corp.1 | 62,262,000 | 137,746 | ||||||
| Samsung Electronics Co., Ltd.1 | 48,700 | 115,703 | ||||||
| AAC Technologies Holdings Inc.1 | 5,894,000 | 104,822 | ||||||
| ASML Holding NV1 | 597,500 | 103,659 | ||||||
| Other securities | 372,786 | |||||||
| 1,493,419 | ||||||||
| Energy 9.32% | ||||||||
| Royal Dutch Shell PLC, Class B1 | 9,964,300 | 336,065 | ||||||
| Royal Dutch Shell PLC, Class B (ADR) | 180,000 | 12,292 | ||||||
| Royal Dutch Shell PLC, Class A1 | 209,458 | 7,012 | ||||||
| Royal Dutch Shell PLC, Class A (ADR) | 3,291 | 220 | ||||||
| Enbridge Inc. (CAD denominated) | 5,028,416 | 196,656 | ||||||
| Enbridge Inc. (CAD denominated)1,2 | 133,054 | 5,100 | ||||||
| Reliance Industries Ltd.1 | 12,123,000 | 174,893 | ||||||
| Schlumberger Ltd. | 2,308,000 | 155,536 | ||||||
| TOTAL SA1 | 2,409,296 | 132,934 | ||||||
| Pembina Pipeline Corp. | 2,981,591 | 107,949 | ||||||
| Other securities | 190,068 | |||||||
| 1,318,725 | ||||||||
| Consumer staples 7.94% | ||||||||
| British American Tobacco PLC1 | 4,906,300 | 331,128 | ||||||
| Nestlé SA1 | 2,393,700 | 205,696 | ||||||
| Booker Group PLC1 | 40,453,000 | 124,545 | ||||||
| Kao Corp.1 | 1,438,750 | 97,314 | ||||||
| Other securities | 364,316 | |||||||
| 1,122,999 | ||||||||
| Industrials 7.89% | ||||||||
| Airbus SE, non-registered shares1 | 1,504,900 | 149,445 | ||||||
| International Consolidated Airlines Group, SA (CDI)1 | 14,485,000 | 127,045 | ||||||
| BAE Systems PLC1 | 16,170,000 | 124,367 | ||||||
| Flughafen Zürich AG1 | 488,700 | 111,750 | ||||||
| Other securities | 603,144 | |||||||
| 1,115,751 | ||||||||
| Materials 7.41% | ||||||||
| Rio Tinto PLC1 | 3,515,000 | 185,512 | ||||||
| Glencore PLC1 | 28,936,856 | 152,245 | ||||||
| Koninklijke DSM NV1 | 1,130,000 | 107,717 | ||||||
| James Hardie Industries PLC (CDI)1 | 5,265,000 | 92,684 | ||||||
| Vale SA, ordinary nominative (ADR) | 4,090,000 | 50,021 | ||||||
| International Growth and Income Fund | 7 |
| Common stocks (continued) | Shares | Value (000) | ||||||
| Materials (continued) | ||||||||
| Vale SA, ordinary nominative | 3,475,037 | $ | 42,177 | |||||
| Air Liquide SA1 | 485,224 | 61,027 | ||||||
| Air Liquide SA, bonus shares1 | 221,127 | 27,812 | ||||||
| Other securities | 329,511 | |||||||
| 1,048,706 | ||||||||
| Utilities 5.89% | ||||||||
| Ørsted AS1 | 2,959,930 | 161,259 | ||||||
| Enel SPA1 | 25,834,334 | 158,793 | ||||||
| Rubis SCA1 | 1,683,037 | 118,986 | ||||||
| Other securities | 393,829 | |||||||
| 832,867 | ||||||||
| Health care 4.95% | ||||||||
| AstraZeneca PLC1 | 3,248,000 | 222,887 | ||||||
| Bayer AG1 | 777,500 | 96,702 | ||||||
| Hypermarcas SA, ordinary nominative | 8,200,000 | 88,993 | ||||||
| Other securities | 291,682 | |||||||
| 700,264 | ||||||||
| Telecommunication services 3.95% | ||||||||
| Vodafone Group PLC1 | 61,795,000 | 195,215 | ||||||
| Mobile TeleSystems PJSC (ADR) | 9,208,000 | 93,829 | ||||||
| Other securities | 269,679 | |||||||
| 558,723 | ||||||||
| Real estate 2.44% | ||||||||
| Link REIT1 | 17,712,152 | 164,131 | ||||||
| Other securities | 181,829 | |||||||
| 345,960 | ||||||||
| Miscellaneous 4.81% | ||||||||
| Other common stocks in initial period of acquisition | 680,552 | |||||||
| Total common stocks (cost: $10,265,851,000) | 13,214,852 | |||||||
| Preferred securities 0.22% | ||||||||
| Financials 0.22% | ||||||||
| Other securities | 31,209 | |||||||
| Total preferred securities (cost: $30,265,000) | 31,209 | |||||||
| Convertible bonds 0.46% | Principal amount (000) | |||||||
| Health care 0.33% | ||||||||
| Bayer AG, convertible notes, 5.625% 2019 | € | 34,700 | 46,894 | |||||
| Financials 0.13% | ||||||||
| Other securities | 18,202 | |||||||
| Total convertible bonds (cost: $57,678,000) | 65,096 | |||||||
| 8 | International Growth and Income Fund |
| Bonds, notes & other debt instruments 0.45% | Principal amount (000) | Value (000) | ||||||
| U.S. Treasury bonds & notes 0.07% | ||||||||
| U.S. Treasury 0.07% | ||||||||
| Other securities | $ | 9,992 | ||||||
| Other bonds & notes 0.38% | ||||||||
| Other securities | 53,582 | |||||||
| Total bonds, notes & other debt instruments (cost: $58,233,000) | 63,574 | |||||||
| Short-term securities 5.42% | ||||||||
| BNP Paribas, New York Branch 1.41% due 2/8/2018 | $ | 34,600 | 34,540 | |||||
| Federal Home Loan Bank 1.13%–1.30% due 1/16/2018–2/28/2018 | 108,800 | 108,647 | ||||||
| Svenska Handelsbanken Inc. 1.29%–1.32% due 1/3/2018–1/25/20182 | 141,300 | 141,230 | ||||||
| U.S. Treasury Bills 1.41%–1.55% due 5/31/2018–11/8/2018 | 110,700 | 109,546 | ||||||
| Other securities | 373,116 | |||||||
| Total short-term securities (cost: $767,221,000) | 767,079 | |||||||
| Total investment securities 99.96% (cost: $11,179,248,000) | 14,141,810 | |||||||
| Other assets less liabilities 0.04% | 5,053 | |||||||
| Net assets 100.00% | $ | 14,146,863 | ||||||
This summary investment portfolio is designed to streamline the report and help investors better focus on the fund’s principal holdings. See the inside back cover for details on how to obtain a complete schedule of portfolio holdings.
As permitted by U.S. Securities and Exchange Commission regulations, “Miscellaneous” securities include holdings in their first year of acquisition that have not previously been publicly disclosed.
“Other securities” includes all issues that are not disclosed separately in the summary investment portfolio.
| International Growth and Income Fund | 9 |
Forward currency contracts
| Contract amount | Unrealized (depreciation) appreciation | |||||||||
| Purchases (000) | Sales (000) | Counterparty | Settlement date | at 12/31/2017 (000) | ||||||
| USD4,103 | JPY465,000 | JPMorgan Chase | 1/10/2018 | $(27 | ) | |||||
| USD10,355 | JPY1,162,000 | Bank of America, N.A. | 1/22/2018 | 29 | ||||||
| USD4,145 | JPY465,000 | UBS AG | 2/23/2018 | 8 | ||||||
| $ 10 | ||||||||||
The following footnotes apply to either the individual securities noted or one or more of the securities aggregated and listed as a single line item.
| 1 | Valued under fair value procedures adopted by authority of the board of trustees. The total value of all such securities, including those in “Miscellaneous” and “Other securities,” was $11,333,904,000, which represented 80.12% of the net assets of the fund. This amount includes $11,169,091,000 related to certain securities trading outside the U.S. whose values were adjusted as a result of significant market movements following the close of local trading. |
| 2 | Acquired in a transaction exempt from registration under Rule 144A or Section 4(2) of the Securities Act of 1933. May be resold in the U.S. in transactions exempt from registration, normally to qualified institutional buyers. The total value of all such securities was $507,878,000, which represented 3.59% of the net assets of the fund. |
Key to abbreviations and symbols
ADR = American Depositary Receipts
CAD = Canadian dollars
CDI = CREST Depository Interest
€ = Euros
JPY = Japanese yen
USD/$ = U.S. dollars
See Notes to Financial Statements
| 10 | International Growth and Income Fund |
Financial statements
| Statement of assets and liabilities | unaudited | |||||||
| at December 31, 2017 | (dollars in thousands) | |||||||
| Assets: | ||||||||
| Investment securities in unaffiliated issuers, at value (cost: $11,179,248) | $ | 14,141,810 | ||||||
| Cash | 1,259 | |||||||
| Cash denominated in currencies other than U.S. dollars (cost: $1,213) | 1,213 | |||||||
| Unrealized appreciation on open forward currency contracts | 37 | |||||||
| Receivables for: | ||||||||
| Sales of fund’s shares | $ | 32,713 | ||||||
| Dividends and interest | 39,510 | |||||||
| Other | 888 | 73,111 | ||||||
| 14,217,430 | ||||||||
| Liabilities: | ||||||||
| Unrealized depreciation on open forward currency contracts | 27 | |||||||
| Payables for: | ||||||||
| Purchases of investments | 36,310 | |||||||
| Repurchases of fund’s shares | 11,246 | |||||||
| Investment advisory services | 5,667 | |||||||
| Services provided by related parties | 2,368 | |||||||
| Trustees’ deferred compensation | 2,237 | |||||||
| Non-U.S. taxes | 12,515 | |||||||
| Other | 197 | 70,540 | ||||||
| Net assets at December 31, 2017 | $ | 14,146,863 | ||||||
| Net assets consist of: | ||||||||
| Capital paid in on shares of beneficial interest | $ | 12,181,182 | ||||||
| Distributions in excess of net investment income | (34,203 | ) | ||||||
| Accumulated net realized loss | (952,352 | ) | ||||||
| Net unrealized appreciation | 2,952,236 | |||||||
| Net assets at December 31, 2017 | $ | 14,146,863 | ||||||
See Notes to Financial Statements
| International Growth and Income Fund | 11 |
(dollars and shares in thousands, except per-share amounts)
Shares of beneficial interest issued and outstanding (no stated par value) —
unlimited shares authorized (404,449 total shares outstanding)
| Shares | Net asset value | |||||||||||
| Net assets | outstanding | per share | ||||||||||
| Class A | $ | 5,121,661 | 146,415 | $ | 34.98 | |||||||
| Class C | 268,955 | 7,710 | 34.89 | |||||||||
| Class T | 12 | — | * | 34.98 | ||||||||
| Class F-1 | 334,196 | 9,546 | 35.01 | |||||||||
| Class F-2 | 2,675,122 | 76,445 | 34.99 | |||||||||
| Class F-3 | 2,268,707 | 64,879 | 34.97 | |||||||||
| Class 529-A | 154,765 | 4,430 | 34.94 | |||||||||
| Class 529-C | 31,274 | 900 | 34.76 | |||||||||
| Class 529-E | 5,534 | 158 | 34.93 | |||||||||
| Class 529-T | 12 | — | * | 34.98 | ||||||||
| Class 529-F-1 | 17,867 | 511 | 34.98 | |||||||||
| Class R-1 | 4,026 | 115 | 34.89 | |||||||||
| Class R-2 | 59,942 | 1,722 | 34.80 | |||||||||
| Class R-2E | 2,971 | 85 | 34.84 | |||||||||
| Class R-3 | 71,006 | 2,034 | 34.91 | |||||||||
| Class R-4 | 90,354 | 2,585 | 34.96 | |||||||||
| Class R-5E | 288 | 8 | 34.95 | |||||||||
| Class R-5 | 34,775 | 989 | 35.16 | |||||||||
| Class R-6 | 3,005,396 | 85,917 | 34.98 | |||||||||
| * | Amount less than one thousand. |
See Notes to Financial Statements
| 12 | International Growth and Income Fund |
| Statement of operations | unaudited | |||||||
| for the six months ended December 31, 2017 | (dollars in thousands) | |||||||
| Investment income: | ||||||||
| Income: | ||||||||
| Dividends (net of non-U.S. taxes of $8,531) | $ | 143,415 | ||||||
| Interest | 9,877 | $ | 153,292 | |||||
| Fees and expenses*: | ||||||||
| Investment advisory services | 32,388 | |||||||
| Distribution services | 9,231 | |||||||
| Transfer agent services | 5,244 | |||||||
| Administrative services | 2,376 | |||||||
| Reports to shareholders | 350 | |||||||
| Registration statement and prospectus | 591 | |||||||
| Trustees’ compensation | 336 | |||||||
| Auditing and legal | 37 | |||||||
| Custodian | 1,786 | |||||||
| Other | 201 | 52,540 | ||||||
| Net investment income | 100,752 | |||||||
| Net realized gain and unrealized appreciation: | ||||||||
| Net realized gain (loss) on: | ||||||||
| Investments in unaffiliated issuers | 138,989 | |||||||
| Forward currency contracts | (108 | ) | ||||||
| Currency transactions | (2,626 | ) | 136,255 | |||||
| Net unrealized appreciation (depreciation) on: | ||||||||
| Investments in unaffiliated issuers (net of non-U.S. taxes of $11,221) | 1,041,089 | |||||||
| Forward currency contracts | (128 | ) | ||||||
| Currency translations | 163 | 1,041,124 | ||||||
| Net realized gain and unrealized appreciation | 1,177,379 | |||||||
| Net increase in net assets resulting from operations | $ | 1,278,131 | ||||||
| * | Additional information related to class-specific fees and expenses is included in the Notes to Financial Statements. |
See Notes to Financial Statements
| International Growth and Income Fund | 13 |
Statements of changes in net assets
(dollars in thousands)
| Six months ended | Year ended | |||||||
| December 31, | June 30, | |||||||
| 2017* | 2017 | |||||||
| Operations: | ||||||||
| Net investment income | $ | 100,752 | $ | 252,614 | ||||
| Net realized gain (loss) | 136,255 | (129,372 | ) | |||||
| Net unrealized appreciation | 1,041,124 | 1,746,918 | ||||||
| Net increase in net assets resulting from operations | 1,278,131 | 1,870,160 | ||||||
| Dividends paid to shareholders from net investment income | (109,160 | ) | (268,092 | ) | ||||
| Net capital share transactions | 437,943 | 409,937 | ||||||
| Total increase in net assets | 1,606,914 | 2,012,005 | ||||||
| Net assets: | ||||||||
| Beginning of period | 12,539,949 | 10,527,944 | ||||||
| End of period (including distributions in excess of net investment income: $(34,203) and $(25,795), respectively) | $ | 14,146,863 | $ | 12,539,949 | ||||
| * | Unaudited. |
See Notes to Financial Statements
| 14 | International Growth and Income Fund |
| Notes to financial statements | unaudited |
1. Organization
International Growth and Income Fund (the “fund”) is registered under the Investment Company Act of 1940 as an open-end, diversified management investment company. The fund seeks to provide long-term growth of capital while providing current income.
The fund has 19 share classes consisting of six retail share classes (Classes A, C, T, F-1, F-2 and F-3), five 529 college savings plan share classes (Classes 529-A, 529-C, 529-E, 529-T and 529-F-1) and eight retirement plan share classes (Classes R-1, R-2, R-2E, R-3, R-4, R-5E, R-5 and R-6). The 529 college savings plan share classes can be used to save for college education. The retirement plan share classes are generally offered only through eligible employer-sponsored retirement plans. The fund’s share classes are described further in the following table:
| Share class | Initial sales charge | Contingent deferred sales charge upon redemption | Conversion feature | ||||
| Classes A and 529-A | Up to 5.75% | None (except 1% for certain redemptions within one year of purchase without an initial sales charge1) | None | ||||
| Class C | None | 1% for redemptions within one year of purchase | Class C converts to Class F-1 after 10 years | ||||
| Class 529-C | None | 1% for redemptions within one year of purchase | Class 529-C converts to Class 529-A after 10 years2 | ||||
| Class 529-E | None | None | None | ||||
| Classes T and 529-T3 | Up to 2.50% | None | None | ||||
| Classes F-1, F-2, F-3 and 529-F-1 | None | None | None | ||||
| Classes R-1, R-2, R-2E, R-3, R-4, R-5E, R-5 and R-6 | None | None | None |
| 1 | 18 months for shares purchased on or after August 14, 2017. |
| 2 | Effective December 1, 2017. |
| 3 | Class T and 529-T shares are not available for purchase. |
Holders of all share classes have equal pro rata rights to the assets, dividends and liquidation proceeds of the fund. Each share class has identical voting rights, except for the exclusive right to vote on matters affecting only its class. Share classes have different fees and expenses (“class-specific fees and expenses”), primarily due to different arrangements for distribution, transfer agent and administrative services. Differences in class-specific fees and expenses will result in differences in net investment income and, therefore, the payment of different per-share dividends by each share class.
| International Growth and Income Fund | 15 |
2. Significant accounting policies
The fund is an investment company that applies the accounting and reporting guidance issued in Topic 946 by the U.S. Financial Accounting Standards Board. The fund’s financial statements have been prepared to comply with U.S. generally accepted accounting principles (“U.S. GAAP”). These principles require the fund’s investment adviser to make estimates and assumptions that affect reported amounts and disclosures. Actual results could differ from those estimates. Subsequent events, if any, have been evaluated through the date of issuance in the preparation of the financial statements. The fund follows the significant accounting policies described in this section, as well as the valuation policies described in the next section on valuation.
Security transactions and related investment income — Security transactions are recorded by the fund as of the date the trades are executed with brokers. Realized gains and losses from security transactions are determined based on the specific identified cost of the securities. In the event a security is purchased with a delayed payment date, the fund will segregate liquid assets sufficient to meet its payment obligations. Dividend income is recognized on the ex-dividend date and interest income is recognized on an accrual basis. Market discounts, premiums and original issue discounts on fixed-income securities are amortized daily over the expected life of the security.
Class allocations — Income, fees and expenses (other than class-specific fees and expenses) and realized and unrealized gains and losses are allocated daily among the various share classes based on their relative net assets. Class-specific fees and expenses, such as distribution, transfer agent and administrative services, are charged directly to the respective share class.
Dividends and distributions to shareholders — Dividends and distributions to shareholders are recorded on the ex-dividend date.
Currency translation — Assets and liabilities, including investment securities, denominated in currencies other than U.S. dollars are translated into U.S. dollars at the exchange rates supplied by one or more pricing vendors on the valuation date. Purchases and sales of investment securities and income and expenses are translated into U.S. dollars at the exchange rates on the dates of such transactions. The effects of changes in exchange rates on investment securities are included with the net realized gain or loss and net unrealized appreciation or depreciation on investments in the fund’s statement of operations. The realized gain or loss and unrealized appreciation or depreciation resulting from all other transactions denominated in currencies other than U.S. dollars are disclosed separately.
3. Valuation
Capital Research and Management Company (“CRMC”), the fund’s investment adviser, values the fund’s investments at fair value as defined by U.S. GAAP. The net asset value of each share class of the fund is generally determined as of approximately 4:00 p.m. New York time each day the New York Stock Exchange is open.
| 16 | International Growth and Income Fund |
Methods and inputs — The fund’s investment adviser uses the following methods and inputs to establish the fair value of the fund’s assets and liabilities. Use of particular methods and inputs may vary over time based on availability and relevance as market and economic conditions evolve.
Equity securities are generally valued at the official closing price of, or the last reported sale price on, the exchange or market on which such securities are traded, as of the close of business on the day the securities are being valued or, lacking any sales, at the last available bid price. Prices for each security are taken from the principal exchange or market on which the security trades.
Fixed-income securities, including short-term securities, are generally valued at prices obtained from one or more pricing vendors. Vendors value such securities based on one or more of the inputs described in the following table. The table provides examples of inputs that are commonly relevant for valuing particular classes of fixed-income securities in which the fund is authorized to invest. However, these classifications are not exclusive, and any of the inputs may be used to value any other class of fixed-income security.
| Fixed-income class | Examples of standard inputs |
| All | Benchmark yields, transactions, bids, offers, quotations from dealers and trading systems, new issues, spreads and other relationships observed in the markets among comparable securities; and proprietary pricing models such as yield measures calculated using factors such as cash flows, financial or collateral performance and other reference data (collectively referred to as “standard inputs”) |
| Corporate bonds & notes; convertible securities | Standard inputs and underlying equity of the issuer |
| Bonds & notes of governments & government agencies | Standard inputs and interest rate volatilities |
| Mortgage-backed; asset-backed obligations | Standard inputs and cash flows, prepayment information, default rates, delinquency and loss assumptions, collateral characteristics, credit enhancements and specific deal information |
When the fund’s investment adviser deems it appropriate to do so (such as when vendor prices are unavailable or deemed to be not representative), fixed-income securities will be valued in good faith at the mean quoted bid and ask prices that are reasonably and timely available (or bid prices, if ask prices are not available) or at prices for securities of comparable maturity, quality and type.
Securities with both fixed-income and equity characteristics, or equity securities traded principally among fixed-income dealers, are generally valued in the manner described for either equity or fixed-income securities, depending on which method is deemed most appropriate by the fund’s investment adviser. Forward currency contracts are valued at the mean of representative quoted bid and ask prices, generally based on prices supplied by one or more pricing vendors.
| International Growth and Income Fund | 17 |
Securities and other assets for which representative market quotations are not readily available or are considered unreliable by the fund’s investment adviser are fair valued as determined in good faith under fair valuation guidelines adopted by authority of the fund’s board of trustees as further described. The investment adviser follows fair valuation guidelines, consistent with U.S. Securities and Exchange Commission rules and guidance, to consider relevant principles and factors when making fair value determinations. The investment adviser considers relevant indications of value that are reasonably and timely available to it in determining the fair value to be assigned to a particular security, such as the type and cost of the security; contractual or legal restrictions on resale of the security; relevant financial or business developments of the issuer; actively traded similar or related securities; conversion or exchange rights on the security; related corporate actions; significant events occurring after the close of trading in the security; and changes in overall market conditions. In addition, the closing prices of equity securities that trade in markets outside U.S. time zones may be adjusted to reflect significant events that occur after the close of local trading but before the net asset value of each share class of the fund is determined. Fair valuations and valuations of investments that are not actively trading involve judgment and may differ materially from valuations that would have been used had greater market activity occurred.
Processes and structure — The fund’s board of trustees has delegated authority to the fund’s investment adviser to make fair value determinations, subject to board oversight. The investment adviser has established a Joint Fair Valuation Committee (the “Fair Valuation Committee”) to administer, implement and oversee the fair valuation process, and to make fair value decisions. The Fair Valuation Committee regularly reviews its own fair value decisions, as well as decisions made under its standing instructions to the investment adviser’s valuation teams. The Fair Valuation Committee reviews changes in fair value measurements from period to period and may, as deemed appropriate, update the fair valuation guidelines to better reflect the results of back testing and address new or evolving issues. The Fair Valuation Committee reports any changes to the fair valuation guidelines to the board of trustees with supplemental information to support the changes. The fund’s board and audit committee also regularly review reports that describe fair value determinations and methods.
The fund’s investment adviser has also established a Fixed-Income Pricing Review Group to administer and oversee the fixed-income valuation process, including the use of fixed-income pricing vendors. This group regularly reviews pricing vendor information and market data. Pricing decisions, processes and controls over security valuation are also subject to additional internal reviews, including an annual control self-evaluation program facilitated by the investment adviser’s compliance group.
Classifications — The fund’s investment adviser classifies the fund’s assets and liabilities into three levels based on the inputs used to value the assets or liabilities. Level 1 values are based on quoted prices in active markets for identical securities. Level 2 values are based on significant observable market inputs, such as quoted prices for similar securities and quoted prices in inactive markets. Certain securities trading outside the U.S. may transfer between Level 1 and Level 2 due to valuation adjustments resulting from
| 18 | International Growth and Income Fund |
significant market movements following the close of local trading. Level 3 values are based on significant unobservable inputs that reflect the investment adviser’s determination of assumptions that market participants might reasonably use in valuing the securities. The valuation levels are not necessarily an indication of the risk or liquidity associated with the underlying investment. For example, U.S. government securities are reflected as Level 2 because the inputs used to determine fair value may not always be quoted prices in an active market. The following tables present the fund’s valuation levels as of December 31, 2017 (dollars in thousands):
| Investment securities | ||||||||||||||||
| Level 1 | Level 2* | Level 3 | Total | |||||||||||||
| Assets: | ||||||||||||||||
| Common stocks: | ||||||||||||||||
| Financials | $ | 273,186 | $ | 2,103,643 | $ | — | $ | 2,376,829 | ||||||||
| Consumer discretionary | 139,253 | 1,480,804 | — | 1,620,057 | ||||||||||||
| Information technology | 38,797 | 1,454,622 | — | 1,493,419 | ||||||||||||
| Energy | 529,730 | 788,995 | — | 1,318,725 | ||||||||||||
| Consumer staples | 149,254 | 973,745 | — | 1,122,999 | ||||||||||||
| Industrials | 157,389 | 958,362 | — | 1,115,751 | ||||||||||||
| Materials | 183,923 | 864,783 | — | 1,048,706 | ||||||||||||
| Utilities | 179,533 | 653,334 | — | 832,867 | ||||||||||||
| Health care | 88,993 | 611,271 | — | 700,264 | ||||||||||||
| Telecommunication services | 93,829 | 464,894 | — | 558,723 | ||||||||||||
| Real estate | 47,061 | 298,899 | — | 345,960 | ||||||||||||
| Miscellaneous | — | 680,552 | — | 680,552 | ||||||||||||
| Preferred securities | 31,209 | — | — | 31,209 | ||||||||||||
| Convertible bonds | — | 65,096 | — | 65,096 | ||||||||||||
| Bonds, notes & other debt instruments | — | 63,574 | — | 63,574 | ||||||||||||
| Short-term securities | — | 767,079 | — | 767,079 | ||||||||||||
| Total | $ | 1,912,157 | $ | 12,229,653 | $ | — | $ | 14,141,810 | ||||||||
| Other investments† | ||||||||||||||||
| Level 1 | Level 2 | Level 3 | Total | |||||||||||||
| Assets: | ||||||||||||||||
| Unrealized appreciation on open forward currency contracts | $ | — | $ | 37 | $ | — | $ | 37 | ||||||||
| Liabilities: | ||||||||||||||||
| Unrealized depreciation on open forward currency contracts | — | (27 | ) | — | (27 | ) | ||||||||||
| Total | $ | — | $ | 10 | $ | — | $ | 10 | ||||||||
| * | Securities with a value of $9,862,490,000, which represented 69.72% of the net assets of the fund, transferred from Level 1 to Level 2 since the prior fiscal year-end, primarily due to significant market movements following the close of local trading. |
| † | Forward currency contracts are not included in the investment portfolio. |
| International Growth and Income Fund | 19 |
4. Risk factors
Investing in the fund may involve certain risks including, but not limited to, those described below.
Market conditions — The prices of, and the income generated by, the common stocks and other securities held by the fund may decline — sometimes rapidly or unpredictably — due to various factors, including events or conditions affecting the general economy or particular industries; overall market changes; local, regional or global political, social or economic instability; governmental or governmental agency responses to economic conditions; and currency exchange rate, interest rate and commodity price fluctuations.
Issuer risks — The prices of, and the income generated by, securities held by the fund may decline in response to various factors directly related to the issuers of such securities, including reduced demand for an issuer’s goods or services, poor management performance and strategic initiatives such as mergers, acquisitions or dispositions and the market response to any such initiatives.
Investing outside the U.S. — Securities of issuers domiciled outside the U.S., or with significant operations or revenues outside the U.S., may lose value because of adverse political, social, economic or market developments (including social instability, regional conflicts, terrorism and war) in the countries or regions in which the issuers operate or generate revenue. These securities may also lose value due to changes in foreign currency exchange rates against the U.S. dollar and/or currencies of other countries. Issuers of these securities may be more susceptible to actions of foreign governments, such as the imposition of price controls or punitive taxes, that could adversely impact the value of these securities. Securities markets in certain countries may be more volatile and/or less liquid than those in the U.S. Investments outside the U.S. may also be subject to different accounting practices and different regulatory, legal and reporting standards and practices, and may be more difficult to value, than those in the U.S. In addition, the value of investments outside the U.S. may be reduced by foreign taxes, including foreign withholding taxes on interest and dividends. Further, there may be increased risks of delayed settlement of securities purchased or sold by the fund. The risks of investing outside the U.S. may be heightened in connection with investments in emerging markets.
Investing in emerging markets — Investing in emerging markets may involve risks in addition to and greater than those generally associated with investing in the securities markets of developed countries. For instance, developing countries may have less developed legal and accounting systems than those in developed countries. The governments of these countries may be less stable and more likely to impose capital controls, nationalize a company or industry, place restrictions on foreign ownership and on withdrawing sale proceeds of securities from the country, and/or impose punitive taxes that could adversely affect the prices of securities. In addition, the economies of these countries may be dependent on relatively few industries that are more susceptible to local and global changes. Securities markets in these countries can also be relatively small and have substantially lower trading volumes. As a result, securities issued in these
| 20 | International Growth and Income Fund |
countries may be more volatile and less liquid, and may be more difficult to value, than securities issued in countries with more developed economies and/or markets. Less certainty with respect to security valuations may lead to additional challenges and risks in calculating the fund’s net asset value. Additionally, there may be increased settlement risks for transactions in local securities.
Investing in growth-oriented stocks — Growth-oriented common stocks and other equity-type securities (such as preferred stocks, convertible preferred stocks and convertible bonds) may involve larger price swings and greater potential for loss than other types of investments.
Investing in income-oriented stocks — Income provided by the fund may be reduced by changes in the dividend policies of, and the capital resources available for dividend payments at, the companies in which the fund invests.
Management — The investment adviser to the fund actively manages the fund’s investments. Consequently, the fund is subject to the risk that the methods and analyses employed by the investment adviser in this process may not produce the desired results. This could cause the fund to lose value or its investment results to lag relevant benchmarks or other funds with similar objectives.
5. Certain investment techniques
Forward currency contracts — The fund has entered into forward currency contracts, which represent agreements to exchange currencies on specific future dates at predetermined rates. The fund’s investment adviser uses forward currency contracts to manage the fund’s exposure to changes in exchange rates. Upon entering into these contracts, risks may arise from the potential inability of counterparties to meet the terms of their contracts and from possible movements in exchange rates.
On a daily basis, the fund’s investment adviser values forward currency contracts and records unrealized appreciation or depreciation for open forward currency contracts in the fund’s statement of assets and liabilities. Realized gains or losses are recorded at the time the forward currency contract is closed or offset by another contract with the same broker for the same settlement date and currency.
Closed forward currency contracts that have not reached their settlement date are included in the respective receivables or payables for closed forward currency contracts in the fund’s statement of assets and liabilities. Net realized gains or losses from closed forward currency contracts and net unrealized appreciation or depreciation from open forward currency contracts are recorded in the fund’s statement of operations. The average month-end notional amount of open forward currency contracts while held was $63,232,000.
| International Growth and Income Fund | 21 |
The following tables present the financial statement impacts resulting from the fund’s use of forward currency contracts as of, or for the six months ended, December 31, 2017 (dollars in thousands):
| Assets | Liabilities | ||||||||||
| Contracts | Risk type | Location on statement of assets and liabilities | Value | Location on statement of assets and liabilities | Value | ||||||
| Forward currency | Currency | Unrealized appreciation on open forward currency contracts | $ | 37 | Unrealized depreciation on open forward currency contracts | $ | 27 | ||||
| Net realized loss | Net unrealized depreciation | ||||||||||
| Contracts | Risk type | Location on statement of operations | Value | Location on statement of operations | Value | ||||||
| Forward currency | Currency | Net realized loss on forward currency contracts | $ | (108 | ) | Net unrealized depreciation on forward currency contracts | $ | (128 | ) | ||
Collateral — The fund participates in a collateral program due to its use of forward currency contracts. The program calls for the fund to either receive or pledge highly liquid assets, such as cash or U.S. Treasury bills, as collateral based on the net gain or loss on unsettled forward currency contracts by counterparty. The purpose of the collateral is to cover potential losses that could occur in the event that either party cannot meet its contractual obligations.
Rights of offset — The fund has entered into enforceable master netting agreements with certain counterparties for forward currency contracts, where on any date amounts payable by each party to the other (in the same currency with respect to the same transaction) may be closed or offset by each party’s payment obligation. If an early termination date occurs under these agreements following an event of default or termination event, all obligations of each party to its counterparty are settled net through a single payment in a single currency (“close-out netting”). For financial reporting purposes, the fund does not offset financial assets and financial liabilities that are subject to these master netting arrangements in the statement of assets and liabilities.
| 22 | International Growth and Income Fund |
The following table presents the fund’s forward currency contracts by counterparty that are subject to master netting agreements but that are not offset in the fund’s statement of assets and liabilities. The net amount column shows the impact of offsetting on the fund’s statement of assets and liabilities as of December 31, 2017, if close-out netting was exercised (dollars in thousands):
| Gross amounts recognized in the | Gross amounts not offset in the statement of assets and liabilities and subject to a master netting agreement | |||||||||||||||||||
| Counterparty | statement of assets and liabilities | Available to offset | Non-cash collateral* | Cash collateral | Net amount | |||||||||||||||
| Assets: | ||||||||||||||||||||
| Bank of America, N.A. | $ | 29 | $ | — | $ | (11 | ) | $ | — | $ | 18 | |||||||||
| UBS AG | 8 | — | — | — | 8 | |||||||||||||||
| Total | $ | 37 | $ | — | $ | (11 | ) | $ | — | $ | 26 | |||||||||
| Liabilities: | ||||||||||||||||||||
| JPMorgan Chase | $ | 27 | $ | — | $ | — | $ | — | $ | 27 | ||||||||||
| * | Non-cash collateral is shown on a settlement basis. |
6. Taxation and distributions
Federal income taxation — The fund complies with the requirements under Subchapter M of the Internal Revenue Code applicable to mutual funds and intends to distribute substantially all of its net taxable income and net capital gains each year. The fund is not subject to income taxes to the extent such distributions are made. Therefore, no federal income tax provision is required.
As of and during the period ended December 31, 2017, the fund did not have a liability for any unrecognized tax benefits. The fund recognizes interest and penalties, if any, related to unrecognized tax benefits as income tax expense in the statement of operations. During the period, the fund did not incur any significant interest or penalties.
The fund’s tax returns are not subject to examination by federal, state and, if applicable, non-U.S. tax authorities after the expiration of each jurisdiction’s statute of limitations, which is generally three years after the date of filing but can be extended in certain jurisdictions.
Non-U.S. taxation — Dividend and interest income are recorded net of non-U.S. taxes paid. The fund may file withholding tax reclaims in certain jurisdictions to recover a portion of amounts previously withheld. As a result of rulings from European courts, the fund filed for additional reclaims related to prior years. These reclaims are recorded when the amount is known and there are no significant uncertainties on collectability. Gains realized by the fund on the sale of securities in certain countries, if any, may be subject to non-U.S. taxes. If applicable, the fund records an estimated deferred tax liability based on unrealized gains to provide for potential non-U.S. taxes payable upon the sale of these securities.
| International Growth and Income Fund | 23 |
Distributions — Distributions paid to shareholders are based on net investment income and net realized gains determined on a tax basis, which may differ from net investment income and net realized gains for financial reporting purposes. These differences are due primarily to different treatment for items such as currency gains and losses; short-term capital gains and losses; capital losses related to sales of certain securities within 30 days of purchase; unrealized appreciation of certain investments in securities outside the U.S.; cost of investments sold; net capital losses and income on certain investments. The fiscal year in which amounts are distributed may differ from the year in which the net investment income and net realized gains are recorded by the fund for financial reporting purposes.
The components of distributable earnings on a tax basis are reported as of the fund’s most recent year-end. As of June 30, 2017, the components of distributable earnings on a tax basis were as follows (dollars in thousands):
| Undistributed ordinary income | $ | 9,498 | |
| Capital loss carryforward* | (1,072,230 | ) |
| * | The capital loss carryforward will be used to offset any capital gains realized by the fund in the current year or in subsequent years. The fund will not make distributions from capital gains while a capital loss carryforward remains. |
As of December 31, 2017, the tax basis unrealized appreciation (depreciation) and cost of investments were as follows (dollars in thousands):
| Gross unrealized appreciation on investments | $ | 3,092,298 | ||
| Gross unrealized depreciation on investments | (169,914 | ) | ||
| Net unrealized appreciation on investments | 2,922,384 | |||
| Cost of investments | 11,219,436 |
| 24 | International Growth and Income Fund |
Tax-basis distributions paid to shareholders from ordinary income were as follows (dollars in thousands):
| Share class | Six months ended December 31, 2017 | Year ended June 30, 2017 | ||||||
| Class A | $ | 36,415 | $ | 101,196 | ||||
| Class B1 | — | 17 | ||||||
| Class C | 912 | 3,663 | ||||||
| Class T2 | — | 3 | — | 3 | ||||
| Class F-1 | 2,384 | 7,762 | ||||||
| Class F-2 | 22,239 | 72,966 | ||||||
| Class F-34 | 19,082 | 17,802 | ||||||
| Class 529-A | 1,050 | 2,760 | ||||||
| Class 529-B1 | — | 1 | ||||||
| Class 529-C | 98 | 425 | ||||||
| Class 529-E | 32 | 88 | ||||||
| Class 529-T2 | — | 3 | — | 3 | ||||
| Class 529-F-1 | 139 | 314 | ||||||
| Class R-1 | 16 | 103 | ||||||
| Class R-2 | 208 | 783 | ||||||
| Class R-2E | 14 | 25 | ||||||
| Class R-3 | 421 | 1,226 | ||||||
| Class R-4 | 656 | 1,853 | ||||||
| Class R-5E | 2 | 4 | ||||||
| Class R-5 | 290 | 759 | ||||||
| Class R-6 | 25,202 | 56,345 | ||||||
| Total | $ | 109,160 | $ | 268,092 | ||||
| 1 | Class B and 529-B shares were fully liquidated on May 5, 2017. |
| 2 | Class T and 529-T shares began investment operations on April 7, 2017. |
| 3 | Amount less than one thousand. |
| 4 | Class F-3 shares began investment operations on January 27, 2017. |
7. Fees and transactions with related parties
CRMC, the fund’s investment adviser, is the parent company of American Funds Distributors,® Inc. (“AFD”), the principal underwriter of the fund’s shares, and American Funds Service Company® (“AFS”), the fund’s transfer agent. CRMC, AFD and AFS are considered related parties to the fund.
Investment advisory services — The fund has an investment advisory and service agreement with CRMC that provides for monthly fees accrued daily. These fees are based on a series of decreasing annual rates beginning with 0.690% on the first $500 million of daily net assets and decreasing to 0.440% on such assets in excess of $17 billion. For the six months ended December 31, 2017, the investment advisory services fee was $32,388,000, which was equivalent to an annualized rate of 0.481% of average daily net assets.
| International Growth and Income Fund | 25 |
Class-specific fees and expenses — Expenses that are specific to individual share classes are accrued directly to the respective share class. The principal class-specific fees and expenses are further described below:
Distribution services — The fund has plans of distribution for all share classes, except Class F-2, F-3, R-5E, R-5 and R-6 shares. Under the plans, the board of trustees approves certain categories of expenses that are used to finance activities primarily intended to sell fund shares and service existing accounts. The plans provide for payments, based on an annualized percentage of average daily net assets, ranging from 0.30% to 1.00% as noted in this section. In some cases, the board of trustees has limited the amounts that may be paid to less than the maximum allowed by the plans. All share classes with a plan may use up to 0.25% of average daily net assets to pay service fees, or to compensate AFD for paying service fees, to firms that have entered into agreements with AFD to provide certain shareholder services. The remaining amounts available to be paid under each plan are paid to dealers to compensate them for their sales activities.
| Share class | Currently approved limits | Plan limits | |||||||
| Class A | 0.30 | % | 0.30 | % | |||||
| Class 529-A | 0.30 | 0.50 | |||||||
| Classes C, 529-C and R-1 | 1.00 | 1.00 | |||||||
| Class R-2 | 0.75 | 1.00 | |||||||
| Class R-2E | 0.60 | 0.85 | |||||||
| Classes 529-E and R-3 | 0.50 | 0.75 | |||||||
| Classes T, F-1, 529-T, 529-F-1 and R-4 | 0.25 | 0.50 | |||||||
For Class A and 529-A shares, distribution-related expenses include the reimbursement of dealer and wholesaler commissions paid by AFD for certain shares sold without a sales charge. These share classes reimburse AFD for amounts billed within the prior 15 months but only to the extent that the overall annual expense limits are not exceeded. As of December 31, 2017, there were no unreimbursed expenses subject to reimbursement for Class A or 529-A shares.
Transfer agent services — The fund has a shareholder services agreement with AFS under which the fund compensates AFS for providing transfer agent services to each of the fund’s share classes. These services include recordkeeping, shareholder communications and transaction processing. In addition, the fund reimburses AFS for amounts paid to third parties for performing transfer agent services on behalf of fund shareholders.
Administrative services — The fund has an administrative services agreement with CRMC under which the fund compensates CRMC for providing administrative services to Class A, C, T, F, 529 and R shares. These services include, but are not limited to, coordinating, monitoring, assisting and overseeing third parties that
| 26 | International Growth and Income Fund |
provide services to fund shareholders. Under the agreement, Class A shares pay an annual fee of 0.01% and Class C, T, F, 529 and R shares pay an annual fee of 0.05% of their respective average daily net assets.
529 plan services — Each 529 share class is subject to service fees to compensate the Virginia College Savings Plan (“Virginia529”) for its oversight and administration of the 529 college savings plan. The quarterly fee is based on a series of decreasing annual rates beginning with 0.10% on the first $20 billion of the net assets invested in the Class 529 shares of the American Funds and decreasing to 0.03% on such assets in excess of $100 billion. The fee for any given calendar quarter is accrued and calculated on the basis of the average net assets of Class 529 shares of the American Funds for the last month of the prior calendar quarter. The fee is included in other expenses in the fund’s statement of operations. Virginia529 is not considered a related party to the fund.
For the six months ended December 31, 2017, class-specific expenses under the agreements were as follows (dollars in thousands):
| Share class | Distribution services | Transfer agent services | Administrative services | 529 plan services | ||||||||||||
| Class A | $6,613 | $2,941 | $248 | Not applicable | ||||||||||||
| Class C | 1,320 | 162 | 66 | Not applicable | ||||||||||||
| Class T | — | — | * | — | * | Not applicable | ||||||||||
| Class F-1 | 431 | 219 | 86 | Not applicable | ||||||||||||
| Class F-2 | Not applicable | 1,497 | 655 | Not applicable | ||||||||||||
| Class F-3 | Not applicable | 93 | 521 | Not applicable | ||||||||||||
| Class 529-A | 152 | 79 | 36 | $49 | ||||||||||||
| Class 529-C | 165 | 19 | 8 | 11 | ||||||||||||
| Class 529-E | 13 | 1 | 1 | 2 | ||||||||||||
| Class 529-T | — | — | * | — | * | — | * | |||||||||
| Class 529-F-1 | — | 9 | 4 | 6 | ||||||||||||
| Class R-1 | 22 | 3 | 1 | Not applicable | ||||||||||||
| Class R-2 | 212 | 99 | 14 | Not applicable | ||||||||||||
| Class R-2E | 7 | 3 | 1 | Not applicable | ||||||||||||
| Class R-3 | 184 | 57 | 19 | Not applicable | ||||||||||||
| Class R-4 | 112 | 47 | 23 | Not applicable | ||||||||||||
| Class R-5E | Not applicable | — | * | — | * | Not applicable | ||||||||||
| Class R-5 | Not applicable | 9 | 8 | Not applicable | ||||||||||||
| Class R-6 | Not applicable | 6 | 685 | Not applicable | ||||||||||||
| Total class-specific expenses | $9,231 | $5,244 | $2,376 | $68 | ||||||||||||
| * | Amount less than one thousand. |
| International Growth and Income Fund | 27 |
Trustees’ deferred compensation — Trustees who are unaffiliated with CRMC may elect to defer the cash payment of part or all of their compensation. These deferred amounts, which remain as liabilities of the fund, are treated as if invested in shares of the fund or other American Funds. These amounts represent general, unsecured liabilities of the fund and vary according to the total returns of the selected funds. Trustees’ compensation of $336,000 in the fund’s statement of operations reflects $181,000 in current fees (either paid in cash or deferred) and a net increase of $155,000 in the value of the deferred amounts.
Affiliated officers and trustees — Officers and certain trustees of the fund are or may be considered to be affiliated with CRMC, AFD and AFS. No affiliated officers or trustees received any compensation directly from the fund.
Security transactions with related funds — The fund may purchase from, or sell securities to, other funds managed by CRMC (or funds managed by certain affiliates of CRMC) under procedures adopted by the fund’s board of trustees. The funds involved in such transactions are considered related by virtue of having a common investment adviser (or affiliated investment advisers), common trustees and/or common officers. When such transactions occur, each transaction is executed at the current market price of the security and no brokerage commissions or fees are paid in accordance with Rule 17a-7 of the 1940 Act.
Interfund lending — Pursuant to an exemptive order issued by the SEC, the fund, along with other CRMC-managed funds (or funds managed by certain affiliates of CRMC), may participate in an interfund lending program. The program provides an alternate credit facility that permits the funds to lend or borrow cash for temporary purposes directly to or from one another, subject to the conditions of the exemptive order. The fund did not lend or borrow cash through the interfund lending program at any time during the six months ended December 31, 2017.
| 28 | International Growth and Income Fund |
8. Capital share transactions
Capital share transactions in the fund were as follows (dollars and shares in thousands):
| Sales1 | Reinvestments of dividends | Repurchases1 | Net (decrease) increase | |||||||||||||||||||||||||||||
| Share class | Amount | Shares | Amount | Shares | Amount | Shares | Amount | Shares | ||||||||||||||||||||||||
| Six months ended December 31, 2017 | ||||||||||||||||||||||||||||||||
| Class A | $ | 289,192 | 8,557 | $ | 35,608 | 1,042 | $ | (332,923 | ) | (9,888 | ) | $ | (8,123 | ) | (289 | ) | ||||||||||||||||
| Class C | 19,948 | 593 | 901 | 27 | (29,866 | ) | (892 | ) | (9,017 | ) | (272 | ) | ||||||||||||||||||||
| Class T | — | — | — | — | — | — | — | — | ||||||||||||||||||||||||
| Class F-1 | 30,658 | 912 | 2,366 | 69 | (91,544 | ) | (2,740 | ) | (58,520 | ) | (1,759 | ) | ||||||||||||||||||||
| Class F-2 | 464,241 | 13,912 | 21,688 | 634 | (482,916 | ) | (14,363 | ) | 3,013 | 183 | ||||||||||||||||||||||
| Class F-3 | 446,348 | 13,279 | 18,696 | 547 | (200,717 | ) | (5,952 | ) | 264,327 | 7,874 | ||||||||||||||||||||||
| Class 529-A | 15,210 | 448 | 1,049 | 31 | (9,917 | ) | (295 | ) | 6,342 | 184 | ||||||||||||||||||||||
| Class 529-C | 2,785 | 83 | 98 | 3 | (6,245 | ) | (184 | ) | (3,362 | ) | (98 | ) | ||||||||||||||||||||
| Class 529-E | 689 | 20 | 32 | 1 | (438 | ) | (13 | ) | 283 | 8 | ||||||||||||||||||||||
| Class 529-T | — | — | — | 2 | — | 2 | — | — | — | 2 | — | 2 | ||||||||||||||||||||
| Class 529-F-1 | 2,965 | 88 | 139 | 4 | (1,228 | ) | (36 | ) | 1,876 | 56 | ||||||||||||||||||||||
| Class R-1 | 354 | 11 | 16 | — | 2 | (1,360 | ) | (41 | ) | (990 | ) | (30 | ) | |||||||||||||||||||
| Class R-2 | 9,300 | 277 | 208 | 6 | (8,479 | ) | (255 | ) | 1,029 | 28 | ||||||||||||||||||||||
| Class R-2E | 1,023 | 31 | 14 | — | 2 | (123 | ) | (4 | ) | 914 | 27 | |||||||||||||||||||||
| Class R-3 | 12,505 | 380 | 421 | 12 | (14,764 | ) | (436 | ) | (1,838 | ) | (44 | ) | ||||||||||||||||||||
| Class R-4 | 11,042 | 329 | 656 | 19 | (16,678 | ) | (498 | ) | (4,980 | ) | (150 | ) | ||||||||||||||||||||
| Class R-5E | 8 | — | 2 | 2 | — | 2 | (75 | ) | (2 | ) | (65 | ) | (2 | ) | ||||||||||||||||||
| Class R-5 | 4,068 | 121 | 290 | 9 | (5,509 | ) | (167 | ) | (1,151 | ) | (37 | ) | ||||||||||||||||||||
| Class R-6 | 363,806 | 10,765 | 25,174 | 737 | (140,775 | ) | (4,216 | ) | 248,205 | 7,286 | ||||||||||||||||||||||
| Total net increase (decrease) | $ | 1,674,142 | 49,806 | $ | 107,358 | 3,141 | $ | (1,343,557 | ) | (39,982 | ) | $ | 437,943 | 12,965 | ||||||||||||||||||
| International Growth and Income Fund | 29 |
| Sales1 | Reinvestments of dividends | Repurchases1 | Net (decrease) increase | |||||||||||||||||||||||||||||
| Share class | Amount | Shares | Amount | Shares | Amount | Shares | Amount | Shares | ||||||||||||||||||||||||
| Year ended June 30, 2017 | ||||||||||||||||||||||||||||||||
| Class A | $ | 601,070 | 20,187 | $ | 98,922 | 3,253 | $ | (1,062,222 | ) | (36,106 | ) | $ | (362,230 | ) | (12,666 | ) | ||||||||||||||||
| Class B3 | 12 | — | 2 | 17 | 1 | (5,158 | ) | (177 | ) | (5,129 | ) | (176 | ) | |||||||||||||||||||
| Class C | 33,924 | 1,143 | 3,609 | 118 | (81,718 | ) | (2,775 | ) | (44,185 | ) | (1,514 | ) | ||||||||||||||||||||
| Class T4 | 10 | — | 2 | — | — | — | — | 10 | — | 2 | ||||||||||||||||||||||
| Class F-1 | 261,545 | 9,085 | 7,664 | 252 | (747,988 | ) | (25,650 | ) | (478,779 | ) | (16,313 | ) | ||||||||||||||||||||
| Class F-2 | 1,670,073 | 56,115 | 71,078 | 2,358 | (2,786,437 | ) | (90,937 | ) | (1,045,286 | ) | (32,464 | ) | ||||||||||||||||||||
| Class F-35 | 1,823,263 | 58,103 | 17,451 | 545 | (52,701 | ) | (1,643 | ) | 1,788,013 | 57,005 | ||||||||||||||||||||||
| Class 529-A | 17,034 | 575 | 2,758 | 91 | (19,110 | ) | (652 | ) | 682 | 14 | ||||||||||||||||||||||
| Class 529-B3 | 12 | — | 2 | — | 2 | — | 2 | (245 | ) | (8 | ) | (233 | ) | (8 | ) | |||||||||||||||||
| Class 529-C | 4,607 | 156 | 425 | 14 | (5,788 | ) | (198 | ) | (756 | ) | (28 | ) | ||||||||||||||||||||
| Class 529-E | 771 | 26 | 88 | 3 | (665 | ) | (23 | ) | 194 | 6 | ||||||||||||||||||||||
| Class 529-T4 | 10 | — | 2 | — | 2 | — | 2 | — | — | 10 | — | 2 | ||||||||||||||||||||
| Class 529-F-1 | 3,688 | 125 | 314 | 10 | (2,625 | ) | (88 | ) | 1,377 | 47 | ||||||||||||||||||||||
| Class R-1 | 1,168 | 40 | 103 | 4 | (7,642 | ) | (258 | ) | (6,371 | ) | (214 | ) | ||||||||||||||||||||
| Class R-2 | 14,826 | 503 | 783 | 26 | (15,940 | ) | (543 | ) | (331 | ) | (14 | ) | ||||||||||||||||||||
| Class R-2E | 1,506 | 51 | 24 | 1 | (208 | ) | (7 | ) | 1,322 | 45 | ||||||||||||||||||||||
| Class R-3 | 21,601 | 731 | 1,225 | 40 | (24,575 | ) | (832 | ) | (1,749 | ) | (61 | ) | ||||||||||||||||||||
| Class R-4 | 22,915 | 773 | 1,853 | 61 | (22,852 | ) | (765 | ) | 1,916 | 69 | ||||||||||||||||||||||
| Class R-5E | 286 | 10 | 4 | — | 2 | (7 | ) | — | 2 | 283 | 10 | |||||||||||||||||||||
| Class R-5 | 9,624 | 325 | 758 | 24 | (7,857 | ) | (264 | ) | 2,525 | 85 | ||||||||||||||||||||||
| Class R-6 | 635,908 | 21,660 | 56,319 | 1,848 | (133,573 | ) | (4,468 | ) | 558,654 | 19,040 | ||||||||||||||||||||||
| Total net increase (decrease) | $ | 5,123,853 | 169,608 | $ | 263,395 | 8,649 | $ | (4,977,311 | ) | (165,394 | ) | $ | 409,937 | 12,863 | ||||||||||||||||||
| 1 | Includes exchanges between share classes of the fund. |
| 2 | Amount less than one thousand. |
| 3 | Class B and 529-B shares were fully liquidated on May 5, 2017. |
| 4 | Class T and 529-T shares began investment operations on April 7, 2017. |
| 5 | Class F-3 shares began investment operations on January 27, 2017. |
| 30 | International Growth and Income Fund |
9. Investment transactions
The fund made purchases and sales of investment securities, excluding short-term securities and U.S. government obligations, if any, of $2,529,808,000 and $1,217,162,000, respectively, during the six months ended December 31, 2017.
| International Growth and Income Fund | 31 |
Financial highlights
| Income (loss) from investment operations1 | ||||||||||||||||
| Period ended | Net asset value, beginning of period | Net investment income2 | Net gains (losses) on securities (both realized and unrealized) | Total from investment operations | ||||||||||||
| Class A: | ||||||||||||||||
| 12/31/20174,5 | $ | 32.03 | $ | .23 | $ | 2.97 | $ | 3.20 | ||||||||
| 6/30/2017 | 27.81 | .63 | 4.27 | 4.90 | ||||||||||||
| 6/30/2016 | 31.99 | .73 | (4.11 | ) | (3.38 | ) | ||||||||||
| 6/30/2015 | 36.56 | .79 | (3.53 | ) | (2.74 | ) | ||||||||||
| 6/30/2014 | 32.06 | 1.23 | 5.82 | 7.05 | ||||||||||||
| 6/30/2013 | 27.81 | .84 | 4.26 | 5.10 | ||||||||||||
| Class C: | ||||||||||||||||
| 12/31/20174,5 | 31.95 | .10 | 2.96 | 3.06 | ||||||||||||
| 6/30/2017 | 27.74 | .38 | 4.27 | 4.65 | ||||||||||||
| 6/30/2016 | 31.91 | .48 | (4.08 | ) | (3.60 | ) | ||||||||||
| 6/30/2015 | 36.47 | .53 | (3.52 | ) | (2.99 | ) | ||||||||||
| 6/30/2014 | 32.00 | .95 | 5.80 | 6.75 | ||||||||||||
| 6/30/2013 | 27.76 | .59 | 4.25 | 4.84 | ||||||||||||
| Class T: | ||||||||||||||||
| 12/31/20174,5 | 32.03 | .27 | 2.97 | 3.24 | ||||||||||||
| 6/30/20174,10 | 30.40 | .29 | 1.65 | 1.94 | ||||||||||||
| Class F-1: | ||||||||||||||||
| 12/31/20174,5 | 32.06 | .23 | 2.96 | 3.19 | ||||||||||||
| 6/30/2017 | 27.80 | .57 | 4.32 | 4.89 | ||||||||||||
| 6/30/2016 | 31.98 | .61 | (4.00 | ) | (3.39 | ) | ||||||||||
| 6/30/2015 | 36.55 | .80 | (3.56 | ) | (2.76 | ) | ||||||||||
| 6/30/2014 | 32.06 | 1.23 | 5.79 | 7.02 | ||||||||||||
| 6/30/2013 | 27.81 | .94 | 4.16 | 5.10 | ||||||||||||
| Class F-2: | ||||||||||||||||
| 12/31/20174,5 | 32.05 | .27 | 2.96 | 3.23 | ||||||||||||
| 6/30/2017 | 27.82 | .65 | 4.32 | 4.97 | ||||||||||||
| 6/30/2016 | 32.00 | .87 | (4.19 | ) | (3.32 | ) | ||||||||||
| 6/30/2015 | 36.57 | .91 | (3.58 | ) | (2.67 | ) | ||||||||||
| 6/30/2014 | 32.07 | 1.32 | 5.80 | 7.12 | ||||||||||||
| 6/30/2013 | 27.81 | .92 | 4.26 | 5.18 | ||||||||||||
| Class F-3: | ||||||||||||||||
| 12/31/20174,5 | 32.02 | .28 | 2.98 | 3.26 | ||||||||||||
| 6/30/20174,11 | 29.42 | .64 | 2.41 | 3.05 | ||||||||||||
| 32 | International Growth and Income Fund |
| Dividends and distributions | ||||||||||||||||||||||||||||||
| Dividends (from net investment income) | Distributions (from capital gains) | Total dividends and distributions | Net asset value, end of period | Total return3 | Net assets, end of period (in millions) | Ratio of expenses to average net assets | Ratio of net income to average net assets2 | |||||||||||||||||||||||
| $ | (.25 | ) | $ | — | $ | (.25 | ) | $ | 34.98 | 9.98 | %6 | $ | 5,122 | .92 | %7 | 1.36 | %7 | |||||||||||||
| (.68 | ) | — | (.68 | ) | 32.03 | 17.80 | 4,700 | .92 | 2.11 | |||||||||||||||||||||
| (.80 | ) | — | (.80 | ) | 27.81 | (10.62 | ) | 4,432 | .91 | 2.52 | ||||||||||||||||||||
| (.86 | ) | (.97 | ) | (1.83 | ) | 31.99 | (7.48 | ) | 5,050 | .91 | 2.36 | |||||||||||||||||||
| (1.18 | ) | (1.37 | ) | (2.55 | ) | 36.56 | 22.66 | 5,027 | .91 | 3.54 | ||||||||||||||||||||
| (.85 | ) | — | (.85 | ) | 32.06 | 18.41 | 3,703 | .93 | 2.70 | |||||||||||||||||||||
| (.12 | ) | — | (.12 | ) | 34.89 | 9.58 | 6 | 269 | 1.70 | 7 | .58 | 7 | ||||||||||||||||||
| (.44 | ) | — | (.44 | ) | 31.95 | 16.83 | 255 | 1.72 | 1.28 | |||||||||||||||||||||
| (.57 | ) | — | (.57 | ) | 27.74 | (11.35 | ) | 263 | 1.72 | 1.68 | ||||||||||||||||||||
| (.60 | ) | (.97 | ) | (1.57 | ) | 31.91 | (8.19 | ) | 323 | 1.69 | 1.58 | |||||||||||||||||||
| (.91 | ) | (1.37 | ) | (2.28 | ) | 36.47 | 21.66 | 309 | 1.71 | 2.73 | ||||||||||||||||||||
| (.60 | ) | — | (.60 | ) | 32.00 | 17.47 | 225 | 1.74 | 1.89 | |||||||||||||||||||||
| (.29 | ) | — | (.29 | ) | 34.98 | 10.13 | 6,8 | — | 9 | .71 | 7,8 | 1.57 | 7,8 | |||||||||||||||||
| (.31 | ) | — | (.31 | ) | 32.03 | 6.37 | 6,8 | — | 9 | .16 | 6,8 | .93 | 6,8 | |||||||||||||||||
| (.24 | ) | — | (.24 | ) | 35.01 | 9.98 | 6 | 334 | .96 | 7 | 1.34 | 7 | ||||||||||||||||||
| (.63 | ) | — | (.63 | ) | 32.06 | 17.73 | 362 | .97 | 1.93 | |||||||||||||||||||||
| (.79 | ) | — | (.79 | ) | 27.80 | (10.68 | ) | 768 | .96 | 2.11 | ||||||||||||||||||||
| (.84 | ) | (.97 | ) | (1.81 | ) | 31.98 | (7.52 | ) | 1,662 | .95 | 2.38 | |||||||||||||||||||
| (1.16 | ) | (1.37 | ) | (2.53 | ) | 36.55 | 22.57 | 1,226 | .96 | 3.53 | ||||||||||||||||||||
| (.85 | ) | — | (.85 | ) | 32.06 | 18.39 | 844 | .96 | 2.97 | |||||||||||||||||||||
| (.29 | ) | — | (.29 | ) | 34.99 | 10.10 | 6 | 2,675 | .69 | 7 | 1.59 | 7 | ||||||||||||||||||
| (.74 | ) | — | (.74 | ) | 32.05 | 18.04 | 2,444 | .70 | 2.22 | |||||||||||||||||||||
| (.86 | ) | — | (.86 | ) | 27.82 | (10.43 | ) | 3,024 | .70 | 3.02 | ||||||||||||||||||||
| (.93 | ) | (.97 | ) | (1.90 | ) | 32.00 | (7.27 | ) | 2,161 | .69 | 2.71 | |||||||||||||||||||
| (1.25 | ) | (1.37 | ) | (2.62 | ) | 36.57 | 22.90 | 1,228 | .70 | 3.79 | ||||||||||||||||||||
| (.92 | ) | — | (.92 | ) | 32.07 | 18.64 | 697 | .73 | 2.95 | |||||||||||||||||||||
| (.31 | ) | — | (.31 | ) | 34.97 | 10.19 | 6 | 2,269 | .59 | 7 | 1.67 | 7 | ||||||||||||||||||
| (.45 | ) | — | (.45 | ) | 32.02 | 10.40 | 6 | 1,825 | .25 | 6 | 1.99 | 6 | ||||||||||||||||||
See end of table for footnotes.
| International Growth and Income Fund | 33 |
Financial highlights (continued)
| Income (loss) from investment operations1 | ||||||||||||||||
| Period ended | Net asset value, beginning of period | Net investment income2 | Net gains (losses) on securities (both realized and unrealized) | Total from investment operations | ||||||||||||
| Class 529-A: | ||||||||||||||||
| 12/31/20174,5 | $ | 31.99 | $ | .22 | $ | 2.97 | $ | 3.19 | ||||||||
| 6/30/2017 | 27.78 | .61 | 4.26 | 4.87 | ||||||||||||
| 6/30/2016 | 31.96 | .70 | (4.10 | ) | (3.40 | ) | ||||||||||
| 6/30/2015 | 36.52 | .77 | (3.52 | ) | (2.75 | ) | ||||||||||
| 6/30/2014 | 32.03 | 1.21 | 5.80 | 7.01 | ||||||||||||
| 6/30/2013 | 27.78 | .83 | 4.25 | 5.08 | ||||||||||||
| Class 529-C: | ||||||||||||||||
| 12/31/20174,5 | 31.83 | .09 | 2.94 | 3.03 | ||||||||||||
| 6/30/2017 | 27.64 | .38 | 4.24 | 4.62 | ||||||||||||
| 6/30/2016 | 31.81 | .47 | (4.09 | ) | (3.62 | ) | ||||||||||
| 6/30/2015 | 36.36 | .50 | (3.51 | ) | (3.01 | ) | ||||||||||
| 6/30/2014 | 31.91 | .93 | 5.77 | 6.70 | ||||||||||||
| 6/30/2013 | 27.68 | .58 | 4.23 | 4.81 | ||||||||||||
| Class 529-E: | ||||||||||||||||
| 12/31/20174,5 | 31.99 | .18 | 2.97 | 3.15 | ||||||||||||
| 6/30/2017 | 27.78 | .56 | 4.25 | 4.81 | ||||||||||||
| 6/30/2016 | 31.96 | .62 | (4.09 | ) | (3.47 | ) | ||||||||||
| 6/30/2015 | 36.52 | .70 | (3.53 | ) | (2.83 | ) | ||||||||||
| 6/30/2014 | 32.03 | 1.12 | 5.81 | 6.93 | ||||||||||||
| 6/30/2013 | 27.79 | .77 | 4.22 | 4.99 | ||||||||||||
| Class 529-T: | ||||||||||||||||
| 12/31/20174,5 | 32.03 | .26 | 2.97 | 3.23 | ||||||||||||
| 6/30/20174,10 | 30.40 | .29 | 1.64 | 1.93 | ||||||||||||
| Class 529-F-1: | ||||||||||||||||
| 12/31/20174,5 | 32.04 | .26 | 2.96 | 3.22 | ||||||||||||
| 6/30/2017 | 27.81 | .69 | 4.26 | 4.95 | ||||||||||||
| 6/30/2016 | 32.00 | .79 | (4.14 | ) | (3.35 | ) | ||||||||||
| 6/30/2015 | 36.57 | .83 | (3.52 | ) | (2.69 | ) | ||||||||||
| 6/30/2014 | 32.07 | 1.30 | 5.79 | 7.09 | ||||||||||||
| 6/30/2013 | 27.81 | .94 | 4.22 | 5.16 | ||||||||||||
| Class R-1: | ||||||||||||||||
| 12/31/20174,5 | 31.95 | .11 | 2.95 | 3.06 | ||||||||||||
| 6/30/2017 | 27.74 | .32 | 4.34 | 4.66 | ||||||||||||
| 6/30/2016 | 31.91 | .52 | (4.09 | ) | (3.57 | ) | ||||||||||
| 6/30/2015 | 36.49 | .60 | (3.55 | ) | (2.95 | ) | ||||||||||
| 6/30/2014 | 32.01 | 1.14 | 5.74 | 6.88 | ||||||||||||
| 6/30/2013 | 27.78 | .77 | 4.27 | 5.04 | ||||||||||||
| 34 | International Growth and Income Fund |
| Dividends and distributions | ||||||||||||||||||||||||||||||
| Dividends (from net investment income) | Distributions (from capital gains) | Total dividends and distributions | Net asset value, end of period | Total return3 | Net assets, end of period (in millions) | Ratio of expenses to average net assets | Ratio of net income to average net assets2 | |||||||||||||||||||||||
| $ | (.24 | ) | $ | — | $ | (.24 | ) | $ | 34.94 | 9.97 | %6 | $ | 155 | .97 | %7 | 1.31 | %7 | |||||||||||||
| (.66 | ) | — | (.66 | ) | 31.99 | 17.71 | 136 | .99 | 2.07 | |||||||||||||||||||||
| (.78 | ) | — | (.78 | ) | 27.78 | (10.71 | ) | 118 | 1.00 | 2.45 | ||||||||||||||||||||
| (.84 | ) | (.97 | ) | (1.81 | ) | 31.96 | (7.52 | ) | 130 | .97 | 2.29 | |||||||||||||||||||
| (1.15 | ) | (1.37 | ) | (2.52 | ) | 36.52 | 22.56 | 129 | .98 | 3.48 | ||||||||||||||||||||
| (.83 | ) | — | (.83 | ) | 32.03 | 18.35 | 93 | 1.00 | 2.66 | |||||||||||||||||||||
| (.10 | ) | — | (.10 | ) | 34.76 | 9.53 | 6 | 31 | 1.76 | 7 | .52 | 7 | ||||||||||||||||||
| (.43 | ) | — | (.43 | ) | 31.83 | 16.79 | 32 | 1.77 | 1.28 | |||||||||||||||||||||
| (.55 | ) | — | (.55 | ) | 27.64 | (11.44 | ) | 29 | 1.79 | 1.64 | ||||||||||||||||||||
| (.57 | ) | (.97 | ) | (1.54 | ) | 31.81 | (8.26 | ) | 33 | 1.77 | 1.50 | |||||||||||||||||||
| (.88 | ) | (1.37 | ) | (2.25 | ) | 36.36 | 21.56 | 32 | 1.78 | 2.67 | ||||||||||||||||||||
| (.58 | ) | — | (.58 | ) | 31.91 | 17.42 | 23 | 1.82 | 1.85 | |||||||||||||||||||||
| (.21 | ) | — | (.21 | ) | 34.93 | 9.85 | 6 | 6 | 1.18 | 7 | 1.09 | 7 | ||||||||||||||||||
| (.60 | ) | — | (.60 | ) | 31.99 | 17.45 | 5 | 1.19 | 1.88 | |||||||||||||||||||||
| (.71 | ) | — | (.71 | ) | 27.78 | (10.92 | ) | 4 | 1.22 | 2.17 | ||||||||||||||||||||
| (.76 | ) | (.97 | ) | (1.73 | ) | 31.96 | (7.74 | ) | 5 | 1.21 | 2.07 | |||||||||||||||||||
| (1.07 | ) | (1.37 | ) | (2.44 | ) | 36.52 | 22.26 | 5 | 1.23 | 3.21 | ||||||||||||||||||||
| (.75 | ) | — | (.75 | ) | 32.03 | 18.01 | 3 | 1.26 | 2.45 | |||||||||||||||||||||
| (.28 | ) | — | (.28 | ) | 34.98 | 10.10 | 6,8 | — | 9 | .75 | 7,8 | 1.53 | 7,8 | |||||||||||||||||
| (.30 | ) | — | (.30 | ) | 32.03 | 6.36 | 6,8 | — | 9 | .17 | 6,8 | .92 | 6,8 | |||||||||||||||||
| (.28 | ) | — | (.28 | ) | 34.98 | 10.07 | 6 | 18 | .75 | 7 | 1.52 | 7 | ||||||||||||||||||
| (.72 | ) | — | (.72 | ) | 32.04 | 17.98 | 15 | .77 | 2.32 | |||||||||||||||||||||
| (.84 | ) | — | (.84 | ) | 27.81 | (10.55 | ) | 11 | .79 | 2.73 | ||||||||||||||||||||
| (.91 | ) | (.97 | ) | (1.88 | ) | 32.00 | (7.34 | ) | 11 | .77 | 2.47 | |||||||||||||||||||
| (1.22 | ) | (1.37 | ) | (2.59 | ) | 36.57 | 22.81 | 11 | .78 | 3.72 | ||||||||||||||||||||
| (.90 | ) | — | (.90 | ) | 32.07 | 18.60 | 7 | .81 | 3.00 | |||||||||||||||||||||
| (.12 | ) | — | (.12 | ) | 34.89 | 9.59 | 6 | 4 | 1.67 | 7 | .65 | 7 | ||||||||||||||||||
| (.45 | ) | — | (.45 | ) | 31.95 | 16.90 | 5 | 1.66 | 1.09 | |||||||||||||||||||||
| (.60 | ) | — | (.60 | ) | 27.74 | (11.25 | )8 | 10 | 1.59 | 8 | 1.80 | 8 | ||||||||||||||||||
| (.66 | ) | (.97 | ) | (1.63 | ) | 31.91 | (8.05 | )8 | 13 | 1.57 | 8 | 1.81 | 8 | |||||||||||||||||
| (1.03 | ) | (1.37 | ) | (2.40 | ) | 36.49 | 22.07 | 8 | 9 | 1.35 | 8 | 3.28 | 8 | |||||||||||||||||
| (.81 | ) | — | (.81 | ) | 32.01 | 18.19 | 8 | 5 | 1.16 | 8 | 2.48 | 8 | ||||||||||||||||||
See end of table for footnotes.
| International Growth and Income Fund | 35 |
Financial highlights (continued)
| Income (loss) from investment operations1 | ||||||||||||||||
| Period ended | Net asset value, beginning of period | Net investment income2 | Net gains (losses) on securities (both realized and unrealized) | Total from investment operations | ||||||||||||
| Class R-2: | ||||||||||||||||
| 12/31/20174,5 | $ | 31.87 | $ | .10 | $ | 2.95 | $ | 3.05 | ||||||||
| 6/30/2017 | 27.68 | .40 | 4.25 | 4.65 | ||||||||||||
| 6/30/2016 | 31.85 | .48 | (4.10 | ) | (3.62 | ) | ||||||||||
| 6/30/2015 | 36.40 | .51 | (3.51 | ) | (3.00 | ) | ||||||||||
| 6/30/2014 | 31.94 | .93 | 5.79 | 6.72 | ||||||||||||
| 6/30/2013 | 27.71 | .60 | 4.24 | 4.84 | ||||||||||||
| Class R-2E: | ||||||||||||||||
| 12/31/20174,5 | 31.92 | .15 | 2.95 | 3.10 | ||||||||||||
| 6/30/2017 | 27.74 | .59 | 4.16 | 4.75 | ||||||||||||
| 6/30/2016 | 31.96 | .87 | (4.35 | ) | (3.48 | ) | ||||||||||
| 6/30/20154,12 | 35.91 | .69 | (2.75 | ) | (2.06 | ) | ||||||||||
| Class R-3: | ||||||||||||||||
| 12/31/20174,5 | 31.97 | .18 | 2.96 | 3.14 | ||||||||||||
| 6/30/2017 | 27.76 | .53 | 4.27 | 4.80 | ||||||||||||
| 6/30/2016 | 31.94 | .64 | (4.12 | ) | (3.48 | ) | ||||||||||
| 6/30/2015 | 36.50 | .71 | (3.55 | ) | (2.84 | ) | ||||||||||
| 6/30/2014 | 32.02 | 1.09 | 5.82 | 6.91 | ||||||||||||
| 6/30/2013 | 27.78 | .76 | 4.23 | 4.99 | ||||||||||||
| Class R-4: | ||||||||||||||||
| 12/31/20174,5 | 32.01 | .23 | 2.97 | 3.20 | ||||||||||||
| 6/30/2017 | 27.79 | .63 | 4.27 | 4.90 | ||||||||||||
| 6/30/2016 | 31.98 | .73 | (4.12 | ) | (3.39 | ) | ||||||||||
| 6/30/2015 | 36.54 | .83 | (3.56 | ) | (2.73 | ) | ||||||||||
| 6/30/2014 | 32.05 | 1.26 | 5.77 | 7.03 | ||||||||||||
| 6/30/2013 | 27.80 | .88 | 4.23 | 5.11 | ||||||||||||
| Class R-5E: | ||||||||||||||||
| 12/31/20174,5 | 32.01 | .26 | 2.96 | 3.22 | ||||||||||||
| 6/30/2017 | 27.79 | .97 | 3.98 | 4.95 | ||||||||||||
| 6/30/20164,13 | 29.43 | .54 | (1.61 | ) | (1.07 | ) | ||||||||||
| Class R-5: | ||||||||||||||||
| 12/31/20174,5 | 32.20 | .28 | 2.98 | 3.26 | ||||||||||||
| 6/30/2017 | 27.95 | .73 | 4.29 | 5.02 | ||||||||||||
| 6/30/2016 | 32.15 | .82 | (4.14 | ) | (3.32 | ) | ||||||||||
| 6/30/2015 | 36.72 | .92 | (3.57 | ) | (2.65 | ) | ||||||||||
| 6/30/2014 | 32.19 | 1.29 | 5.87 | 7.16 | ||||||||||||
| 6/30/2013 | 27.91 | .94 | 4.28 | 5.22 | ||||||||||||
| 36 | International Growth and Income Fund |
| Dividends and distributions | ||||||||||||||||||||||||||||||
| Dividends (from net investment income) | Distributions (from capital gains) | Total dividends and distributions | Net asset value, end of period | Total return3 | Net assets, end of period (in millions) | Ratio of expenses to average net assets | Ratio of net income to average net assets2 | |||||||||||||||||||||||
| $ | (.12 | ) | $ | — | $ | (.12 | ) | $ | 34.80 | 9.59 | %6 | $ | 60 | 1.67 | %7 | .60 | %7 | |||||||||||||
| (.46 | ) | — | (.46 | ) | 31.87 | 16.89 | 54 | 1.68 | 1.37 | |||||||||||||||||||||
| (.55 | ) | — | (.55 | ) | 27.68 | (11.42 | ) | 47 | 1.79 | 1.66 | ||||||||||||||||||||
| (.58 | ) | (.97 | ) | (1.55 | ) | 31.85 | (8.23 | ) | 52 | 1.74 | 1.51 | |||||||||||||||||||
| (.89 | ) | (1.37 | ) | (2.26 | ) | 36.40 | 21.62 | 53 | 1.74 | 2.69 | ||||||||||||||||||||
| (.61 | ) | — | (.61 | ) | 31.94 | 17.48 | 40 | 1.74 | 1.93 | |||||||||||||||||||||
| (.18 | ) | — | (.18 | ) | 34.84 | 9.73 | 6 | 3 | 1.39 | 7 | .88 | 7 | ||||||||||||||||||
| (.57 | ) | — | (.57 | ) | 31.92 | 17.24 | 2 | 1.40 | 1.98 | |||||||||||||||||||||
| (.74 | ) | — | (.74 | ) | 27.74 | (10.97 | ) | — | 9 | 1.38 | 3.19 | |||||||||||||||||||
| (.92 | ) | (.97 | ) | (1.89 | ) | 31.96 | (5.73 | )6,8 | — | 9 | .77 | 7,8 | 2.48 | 7,8 | ||||||||||||||||
| (.20 | ) | — | (.20 | ) | 34.91 | 9.82 | 6 | 71 | 1.24 | 7 | 1.04 | 7 | ||||||||||||||||||
| (.59 | ) | — | (.59 | ) | 31.97 | 17.40 | 66 | 1.25 | 1.80 | |||||||||||||||||||||
| (.70 | ) | — | (.70 | ) | 27.76 | (10.95 | ) | 60 | 1.25 | 2.22 | ||||||||||||||||||||
| (.75 | ) | (.97 | ) | (1.72 | ) | 31.94 | (7.77 | ) | 60 | 1.25 | 2.13 | |||||||||||||||||||
| (1.06 | ) | (1.37 | ) | (2.43 | ) | 36.50 | 22.20 | 46 | 1.26 | 3.14 | ||||||||||||||||||||
| (.75 | ) | — | (.75 | ) | 32.02 | 18.02 | 33 | 1.27 | 2.43 | |||||||||||||||||||||
| (.25 | ) | — | (.25 | ) | 34.96 | 10.01 | 6 | 90 | .93 | 7 | 1.35 | 7 | ||||||||||||||||||
| (.68 | ) | — | (.68 | ) | 32.01 | 17.77 | 87 | .94 | 2.13 | |||||||||||||||||||||
| (.80 | ) | — | (.80 | ) | 27.79 | (10.67 | ) | 74 | .93 | 2.54 | ||||||||||||||||||||
| (.86 | ) | (.97 | ) | (1.83 | ) | 31.98 | (7.46 | ) | 72 | .93 | 2.48 | |||||||||||||||||||
| (1.17 | ) | (1.37 | ) | (2.54 | ) | 36.54 | 22.61 | 51 | .93 | 3.62 | ||||||||||||||||||||
| (.86 | ) | — | (.86 | ) | 32.05 | 18.43 | 26 | .93 | 2.82 | |||||||||||||||||||||
| (.28 | ) | — | (.28 | ) | 34.95 | 10.08 | 6 | — | 9 | .75 | 7 | 1.54 | 7 | |||||||||||||||||
| (.73 | ) | — | (.73 | ) | 32.01 | 17.97 | — | 9 | .71 | 3.19 | ||||||||||||||||||||
| (.57 | ) | — | (.57 | ) | 27.79 | (3.68 | )6 | — | 9 | .78 | 7 | 3.16 | 7 | |||||||||||||||||
| (.30 | ) | — | (.30 | ) | 35.16 | 10.15 | 6 | 35 | .63 | 7 | 1.64 | 7 | ||||||||||||||||||
| (.77 | ) | — | (.77 | ) | 32.20 | 18.13 | 33 | .63 | 2.46 | |||||||||||||||||||||
| (.88 | ) | — | (.88 | ) | 27.95 | (10.39 | ) | 26 | .63 | 2.85 | ||||||||||||||||||||
| (.95 | ) | (.97 | ) | (1.92 | ) | 32.15 | (7.19 | ) | 26 | .63 | 2.72 | |||||||||||||||||||
| (1.26 | ) | (1.37 | ) | (2.63 | ) | 36.72 | 22.95 | 21 | .63 | 3.69 | ||||||||||||||||||||
| (.94 | ) | — | (.94 | ) | 32.19 | 18.77 | 40 | .65 | 3.00 | |||||||||||||||||||||
See end of table for footnotes.
| International Growth and Income Fund | 37 |
Financial highlights (continued)
| Income (loss) from investment operations1 | ||||||||||||||||
| Period ended | Net asset value, beginning of period | Net investment income2 | Net gains (losses) on securities (both realized and unrealized) | Total from investment operations | ||||||||||||
| Class R-6: | ||||||||||||||||
| 12/31/20174,5 | $ | 32.03 | $ | .29 | $ | 2.97 | $ | 3.26 | ||||||||
| 6/30/2017 | 27.81 | .76 | 4.24 | 5.00 | ||||||||||||
| 6/30/2016 | 31.99 | .85 | (4.13 | ) | (3.28 | ) | ||||||||||
| 6/30/2015 | 36.56 | .93 | (3.56 | ) | (2.63 | ) | ||||||||||
| 6/30/2014 | 32.06 | 1.37 | 5.79 | 7.16 | ||||||||||||
| 6/30/2013 | 27.80 | .97 | 4.25 | 5.22 | ||||||||||||
| Six months ended December 31, | Year ended June 30 | |||||
| 20174,5,6 | 2017 | 2016 | 2015 | 2014 | 2013 | |
| Portfolio turnover rate for all share classes | 10% | 37% | 37% | 25% | 29% | 37% |
See Notes to Financial Statements
| 38 | International Growth and Income Fund |
| Dividends and distributions | ||||||||||||||||||||||||||||||
| Dividends (from net investment income) | Distributions (from capital gains) | Total dividends and distributions | Net asset value, end of period | Total return3 | Net assets, end of period (in millions) | Ratio of expenses to average net assets | Ratio of net income to average net assets2 | |||||||||||||||||||||||
| $ | (.31 | ) | $ | — | $ | (.31 | ) | $ | 34.98 | 10.20 | %6 | $ | 3,005 | .58 | %7 | 1.69 | %7 | |||||||||||||
| (.78 | ) | — | (.78 | ) | 32.03 | 18.17 | 2,519 | .58 | 2.56 | |||||||||||||||||||||
| (.90 | ) | — | (.90 | ) | 27.81 | (10.33 | ) | 1,657 | .58 | 2.98 | ||||||||||||||||||||
| (.97 | ) | (.97 | ) | (1.94 | ) | 31.99 | (7.18 | ) | 1,305 | .58 | 2.79 | |||||||||||||||||||
| (1.29 | ) | (1.37 | ) | (2.66 | ) | 36.56 | 23.04 | 949 | .59 | 3.91 | ||||||||||||||||||||
| (.96 | ) | — | (.96 | ) | 32.06 | 18.83 | 593 | .61 | 3.11 | |||||||||||||||||||||
| 1 | Based on average shares outstanding. | |
| 2 | For the year ended June 30, 2014, this column reflects the impact of a corporate action event that resulted in a one-time increase to net investment income. If the corporate action event had not occurred, the Class A net investment income per share and ratio of net income to average net assets would have been lower by $.28 and .81 percentage points, respectively. The impact to the other share classes would have been similar. | |
| 3 | Total returns exclude any applicable sales charges, including contingent deferred sales charges. | |
| 4 | Based on operations for a period that is less than a full year. | |
| 5 | Unaudited. | |
| 6 | Not annualized. | |
| 7 | Annualized. | |
| 8 | All or a significant portion of assets in this class consisted of seed capital invested by CRMC and/or its affiliates. Fees for distribution services are not charged or accrued on these seed capital assets. If such fees were paid by the fund on seed capital assets, fund expenses would have been higher and net income and total return would have been lower. | |
| 9 | Amount less than $1 million. | |
| 10 | Class T and 529-T shares began investment operations on April 7, 2017. | |
| 11 | Class F-3 shares began investment operations on January 27, 2017. | |
| 12 | Class R-2E shares began investment operations on August 29, 2014. | |
| 13 | Class R-5E shares began investment operations on November 20, 2015. |
| International Growth and Income Fund | 39 |
| Expense example | unaudited |
As a fund shareholder, you incur two types of costs: (1) transaction costs, such as initial sales charges on purchase payments and contingent deferred sales charges on redemptions (loads), and (2) ongoing costs, including management fees, distribution and service (12b-1) fees, and other expenses. This example is intended to help you understand your ongoing costs (in dollars) of investing in the fund so you can compare these costs with the ongoing costs of investing in other mutual funds. The example is based on an investment of $1,000 invested at the beginning of the period and held for the entire six-month period (July 1, 2017, through December 31, 2017).
Actual expenses:
The first line of each share class in the table on the following page provides information about actual account values and actual expenses. You may use the information in this line, together with the amount you invested, to estimate the expenses that you paid over the period. Simply divide your account value by $1,000 (for example, an $8,600 account value divided by $1,000 = 8.6), then multiply the result by the number in the first line under the heading titled “Expenses paid during period” to estimate the expenses you paid on your account during this period.
Hypothetical example for comparison purposes:
The second line of each share class in the table on the following page provides information about hypothetical account values and hypothetical expenses based on the actual expense ratio for the share class and an assumed rate of return of 5.00% per year before expenses, which is not the actual return of the share class. The hypothetical account values and expenses may not be used to estimate the actual ending account balance or expenses you paid for the period. You may use this information to compare the ongoing costs of investing in the fund and other funds. To do so, compare this 5.00% hypothetical example with the 5.00% hypothetical examples that appear in the shareholder reports of the other funds.
Notes:
Retirement plan participants may be subject to certain fees charged by the plan sponsor, and Class F-1, F-2, F-3 and 529-F-1 shareholders may be subject to fees charged by financial intermediaries, typically ranging from 0.75% to 1.50% of assets annually depending on services offered. You can estimate the impact of these fees by adding the amount of the fees to the total estimated expenses you paid on your account during the period as calculated above. In addition, your ending account value would be lower by the amount of these fees.
Note that the expenses shown in the table on the following page are meant to highlight your ongoing costs only and do not reflect any transactional costs, such as sales charges (loads). Therefore, the second line of each share class in the table is useful in comparing ongoing costs only and will not help you determine the relative total costs of owning different funds. In addition, if these transactional costs were included, your costs would have been higher.
| 40 | International Growth and Income Fund |
| Class A - actual return | $ | 1,000.00 | $ | 1,099.77 | $ | 4.87 | .92 | % | ||||||||
| Class A - assumed 5% return | 1,000.00 | 1,020.57 | 4.69 | .92 | ||||||||||||
| Class C - actual return | 1,000.00 | 1,095.79 | 8.98 | 1.70 | ||||||||||||
| Class C - assumed 5% return | 1,000.00 | 1,016.64 | 8.64 | 1.70 | ||||||||||||
| Class T - actual return | 1,000.00 | 1,101.28 | 3.76 | .71 | ||||||||||||
| Class T - assumed 5% return | 1,000.00 | 1,021.63 | 3.62 | .71 | ||||||||||||
| Class F-1 - actual return | 1,000.00 | 1,099.77 | 5.08 | .96 | ||||||||||||
| Class F-1 - assumed 5% return | 1,000.00 | 1,020.37 | 4.89 | .96 | ||||||||||||
| Class F-2 - actual return | 1,000.00 | 1,100.96 | 3.65 | .69 | ||||||||||||
| Class F-2 - assumed 5% return | 1,000.00 | 1,021.73 | 3.52 | .69 | ||||||||||||
| Class F-3 - actual return | 1,000.00 | 1,101.94 | 3.13 | .59 | ||||||||||||
| Class F-3 - assumed 5% return | 1,000.00 | 1,022.23 | 3.01 | .59 | ||||||||||||
| Class 529-A - actual return | 1,000.00 | 1,099.67 | 5.13 | .97 | ||||||||||||
| Class 529-A - assumed 5% return | 1,000.00 | 1,020.32 | 4.94 | .97 | ||||||||||||
| Class 529-C - actual return | 1,000.00 | 1,095.32 | 9.30 | 1.76 | ||||||||||||
| Class 529-C - assumed 5% return | 1,000.00 | 1,016.33 | 8.94 | 1.76 | ||||||||||||
| Class 529-E - actual return | 1,000.00 | 1,098.55 | 6.24 | 1.18 | ||||||||||||
| Class 529-E - assumed 5% return | 1,000.00 | 1,019.26 | 6.01 | 1.18 | ||||||||||||
| Class 529-T - actual return | 1,000.00 | 1,101.03 | 3.97 | .75 | ||||||||||||
| Class 529-T - assumed 5% return | 1,000.00 | 1,021.42 | 3.82 | .75 | ||||||||||||
| Class 529-F-1 - actual return | 1,000.00 | 1,100.72 | 3.97 | .75 | ||||||||||||
| Class 529-F-1 - assumed 5% return | 1,000.00 | 1,021.42 | 3.82 | .75 | ||||||||||||
| Class R-1 - actual return | 1,000.00 | 1,095.93 | 8.82 | 1.67 | ||||||||||||
| Class R-1 - assumed 5% return | 1,000.00 | 1,016.79 | 8.49 | 1.67 | ||||||||||||
| Class R-2 - actual return | 1,000.00 | 1,095.92 | 8.82 | 1.67 | ||||||||||||
| Class R-2 - assumed 5% return | 1,000.00 | 1,016.79 | 8.49 | 1.67 | ||||||||||||
| Class R-2E - actual return | 1,000.00 | 1,097.25 | 7.35 | 1.39 | ||||||||||||
| Class R-2E - assumed 5% return | 1,000.00 | 1,018.20 | 7.07 | 1.39 | ||||||||||||
| Class R-3 - actual return | 1,000.00 | 1,098.23 | 6.56 | 1.24 | ||||||||||||
| Class R-3 - assumed 5% return | 1,000.00 | 1,018.95 | 6.31 | 1.24 | ||||||||||||
| Class R-4 - actual return | 1,000.00 | 1,100.12 | 4.92 | .93 | ||||||||||||
| Class R-4 - assumed 5% return | 1,000.00 | 1,020.52 | 4.74 | .93 | ||||||||||||
| Class R-5E - actual return | 1,000.00 | 1,100.75 | 3.97 | .75 | ||||||||||||
| Class R-5E - assumed 5% return | 1,000.00 | 1,021.42 | 3.82 | .75 | ||||||||||||
| Class R-5 - actual return | 1,000.00 | 1,101.49 | 3.34 | .63 | ||||||||||||
| Class R-5 - assumed 5% return | 1,000.00 | 1,022.03 | 3.21 | .63 | ||||||||||||
| Class R-6 - actual return | 1,000.00 | 1,102.01 | 3.07 | .58 | ||||||||||||
| Class R-6 - assumed 5% return | 1,000.00 | 1,022.28 | 2.96 | .58 |
| * | The “expenses paid during period” are equal to the “annualized expense ratio,” multiplied by the average account value over the period, multiplied by the number of days in the period, and divided by 365 (to reflect the one-half year period). |
| International Growth and Income Fund | 41 |
Approval of Investment Advisory and Service Agreement
International Growth and Income Fund’s board has approved the fund’s Investment Advisory and Service Agreement (the “agreement”) with Capital Research and Management Company (“CRMC”) for an additional one-year term through January 31, 2019. The board approved the agreement following the recommendation of the fund’s Contracts Committee (the “committee”), which is composed of all of the fund’s independent board members. The board and the committee determined in the exercise of their business judgment that the fund’s advisory fee structure was fair and reasonable in relation to the services provided, and that approving the agreement was in the best interests of the fund and its shareholders.
In reaching this decision, the board and the committee took into account information furnished to them throughout the year and otherwise provided to them, as well as information prepared specifically in connection with their review of the agreement, and were advised by their independent counsel. They considered the following factors, among others, but did not identify any single issue or particular piece of information that, in isolation, was the controlling factor, and each board and committee member did not necessarily attribute the same weight to each factor.
1. Nature, extent and quality of services
The board and the committee considered the depth and quality of CRMC’s investment management process, including its global research capabilities; the experience, capability and integrity of its senior management and other personnel; the low turnover rates of its key personnel; the overall financial strength and stability of CRMC and the Capital Group organization; and the ongoing evolution of CRMC’s organizational structure designed to maintain and strengthen these qualities. The board and the committee also considered the nature, extent and quality of administrative, compliance and shareholder services provided by CRMC to the fund under the agreement and other agreements, as well as the benefits to fund shareholders from investing in a fund that is part of a large family of funds. The board and the committee concluded that the nature, extent and quality of the services provided by CRMC have benefited and should continue to benefit the fund and its shareholders.
2. Investment results
The board and the committee considered the investment results of the fund in light of its objective of providing long-term growth of capital with current income. They compared the fund’s investment results with those of other funds (including funds that form the basis of the Lipper index for the category in which the fund is included), and data such as relevant market and fund indexes, over various periods through June 30, 2017. This report, including the letter to shareholders and related disclosures, contains certain information about the fund’s investment results. The board and the committee reviewed the fund’s investment results measured against various indexes, including the Lipper International Funds Index and the MSCI All Country World ex USA Index. They noted that the investment results of the fund exceeded the results of the Lipper Index and the MSCI Index for the lifetime period and were mixed for shorter periods. They also noted that the volatility of the fund’s monthly returns for the period was less than that of both indexes. The board and the committee concluded that the fund’s investment results have been satisfactory for
| 42 | International Growth and Income Fund |
renewal of the agreement and that CRMC’s record in managing the fund indicated that its continued management should benefit the fund and its shareholders.
3. Advisory fees and total expenses
The board and the committee compared the advisory fees and total expense levels of the fund to those of other relevant funds. They observed that the fund’s advisory fees and expenses generally compared favorably to those of other similar funds included in the Lipper International Funds category. The board and the committee also considered the breakpoint discounts in the fund’s advisory fee structure that reduce the level of fees charged by CRMC to the fund as fund assets increase. In addition, they reviewed information regarding the effective advisory fees charged to non-mutual fund clients by CRMC and its affiliates. They noted that, to the extent there were differences between the advisory fees paid by the fund and the advisory fees paid by those clients, the differences appropriately reflected the investment, operational and regulatory differences between advising the fund and the other clients. The board and the committee concluded that the fund’s cost structure was fair and reasonable in relation to the services provided, the Funds’ advisory fee structure reflected a reasonable sharing of benefits between CRMC and the Funds’ shareholders and that the fund’s shareholders receive reasonable value in return for the advisory fees and other amounts paid to CRMC by the fund.
4. Ancillary benefits
The board and the committee considered a variety of other benefits that CRMC and its affiliates receive as a result of CRMC’s relationship with the fund and the other American Funds, including fees for administrative services provided to certain share classes; fees paid to CRMC’s affiliated transfer agent; sales charges and distribution fees received and retained by the fund’s principal underwriter, an affiliate of CRMC; and possible ancillary benefits to CRMC and its institutional management affiliates in managing other investment vehicles. The board and the committee reviewed CRMC’s portfolio trading practices, noting the benefits CRMC receives from the research obtained with commissions from portfolio transactions made on behalf of the fund. The board and the committee took these ancillary benefits into account in evaluating the reasonableness of the advisory fees and other amounts paid to CRMC by the fund.
5. Adviser financial information
The board and the committee reviewed information regarding CRMC’s costs of providing services to the American Funds, including personnel, systems and resources of investment, compliance, trading, accounting and other administrative operations. They considered CRMC’s costs and related cost allocation methodology as well as its willingness to invest in technology, infrastructure and staff to maintain and expand services and capabilities, respond to industry and regulatory developments, and attract and retain qualified personnel.They noted information regarding the compensation structure for CRMC’s investment professionals. The board and the committee also compared CRMC’s profitability and compensation data to the reported results and data of several large, publicly held investment management companies. The board and the committee noted the competitiveness and cyclicality of both the mutual fund industry and the capital markets, and the importance in that environment of CRMC’s long-term profitability for maintaining its independence, company culture and management continuity.
| International Growth and Income Fund | 43 |
Office of the fund
6455 Irvine Center Drive
Irvine, CA 92618-4518
Investment adviser
Capital Research and Management Company
333 South Hope Street
Los Angeles, CA 90071-1406
6455 Irvine Center Drive
Irvine, CA 92618-4518
Transfer agent for shareholder accounts
American Funds Service Company
(Write to the address near you.)
P.O. Box 6007
Indianapolis, IN 46206-6007
P.O. Box 2280
Norfolk, VA 23501-2280
Custodian of assets
JPMorgan Chase Bank
270 Park Avenue
New York, NY 10017-2070
Counsel
Morgan, Lewis & Bockius LLP
300 South Grand Avenue, 22nd Floor
Los Angeles, CA 90071-3132
Independent registered public accounting firm
Deloitte & Touche LLP
695 Town Center Drive
Suite 1200
Costa Mesa, CA 92626-7188
Principal underwriter
American Funds Distributors, Inc.
333 South Hope Street
Los Angeles, CA 90071-1406
| 44 | International Growth and Income Fund |
Investors should carefully consider investment objectives, risks, charges and expenses. This and other important information is contained in the fund prospectus and summary prospectus, which can be obtained from your financial professional and should be read carefully before investing. You may also call American Funds Service Company (AFS) at (800) 421-4225 or visit the American Funds website at americanfunds.com. Fund shares offered through American Funds Distributors, Inc.
“American Funds Proxy Voting Procedures and Principles” — which describes how we vote proxies relating to portfolio securities — is available on the American Funds website or upon request by calling AFS. The fund files its proxy voting record with the U.S. Securities and Exchange Commission (SEC) for the 12 months ended June 30 by August 31. The proxy voting record is available free of charge on the SEC website at sec.gov and on the American Funds website.
A complete December 31, 2017, portfolio of International Growth and Income Fund’s investments is available free of charge by calling AFS or visiting the SEC website (where it is part of Form N-CSR).
International Growth and Income Fund files a complete list of its portfolio holdings with the SEC for the first and third quarters of each fiscal year on Form N-Q. This filing is available free of charge on the SEC website. You may also review or, for a fee, copy this filing at the SEC’s Public Reference Room in Washington, D.C. Additional information regarding the operation of the Public Reference Room may be obtained by calling the SEC’s Office of Investor Education and Advocacy at (800) SEC-0330. Additionally, the list of portfolio holdings is available by calling AFS.
This report is for the information of shareholders of International Growth and Income Fund, but it also may be used as sales literature when preceded or accompanied by the current prospectus or summary prospectus, which gives details about charges, expenses, investment objectives and operating policies of the fund. If used as sales material after March 31, 2018, this report must be accompanied by an American Funds statistical update for the most recently completed calendar quarter.
MSCI has not approved, reviewed or produced this report, makes no express or implied warranties or representations and is not liable whatsoever for any data in the report. You may not redistribute the MSCI data or use it as a basis for other indices or investment products.
American Funds from Capital Group
The Capital Advantage®
Since 1931, American Funds, part of Capital Group, has helped investors pursue long-term investment success. Our consistent approach — in combination with The Capital SystemSM — has resulted in a superior long-term track record.
| Aligned with investor success | |
| We base our decisions on a long-term perspective, which we believe aligns our goals with the interests of our clients. Our portfolio managers average 27 years of investment experience, including 21 years at our company, reflecting a career commitment to our long-term approach.1 | |
| The Capital System | |
| The Capital System combines individual accountability with teamwork. Funds using The Capital System are divided into portions that are managed independently by investment professionals with diverse backgrounds, ages and investment approaches. An extensive global research effort is the backbone of our system. | |
| American Funds’ superior long-term track record | |
| Equity funds have beaten their Lipper peer indexes in 92% of 10-year periods and 99% of 20-year periods. Fixed income funds have beaten their Lipper indexes in 77% of 10-year periods and 80% of 20-year periods.2 Fund management fees have been among the lowest in the industry.3 |
| 1 | Portfolio manager experience as of December 31, 2017. | |
| 2 | Based on Class F-2 share results for rolling periods through December 31, 2017. Periods covered are the shorter of the fund’s lifetime or since the comparable Lipper index inception date (except Capital Income Builder and SMALLCAP World Fund, for which the Lipper average was used). Expenses differ for each share class, so results will vary. Class F-2 shares were first offered on August 1, 2008. Class F-2 share results prior to the date of first sale are hypothetical based on Class A share results without a sales charge, adjusted for typical estimated expenses. Results for certain funds with an inception date after August 1, 2008, also include hypothetical returns because those funds’ Class F-2 shares sold after the funds’ date of first offering. Please see americanfunds.com for more information on specific expense adjustments and the actual dates of first sale. | |
| 3 | On average, our management fees were in the lowest quintile 71% of the time, based on the 20-year period ended December 31, 2017, versus comparable Lipper categories, excluding funds of funds. |
ITEM 2 – Code of Ethics
Not applicable for filing of semi-annual reports to shareholders.
ITEM 3 – Audit Committee Financial Expert
Not applicable for filing of semi-annual reports to shareholders.
ITEM 4 – Principal Accountant Fees and Services
Not applicable for filing of semi-annual reports to shareholders.
ITEM 5 – Audit Committee of Listed Registrants
Not applicable to this Registrant, insofar as the Registrant is not a listed issuer as defined in Rule 10A-3 under the Securities Exchange Act of 1934.
ITEM 6 – Schedule of Investments

International Growth and Income FundSM
Investment portfolio
December 31, 2017
unaudited
| Common stocks 93.41% Financials 16.80% | Shares | Value (000) |
| Prudential PLC1 | 10,199,572 | $262,233 |
| AXA SA1 | 7,426,800 | 220,119 |
| AIA Group Ltd.1 | 23,543,600 | 200,787 |
| Banco Santander, SA1 | 24,724,725 | 162,129 |
| Société Générale1 | 3,075,400 | 158,560 |
| BM&FBOVESPA SA - Bolsa de Valores, Mercadorias e Futuros, ordinary nominative | 20,725,000 | 142,328 |
| HDFC Bank Ltd.1 | 2,396,694 | 70,874 |
| HDFC Bank Ltd. (ADR) | 498,707 | 50,704 |
| BNP Paribas SA1 | 1,501,000 | 111,935 |
| ABN AMRO Group NV, depository receipts1 | 3,213,437 | 103,402 |
| Svenska Handelsbanken AB, Class A1 | 6,307,000 | 86,094 |
| Toronto-Dominion Bank (CAD denominated) | 1,368,000 | 80,154 |
| Credit Suisse Group AG1 | 4,250,041 | 75,652 |
| Daiwa Securities Group Inc.1 | 10,282,000 | 64,527 |
| AIB Group PLC1,2 | 8,104,002 | 52,580 |
| AIB Group PLC1 | 1,527,318 | 10,079 |
| Oversea-Chinese Banking Corp. Ltd.1 | 6,313,000 | 58,326 |
| DBS Group Holdings Ltd1 | 2,840,000 | 52,585 |
| Aviva PLC1 | 7,495,000 | 51,221 |
| Sberbank of Russia PJSC (ADR)1 | 2,955,000 | 50,016 |
| Housing Development Finance Corp. Ltd.1 | 1,652,687 | 44,232 |
| Ping An Insurance (Group) Co. of China, Ltd., Class H1 | 3,899,000 | 40,582 |
| Bank Central Asia Tbk PT1 | 24,450,800 | 39,413 |
| Danske Bank AS1 | 1,000,000 | 38,876 |
| HSBC Holdings PLC (GBP denominated)1 | 3,762,000 | 38,798 |
| Sampo Oyj, Class A1 | 677,500 | 37,219 |
| ORIX Corp.1 | 2,200,000 | 37,198 |
| Moscow Exchange MICEX-RTS PJSC1 | 19,130,000 | 36,162 |
| Piraeus Bank SA1,2 | 12,077 | 44 |
| 2,376,829 | ||
| Consumer discretionary 11.45% | ||
| Sony Corp.1 | 4,870,000 | 218,756 |
| MGM China Holdings, Ltd.1 | 60,772,800 | 183,829 |
| Wynn Macau, Ltd.1 | 42,474,000 | 133,819 |
| Nitori Holdings Co., Ltd.1 | 612,000 | 87,263 |
| Axel Springer SE1 | 1,116,501 | 86,995 |
| HUGO BOSS AG1 | 948,298 | 80,439 |
| Paddy Power Betfair PLC1 | 554,649 | 65,801 |
| ProSiebenSat.1 Media SE1 | 1,860,000 | 64,041 |
| Prada SpA1 | 16,462,700 | 59,640 |
| Sands China Ltd.1 | 11,533,200 | 59,360 |
| Kroton Educacional SA, ordinary nominative | 9,600,000 | 53,251 |
| adidas AG1 | 266,500 | 53,200 |
| Carnival Corp., units | 788,000 | 52,299 |
| Hyundai Motor Co., Series 21 | 547,266 | 52,160 |
| Cie. Financière Richemont SA, Class A1 | 567,500 | 51,383 |
International Growth and Income Fund — Page 1 of 6
unaudited
| Common stocks Consumer discretionary (continued) | Shares | Value (000) |
| Intercontinental Hotels Group PLC1 | 783,200 | $49,816 |
| Accor SA1 | 940,000 | 48,453 |
| Ryohin Keikaku Co., Ltd.1 | 145,000 | 45,146 |
| OPAP SA1 | 3,042,048 | 38,279 |
| Las Vegas Sands Corp. | 485,000 | 33,703 |
| Peugeot SA1 | 1,521,000 | 30,897 |
| Hyundai Mobis Co., Ltd.1 | 109,000 | 26,795 |
| Continental AG1 | 97,000 | 26,188 |
| SES SA, Class A (FDR)1 | 1,190,000 | 18,544 |
| 1,620,057 | ||
| Information technology 10.56% | ||
| Taiwan Semiconductor Manufacturing Co., Ltd.1 | 63,370,506 | 486,943 |
| Nintendo Co., Ltd.1 | 471,800 | 171,760 |
| Vanguard International Semiconductor Corp.1 | 62,262,000 | 137,746 |
| Samsung Electronics Co., Ltd.1 | 48,700 | 115,703 |
| AAC Technologies Holdings Inc.1 | 5,894,000 | 104,822 |
| ASML Holding NV1 | 597,500 | 103,659 |
| Murata Manufacturing Co., Ltd.1 | 492,000 | 65,758 |
| Delta Electronics, Inc.1 | 11,655,000 | 56,125 |
| Telefonaktiebolaget LM Ericsson, Class B1 | 8,118,692 | 53,220 |
| ASM Pacific Technology Ltd.1 | 3,757,100 | 52,258 |
| Tech Mahindra Ltd.1 | 5,402,500 | 42,614 |
| Alibaba Group Holding Ltd. (ADR)2 | 225,000 | 38,797 |
| Quanta Computer Inc.1 | 17,957,830 | 37,288 |
| Tencent Holdings Ltd.1 | 517,000 | 26,726 |
| 1,493,419 | ||
| Energy 9.32% | ||
| Royal Dutch Shell PLC, Class B1 | 9,964,300 | 336,065 |
| Royal Dutch Shell PLC, Class B (ADR) | 180,000 | 12,292 |
| Royal Dutch Shell PLC, Class A1 | 209,458 | 7,012 |
| Royal Dutch Shell PLC, Class A (ADR) | 3,291 | 220 |
| Enbridge Inc. (CAD denominated) | 5,028,416 | 196,656 |
| Enbridge Inc. (CAD denominated)1,3 | 133,054 | 5,100 |
| Reliance Industries Ltd.1 | 12,123,000 | 174,893 |
| Schlumberger Ltd. | 2,308,000 | 155,536 |
| TOTAL SA1 | 2,409,296 | 132,934 |
| Pembina Pipeline Corp. | 2,981,591 | 107,949 |
| LUKOIL Oil Co. PJSC (ADR)1 | 1,305,000 | 74,653 |
| Keyera Corp. | 1,796,000 | 50,608 |
| Gazprom PJSC (ADR)1 | 7,905,000 | 34,856 |
| Coal India Ltd.1 | 5,700,000 | 23,482 |
| Peyto Exploration & Development Corp. | 541,000 | 6,469 |
| 1,318,725 | ||
| Consumer staples 7.94% | ||
| British American Tobacco PLC1 | 4,906,300 | 331,128 |
| Nestlé SA1 | 2,393,700 | 205,696 |
| Booker Group PLC1 | 40,453,000 | 124,545 |
| Kao Corp.1 | 1,438,750 | 97,314 |
| Pernod Ricard SA1 | 502,800 | 79,589 |
| Philip Morris International Inc. | 682,500 | 72,106 |
| Shoprite Holdings Ltd.1 | 2,752,864 | 49,212 |
| Carlsberg A/S, Class B1 | 377,860 | 45,259 |
International Growth and Income Fund — Page 2 of 6
unaudited
| Common stocks Consumer staples (continued) | Shares | Value (000) |
| Coca-Cola European Partners PLC | 1,090,000 | $43,436 |
| Associated British Foods PLC1 | 1,078,522 | 41,002 |
| Ambev SA | 5,255,000 | 33,712 |
| 1,122,999 | ||
| Industrials 7.89% | ||
| Airbus SE, non-registered shares1 | 1,504,900 | 149,445 |
| International Consolidated Airlines Group, SA (CDI)1 | 14,485,000 | 127,045 |
| BAE Systems PLC1 | 16,170,000 | 124,367 |
| Flughafen Zürich AG1 | 488,700 | 111,750 |
| Ryanair Holdings PLC (ADR)2 | 757,529 | 78,927 |
| Alliance Global Group, Inc.1,2 | 229,600,000 | 73,492 |
| ACS, Actividades de Construcción y Servicios SA1 | 1,617,416 | 63,283 |
| Meggitt PLC1 | 9,144,324 | 59,210 |
| CCR SA, ordinary nominative | 10,686,000 | 52,027 |
| Geberit AG1 | 115,500 | 50,821 |
| Edenred SA1 | 1,530,000 | 44,325 |
| ASSA ABLOY AB, Class B1 | 1,963,000 | 40,733 |
| Cía. de Distribución Integral Logista Holdings, SA, non-registered shares1 | 1,766,000 | 40,610 |
| MTU Aero Engines AG1 | 195,205 | 34,914 |
| Grupo Aeroportuario del Pacífico SAB de CV | 2,572,000 | 26,435 |
| DCC PLC1 | 258,000 | 25,996 |
| Kühne + Nagel International AG1 | 70,000 | 12,371 |
| 1,115,751 | ||
| Materials 7.41% | ||
| Rio Tinto PLC1 | 3,515,000 | 185,512 |
| Glencore PLC1 | 28,936,856 | 152,245 |
| Koninklijke DSM NV1 | 1,130,000 | 107,717 |
| James Hardie Industries PLC (CDI)1 | 5,265,000 | 92,684 |
| Vale SA, ordinary nominative (ADR) | 4,090,000 | 50,021 |
| Vale SA, ordinary nominative | 3,475,037 | 42,177 |
| Air Liquide SA1 | 485,224 | 61,027 |
| Air Liquide SA, bonus shares1 | 221,127 | 27,812 |
| Boral Ltd.1 | 13,020,784 | 78,914 |
| Asahi Kasei Corp.1 | 4,700,000 | 60,545 |
| Potash Corp. of Saskatchewan Inc. (CAD denominated) | 2,911,100 | 59,704 |
| Boliden AB1 | 1,141,000 | 38,867 |
| Anhui Conch Cement Co. Ltd., Class H1 | 8,117,000 | 38,173 |
| Klabin SA, units | 6,035,000 | 32,021 |
| Croda International PLC1 | 183,448 | 10,954 |
| Amcor Ltd.1 | 860,000 | 10,333 |
| 1,048,706 | ||
| Utilities 5.89% | ||
| Ørsted AS1 | 2,959,930 | 161,259 |
| Enel SPA1 | 25,834,334 | 158,793 |
| Rubis SCA1 | 1,683,037 | 118,986 |
| Northland Power Inc. | 4,659,000 | 86,545 |
| EDP - Energias de Portugal, SA1 | 16,944,600 | 58,652 |
| SSE PLC1 | 2,915,826 | 51,945 |
| Brookfield Infrastructure Partners LP | 1,130,000 | 50,684 |
| Power Assets Holdings Ltd.1 | 5,583,000 | 47,116 |
| Infraestructura Energética Nova, SAB de CV | 8,624,100 | 42,304 |
International Growth and Income Fund — Page 3 of 6
unaudited
| Common stocks Utilities (continued) | Shares | Value (000) |
| NTPC Ltd.1 | 14,840,000 | $41,156 |
| CK Infrastructure Holdings Ltd.1 | 1,797,000 | 15,427 |
| 832,867 | ||
| Health care 4.95% | ||
| AstraZeneca PLC1 | 3,248,000 | 222,887 |
| Bayer AG1 | 777,500 | 96,702 |
| Hypermarcas SA, ordinary nominative | 8,200,000 | 88,993 |
| Novartis AG1 | 977,600 | 82,648 |
| Novo Nordisk A/S, Class B1 | 1,429,475 | 76,827 |
| Fisher & Paykel Healthcare Corp. Ltd.1 | 4,336,000 | 43,970 |
| Sanofi1 | 440,000 | 37,886 |
| Roche Holding AG, non-registered shares, nonvoting1 | 102,000 | 25,800 |
| GlaxoSmithKline PLC1 | 1,388,000 | 24,551 |
| 700,264 | ||
| Telecommunication services 3.95% | ||
| Vodafone Group PLC1 | 61,795,000 | 195,215 |
| Mobile TeleSystems PJSC (ADR) | 9,208,000 | 93,829 |
| SoftBank Group Corp.1 | 1,002,500 | 79,201 |
| Koninklijke KPN NV1 | 14,937,628 | 52,113 |
| TDC A/S1 | 7,374,840 | 45,316 |
| BT Group PLC1 | 12,030,000 | 44,047 |
| Advanced Info Service PCL, foreign registered1 | 5,440,000 | 31,878 |
| HKT Trust and HKT Ltd., units1 | 13,428,000 | 17,124 |
| 558,723 | ||
| Real estate 2.44% | ||
| Link REIT1 | 17,712,152 | 164,131 |
| Longfor Properties Co. Ltd.1 | 25,493,000 | 63,876 |
| Brookfield Property Partners LP | 2,123,700 | 47,061 |
| Vonovia SE1 | 759,098 | 37,576 |
| Sun Hung Kai Properties Ltd.1 | 2,000,005 | 33,316 |
| 345,960 | ||
| Miscellaneous 4.81% | ||
| Other common stocks in initial period of acquisition | 680,552 | |
| Total common stocks (cost: $10,265,851,000) | 13,214,852 | |
| Preferred securities 0.22% Financials 0.22% | ||
| HSBC Holdings PLC, Series 2, 8.00% | 1,162,795 | 31,209 |
| Total preferred securities (cost: $30,265,000) | 31,209 | |
| Rights & warrants 0.00% Financials 0.00% | ||
| Piraeus Bank SA, warrants, expire 20181,2,4 | 8,630,614 | — |
| Total rights & warrants (cost: $0) | — |
International Growth and Income Fund — Page 4 of 6
unaudited
| Convertible bonds 0.46% Health care 0.33% | Principal?amount (000) | Value (000) |
| Bayer AG, convertible notes, 5.625% 2019 | € 34,700 | $46,894 |
| Financials 0.13% | ||
| Banco Bilbao Vizcaya Argentaria, SA, convertible notes, 7.00% (undated) | 14,400 | 18,202 |
| Total convertible bonds (cost: $57,678,000) | 65,096 | |
| Bonds, notes & other debt instruments 0.45% Bonds & notes of governments outside the U.S. 0.20% | ||
| Buenos Aires (City of) 8.95% 20213,5 | $25,000 | 27,813 |
| Corporate bonds & notes 0.18% Consumer discretionary 0.14% | ||
| Myriad International Holdings 6.00% 20203 | 18,700 | 20,146 |
| Financials 0.04% | ||
| SMFG Preferred Capital USD 3 Ltd., junior subordinated 9.50% 20493 | 5,410 | 5,623 |
| Total corporate bonds & notes | 25,769 | |
| U.S. Treasury bonds & notes 0.07% U.S. Treasury 0.07% | ||
| U.S. Treasury 0.75% 2018 | 10,000 | 9,992 |
| Total U.S. Treasury bonds & notes | 9,992 | |
| Total bonds, notes & other debt instruments (cost: $58,233,000) | 63,574 | |
| Short-term securities 5.42% | ||
| Bank of Nova Scotia 1.73% due 3/19/20183 | 36,400 | 36,263 |
| BNP Paribas, New York Branch 1.41% due 2/8/2018 | 34,600 | 34,540 |
| CPPIB Capital Inc. 1.31% due 1/5/20183 | 30,000 | 29,992 |
| Federal Home Loan Bank 1.13%–1.30% due 1/16/2018–2/28/2018 | 108,800 | 108,647 |
| Mizuho Bank, Ltd. 1.33%–1.65% due 1/16/2018–3/13/20183 | 88,600 | 88,391 |
| Nordea Bank AB 1.29% due 1/23/20183 | 53,500 | 53,447 |
| Oversea-Chinese Banking Corporation Limited 1.42% due 1/8/20183 | 75,000 | 74,971 |
| Royal Bank of Canada 1.53% due 1/16/2018 | 65,200 | 65,150 |
| Svenska Handelsbanken Inc. 1.29%–1.32% due 1/3/2018–1/25/20183 | 141,300 | 141,230 |
| Toronto-Dominion Bank 1.75% due 3/21/20183 | 25,000 | 24,902 |
| U.S. Treasury Bills 1.41%–1.55% due 5/31/2018–11/8/2018 | 110,700 | 109,546 |
| Total short-term securities (cost: $767,221,000) | 767,079 | |
| Total investment securities 99.96% (cost: $11,179,248,000) | 14,141,810 | |
| Other assets less liabilities 0.04% | 5,053 | |
| Net assets 100.00% | $14,146,863 |
As permitted by U.S. Securities and Exchange Commission regulations, “Miscellaneous” securities include holdings in their first year of acquisition that have not previously been publicly disclosed.
International Growth and Income Fund — Page 5 of 6
unaudited
Forward currency contracts
| Contract amount | Counterparty | Settlement date | Unrealized (depreciation) appreciation at 12/31/2017 (000) | |
| Purchases (000) | Sales (000) | |||
| USD4,103 | JPY465,000 | JPMorgan Chase | 1/10/2018 | $(27) |
| USD10,355 | JPY1,162,000 | Bank of America, N.A. | 1/22/2018 | 29 |
| USD4,145 | JPY465,000 | UBS AG | 2/23/2018 | 8 |
| $10 | ||||
The following footnotes apply to either the individual securities noted or one or more of the securities aggregated and listed as a single line item.
| 1 | Valued under fair value procedures adopted by authority of the board of trustees. The total value of all such securities, including those in “Miscellaneous,“ was $11,333,904,000, which represented 80.12% of the net assets of the fund. This amount includes $11,169,091,000 related to certain securities trading outside the U.S. whose values were adjusted as a result of significant market movements following the close of local trading. |
| 2 | Security did not produce income during the last 12 months. |
| 3 | Acquired in a transaction exempt from registration under Rule 144A or Section 4(2) of the Securities Act of 1933. May be resold in the U.S. in transactions exempt from registration, normally to qualified institutional buyers. The total value of all such securities was $507,878,000, which represented 3.59% of the net assets of the fund. |
| 4 | Value determined using significant unobservable inputs. |
| 5 | Principal payments may be made periodically. Therefore, the effective maturity date may be earlier than the stated maturity date. |
| Key to abbreviations and symbols |
| ADR = American Depositary Receipts |
| CAD = Canadian dollars |
| CDI = CREST Depository Interest |
| € = Euros |
| FDR = Fiduciary Depositary Receipts |
| GBP = British pounds |
| JPY = Japanese yen |
| USD/$ = U.S. dollars |
Additional financial disclosures are included in the fund’s current shareholder report and should be read in conjunction with this report.
Investments are not FDIC-insured, nor are they deposits of or guaranteed by a bank or any other entity, so they may lose value.
Investors should carefully consider investment objectives, risks, charges and expenses. This and other important information is contained in the fund prospectus and summary prospectus, which can be obtained from your financial professional and should be read carefully before investing. You may also call American Funds Service Company (AFS) at (800) 421-4225 or visit the American Funds website at americanfunds.com. Fund shares offered through American Funds Distributors, Inc.
| MFGEFPX-034-0218O-S60724 | International Growth and Income Fund — Page 6 of 6 |
ITEM 7 – Disclosure of Proxy Voting Policies and Procedures for Closed-End Management Investment Companies
Not applicable to this Registrant, insofar as the Registrant is not a closed-end management investment company.
ITEM 8 – Portfolio Managers of Closed-End Management Investment Companies
Not applicable to this Registrant, insofar as the Registrant is not a closed-end management investment company.
ITEM 9 – Purchases of Equity Securities by Closed-End Management Investment Company and Affiliated Purchasers
Not applicable to this Registrant, insofar as the Registrant is not a closed-end management investment company.
ITEM 10 – Submission of Matters to a Vote of Security Holders
There have been no material changes to the procedures by which shareholders may recommend nominees to the Registrant’s board of trustees since the Registrant last submitted a proxy statement to its shareholders. The procedures are as follows. The Registrant has a nominating and governance committee comprised solely of persons who are not considered ‘‘interested persons’’ of the Registrant within the meaning of the Investment Company Act of 1940, as amended. The committee periodically reviews such issues as the board’s composition, responsibilities, committees, compensation and other relevant issues, and recommends any appropriate changes to the full board of trustees. While the committee normally is able to identify from its own resources an ample number of qualified candidates, it will consider shareholder suggestions of persons to be considered as nominees to fill future vacancies on the board. Such suggestions must be sent in writing to the nominating and governance committee of the Registrant, c/o the Registrant’s Secretary, and must be accompanied by complete biographical and occupational data on the prospective nominee, along with a written consent of the prospective nominee for consideration of his or her name by the nominating and governance committee.
ITEM 11 – Controls and Procedures
| (a) | The Registrant’s Principal Executive Officer and Principal Financial Officer have concluded, based on their evaluation of the Registrant’s disclosure controls and procedures (as such term is defined in Rule 30a-3 under the Investment Company Act of 1940), that such controls and procedures are adequate and reasonably designed to achieve the purposes described in paragraph (c) of such rule. |
| (b) | There were no changes in the Registrant’s internal controls over financial reporting (as defined in Rule 30a-3(d) under the Investment Company Act of 1940) that occurred during the Registrant’s second fiscal quarter of the period covered by this report that has materially affected, or is reasonably likely to materially affect, the Registrant’s internal control over financial reporting. |
ITEM 12 – Exhibits
| (a)(1) | Not applicable for filing of semi-annual reports to shareholders. |
| (a)(2) | The certifications required by Rule 30a-2 of the Investment Company Act of 1940 and Sections 302 and 906 of the Sarbanes-Oxley Act of 2002 are attached as exhibits hereto. |
SIGNATURES
Pursuant to the requirements of the Securities Exchange Act of 1934 and the Investment Company Act of 1940, the Registrant has duly caused this report to be signed on its behalf by the undersigned, thereunto duly authorized.
| INTERNATIONAL GROWTH AND INCOME FUND | |
| By /s/ Paul F. Roye | |
Paul F. Roye, Executive Vice President and Principal Executive Officer | |
| Date: February 28, 2018 |
Pursuant to the requirements of the Securities Exchange Act of 1934 and the Investment Company Act of 1940, this report has been signed below by the following persons on behalf of the Registrant and in the capacities and on the dates indicated.
| By /s/ Paul F. Roye |
Paul F. Roye, Executive Vice President and Principal Executive Officer |
| Date: February 28, 2018 |
| By /s/ Brian C. Janssen |
Brian C. Janssen, Treasurer and Principal Financial Officer |
| Date: February 28, 2018 |