Exhibit 99.1

ZYNGA – Q1 2017 QUARTERLY EARNINGS LETTER
May 4, 2017
Dear Shareholders,
We look forward to discussing our Q1 results during today’s earnings call at 2:30 p.m. PT. Below, you’ll find our Q1 2017 Quarterly Earnings Letter which details our performance over the last quarter and progress in our turnaround, as well as guidance for Q2 and key areas of focus for this year and beyond. Please note that we manage our business based on several topline measures, including revenue, which is comprised of deferred revenue and bookings. Revenue and deferred revenue are both directly affected by bookings results, and our management team utilizes bookings as a primary topline measure to help inform their decisions. We’ve consolidated earnings-related news into our Quarterly Earnings Letter and are no longer distributing a separate detailed earnings press release. Additional materials, including our Quarterly Earnings Slides, are available on our investor relations website.
HIGHLIGHTS
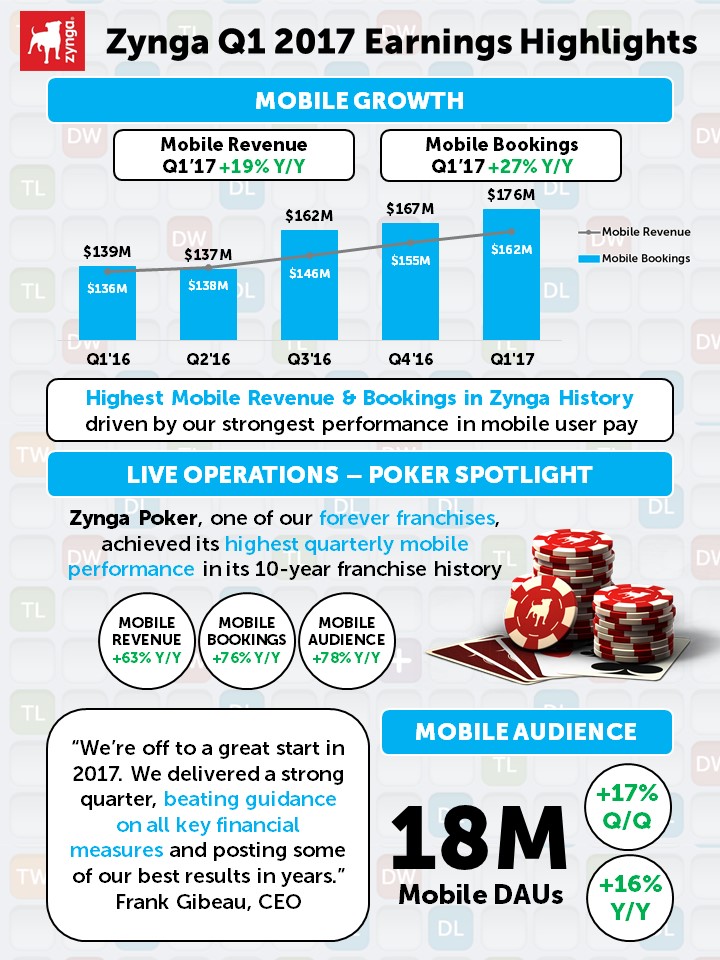
We’re off to a great start in 2017. Zynga is much stronger than it was 12 months ago, and we’re posting some of the best company performance metrics we’ve seen in years.
Highlights from the quarter include:
| • | We significantly outperformed our guidance in the quarter across all key financial measures. |
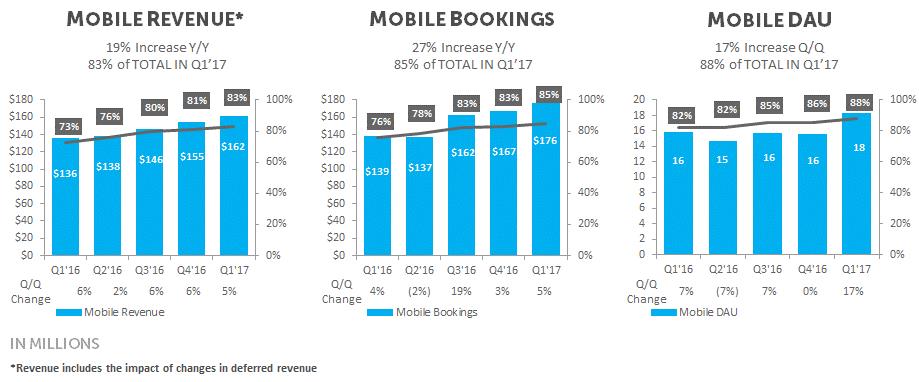
| • | Mobile revenue and bookings were the highest in Zynga history, with mobile revenue up 19% year-over-year and mobile bookings up 27% year-over-year. |
| • | Mobile online game – or user pay – revenue was up 31% year-over-year, and our mobile user pay bookings were up 40% year-over-year – both of which were the best in Zynga history. |
| • | Mobile audience reached 18 million average daily active users (DAU), the strongest year-over-year growth we’ve seen in two years – up 16% from Q1 2016. |
| • | Zynga Poker continued to show strong results, reflecting our focus on growing our existing live services as a top priority. The game saw its highest quarterly mobile performance in franchise history. Zynga Poker’s mobile revenue was up 63% year-over-year and mobile bookings were up 76% year-over-year. Zynga Poker also saw impressive gains in audience, with average mobile DAU up 78% year-over-year. |
| • | GAAP operating expenses for the quarter were 71% of revenue – down from 84% of revenue in Q1 2016 – and Non-GAAP operating expenses were 58% of bookings – down from 68% of bookings a year ago. |
| • | We continue to return capital to shareholders and to date we have repurchased 47 million shares at an average price of $2.72, leaving $73 million in our existing $200 million share buyback program. |
EXECUTIVE SUMMARY
(in millions) | Q1'17 Actuals | | Q1'16 Actuals | | Variance $ (Y/Y) | | Variance % (Y/Y) | | Q1'17 Guidance | | Variance $ (Guidance) | | Variance % (Guidance) |
Revenue | $ | 194.3 | | $ | 186.7 | | $ | 7.6 | | 4% | | $ | 185.0 | | $ | 9.3 | | 5% |
Net income (loss) | $ | (9.5) | | $ | (26.6) | | $ | 17.1 | | NA | | $ | (16.0) | | $ | 6.5 | | NA |
| | | | | | | | | | | | | | | | | | |
Bookings | $ | 207.4 | | $ | 181.6 | | $ | 25.7 | (2) | 14% | | $ | 190.0 | | $ | 17.4 | | 9% |
Adjusted EBITDA(1) | $ | 16.7 | | $ | 16.0 | | $ | 0.6 | (2) | 4% | | $ | 14.0 | | $ | 2.7 | | 19% |
| | | | | | | | | | | | | | | | | | |
Change in deferred revenue | $ | 13.1 | | $ | (5.1) | | $ | 18.2 | | NA | | $ | 5.0 | | $ | 8.1 | | NA |
(1) | Zynga's methodology for computing Adjusted EBITDA includes the change in deferred revenue. This methodology has also been applied for the first quarter of 2016, which was previously reported without the inclusion of deferred revenue before we applied the SEC Compliance and Disclosure Interpretations released on May 17, 2017. |
(2) | The variance of these measures, as presented, differ due to the impact of rounding. |
2
In Q1, revenue was $194.3 million, up 4% year-over-year, and above our guidance by $9.3 million. We had a net loss of $9.5 million, better than our guidance by $6.5 million and an improvement of $17.1 million year-over-year. In terms of our bookings performance, our teams delivered $207.4 million, beating our guidance by $17.4 million. This over delivery in the quarter was driven by better than expected results from our portfolio of live operations and a partial quarter contribution from Solitaire, which more than offset softness in advertising. The strength in bookings led to correspondingly higher revenue deferrals of $13.1 million, above our guidance estimate by $8.1 million. Our Q1 Adjusted EBITDA, which includes the impact of changes in deferred revenues, was $16.7 million, above our guidance by $2.7 million. This was primarily due to our bookings beat and lower than expected labor costs, offset by platform fees associated with the higher revenue deferrals.
Our Q1 outperformance was largely driven by the strength of our live operations particularly across Zynga Poker, CSR2 and Social Slots. Zynga Poker in particular showed strong results, delivering its highest quarterly mobile performance in franchise history. Zynga Poker’s mobile revenue was up 63% year-over-year and mobile bookings were up 76% year-over-year. Poker also saw impressive gains in audience, with average mobile DAU up 78% year-over-year – the strongest audience growth in the last two years for this forever franchise. As Zynga Poker celebrates its 10-year anniversary this July, the team is working hard to execute against a steady roadmap of new bold beats in the coming quarters.
CSR2 had a great holiday season and we continued that momentum into Q1. We released new events and partnerships, including exclusive content from iconic automotive brands like Porsche, McLaren and Lamborghini. The team’s commitment to live operations and delivering players unique content from their favorite auto manufacturers helped propel CSR2 into the Top 15 Grossing Game charts in the U.S. App Store last month and maintain its spot as the #1 Top Grossing Racing game in the U.S. App Store and Google Play Store. Last week, we launched a new Fast & Furious integration with Universal Brand Development which includes characters and cars from the Fate of the Furious. This new partnership includes a multi-month series of in-game events and social challenges across the blockbuster franchise. We’re excited about the team’s plans to deliver high quality features for players this year.
In Social Slots, the team has been focused on improving player engagement and monetization. Specifically, our goal has been to increase our average daily bookings per average DAU (ABPU) for the franchise, and we’ve seen a sequential improvement. This is primarily due to our investments in events and elder game optimization, as well as a strong performance from Wizard of Oz Slots and the team’s bold beat Choose Your Side. While we’re happy with the initial progress we’ve seen on ABPU, there’s more work to do to drive better results in our Social Slots portfolio.
We believe that one of the best measures to gauge momentum in our growth story is online game – or user pay – revenue and bookings. In Q1, our total user pay revenue was $153.5 million – up $16.4 million or up 12% year-over-year – and our total user pay bookings were $165.5 million – up $30.5 million or up 23% year-over-year. Our mobile user pay revenue was up 31% year-over-year and our mobile user pay bookings were up 40% year-over-year – the best we’ve seen in company history. Our payer conversion rates have also improved from 1.7% to 2.3% over the last year, up 36% year-over-year, reflecting our investment in live services.
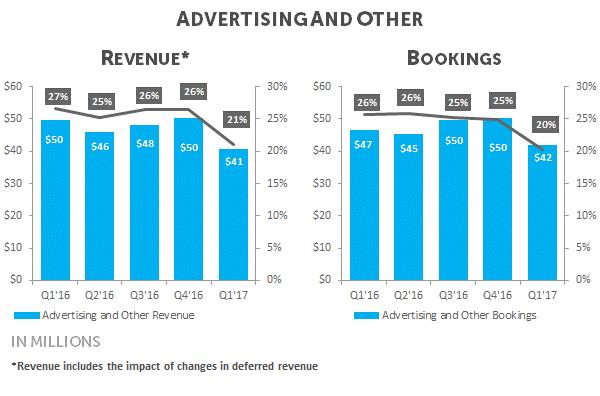
Looking at advertising, we’re seeing softness in the gaming advertising market. In Q1, our advertising and other revenue was down $8.9 million or 18% year-over-year, and our advertising and other bookings were down $4.7 million or 10% year-over-year. Despite these advertising trends, Words With Friends, our largest ad-driven game, increased its audience with average mobile DAU up 4% sequentially – an indicator of the game’s strong engagement. Over the last few quarters, we’ve been testing new features in order to deliver more value for Words With Friends players. As we look to the remainder of 2017, we expect advertising revenue and bookings to grow marginally as we progress through the year.
On the operating front, we’re continuing to improve our business fundamentals and sharpen our operating model. We’ve built a new management team, redefined live operations as a core strength of the company, reprioritized our investments and dramatically increased year-over-year profitability. Our GAAP operating expenses for the quarter were 71% of revenue – down from 84% of revenue in Q1 2016 – and Non-GAAP operating expenses were 58% of bookings – down from 68% of bookings a year ago. We’re encouraged by this progress and believe there’s more work to be done to unlock more operating leverage across the company and increase shareholder value. We remain on track to deliver margins in line with our peers over the long-term.
3
Q1 PERFORMANCE OVERVIEW
Q1 Financial Highlights
| • | Revenue of $194.3 million; above our guidance, up 4% year-over-year and up 2% sequentially |
| • | GAAP operating expenses of $138.4 million, down 12% year-over-year and down 15% sequentially |
| • | Net loss of $9.5 million, better than our guidance and an improvement of $17.1 million year-over-year and $26.0 million sequentially |
| • | Deferred revenue increased by $13.1 million; $8.1 million above our guidance |
| • | Bookings of $207.4 million; above our guidance, up 14% year-over-year and up 3% sequentially |
| • | Non-GAAP operating expenses of $121.2 million were in line with our expectations; down 2% year-over-year and down 4% sequentially |
| • | Adjusted EBITDA, which includes the impact of changes in deferred revenue, of $16.7 million; above our guidance |
| • | Operating cash flow of negative $4.7 million, down $1.4 million year-over-year and down $32.5 million sequentially |
Q1 Mobile Highlights
| • | Mobile revenue of $161.6 million or 83% of overall revenue; up 19% year-over-year and up 4% sequentially |
| • | Mobile bookings of $176.1 million or 85% of overall bookings; up 27% year-over-year and up 5% sequentially |
| • | Average mobile DAUs of 18 million; up 16% year-over-year and up 17% sequentially |
| • | Apple and Google continue to be our two largest platform partners for user pay revenue and bookings |
4
Q1 Advertising Highlights
| • | We’re seeing softness in the gaming advertising market |
| • | Advertising and other revenue of $40.8 million or 21% of overall revenue; down 18% year-over-year and down 19% sequentially |
| • | Advertising and other bookings of $41.9 million or 20% of overall bookings; down 10% year-over-year and down 17% sequentially |
| • | As we look across 2017, we expect advertising to grow marginally as we progress through the year when including Solitaire |
| • | We continue to look for more ways to integrate our popular advertising products with key brand partners within our products |
Player Metrics (users and payers in millions)
| | Three Months Ended | | | | | | | | | |
| | March 31, | | | December 31, | | | March 31, | | | Q1'17 | | | Q1'17 | |
| | 2017 | | | 2016 | | | 2016 | | | Q/Q | | | Y/Y | |
Average daily active users (DAUs) | | | 21 | | | | 18 | | | | 19 | | | | 14 | % | | | 8 | % |
Average mobile DAUs | | | 18 | | | | 16 | | | | 16 | | | | 17 | % | | | 16 | % |
Average web DAUs | | | 3 | | | | 2 | | | | 3 | | | | (5 | )% | | | (30 | )% |
| | | | | | | | | | | | | | | | | | | | |
Average monthly active user (MAUs) | | | 72 | | | | 63 | | | | 68 | | | | 15 | % | | | 5 | % |
Average mobile MAUs | | | 63 | | | | 53 | | | | 55 | | | | 19 | % | | | 13 | % |
Average web MAUs | | | 9 | | | | 10 | | | | 13 | | | | (9 | )% | | | (28 | )% |
| | | | | | | | | | | | | | | | | | | | |
Average daily bookings per average DAU (ABPU) | | $ | 0.107 | | | $ | 0.120 | | | $ | 0.103 | | | | (10 | )% | | | 4 | % |
Average monthly unique users (MUUs) (1) | | | 56 | | | | 56 | | | | 56 | | | | (1 | )% | | | (1 | )% |
Average monthly unique payers (MUPs) (1) | | | 1.3 | | | | 1.2 | | | | 1.0 | | | | 6 | % | | | 35 | % |
Payer conversion (1) | | | 2.3 | % | | | 2.2 | % | | | 1.7 | % | | | 7 | % | | | 36 | % |
| | | | | | | | | | | | | | | | | | | | |
(1) | For the first quarter of 2017, Vegas Diamond Slots, Daily Celebrity Crossword and Solitaire are excluded from MUUs, MUPs and payer conversion. For the fourth quarter of 2016, Vegas Diamond Slots and Daily Celebrity Crossword are excluded from MUUs, MUPs and payer conversion. For the first quarter of 2016, Black Diamond Casino, Vegas Diamond Slots, Yummy Gummy and Crazy Kitchen are excluded from MUUs, MUPs and payer conversion. These games are excluded to avoid potential double counting of MUUs and MUPs as our systems are unable to distinguish whether a player of these games is also a player of the Company’s other games during the applicable time periods. |
5
FINANCIAL GUIDANCE
Q2 Guidance:
| • | Bookings of $205 million |
| • | Adjusted EBITDA, which includes the impact of changes in deferred revenue, of $19 million |
| • | Change in deferred revenue of $5 million |
There are several factors to consider in our Q2 guidance as we continue to execute on our turnaround. On a year-over-year basis, we expect our growth to be driven by our live service franchises and our Solitaire acquisition. We believe this growth will be partially offset by continued softness in advertising and declines in Web and older games. Gross margins in Q2 should be comparable to those in Q1. We plan to invest in additional marketing spend in Q2 on a year-over-year and sequential basis to maintain the positive momentum in our live services through 2017 and beyond. This investment is informed by our improved player metrics and detailed lifetime valuation assessments. We expect R&D and G&A expenses to deliver operating leverage year-over-year, in absolute and percentage terms, as we continue to focus on delivering operational efficiency and sustainable profitability.
SHARE REPURCHASE
We continue to return capital to shareholders, and to date we have repurchased 47 million shares at an average price of $2.72, leaving $73 million in our existing $200 million share buyback program.
OUR PRODUCTS
Social Casino
Zynga Poker – The focus on our live operations is paying off – particularly with Zynga Poker. The game saw its highest quarterly mobile performance in franchise history. Our Q1 mobile revenue was up 63% year-over-year and up 32% sequentially. Mobile bookings were up 76% year-over-year and up 33% sequentially. Our mobile audience was also up an impressive 78% year-over-year. Last quarter, the team received strong partnership support with Apple featuring Zynga Poker for the first time in the App Store, underscoring our commitment to quality and innovation. We’re also finding new ways to market the game and engage broader audiences, including our recently launched Poker Snapchat lens. We’re prepping an ambitious roadmap of bold beats to excite our loyal players in celebration of the game’s 10-year anniversary later this year.
Social Slots – Our mobile revenue was up 6% year-over-year and down 7% sequentially, while our mobile bookings were down 10% year-over-year and down 6% sequentially. After an initial slow start to the quarter, the team ramped their development efforts – specifically in events and elder game optimization – resulting in a strong Q1 finish. In particular, Wizard of Oz Slots had a strong quarter due to the introduction of the Choose Your Side feature, as well as improved event cadence. Across our portfolio, we’ve been improving player engagement and monetization, and, as a result, we’ve driven our ABPU up sequentially. Over the last few quarters we’ve also reduced our paid user acquisition spend in an effort to focus our investment in higher quality bookings, increasing the yield from our core base.
Solitaire – In February, we acquired the world’s most downloaded Solitaire game from Harpan – a positive addition to our portfolio. We’re seeing strong affinity between Solitaire players and our broader Casual and Social Casino audiences. With this acquisition, we now have the world’s largest poker game and the most popular solitaire game on mobile – a big win for us as we continue to grow our leadership in the category.
Casual
Words With Friends –Words With Friends mobile revenue was down 20% year-over-year and down 26% sequentially. Mobile bookings were down 19% year-over-year and down 24% sequentially as advertising continues to experience headwinds. An important part of our strategy is to expand and grow our portfolio of forever franchises. Words With Friends is a great example of how we’re pursuing this.
6
In terms of the core game experience, we’re increasing the pace of new feature development and we’re testing new bold beats like Hindsight, Radar and Tile Swap which introduce dynamic new ways for players to engage with this popular game. Words With Friends’ audience and engagement continues to grow, with mobile DAUs up 4% sequentially. After 8 years, this forever franchise continues to be a daily part of so many of our players’ lives.
Today, we launched Crosswords With Friends to global audiences. This is the first product from our PuzzleSocial acquisition last year. Crosswords With Friends is a new game that extends our With Friends brand and marries pop culture with brain puzzle gameplay. As part of our launch, the game will feature a unique cross-platform partnership with People Magazine including content inspired by trends and entertainment news.
Finally, we’re also experimenting with new platforms to broaden the reach of Words With Friends. As a social game company we’re always looking for new ways to reach bigger audiences. Some of the largest and most social audiences on mobile are in messaging apps. Words With Friends is a mass market, player-vs-player experience that lends itself well to the chat environment.
Earlier this week, we partnered with Facebook to bring the first ever turn-based game to Messenger with Words With Friends for Instant Games. We’ve also recently introduced new products in the App Store for iMessage with our new collection of iMessage games, including Words With Friends, GIFs Against Friends, Boggle With Friends and Games With Friends, a portfolio of 16 unique, chat-based entertainment experiences. Its early days, but we’re excited about the opportunity to innovate on a new platform.
Action Strategy
CSR2 – This past quarter, we executed on a number of bold beats including partnerships with Porsche, McLaren and Lamborghini – which helped propel CSR2 into the Top 15 Grossing Game charts in the U.S. App Store last month and maintain its spot as the #1 Top Grossing Racing game in the U.S. App Store and Google Play Store. Last week, we launched a new Fast & Furious integration with Universal Brand Development which includes characters and cars from the Fate of the Furious. This new partnership includes a multi-month series of in-game events and social challenges across the blockbuster franchise. We’re excited about the team’s plans to deliver high quality features for players this year.
Dawn of Titans – Q1 represented our first full quarter for Dawn of Titans. Our teams have moved quickly into live operations mode by executing on a steady cadence of bold beats including a new Titan class – Ranger Titans – and an enhanced relic system. We’ve also added machine translation of chat and language support for Arabic to broaden our reach for players. In Q2, the team will introduce advancements in Quests and debut additional new features that will deepen the social and event strategy for our elder players.
Invest Express
FarmVille: Country Escape – We saw strong outperformance in the quarter due the introduction of The Social Order Board – a new bold beat that allows players to claim and complete in-game orders for their friends while progressing towards shared common goals. This resulted in an increase in the game’s player monetization and growth in the game’s long-term retention.
CLOSING
We’re off to a strong start in 2017. Our continued focus on growing our existing live services and investing in our forever franchises – games that stand the test of time and have the potential to engage players for years as enduring entertainment brands – is paying off. Over the past 12 months, we’ve fixed the fundamentals of the company and have driven significant improvement in profitability and cash flow – all of which are the strongest we’ve delivered in years. We remain on track to deliver margins in line with our peers over the long-term. We’re starting to bring to life our unique social mission to connect the world through games and unlock the potential of our business through better execution.
Sincerely,
| | |

| 
| |
Frank Gibeau, Chief Executive Officer | Ger Griffin, Chief Financial Officer | |
7
CONTACTS
Rebecca Lau
Manager, Investor Relations & Corporate Finance
relau@zynga.com
Dani Dudeck
Chief Communications Officer
dani@zynga.com
FORWARD LOOKING STATEMENTS
This letter contains forward-looking statements, including those statements relating to our outlook for the second quarter of 2017 under the heading "FINANCIAL GUIDANCE" and statements relating to, among other things: progress in our turnaround; our commitment to live services; our expectations regarding advertising; our expectations regarding our marketing spend; our ability to improve our business fundamentals and sharpen our operating model; our ability to unlock more operating leverage; our ability to deliver margins in line with our peers; our expectations regarding our live service franchises; our expectations regarding our margins; our ability to deliver product, financial and operating performance; and our expectations with respect to new products, features and platforms. Forward-looking statements often include words such as "outlook," "projected," "intends," "will," "anticipate," "believe," "target," "expect," and statements in the future tense are generally forward-looking. The achievement or success of the matters covered by such forward-looking statements involves significant risks, uncertainties, and assumptions. Our actual results could differ materially from those predicted or implied and reported results should not be considered as an indication of our future performance. Undue reliance should not be placed on such forward-looking statements, which are based on information available to us on the date hereof. We assume no obligation to update such statements. More information about factors that could affect our operating results are described in greater detail in our public filings with the Securities and Exchange Commission (the “SEC”), copies of which may be obtained by visiting our Investor Relations web site at http://investor.zynga.com or the SEC's web site at www.sec.gov.
In addition, the preliminary financial results set forth in this letter are estimates based on information currently available to us. While we believe these estimates are meaningful, they could differ from the actual amounts that we ultimately report in our Quarterly Report on Form 10-Q for the quarter ended March 31, 2017. We assume no obligation and do not intend to update these estimates prior to filing our Quarterly Report on Form 10-Q for the quarter ended March 31, 2017.
NON-GAAP FINANCIAL MEASURES
We have provided in this letter certain non-GAAP financial measures to supplement our consolidated financial statements prepared in accordance with GAAP (our “GAAP financial statements”). Management uses non-GAAP financial measures internally in analyzing our financial results to assess operational performance and liquidity. Our non-GAAP financial measures may be different from non-GAAP financial measures used by other companies.
The presentation of our non-GAAP financial measures is not intended to be considered in isolation or as a substitute for our GAAP financial statements. We believe that both management and investors benefit from referring to our non-GAAP financial measures in assessing our performance and when planning, forecasting and analyzing future periods. We believe our non-GAAP financial measures are useful to investors because they allow for greater transparency with respect to key financial metrics we use in making operating decisions and because our investors and analysts use them to help assess the health of our business.
We have provided reconciliations of our non-GAAP financial measures used in this letter to the most directly comparable GAAP financial measures in the following tables. Because of the following limitations of our non-GAAP financial measures, you should consider the non-GAAP financial measures presented in this letter with our GAAP financial statements.
Key limitations of our non-GAAP financial measures include:
| • | Adjusted EBITDA does not include the impact of stock-based expense, acquisition-related transaction expenses, contingent consideration fair value adjustments and restructuring expense; |
| • | Bookings does not reflect that we defer and recognize online game revenue and revenue from certain advertising transactions over the estimated average life of durable virtual goods or as virtual goods are consumed; |
| • | Adjusted EBITDA does not reflect income tax expense and does not include other income (expense) net, which includes foreign exchange gains and losses and interest income; |
8
| • | Adjusted EBITDA excludes depreciation and amortization of intangible assets. Although depreciation and amortization are non-cash charges, the assets being depreciated and amortized may have to be replaced in the future; and |
| • | Free cash flow is derived from net cash provided by operating activities less cash spent on capital expenditures and acquisitions, and removing the excess income tax benefits or costs associated with stock-based awards. |
9
ZYNGA INC.
CONSOLIDATED BALANCE SHEETS
(In thousands, unaudited)
| | March 31, | | | December 31, | |
| | 2017 | | | 2016 | |
Assets | | | | | | | | |
Current assets: | | | | | | | | |
Cash and cash equivalents | | $ | 720,437 | | | $ | 852,467 | |
Accounts receivable | | | 86,224 | | | | 77,260 | |
Income tax receivable | | | 276 | | | | 296 | |
Restricted cash | | | 11,382 | | | | 6,199 | |
Prepaid expenses and other current assets | | | 34,936 | | | | 29,254 | |
Total current assets | | | 853,255 | | | | 965,476 | |
| | | | | | | | |
Goodwill | | | 632,608 | | | | 613,335 | |
Other intangible assets, net | | | 47,886 | | | | 25,430 | |
Property and equipment, net | | | 268,884 | | | | 269,439 | |
Restricted cash | | | 250 | | | | 3,050 | |
Prepaid expenses and other long-term assets | | | 29,205 | | | | 29,119 | |
Total assets | | $ | 1,832,088 | | | $ | 1,905,849 | |
| | | | | | | | |
Liabilities and stockholders’ equity | | | | | | | | |
Current liabilities: | | | | | | | | |
Accounts payable | | $ | 13,803 | | | $ | 23,999 | |
Income tax payable | | | 3,141 | | | | 1,889 | |
Other current liabilities | | | 68,979 | | | | 75,754 | |
Deferred revenue | | | 155,102 | | | | 141,998 | |
Total current liabilities | | | 241,025 | | | | 243,640 | |
Deferred revenue | | | 128 | | | | 158 | |
Deferred tax liabilities | | | 5,848 | | | | 5,791 | |
Other non-current liabilities | | | 24,459 | | | | 75,596 | |
Total liabilities | | | 271,460 | | | | 325,185 | |
| | | | | | | | |
Stockholders’ equity: | | | | | | | | |
Common stock and additional paid in capital | | | 3,373,988 | | | | 3,349,714 | |
Accumulated other comprehensive income (loss) | | | (123,190 | ) | | | (128,694 | ) |
Accumulated deficit | | | (1,690,170 | ) | | | (1,640,356 | ) |
Total stockholders’ equity | | | 1,560,628 | | | | 1,580,664 | |
Total liabilities and stockholders’ equity | | $ | 1,832,088 | | | $ | 1,905,849 | |
10
ZYNGA INC.
CONSOLIDATED STATEMENTS OF OPERATIONS
(In thousands, except per share data, unaudited)
| | Three Months Ended | |
| | March 31, 2017 | | | December 31, 2016 | | | March 31, 2016 | |
Revenue: | | | | | | | | | | | | |
Online game | | $ | 153,481 | | | $ | 140,157 | | | $ | 137,057 | |
Advertising and other | | | 40,803 | | | | 50,383 | | | | 49,664 | |
Total revenue | | | 194,284 | | | | 190,540 | | | | 186,721 | |
Costs and expenses: | | | | | | | | | | | | |
Cost of revenue | | | 64,877 | | | | 62,629 | | | | 57,139 | |
Research and development | | | 69,202 | | | | 92,417 | | | | 87,737 | |
Sales and marketing | | | 46,620 | | | | 46,860 | | | | 46,344 | |
General and administrative | | | 22,565 | | | | 23,095 | | | | 22,384 | |
Total costs and expenses | | | 203,264 | | | | 225,001 | | | | 213,604 | |
Income (loss) from operations | | | (8,980 | ) | | | (34,461 | ) | | | (26,883 | ) |
Interest income | | | 937 | | | | 791 | | | | 705 | |
Other income (expense), net | | | 1,436 | | | | 1,476 | | | | 2,100 | |
Income (loss) before income taxes | | | (6,607 | ) | | | (32,194 | ) | | | (24,078 | ) |
Provision for (benefit from) income taxes | | | 2,867 | | | | 3,238 | | | | 2,480 | |
Net income (loss) | | $ | (9,474 | ) | | $ | (35,432 | ) | | $ | (26,558 | ) |
| | | | | | | | | | | | |
Net income (loss) per share attributable to common stockholders: | | | | | | | | | | | | |
Basic and diluted | | $ | (0.01 | ) | | $ | (0.04 | ) | | $ | (0.03 | ) |
| | | | | | | | | | | | |
Weighted average common shares used to compute net income (loss) per share attributable to common stockholders: | | | | | | | | | | | | |
Basic and diluted | | | 875,712 | | | | 888,272 | | | | 871,093 | |
| | | | | | | | | | | | |
Stock-based expense included in the above line items: | | | | | | | | | | | | |
Cost of revenue | | $ | 619 | | | $ | 895 | | | $ | 649 | |
Research and development | | | 11,713 | | | | 21,158 | | | | 24,203 | |
Sales and marketing | | | 1,787 | | | | 1,516 | | | | 1,991 | |
General and administrative | | | 3,407 | | | | 2,910 | | | | 2,765 | |
Total stock-based expense | | $ | 17,526 | | | $ | 26,479 | | | $ | 29,608 | |
11
ZYNGA INC.
CONSOLIDATED STATEMENTS OF CASH FLOWS
(In thousands, unaudited)
| | Three Months Ended | |
| | March 31, 2017 | | | December 31, 2016 | | | March 31, 2016 | |
Operating activities: | | | | | | | | | | | | |
Net income (loss) | | $ | (9,474 | ) | | $ | (35,432 | ) | | $ | (26,558 | ) |
Adjustments to reconcile net income (loss) to net cash provided by (used in) operating activities: | | | | | | | | | | | | |
Depreciation and amortization | | | 8,881 | | | | 9,612 | | | | 10,812 | |
Stock-based expense | | | 17,526 | | | | 26,479 | | | | 29,608 | |
(Gain) loss from sales of investments, assets and other, net | | | 38 | | | | (134 | ) | | | 11 | |
Accretion and amortization on marketable securities | | | — | | | | 1 | | | | 259 | |
Change in deferred income taxes and other | | | 1,075 | | | | 746 | | | | 1,422 | |
Changes in operating assets and liabilities: | | | | | | | | | | | | |
Accounts receivable, net | | | (8,964 | ) | | | (4,909 | ) | | | 7,217 | |
Income tax receivable | | | 20 | | | | 714 | | | | 595 | |
Other assets | | | (5,923 | ) | | | (2,407 | ) | | | (1,812 | ) |
Accounts payable | | | (8,802 | ) | | | 6,558 | | | | (12,818 | ) |
Deferred revenue | | | 13,074 | | | | 10,992 | | | | (5,096 | ) |
Income tax payable | | | 1,252 | | | | 1,889 | | | | — | |
Other liabilities | | | (13,422 | ) | | | 13,634 | | | | (6,945 | ) |
Net cash provided by (used in) operating activities | | | (4,719 | ) | | | 27,743 | | | | (3,305 | ) |
| | | | | | | | | | | | |
Investing activities: | | | | | | | | | | | | |
Sales and maturities of marketable securities | | | — | | | | 4,500 | | | | 118,900 | |
Acquisition of property and equipment | | | (2,285 | ) | | | (3,692 | ) | | | (2,654 | ) |
Business acquisitions, net of cash acquired | | | (35,081 | ) | | | — | | | | (12,500 | ) |
Proceeds from sale of property and equipment | | | 15 | | | | 174 | | | | 398 | |
Other investing activities, net | | | (7,390 | ) | | | — | | | | — | |
Net cash provided by (used in) investing activities | | | (44,741 | ) | | | 982 | | | | 104,144 | |
| | | | | | | | | | | | |
Financing activities: | | | | | | | | | | | | |
Taxes paid related to net share settlement of equity awards | | | (415 | ) | | | (1,259 | ) | | | (919 | ) |
Repurchases of common stock | | | (86,164 | ) | | | (30,204 | ) | | | (112,392 | ) |
Proceeds from employee stock purchase plan and exercise of stock options | | | 3,152 | | | | 351 | | | | 2,476 | |
Acquisition-related contingent consideration payment | | | — | | | | (10,230 | ) | | | — | |
Net cash provided by (used in) financing activities | | | (83,427 | ) | | | (41,342 | ) | | | (110,835 | ) |
| | | | | | | | | | | | |
Effect of exchange rate changes on cash and cash equivalents | | | 857 | | | | (1,235 | ) | | | (770 | ) |
| | | | | | | | | | | | |
Net increase (decrease) in cash and cash equivalents | | | (132,030 | ) | | | (13,852 | ) | | | (10,766 | ) |
Cash and cash equivalents, beginning of period | | | 852,467 | | | | 866,319 | | | | 742,217 | |
Cash and cash equivalents, end of period | | $ | 720,437 | | | $ | 852,467 | | | $ | 731,451 | |
12
ZYNGA INC.
RECONCILIATION OF GAAP TO NON-GAAP RESULTS
(In thousands, except per share data, unaudited)
| | Three Months Ended | |
| | March 31, 2017 | | | December 31, 2016 | | | March 31, 2016 | |
Reconciliation of Revenue to Bookings | | | | | | | | | | | | |
Revenue | | $ | 194,284 | | | $ | 190,540 | | | $ | 186,721 | |
Change in deferred revenue | | | 13,074 | | | | 10,992 | | | | (5,096 | ) |
Bookings | | $ | 207,358 | | | $ | 201,532 | | | $ | 181,625 | |
| | | | | | | | | | | | |
Reconciliation of Revenue to Bookings: Mobile | | | | | | | | | | | | |
Revenue | | $ | 161,613 | | | $ | 154,674 | | | $ | 135,667 | |
Change in deferred revenue | | | 14,508 | | | | 12,387 | | | | 3,095 | |
Bookings: Mobile | | $ | 176,121 | | | $ | 167,061 | | | $ | 138,762 | |
| | | | | | | | | | | | |
Reconciliation of Revenue to Bookings: Advertising and Other; Advertising | | | | | | | | | | | | |
Revenue | | $ | 40,802 | | | $ | 50,382 | | | $ | 49,664 | |
Change in deferred revenue | | | 1,082 | | | | (97 | ) | | | (3,055 | ) |
Bookings: Advertising and Other | | $ | 41,884 | | | $ | 50,285 | | | $ | 46,609 | |
Bookings: Other | | | (777 | ) | | | (641 | ) | | | (1,233 | ) |
Bookings: Advertising | | $ | 41,107 | | | $ | 49,644 | | | $ | 45,376 | |
| | | | | | | | | | | | |
Reconciliation of Net income (loss) to Adjusted EBITDA | | | | | | | | | | | | |
Net income (loss) | | $ | (9,474 | ) | | $ | (35,432 | ) | | $ | (26,558 | ) |
Provision for (benefit from) income taxes | | | 2,867 | | | | 3,238 | | | | 2,480 | |
Other income (expense), net | | | (1,436 | ) | | | (1,476 | ) | | | (2,100 | ) |
Interest income | | | (937 | ) | | | (791 | ) | | | (705 | ) |
Restructuring expense, net | | | (845 | ) | | | (191 | ) | | | 468 | |
Depreciation and amortization | | | 8,881 | | | | 9,612 | | | | 10,812 | |
Acquisition-related transaction expenses | | | 187 | | | | — | | | | — | |
Contingent consideration fair value adjustment | | | (94 | ) | | | 9,145 | | | | 2,030 | |
Stock-based expense | | | 17,526 | | | | 26,479 | | | | 29,608 | |
Adjusted EBITDA | | $ | 16,675 | | | $ | 10,584 | | | $ | 16,035 | |
| | | | | | | | | | | | |
Reconciliation of GAAP operating expense to Non-GAAP operating expense | | | | | | | | | | | | |
GAAP operating expense | | $ | 138,387 | | | $ | 162,372 | | | $ | 156,465 | |
Restructuring expense, net | | | 845 | | | | 191 | | | | (468 | ) |
Amortization of intangible assets from acquisition | | | (1,053 | ) | | | (1,520 | ) | | | (736 | ) |
Acquisition-related transaction expenses | | | (187 | ) | | | — | | | | — | |
Contingent consideration fair value adjustment | | | 94 | | | | (9,145 | ) | | | (2,030 | ) |
Stock-based expense | | | (16,907 | ) | | | (25,584 | ) | | | (28,959 | ) |
Non-GAAP operating expense | | $ | 121,179 | | | $ | 126,314 | | | $ | 124,272 | |
| | | | | | | | | | | | |
Reconciliation of Cash provided by operating activities to free cash flow | | | | | | | | | | | | |
Net cash provided by (used in) operating activities | | | (4,719 | ) | | | 27,743 | | | | (3,305 | ) |
Acquisition of property and equipment | | | (2,285 | ) | | | (3,692 | ) | | | (2,654 | ) |
Free cash flow | | $ | (7,004 | ) | | $ | 24,051 | | | $ | (5,959 | ) |
13
ZYNGA INC.
RECONCILIATION OF GAAP TO NON-GAAP SECOND QUARTER 2017 GUIDANCE
(In thousands, except per share data, unaudited)
| | Second Quarter 2017 |
Reconciliation of Revenue to Bookings | | |
Revenue | $ | 200,000 |
Change in deferred revenue | | 5,000 |
Bookings | $ | 205,000 |
| | |
Reconciliation of Net income (loss) to Adjusted EBITDA | | |
Net income (loss) | $ | (6,000) |
Provision for (benefit from) income taxes | | 4,000 |
Other income (expense), net | | (1,000) |
Interest income | | (1,000) |
Depreciation and amortization | | 8,000 |
Stock-based expense | | 15,000 |
Adjusted EBITDA | $ | 19,000 |
| | |
GAAP diluted shares | | 863,000 |
Net income (loss) per share | $ | (0.01) |
###
14