Exhibit 99.1

Zynga Q4 2017 Earnings Highlights RECORD MOBILE REVENUE & BOOKINGS Mobile Revenue = $203.6M Mobile Bookings = $197.0M Q4 2017 = +32% Y/Y Q4 2017 = +18% Y/Y $167M $155M Q4’16 $176M $162M Q1’17 $182M $180M Q2’17 $194M $187M Q3’17 $204M $197M Q4’17 Mobile Revenue Mobile Bookings SUCCESSFUL LAUNCH OF NEW GAME WORDS with friends 2 Best quarterly mobile performance in franchise history MOBILE REVENUE +19% Y/Y MOBILE BOOKINGS +28% Y/Y #1 FREE APP* #1 FREE GAME* *Achieved in Apple App Store Q4’17 AUDIENCE q4’17 NET INCOME 20M Mobile DAUs +24% Y/Y 76M Mobile MAUs +45%Y/Y $12.9M +$48.4M Y/Y

ZYNGA – Q4 2017 QUARTERLY EARNINGS LETTER
February 7, 2018
Dear Shareholders,
We look forward to discussing our Q4 2017 and full year 2017 results during today’s earnings call at 2:30 p.m. PT. Below, you’ll find our quarterly earnings letter detailing our Q4 and 2017 performance, as well as our outlook for Q1 and growth opportunities for 2018 and beyond. Please note that we manage our business based on topline measures including revenue, which is comprised of the change in deferred revenue and bookings. Revenue and the change in deferred revenue are both directly affected by bookings results, and management utilizes bookings as a primary topline measure to help inform their decisions.
HIGHLIGHTS
We had a strong holiday quarter and a great end to the year anchored by the successful new game launch of Words With Friends 2 and continued mobile momentum in our live services. In 2017, we improved the fundamentals of our business and drove substantial growth across our topline, audience, profitability and operating cash flow. We’re starting 2018 with the strongest mobile game portfolio in company history, and we’re excited about the new titles we have in development across our global studios. Our performance and execution over the last year gives us confidence in our ability to grow the company and achieve our near-term margin goals later this year.
Q4 Highlights:
| • | Best revenue and bookings performance in nearly 5 years driven by mobile revenue up 32% year-over-year and mobile bookings up 18% year-over-year. |
| • | Successfully launched Words With Friends 2 – the new title from our Words With Friends franchise – which achieved #1 Free App, #1 Free Game and #1 Free Word Game rankings in the App Store. |
| • | Words With Friends – Delivered its strongest quarter of mobile revenue and bookings in the franchise’s 8-year history; Mobile revenue up 19% year-over-year and mobile bookings up 28% year-over-year |
| • | CSR2 – Mobile revenue up 90% year-over-year; Mobile bookings up 27% year-over-year |
| • | Zynga Poker – Mobile revenue up 44% year-over-year; Mobile bookings up 38% year-over-year |
| • | Acquired Peak Games’ casual card game studio in mid-December. |
| • | Mobile audience for the quarter was 20 million average daily active users (DAUs), up 24% year-over-year. |
| • | Increased profitability year-over-year as we progress towards our near-term margin goals. |
2017 Highlights:
| • | Continued mobile momentum with mobile revenue up 29% year-over-year and mobile bookings up 23% year-over-year. |
| • | We ended the year with our highest mobile average DAUs in 4 years. |
| • | Strengthened our Words With Friends franchise with new bold beats like Social Dictionary, followed by the successful launch of Words With Friends 2 to fans globally. |
| • | Created a new forever franchise with the success of CSR2, the #1 Top Grossing Racing Game in the U.S. App Store and on Google Play. |
| • | Zynga Poker marked its 10-year anniversary with all-time highs in mobile revenue and bookings. |
| • | Refocused our Slots portfolio on our core games, driving deeper player engagement and improved monetization. |
| • | Exited the year with the world’s largest mobile casual card game portfolio with Zynga Poker and our acquisitions of Harpan’s Solitaire titles and Peak Games’ casual card game studio. |
| • | Improved our operating leverage with GAAP operating expenses for the year at 67% of revenue, down from 83% of revenue in 2016. Non-GAAP operating expenses for the year were 58% of bookings, down from 66% of bookings in 2016. |
| • | Delivered a profitable year for the first time since 2010 – with net income of $26.6 million, up $134.8 million year-over-year. |
| • | Generated operating cash flow of $94.6 million, up 58% year-over-year. |
2
EXECUTIVE SUMMARY
(in millions) | Q4'17 Actuals | | | Q4'16 Actuals | | | Variance $ (Y/Y) | | | Variance % (Y/Y) | | | Q4'17 Guidance | | | Variance $ (Guidance) | | | Variance % (Guidance) | |
Revenue | $ | | 233.3 | | | $ | | 190.5 | | | $ | | 42.7 | | | | | 22 | % | | $ | | 215.0 | | | $ | | 18.3 | | | | | 9 | % |
Net income (loss) | $ | | 12.9 | | | $ | | (35.4 | ) | | $ | | 48.4 | | | | NM | | | $ | | 13.0 | | | $ | | (0.1 | ) | | | | (1 | )% |
| | | | | | | | | | | | | | | | | | | | | | | | | | | | | | | | | | |
Bookings | $ | | 223.8 | | | $ | | 201.5 | | | $ | | 22.3 | | | | | 11 | % | | $ | | 210.0 | | | $ | | 13.8 | | | | | 7 | % |
Adjusted EBITDA (1) | $ | | 46.5 | | | $ | | 10.6 | | | $ | | 35.9 | | | | NM | | | $ | | 35.0 | | | $ | | 11.5 | | | | | 33 | % |
| | | | | | | | | | | | | | | | | | | | | | | | | | | | | | | | | | |
Net release of (increase in) deferred revenue (2) | $ | | 9.5 | | | $ | | (11.0 | ) | | $ | | 20.5 | | | | NM | | | $ | | 5.0 | | | $ | | 4.5 | | | | | 90 | % |
| (1) | Adjusted EBITDA includes the net release of (increase in) deferred revenue. |
| (2) | For clarity, a net release of deferred revenue results in revenue being higher than bookings and is a positive impact to Adjusted EBITDA as reported; a net increase in deferred revenue results in revenue being lower than bookings and is a negative impact to Adjusted EBITDA as reported. |
In Q4, we delivered our strongest topline performance since Q1 2013. Revenue was $233.3 million, above our guidance by $18.3 million and up $42.7 million or 22% year-over-year. Bookings were $223.8 million – beating our guidance by $13.8 million and up $22.3 million or 11% year-over-year. Our better than expected performance was driven by the successful launch of Words With Friends 2, as well as a partial month contribution from our acquisition of Peak Games’ casual card game studio. We achieved net income of $12.9 million, an improvement of $48.4 million year-over-year, broadly in-line with our guidance of $13.0 million. Our Adjusted EBITDA was $46.5 million, above our guidance by $11.5 million, and an increase of $35.9 million year-over-year. We had a net release of deferred revenue of $9.5 million versus our guidance of a net release of $5.0 million and a net increase of $11.0 million in the prior year quarter. The year-over-year change in deferred revenue accounted for $20.5 million of the year-over-year increase in revenue, net income and Adjusted EBITDA. We delivered operating cash flow of $26.4 million, down $1.4 million year-over-year, due to an increase in accounts receivable, partially offset by improved profitability.
Our quarterly performance was anchored by the successful launch of Words With Friends 2 and our commitment to growing our live services, including a standout performance from CSR2 and continued strength of Zynga Poker.
Words With Friends delivered its strongest quarterly mobile revenue and bookings performance in the franchise’s 8-year history, with mobile revenue up 19% year-over-year and mobile bookings up 28% year-over-year. The record quarter was driven by the successful launch of our new game, Words With Friends 2, as well as a significant, one-time yield benefit from an advertising network deal tied to the game’s debut. Since launching in November, Words With Friends 2 has received positive partner featuring from Google and Apple, and achieved #1 Free App, #1 Free Game and #1 Free Word Game rankings in the App Store. The new game builds on this popular franchise by adding some of the most requested features from our players, such as Solo Challenge and Lightning Round, in addition to introducing boosts such as Tile Swap, Hindsight and Word Radar. These new features have been positively received by players, resulting in increased player engagement and an expansion of the monetization potential of the game.
CSR2 ended the year with strong results driven by innovative bold beats and exclusive events for players. In Q4, revenue was up 90% year-over-year and bookings were up 27% year-over-year. This quarter, we released our Fast & Furious finale event in partnership with Universal Brand Development, which featured a new Siberia-themed racetrack based on the film. We also launched Relay Races – a new way for players to compete with one another. Finally, we leveraged Apple’s ARKit to introduce CSR2’s Augmented Reality (AR) mode in November, giving players the ability to virtually bring their dream car collection off the mobile screen and into their driveways. Since the game’s worldwide launch, CSR2 has delighted millions of players and remains the #1 Top Grossing Racing game in the U.S. App Store and on Google Play.
In Social Casino, Zynga Poker ended a particularly exciting year with Q4 mobile revenue up 44% year-over-year and mobile bookings up 38% year-over-year. This performance was driven by improved player engagement with popular features such as Challenges and Leagues. 2017 marked a pivotal year for Zynga Poker as the franchise turned 10 years old and reached all-time highs in mobile revenue and bookings. In the quarter, our Slots mobile revenue was down 12% year-over-year and mobile bookings were down 8% year-over-year. This decline is a result of our commitment to quality over quantity as our teams focused on deeper player engagement and increased monetization across our core slots games.
3
In 2017, we improved the fundamentals of the business by sharpening our operating model, enhancing our live services and innovating into new games and emerging mobile technologies. This focus strengthened our position as a leading mobile game publisher as we delivered total company revenue of $861.4 million, up 16% year-over-year, and bookings of $853.8 million, up 13% year-over-year. This topline growth was driven by the mobile performance of our forever franchises, which more than offset the headwinds we continue to face in our web and older mobile games.
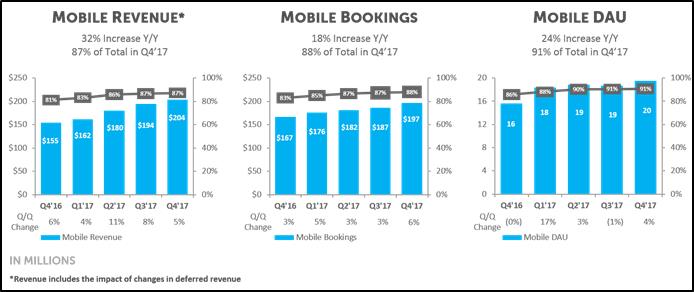
Our mobile momentum over the past year continued with mobile revenue up 29% year-over-year and mobile bookings up 23% year-over-year. Mobile revenue last year represented 86% of total revenue, up from 77% a year ago, and mobile bookings represented 87% of our total bookings, up from 80% in 2016. Mobile online game – or user pay – revenue was up 36% year-over-year, and mobile user pay bookings were up 28% year-over-year. A key strategic initiative for us in 2017 was to grow our audience and Q4 represented Zynga’s highest mobile average DAUs in 4 years. This past quarter, we significantly increased our mobile audience from 16 million average DAUs in Q4 2016 to 20 million average DAUs in Q4 2017, up 24% year-over-year driven primarily by Solitaire and Zynga Poker. Mobile average MAUs are also up, from 53 million in Q4 2016 to 76 million in Q4 2017, an increase of 45% year-over-year. We remain focused on growing our audience and broadening the accessibility of our games across existing and new emerging platforms.
This year, we also made two acquisitions with Harpan’s Solitaire games in Q1 and Peak Games’ casual card game studio in Q4. These acquisitions align with our strategy to grow our live services and prioritize opportunities that are accretive to our near-term margin goals. They also helped to grow our audience, and strengthen our development talent with a high-quality team in Turkey with a proven track record. The combination of Zynga Poker, our Solitaire titles and Peak Games’ casual card games now gives Zynga the world’s largest portfolio of casual card games.
We also made substantial improvements in sharpening our operating model in 2017. We delivered GAAP operating expenses for the year at 67% of revenue – down from 83% of revenue in 2016 – and non-GAAP operating expenses at 58% of bookings – down from 66% of bookings last year. All of this contributed to achieving $26.6 million of net income, up $134.8 million year-over-year, and operating cash flow of $94.6 million, up 58% year-over-year. 2017 was a significant year in our turnaround – we’re proud of the progress we made in growing the company and we’re well on our way to achieving our near-term margin goals later this year.
As we look to the future, our strategy is to grow Zynga in four ways: (1) Live Services, (2) New Games, (3) Emerging Platforms and (4) M&A.
First, we’ll continue to focus on growing our live services through innovative bold beats. We’ve seen this approach pay off over the last two years as we’ve enhanced and grown our forever franchises into the strongest mobile portfolio in company history. Our bold beat strategy is designed to deepen engagement with our existing players, bring back lapsed players and attract new players to our franchises. For Zynga, bold beats include new features, new systems and new content, such as global licenses and strategic partnerships that enhance the player experience. On that front, we’re pleased to announce that we’ve entered into a multi-year partnership with the World Poker Tour® (WPT®) – the premiere name in international, televised gaming and entertainment – to bring the WPT experience into Zynga Poker for in-game, free-to-play tournaments. We expect to introduce our WPT-themed in-game bold beat tournaments to Zynga Poker in the second half of 2018, delivering players a more competitive, authentic tournament experience. Overall, we believe our continued commitment to growth in live services will provide a more predictable and recurring revenue stream for Zynga over the long-term.
Second, we’ll also pursue growth by building new games with the goal of creating new forever franchises. Our approach to new game development combines strong game teams with high potential sequels, reinvigorated Zynga brands, new intellectual properties (IP) and strategic licenses with global appeal. We have games in development in four categories – Action Strategy, Casual, Invest Express and Social Casino. Our goal is to engineer hits and rigorously test our new games during soft launch to ensure they have the right long-term engagement and have the potential to be a forever franchise for us. We’re tuning to quality over quantity and, based on player feedback and soft launch results, we expect to launch new titles in some or all of these categories beginning in the second half of 2018 and continuing into 2019 and beyond.
Third, mobile is the largest and fastest growing gaming platform in the world and we believe emerging technologies – including chat, AR, virtual reality and 5G wireless networking – will create the next phase of long-term platform growth. We’re actively investing in the mobile platform, particularly chat, because of its potential to drive innovation, create new gaming experiences and grow our audience. We believe that chat platforms, such as Facebook Instant Games and Apple iMessage, will reshape the accessibility and social nature of mobile gaming. This year, we’ll continue to bring our existing franchises, like Words With Friends, and new IP to these highly social, new mobile platforms. Our goal is to deliver a high-quality player experience and build our audience on chat, however, we don’t expect monetization to have a meaningful impact in 2018.
4
Finally, we intend to use the strength of our balance sheet and positive cash flow from operations to explore M&A opportunities that will enhance our growth potential. Our goal is to bring talented teams and compelling franchises into Zynga that align with our strategic priorities to grow our live services, create new forever franchises and build out our capabilities on emerging platforms. We’ll continue to take a diligent approach towards M&A, prioritizing opportunities that are accretive to our near-term margin goals.
2017 & Q4 PERFORMANCE OVERVIEW
2017 Financial Highlights
| • | Revenue of $861.4 million; up 16% year-over-year |
| • | GAAP operating expenses of $576.7 million; down 7% year-over-year |
| • | Net income of $26.6 million; an improvement of $134.8 million year-over-year |
| • | Net release of deferred revenue of $7.6 million compared to an increase of $13.1 million in 2016, representing a $20.7 million change year-over-year |
| • | Bookings of $853.8 million; up 13% year-over-year |
| • | Non-GAAP operating expenses of $493.0 million; flat year-over-year |
| • | Adjusted EBITDA, which includes the impact of changes in deferred revenue, was $137.7 million, up $88.9 million or 182% year-over-year |
| • | Operating cash flow of $94.6 million; up 58% year-over-year and our best performance since 2012 |
Q4 Financial Highlights
| • | Revenue of $233.3 million; above our guidance and up 22% year-over-year |
| • | GAAP operating expenses of $160.2 million; down 1% year-over-year |
| • | Net income of $12.9 million; broadly in-line with our guidance and an improvement of $48.4 million year-over-year. |
| • | Net release of deferred revenue of $9.5 million; versus our guidance of a net release of deferred revenue of $5.0 million |
| • | Bookings of $223.8 million; above our guidance and up 11% year-over-year |
| • | Non-GAAP operating expenses of $129.0 million; up 2% year-over-year |
| • | Adjusted EBITDA of $46.5 million; above our guidance and an increase of $35.9 million year-over-year |
| • | Operating cash flow of $26.4 million; down $1.4 million year-over-year |
Q4 Mobile Highlights
| • | Mobile revenue of $203.6 million; up 32% year-over-year |
| • | Mobile bookings of $197.0 million; up 18% year-over-year |
| • | Mobile average DAUs of 20 million; up 24% year-over-year |
| • | Mobile user pay revenue was up 31% year-over-year, and mobile user pay bookings were up 12% year-over-year |
5
Q4 Advertising Highlights
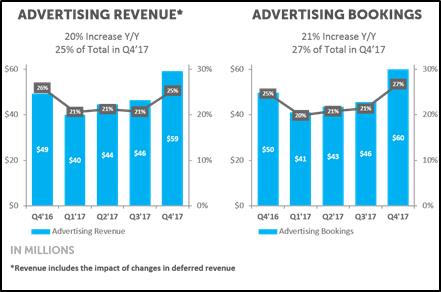
| • | Advertising revenue of $59.0 million and advertising bookings of $59.9 million were up 20% and 21% year-over-year, respectively. |
| • | Advertising represented 25% of total revenue and 27% of total bookings as compared to 26% of total revenue and 25% of total bookings in Q4 2016. |
| • | Our advertising performance included a significant, one-time yield benefit from an advertising network deal tied to the worldwide launch of Words With Friends 2. |
| • | We expect the mobile advertising market to continue to be highly competitive and price sensitive. We remain focused on growing our advertising inventory and optimizing our product offerings. |
Q4 Player Metrics (users and payers in millions)
| | Three Months Ended | | | | | | | | | |
| | December 31, | | | September 30, | | | December 31, | | | Q4'17 | | | Q4'17 | |
| | 2017 | | | 2017 | | | 2016 | | | Q/Q | | | Y/Y | |
Average daily active users (DAUs) (1) | | | 22 | | | | 21 | | | | 18 | | | | 4 | % | | | 18 | % |
Average mobile DAUs (1) | | | 20 | | | | 19 | | | | 16 | | | | 4 | % | | | 24 | % |
Average web DAUs (1) | | | 2 | | | | 2 | | | | 2 | | | | 5 | % | | | (22 | )% |
| | | | | | | | | | | | | | | | | | | | |
Average monthly active user (MAUs) (1) | | | 86 | | | | 80 | | | | 63 | | | | 8 | % | | | 37 | % |
Average mobile MAUs (1) | | | 76 | | | | 72 | | | | 53 | | | | 6 | % | | | 45 | % |
Average web MAUs (1) | | | 10 | | | | 8 | | | | 10 | | | | 23 | % | | | (3 | )% |
| | | | | | | | | | | | | | | | | | | | |
Average daily bookings per average DAU (ABPU) | | $ | 0.113 | | | $ | 0.113 | | | $ | 0.120 | | | | 0 | % | | | (6 | )% |
Average monthly unique users (MUUs) (2) | | | 49 | | | | 51 | | | | 56 | | | | (4 | )% | | | (12 | )% |
Average monthly unique payers (MUPs) (2) | | | 1.2 | | | | 1.2 | | | | 1.2 | | | | (4 | )% | | | (4 | )% |
Payer conversion (2) | | | 2.4 | % | | | 2.4 | % | | | 2.2 | % | | | (1 | )% | | | 9 | % |
| (1) | We do not have the third party network login data to link an individual who has played under multiple user accounts and accordingly, actual DAU and MAU may be lower than reported due to the potential duplication of these individuals. Specifically, for the fourth quarter of 2017, DAUs and MAUs incrementally include Daily Celebrity Crossword, Solitaire, our Facebook Messenger games and games recently acquired from Peak Games; for the third quarter of 2017, DAUs and MAUs incrementally include Daily Celebrity Crossword, Solitaire and our Facebook Messenger games; and for the fourth quarter of 2016, DAUs and MAUs incrementally include Daily Celebrity Crossword and Vegas Diamond Slots. |
| (2) | For the fourth quarter of 2017, MUUs and MUPs exclude Daily Celebrity Crossword, Solitaire, our Facebook Messenger games and games recently acquired from Peak Games. For the third quarter of 2017, MUUs and MUPs exclude Daily Celebrity Crossword, Solitaire and our Facebook Messenger games. For the fourth quarter of 2016, MUUs and MUPs exclude Daily Celebrity Crossword and Vegas Diamond Slots. These games are excluded to avoid potential double counting of MUUs and MUPs as our systems are unable to distinguish whether a player of these games is also a player of the Company’s other games during the applicable time periods. |
6
2018 FINANCIAL THEMES
We anticipate our financial performance in 2018 will be predominantly driven by our live services anchored by our forever franchises, with continued investment in bold beats aimed at enhancing player engagement. Our investments in new games and emerging mobile technologies should have more of an effect on our growth in 2019 and beyond.
We expect moderate growth in revenue and bookings driven by:
| • | Low double-digit growth in mobile bookings with the full year contribution from our recent acquisition of Peak Games’ casual card game studio offsetting the declines in our older mobile games. |
| • | Web declines of a similar level to that experienced in 2017. |
| • | Live services which should deliver more than 95% of our revenue and bookings. |
Our topline performance should be weighted towards the second half of the year due to seasonality and the cadence of our live service bold beats.
We’re going to continue our disciplined approach to sharpening our operating model and are targeting:
| • | Low single-digit growth in our operating expenses with continued investment in our live services, new game development and emerging mobile technologies funded largely by savings from our turnaround actions in 2017. |
| • | Marketing to be the primary variable spend in the year with the level and phasing of investments influenced by the performance of our live services and timing of new game launches. |
| • | Gross margins to be in-line with 2017. |
| • | Operating cash flow to grow year-over-year. |
Our performance and execution over the last year gives us confidence in our ability to grow the company and achieve our near-term margin goals later this year.
FINANCIAL GUIDANCE
Q1 Guidance
| • | Net increase of deferred revenue of $10 million |
| • | Bookings of $210 million |
| • | Adjusted EBITDA of $20 million |
Some additional factors to consider in assessing our Q1 guidance include:
| • | We anticipate advertising will grow year-over-year, despite sequential declines as yields normalize versus the higher levels delivered in Q4 FY17 and due to typical advertising seasonality. |
| • | We expect Dawn of Titans bookings to be down year-over-year as we compare against the first full quarter post-worldwide launch. |
| • | We expect operating expenses to be slightly up year-over-year primarily driven by higher marketing spend on our live services and higher G&A expenses, offset by savings in R&D. |
| • | We anticipate that our gross margins in Q1 will be comparable to the prior year period. |
In closing, we’re proud of the results we delivered in 2017 and are excited by the potential ahead of us in 2018. The significant improvement in our fundamentals gives us confidence in our ability to grow Zynga over the long-term as we connect the world through games and deliver value to our players, employees and investors.
Sincerely,
| |

| 
|
Frank Gibeau Chief Executive Officer | Ger Griffin Chief Financial Officer |
7
CONTACTS
Rebecca Lau
Director, Investor Relations & Corporate Finance
relau@zynga.com
Dani Dudeck
Chief Communications Officer
dani@zynga.com
FORWARD-LOOKING STATEMENTS
This letter contains forward-looking statements, including those statements relating to our outlook for the first quarter and full year 2018 under the headings “2018 FINANCIAL THEMES” and "FINANCIAL GUIDANCE" and statements relating to, among other things: our operational performance and progress in our turnaround; our operational strategy, including our focus on live services, growth projections relating to our mobile forever franchises, and our belief that live services will provide increased predictability in recurring revenue over the long-term; our continued investment in game innovations; our plans to acquire additional games and IP assets; our partnership with the World Poker Tour (WPT), including the development, launch and success of future game features; our expectations regarding customer adoption; our ability to successfully launch new games and enhance existing games; the success of new product and feature launches and other special events; the prospect of emerging game platforms and features, such as augmented reality, chat and next generation wireless networks, including our belief in the growth of mobile as a gaming platform driving growth in our industry; our expectations regarding the advertising market, including anticipated trends in that market; our expectations in the mobile game industry, including anticipated trends in that market; our expectations regarding the acquisition of the mobile card game studio of Peak Games, including our ability to successfully integrate the acquired games and other assets into our business and operations; our belief that we operate the world’s largest casual mobile card game portfolio; our performance expectations regarding our legacy portfolio of web and older mobile games; and our ability to achieve financial projections, including revenue, bookings, income and margin goals.
Forward-looking statements often include words such as "outlook," "projected," "intends," "will," "anticipate," "believe," "target," "expect," and statements in the future tense are generally forward-looking. The achievement or success of the matters covered by such forward-looking statements involves significant risks, uncertainties, and assumptions. Our actual results could differ materially from those predicted or implied and reported results should not be considered as an indication of our future performance. Undue reliance should not be placed on such forward-looking statements, which are based on information available to us on the date hereof. We assume no obligation to update such statements. More information about factors that could affect our operating results are described in greater detail in our public filings with the Securities and Exchange Commission (the “SEC”), copies of which may be obtained by visiting our Investor Relations web site at http://investor.zynga.com or the SEC's web site at www.sec.gov.
In addition, the preliminary financial results set forth in this letter are estimates based on information currently available to us. While we believe these estimates are meaningful, they could differ from the actual amounts that we ultimately report in our Annual Report on Form 10-K for the quarter and full year ended December 31, 2017. We assume no obligation and do not intend to update these estimates prior to filing our Annual Report on Form 10-K.
8
NON-GAAP FINANCIAL MEASURES
We have provided in this letter certain non-GAAP financial measures to supplement our consolidated financial statements prepared in accordance with U.S. GAAP (our “GAAP financial statements”). Management uses non-GAAP financial measures internally in analyzing our financial results to assess operational performance and liquidity. Our non-GAAP financial measures may be different from non-GAAP financial measures used by other companies.
The presentation of our non-GAAP financial measures is not intended to be considered in isolation or as a substitute for, or superior to, our GAAP financial statements. We believe that both management and investors benefit from referring to our non-GAAP financial measures in assessing our performance and when planning, forecasting and analyzing future periods. We believe our non-GAAP financial measures are useful to investors because they allow for greater transparency with respect to key financial measures we use in making operating decisions and because our investors and analysts use them to help assess the health of our business.
We have provided reconciliations of our non-GAAP financial measures used in this letter to the most directly comparable GAAP financial measures in the following tables. Because of the following limitations of our non-GAAP financial measures, you should consider the non-GAAP financial measures presented in this letter with our GAAP financial statements.
Key limitations of our non-GAAP financial measures include:
| • | Bookings does not reflect that we defer and recognize online game revenue and revenue from certain advertising transactions over the estimated average life of durable virtual goods or as virtual goods are consumed; |
| • | Adjusted EBITDA does not include the impact of stock-based expense, acquisition-related transaction expenses, contingent consideration fair value adjustments, impairment of intangible assets, legal settlements and restructuring expense; |
| • | Adjusted EBITDA does not reflect provisions for or benefits from income taxes and does not include other income (expense) net, which includes foreign exchange gains and losses, and interest income; |
| • | Adjusted EBITDA excludes depreciation and amortization of tangible and intangible assets. Although depreciation and amortization are non-cash charges, the assets being depreciated and amortized may have to be replaced in the future; and |
| • | Free cash flow is derived from net cash provided by operating activities less cash spent on capital expenditures. |
9
ZYNGA INC.
CONSOLIDATED BALANCE SHEETS
(In thousands, unaudited)
| | December 31, | | | December 31, | |
| | 2017 | | | 2016 | |
Assets | | | | | | | | |
Current assets: | | | | | | | | |
Cash and cash equivalents | | $ | 372,870 | | | $ | 852,467 | |
Short-term investments | | | 308,506 | | | | — | |
Accounts receivable, net of allowance of $0 at December 31, 2017 and December 31, 2016 | | | 103,677 | | | | 77,260 | |
Restricted cash | | | 12,807 | | | | 6,199 | |
Prepaid expenses | | | 24,253 | | | | 22,951 | |
Other current assets | | | 8,837 | | | | 6,599 | |
Total current assets | | | 830,950 | | | | 965,476 | |
Goodwill | | | 730,464 | | | | 613,335 | |
Other intangible assets, net | | | 64,258 | | | | 25,430 | |
Property and equipment, net | | | 266,589 | | | | 269,439 | |
Restricted cash | | | 20,000 | | | | 3,050 | |
Prepaid expenses | | | 23,821 | | | | 18,598 | |
Other non-current assets | | | 43,251 | | | | 10,521 | |
Total assets | | $ | 1,979,333 | | | $ | 1,905,849 | |
Liabilities and stockholders’ equity | | | | | | | | |
Current liabilities: | | | | | | | | |
Accounts payable | | $ | 18,938 | | | $ | 23,999 | |
Income tax payable | | | 6,677 | | | | 1,889 | |
Deferred revenue | | | 134,007 | | | | 141,998 | |
Other current liabilities | | | 123,089 | | | | 75,754 | |
Total current liabilities | | | 282,711 | | | | 243,640 | |
Deferred revenue | | | 568 | | | | 158 | |
Deferred tax liabilities, net | | | 5,902 | | | | 5,791 | |
Other non-current liabilities | | | 48,912 | | | | 75,596 | |
Total liabilities | | | 338,093 | | | | 325,185 | |
Stockholders’ equity: | | | | | | | | |
Common stock and additional paid-in capital | | | 3,426,505 | | | | 3,349,714 | |
Accumulated other comprehensive income (loss) | | | (93,497 | ) | | | (128,694 | ) |
Accumulated deficit | | | (1,691,768 | ) | | | (1,640,356 | ) |
Total stockholders’ equity | | | 1,641,240 | | | | 1,580,664 | |
Total liabilities and stockholders’ equity | | $ | 1,979,333 | | | $ | 1,905,849 | |
10
ZYNGA INC.
CONSOLIDATED STATEMENTS OF OPERATIONS
(In thousands, except per share data, unaudited)
| | Three Months Ended | | | Twelve Months Ended | |
| | December 31, 2017 | | | September 30, 2017 | | | December 31, 2016 | | | December 31, 2017 | | | December 31, 2016 | |
Revenue: | | | | | | | | | | | | | | | | | | | | |
Online game | | $ | 173,114 | | | $ | 175,253 | | | $ | 140,157 | | | $ | 665,593 | | | $ | 547,291 | |
Advertising and other | | | 60,166 | | | | 49,342 | | | | 50,383 | | | | 195,797 | | | | 194,129 | |
Total revenue | | | 233,280 | | | | 224,595 | | | | 190,540 | | | | 861,390 | | | | 741,420 | |
Costs and expenses: | | | | | | | | | | | | | | | | | | | | |
Cost of revenue | | | 64,015 | | | | 65,907 | | | | 62,629 | | | | 258,971 | | | | 238,546 | |
Research and development | | | 61,229 | | | | 60,966 | | | | 92,417 | | | | 256,012 | | | | 320,300 | |
Sales and marketing | | | 60,265 | | | | 53,944 | | | | 46,860 | | | | 212,030 | | | | 183,637 | |
General and administrative | | | 38,711 | | | | 23,826 | | | | 23,095 | | | | 108,653 | | | | 92,509 | |
Impairment of intangible assets | | | — | | | | — | | | | — | | | | — | | | | 20,677 | |
Total costs and expenses | | | 224,220 | | | | 204,643 | | | | 225,001 | | | | 835,666 | | | | 855,669 | |
Income (loss) from operations | | | 9,060 | | | | 19,952 | | | | (34,461 | ) | | | 25,724 | | | | (114,249 | ) |
Interest income | | | 1,761 | | | | 1,502 | | | | 791 | | | | 5,309 | | | | 3,057 | |
Other income (expense), net | | | 2,319 | | | | 1,181 | | | | 1,476 | | | | 6,550 | | | | 6,461 | |
Income (loss) before income taxes | | | 13,140 | | | | 22,635 | | | | (32,194 | ) | | | 37,583 | | | | (104,731 | ) |
Provision for (benefit from) income taxes | | | 211 | | | | 4,544 | | | | 3,238 | | | | 10,944 | | | | 3,442 | |
Net income (loss) | | $ | 12,929 | | | $ | 18,091 | | | $ | (35,432 | ) | | $ | 26,639 | | | $ | (108,173 | ) |
| | | | | | | | | | | | | | | | | | | | |
Net income (loss) per share attributable to common stockholders: | | | | | | | | | | | | | | | | | | | | |
Basic | | $ | 0.01 | | | $ | 0.02 | | | $ | (0.04 | ) | | $ | 0.03 | | | $ | (0.12 | ) |
Diluted | | $ | 0.01 | | | $ | 0.02 | | | $ | (0.04 | ) | | $ | 0.03 | | | $ | (0.12 | ) |
| | | | | | | | | | | | | | | | | | | | |
Weighted average common shares used to compute net income (loss) per share attributable to common stockholders: | | | | | | | | | | | | | | | | | | | | |
Basic | | | 870,137 | | | | 867,377 | | | | 888,272 | | | | 869,067 | | | | 878,827 | |
Diluted | | | 898,410 | | | | 893,684 | | | | 888,272 | | | | 897,165 | | | | 878,827 | |
| | | | | | | | | | | | | | | | | | | | |
Stock-based compensation expense included in the above line items | | | | | | | | | | | | | | | | | | | | |
Cost of revenue | | $ | 413 | | | $ | 435 | | | $ | 895 | | | $ | 1,838 | | | $ | 3,720 | |
Research and development | | | 9,883 | | | | 10,097 | | | | 21,158 | | | | 42,176 | | | | 84,236 | |
Sales and marketing | | | 1,852 | | | | 1,891 | | | | 1,516 | | | | 7,281 | | | | 7,254 | |
General and administrative | | | 3,021 | | | | 3,166 | | | | 2,910 | | | | 13,220 | | | | 12,251 | |
Total stock-based compensation expense | | $ | 15,169 | | | $ | 15,589 | | | $ | 26,479 | | | $ | 64,515 | | | $ | 107,461 | |
11
ZYNGA INC.
CONSOLIDATED STATEMENTS OF CASH FLOWS
(In thousands, unaudited)
| | Three Months Ended | | | Twelve Months Ended | |
| | December 31, 2017 | | | September 30, 2017 | | | December 31, 2016 | | | December 31, 2017 | | | December 31, 2016 | |
Cash flows from operating activities: | | | | | | | | | | | | | | | | | | | | |
Net income (loss) | | $ | 12,929 | | | $ | 18,091 | | | $ | (35,432 | ) | | $ | 26,639 | | | $ | (108,173 | ) |
Adjustments to reconcile net income (loss) to net cash provided by (used in) operating activities: | | | | | | | | | | | | | | | | | | | | |
Depreciation and amortization | | | 6,405 | | | | 7,610 | | | | 9,612 | | | | 30,294 | | | | 41,770 | |
Stock-based compensation expense | | | 15,169 | | | | 15,589 | | | | 26,479 | | | | 64,515 | | | | 107,461 | |
(Gain) loss from sales of investments, assets and other, net | | | (34 | ) | | | (23 | ) | | | (134 | ) | | | (238 | ) | | | 26 | |
Accretion and amortization on marketable securities | | | (464 | ) | | | (172 | ) | | | 1 | | | | (636 | ) | | | 323 | |
Change in deferred income taxes and other | | | (443 | ) | | | 1,955 | | | | 746 | | | | 3,780 | | | | (1,988 | ) |
Impairment of intangible assets | | | — | | | | — | | | | — | | | | — | | | | 20,677 | |
Changes in operating assets and liabilities: | | | | | | | | | | | | | | | | | | | | |
Accounts receivable, net | | | (14,267 | ) | | | (4,182 | ) | | | (4,909 | ) | | | (26,417 | ) | | | 3,834 | |
Other assets | | | (8,483 | ) | | | 2,953 | | | | (1,693 | ) | | | (8,124 | ) | | | (2,501 | ) |
Accounts payable | | | 2,346 | | | | 2,329 | | | | 6,558 | | | | (3,666 | ) | | | (3,613 | ) |
Deferred revenue | | | (9,494 | ) | | | (11,108 | ) | | | 10,992 | | | | (7,581 | ) | | | 13,113 | |
Income tax payable | | | 2,785 | | | | (746 | ) | | | 1,889 | | | | 4,788 | | | | 1,889 | |
Other liabilities | | | 19,931 | | | | 2,791 | | | | 13,634 | | | | 11,223 | | | | (12,802 | ) |
Net cash provided by (used in) operating activities | | | 26,380 | | | | 35,087 | | | | 27,743 | | | | 94,577 | | | | 60,016 | |
Cash flows from investing activities: | | | | | | | | | | | | | | | | | | | | |
Purchases of short-term investments | | | (93,293 | ) | | | (255,301 | ) | | | — | | | | (348,594 | ) | | | — | |
Sales and maturities of short-term investments | | | 40,000 | | | | — | | | | 4,500 | | | | 40,000 | | | | 244,837 | |
Acquisition of property and equipment | | | (3,093 | ) | | | (2,737 | ) | | | (3,692 | ) | | | (9,971 | ) | | | (10,313 | ) |
Business acquisitions, net of cash acquired | | | (98,620 | ) | | | — | | | | — | | | | (133,701 | ) | | | (33,630 | ) |
Proceeds from sale of property and equipment | | | 52 | | | | 73 | | | | 174 | | | | 273 | | | | 3,209 | |
Other investing activities, net | | | (938 | ) | | | — | | | | — | | | | (8,163 | ) | | | — | |
Net cash provided by (used in) investing activities | | | (155,892 | ) | | | (257,965 | ) | | | 982 | | | | (460,156 | ) | | | 204,103 | |
Cash flows from financing activities: | | | | | | | | | | | | | | | | | | | | |
Taxes paid related to net share settlement of stockholders' equity awards | | | (7,143 | ) | | | (5,153 | ) | | | (1,259 | ) | | | (21,719 | ) | | | (3,422 | ) |
Repurchases of common stock | | | (8,089 | ) | | | — | | | | (30,204 | ) | | | (105,013 | ) | | | (142,596 | ) |
Proceeds from issuance of common stock | | | 520 | | | | 4,231 | | | | 351 | | | | 8,769 | | | | 5,921 | |
Acquisition-related contingent consideration payment | | | — | | | | — | | | | (10,230 | ) | | | — | | | | (10,230 | ) |
Net cash provided by (used in) financing activities | | | (14,712 | ) | | | (922 | ) | | | (41,342 | ) | | | (117,963 | ) | | | (150,327 | ) |
| | | | | | | | | | | | | | | | | | | | |
Effect of exchange rate changes on cash and cash equivalents | | | (163 | ) | | | 2,082 | | | | (1,235 | ) | | | 3,945 | | | | (3,542 | ) |
| | | | | | | | | | | | | | | | | | | | |
Net increase (decrease) in cash and cash equivalents | | | (144,387 | ) | | | (221,718 | ) | | | (13,852 | ) | | | (479,597 | ) | | | 110,250 | |
Cash and cash equivalents, beginning of period | | | 517,257 | | | | 738,975 | | | | 866,319 | | | | 852,467 | | | | 742,217 | |
Cash and cash equivalents, end of period | | $ | 372,870 | | | $ | 517,257 | | | $ | 852,467 | | | $ | 372,870 | | | $ | 852,467 | |
12
ZYNGA INC.
RECONCILIATION OF GAAP TO NON-GAAP RESULTS
(In thousands, except per share data, unaudited)
| | Three Months Ended | | | Twelve Months Ended | |
| | December 31, 2017 | | | September 30, 2017 | | | December 31, 2016 | | | December 31, 2017 | | | December 31, 2016 | |
Reconciliation of Revenue to Bookings | | | | | | | | | | | | | | | | | | | | |
Revenue | | $ | 233,280 | | | $ | 224,595 | | | $ | 190,540 | | | $ | 861,390 | | | $ | 741,420 | |
Change in deferred revenue | | | (9,494 | ) | | | (11,108 | ) | | | 10,992 | | | | (7,581 | ) | | | 13,113 | |
Bookings | | $ | 223,786 | | | $ | 213,487 | | | $ | 201,532 | | | $ | 853,809 | | | $ | 754,533 | |
| | | | | | | | | | | | | | | | | | | | |
Reconciliation of Revenue to Bookings: Mobile | | | | | | | | | | | | | | | | | | | | |
Revenue | | $ | 203,625 | | | $ | 194,390 | | | $ | 154,674 | | | $ | 739,496 | | | $ | 574,371 | |
Change in deferred revenue | | | (6,584 | ) | | | (7,848 | ) | | | 12,387 | | | | 1,831 | | | | 30,404 | |
Bookings: Mobile | | $ | 197,041 | | | $ | 186,542 | | | $ | 167,061 | | | $ | 741,327 | | | $ | 604,775 | |
| | | | | | | | | | | | | | | | | | | | |
Reconciliation of Revenue to Bookings: Advertising | | | | | | | | | | | | | | | | | | | | |
Revenue | | $ | 58,991 | | | $ | 46,352 | | | $ | 49,338 | | | $ | 189,828 | | | $ | 188,493 | |
Change in deferred revenue | | | 860 | | | | (773 | ) | | | 306 | | | | 133 | | | | (1,660 | ) |
Bookings: Advertising | | $ | 59,851 | | | $ | 45,579 | | | $ | 49,644 | | | $ | 189,961 | | | $ | 186,833 | |
| | | | | | | | | | | | | | | | | | | | |
Reconciliation of Net Income (Loss) to Adjusted EBITDA | | | | | | | | | | | | | | | | | | | | |
Net income (loss) | | $ | 12,929 | | | $ | 18,091 | | | $ | (35,432 | ) | | $ | 26,639 | | | $ | (108,173 | ) |
Provision for income taxes | | | 211 | | | | 4,544 | | | | 3,238 | | | | 10,944 | | | | 3,442 | |
Other income, net | | | (2,319 | ) | | | (1,181 | ) | | | (1,476 | ) | | | (6,550 | ) | | | (6,461 | ) |
Interest income | | | (1,761 | ) | | | (1,502 | ) | | | (791 | ) | | | (5,309 | ) | | | (3,057 | ) |
Restructuring expense, net | | | 1,612 | | | | 995 | | | | (191 | ) | | | 3,184 | | | | 1,938 | |
Depreciation and amortization | | | 6,405 | | | | 7,610 | | | | 9,612 | | | | 30,294 | | | | 41,770 | |
Acquisition-related transaction expenses | | | 2,390 | | | | 443 | | | | — | | | | 3,020 | | | | 274 | |
Contingent consideration fair value adjustment | | | — | | | | — | | | | 9,145 | | | | (901 | ) | | | (9,025 | ) |
Loss on legal settlements | | | 11,867 | | | | — | | | | — | | | | 11,867 | | | | — | |
Impairment of intangible assets | | | — | | | | — | | | | — | | | | — | | | | 20,677 | |
Stock-based compensation expense | | | 15,169 | | | | 15,589 | | | | 26,479 | | | | 64,515 | | | | 107,461 | |
Adjusted EBITDA | | $ | 46,503 | | | $ | 44,589 | | | $ | 10,584 | | | $ | 137,703 | | | $ | 48,846 | |
| | | | | | | | | | | | | | | | | | | | |
Reconciliation of GAAP operating expense to Non-GAAP operating expense | | | | | | | | | | | | | | | | | | | | |
GAAP operating expense | | $ | 160,205 | | | $ | 138,736 | | | $ | 162,372 | | | $ | 576,695 | | | $ | 617,123 | |
Restructuring expense, net | | | (1,612 | ) | | | (995 | ) | | | 191 | | | | (3,184 | ) | | | (1,938 | ) |
Amortization of intangible assets from acquisition | | | (547 | ) | | | (814 | ) | | | (1,520 | ) | | | (3,811 | ) | | | (4,257 | ) |
Acquisition-related transaction expenses | | | (2,390 | ) | | | (443 | ) | | | — | | | | (3,020 | ) | | | (274 | ) |
Contingent consideration fair value adjustment | | | — | | | | — | | | | (9,145 | ) | | | 901 | | | | 9,025 | |
Loss on legal settlements | | | (11,867 | ) | | | — | | | | — | | | | (11,867 | ) | | | — | |
Impairment of intangible assets | | | — | | | | — | | | | — | | | | — | | | | (20,677 | ) |
Stock-based compensation expense | | | (14,756 | ) | | | (15,154 | ) | | | (25,584 | ) | | | (62,677 | ) | | | (103,741 | ) |
Non-GAAP operating expense | | $ | 129,033 | | | $ | 121,330 | | | $ | 126,314 | | | $ | 493,037 | | | $ | 495,261 | |
| | | | | | | | | | | | | | | | | | | | |
Reconciliation of cash provided by operating activities to free cash flow | | | | | | | | | | | | | | | | | | | | |
Net cash provided by (used in) operating activities | | | 26,380 | | | | 35,087 | | | | 27,743 | | | | 94,577 | | | | 60,016 | |
Acquisition of property and equipment | | | (3,093 | ) | | | (2,737 | ) | | | (3,692 | ) | | | (9,971 | ) | | | (10,313 | ) |
Free cash flow | | $ | 23,287 | | | $ | 32,350 | | | $ | 24,051 | | | $ | 84,606 | | | $ | 49,703 | |
13
ZYNGA INC.
RECONCILIATION OF GAAP TO NON-GAAP FIRST QUARTER 2018 GUIDANCE
(In thousands, except per share data, unaudited)
| | First Quarter 2018 | |
Reconciliation of Revenue to Bookings | | | | |
Revenue | $ | | 200,000 | |
Change in deferred revenue | | | 10,000 | |
Bookings | $ | | 210,000 | |
| | | | |
Reconciliation of Net Loss to Adjusted EBITDA | | | | |
Net loss | $ | | (5,000) | |
Provision for income taxes | | | 5,000 | |
Other income, net | | | (3,000) | |
Interest income | | | (2,000) | |
Depreciation and amortization | | | 8,000 | |
Stock-based compensation expense | | | 17,000 | |
Adjusted EBITDA | $ | | 20,000 | |
| | | | |
GAAP diluted shares | | | 905,000 | |
Diluted net loss per share | $ | | (0.01) | |
14