Exhibit 99.1
Q2 2019 Zynga Quarterly earnings letter July 31, 2019

Dear Shareholders,
We look forward to discussing our Q2 2019 results during today’s earnings call at 2:00 p.m. PT. Our quarterly earnings letter below details our Q2 performance, as well as our outlook for Q3 and growth opportunities for 2019 and beyond. Please note that we manage our business based on topline measures including revenue, which is composed of the change in deferred revenue and bookings. Revenue and the change in deferred revenue are both directly affected by bookings results, and management utilizes bookings as a primary topline measure to help inform its decisions.
Executive Summary
We delivered strong Q2 results, ahead of our guidance, and finished the first half of 2019 with momentum across all aspects of our multi-year growth strategy. In the quarter, revenue was up 41% year-over-year and bookings were up 61% year-over-year as we achieved our best mobile revenue and bookings quarter in Zynga history.
Live services continue to drive our great results. In particular, Empires & Puzzles and Merge Dragons! reached record revenue and bookings in the quarter and Words With Friends achieved its best Q2 mobile revenue and bookings in franchise history. Zynga Poker also performed ahead of our expectations while CSR2 and Hit It Rich! Slots were strong contributors.
We released Game of Thrones® Slots Casino worldwide on May 30. Through its first two months, the title is off to a great start with strong player engagement and monetization metrics. We expect this title to steadily scale over the coming quarters as we continue to invest in its growth. In July, we also introduced two new games into soft launch – FarmVille 3 and Merge Magic!. These titles join Puzzle Combat in soft launch as we gather player feedback and test for long-term engagement.
In terms of capital allocation, we executed our objective to increase our cash reserves. Given favorable market conditions, we raised $690 million in a convertible notes offering, which was well-received and generated net cash proceeds of approximately $600 million in the quarter after the cost of the capped call transactions and associated issuance fees. In addition, given a strong San Francisco real estate market, on July 1, we completed the sale-leaseback of our headquarters building, which provided net proceeds of approximately $580 million after taxes and fees. As of
July 1, we had approximately $1.4 billion of cash and investments, which we anticipate will be used primarily to fund future acquisitions to further accelerate our growth.
Given the continued strong momentum of our live services, we are raising our full year 2019 guidance to $1.24 billion in revenue, up 37% year-over-year and an increase of $40 million versus our prior guidance. We are also raising our bookings guidance to $1.5 billion, up 55% year-over-year and an increase of $50 million versus our prior guidance. We remain on track to deliver our best annual revenue since 2012 and the highest bookings in Zynga history.
It is an incredibly exciting time for Zynga. By executing our multi-year growth strategy, we are positioned to be one of the fastest growing public gaming companies in 2019.
1
Q2 Highlights
| • | Revenue of $306 million, up 41% year-over-year. Bookings of $376 million, up 61% year-over-year. |
| • | Our live services portfolio drove our Q2 topline performance. In particular, Empires & Puzzles and Merge Dragons! both had record revenue and bookings quarters, while Words With Friends achieved its best Q2 mobile revenue and bookings in franchise history. CSR2, Zynga Poker and Hit It Rich! Slots were also strong contributors in the quarter. |
| • | Empires & Puzzles and Merge Dragons! were the primary contributors to our deferred revenue build of $70 million. |
| • | The strength of our portfolio drove our best mobile revenue and bookings performances in Zynga history; mobile revenue of $287 million, up 49% year-over-year, and mobile bookings of $358 million, up 69% year-over-year. |
| • | Record mobile online game – or mobile user pay – revenue of $224 million, up 56% year-over-year, and mobile user pay bookings of $294 million, up 83% year-over-year. |
| • | Highest Q2 mobile advertising quarter with mobile advertising revenue of $64 million, up 28% year-over-year, and mobile advertising bookings of $64 million, up 27% year-over-year. |
| • | Launched Game of Thrones Slots Casino on May 30. Through its first two months, the title is off to a great start with strong player engagement and monetization metrics. We expect this title to steadily scale over the coming quarters as we continue to invest in its growth. |
| • | Self-published Empires & Puzzles in South Korea and Japan. We are encouraged by the game’s early engagement results and expect to invest additional marketing on this title in Asia over the coming quarters. |
| • | Launched Tiny Royale, a team-based battle royale experience and one of the first games on Snapchat’s Snap Games platform. |
| • | Our recent acquisitions continue to perform ahead of our initial expectations resulting in an increase in contingent consideration of $24 million in the quarter. |
| • | Issued $690 million of convertible notes, providing net cash proceeds of approximately $600 million. |
| • | Entered an agreement for the sale-leaseback of our San Francisco headquarters building, which closed on July 1, generating net proceeds of approximately $580 million after taxes and fees. |
| • | Generated operating cash flow of $99 million, our best performance since Q4 2011 and up 140% year-over-year. |

Launched Game of Thrones Slots Casino on May 30
2
Financials
In Q2, we delivered revenue of $306 million, above our guidance by $26 million and up $89 million or 41% year-over-year as a result of strong bookings growth offset by a significant increase in deferred revenue. Bookings were $376 million, beating our guidance by $16 million and up $142 million or 61% year-over-year. The strong collective performance of our mobile live services portfolio drove our better than expected results.
We achieved record mobile revenue and bookings in the quarter with mobile revenue up 49% year-over-year and mobile bookings up 69% year-over-year. Mobile represented 94% of total revenue versus 89% a year ago and 95% of total bookings versus 90% in Q2 2018.
We had a net increase in deferred revenue of $70 million versus our guidance of a net increase of $80 million and a net increase of $17 million in the prior year quarter. Empires & Puzzles and Merge Dragons! were the primary drivers of the net increase in deferred revenue.
While the release of this GAAP deferral will have a positive impact on revenue and profitability in future periods, it represented a $70 million reduction in revenue, net income and Adjusted EBITDA in the current period. On a year-over-year basis, the difference in the change in deferred revenue represented a $53 million decrease in the year-over-year change in revenue, net income and Adjusted EBITDA.
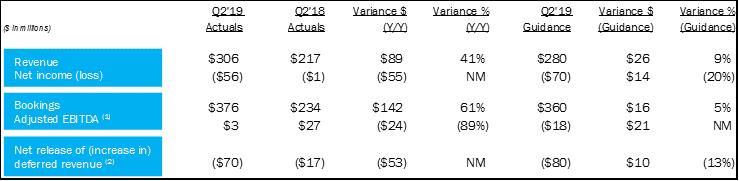
Q2’19 actuals Q2’18 actuals variance $ (y/y/) variance % (y/y) q2’19 guidance variance $ (guidance) variance % (guidance) ($ in millions) revenue net income (loss) bookings adjusted ebitda (1) net release of (increase in) deferred revenue (2) $306 $217 $89 41% $280 $26 9% ($56) ($1) ($55) NM ($70) $14 (20%) $376 $234 $142 61% $360 $16 5% $3 $27 ($24) (89%) ($18) $21 NM ($70) ($17) ($53) NM ($80) $10 (13%)
Note: Certain measures as presented differ due to the impact of rounding.
(1) | Adjusted EBITDA includes the net release of (increase in) deferred revenue. |
(2) | For clarity, a net release of deferred revenue results in revenue being higher than bookings and is a positive impact to Adjusted EBITDA as reported; a net increase in deferred revenue results in revenue being lower than bookings and is a negative impact to Adjusted EBITDA as reported. |
GAAP operating expenses rose to 79% of revenue from 67% of revenue in Q2 2018, due primarily to the material year-over-year increase in deferred revenue and contingent consideration. On a non-GAAP basis, operating expenses represented 52% of bookings, down from 54% of bookings in Q2 2018, driven by stronger operating leverage.
Our recent acquisitions continue to perform ahead of our initial expectations resulting in an increase in contingent consideration of $24 million in the quarter versus our guidance of $15 million.
We finished Q2 with a net loss of $56 million, $14 million better than our guidance of a net loss of $70 million, primarily driven by better than expected operational performance. Our Adjusted EBITDA was $3 million, above our guidance by $21 million and a decrease of $24 million year-over-year. In the quarter, we generated operating cash flow of $99 million, our best performance since Q4 2011 and up $57 million or 140% year-over-year.
3
Product
We are focused on driving strong, recurring growth across our live services through the steady release of innovative bold beats – new content and game play modes designed to engage and attract current, lapsed and new audiences. In Q2, our better than expected topline results were driven by outstanding performances from Merge Dragons! and Empires & Puzzles, as well as an initial contribution from our recently launched Game of Thrones Slots Casino title.
Merge Dragons! completed an exceptional Q2, achieving another record revenue and bookings quarter. Our new Merge 5 event was particularly well-received by players, in addition to exciting Easter and Greek-themed events. The game continues to attract new audiences effectively through paid user acquisition and repeatedly broke into the Top 10 U.S. Grossing Game charts on the Google Play Store and Top 20 U.S. Grossing Game charts on the Apple App Store. Looking ahead, the team continues to explore ways to enhance the social features within the game, including the introduction of a brand-new Dragon Dens feature for players in Q3 along with additional summer-themed events.
Empires & Puzzles also delivered its best revenue and bookings quarter. At the end of Q2, we released the first expansion to the game’s base features which included an increase to the stronghold’s max level from 20 to 21 and new buildings such as the Hunter's Lodge. During the quarter, Empires & Puzzles repeatedly broke into the Top 5 U.S. Grossing Game charts on the Google Play Store and the Apple App Store. In the quarter, we also self-published Empires & Puzzles in South Korea and Japan. We are pleased with the game’s initial player engagement in these markets and expect to further invest in its growth in Asia over the coming quarters.
Words With Friends continues to perform well, producing its best Q2 mobile revenue and bookings in franchise history with mobile revenue up 31% year-over-year and mobile bookings up 13% year-over-year. Our new Achievements bold beat engaged and delighted players by recognizing and rewarding them for their unique styles of play. Garth Brooks also co-hosted our first-ever celebrity Words With Friends LIVE show in May, which was well-received by players. In Q3, Words With Friends celebrates its 10-year anniversary with a special ‘Friendiversary’ event as well as in-game giveaways, exclusive tiles and prizes.
CSR2 was a strong contributor in Q2 as the game marked its third anniversary. In the quarter, we completed the first series of three Fast & Furious-themed events, which featured fan-favorite cars such as the Veilside Honda S2000 and Dodge Ice Charger, as well as a new in-game addition of the Fast & Furious Flip Car. In Q2, revenue was up 21% year-over-year – driven by a release of deferred revenue – and bookings were down 8% year-over-year due to a lighter content calendar. Heading into Q3, we have exciting bold beats planned including additional Fast & Furious themed events, a first-time and exclusive unveil of the new Pagani Huayra Roadster BC in-game and the initial beta testing of a new player-versus-player feature called Showdown.
Zynga Poker performed ahead of our expectations in the quarter as mobile revenue was flat sequentially and mobile bookings returned to sequential growth. This was driven by a new Boosts feature that enhances players’ core game play experience. In the quarter, mobile revenue was down 22% year-over-year and mobile bookings were down 18% year-over-year. We remain confident that Zynga Poker will grow sequentially in the second half of 2019 with more content from our World Poker Tour partnership and new bold beats.
We launched Game of Thrones Slots Casino worldwide on May 30. This new title is based on the hit HBO® series and delivers a high-quality Social Slots experience with unique in-game social mechanics. Through its first two months, the title is off to a great start with strong player engagement and monetization metrics. We expect this title to steadily scale over the coming quarters as we continue to invest in its growth. In addition, Hit It Rich! Slots delivered strong year-over-year mobile revenue and bookings growth of 13% and 17%, respectively. Q2 represented its best mobile revenue and bookings performances in over three years as a result of strong player engagement in features such as Weekly Race and Collections. Overall, these growth drivers were partially offset by declines in legacy slots titles, resulting in our Social Slots portfolio’s Q2 mobile revenue down 6% year-over-year and mobile bookings up 3% year-over-year.
We are testing three new games in soft launch including Puzzle Combat, a new title from Small Giant Games that combines modern combat with role-playing systems and accessible puzzle mechanics. In addition, we recently soft launched two games – FarmVille 3, an innovative mobile experience built from the ground up around this iconic brand, and Merge Magic!, a new title from Gram Games that combines whimsical, magical themes with merge and builder game elements. As these games progress through soft launch, we will enhance these titles based on player feedback and test results.
4
Advertising
We delivered our highest Q2 advertising quarter with revenue of $66 million, up 26% year-over-year and bookings of $66 million, up 25% year-over-year. Our strong results were driven by the year-over-year additions of Gram Games and Small Giant Games as well as by advertising network optimizations.
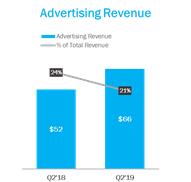
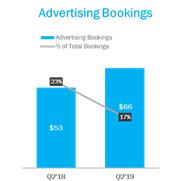
Advertising revenue Advertising revenue % of total revenue 24% 21% $52 $66 q2’18 q2’19 advertising bookings advertising bookings % of total bookings 23% $53 $66 17% q2’18 q2’19
Beginning in Q3, we will encounter stronger year-over-year advertising comparatives as we lap our acquisition of Gram Games and network optimizations that resulted in higher yields over the past year. We expect advertising to grow in the low double-digits in fiscal 2019 and anticipate advertising as a percentage of total revenue and bookings to decline relative to our historical levels driven by a higher user pay mix. We remain focused on expanding our advertising inventory within our live services portfolio and via new game launches, in addition to optimizing our yields through our advertising network partnerships.
Player Metrics
In Q2, our average mobile daily active users (DAUs) were up 1% year-over-year as the additions of Empires & Puzzles and full quarter of Merge Dragons! were offset by decreases in older mobile games, Zynga Poker and Words With Friends. Our average mobile monthly active users (MAUs) declined by 10% year-over-year for reasons similar to mobile DAUs, as well as due to decreases in our chat games and Solitaire, both of which have a larger impact on mobile MAUs due to player behavior in these games. On a sequential basis, Q2 mobile DAUs were down 5% and mobile MAUs were down 2%. This was primarily due to declines in older mobile and chat games in addition to audience seasonality in Words With Friends.
We expect player metrics to fluctuate in the near term primarily driven by continued declines in older mobile titles and our decision to sunset some chat games, while being partially offset by growth from new titles in the second half of 2019. We remain pleased with the engagement and monetization we are seeing collectively across our forever franchises.
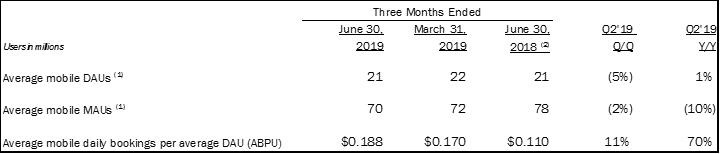
Three months ended users in millions June 30, 2019 March 31, 2019 June 30, 2018 (2) Q2’19 q/q Q2’19 Y/Y average mobile daus (1) 21 22 21 (5%) 1% average mobile maus (1) 70 72 78 (2%) (10%) average mobile daily bookings per average DAU (abpu) $0.188 $0.170 $0.110 11% 70%
(1) | We do not have the third party network login data to link an individual who has played under multiple user accounts and accordingly, actual Mobile DAU and Mobile MAU may be lower than reported due to the potential duplication of these individuals. Specifically, Mobile DAUs and Mobile MAUs incrementally include the games acquired from Gram Games in May 2018 and the game acquired from Small Giant Games in January 2019. |
(2) | In the first quarter of 2019, we updated our methodologies and approaches for identifying automated attempts to replicate legitimate player activity. Amounts reported for the three months ended June 30, 2018 have not been adjusted to reflect any subsequent updates to the reporting and estimation methodologies due to the potential variability in player behavior and other factors that can influence the various data sets. Assuming consistency in the player data profiles across periods, we estimate that the impact of new methodologies on the amounts previously reported during 2018 may reduce our average Mobile DAUs and average Mobile MAUs by approximately 5-10%. As a result, these audience metrics may not be comparable to prior periods. |
5
Capital Allocation
In Q2, we generated operating cash flow of $99 million, our best performance since Q4 2011 and up $57 million or 140% year-over-year. In addition, given favorable market conditions, we executed our objective of increasing our cash reserves through a convertible notes offering and the sale-leaseback of our San Francisco headquarters building.
In mid-June, we issued $690 million of 0.25% interest 5-year convertible senior notes, which have an initial conversion price of approximately $8.31 per share. In conjunction with the convertible notes offering, we entered into capped call transactions designed to effectively eliminate the potential dilution impact of these convertible notes until our stock trades above a price of $12.54 per share. Net proceeds from the convertible notes issuance were approximately $600 million after the cost of the capped call transactions and associated issuance fees.
In the quarter, we also paid down the $100 million previously drawn on our revolving credit facility. As of June 30, we held $831 million of cash and investments.
In addition, given a strong San Francisco real estate market, on July 1, we completed the sale-leaseback of our headquarters building, which provided net proceeds of approximately $580 million after taxes and fees. As of
July 1, we had approximately $1.4 billion of cash and investments, which we anticipate will be used primarily to fund future acquisitions to further accelerate our growth.
Multi-Year Growth Strategy
We are executing well as we deliver on our multi-year growth strategy to: (1) grow our live services, (2) create new forever franchises and (3) invest in emerging markets, technologies and platforms. We also see opportunities to further enhance our growth through acquisitions.
First, our strength in live services is the foundation of our multi-year growth strategy. Today, we have a highly diversified live services portfolio, anchored by our five forever franchises – CSR Racing, Empires & Puzzles, Merge Dragons!, Words With Friends and Zynga Poker. We are focused on growing this live services portfolio by delivering innovative bold beats, including new content and game play modes designed to engage and attract current, lapsed and new audiences. All of this is fueled by our proven and scalable live services platform comprised of best-in-class product management, data science, user acquisition, advertising and platform relationships. In any given year, we expect strong, recurring growth from this portfolio with live services accounting for the vast majority of our total revenue and bookings. Sustainable profitability generated by our live services enables us to invest in new game development as well as emerging platforms, technologies and markets.
Second, our goal is to create new forever franchises to add to our live services portfolio. We have an exciting new game pipeline that includes titles based on existing and new IPs such as FarmVille, CityVille, Merge Magic! and Puzzle Combat, as well as strategic licenses such as Game of ThronesTM, Harry PotterTM and Star WarsTM. These new titles are built within our global studio organization by teams that have been together for years and have a proven track record of developing successful games. We maintain a rigorous approach to engineering hits, which includes careful testing in soft launch and relentless iteration with the goal of delivering long-term player engagement. We launched Game of Thrones Slots Casino in Q2 and currently have three games in soft launch – Puzzle Combat, FarmVille 3 and Merge Magic!.
Third, we are investing in emerging markets, technologies and platforms to increase future growth. Specifically in the quarter, we self-published Empires & Puzzles in South Korea and Japan. We are encouraged by the game’s early engagement results in these markets and expect to invest additional marketing for this title in Asia over the coming quarters. We are also experimenting with the distribution of our games on new platforms. In June, we launched Tiny Royale, a team-based battle royale experience and one of the first games on Snapchat’s Snap Games platform.
We also see opportunities to enhance our multi-year growth strategy by acquiring talented teams and franchises that can accelerate our growth. Zynga is uniquely positioned to capitalize on the dynamic gaming landscape with our proven live services platform that is highly scalable and has global reach. Our integration approach is designed to enable teams to do what they love most – create games – while growing faster together.
6
Q3 Guidance
| • | Net increase in deferred revenue of $55 million |
| • | Bookings of $380 million |
| • | Net income of $250 million (includes a $305 million one-time gain on the sale of our headquarters building) |
| • | Adjusted EBITDA of $7 million |
In Q3, we expect $325 million in revenue, up $92 million or 39% year-over-year, with bookings of $380 million, up $131 million or 53% year-over-year.
Our Q3 topline performance will be driven by our live services – in particular, we expect moderate sequential growth collectively across our five forever franchises. We also anticipate the incremental topline contribution from Game of Thrones Slots Casino will be more than offset by declines in web and older mobile games.
We expect our gross margins to be pressured sequentially by a higher mix of user pay versus advertising as well as an increase in royalties on licensed IPs, with this negative impact more than offset by the revenue increase in the quarter.
We also expect an increase in our operating expenses sequentially, primarily due to higher marketing investments in the quarter, a slight ramp in R&D spend on our new game pipeline and rent expense on our San Francisco headquarters. These increases should be partially offset on a GAAP basis by a lower accrual for contingent consideration.
The sequential increase in marketing costs is expected to be driven primarily by the ramp of investment spend on our recently launched title Game of Thrones Slots Casino, as well as Merge Dragons! and Empires & Puzzles. We have also factored into our guidance the potential for initial marketing investment on some of our titles in soft launch. While these investments will pressure operating margins in Q3, we expect them to support growth in future quarters.
On July 1, we completed the sale-leaseback of our San Francisco headquarters building, resulting in net cash proceeds after taxes and fees of approximately $580 million and an expected one-time gain of approximately $305 million. We expect minimal federal and state taxes on this gain due to the utilization of net operating losses.

7
2019 & Beyond
Given the continued strong momentum in our live services, we are raising our full year 2019 guidance to $1.24 billion in revenue, up 37% year-over-year and an increase of $40 million versus our prior guidance. We are also raising our bookings guidance to $1.5 billion, up 55% year-over-year and an increase of $50 million versus our prior guidance. We expect a net increase in deferred revenue of $260 million, up 317% year-over-year and an increase of $10 million versus our prior guidance. We remain on track to deliver our best annual revenue since 2012 and the highest bookings in Zynga history.
We continue to expect pressure on our gross margins due to a higher mix of user pay versus advertising and an increase in royalties on licensed IPs. In addition, we expect to increase our marketing spend year-over-year as we invest in high-growth live services titles such as Empires & Puzzles and Merge Dragons! as well as the launch of new titles. We also anticipate a slight ramp in development spend on our new game pipeline and incremental rent expense related to the sale-leaseback of our San Francisco headquarters building. These factors will modestly impact our overall operating margins in 2019 but should deliver returns in future years.
Looking towards 2020, we continue to expect low double-digit revenue and bookings growth with greater operating leverage. Our live services growth in 2020 will be enhanced by full-year contributions from our 2019 new game launches as well as initial contributions from games launched in 2020. Over the next few years, we expect to make meaningful progress toward achieving margins more in-line with our peers on a like-for-like basis.
Closing
Zynga is a leading mobile-first, free-to-play, live services company with the mission of connecting the world through games. Mobile is the largest and fastest-growing gaming platform in the world with mobile games expected to reach 2.4 billion people in 2019. This platform is constantly evolving with new devices, technologies and distribution innovations that will expand the overall accessibility of games and, therefore, Zynga's total addressable market.
As a nimble, mobile-first company, we are well positioned to capitalize on this rapidly evolving gaming landscape at a time when demand for interactive entertainment is reaching new highs. Our excellent results through the first half of 2019 puts us well on track to be one of the fastest-growing public game companies this year. We are focused on executing our multi-year growth strategy to further scale our business and generate more value for players and shareholders.
| |
Sincerely, | |

Frank Gibeau
Chief Executive Officer | 
Ger Griffin
Chief Financial Officer |
8
Forward-Looking Statements
This letter contains forward-looking statements, including those statements relating to our outlook for the full year and third quarter of 2019, including under the headings “Executive Summary,” “Q3 Guidance” and “2019 & Beyond” and statements relating to, among other things: our operational performance and strategy, including our focus on live services, growth projections relating to our forever franchises, and confidence in our ability to grow our business in 2019 and beyond; our expectation to use cash reserves to fund future acquisitions; our plans to launch new games featuring (i) owned IP, including FarmVille, CityVille, Merge Magic! and Puzzle Combat, and (ii) titles based on strategic licenses, including Game of Thrones™, Harry Potter™ and Star Wars™, enhance existing games with new features and updates, enhance soft-launched games based on player feedback and test results, and further invest in player engagement in new markets, including for Empires & Puzzles in Asia; the success of new product and feature launches and other special events, and the investments related to introductions of new games and features, including Game of Thrones Slots Casino; growth projections as a result of new technologies and player preferences; our performance expectations regarding our legacy portfolio of web and older mobile games; and our ability to achieve and expectations related to financial projections, including revenue, deferred revenue, bookings, income, adjusted EBITDA, operating expenses, operating cash flow and margins.
Forward-looking statements often include words such as “outlook,” “projected,” “intend,” “will,” “anticipate,” “believe,” “target,” “expect,” “positioned,” and statements in the future tense are generally forward-looking. The achievement or success of the matters covered by such forward-looking statements involves significant risks, uncertainties, and assumptions. Our actual results could differ materially from those predicted or implied and reported results should not be considered as an indication of our future performance. Undue reliance should not be placed on such forward-looking statements, which are based on information available to us on the date hereof. We assume no obligation to update such statements. More information about factors that could affect our operating results are described in greater detail in our public filings with the Securities and Exchange Commission (the “SEC”), copies of which may be obtained by visiting our Investor Relations web site at http://investor.zynga.com or the SEC's website at www.sec.gov.
In addition, the preliminary financial results set forth in this letter are estimates based on information currently available to us. While we believe these estimates are meaningful, they could differ from the actual amounts that we ultimately report in our Quarterly Report on Form 10-Q for the quarter ended June 30, 2019. We assume no obligation and do not intend to update these estimates prior to filing our Quarterly Report on Form 10-Q.
9
Key Operating Metrics
We manage our business by tracking several operating metrics: “Mobile DAUs,” which measure daily active users of our mobile games, “Mobile MAUs,” which measure monthly active users of our mobile games, and “ABPU,” which measures our average daily mobile bookings per average Mobile DAU, each of which is recorded and estimated by our internal analytics systems. We determine these operating metrics by using internal company data based on tracking of user account activity. We also use information provided by third parties, including third party network logins provided by platform providers, to help us track whether a player logged in under two or more different user accounts is the same individual. We believe that the amounts are reasonable estimates of our user base for the applicable period of measurement and that the methodologies we employ and update from time-to-time are reasonably based on our efforts to identify trends in player behavior; however, factors relating to user activity and systems and our ability to identify and detect attempts to replicate legitimate player activity may impact these numbers.
Mobile DAUs. We define Mobile DAUs as the number of individuals who played one of our mobile games during a particular day. Under this metric, an individual who plays two different mobile games on the same day is counted as two DAUs. We use information provided by third parties to help us identify individuals who play the same game to reduce this duplication. However, because we do not always have the third party network login data to link an individual who has played under multiple user accounts, a player may be counted as multiple Mobile DAUs. Average Mobile DAUs for a particular period is the average of the Mobile DAUs for each day during that period. We use Mobile DAUs as a measure of audience engagement.
Mobile MAUs. We define Mobile MAUs as the number of individuals who played one of our mobile games in the 30-day period ending with the measurement date. Under this metric, an individual who plays two different mobile games in the same 30-day period is counted as two Mobile MAUs. We use information provided by third parties to help us identify individuals who play the same game to reduce this duplication. However, because we do not always have the third party network login data to link an individual who has played under multiple user accounts, a player may be counted as multiple Mobile MAUs. Average Mobile MAUs for a particular period is the average of the Mobile MAUs at each month-end during that period. We use Mobile MAUs as a measure of total game audience size.
Mobile ABPU. We define Mobile ABPU as our total bookings in a given period, divided by the number of days in that period, divided by, the average Mobile DAUs during the period. We believe that Mobile ABPU provides useful information to investors and others in understanding and evaluating our results in the same manner as management. We use Mobile ABPU as a measure of overall monetization across all of our players through the sale of virtual items and advertising.
Our business model around our social games is designed so that, as more players play our games, social interactions increase and the more valuable our games and our business become. All engaged players of our games help drive our bookings and, consequently, both online game revenue and advertising revenue. Virtual items are purchased by players who are socializing with, competing against or collaborating with other players, most of whom do not buy virtual items. Accordingly, we primarily focus on Mobile DAUs, Mobile MAUs and Mobile ABPU, which we believe collectively best reflect key audience metrics.
10
Non-GAAP Financial Measures
We have provided in this letter certain non-GAAP financial measures to supplement our consolidated financial statements prepared in accordance with U.S. GAAP (our “GAAP financial statements”). Management uses non-GAAP financial measures internally in analyzing our financial results to assess operational performance and liquidity. Our non-GAAP financial measures may be different from non-GAAP financial measures used by other companies.
The presentation of our non-GAAP financial measures is not intended to be considered in isolation or as a substitute for, or superior to, our GAAP financial statements. We believe that both management and investors benefit from referring to our non-GAAP financial measures in assessing our performance and when planning, forecasting and analyzing future periods. We believe our non-GAAP financial measures are useful to investors because they allow for greater transparency with respect to key financial measures we use in making operating decisions and because our investors and analysts use them to help assess the health of our business.
We have provided reconciliations of our non-GAAP financial measures used in this letter to the most directly comparable GAAP financial measures in the following tables. Because of the following limitations of our non-GAAP financial measures, you should consider the non-GAAP financial measures presented in this letter with our GAAP financial statements.
Key limitations of our non-GAAP financial measures include:
| • | Bookings does not reflect that we defer and recognize online game revenue and revenue from certain advertising transactions over the estimated average playing period of payers for durable virtual items or as consumed for consumable virtual items; |
| • | Adjusted EBITDA does not include the impact of stock-based expense, acquisition-related transaction expenses, contingent consideration fair value adjustments, legal settlements and related legal expense, and restructuring expense; |
| • | Adjusted EBITDA does not reflect provisions for or benefits from income taxes and does not include other income (expense) net, which includes foreign exchange gains and losses, and interest income; and |
| • | Adjusted EBITDA excludes depreciation and amortization of tangible and intangible assets. Although depreciation and amortization are non-cash charges, the assets being depreciated and amortized may have to be replaced in the future. |
11
ZYNGA INC.
CONSOLIDATED BALANCE SHEETS
(In thousands, unaudited)
| | June 30, | | | December 31, | |
| | 2019 | | | 2018 | |
Assets | | | | | | | | |
Current assets: | | | | | | | | |
Cash and cash equivalents | | $ | 691,343 | | | $ | 544,990 | |
Short-term investments | | | 137,265 | | | | 36,232 | |
Accounts receivable, net of allowance of $0 at June 30, 2019 and December 31, 2018 | | | 144,935 | | | | 91,630 | |
Restricted cash | | | 25,006 | | | | 35,006 | |
Prepaid expenses | | | 24,054 | | | | 26,914 | |
Assets held for sale | | | 310,902 | | | | — | |
Other current assets | | | 9,992 | | | | 12,505 | |
Total current assets | | | 1,343,497 | | | | 747,277 | |
Long-term investments | | | 2,004 | | | | — | |
Goodwill | | | 1,460,896 | | | | 934,187 | |
Intangible assets, net | | | 269,923 | | | | 118,600 | |
Property and equipment, net | | | 18,043 | | | | 266,557 | |
Right-of-use assets | | | 17,249 | | | | — | |
Restricted cash | | | 30,000 | | | | — | |
Prepaid expenses | | | 28,928 | | | | 30,774 | |
Other non-current assets | | | 13,712 | | | | 49,308 | |
Total assets | | $ | 3,184,252 | | | $ | 2,146,703 | |
Liabilities and stockholders’ equity | | | | | | | | |
Current liabilities: | | | | | | | | |
Accounts payable | | $ | 21,909 | | | $ | 26,811 | |
Income tax payable | | | 11,155 | | | | 4,895 | |
Deferred revenue | | | 356,932 | | | | 191,299 | |
Debt | | | — | | | | 100,000 | |
Operating lease liabilities | | | 9,042 | | | | — | |
Liabilities related to assets held for sale | | | 46,279 | | | | — | |
Other current liabilities | | | 229,882 | | | | 156,829 | |
Total current liabilities | | | 675,199 | | | | 479,834 | |
Convertible senior notes, net | | | 558,394 | | | | — | |
Deferred revenue | | | 944 | | | | 1,586 | |
Deferred tax liabilities, net | | | 21,635 | | | | 16,087 | |
Non-current operating lease liabilities | | | 17,917 | | | | — | |
Other non-current liabilities | | | 187,212 | | | | 52,586 | |
Total liabilities | | | 1,461,301 | | | | 550,093 | |
Stockholders’ equity: | | | | | | | | |
Common stock and additional paid-in capital | | | 3,846,919 | | | | 3,504,713 | |
Accumulated other comprehensive income (loss) | | | (122,026 | ) | | | (118,439 | ) |
Accumulated deficit | | | (2,001,942 | ) | | | (1,789,664 | ) |
Total stockholders’ equity | | | 1,722,951 | | | | 1,596,610 | |
Total liabilities and stockholders’ equity | | $ | 3,184,252 | | | $ | 2,146,703 | |
12
ZYNGA INC.
CONSOLIDATED STATEMENTS OF OPERATIONS
(In thousands, except per share data, unaudited)
| | Three Months Ended | | | Six Months Ended | |
| | June 30, 2019 | | | March 31, 2019 | | | June 30, 2018 | | | June 30, 2019 | | | June 30, 2018 | |
Revenue: | | | | | | | | | | | | | | | | | | | | |
Online game | | $ | 240,708 | | | $ | 200,164 | | | $ | 164,680 | | | $ | 440,872 | | | $ | 326,233 | |
Advertising and other | | | 65,792 | | | | 65,239 | | | | 52,365 | | | | 131,031 | | | | 99,044 | |
Total revenue | | | 306,500 | | | | 265,403 | | | | 217,045 | | | | 571,903 | | | | 425,277 | |
Costs and expenses: | | | | | | | | | | | | | | | | | | | | |
Cost of revenue | | | 126,872 | | | | 121,643 | | | | 74,182 | | | | 248,515 | | | | 143,224 | |
Research and development | | | 102,094 | | | | 161,880 | | | | 67,391 | | | | 263,974 | | | | 128,216 | |
Sales and marketing | | | 113,529 | | | | 102,011 | | | | 52,878 | | | | 215,540 | | | | 103,733 | |
General and administrative | | | 25,239 | | | | 21,504 | | | | 25,580 | | | | 46,743 | | | | 48,833 | |
Total costs and expenses | | | 367,734 | | | | 407,038 | | | | 220,031 | | | | 774,772 | | | | 424,006 | |
Income (loss) from operations | | | (61,234 | ) | | | (141,635 | ) | | | (2,986 | ) | | | (202,869 | ) | | | 1,271 | |
Interest income | | | 889 | | | | 443 | | | | 1,800 | | | | 1,332 | | | | 3,610 | |
Interest expense | | | (2,167 | ) | | | (1,263 | ) | | | (9 | ) | | | (3,430 | ) | | | (14 | ) |
Other income (expense), net | | | 3,877 | | | | 3,375 | | | | 2,614 | | | | 7,252 | | | | 6,020 | |
Income (loss) before income taxes | | | (58,635 | ) | | | (139,080 | ) | | | 1,419 | | | | (197,715 | ) | | | 10,887 | |
Provision for (benefit from) income taxes | | | (2,805 | ) | | | (10,252 | ) | | | 2,330 | | | | (13,057 | ) | | | 6,189 | |
Net income (loss) | | $ | (55,830 | ) | | $ | (128,828 | ) | | $ | (911 | ) | | $ | (184,658 | ) | | $ | 4,698 | |
| | | | | | | | | | | | | | | | | | | | |
Net income (loss) per share attributable to common stockholders: | | | | | | | | | | | | | | | | | | | | |
Basic | | $ | (0.06 | ) | | $ | (0.14 | ) | | $ | (0.00 | ) | | $ | (0.20 | ) | | $ | 0.01 | |
Diluted | | $ | (0.06 | ) | | $ | (0.14 | ) | | $ | (0.00 | ) | | $ | (0.20 | ) | | $ | 0.01 | |
| | | | | | | | | | | | | | | | | | | | |
Weighted-average common shares used to compute net income (loss) per share attributable to common stockholders: | | | | | | | | | | | | | | | | | | | | |
Basic | | | 937,334 | | | | 926,230 | | | | 858,666 | | | | 931,813 | | | | 864,117 | |
Diluted | | | 937,334 | | | | 926,230 | | | | 858,666 | | | | 931,813 | | | | 890,285 | |
| | | | | | | | | | | | | | | | | | | | |
Stock-based compensation expense included in the above line items: | | | | | | | | | | | | | | | | | | | | |
Cost of revenue | | $ | 397 | | | $ | 284 | | | $ | 564 | | | $ | 681 | | | $ | 995 | |
Research and development | | | 12,238 | | | | 11,715 | | | | 10,363 | | | | 23,953 | | | | 18,988 | |
Sales and marketing | | | 2,920 | | | | 2,487 | | | | 2,214 | | | | 5,407 | | | | 4,050 | |
General and administrative | | | 5,800 | | | | 4,287 | | | | 4,228 | | | | 10,087 | | | | 7,449 | |
Total stock-based compensation expense | | $ | 21,355 | | | $ | 18,773 | | | $ | 17,369 | | | $ | 40,128 | | | $ | 31,482 | |
13
ZYNGA INC.
CONSOLIDATED STATEMENTS OF CASH FLOWS
(In thousands, unaudited)
| | Three Months Ended | | | Six Months Ended | |
| | June 30, 2019 | | | March 31, 2019 | | | June 30, 2018 | | | June 30, 2019 | | | June 30, 2018 | |
Cash flows from operating activities: | | | | | | | | | | | | | | | | | | | | |
Net income (loss) | | $ | (55,830 | ) | | $ | (128,828 | ) | | $ | (911 | ) | | $ | (184,658 | ) | | $ | 4,698 | |
Adjustments to reconcile net income (loss) to net cash provided by (used in) operating activities: | | | | | | | | | | | | | | | | | | | | |
Depreciation and amortization | | | 19,669 | | | | 21,080 | | | | 9,178 | | | | 40,749 | | | | 16,909 | |
Stock-based compensation expense | | | 21,355 | | | | 18,773 | | | | 17,369 | | | | 40,128 | | | | 31,482 | |
(Gain) loss from foreign currency, sales of investments, assets and other, net | | | (539 | ) | | | 154 | | | | (460 | ) | | | (385 | ) | | | 1,491 | |
(Accretion) and amortization on marketable debt securities, net | | | (232 | ) | | | (153 | ) | | | (751 | ) | | | (385 | ) | | | (1,300 | ) |
Noncash lease expense | | | 1,712 | | | | 1,449 | | | | — | | | | 3,161 | | | | — | |
Noncash interest expense | | | 1,008 | | | | — | | | | — | | | | 1,008 | | | | — | |
Change in deferred income taxes and other | | | (13,657 | ) | | | (20,374 | ) | | | (49 | ) | | | (34,031 | ) | | | 1,273 | |
Changes in operating assets and liabilities: | | | | | | | | | | | | | | | | | | | | |
Accounts receivable, net | | | 3,491 | | | | (30,001 | ) | | | 3,327 | | | | (26,510 | ) | | | 14,009 | |
Prepaid expenses and other assets | | | 3,842 | | | | 3,318 | | | | (2,437 | ) | | | 7,160 | | | | (7,223 | ) |
Accounts payable | | | 7,005 | | | | (14,293 | ) | | | (6,687 | ) | | | (7,288 | ) | | | (16,261 | ) |
Deferred revenue | | | 69,515 | | | | 86,474 | | | | 16,893 | | | | 155,989 | | | | 28,126 | |
Income tax payable | | | 5,421 | | | | (5,361 | ) | | | (32 | ) | | | 60 | | | | (5,042 | ) |
Operating lease and other liabilities | | | 35,857 | | | | 69,309 | | | | 5,699 | | | | 105,166 | | | | (30,974 | ) |
Net cash provided by (used in) operating activities | | | 98,617 | | | | 1,547 | | | | 41,139 | | | | 100,164 | | | | 37,188 | |
Cash flows from investing activities: | | | | | | | | | | | | | | | | | | | | |
Purchases of investments | | | (94,335 | ) | | | (29,756 | ) | | | (59,267 | ) | | | (124,091 | ) | | | (184,089 | ) |
Maturities of investments | | | 8,000 | | | | 8,500 | | | | 142,000 | | | | 16,500 | | | | 302,000 | |
Sales of investments | | | — | | | | 4,987 | | | | 9,999 | | | | 4,987 | | | | 9,999 | |
Acquisition of property and equipment | | | (4,900 | ) | | | (5,058 | ) | | | (2,255 | ) | | | (9,958 | ) | | | (3,679 | ) |
Proceeds from sale of property and equipment | | | 44 | | | | 46 | | | | 3 | | | | 90 | | | | 28 | |
Business acquisitions, net of cash acquired and restricted cash held in escrow | | | — | | | | (299,357 | ) | | | (222,075 | ) | | | (299,357 | ) | | | (222,075 | ) |
Release of restricted cash escrow from business combinations | | | (10,000 | ) | | | — | | | | — | | | | (10,000 | ) | | | (22,800 | ) |
Other investing activities, net | | | — | | | | — | | | | 97 | | | | — | | | | 97 | |
Net cash provided by (used in) investing activities | | | (101,191 | ) | | | (320,638 | ) | | | (131,498 | ) | | | (421,829 | ) | | | (120,519 | ) |
Cash flows from financing activities: | | | | | | | | | | | | | | | | | | | | |
Proceeds from issuance of debt, net | | | 672,682 | | | | — | | | | — | | | | 672,682 | | | | — | |
Purchase of capped calls | | | (73,830 | ) | | | — | | | | — | | | | (73,830 | ) | | | — | |
Taxes paid related to net share settlement of stockholders' equity awards | | | (16,610 | ) | | | (11,010 | ) | | | (7,609 | ) | | | (27,620 | ) | | | (13,972 | ) |
Repurchases of common stock | | | — | | | | — | | | | (25,874 | ) | | | — | | | | (65,418 | ) |
Proceeds from issuance of common stock | | | 2,092 | | | | 4,939 | | | | 844 | | | | 7,030 | | | | 4,158 | |
Repayment of debt | | | (100,000 | ) | | | (1,364 | ) | | | — | | | | (101,364 | ) | | | �� | |
Other financing activities, net | | | (1) | | | | (326 | ) | | | — | | | | (326 | ) | | | — | |
Net cash provided by (used in) financing activities | | | 484,333 | | | | (7,761 | ) | | | (32,639 | ) | | | 476,572 | | | | (75,232 | ) |
| | | | | | | | | | | | | | | | | | | | |
Effect of exchange rate changes on cash, cash equivalents and restricted cash | | | (159 | ) | | | 11,605 | | | | (3,407 | ) | | | 11,446 | | | | (1,931 | ) |
| | | | | | | | | | | | | | | | | | | | |
Net change in cash, cash equivalents and restricted cash | | | 481,600 | | | | (315,247 | ) | | | (126,405 | ) | | | 166,353 | | | | (160,494 | ) |
Cash, cash equivalents and restricted cash, beginning of period | | | 264,749 | | | | 579,996 | | | | 371,588 | | | | 579,996 | | | | 405,677 | |
Cash, cash equivalents and restricted cash, end of period | | $ | 746,349 | | | $ | 264,749 | | | $ | 245,183 | | | $ | 746,349 | | | $ | 245,183 | |
14
ZYNGA INC.
RECONCILIATION OF GAAP TO NON-GAAP RESULTS
(In thousands, unaudited)
| | Three Months Ended | | | Six Months Ended | |
| | June 30, 2019 | | | March 31, 2019 | | | June 30, 2018 | | | June 30, 2019 | | | June 30, 2018 | |
Reconciliation of Revenue to Bookings: Total | | | | | | | | | | | | | | | | | | | | |
Revenue | | $ | 306,500 | | | $ | 265,403 | | | $ | 217,045 | | | $ | 571,903 | | | $ | 425,277 | |
Change in deferred revenue | | | 69,873 | | | | 94,082 | | | | 16,884 | | | | 163,955 | | | | 28,124 | |
Bookings: Total | | $ | 376,373 | | | $ | 359,485 | | | $ | 233,929 | | | $ | 735,858 | | | $ | 453,401 | |
| | | | | | | | | | | | | | | | | | | | |
Reconciliation of Revenue to Bookings: Mobile | | | | | | | | | | | | | | | | | | | | |
Revenue | | $ | 287,442 | | | $ | 246,093 | | | $ | 192,744 | | | $ | 533,535 | | | $ | 375,345 | |
Change in deferred revenue | | | 70,855 | | | | 95,305 | | | | 18,858 | | | | 166,160 | | | | 29,680 | |
Bookings: Mobile | | $ | 358,297 | | | $ | 341,398 | | | $ | 211,602 | | | $ | 699,695 | | | $ | 405,025 | |
| | | | | | | | | | | | | | | | | | | | |
Reconciliation of Revenue to Bookings: Advertising | | | | | | | | | | | | | | | | | | | | |
Revenue | | $ | 65,649 | | | $ | 65,195 | | | $ | 52,246 | | | $ | 130,844 | | | $ | 97,071 | |
Change in deferred revenue | | | 383 | | | | (266 | ) | | | 792 | | | | 117 | | | | 1,088 | |
Bookings: Advertising | | $ | 66,032 | | | $ | 64,929 | | | $ | 53,038 | | | $ | 130,961 | | | $ | 98,159 | |
| | | | | | | | | | | | | | | | | | | | |
Reconciliation of Net Income (Loss) to Adjusted EBITDA | | | | | | | | | | | | | | | | | | | | |
Net income (loss) | | $ | (55,830 | ) | | $ | (128,828 | ) | | $ | (911 | ) | | $ | (184,658 | ) | | $ | 4,698 | |
(Benefit from) provision for income taxes | | | (2,805 | ) | | | (10,252 | ) | | | 2,330 | | | | (13,057 | ) | | | 6,189 | |
Other income, net | | | (3,877 | ) | | | (3,374 | ) | | | (2,614 | ) | | | (7,252 | ) | | | (6,020 | ) |
Interest income | | | (889 | ) | | | (443 | ) | | | (1,800 | ) | | | (1,332 | ) | | | (3,610 | ) |
Interest expense | | | 2,167 | | | | 1,262 | | | | 9 | | | | 3,430 | | | | 14 | |
Restructuring expense, net | | | — | | | | — | | | | 400 | | | | — | | | | 871 | |
Depreciation and amortization | | | 19,669 | | | | 21,080 | | | | 9,178 | | | | 40,749 | | | | 16,909 | |
Acquisition-related transaction expenses | | | 232 | | | | 7,356 | | | | 1,283 | | | | 7,588 | | | | 1,283 | |
Contingent consideration fair value adjustment | | | 23,900 | | | | 85,500 | | | | 1,500 | | | | 109,400 | | | | 1,500 | |
(Gain) loss on legal settlements and related legal expense | | | (1,037 | ) | | | (9,627 | ) | | | — | | | | (10,664 | ) | | | — | |
Stock-based compensation expense | | | 21,355 | | | | 18,773 | | | | 17,369 | | | | 40,128 | | | | 31,482 | |
Adjusted EBITDA | | $ | 2,885 | | | $ | (18,553 | ) | | $ | 26,744 | | | $ | (15,668 | ) | | $ | 53,316 | |
| | | | | | | | | | | | | | | | | | | | |
Reconciliation of GAAP Operating Expense to Non-GAAP Operating Expense | | | | | | | | | | | | | | | | | | | | |
GAAP operating expense | | $ | 240,862 | | | $ | 285,395 | | | $ | 145,849 | | | $ | 526,257 | | | $ | 280,782 | |
Restructuring expense, net | | | — | | | | — | | | | (400 | ) | | | — | | | | (844 | ) |
Amortization of intangible assets from acquisition | | | — | | | | (291 | ) | | | (467 | ) | | | (291 | ) | | | (1,001 | ) |
Acquisition-related transaction expenses | | | (232 | ) | | | (7,356 | ) | | | (1,283 | ) | | | (7,588 | ) | | | (1,283 | ) |
Contingent consideration fair value adjustment | | | (23,900 | ) | | | (85,500 | ) | | | (1,500 | ) | | | (109,400 | ) | | | (1,500 | ) |
Gain (loss) on legal settlements and related legal expense | | | 1,037 | | | | 9,627 | | | | — | | | | 10,664 | | | | — | |
Stock-based compensation expense | | | (20,958 | ) | | | (18,489 | ) | | | (16,805 | ) | | | (39,447 | ) | | | (30,487 | ) |
Non-GAAP operating expense | | $ | 196,809 | | | $ | 183,386 | | | $ | 125,394 | | | $ | 380,195 | | | $ | 245,667 | |
| | | | | | | | | | | | | | | | | | | | |
Reconciliation of Cash Provided by Operating Activities to Free Cash Flow | | | | | | | | | | | | | | | | | | | | |
Net cash provided by (used in) operating activities | | $ | 98,617 | | | $ | 1,547 | | | $ | 41,139 | | | $ | 100,164 | | | $ | 37,188 | |
Acquisition of property and equipment | | | (4,900 | ) | | | (5,058 | ) | | | (2,255 | ) | | | (9,958 | ) | | | (3,679 | ) |
Free cash flow | | $ | 93,717 | | | $ | (3,511 | ) | | $ | 38,884 | | | $ | 90,206 | | | $ | 33,509 | |
15
ZYNGA INC.
RECONCILIATION OF GAAP TO NON-GAAP THIRD QUARTER 2019 GUIDANCE
(In thousands, except per share data, unaudited)
| | Third Quarter 2019 Guidance | | | Third Quarter 2018 Actual | | | Variance | |
Reconciliation of Revenue to Bookings | | | | | | | | | | | | |
Revenue | $ | | 325,000 | | $ | | 233,243 | | $ | | 91,757 | |
Change in deferred revenue | | | 55,000 | | | | 15,632 | | | | 39,368 | |
Bookings | $ | | 380,000 | | $ | | 248,875 | | $ | | 131,125 | |
| | | | | | | | | | | | |
Reconciliation of Net (Loss) Income to Adjusted EBITDA | | | | | | | | | | | | |
Net (loss) income | $ | | 250,000 | | $ | | 10,200 | | $ | | 239,800 | |
(Benefit from) provision for income taxes | | | 5,000 | | | | 5 | | | | 4,995 | |
Other income, net | | | — | | | | (4,147) | | | | 4,147 | |
Interest income | | | (6,000) | | | | (1,421) | | | | (4,579) | |
Interest expense | | | 7,000 | | | | 133 | | | | 6,867 | |
Restructuring expense | | | — | | | | 124 | | | | (124) | |
Depreciation and amortization | | | 19,000 | | | | 12,454 | | | | 6,546 | |
Acquisition-related transaction expenses | | | — | | | | 426 | | | | (426) | |
Contingent consideration fair value adjustment | | | 15,000 | | | | 1,500 | | | | 13,500 | |
Gain on sale of building, net of transfer tax | | | (305,000) | | | | — | | | | (305,000) | |
Stock-based compensation expense | | | 22,000 | | | | 18,754 | | | | 3,246 | |
Adjusted EBITDA | $ | | 7,000 | | $ | | 38,028 | | $ | | (31,028) | |
| | | | | | | | | | | | |
GAAP diluted shares | | | 970,000 | | | | 887,228 | | | | 82,772 | |
Diluted net loss per share | $ | | 0.26 | | $ | | 0.01 | | $ | | 0.25 | |
ZYNGA INC.
RECONCILIATION OF GAAP TO NON-GAAP RAISED FISCAL YEAR 2019 GUIDANCE
(In thousands, unaudited)
| | Revised Fiscal Year 2019 Guidance | | | Fiscal Year 2018 Actual | | | Variance | |
Reconciliation of Revenue to Bookings | | | | | | | | | | | | |
Revenue | $ | | 1,240,000 | | $ | | 907,208 | | $ | | 332,792 | |
Change in deferred revenue | | | 260,000 | | | | 62,334 | | | | 197,666 | |
Bookings | $ | | 1,500,000 | | $ | | 969,542 | | $ | | 530,458 | |
16