Exhibit 99.1

Dear Shareholders,
We look forward to discussing our Q3 2019 results during today’s earnings call at 2:30 p.m. PT. Our quarterly earnings letter below details our Q3 performance, as well as our outlook for Q4, fiscal 2019 and growth opportunities for 2020 and beyond. Please note that we manage our business based on topline measures including revenue, which is comprised of the change in deferred revenue and bookings. Revenue and the change in deferred revenue are both directly affected by bookings results, and management utilizes bookings as a primary topline measure to help inform its decisions.
Executive Summary
In Q3, we achieved our highest quarterly revenue and bookings in Zynga history, with mobile revenue up 54% year-over-year and mobile bookings up 64% year-over-year. Our performance in the quarter was driven by strong momentum across our live services as well as initial contributions from our recently launched titles.
Our innovative bold beat strategy is working across our live services. In particular, Words With Friends, Zynga Poker and CSR2 were strong contributors in the quarter while Empires & Puzzles and Merge Dragons! grew to new quarterly revenue and bookings highs. Live services are driving the vast majority of our total revenue and bookings and are the foundation of our growth strategy.
Our new product pipeline is starting to gain momentum with the successful launch of another new title – Merge Magic!, which is off to a great start. This comes on the heels of the recently launched Game of Thrones® Slots Casino which has become our fastest growing Slots title in its first full quarter post-launch. We expect these titles to become meaningful contributors to our live services foundation.
Building on our strong performance to date, we are raising our full year 2019 guidance to $1.28 billion in revenue, up 41% year-over-year and an increase of $42 million versus our prior guidance. We are also raising our bookings guidance to $1.55 billion, up 59% year-over-year and an increase of $46 million versus our prior guidance.
Our raised guidance puts us on track to deliver our best annual revenue and bookings in Zynga history. We continue to be one of the fastest growing public gaming companies in 2019. We intend to build on this momentum in 2020 where we expect low double-digit organic revenue and bookings growth.
Q3 Highlights
| • | Highest quarterly revenue and bookings performances in Zynga history. |
| • | Revenue of $345 million, up 48% year-over-year, and bookings of $395 million, up 59% year-over-year. |
| • | Mobile revenue of $328 million, up 54% year-over-year. Mobile bookings of $378 million, up 64% year-over-year. |
| • | Record mobile online game – or mobile user pay – revenue of $266 million, up 78% year-over-year, and mobile user pay bookings of $316 million, up 90% year-over-year. |
| • | Empires & Puzzles and Merge Dragons! both achieved record revenue and bookings quarters. |
| • | Game of Thrones® Slots Casino became our fastest growing Slots title in its first full quarter post-launch. |
| • | Merge Magic! is off to a great start with positive player feedback and strong engagement and monetization metrics. |
| • | International revenue and bookings grew 67% and 89% year-over-year, respectively, and now represent 38% of total revenue and 41% of total bookings versus 34% of total revenue and bookings in the prior year period. |
| • | Gram Games and Small Giant Games continue to perform ahead of our expectations, resulting in an increase in contingent consideration expense of $61 million in the quarter. |
| • | Net income of $230 million, including a one-time gain related to the sale of our San Francisco building. |
| • | Operating cash flow of $69 million, up 67% year-over-year. Cash and investments of approximately $1.45 billion as of September 30, 2019. |
1
Financials
In Q3, we delivered record revenue of $345 million, above our guidance by $20 million and up $112 million or 48% year-over-year as a result of strong bookings growth offset by a significant increase in deferred revenue. Bookings also reached a new high of $395 million, beating our guidance by $15 million and up $146 million or 59% year-over-year. Our better than expected topline results were driven primarily by outstanding performances from Empires & Puzzles and Merge Dragons! as well as an initial contribution from Merge Magic!.
We also achieved record mobile revenue and bookings in the quarter with mobile revenue up 54% year-over-year and mobile bookings up 64% year-over-year. Mobile represented 95% of total revenue versus 91% a year ago and 96% of total bookings versus 92% in Q3 2018.
Our net increase in deferred revenue was $50 million versus our guidance of a net increase of $55 million and a net increase of $16 million in the prior year quarter. The primary drivers of the net increase in deferred revenue were bookings from Empires & Puzzles and Merge Dragons!.
While the release of this GAAP deferral will have a positive impact on revenue and profitability in future periods, it represented a $50 million reduction in revenue, net income and Adjusted EBITDA in Q3. On a year-over-year basis, the difference in the change in deferred revenue represented a $34 million decrease in the year-over-year change in revenue, net income and Adjusted EBITDA.
We ended Q3 with a deferred revenue balance of $403 million versus $174 million a year ago.
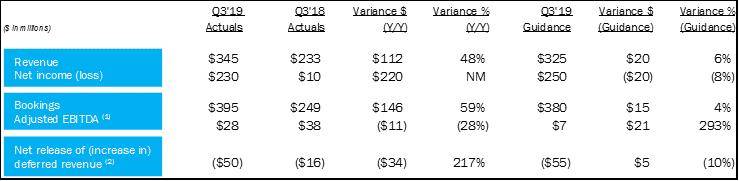
($ in millions) q3’19 actuals q3’18 actuals variance $ (y/y) variance % (y/y) q3’19 guidance variance $ (guidance) variance % (guidance) revenue $345 $233 $112 48% $325 $20 6% Net income (loss) $230 $10 $220 NM $250 ($20) (8%) Bookings $395 $249 $146 59% $380 $15 4% Adjusted EBITDA(1) $28 $38 ($11) (28%) $7 $21 293% Net release of (increase in) deferred revenue(2) ($50) ($16) ($34) 217% ($55) $5 (10%)
Note: Certain measures as presented differ due to the impact of rounding.
(1) | Adjusted EBITDA includes the net release of (increase in) deferred revenue. |
(2) | For clarity, a net release of deferred revenue results in revenue being higher than bookings and is a positive impact to Adjusted EBITDA as reported; a net increase in deferred revenue results in revenue being lower than bookings and is a negative impact to Adjusted EBITDA as reported. |
GAAP operating expenses rose to 83% of revenue from 64% of revenue in Q3 2018, due primarily to the material year-over-year increase in deferred revenue and contingent consideration. On a non-GAAP basis, operating expenses represented 52% of bookings, in line with the prior year period.
Empires & Puzzles and Merge Dragons! continue to perform ahead of our expectations and were the primary drivers of the $61 million increase in contingent consideration expense in the quarter versus our guidance of $15 million.
Our strong operating performance, in addition to the $314 million one-time gain related to the sale of our San Francisco building, enabled us to deliver our highest quarterly net income of $230 million. This was $20 million lower than guidance primarily due to the material increase in contingent consideration, which more than offset our better than expected operating performance in the quarter.
Adjusted EBITDA in the quarter was $28 million, above our guidance by $21 million and a decrease of $11 million year-over-year. Additionally, we generated operating cash flow of $69 million, up 67% year-over-year, bringing our cash and investments to approximately $1.45 billion as of September 30, 2019.
2
Product
We are focused on driving strong, recurring growth across our live services through the steady release of innovative bold beats – new content and game play modes designed to engage and attract current, lapsed and new audiences.
CSR2 performed well in Q3. We began the quarter by unveiling the Pagani Huayra Roadster BC in-game, marking the first time an auto manufacturer showcased a car in a mobile game. We also released a new Fast & Furious: Hobbs & Shaw event in partnership with Universal Brand Development. In Q4, we will continue to beta test a new player-versus-player feature called Showdown in addition to featuring Bugatti’s 110th Anniversary event series, which will give players the chance to race, compete and collect Bugatti-engineered cars, some of which will be exclusively available in CSR2.
Empires & Puzzles again delivered its best revenue and bookings quarter driven by our updated Challenge Events feature and the introduction of a new set of exciting Knights of Avalon heroes. We also remain pleased with early player engagement in South Korea and Japan and expect to invest additional marketing in these countries over the coming quarters. In Q4, we are excited to release a new feature, Hero Costumes, which will give players the ability to enhance their favorite heroes with new looks, skills and powers.
Merge Dragons! achieved another record revenue and bookings quarter with revenue up 817% year-over-year and bookings up 281% year-over-year. In Q3, players enjoyed a steady cadence of themed events with opportunities to earn unique items and special dragons. In addition, our new Dragon Dens social feature was well-received by players as it introduced the ability to chat in-game for the first time. Over the coming quarters, we will continue to enhance the Dens feature and launch more seasonal events.
Words With Friends celebrated its 10th anniversary in the quarter with special events and exclusive Tile Styles rewards. We continue to see strong player engagement – as measured by moves per daily active user – as well as steady year-over-year growth in in-app purchases. As we expected, we faced tougher year-over-year advertising comparisons beginning in Q3. Words With Friends’ total mobile revenue was up 6% year-over-year and total mobile bookings were down 1% year-over-year. Looking forward, we will continue to enhance in-game features including Daily Puzzles and Achievements.
Zynga Poker mobile revenue and bookings grew sequentially in Q3. In the quarter, we made a series of live operations improvements and players continued to amplify their daily game play with Boosts. We also introduced a new branded partnership with WWE® for themed events. Looking ahead, we’re focused on introducing new features to provide players with more ways to compete and celebrate progression within the game.
Our Social Slots portfolio delivered mobile revenue up 6% year-over-year and mobile bookings up 23% year-over-year. Game of Thrones® Slots Casino became our fastest growing Slots title in its first full quarter post-launch. This performance was driven by strong engagement and monetization as players enjoyed social features within the game in addition to the introduction of Collections. In Q3, Hit It Rich! Slots continued to deliver impressive year-over-year mobile revenue and bookings growth, while Wizard of Oz Slots also remained a solid contributor.
Merge Magic! launched worldwide on September 18. The title is off to a great start with positive player feedback and strong engagement and monetization metrics. We’re particularly excited to see players interact with our innovative merge mechanic in a new whimsical, magical environment. We expect the game to steadily scale over the coming quarters.
Puzzle Combat and FarmVille 3 are continuing to make progress in soft launch. We are rigorously testing these games for long-term engagement with the goal of creating new forever franchises to add to our live services portfolio. Potential worldwide release timing for these titles will be determined based on key performance indicators and player feedback gathered in soft launch.
3
Advertising
We delivered Q3 advertising revenue and bookings of $64 million, down 3% year-over-year. As expected, we encountered tougher year-over-year advertising comparisons in the quarter as we lapped the first full quarter of contribution from Gram Games and prior advertising network optimizations.
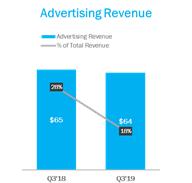
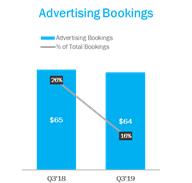
Advertising Revenue Advertising Revenue % of Total Revenue 28% $65 $64 18% Advertising Bookings Advertising Bookings % of total bookings 26% $65 $64 16% q3’18 q3’19 q3’18 q3’19
We continue to expect advertising growth in the low double-digits in fiscal 2019 and anticipate advertising as a percentage of total revenue and bookings to decline relative to our historical levels driven by a higher user pay mix. We remain focused on expanding our advertising inventory within our live services portfolio and via new game launches, in addition to optimizing our yields through advertising network partnerships.
Player Metrics
In Q3, our average mobile daily active users (DAUs) were down 1% year-over-year as the addition of Empires & Puzzles and audience growth in Merge Dragons! were offset by decreases in older mobile and chat games, as well as in Zynga Poker and Words With Friends. Our average mobile monthly active users (MAUs) declined by 13% year-over-year for reasons similar to mobile DAUs, with a greater impact from our decision to sunset certain chat games.
Our average mobile daily bookings per average mobile DAU (ABPU) grew 67% year-over-year and reached its highest level since 2012. This increase was primarily driven by the addition of Empires & Puzzles, growth in Merge Dragons! and an initial contribution from Game of Thrones® Slots Casino.
We continue to expect player metrics to fluctuate in the near term primarily driven by declines in older mobile titles and our decision to sunset certain chat games. These headwinds may be offset by growth in our core live services titles or from new titles as they scale. We remain pleased with the engagement and monetization we are seeing collectively across our core mobile live services.
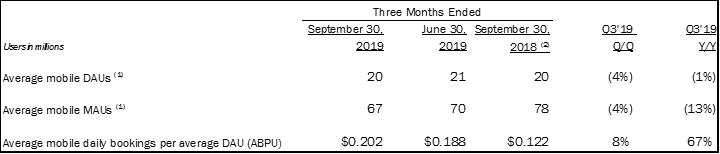
Three months ended users in millions September 30, 2019 june 30, 2019 September 30, 2018(2) q3’19 q/q q3’19 y/y average mobile daus(1) 20 21 20 (4%) (1%) average mobile maus(1) 67 70 78 (4%) (13%) average mobile daily bookings per average dau (abpu) $0.202 $0.188 $0.122 8% 67%
| (1) | We do not have third party network login data to link an individual who has played under multiple user accounts and accordingly, actual Mobile DAU and Mobile MAU may be lower than reported due to the potential duplication of these individuals. Specifically, Mobile DAUs and Mobile MAUs incrementally include Merge Magic! and the games acquired from Gram Games in May 2018 and Small Giant Games in January 2019. |
| (2) | In the first quarter of 2019, we updated our methodologies and approaches for identifying automated attempts to replicate legitimate player activity. Amounts reported for the three months ended September 30, 2018 have not been adjusted to reflect any subsequent updates to the reporting and estimation methodologies due to the potential variability in player behavior and other factors that can influence the various data sets. Assuming consistency in the player data profiles across periods, we estimate that the impact of new methodologies on the amounts previously reported during 2018 may reduce our average Mobile DAUs and average Mobile MAUs by approximately 5-10%. As a result, these audience metrics may not be comparable to prior periods. |
4
Q4 & Full Year 2019 Guidance
Q4 2019 Guidance
| • | Net increase in deferred revenue of $50 million |
| • | Bookings of $415 million |
| • | Adjusted EBITDA of $25 million |
In Q4, we expect $365 million in revenue, up $116 million or 47% year-over-year, with bookings of $415 million, up $148 million or 55% year-over-year. Our topline performance will be driven by our live services, where we expect sequential growth collectively across our five forever franchises, as well as by initial contributions from Merge Magic! and the continued ramp of Game of Thrones® Slots Casino. These gains will be partially offset by declines in older mobile and web titles. Our topline guidance does not assume the launch of additional new titles in Q4.
We anticipate our gross margins to be broadly in line with Q3. We expect a decrease in our operating expenses sequentially due to a lower accrual for contingent consideration. This is partially offset by increases in other operating expenses, in particular higher marketing investments on our recently launched titles and live services portfolio. However, should titles from our acquisitions continue to perform ahead of current expectations, we may see a further increase in the cumulative contingent consideration accrual.
Building on our strong performance to date, we are raising our full year 2019 guidance to $1.28 billion in revenue, up 41% year-over-year and an increase of $42 million versus our prior guidance. We expect a net increase in deferred revenue of $263 million, up 323% year-over-year and an increase of $3 million versus our prior guidance. We are also raising our bookings guidance to $1.55 billion, up 59% year-over-year and representing an increase of $46 million versus our prior guidance.
For the full year, we expect to deliver our best annual revenue and bookings in Zynga history. We are also on track to deliver results ahead of the profitability expectations that we outlined at the start of 2019, both on an absolute and margin percentage basis. This better than expected performance has been driven by the strong momentum in our live services and the phasing of new game launches. These factors more than offset the pressure on gross margins from a higher mix of user pay versus advertising as well as the incremental rent expense in the second half of the year.
2020 & Beyond
We are finishing the year with tremendous momentum. Looking toward 2020, we continue to expect low double-digit organic revenue and bookings growth on top of our raised full year 2019 guidance.
The vast majority of our topline growth in 2020 will be driven by our highly diversified live services portfolio, anchored by our five forever franchises – CSR Racing, Empires & Puzzles, Merge Dragons!, Words With Friends and Zynga Poker – in addition to full-year contributions from Game of Thrones Slots® Casino and Merge Magic!. Our innovative bold beat strategy is designed to deliver strong, recurring growth collectively across our live services year in and year out.
On top of our live services foundation, we have an exciting pipeline of new games in development including titles based on existing and new IPs such as FarmVille, CityVille and Puzzle Combat, as well as strategic licenses such as Harry PotterTM and Star WarsTM. We currently have two games in soft launch, Puzzle Combat and FarmVille 3. The level of contributions from new title launches in 2020 will depend on the timing of new releases and how the games scale.
We expect to improve our operating results in absolute terms in 2020. Operating leverage will ultimately be a function of our live services performance, the timing of additional new game launches and the level of marketing investment we choose to deploy to scale these titles. Over the next few years, we expect to continue to make meaningful progress toward achieving margins more in-line with our peers on a like-for-like basis.
In addition to organic growth, we have the potential to further scale the business through acquisitions that accelerate our current growth trajectory. We see opportunities to bring talented teams and franchises into the Zynga family that add to our live services, new game pipeline or investments in emerging markets and platforms.
5
Closing
It is an incredibly exciting time for Zynga. We are a leading mobile-first, free-to-play, live services company and are well positioned to capitalize on a rapidly evolving gaming landscape at a time when demand for interactive entertainment is reaching new highs. Mobile is the largest and fastest growing gaming platform in the world and is constantly evolving with new devices, technologies and distribution that will expand the overall accessibility of games and, therefore, Zynga’s total addressable market.
Our strong performance puts us on track to be one of the fastest growing public game companies this year. We expect to build upon this momentum into 2020 and are confident in our ability to further scale our business and generate more value for players and shareholders.
| |
Sincerely, | |

Frank Gibeau
Chief Executive Officer | 
Ger Griffin
Chief Financial Officer |
6
Forward-Looking Statements
This letter contains forward-looking statements, including those statements relating to our outlook for the full year and fourth quarter of 2019, including under the headings “Executive Summary,” “Q4 Guidance” and “2020 & Beyond” and statements relating to, among other things: our operational performance and strategy, including our focus on live services, growth projections relating to our forever franchises, contributions from Merge Magic! and Game of Thrones Slots Casino and investments in our new game pipeline generally, and confidence in our ability to grow our business in 2019 and 2020; our expectation to enter 2020 with approximately $1.5 billion in cash and investments and to use such capital to fund future acquisitions; our plans to enhance existing games with new features and updates, invest additional marketing in both South Korea and Japan for Empires & Puzzles, determine the worldwide release timing for Puzzle Combat and FarmVille 3 based on player feedback gathered in soft launch, launch new titles in 2020 and not launch any additional new titles in the fourth quarter of 2019; our expectation to steadily scale Merge Magic! over the coming quarters; our potential to further scale the business through acquisitions; our performance expectations regarding our older mobile and web titles; expected fluctuations in player metrics; and our ability to achieve and expectations related to financial projections, including revenue, deferred revenue, bookings, income, adjusted EBITDA, contingent consideration accruals, operating expenses, operating leverage, operating results, operating cash flow and margins.
Forward-looking statements often include words such as “outlook,” “projected,” “intend,” “will,” “anticipate,” “believe,” “target,” “expect,” “positioned,” and statements in the future tense are generally forward-looking. The achievement or success of the matters covered by such forward-looking statements involves significant risks, uncertainties, and assumptions. Our actual results could differ materially from those predicted or implied and reported results should not be considered as an indication of our future performance. Undue reliance should not be placed on such forward-looking statements, which are based on information available to us on the date hereof. We assume no obligation to update such statements. More information about factors that could affect our operating results are described in greater detail in our public filings with the Securities and Exchange Commission (the “SEC”), copies of which may be obtained by visiting our Investor Relations web site at http://investor.zynga.com or the SEC's website at www.sec.gov.
In addition, the preliminary financial results set forth in this letter are estimates based on information currently available to us. While we believe these estimates are meaningful, they could differ from the actual amounts that we ultimately report in our Quarterly Report on Form 10-Q for the quarter ended September 30, 2019. We assume no obligation and do not intend to update these estimates prior to filing our Quarterly Report on Form 10-Q.
7
Key Operating Metrics
We manage our business by tracking several operating metrics: “Mobile DAUs,” which measure daily active users of our mobile games, “Mobile MAUs,” which measure monthly active users of our mobile games, and “Mobile ABPU,” which measures our average daily mobile bookings per average Mobile DAU, each of which is recorded and estimated by our internal analytics systems. We determine these operating metrics by using internal company data based on tracking of user account activity. We also use information provided by third parties, including third party network logins provided by platform providers, to help us track whether a player logged in under two or more different user accounts is the same individual. We believe that the amounts are reasonable estimates of our user base for the applicable period of measurement and that the methodologies we employ and update from time-to-time are reasonably based on our efforts to identify trends in player behavior; however, factors relating to user activity and systems and our ability to identify and detect attempts to replicate legitimate player activity may impact these numbers.
Mobile DAUs. We define Mobile DAUs as the number of individuals who played one of our mobile games during a particular day. Under this metric, an individual who plays two different mobile games on the same day is counted as two DAUs. We use information provided by third parties to help us identify individuals who play the same game to reduce this duplication. However, because we do not always have the third party network login data to link an individual who has played under multiple user accounts, a player may be counted as multiple Mobile DAUs. Average Mobile DAUs for a particular period is the average of the Mobile DAUs for each day during that period. We use Mobile DAUs as a measure of audience engagement.
Mobile MAUs. We define Mobile MAUs as the number of individuals who played one of our mobile games in the 30-day period ending with the measurement date. Under this metric, an individual who plays two different mobile games in the same 30-day period is counted as two Mobile MAUs. We use information provided by third parties to help us identify individuals who play the same game to reduce this duplication. However, because we do not always have the third party network login data to link an individual who has played under multiple user accounts, a player may be counted as multiple Mobile MAUs. Average Mobile MAUs for a particular period is the average of the Mobile MAUs at each month-end during that period. We use Mobile MAUs as a measure of total game audience size.
Mobile ABPU. We define Mobile ABPU as our total bookings in a given period, divided by the number of days in that period, divided by, the average Mobile DAUs during the period. We believe that Mobile ABPU provides useful information to investors and others in understanding and evaluating our results in the same manner as management. We use Mobile ABPU as a measure of overall monetization across all of our players through the sale of virtual items and advertising.
Our business model around our social games is designed so that, as more players play our games, social interactions increase and the more valuable our games and our business become. All engaged players of our games help drive our bookings and, consequently, both online game revenue and advertising revenue. Virtual items are purchased by players who are socializing with, competing against or collaborating with other players, most of whom do not buy virtual items. Accordingly, we primarily focus on Mobile DAUs, Mobile MAUs and Mobile ABPU, which we believe collectively best reflect key audience metrics.
8
Non-GAAP Financial Measures
We have provided in this letter certain non-GAAP financial measures to supplement our consolidated financial statements prepared in accordance with U.S. GAAP (our “GAAP financial statements”). Management uses non-GAAP financial measures internally in analyzing our financial results to assess operational performance and liquidity. Our non-GAAP financial measures may be different from non-GAAP financial measures used by other companies.
The presentation of our non-GAAP financial measures is not intended to be considered in isolation or as a substitute for, or superior to, our GAAP financial statements. We believe that both management and investors benefit from referring to our non-GAAP financial measures in assessing our performance and when planning, forecasting and analyzing future periods. We believe our non-GAAP financial measures are useful to investors because they allow for greater transparency with respect to key financial measures we use in making operating decisions and because our investors and analysts use them to help assess the health of our business.
We have provided reconciliations of our non-GAAP financial measures used in this letter to the most directly comparable GAAP financial measures in the following tables. Because of the following limitations of our non-GAAP financial measures, you should consider the non-GAAP financial measures presented in this letter with our GAAP financial statements.
Key limitations of our non-GAAP financial measures include:
| • | Bookings does not reflect that we defer and recognize online game revenue and revenue from certain advertising transactions over the estimated average playing period of payers for durable virtual items or as consumed for consumable virtual items; |
| • | Adjusted EBITDA does not include the impact of stock-based expense, acquisition-related transaction expenses, contingent consideration fair value adjustments, legal settlements and related legal expense, and restructuring expense; |
| • | Adjusted EBITDA does not reflect provisions for or benefits from income taxes and does not include other income (expense) net, which includes foreign exchange and asset disposition gains and losses, interest expense and interest income; and |
| • | Adjusted EBITDA excludes depreciation and amortization of tangible and intangible assets. Although depreciation and amortization are non-cash charges, the assets being depreciated and amortized may have to be replaced in the future. |
| • | Free cash flow is derived from net cash provided by operating activities less cash spent on capital expenditures. |
9
ZYNGA INC.
CONSOLIDATED BALANCE SHEETS
(In thousands, unaudited)
| | September 30, | | | December 31, | |
| | 2019 | | | 2018 | |
Assets | | | | | | | | |
Current assets: | | | | | | | | |
Cash and cash equivalents | | $ | 589,446 | | | $ | 544,990 | |
Short-term investments | | | 790,776 | | | | 36,232 | |
Accounts receivable, net of allowance of $0 at September 30, 2019 and December 31, 2018 | | | 149,507 | | | | 91,630 | |
Restricted cash | | | 55,006 | | | | 35,006 | |
Prepaid expenses | | | 22,817 | | | | 26,914 | |
Other current assets | | | 15,907 | | | | 12,505 | |
Total current assets | | | 1,623,459 | | | | 747,277 | |
Long-term investments | | | 66,018 | | | | — | |
Goodwill | | | 1,437,900 | | | | 934,187 | |
Intangible assets, net | | | 247,299 | | | | 118,600 | |
Property and equipment, net | | | 24,118 | | | | 266,557 | |
Right-of-use assets | | | 139,048 | | | | — | |
Prepaid expenses | | | 26,752 | | | | 30,774 | |
Other non-current assets | | | 13,420 | | | | 49,308 | |
Total assets | | $ | 3,578,014 | | | $ | 2,146,703 | |
Liabilities and stockholders’ equity | | | | | | | | |
Current liabilities: | | | | | | | | |
Accounts payable | | $ | 25,953 | | | $ | 26,811 | |
Income tax payable | | | 5,817 | | | | 4,895 | |
Deferred revenue | | | 401,844 | | | | 191,299 | |
Debt | | | — | | | | 100,000 | |
Operating lease liabilities | | | 15,278 | | | | — | |
Other current liabilities | | | 315,891 | | | | 156,829 | |
Total current liabilities | | | 764,783 | | | | 479,834 | |
Convertible senior notes, net | | | 564,309 | | | | — | |
Deferred revenue | | | 965 | | | | 1,586 | |
Deferred tax liabilities, net | | | 27,873 | | | | 16,087 | |
Non-current operating lease liabilities | | | 132,225 | | | | — | |
Other non-current liabilities | | | 149,424 | | | | 52,586 | |
Total liabilities | | | 1,639,579 | | | | 550,093 | |
Stockholders’ equity: | | | | | | | | |
Common stock and additional paid-in capital | | | 3,873,712 | | | | 3,504,713 | |
Accumulated other comprehensive income (loss) | | | (152,610 | ) | | | (118,439 | ) |
Accumulated deficit | | | (1,782,667 | ) | | | (1,789,664 | ) |
Total stockholders’ equity | | | 1,938,435 | | | | 1,596,610 | |
Total liabilities and stockholders’ equity | | $ | 3,578,014 | | | $ | 2,146,703 | |
10
ZYNGA INC.
CONSOLIDATED STATEMENTS OF OPERATIONS
(In thousands, except per share data, unaudited)
| | Three Months Ended | | | Nine Months Ended | |
| | September 30, 2019 | | | June 30, 2019 | | | September 30, 2018 | | | September 30, 2019 | | | September 30, 2018 | |
Revenue: | | | | | | | | | | | | | | | | | | | | |
Online game | | $ | 281,651 | | | $ | 240,708 | | | $ | 167,716 | | | $ | 722,523 | | | $ | 493,949 | |
Advertising and other | | | 63,642 | | | | 65,792 | | | | 65,527 | | | | 194,673 | | | | 164,571 | |
Total revenue | | | 345,293 | | | | 306,500 | | | | 233,243 | | | | 917,196 | | | | 658,520 | |
Costs and expenses: | | | | | | | | | | | | | | | | | | | | |
Cost of revenue | | | 133,859 | | | | 126,872 | | | | 78,592 | | | | 382,374 | | | | 221,816 | |
Research and development | | | 137,487 | | | | 102,094 | | | | 71,124 | | | | 401,461 | | | | 199,340 | |
Sales and marketing | | | 120,836 | | | | 113,529 | | | | 55,613 | | | | 336,376 | | | | 159,346 | |
General and administrative | | | 26,774 | | | | 25,239 | | | | 23,144 | | | | 73,517 | | | | 71,977 | |
Total costs and expenses | | | 418,956 | | | | 367,734 | | | | 228,473 | | | | 1,193,728 | | | | 652,479 | |
Income (loss) from operations | | | (73,663 | ) | | | (61,234 | ) | | | 4,770 | | | | (276,532 | ) | | | 6,041 | |
Interest income | | | 6,597 | | | | 889 | | | | 1,421 | | | | 7,929 | | | | 5,031 | |
Interest expense | | | (6,728 | ) | | | (2,167 | ) | | | (133 | ) | | | (10,158 | ) | | | (147 | ) |
Other income (expense), net | | | 313,757 | | | | 3,877 | | | | 4,147 | | | | 321,009 | | | | 10,167 | |
Income (loss) before income taxes | | | 239,963 | | | | (58,635 | ) | | | 10,205 | | | | 42,248 | | | | 21,092 | |
Provision for (benefit from) income taxes | | | 9,880 | | | | (2,805 | ) | | | 5 | | | | (3,177 | ) | | | 6,194 | |
Net income (loss) | | $ | 230,083 | | | $ | (55,830 | ) | | $ | 10,200 | | | $ | 45,425 | | | $ | 14,898 | |
| | | | | | | | | | | | | | | | | | | | |
Net income (loss) per share attributable to common stockholders: | | | | | | | | | | | | | | | | | | | | |
Basic | | $ | 0.24 | | | $ | (0.06 | ) | | $ | 0.01 | | | $ | 0.05 | | | $ | 0.02 | |
Diluted | | $ | 0.24 | | | $ | (0.06 | ) | | $ | 0.01 | | | $ | 0.05 | | | $ | 0.02 | |
| | | | | | | | | | | | | | | | | | | | |
Weighted-average common shares used to compute net income (loss) per share attributable to common stockholders: | | | | | | | | | | | | | | | | | | | | |
Basic | | | 943,350 | | | | 937,334 | | | | 860,988 | | | | 935,701 | | | | 863,062 | |
Diluted | | | 973,830 | | | | 937,334 | | | | 887,228 | | | | 970,801 | | | | 890,146 | |
| | | | | | | | | | | | | | | | | | | | |
Stock-based compensation expense included in the above line items: | | | | | | | | | | | | | | | | | | | | |
Cost of revenue | | $ | 407 | | | $ | 397 | | | $ | 242 | | | $ | 1,088 | | | $ | 1,237 | |
Research and development | | | 12,029 | | | | 12,238 | | | | 12,039 | | | | 35,982 | | | | 31,027 | |
Sales and marketing | | | 3,046 | | | | 2,920 | | | | 2,232 | | | | 8,453 | | | | 6,282 | |
General and administrative | | | 5,857 | | | | 5,800 | | | | 4,241 | | | | 15,944 | | | | 11,690 | |
Total stock-based compensation expense | | $ | 21,339 | | | $ | 21,355 | | | $ | 18,754 | | | $ | 61,467 | | | $ | 50,236 | |
11
ZYNGA INC.
CONSOLIDATED STATEMENTS OF CASH FLOWS
(In thousands, unaudited)
| | Three Months Ended | | | Nine Months Ended | |
| | September 30, 2019 | | | June 30, 2019 | | | September 30, 2018 | | | September 30, 2019 | | | September 30, 2018 | |
Cash flows from operating activities: | | | | | | | | | | | | | | | | | | | | |
Net income (loss) | | $ | 230,083 | | | $ | (55,830 | ) | | $ | 10,200 | | | $ | 45,425 | | | $ | 14,898 | |
Adjustments to reconcile net income (loss) to net cash provided by (used in) operating activities: | | | | | | | | | | | | | | | | | | | | |
Depreciation and amortization | | | 19,069 | | | | 19,669 | | | | 12,454 | | | | 59,818 | | | | 29,363 | |
Stock-based compensation expense | | | 21,339 | | | | 21,355 | | | | 18,754 | | | | 61,467 | | | | 50,236 | |
(Gain) loss from sale of building, investments and other assets and foreign currency, net | | | (313,708 | ) | | | (539 | ) | | | (994 | ) | | | (314,093 | ) | | | 497 | |
(Accretion) and amortization on marketable debt securities, net | | | (1,846 | ) | | | (232 | ) | | | (743 | ) | | | (2,231 | ) | | | (2,043 | ) |
Noncash lease expense | | | 3,612 | | | | 1,712 | | | | — | | | | 6,773 | | | | — | |
Noncash interest expense | | | 6,086 | | | | 1,008 | | | | — | | | | 7,094 | | | | — | |
Noncash consideration received | | | — | | | | — | | | | (1,494 | ) | | | — | | | | (1,494 | ) |
Change in deferred income taxes and other | | | 11,864 | | | | (13,657 | ) | | | (3,082 | ) | | | (22,167 | ) | | | (1,809 | ) |
Changes in operating assets and liabilities: | | | | | | | | | | | | | | | | | | | | |
Accounts receivable, net | | | (5,926 | ) | | | 3,491 | | | | (6,707 | ) | | | (32,436 | ) | | | 7,302 | |
Prepaid expenses and other assets | | | (3,651 | ) | | | 3,842 | | | | (7,610 | ) | | | 3,509 | | | | (14,833 | ) |
Accounts payable | | | 4,449 | | | | 7,005 | | | | (2,352 | ) | | | (2,839 | ) | | | (18,613 | ) |
Deferred revenue | | | 50,165 | | | | 69,515 | | | | 15,632 | | | | 206,154 | | | | 43,758 | |
Income tax payable | | | (5,202 | ) | | | 5,421 | | | | (138 | ) | | | (5,142 | ) | | | (5,180 | ) |
Operating lease and other liabilities | | | 52,281 | | | | 35,857 | | | | 7,198 | | | | 157,447 | | | | (23,770 | ) |
Net cash provided by (used in) operating activities | | | 68,615 | | | | 98,617 | | | | 41,118 | | | | 168,779 | | | | 78,312 | |
Cash flows from investing activities: | | | | | | | | | | | | | | | | | | | | |
Purchases of investments | | | (749,533 | ) | | | (94,335 | ) | | | (83,346 | ) | | | (873,624 | ) | | | (267,435 | ) |
Maturities of investments | | | 24,000 | | | | 8,000 | | | | 82,300 | | | | 40,500 | | | | 384,300 | |
Sales of investments | | | 9,941 | | | | — | | | | — | | | | 14,928 | | | | 9,999 | |
Acquisition of property and equipment | | | (8,841 | ) | | | (4,900 | ) | | | (3,826 | ) | | | (18,799 | ) | | | (7,505 | ) |
Proceeds from sale of building and other property and equipment, net | | | 580,536 | | | | 44 | | | | 5 | | | | 580,626 | | | | 33 | |
Business acquisitions, net of cash acquired and restricted cash held in escrow | | | (2,459 | ) | | | — | | | | — | | | | (301,816 | ) | | | (222,075 | ) |
Release of restricted cash escrow from business combinations | | | — | | | | (10,000 | ) | | | — | | | | (10,000 | ) | | | (22,800 | ) |
Other investing activities, net | | | — | | | | — | | | | 278 | | | | — | | | | 375 | |
Net cash provided by (used in) investing activities | | | (146,356 | ) | | | (101,191 | ) | | | (4,589 | ) | | | (568,185 | ) | | | (125,108 | ) |
Cash flows from financing activities: | | | | | | | | | | | | | | | | | | | | |
Proceeds from issuance of debt, net | | | (530 | ) | | | 672,682 | | | | — | | | | 672,152 | | | | — | |
Purchase of capped calls | | | — | | | | (73,830 | ) | | | — | | | | (73,830 | ) | | | — | |
Taxes paid related to net share settlement of stockholders' equity awards | | | (10,808 | ) | | | (16,610 | ) | | | (5,390 | ) | | | (38,428 | ) | | | (19,363 | ) |
Repurchases of common stock | | | — | | | | — | | | | (8,392 | ) | | | — | | | | (73,811 | ) |
Proceeds from issuance of common stock | | | 5,490 | | | | 2,092 | | | | 4,771 | | | | 12,521 | | | | 8,925 | |
Repayment of debt | | | — | | | | (100,000 | ) | | | — | | | | (101,364 | ) | | | — | |
Acquisition-related contingent consideration payment | | | (12,900 | ) | | | — | | | | — | | | | (12,900 | ) | | | — | |
Other financing activities, net | | | — | | | | (1 | ) | | | — | | | | (324 | ) | | | — | |
Net cash provided by (used in) financing activities | | | (18,748 | ) | | | 484,333 | | | | (9,011 | ) | | | 457,827 | | | | (84,249 | ) |
| | | | | | | | | | | | | | | | | | | | |
Effect of exchange rate changes on cash, cash equivalents and restricted cash | | | (5,408 | ) | | | (159 | ) | | | (1,248 | ) | | | 6,035 | | | | (3,179 | ) |
| | | | | | | | | | | | | | | | | | | | |
Net change in cash, cash equivalents and restricted cash | | | (101,897 | ) | | | 481,600 | | | | 26,270 | | | | 64,456 | | | | (134,224 | ) |
Cash, cash equivalents and restricted cash, beginning of period | | | 746,349 | | | | 264,749 | | | | 245,183 | | | | 579,996 | | | | 405,677 | |
Cash, cash equivalents and restricted cash, end of period | | $ | 644,452 | | | $ | 746,349 | | | $ | 271,453 | | | $ | 644,452 | | | $ | 271,453 | |
ZYNGA INC.
12
RECONCILIATION OF GAAP TO NON-GAAP RESULTS
(In thousands, unaudited)
| | Three Months Ended | | | Nine Months Ended | |
| | September 30, 2019 | | | June 30,
2019 | | | September 30, 2018 | | | September 30, 2019 | | | September 30, 2018 | |
Reconciliation of Revenue to Bookings: Total | | | | | | | | | | | | | | | | | | | | |
Revenue | | $ | 345,293 | | | $ | 306,500 | | | $ | 233,243 | | | $ | 917,196 | | | $ | 658,520 | |
Change in deferred revenue | | | 49,513 | | | | 69,873 | | | | 15,632 | | | | 213,468 | | | | 43,756 | |
Bookings: Total | | $ | 394,806 | | | $ | 376,373 | | | $ | 248,875 | | | $ | 1,130,664 | | | $ | 702,276 | |
| | | | | | | | | | | | | | | | | | | | |
Reconciliation of Revenue to Bookings: Mobile | | | | | | | | | | | | | | | | | | | | |
Revenue | | $ | 327,578 | | | $ | 287,442 | | | $ | 212,466 | | | $ | 861,114 | | | $ | 587,812 | |
Change in deferred revenue | | | 49,983 | | | | 70,855 | | | | 17,422 | | | | 216,143 | | | | 47,102 | |
Bookings: Mobile | | $ | 377,561 | | | $ | 358,297 | | | $ | 229,888 | | | $ | 1,077,257 | | | $ | 634,914 | |
| | | | | | | | | | | | | | | | | | | | |
Reconciliation of Revenue to Bookings: Advertising | | | | | | | | | | | | | | | | | | | | |
Revenue | | $ | 63,599 | | | $ | 65,649 | | | $ | 65,446 | | | $ | 194,443 | | | $ | 162,517 | |
Change in deferred revenue | | | 155 | | | | 383 | | | | (23 | ) | | | 272 | | | | 1,065 | |
Bookings: Advertising | | $ | 63,754 | | | $ | 66,032 | | | $ | 65,423 | | | $ | 194,715 | | | $ | 163,582 | |
| | | | | | | | | | | | | | | | | | | | |
Reconciliation of Net Income (Loss) to Adjusted EBITDA | | | | | | | | | | | | | | | | | | | | |
Net income (loss) | | $ | 230,083 | | | $ | (55,830 | ) | | $ | 10,200 | | | $ | 45,425 | | | $ | 14,898 | |
Provision for (benefit from) income taxes | | | 9,880 | | | | (2,805 | ) | | | 5 | | | | (3,177 | ) | | | 6,194 | |
Other (income) expense, net | | | 490 | | | | (3,877 | ) | | | (4,147 | ) | | | (6,762 | ) | | | (10,167 | ) |
Interest income | | | (6,597 | ) | | | (889 | ) | | | (1,421 | ) | | | (7,929 | ) | | | (5,031 | ) |
Interest expense | | | 6,728 | | | | 2,167 | | | | 133 | | | | 10,158 | | | | 147 | |
Restructuring expense, net | | | — | | | | — | | | | 124 | | | | — | | | | 995 | |
Depreciation and amortization | | | 19,069 | | | | 19,669 | | | | 12,454 | | | | 59,818 | | | | 29,363 | |
Acquisition-related transaction expenses | | | — | | | | 232 | | | | 426 | | | | 7,588 | | | | 1,709 | |
Contingent consideration fair value adjustment | | | 60,764 | | | | 23,900 | | | | 1,500 | | | | 170,164 | | | | 3,000 | |
(Gain) loss on legal settlements and related legal expense | | | — | | | | (1,037 | ) | | | — | | | | (10,664 | ) | | | — | |
Gain on sale of building, net of transfer tax(1) | | | (314,247 | ) | | | — | | | | — | | | | (314,247 | ) | | | — | |
Stock-based compensation expense | | | 21,339 | | | | 21,355 | | | | 18,754 | | | | 61,467 | | | | 50,236 | |
Adjusted EBITDA | | $ | 27,509 | | | $ | 2,885 | | | $ | 38,028 | | | $ | 11,841 | | | $ | 91,344 | |
| | | | | | | | | | | | | | | | | | | | |
Reconciliation of GAAP Operating Expense to Non-GAAP Operating Expense | | | | | | | | | | | | | | | | | | | | |
GAAP operating expense | | $ | 285,097 | | | $ | 240,862 | | | $ | 149,881 | | | $ | 811,354 | | | $ | 430,663 | |
Restructuring expense, net | | | — | | | | — | | | | (124 | ) | | | — | | | | (968 | ) |
Amortization of intangible assets from acquisition | | | — | | | | — | | | | (442 | ) | | | (291 | ) | | | (1,443 | ) |
Acquisition-related transaction expenses | | | — | | | | (232 | ) | | | (426 | ) | | | (7,588 | ) | | | (1,709 | ) |
Contingent consideration fair value adjustment | | | (60,764 | ) | | | (23,900 | ) | | | (1,500 | ) | | | (170,164 | ) | | | (3,000 | ) |
Gain (loss) on legal settlements and related legal expense | | | — | | | | 1,037 | | | | — | | | | 10,664 | | | | — | |
Stock-based compensation expense | | | (20,932 | ) | | | (20,958 | ) | | | (18,512 | ) | | | (60,379 | ) | | | (48,999 | ) |
Non-GAAP operating expense | | $ | 203,401 | | | $ | 196,809 | | | $ | 128,877 | | | $ | 583,596 | | | $ | 374,544 | |
| | | | | | | | | | | | | | | | | | | | |
Reconciliation of Cash Provided by Operating Activities to Free Cash Flow | | | | | | | | | | | | | | | | | | | | |
Net cash provided by (used in) operating activities | | $ | 68,615 | | | $ | 98,617 | | | $ | 41,118 | | | $ | 168,779 | | | $ | 78,312 | |
Acquisition of property and equipment | | | (8,841 | ) | | | (4,900 | ) | | | (3,826 | ) | | | (18,799 | ) | | | (7,505 | ) |
Free cash flow | | $ | 59,774 | | | $ | 93,717 | | | $ | 37,292 | | | $ | 149,980 | | | $ | 70,807 | |
(1) | The gain on the sale of the building, net of transfer tax, was recorded within “Other income (expense), net” in our consolidated statement of operations for the three and nine months ended September 30, 2019. |
ZYNGA INC.
RECONCILIATION OF GAAP TO NON-GAAP FOURTH QUARTER 2019 GUIDANCE
13
(In thousands, except per share data, unaudited)
| | Fourth Quarter 2019 Guidance | | | Fourth Quarter 2018 Actual | | | Variance | |
Reconciliation of Revenue to Bookings | | | | | | | | | | | | |
Revenue | $ | | 365,000 | | $ | | 248,688 | | $ | | 116,312 | |
Change in deferred revenue | | | 50,000 | | | | 18,578 | | | | 31,422 | |
Bookings | $ | | 415,000 | | $ | | 267,266 | | $ | | 147,734 | |
| | | | | | | | | | | | |
Reconciliation of Net (Loss) Income to Adjusted EBITDA | | | | | | | | | | | | |
Net (loss) income | $ | | (44,000) | | $ | | 559 | | $ | | (44,559) | |
(Benefit from) provision for income taxes | | | 5,000 | | | | 4,812 | | | | 188 | |
Other income, net | | | — | | | | (3,239) | | | | 3,239 | |
Interest income | | | (5,000) | | | | (1,518) | | | | (3,482) | |
Interest expense | | | 8,000 | | | | 107 | | | | 7,893 | |
Restructuring expense | | | — | | | | 13 | | | | (13) | |
Depreciation and amortization | | | 20,000 | | | | 12,695 | | | | 7,305 | |
Acquisition-related transaction expenses | | | — | | | | 844 | | | | (844) | |
Contingent consideration fair value adjustment | | | 20,000 | | | | 2,500 | | | | 17,500 | |
Loss on legal settlements and related legal expense | | | — | | | | 2,333 | | | | (2,333) | |
Stock-based compensation expense | | | 21,000 | | | | 18,003 | | | | 2,997 | |
Adjusted EBITDA | $ | | 25,000 | | $ | | 37,109 | | $ | | (12,109) | |
| | | | | | | | | | | | |
GAAP basic shares | | | 945,000 | | | | 860,673 | | | | 84,327 | |
GAAP diluted shares | | | 945,000 | | | | 882,769 | | | | 62,231 | |
Basic and diluted net (loss) income per share | $ | | (0.05) | | $ | | 0.00 | | $ | | (0.05) | |
ZYNGA INC.
RECONCILIATION OF GAAP TO NON-GAAP RAISED FISCAL YEAR 2019 GUIDANCE
(In thousands, unaudited)
| | Raised Fiscal Year 2019 Guidance | | | Fiscal Year 2018 Actual | | | Variance | |
Reconciliation of Revenue to Bookings | | | | | | | | | | | | |
Revenue | $ | | 1,282,196 | | $ | | 907,208 | | $ | | 374,988 | |
Change in deferred revenue | | | 263,468 | | | | 62,334 | | | | 201,134 | |
Bookings | $ | | 1,545,664 | | $ | | 969,542 | | $ | | 576,122 | |
14