Exhibit 99.1
Q1 2020
Zynga Quarterly Earnings Letter
May 6, 2020


Dear Shareholders,
We look forward to discussing our Q1 2020 results during today’s earnings call at 2:00 p.m. PT. Our quarterly earnings letter below details our Q1 performance, as well as our outlook for Q2 and growth opportunities in 2020 and beyond. Please note that we manage our business based on topline measures including revenue, which is comprised of the change in deferred revenue and bookings. Revenue and the change in deferred revenue are both directly affected by bookings results, and management utilizes bookings as a primary topline measure to help inform its decisions.
Executive Summary
The human costs of the COVID-19 pandemic have been extraordinary, straining global capabilities and forcing massive societal change. Amidst this global crisis which has done so much to separate us from our colleagues, friends, and family, Zynga’s founding mission – to connect the world through games – has never been more vital. We’ve been humbled to see millions of people turning to our deeply social game experiences for entertainment and a sense of community and continuity.
Today, all Zynga employees are working from home, a transition we executed without any material disruptions to our operations. Our global workforce has rallied, adapting quickly to keep pace with the increasing appetite for innovative bold beats as well as progressing on our new game pipeline. We’ve also been grateful for the opportunity to serve our community during this time and are collaborating with the World Health Organization (WHO) and more than 55 other games companies on the #PlayApartTogether campaign to promote physical distancing through special in-game events, content and giveaways. Zynga’s collaborative culture has never been stronger and while the duration of shelter-in-place rules is uncertain, we are confident in our ability to operate our business remotely for as long as is necessary.
In Q1, we delivered our best first quarter revenue and bookings in Zynga history driven by our live services, which performed well throughout the quarter. We achieved revenue of $404 million, up 52% year-over-year, and bookings of $425 million, up 18% year-over-year. Our topline performance was above guidance driven by broad-based strength across our portfolio, especially by a record quarter from Empires & Puzzles and a great start to the year from Merge Dragons!. Additionally, the new titles we launched in 2019 – Merge Magic! and Game of ThronesTM Slots Casino – are doing well and were meaningful year-over-year contributors.
Given our Q1 beat and strong Q2 outlook, we are raising our full year 2020 guidance to $1.65 billion in revenue, up 25% year-over-year, and $1.8 billion in bookings, up 15% year-over-year. This represents an increase of $50 million in both revenue and bookings versus our prior guidance.
We continue to expect live services, anchored by our forever franchises, to drive the vast majority of our 2020 performance. Our new game pipeline is on schedule and we expect to release new titles worldwide in the second half of the year. In March, Harry Potter: Puzzles & Spells joined Puzzle Combat and FarmVille 3 in soft launch, and all three games are progressing well in test markets. We also continue to see opportunities to acquire talented teams and franchises around the world to further accelerate our growth.
While we are operating in an uncertain times, our business fundamentals are strong and should enable us to navigate the current environment, while remaining well-positioned for the long term.
1
Q1 Highlights
| • | Highest first quarter revenue and bookings performances in Zynga history. |
| • | Revenue of $404 million, up 52% year-over-year, and bookings of $425 million, up 18% year-over-year. |
| • | Online game – or user pay – revenue of $344 million, up 72% year-over-year, and user pay bookings of $366 million, up 24% year-over-year. |
| • | Empires & Puzzles, Merge Magic!, Game of ThronesTM Slots Casino and Merge Dragons! were the primary drivers of year-over-year topline growth. |
| • | Empires & Puzzles and our Social Slots portfolio achieved record revenue and bookings quarters. |
| • | Our Small Giant Games and Gram Games acquisitions continue to perform ahead of expectations driven by strong engagement and monetization in Empires & Puzzles, Merge Dragons! and Merge Magic!. |
| • | In March, Harry Potter: Puzzles & Spells joined Puzzle Combat and FarmVille 3 in soft launch, and all three titles are progressing well in test markets. |
| • | Successfully transitioned all Zynga employees to work from home without material disruptions to our operations. |
| • | Cash and investments of approximately $1.43 billion as of March 31, 2020. |

Playaparttogether playaparttogether Playaparttogether playaparttogether # playaparttogether Zynga Zynga poker extra chips! Play now!mMerge dragons! csr2 unlock community rewards! Community challenge farmville2 tropic escape play now 777 words with friends 2 merge magic empires & puzzles
Zynga Promotes the World Health Organization’s Messaging Through the #PlayApartTogether Campaign
2
Financials
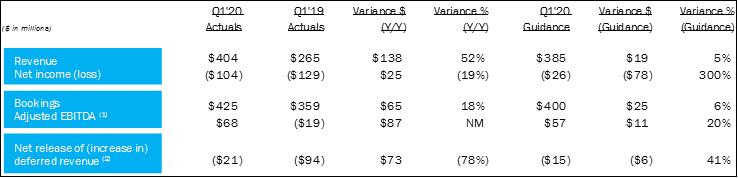
We delivered our highest ever Q1 revenue and bookings, with revenue of $404 million, above our guidance by $19 million and up $138 million or 52% year-over-year, and bookings of $425 million, beating our guidance by $25 million and up $65 million or 18% year-over-year. Broad-based strength across our live services portfolio drove our better than expected topline results, with standout performances from Empires & Puzzles and Merge Dragons!. User pay drove our topline beat, with advertising largely in-line with our expectations.
We generated user pay revenue of $344 million, up 72% year-over-year, and user pay bookings of $366 million, up 24% year-over-year. Advertising revenue and bookings were $59 million, down 9% year-over-year, as we lapped prior advertising network optimizations. In mid-March, we also started to see a pullback in advertising yields; however, this impact was offset by strong player engagement in our titles.
Our net increase in deferred revenue was $21 million versus our guidance of $15 million and a net increase of $94 million in Q1 2019. The primary drivers of the net increase in deferred revenue were bookings from Empires & Puzzles and Merge Magic!. We ended Q1 with a deferred revenue balance of $453 million versus $287 million a year ago.
($ in millions) Q1’20 actuals Q1’19 actuals variance $ (y/y) variance % (y/y) Q1’20 guidance variance $ (guidance) variance % (guidance) revenue net income (loss) bookings adjusted ebitda (1) net release of (increase in) deferred revenue (2) $404 $265 $138 52% $385 $19 5% ($104) ($129) $25 (19%) ($26) ($78) 300% $425 $359 $65 18% $400 $25 6% $68 ($19) $87 NM $57 $11 20% ($21) ($94) $73 (78%) ($15) ($6) 41%
Note: Certain measures as presented differ due to the impact of rounding. NM - not meaningful.
(1) | Adjusted EBITDA includes the net release of (increase in) deferred revenue. |
(2) | For clarity, a net release of deferred revenue results in revenue being higher than bookings and is a positive impact to Adjusted EBITDA as reported; a net increase in deferred revenue results in revenue being lower than bookings and is a negative impact to Adjusted EBITDA as reported. |
GAAP gross margins were 64% of revenue up from 54% in Q1 2019 primarily due to a lower net increase in deferred revenue. GAAP operating expenses (OpEx) decreased to 86% of revenue from 108% in Q1 2019 also primarily due to the lower net increase in deferred revenue, partially offset by increases in marketing and contingent consideration expense. Non-GAAP OpEx decreased to 49% of bookings from 51% a year ago on stronger operating leverage, primarily from R&D.
Given the strength in engagement and monetization in Empires & Puzzles, Merge Dragons! and Merge Magic!, our acquisitions of Small Giant Games and Gram Games continue to perform ahead of our expectations, resulting in a $120 million contingent consideration expense versus our guidance of $25 million. This was the primary driver of the difference in our net loss of $104 million versus our guidance of a net loss of $26 million. On a year-over-year basis, our net loss improved by $25 million driven by a lower net increase in deferred revenue and stronger operating performance, partially offset by the higher year-over-year contingent consideration expense.
Adjusted EBITDA was $68 million, above our guidance by $11 million, driven by our stronger than expected operating results, partially offset by a higher than expected net increase in deferred revenue. On a year-over-year basis, a lower net increase in deferred revenue and stronger operating results drove an $87 million increase in Adjusted EBITDA.
We had an operating cash outflow of $35 million versus a cash inflow of $2 million in the prior year quarter. In Q1, we completed the first of three annual earn out payments to Small Giant Games for $122 million – of which $74 million was classified as a reduction in operating cash flow and $48 million was classified as a cash outflow from financing activities. We ended the quarter with $1.43 billion of cash and investments.
In Q1, average mobile daily active users (DAUs) were 21 million and mobile monthly active users (MAUs) were 68 million, down 7% and 5% year-over-year, respectively. Audience growth from the addition of Merge Magic! was more than offset by decreases in older mobile titles, Words With Friends and chat games for mobile DAUs, and by declines in chat games and older mobile titles for mobile MAUs. Mobile average bookings per mobile DAU (ABPU) of $0.216 was up 27% year-over-year. On a sequential basis, both Q1 mobile DAUs and mobile MAUs increased modestly, led by growth in our Casual Cards portfolio and Words With Friends. Since late March, as more people sheltered-in-place, we have started to experience higher levels of engagement in our games and expect this to positively affect our Q2 mobile DAUs and MAUs.
3
Product
Our live services portfolio, anchored by our forever franchises, was the primary driver of our strong Q1 results. As we head into Q2, we are experiencing higher levels of engagement from current, lapsed and new players in our titles and have a robust slate of bold beats planned to connect and entertain our players.
CSR2 was a solid contributor in Q1 with the successful launch of Elite Customs – a new feature allowing players to customize and upgrade their car collections using new liveries, interiors, wheel upgrades and more – and a second Legends pack. To begin Q2, CSR2 held a #PlayApartTogether community challenge featuring an in-game BMW Z4 M40i for participants. We are also continuing our collaboration with Universal Brand Development and Digital Platforms to bring additional iconic cars from the Fast & FuriousTM franchise to the game.
Empires & Puzzles once again delivered its best revenue and bookings quarter driven by a robust series of bold beats. In Q1, we successfully launched Path of Valor, a brand-new battle pass system that rewards players for completing tasks and goals, followed by the highly anticipated Season 3 that introduced players to the nine realms of Valhalla – a land featuring frost giants, dark elves and Norse gods. We also re-introduced an updated Wardrobe feature, which gives players the ability to enhance their favorite heroes with new looks, skills and powers. We expect to build upon Empires & Puzzles’ momentum in Q2 by offering more events and challenges.
Merge Dragons! had a strong start to the year as players enjoyed Zen, Valentine’s Day, Carnival and Rick and Morty™ themed events featuring unique items and special dragons. In Q1, we also made technical adjustments within the title, improving its overall performance. In Q2, we will test enhancements to the game’s user experience and introduce more seasonal and themed events.
Merge Magic! continues to steadily scale and remains on track to become our newest forever franchise. In Q1, we began testing Season Pass – a new feature within the title that rewards players for higher engagement. We expect to launch this Season Pass feature globally in Q2 while also working on other potential updates.
Our Social Slots portfolio completed a record revenue and bookings quarter driven by strong performance across its titles. In particular, Hit It Rich! Slots was a meaningful contributor driven by winter-themed ‘Quest for the Chest’ events, and Wizard of Oz Slots successfully introduced Daily Challenges Deluxe – a new take on the player favorite Daily Challenges. Game of ThronesTM Slots Casino players enjoyed a new event type, Tales of Westeros, which challenges players to complete tasks to reach a final jackpot wheel. In Q2, we expect to introduce more innovative features across our Social Slots portfolio to surprise and entertain players.
Words With Friends had a good start to the year with solid engagement throughout the quarter and increases in installs and reactivations beginning in late March. In Q2, as a part of the #PlayApartTogether campaign, Words With Friends featured a new tile style in the shape of a home and special flash event challenges that celebrate connection. Last week, we announced a new collaboration with Amazon to feature free content – such as mystery boxes and special tile styles – exclusively to Prime subscribers within Words With Friends 2. Later in the quarter, we expect to introduce Duels, a new social competitive game mode, and a tiered referrals system to reward players for bringing new and lapsed players back into the community.
Zynga Poker completed a great Q1 driven by a variety of new themed events – such as ‘Pot O’ Gold’ for St. Patrick’s Day – that utilized our updated Event Challenges system. In late March, as more people sheltered at home, we rallied to introduce a new quick chat feature that allows players to socialize without missing any action. This feature is off to a great start and we are seeing a strong increase in overall chats within the game. In Q2, we will continue to launch more events as well as Watches – a new collectibles system that gives players a new way to compete and customize their profiles.
4
Multi-Year Growth Strategy
While there is uncertainty around the full impact and duration of the COVID-19 pandemic, we believe in the continued long-term growth of interactive entertainment. Our business fundamentals remain strong and we continue to execute our multi-year growth strategy of: (1) growing our live services, (2) creating new forever franchises and (3) investing in new platforms, markets and technology that have the ability to further accelerate our growth. We also see opportunities to enhance each of these growth pillars through acquisitions.
First, our strength in live services is the foundation of our multi-year growth strategy. Zynga has a highly diversified live services portfolio anchored by our forever franchises – CSR Racing, Empires & Puzzles, Merge Dragons!, Words With Friends and Zynga Poker – as well as Merge Magic!, which continues to steadily scale. In addition, our Social Slots and Casual Cards games are ongoing key contributors to our overall portfolio. Since late March, we have seen strong increases in reactivations from lapsed players as they return to iconic franchises they’ve enjoyed in the past. While working from home, our teams are continuing to deliver a steady cadence of innovative bold beats – new content and gameplay modes – to engage our players and drive strong, recurring growth from our live services. All of this is fueled by our proven and scalable live services capabilities comprised of best-in-class product management, data science, user acquisition, advertising and platform relationships.
Second, our goal is to create new forever franchises that add to our live services portfolio. Our new game pipeline remains on track and we expect to begin launching titles in the second half of 2020. Most recently, in March, we introduced our latest mobile title – Harry Potter: Puzzles & Spells – into soft launch. Officially licensed from Warner Bros. Interactive Entertainment, this title weaves innovative Match-3 puzzle gameplay with the iconic characters, narrative, settings, spell-casting and magical mischief of the Wizarding World. Puzzle Combat and FarmVille 3 are also progressing well in test markets. We maintain a rigorous approach to engineering hits, which includes careful testing in soft launch and relentless iteration with the goal of delivering long-term player engagement.
Third, mobile is continuously evolving and we are investing in new platforms, markets and technology to attract and engage more players. We are focused on growing our revenue and bookings in international markets and our decision to self-publish Empires & Puzzles in Asia is driving positive results. We are also innovating and experimenting with new game platforms with titles like Tiny Royale on Snapchat’s Snap Games platform as well as Words With Friends and Draw Something on Facebook Instant Games. While our investments in these and other initiatives are still in early stages, we believe they have the potential to increase our growth over the long term.
Last, we continue to see opportunities to acquire talented teams and franchises to further accelerate our growth. Our integration model enables teams to maintain their unique development cultures while leveraging Zynga’s highly scalable studio operations and publishing platform so that we can grow faster together.

Zynga poker tm words with friends 2 tm csr2 merge dragons! empires & puzzles merge magic zynga
5
Forward Outlook
Our Q2 and Full Year 2020 Guidance have been developed based on the information available as of May 6, 2020 and a similar methodology to prior quarters. Given the higher level of uncertainty around the COVID-19 crisis, there is the potential for a wider range of outcomes – both positive and negative – as it relates to our ultimate business results.
Q2 Guidance
| • | Net increase in deferred revenue of $60 million |
| • | Bookings of $460 million |
| • | Adjusted EBITDA of $32 million |
In Q2, we expect revenue of $400 million, up $94 million or 31% year-over-year, with bookings of $460 million, up $84 million or 22% year-over-year. Live services will drive our topline performance, led by our forever franchises, as well as the year-over-year additions of Merge Magic! and Game of ThronesTM Slots Casino. This overall momentum will be partially offset by year-over-year declines in older mobile and web titles. We also expect user pay to be the driver of our growth with advertising down year-over-year as we continue to lap prior advertising network optimizations and due to the recent pressure on advertising yields. Our topline guidance does not assume the launch of new titles in Q2.
As previously noted, we are experiencing elevated levels of engagement in our live services portfolio as people continue to shelter-in-place. In the current environment, it is hard to predict how events will unfold, but as shelter-in-place rules begin to be lifted, we expect trends to normalize. Our guidance assumes that this normalization will begin in the second half of Q2.
We expect a net increase in deferred revenue of $60 million in Q2 2020 versus a net increase of $70 million in Q2 2019.
The year-over-year change in this GAAP deferral represents a $10 million year-over-year increase in revenue, gross profit, net income and Adjusted EBITDA.
We expect gross margins to be up year-over-year primarily due to a lower net increase in deferred revenue in Q2 2020
versus Q2 2019, partially offset by the dilutive impact of a stronger user pay mix in Q2 2020 versus Q2 2019. Given the strong anticipated growth in revenue, we expect our GAAP operating expenses as a percentage of revenue to significantly decrease year-over-year.
Outside of these factors, we anticipate modest year-over-year improvements in operating leverage in R&D and G&A, which should be more than offset by higher sales & marketing. Specifically, in Q2, we are seeing unique opportunities to acquire audiences and are ramping our marketing investments across our live services portfolio and games in test markets.
What will our players thank us for?

6
2020 Guidance
| • | Revenue of $1.65 billion |
| • | Net increase in deferred revenue of $150 million |
| • | Bookings of $1.8 billion |
| • | Net loss of $245 million |
| • | Adjusted EBITDA of $210 million |
While we are operating in unprecedented times, based on our anticipated performance for the first half of the year, we are raising our full year 2020 revenue and bookings guidance by $50 million. In 2020, we expect to deliver $1.65 billion in revenue, up $328 million or 25% year-over-year, and bookings of $1.8 billion, up $236 million or 15% year-over-year.
Our guidance assumes that live services will drive the vast majority of our topline performance as we expect our forever franchises to collectively scale throughout 2020 and anticipate initial contributions from new games that are targeted to launch in the second half of the year. In 2020, we also expect year-over-year user pay growth to more than offset modest declines in advertising due to the recent pressure on advertising yields.
We continue to expect a net increase in deferred revenue of $150 million in 2020 versus a net increase of $242 million in 2019. The year-over-year change in this GAAP deferral represents a $92 million year-over-year increase in revenue, gross profit, net income and Adjusted EBITDA. The ultimate outcome for our net increase in deferred revenue in 2020 will be a function of the mix of live services bookings growth as well as the timing and scale of bookings contribution from our new game launches in the second half of the year.
For the full year, we anticipate slight pressure on our gross margins due to a higher mix of user pay versus advertising. We expect to see modest improvement in operating leverage from R&D and G&A, which should be more than offset by increased marketing investments on both our live services and new game launches. Operating leverage will ultimately be a function of our live services performance, user pay versus advertising mix, timing of new game launches and level of marketing invested into scaling our live services and new titles.
In addition, while we anticipate strong performance in the first half of 2020, it is uncertain how the current COVID-19 crisis will progress as well as how it may affect our business for the remainder of the year.
In 2020, we expect a net loss of $245 million, which includes $200 million of contingent consideration expense and a $150 million net increase in deferred revenue. Collectively these will more than offset the anticipated strong year-over-year improvement in our operating performance. Should our recent acquisitions continue to perform ahead of expectations, we may see a further increase in the cumulative contingent consideration expense.
We are raising our Adjusted EBITDA guidance to $210 million, up $123 million year-over-year primarily due to a lower net increase in deferred revenue and stronger operating performance, and representing an increase of $10 million versus our prior guidance driven by the increase in our topline guidance.
Earnings Call
We will host our Q1 2020 earnings conference call today, Wednesday, May 6, at 2:00 p.m. PT (5:00 p.m. ET). The call can be accessed at http://investor.zynga.com or via the below conference dial-in number:
| • | Toll-Free Dial-In Number: (800) 537-0745 |
| • | International Dial-In Number: (253) 237-1142 |
7
| |
Sincerely, | |

Frank Gibeau
Chief Executive Officer | 
Ger Griffin
Chief Financial Officer |
8
Forward-Looking Statements
This letter contains forward-looking statements, including those statements relating to our outlook for the full year and second quarter of 2020, including under the headings “Executive Summary,” “Financials,” “Product,” “Multi-Year Growth Strategy,” “Forward Outlook,” “Q2 Guidance” and “2020 Guidance” and statements relating to, among other things: our operational performance and strategy, including our focus on live services, growth projections relating to our forever franchises, an expected positive impact from shelter-in-place orders on our Q2 audience metrics, expectation to both launch and receive initial contributions from new titles in the second half of 2020, potential to accelerate growth through existing efforts and investments in new platforms and other initiatives, markets and technology, and confidence in our ability to grow our business in 2020; our ability to navigate the current environment and remain well-positioned for the long term; our plans to enhance existing games with new events, features and updates, scale existing games and increase marketing investments for both our live services portfolio and new game launches; our performance expectations regarding our live services, advertising business, forever franchises and our older mobile and web titles; our expectation for growth in user pay; our expectation for normalization in player engagement as shelter-in-place rules are lifted; our opportunities to further scale the business through acquisitions; and our ability to achieve and expectations related to financial projections, including revenue, deferred revenue, bookings, income, adjusted EBITDA, contingent consideration accruals, operating expenses, operating leverage, operating results, operating cash flow and margins.
Forward-looking statements often include words such as “outlook,” “projected,” “intend,” “will,” “anticipate,” “believe,” “target,” “expect,” “positioned,” and statements in the future tense are generally forward-looking. The achievement or success of the matters covered by such forward-looking statements involves significant risks, uncertainties and assumptions, including risks, uncertainty and assumptions relating to the COVID-19 pandemic, shelter-in-place rules and effects on business and economic conditions. Our actual results could differ materially from those predicted or implied and reported results should not be considered as an indication of our future performance. Undue reliance should not be placed on such forward-looking statements, which are based on information available to us on the date hereof. We assume no obligation to update such statements. More information about factors that could affect our operating results are described in greater detail in our public filings with the Securities and Exchange Commission (the “SEC”), copies of which may be obtained by visiting our Investor Relations web site at http://investor.zynga.com or the SEC's website at www.sec.gov.
In addition, the preliminary financial results set forth in this letter are estimates based on information currently available to us. While we believe these estimates are meaningful, they could differ from the actual amounts that we ultimately report in our Quarterly Report on Form 10-Q for the quarter ended March 31, 2020. We assume no obligation and do not intend to update these estimates prior to filing our Quarterly Report on Form 10-Q.
9
Key Operating Metrics
We manage our business by tracking several operating metrics: “Mobile DAUs,” which measure daily active users of our mobile games, “Mobile MAUs,” which measure monthly active users of our mobile games, and “Mobile ABPU,” which measures our average daily mobile bookings per average Mobile DAU, each of which is recorded and estimated by our internal analytics systems. We determine these operating metrics by using internal company data based on tracking of user account activity. We also use information provided by third parties, including third party network logins provided by platform providers, to help us track whether a player logged in under two or more different user accounts is the same individual. Overall, we believe that the amounts are reasonable estimates of our user base for the applicable period of measurement and that the methodologies we employ and update from time-to-time are reasonably based on our efforts to identify trends in player behavior. However, factors relating to user activity and systems and our ability to identify and detect attempts to replicate legitimate player activity may impact these numbers.
Mobile DAUs. We define Mobile DAUs as the number of individuals who played one of our mobile games during a particular day. Average Mobile DAUs for a particular period is the average of the Mobile DAUs for each day during that period. Under this metric, an individual who plays two different mobile games on the same day is counted as two DAUs. We use information provided by third parties to help us identify individuals who play the same game to reduce this duplication. However, because we do not always have the third party network login data to link an individual who has played under multiple user accounts, a player may be counted as multiple Mobile DAUs. Specifically, Mobile DAUs incrementally include Merge Magic! and the games acquired from Gram Games in May 2018 and Small Giant Games in January 2019 and, accordingly, actual Mobile DAUs may be lower than reported due to the potential duplication of these individuals. We use Mobile DAUs as a measure of audience engagement.
Mobile MAUs. We define Mobile MAUs as the number of individuals who played one of our mobile games in the 30-day period ending with the measurement date. Average Mobile MAUs for a particular period is the average of the Mobile MAUs at each month-end during that period. Under this metric, an individual who plays two different mobile games in the same 30-day period is counted as two Mobile MAUs. We use information provided by third parties to help us identify individuals who play the same game to reduce this duplication. However, because we do not always have the third party network login data to link an individual who has played under multiple user accounts, a player may be counted as multiple Mobile MAUs. Specifically, Mobile MAUs incrementally include Merge Magic! and the games acquired from Gram Games in May 2018 and Small Giant Games in January 2019 and, accordingly, actual Mobile MAUs may be lower than reported due to the potential duplication of these individuals. We use Mobile MAUs as a measure of total game audience size.
Mobile ABPU. We define Mobile ABPU as our total mobile bookings in a given period, divided by the number of days in that period, divided by the average Mobile DAUs during the period. We believe that Mobile ABPU provides useful information to investors and others in understanding and evaluating our results in the same manner as management. We use Mobile ABPU as a measure of overall monetization across all of our players through the sale of virtual items and advertising.
Our business model around our social games is designed so that, as more players play our games, social interactions increase and the more valuable our games and our business become. All engaged players of our games help drive our bookings and, consequently, both online game revenue and advertising revenue. Virtual items are purchased by players who are socializing with, competing against or collaborating with other players, most of whom do not buy virtual items. Accordingly, we primarily focus on Mobile DAUs, Mobile MAUs and Mobile ABPU, which we believe collectively best reflect key audience metrics.
10
Non-GAAP Financial Measures
We have provided in this letter certain non-GAAP financial measures to supplement our consolidated financial statements prepared in accordance with U.S. GAAP (our “GAAP financial statements”). Management uses non-GAAP financial measures internally in analyzing our financial results to assess operational performance and liquidity. Our non-GAAP financial measures may be different from non-GAAP financial measures used by other companies.
The presentation of our non-GAAP financial measures is not intended to be considered in isolation or as a substitute for, or superior to, our GAAP financial statements. We believe that both management and investors benefit from referring to our non-GAAP financial measures in assessing our performance and when planning, forecasting and analyzing future periods. We believe our non-GAAP financial measures are useful to investors because they allow for greater transparency with respect to key financial measures we use in making operating decisions and because our investors and analysts use them to help assess the health of our business.
We have provided reconciliations of our non-GAAP financial measures used in this letter to the most directly comparable GAAP financial measures in the following tables. Because of the following limitations of our non-GAAP financial measures, you should consider the non-GAAP financial measures presented in this letter with our GAAP financial statements.
Key limitations of our non-GAAP financial measures include:
| • | Bookings does not reflect that we defer and recognize online game revenue and revenue from certain advertising transactions over the estimated average playing period of payers for durable virtual items or as consumed for consumable virtual items; |
| • | Adjusted EBITDA does not include the impact of stock-based expense, acquisition-related transaction expenses, contingent consideration fair value adjustments and legal settlements and related legal expense; |
| • | Adjusted EBITDA does not reflect provisions for or benefits from income taxes and does not include other income (expense) net, which includes foreign exchange and asset disposition gains and losses, interest expense and interest income; |
| • | Adjusted EBITDA excludes depreciation and amortization of tangible and intangible assets. Although depreciation and amortization are non-cash charges, the assets being depreciated and amortized may have to be replaced in the future; |
| • | Free cash flow is derived from net cash provided by operating activities less cash spent on capital expenditures; and |
| • | Non-GAAP Operating Expenses do not include the impact of stock-based expense, acquisition-related transaction expenses, contingent consideration fair value adjustments, legal settlements and related legal expense or amortization of intangible assets from acquisitions. |
11
ZYNGA INC.
CONSOLIDATED BALANCE SHEETS
(In thousands, unaudited)
| | March 31, | | | December 31, | |
| | 2020 | | | 2019 | |
Assets | | | | | | | | |
Current assets: | | | | | | | | |
Cash and cash equivalents | | $ | 552,421 | | | $ | 423,323 | |
Short-term investments | | | 708,513 | | | | 938,173 | |
Accounts receivable, net of allowance of $401 at March 31, 2020 and $0 at December 31, 2019 | | | 166,065 | | | | 140,078 | |
Restricted cash | | | 30,006 | | | | 30,006 | |
Prepaid expenses | | | 31,311 | | | | 27,533 | |
Other current assets | | | 15,830 | | | | 16,557 | |
Total current assets | | | 1,504,146 | | | | 1,575,670 | |
Long-term investments | | | 173,305 | | | | 175,300 | |
Goodwill | | | 1,436,305 | | | | 1,460,933 | |
Intangible assets, net | | | 215,758 | | | | 233,005 | |
Property and equipment, net | | | 31,362 | | | | 25,826 | |
Right-of-use assets | | | 132,305 | | | | 136,972 | |
Prepaid expenses | | | 33,998 | | | | 37,815 | |
Other non-current assets | | | 15,242 | | | | 15,093 | |
Total assets | | $ | 3,542,421 | | | $ | 3,660,614 | |
Liabilities and stockholders’ equity | | | | | | | | |
Current liabilities: | | | | | | | | |
Accounts payable | | $ | 18,564 | | | $ | 27,799 | |
Income tax payable | | | 3,106 | | | | 649 | |
Deferred revenue | | | 451,740 | | | | 432,962 | |
Operating lease liabilities | | | 16,043 | | | | 15,753 | |
Other current liabilities | | | 308,385 | | | | 314,805 | |
Total current liabilities | | | 797,838 | | | | 791,968 | |
Convertible senior notes, net | | | 576,666 | | | | 570,456 | |
Deferred revenue | | | 1,618 | | | | 567 | |
Deferred tax liabilities, net | | | 39,118 | | | | 33,479 | |
Non-current operating lease liabilities | | | 126,036 | | | | 130,301 | |
Other non-current liabilities | | | 145,566 | | | | 158,413 | |
Total liabilities | | | 1,686,842 | | | | 1,685,184 | |
Stockholders’ equity: | | | | | | | | |
Common stock and additional paid-in capital | | | 3,927,962 | | | | 3,898,695 | |
Accumulated other comprehensive income (loss) | | | (155,891 | ) | | | (125,935 | ) |
Accumulated deficit | | | (1,916,492 | ) | | | (1,797,330 | ) |
Total stockholders’ equity | | | 1,855,579 | | | | 1,975,430 | |
Total liabilities and stockholders’ equity | | $ | 3,542,421 | | | $ | 3,660,614 | |
12
ZYNGA INC.
CONSOLIDATED STATEMENTS OF OPERATIONS
(In thousands, except per share data, unaudited)
| | Three Months Ended | |
| | March 31, 2020 | | | December 31, 2019 | | | March 31, 2019 | |
Revenue: | | | | | | | | | | | | |
Online game | | $ | 344,360 | | | $ | 324,714 | | | $ | 200,164 | |
Advertising and other | | | 59,407 | | | | 79,749 | | | | 65,239 | |
Total revenue | | | 403,767 | | | | 404,463 | | | | 265,403 | |
Costs and expenses: | | | | | | | | | | | | |
Cost of revenue | | | 146,202 | | | | 141,715 | | | | 121,643 | |
Research and development | | | 197,845 | | | | 104,428 | | | | 161,880 | |
Sales and marketing | | | 123,171 | | | | 127,715 | | | | 102,011 | |
General and administrative | | | 28,203 | | | | 26,273 | | | | 21,504 | |
Total costs and expenses | | | 495,421 | | | | 400,131 | | | | 407,038 | |
Income (loss) from operations | | | (91,654 | ) | | | 4,332 | | | | (141,635 | ) |
Interest income | | | 5,525 | | | | 6,110 | | | | 443 | |
Interest expense | | | (6,955 | ) | | | (6,813 | ) | | | (1,263 | ) |
Other income (expense), net | | | (2,330 | ) | | | 1,458 | | | | 3,375 | |
Income (loss) before income taxes | | | (95,414 | ) | | | 5,087 | | | | (139,080 | ) |
Provision for (benefit from) income taxes | | | 8,511 | | | | 8,587 | | | | (10,252 | ) |
Net income (loss) | | $ | (103,925 | ) | | $ | (3,500 | ) | | $ | (128,828 | ) |
| | | | | | | | | | | | |
Net income (loss) per share attributable to common stockholders: | | | | | | | | | | | | |
Basic | | $ | (0.11 | ) | | $ | (0.00 | ) | | $ | (0.14 | ) |
Diluted | | $ | (0.11 | ) | | $ | (0.00 | ) | | $ | (0.14 | ) |
| | | | | | | | | | | | |
Weighted-average common shares used to compute net income (loss) per share attributable to common stockholders: | | | | | | | | | | | | |
Basic | | | 952,502 | | | | 947,633 | | | | 926,230 | |
Diluted | | | 952,502 | | | | 947,633 | | | | 926,230 | |
| | | | | | | | | | | | |
Stock-based compensation expense included in the above line items: | | | | | | | | | | | | |
Cost of revenue | | $ | 438 | | | $ | 383 | | | $ | 284 | |
Research and development | | | 10,703 | | | | 11,067 | | | | 11,715 | |
Sales and marketing | | | 3,063 | | | | 2,824 | | | | 2,487 | |
General and administrative | | | 6,261 | | | | 5,741 | | | | 4,287 | |
Total stock-based compensation expense | | $ | 20,465 | | | $ | 20,015 | | | $ | 18,773 | |
13
ZYNGA INC.
CONSOLIDATED STATEMENTS OF CASH FLOWS
(In thousands, unaudited)
| | Three Months Ended | |
| | March 31, 2020 | | | December 31, 2019 | | | March 31, 2019 | |
Cash flows from operating activities: | | | | | | | | | | | | |
Net income (loss) | | $ | (103,925 | ) | | $ | (3,500 | ) | | $ | (128,828 | ) |
Adjustments to reconcile net income (loss) to net cash provided by (used in) operating activities: | | | | | | | | | | | | |
Depreciation and amortization | | | 18,862 | | | | 19,627 | | | | 21,080 | |
Stock-based compensation expense | | | 20,465 | | | | 20,015 | | | | 18,773 | |
(Gain) loss from investments, foreign currency and sale of assets, net | | | 923 | | | | (420 | ) | | | 154 | |
(Accretion) amortization on marketable debt securities, net | | | (1,900 | ) | | | (2,652 | ) | | | (153 | ) |
Noncash lease expense | | | 4,188 | | | | 4,394 | | | | 1,449 | |
Noncash interest expense | | | 6,210 | | | | 6,147 | | | | — | |
Change in deferred income taxes and other | | | 5,353 | | | | 5,405 | | | | (20,374 | ) |
Changes in operating assets and liabilities: | | | | | | | | | | | | |
Accounts receivable, net | | | (27,294 | ) | | | 9,890 | | | | (30,001 | ) |
Prepaid expenses and other assets | | | 1,362 | | | | (18,566 | ) | | | 3,318 | |
Accounts payable | | | (8,971 | ) | | | 1,834 | | | | (14,293 | ) |
Deferred revenue | | | 20,713 | | | | 28,527 | | | | 86,474 | |
Income tax payable | | | 2,459 | | | | (5,034 | ) | | | (5,361 | ) |
Operating lease and other liabilities | | | 26,369 | | | | 28,382 | | | | 69,309 | |
Net cash provided by (used in) operating activities | | | (35,186 | ) | | | 94,049 | | | | 1,547 | |
Cash flows from investing activities: | | | | | | | | | | | | |
Purchases of investments | | | (471,025 | ) | | | (694,592 | ) | | | (29,756 | ) |
Maturities of investments | | | 605,444 | | | | 411,000 | | | | 8,500 | |
Sales of investments | | | 96,808 | | | | 29,962 | | | | 4,987 | |
Acquisition of property and equipment | | | (8,546 | ) | | | (4,838 | ) | | | (5,058 | ) |
Proceeds from sale of property and equipment, net | | | 26 | | | | 54 | | | | 46 | |
Business acquisitions, net of cash acquired and restricted cash held in escrow | | | — | | | | — | | | | (299,357 | ) |
Release of restricted cash escrow from business combinations | | | — | | | | (25,000 | ) | | | — | |
Other investing activities, net | | | (1,045 | ) | | | (266 | ) | | | — | |
Net cash provided by (used in) investing activities | | | 221,662 | | | | (283,680 | ) | | | (320,638 | ) |
Cash flows from financing activities: | | | | | | | | | | | | |
Taxes paid related to net share settlement of stockholders' equity awards | | | (14,836 | ) | | | (11,163 | ) | | | (11,010 | ) |
Proceeds from issuance of common stock | | | 8,802 | | | | 4,968 | | | | 4,939 | |
Repayment of debt | | | — | | | | — | | | | (1,364 | ) |
Acquisition-related contingent consideration payment | | | (48,100 | ) | | | — | | | | — | |
Other financing activities, net | | | — | | | | — | | | | (326 | ) |
Net cash provided by (used in) financing activities | | | (54,134 | ) | | | (6,195 | ) | | | (7,761 | ) |
| | | | | | | | | | | | |
Effect of exchange rate changes on cash, cash equivalents and restricted cash | | | (3,244 | ) | | | 4,703 | | | | 11,605 | |
| | | | | | | | | | | | |
Net change in cash, cash equivalents and restricted cash | | | 129,098 | | | | (191,123 | ) | | | (315,247 | ) |
Cash, cash equivalents and restricted cash, beginning of period | | | 453,329 | | | | 644,452 | | | | 579,996 | |
Cash, cash equivalents and restricted cash, end of period | | $ | 582,427 | | | $ | 453,329 | | | $ | 264,749 | |
14
ZYNGA INC.
RECONCILIATION OF GAAP TO NON-GAAP RESULTS
(In thousands, unaudited)
| | Three Months Ended | |
| | March 31, 2020 | | | December 31, 2019 | | | March 31, 2019 | |
Reconciliation of Revenue to Bookings: Total | | | | | | | | | | | | |
Revenue | | $ | 403,767 | | | $ | 404,463 | | | $ | 265,403 | |
Change in deferred revenue | | | 21,108 | | | | 28,934 | | | | 94,082 | |
Bookings: Total | | $ | 424,875 | | | $ | 433,397 | | | $ | 359,485 | |
| | | | | | | | | | | | |
Reconciliation of Revenue to Bookings: Mobile | | | | | | | | | | | | |
Revenue | | $ | 386,989 | | | $ | 386,621 | | | $ | 246,093 | |
Change in deferred revenue | | | 21,510 | | | | 29,507 | | | | 95,305 | |
Bookings: Mobile | | $ | 408,499 | | | $ | 416,128 | | | $ | 341,398 | |
| | | | | | | | | | | | |
Reconciliation of Revenue to Bookings: Advertising | | | | | | | | | | | | |
Revenue | | $ | 59,290 | | | $ | 79,709 | | | $ | 65,195 | |
Change in deferred revenue | | | (30 | ) | | | 9 | | | | (266 | ) |
Bookings: Advertising | | $ | 59,260 | | | $ | 79,718 | | | $ | 64,929 | |
| | | | | | | | | | | | |
Reconciliation of Net Income (Loss) to Adjusted EBITDA | | | | | | | | | | | | |
Net income (loss) | | $ | (103,925 | ) | | $ | (3,500 | ) | | $ | (128,828 | ) |
Provision for (benefit from) income taxes | | | 8,511 | | | | 8,587 | | | | (10,252 | ) |
Other expense (income), net | | | 2,330 | | | | (1,458 | ) | | | (3,374 | ) |
Interest income | | | (5,525 | ) | | | (6,110 | ) | | | (443 | ) |
Interest expense | | | 6,955 | | | | 6,813 | | | | 1,262 | |
Depreciation and amortization | | | 18,862 | | | | 19,627 | | | | 21,080 | |
Acquisition-related transaction expenses | | | 787 | | | | — | | | | 7,356 | |
Contingent consideration fair value adjustment | | | 120,000 | | | | 31,400 | | | | 85,500 | |
Gain on legal settlements and related legal expense | | | — | | | | — | | | | (9,627 | ) |
Stock-based compensation expense | | | 20,465 | | | | 20,015 | | | | 18,773 | |
Adjusted EBITDA | | $ | 68,460 | | | $ | 75,374 | | | $ | (18,553 | ) |
| | | | | | | | | | | | |
Reconciliation of GAAP Operating Expense to Non-GAAP Operating Expense | | | | | | | | | | | | |
GAAP operating expense | | $ | 349,219 | | | $ | 258,416 | | | $ | 285,395 | |
Amortization of intangible assets from acquisition | | | — | | | | — | | | | (291 | ) |
Acquisition-related transaction expenses | | | (787 | ) | | | — | | | | (7,356 | ) |
Contingent consideration fair value adjustment | | | (120,000 | ) | | | (31,400 | ) | | | (85,500 | ) |
Gain on legal settlements and related legal expense | | | — | | | | — | | | | 9,627 | |
Stock-based compensation expense | | | (20,027 | ) | | | (19,632 | ) | | | (18,489 | ) |
Non-GAAP operating expense | | $ | 208,405 | | | $ | 207,384 | | | $ | 183,386 | |
| | | | | | | | | | | | |
Reconciliation of Cash Provided by Operating Activities to Free Cash Flow | | | | | | | | | | | | |
Net cash provided by (used in) operating activities | | $ | (35,186 | ) | | $ | 94,049 | | | $ | 1,547 | |
Acquisition of property and equipment | | | (8,546 | ) | | | (4,838 | ) | | | (5,058 | ) |
Free cash flow | | $ | (43,732 | ) | | $ | 89,211 | | | $ | (3,511 | ) |
15
ZYNGA INC.
RECONCILIATION OF GAAP TO NON-GAAP SECOND QUARTER 2020 GUIDANCE
(In thousands, except per share data, unaudited)
| | Second Quarter 2020 Guidance | | | Second Quarter 2019 Actual | | | Variance | |
Reconciliation of Revenue to Bookings | | | | | | | | | | | | |
Revenue | $ | | 400,000 | | $ | | 306,500 | | $ | | 93,500 | |
Change in deferred revenue | | | 60,000 | | | | 69,873 | | | | (9,873 | ) |
Bookings | $ | | 460,000 | | $ | | 376,373 | | $ | | 83,627 | |
| | | | | | | | | | | | |
Reconciliation of Net (Loss) Income to Adjusted EBITDA | | | | | | | | | | | | |
Net (loss) income | $ | | (60,000 | ) | $ | | (55,830 | ) | $ | | (4,170 | ) |
Provision for (benefit from) income taxes | | | 10,000 | | | | (2,805 | ) | | | 12,805 | |
Other income, net | | | — | | | | (3,877 | ) | | | 3,877 | |
Interest income | | | (2,000 | ) | | | (889 | ) | | | (1,111 | ) |
Interest expense | | | 8,000 | | | | 2,167 | | | | 5,833 | |
Depreciation and amortization | | | 20,000 | | | | 19,669 | | | | 331 | |
Acquisition-related transaction expenses | | | 1,000 | | | | 232 | | | | 768 | |
Contingent consideration fair value adjustment | | | 25,000 | | | | 23,900 | | | | 1,100 | |
Gain on legal settlements and related legal expense | | | — | | | | (1,037 | ) | | | 1,037 | |
Stock-based compensation expense | | | 30,000 | | | | 21,355 | | | | 8,645 | |
Adjusted EBITDA | $ | | 32,000 | | $ | | 2,885 | | $ | | 29,115 | |
| | | | | | | | | | | | |
Basic and diluted net loss per share | $ | | (0.06 | ) | $ | | (0.06 | ) | $ | | (0.00 | ) |
| | | | | | | | | | | | |
GAAP basic and diluted shares | | | 960,000 | | | | 937,334 | | | | 22,666 | |
16
ZYNGA INC.
RECONCILIATION OF GAAP TO NON-GAAP REVISED FISCAL YEAR 2020 GUIDANCE
(In thousands, unaudited)
| | Revised Fiscal Year 2020 Guidance | | | Fiscal Year 2019 Actual | | | Variance | |
Reconciliation of Revenue to Bookings | | | | | | | | | | | | |
Revenue | $ | | 1,650,000 | | $ | | 1,321,659 | | $ | | 328,341 | |
Change in deferred revenue | | | 150,000 | | | | 242,402 | | | | (92,402 | ) |
Bookings | $ | | 1,800,000 | | $ | | 1,564,061 | | $ | | 235,939 | |
| | | | | | | | | | | | |
Reconciliation of Net Income (Loss) to Adjusted EBITDA | | | | | | | | | | | | |
Net income (loss) | $ | | (245,000 | ) | $ | | 41,925 | | $ | | (286,925 | ) |
Provision for income taxes | | | 40,000 | | | | 5,410 | | | | 34,590 | |
Other expense (income), net | | | 2,000 | | | | (8,220 | ) | | | 10,220 | |
Interest income | | | (10,000 | ) | | | (14,039 | ) | | | 4,039 | |
Interest expense | | | 30,000 | | | | 16,971 | | | | 13,029 | |
Depreciation and amortization | | | 80,000 | | | | 79,445 | | | | 555 | |
Acquisition-related transaction expenses | | | 3,000 | | | | 7,588 | | | | (4,588 | ) |
Contingent consideration fair value adjustment | | | 200,000 | | | | 201,564 | | | | (1,564 | ) |
Gain on legal settlements and related legal expense | | | — | | | | (10,664 | ) | | | 10,664 | |
Gain on sale of building, net of transfer tax(1) | | | — | | | | (314,247 | ) | | | 314,247 | |
Stock-based compensation expense | | | 110,000 | | | | 81,482 | | | | 28,518 | |
Adjusted EBITDA | $ | | 210,000 | | $ | | 87,215 | | $ | | 122,785 | |
| | | | | | | | | | | | |
Basic net (loss) income per share | $ | | (0.25 | ) | $ | | 0.04 | | $ | | (0.29 | ) |
Diluted net (loss) income per share | $ | | (0.25 | ) | $ | | 0.04 | | $ | | (0.29 | ) |
| | | | | | | | | | | | |
GAAP basic shares | | | 965,000 | | | | 938,709 | | | | 26,291 | |
GAAP diluted shares | | | 965,000 | | | | 974,020 | | | | (9,020 | ) |
(1) | The gain on the sale of the building, net of transfer tax, was recorded within “Other income (expense), net” in our consolidated statement of operations for the twelve months ended December 31, 2019. |
17