UNITED STATES
SECURITIES AND EXCHANGE COMMISSION
Washington, D.C. 20549
FORM 10-Q
[Mark One]
| x | QUARTERLY REPORT PURSUANT TO SECTION 13 OR 15(d) OF THE | |
| | SECURITIES EXCHANGE ACT OF 1934 | |
For the quarterly period ended March 31, 2013
OR
| ¨ | TRANSITION REPORT PURSUANT TO SECTION 13 OR 15(d) OF THE | |
| | SECURITIES EXCHANGE ACT OF 1934 | |
For the transition period from ____________ to ____________
Commission File Number: 000-54383
United Development Funding IV
(Exact Name of Registrant as Specified in Its Charter)
| Maryland | | 26-2775282 |
| (State or other jurisdiction of incorporation or organization) | | (I.R.S. Employer Identification No.) |
1301 Municipal Way, Suite 100, Grapevine, Texas 76051
(Address of principal executive offices)
(Zip Code)
Registrant’s telephone number, including area code: (214) 370-8960
N/A
(Former name, former address and former fiscal year, if changed since last report)
Indicate by check mark whether the Registrant: (1) has filed all reports required to be filed by Section 13 or 15(d) of the Securities Exchange Act of 1934 during the preceding 12 months (or for such shorter period that the Registrant was required to file such reports) and (2) has been subject to such filing requirements for the past 90 days. Yesx No¨
Indicate by check mark whether the registrant has submitted electronically and posted on its corporate Web site, if any, every Interactive Data File required to be submitted and posted pursuant to Rule 405 of Regulation S-T (§232.405 of this chapter) during the preceding 12 months (or for such shorter period that the registrant was required to submit and post such files).YesxNo¨
Indicate by check mark whether the Registrant is a large accelerated filer, an accelerated filer, a non-accelerated filer, or a smaller reporting company. See the definitions of “large accelerated filer,” “accelerated filer” and “smaller reporting company” in Rule 12b-2 of the Exchange Act.
| Large accelerated filer¨ | Accelerated filer¨ |
| Non-accelerated filerx(Do not check if a smaller reporting company) | Smaller reporting company¨ |
Indicate by check mark whether the Registrant is a shell company (as defined in Rule 12b-2 of the Exchange Act).
Yes¨Nox
The number of shares outstanding of the Registrant’s common shares of beneficial interest, par value $0.01 per share, as of the close of business on May 1, 2013 was 23,908,905.
UNITED DEVELOPMENT FUNDING IV
FORM 10-Q
Quarter Ended March 31, 2013
PART I
FINANCIAL INFORMATION |
| | | |
| Item 1. | Consolidated Financial Statements. | |
| | | |
| | Consolidated Balance Sheets as of March 31, 2013 and December 31, 2012 (Unaudited) | 3 |
| | | |
| | Consolidated Statements of Operations for the three months ended March 31, 2013 and 2012 (Unaudited) | 4 |
| | | |
| | Consolidated Statements of Cash Flows for the three months ended March 31, 2013 and 2012 (Unaudited) | 5 |
| | | |
| | Notes to Consolidated Financial Statements (Unaudited) | 6 |
| | | |
| Item 2. | Management’s Discussion and Analysis of Financial Condition and Results of Operations. | 37 |
| | | |
| Item 3. | Quantitative and Qualitative Disclosures About Market Risk. | 59 |
| | | |
| Item 4. | Controls and Procedures. | 60 |
| | | |
PART II OTHER INFORMATION |
| | | |
| Item 1. | Legal Proceedings. | 61 |
| | | |
| Item 1A. | Risk Factors. | 61 |
| | | |
| Item 2. | Unregistered Sales of Equity Securities and Use of Proceeds. | 64 |
| | | |
| Item 3. | Defaults Upon Senior Securities. | 66 |
| | | |
| Item 4. | Mine Safety Disclosures. | 66 |
| | | |
| Item 5. | Other Information. | 66 |
| | | |
| Item 6. | Exhibits. | 66 |
| | | |
| Signatures. | | 67 |
PART I
FINANCIAL INFORMATION
Item 1. Financial Statements.
UNITED DEVELOPMENT FUNDING IV
CONSOLIDATED BALANCE SHEETS
(Unaudited)
| | | March 31, 2013 | | | December 31, 2012 | |
| Assets | | | | | | | | |
| Cash and cash equivalents | | $ | 43,398,015 | | | $ | 23,225,858 | |
| Accrued interest receivable | | | 11,460,279 | | | | 7,267,604 | |
| Accrued receivable – related parties | | | 1,823,904 | | | | 1,980,274 | |
| Loan participation interest – related parties, net | | | 27,435,958 | | | | 29,743,602 | |
| Notes receivable, net | | | 273,547,740 | | | | 246,450,255 | |
| Notes receivable – related parties, net | | | 30,169,624 | | | | 29,350,382 | |
| Deferred offering costs | | | 3,186,897 | | | | 5,050,715 | |
| Investor subscriptions receivable | | | 1,714,834 | | | | 1,137,357 | |
| Other assets | | | 698,114 | | | | 665,127 | |
| Total assets | | $ | 393,435,365 | | | $ | 344,871,174 | |
| | | | | | | | | |
| Liabilities and Shareholders’ Equity | | | | | | | | |
| Liabilities: | | | | | | | | |
| Accounts payable | | $ | 63,279 | | | $ | - | |
| Accrued liabilities | | | 191,805 | | | | 208,853 | |
| Accrued liabilities – related parties | | | 3,862,266 | | | | 6,229,710 | |
| Distributions payable | | | 1,784,846 | | | | 1,956,226 | |
| Lines of credit | | | 28,053,818 | | | | 28,688,003 | |
| Notes payable | | | 4,335,523 | | | | 5,095,523 | |
| Total liabilities | | | 38,291,537 | | | | 42,178,315 | |
| | | | | | | | | |
| Commitments and contingencies | | | | | | | | |
| | | | | | | | | |
| Shareholders’ equity: | | | | | | | | |
| Shares of beneficial interest; $0.01 par value; 400,000,000 shares authorized; 20,687,672 shares issued and 20,532,375 shares outstanding at March 31, 2013, and 17,624,839 shares issued and 17,500,308 shares outstanding at December 31, 2012 | | | 206,877 | | | | 176,248 | |
| Additional paid-in-capital | | | 361,723,839 | | | | 308,069,721 | |
| Accumulated deficit | | | (3,681,429 | ) | | | (3,062,972 | ) |
| Shareholders’ equity before treasury stock | | | 358,249,287 | | | | 305,182,997 | |
| Less: Treasury stock, 155,297 shares at March 31, 2013 and 124,531 shares at December 31, 2012, at cost | | | (3,105,459 | ) | | | (2,490,138 | ) |
| Total shareholders’ equity | | | 355,143,828 | | | | 302,692,859 | |
| Total liabilities and shareholders’ equity | | $ | 393,435,365 | | | $ | 344,871,174 | |
See accompanying notes to consolidated financial statements (unaudited).
UNITED DEVELOPMENT FUNDING IV
CONSOLIDATED STATEMENTS OF OPERATIONS
(Unaudited)
| | | Three Months Ended March 31, | |
| | | 2013 | | | 2012 | |
| Interest income: | | | | | | | | |
| Interest income | | $ | 8,385,076 | | | $ | 3,839,183 | |
| Interest income – related parties | | | 1,895,259 | | | | 1,225,369 | |
| Total interest income | | | 10,280,335 | | | | 5,064,552 | |
| | | | | | | | | |
| Interest expense: | | | | | | | | |
| Interest expense | | | 474,381 | | | | 419,996 | |
| | | | | | | | | |
| Net interest income | | | 9,805,954 | | | | 4,644,556 | |
| Provision for loan losses | | | 415,699 | | | | 203,076 | |
| Net interest income after provision for loan losses | | | 9,390,255 | | | | 4,441,480 | |
| | | | | | | | | |
| Noninterest income: | | | | | | | | |
| Commitment fee income | | | 218,895 | | | | 78,809 | |
| Commitment fee income – related parties | | | 55,631 | | | | 11,814 | |
| Total noninterest income | | | 274,526 | | | | 90,623 | |
| | | | | | | | | |
| Noninterest expense: | | | | | | | | |
| Advisory fee – related party | | | 1,641,566 | | | | 775,216 | |
| General and administrative | | | 261,830 | | | | 174,715 | |
| General and administrative – related parties | | | 462,929 | | | | 261,360 | |
| Total noninterest expense | | | 2,366,325 | | | | 1,211,291 | |
| | | | | | | | | |
| Net income | | $ | 7,298,456 | | | $ | 3,320,812 | |
| | | | | | | | | |
| Net income per weighted average share outstanding | | $ | 0.39 | | | $ | 0.41 | |
| | | | | | | | | |
| Weighted average shares outstanding | | | 18,833,062 | | | | 8,078,848 | |
| | | | | | | | | |
| Distributions per weighted average share outstanding | | $ | 0.42 | | | $ | 0.40 | |
See accompanying notes to consolidated financial statements (unaudited).
UNITED DEVELOPMENT FUNDING IV
CONSOLIDATED STATEMENTS OF CASH FLOWS
(Unaudited)
| | | Three Months Ended March 31, | |
| | | 2013 | | | 2012 | |
| Operating Activities | | | | | | | | |
| Net income | | $ | 7,298,456 | | | $ | 3,320,812 | |
| Adjustments to reconcile net income to net cash provided by operating activities: | | | | | | | | |
| Provision for loan losses | | | 415,699 | | | | 203,076 | |
| Amortization expense | | | 95,738 | | | | 135,509 | |
| Changes in assets and liabilities: | | | | | | | | |
| Accrued interest receivable | | | (4,192,675 | ) | | | (2,158,964 | ) |
| Accrued receivable – related parties | | | 156,370 | | | | 57,859 | |
| Other assets | | | (128,725 | ) | | | (5,525 | ) |
| Accounts payable and accrued liabilities | | | 46,231 | | | | (138,921 | ) |
| Net cash provided by operating activities | | | 3,691,094 | | | | 1,413,846 | |
| | | | | | | | | |
| Investing Activities | | | | �� | | | | |
| Investments in loan participation interest – related parties | | | (1,419,746 | ) | | | (1,047,818 | ) |
| Principal receipts from loan participation interest – related parties | | | 3,727,390 | | | | 890,630 | |
| Investments in notes receivable | | | (36,028,817 | ) | | | (26,134,901 | ) |
| Principal receipts from notes receivable | | | 8,515,633 | | | | 4,658,761 | |
| Investments in notes receivable – related parties | | | (5,156,287 | ) | | | (1,702,169 | ) |
| Principal receipts from notes receivable – related parties | | | 4,337,045 | | | | 1,807,090 | |
| Net cash used in investing activities | | | (26,024,782 | ) | | | (21,528,407 | ) |
| | | | | | | | | |
| Financing Activities | | | | | | | | |
| Proceeds from issuance of shares of beneficial interest | | | 58,454,241 | | | | 31,141,106 | |
| Investor subscriptions receivable | | | (577,477 | ) | | | (279,840 | ) |
| Purchase of treasury shares | | | (599,623 | ) | | | (401,184 | ) |
| Net borrowings on lines of credit | | | (634,185 | ) | | | 102,076 | |
| Proceeds from notes payable | | | - | | | | 216,521 | |
| Payments on notes payable | | | (760,000 | ) | | | (2,941,294 | ) |
| Distributions | | | (8,088,292 | ) | | | (3,094,071 | ) |
| Shareholders’ distribution reinvestment | | | 2,800,309 | | | | 1,149,791 | |
| Payments of offering costs | | | (7,585,502 | ) | | | (4,046,221 | ) |
| Deferred offering costs | | | 1,863,818 | | | | 74,361 | |
| Accrued liabilities – related parties | | | (2,367,444 | ) | | | (517,711 | ) |
| Net cash provided by financing activities | | | 42,505,845 | | | | 21,403,534 | |
| | | | | | | | | |
| Net increase in cash and cash equivalents | | | 20,172,157 | | | | 1,288,973 | |
| Cash and cash equivalents at beginning of period | | | 23,225,858 | | | | 6,031,956 | |
| Cash and cash equivalents at end of period | | $ | 43,398,015 | | | $ | 7,320,929 | |
| Supplemental Cash Flow Information: | | | | | | | | |
| Cash paid for interest | | $ | 476,731 | | | $ | 471,550 | |
See accompanying notes to consolidated financial statements (unaudited).
UNITED DEVELOPMENT FUNDING IV
NOTES TO CONSOLIDATED FINANCIAL STATEMENTS
(Unaudited)
A. Nature of Business
United Development Funding IV (which may be referred to as the “Trust,” “we,” “our,” or “UDF IV”) was organized on May 28, 2008 (“Inception”) as a Maryland real estate investment trust. The Trust is the sole general partner of and owns a 99.999% partnership interest in United Development Funding IV Operating Partnership, L.P. (“UDF IV OP”), a Delaware limited partnership. UMTH Land Development, L.P. (“UMTH LD”), a Delaware limited partnership and the affiliated asset manager of the Trust, is the sole limited partner and owner of 0.001% (minority interest) of the partnership interests in UDF IV OP. At March 31, 2013 and December 31, 2012, UDF IV OP had no assets, liabilities or equity. The Trust owns a 100% limited partnership interest in UDF IV Home Finance, LP (“UDF IV HF”), UDF IV Finance I, LP (“UDF IV FI”), UDF IV Finance II, LP (“UDF IV FII”), UDF IV Acquisitions, LP (“UDF IV AC”) and UDF IV Finance III, LP (“UDF IV FIII”) and UDF IV Finance IV, L.P. (“UDF IV Fin IV”), all Delaware limited partnerships. The Trust is the sole member of (i) UDF IV HF Manager, LLC (“UDF IV HFM”), a Delaware limited liability company, the general partner of UDF IV HF; (ii) UDF IV Finance I Manager, LLC (“UDF IV FIM”), a Delaware limited liability company, the general partner of UDF IV FI; (iii) UDF IV Finance II Manager, LLC (“UDF IV FIIM”), a Delaware limited liability company, the general partner of UDF IV FII; (iv) UDF IV Acquisitions Manager, LLC (“UDF IV ACM”), a Delaware limited liability company, the general partner of UDF IV AC; (v) UDF IV Finance III Manager, LLC (“UDF IV FIIIM”), a Delaware limited liability company, the general partner of UDF IV FIII; and (vi) UDF IV Finance IV Manager, LLC (“UDF IV FIVM”), a Delaware limited liability company, the general partner of UDF IV Fin IV.
As of March 31, 2013 and December 31, 2012, UDF IV HFM, UDF IV FIM, UDF IV FIIM, UDF IV ACM, UDF IV FIIIM and UDF IV FIVM had no assets, liabilities, or equity.
The Trust uses substantially all of the net proceeds from the public offering of common shares of beneficial interest in the Trust to originate, purchase, participate in and hold for investment secured loans made directly by the Trust or indirectly through its affiliates to persons and entities for the acquisition and development of parcels of real property as single-family residential lots, and theconstruction of model and new single-family homes, including development of mixed-use master planned residential communities. The Trust alsomakes direct investments in land for development into single-family lots, new and model homes and portfolios of finished lots and homes; provides credit enhancements to real estate developers, home builders, land bankers and other real estate investors; and purchases participations in, or finances for other real estate investors the purchase of, securitized real estate loan pools and discounted cash flows secured by state, county, municipal or other similar assessments levied on real property. The Trust also may enter into joint ventures with unaffiliated real estate developers, home builders, land bankers and other real estate investors, or with other United Development Funding-sponsored programs, to originate or acquire, as the case may be, the same kind of secured loans or real estate investments the Trust may originate or acquire directly.
UMTH General Services, L.P. (“UMTH GS” or “Advisor”), a Delaware limited partnership, is the Trust’s advisor and is responsible for managing the Trust’s affairs on a day-to-day basis. UMTH GS has engaged UMTH LD as the Trust’s asset manager. The asset manager oversees the investing and financing activities of the affiliated programs managed and advised by the Advisor and UMTH LD as well as provides the Trust’s board of trustees recommendations regarding investments and finance transactions, management, policies and guidelines and reviews investment transaction structure and terms, investment underwriting, investment collateral, investment performance, investment risk management, and the Trust’s capital structure at both the entity and asset level.
The Trust has no employees and does not maintain any physical properties. The Trust’s operations are conducted at the corporate offices of the Trust’s Advisor at 1301 Municipal Way, Grapevine, Texas 76051.
B.Summary of Significant Accounting Policies
A summary of our significant accounting policies consistently applied in the preparation of the accompanying consolidated financial statements follows:
Basis of Presentation
The accompanying unaudited consolidated financial statements were prepared in accordance with generally accepted accounting principles in the United States of America (“GAAP”) for interim financial information, with the instructions to Form 10-Q and with Regulation S-X. They do not include all information and footnotes required by GAAP for complete financial statements. However, except as disclosed herein, there has been no material change to the information disclosed in our 2012 Annual Report on Form 10-K for the year ended December 31, 2012, which was filed with the Securities and Exchange Commission on April 1, 2013 (the “Annual Report”). The accompanying interim unaudited consolidated financial statements should be read in conjunction with the consolidated financial statements filed in our Annual Report. In the opinion of management, the accompanying unaudited consolidated financial statements include all adjustments, consisting solely of normal recurring adjustments, considered necessary to present fairly our financial position as of March 31, 2013 and December 31, 2012, operating results for the three months ended March 31, 2013 and 2012, and cash flows for the three months ended March 31, 2013 and 2012. Operating results and cash flows for the three months ended March 31, 2013 are not necessarily indicative of the results that may be expected for the year ending December 31, 2013.
Principles of Consolidation
The consolidated financial statements include the accounts of the Trust and its wholly-owned subsidiaries. All significant intercompany accounts and transactions have been eliminated.
Loan Participation Interest – Related Parties
Loan participation interest – related parties are recorded at the lower of cost or net realizable value.Loan participation interest – related parties represents the purchase of a financial interest in certain interim construction loan, paper lot (residential lots shown on a plat that has been accepted by the city or county, but which is currently undeveloped or under development) loan and finished lot loan facilities originated by our affiliates. We participate in these loans by funding the lending obligations of our affiliates under these credit facilities up to a maximum amount for each participation. Such participations entitle us to receive payments of principal and interest from the borrower up to the amounts funded by us and interest on the funded amounts from the borrower. The participation interests in interim construction loan facilities are collateralized by first lien deeds of trust on the homes financed under the construction loans. The participation interests in paper lot loan and finished lot loan facilities are collateralized by one or more of the following: first or second lien deeds of trust, a pledge of ownership interests in the borrower, assignments of lot sale contracts, or reimbursements of development costs due to the borrower under contracts with districts and cities. None of such loans are insured or guaranteed by a federally owned or guaranteed mortgage agency. As of March 31, 2013, the participations have terms ranging from 6 to 18 months and bear interest at rates ranging from 11.5%to 15%. The participation interests may be paid off prior to maturity; however, we intend to hold all participation interests for the life of the loans.
Notes Receivable and Notes Receivable – Related Parties
Notes receivable and notes receivable – related parties are recorded at the lower of cost or net realizable value. The notes are collateralized by one or more of the following: first or second lien deeds of trust, a pledge of ownership interests in the borrower, assignments of lot sale contracts, or reimbursements of development costs due to the borrower under contracts with districts and cities. None of such notes are insured or guaranteed by a federally owned or guaranteed mortgage agency. As of March 31, 2013, the notes have terms ranging from 1 to 47 months and bear interest at rates ranging from 11% to 15%. The notes may be paid off prior to maturity; however, we intend to hold all notes for the life of the notes.
Allowance for Loan Losses
The allowance for loan losses is our estimate of incurred losses in our portfolio of notes receivable, notes receivable – related parties and loan participation interest – related parties. We periodically perform a detailed review of our portfolio of notes and other loans to determine if impairment has occurred and to assess the adequacy of the allowance for loan losses. Our review consists of evaluating economic conditions, the estimated value of the underlying collateral, the guarantor, adverse situations that may affect the borrower’s ability to pay or the value of the collateral, and other relevant factors. This review is inherently subjective as it requires estimates that are susceptible to significant revision as more information becomes available.
In reviewing our portfolio, we use cash flow estimates from the disposition of finished lots, paper lots and undeveloped land as well as cash flow received from the issuance of bonds from municipal reimbursement districts. These estimates are based on current market metrics, including, without limitation, the supply of finished lots, paper lots and undeveloped land, the supply of homes and the rate and price at which land and homes are sold, historic levels and trends, executed contracts, appraisals and discussions with third party market analysts and participants, including homebuilders. We have based our valuations on current and historic market trends on our analysis of market events and conditions, including activity within our portfolio, as well as those of third-party services such as Metrostudy and Residential Strategies, Inc. Cash flow forecasts also have been based on executed purchase contracts which provide base prices, escalation rates, and absorption rates on an individual project basis. For projects deemed to have an extended time horizon for disposition, we have considered third-party appraisals to provide a valuation in accordance with guidelines set forth in the Uniform Standards of Professional Appraisal Practice. In addition to cash flows from the disposition of property, cost analysis has been performed based on estimates of development and senior financing expenditures provided by developers and independent professionals on a project-by-project basis. These amounts have been reconciled with our best estimates to establish the net realizable value of the portfolio.
We charge additions to the allowance for loan losses to current period earnings through a provision for loan losses. Amounts determined to be uncollectible are charged directly against, or “charged off,” and decrease the allowance for loan losses, while amounts recovered on previously charged off accounts increase the allowance.
Organization and Offering Expenses
Organization costs will be expensed as incurred in accordance with Statement of Position 98-5,Reporting on the Costs of Start-up Activities,currently within the scope of Financial Accounting Standards Board (“FASB”) Accounting Standards Codification (“ASC”) 720-15. Offering costs related to raising capital from debt will be capitalized and amortized over the term of such debt. Offering costs related to raising capital from equity reduce equity and are reflected as shares issuance costs in shareholders’ equity. Certain offering costs are currently being paid by our Advisor. As discussed in Note G, these costs will be reimbursed to our Advisor by the Trust.
Investor Subscriptions Receivable
Investor subscriptions receivable represents amounts receivable from our transfer agent related to investments they have admitted in connection with ourinitial public offering. See Note C – Registration Statement for further discussion of our offering. Our transfer agent processes investor admissions on a daily basis and sends the proceeds of each admission to us the subsequent day. The investor subscriptions receivable represents our receivable related to the previous day’s investor admissions.
Interest Income and Non-Interest Income Recognition
Interest income on loan participation interest – related parties, notes receivable and notes receivable – related parties is recognized over the life of the participation agreement or note agreement and recorded on the accrual basis. A loan is placed on non-accrual status and income recognition is suspended at the date at which, in the opinion of management, a full recovery of income and principal becomes more likely than not, but is no longer probable, based upon our review of economic conditions, the estimated value of the underlying collateral, the guarantor, adverse situations that may affect the borrower’s ability to pay or the value of the collateral and other relevant factors. Income recognition is resumed when the loan becomes contractually current and performance is demonstrated to be resumed. Any payments received on loans classified as non-accrual status are typically applied first to outstanding loan amounts and then to the recovery of lost interest. As of March 31, 2013 and December 31, 2012, we were accruing interest on all loan participation interest – related parties, notes receivable and notes receivable – related parties.
Commitment fee income and commitment fee income – related parties represents non-refundable fees charged to borrowers for entering into an obligation that commits us to make or acquire a loan or to satisfy a financial obligation of the borrower when certain conditions are met within a specified time period. When a commitment is considered an integral part of the resulting loan and we believe there is a reasonable expectation that the commitment will be called upon, the commitment fee is recognized as revenue over the life of the resulting loan. As of March 31, 2013 and December 31, 2012, approximately $1.1 million and $970,000, respectively, of unamortized commitment fees are included as an offset of notes receivable. Approximately $237,000 and $263,000 of unamortized commitment fees are included as an offset of notes receivable – related parties as of March 31, 2013 and December 31, 2012, respectively. When we believe it is unlikely that the commitment will be called upon or that the fee is not an integral part of the return of a specific future lending arrangement, the commitment fee is recognized as income when it is earned, based on the specific terms of the commitment. We make a determination of revenue recognition on a case by case basis, due to the unique and varying terms of each commitment.
Acquisition and Origination Fees
We incur acquisition and origination fees, payable to UMTH LD, our asset manager, equal to 3% of the net amount available for investment in secured loans and other real estate assets (“Acquisition and Origination Fees”); provided, however, that we will not incur Acquisition and Origination Fees with respect to any asset level indebtedness we incur. The Acquisition and Origination Fees that we incur will be reduced by the amount of any acquisition and origination fees and expenses paid by borrowers or investment entities to our Advisor or affiliates of our Advisor with respect to our investment. We will not incur any Acquisition and Origination Fees with respect to any participation agreement we enter into with our affiliates or any affiliates of our Advisor for which our Advisor or affiliates of our Advisor have previously received acquisition and origination fees and expenses from such affiliate with respect to the same secured loan or other real estate asset. Acquisition and Origination Fees are amortized into expense on a straight line basis. As of March 31, 2013 and December 31, 2012, approximately $6.8 million and $6.5 million, respectively, of such unamortized Acquisition and Origination Fees are included in notes receivable. Approximately $1.5 million and $1.6 million of unamortized Acquisition and Origination Fees are included in notes receivable – related parties as of March 31, 2013 and December 31, 2012, respectively. As of March 31, 2013 and December 31, 2012, approximately $546,000 and $350,000, respectively, of unamortized Acquisition and Origination Fees are included in loan participation interest – related parties.
Income Taxes
We made an election under Section 856(c) of the Internal Revenue Code of 1986, as amended (the “Internal Revenue Code”), to be taxed as a real estate investment trust (“REIT”), beginning with the taxable year ended December 31, 2010. As a REIT, we generally are not subject to federal income tax on income that we distribute to our shareholders. If we later fail to qualify as a REIT in any taxable year, we will be subject to federal income tax on our taxable income at regular corporate rates and may not be permitted to qualify for treatment as a REIT for federal income tax purposes for four years following the year in which our qualification is denied unless we are entitled to relief under certain statutory provisions. Such an event could materially and adversely affect our net income. However, we intend to continue to operate so as to remain qualified as a REIT for federal income tax purposes.
FASB ASC 740 prescribes a comprehensive model for the financial statement recognition, measurement, presentation and disclosure of uncertain tax positions taken or expected to be taken in income tax returns. In accordance with FASB ASC 740, we must determine whether it is more likely than not that a tax position will be sustained upon examination based on the technical merits of the position. We believe we have no such uncertain positions.
We file income tax returns in the United States federal jurisdiction. At March 31, 2013, tax returns related to fiscal years ended December 31, 2009 through December 31, 2012 remain open to possible examination by the tax authorities. No tax returns are currently under examination by any tax authorities. We did not incur any penalties or interest during the three months ended March 31, 2013 or 2012.
Fair Value of Financial Instruments
In accordance with the reporting requirements of FASB ASC 825-10,Financial Instruments-Fair Value, we calculate the fair value of our assets and liabilities which qualify as financial instruments under this statement and include this additional information in the notes to the consolidated financial statements when the fair value is different than the carrying value of those financial instruments. The estimated fair value of restricted cash, accrued interest receivable, accrued receivable – related parties, accounts payable, accrued liabilities and accrued liabilities – related parties approximates the carrying amounts due to the relatively short maturity of these instruments. The estimated fair value of notes receivable, notes receivable – related parties, loan participation interest – related parties, lines of credit and notes payable approximate the carrying amount since they bear interest at the market rate.
Guarantees
From time to time, we enter into guarantees of debtor’s or affiliates’ borrowings and provide credit enhancements for the benefit of senior lenders in connection with our debtors and investments in partnerships (collectively referred to as “guarantees”), and account for such guarantees in accordance with FASB ASC 460-10Guarantees.
Reclassifications
Certain reclassifications have been made to prior period amounts in order to conform with the current year presentation.
C. Registration Statement
On November 12, 2009, the Trust’s Registration Statement on Form S-11, covering an initial public offering (the “Offering”) of up to 25,000,000 common shares of beneficial interest to be offered in the primary offering at a price of $20 per share (the “Primary Offering”), was declared effective under the Securities Act of 1933, as amended. The Offering also initially covered up to 10,000,000 common shares of beneficial interest to be issued pursuant to our distribution reinvestment plan (the “DRIP”) for $20 per share. We have the right to reallocate the common shares of beneficial interest registered in the Offering between the Primary Offering and the DRIP, and pursuant to Supplement No. 6 to our prospectus regarding the Offering, which was filed with the Securities and Exchange Commission on May 3, 2013, we reallocated the shares being offered to be 34,000,000 shares offered pursuant to the Primary Offering and 1,000,000 shares offered pursuant to the DRIP. The shares are being offered to investors on a reasonable best efforts basis, which means the dealer manager will use its reasonable best efforts to sell the shares offered, but is not required to sell any specific number or dollar amount of shares and does not have a firm commitment or obligation to purchase any of the offered shares. The Offeringwill terminate on or before May 13, 2013.
On October 19, 2012, we filed a Registration Statement on Form S-11 (Registration No. 333-184508) with the Securities and Exchange Commission (the “SEC”) with respect to a proposed follow-on public offering (the “Follow-On Offering”) of up to 20,000,000 common shares of beneficial interest to be offered at a price of $20.00 per share and up to 10,000,000 common shares of beneficial interest to be issued pursuant to our DRIP for $20.00 per share. We have not issued any shares under this registration statement as it has not yet been declared effective by the SEC.
On April 19, 2013, we registered 7,500,000 additionalcommon shares of beneficial interest to be offered pursuant to the DRIP in a Registration Statement on Form S-3 (File No. 333-188045) (the “Secondary DRIP”) for $20 per share. We will stop offeringcommon shares of beneficial interest under the DRIP portion of the Offering upon the termination of the Offering (which is anticipated to be May 13, 2013). Upon the termination of the Offering, we will begin to offer our common shares of beneficial interest to our shareholders pursuant to the Secondary DRIP.
D. Loan and Allowance for Credit Losses
Our aggregate loan portfolio is comprised of loan participation interest – related parties, notes receivable, net and notes receivable – related parties and is recorded at the lower of cost or estimated net realizable value.
| | | March 31, 2013 | | | December 31, 2012 | |
| Loan participation interest – related parties | | $ | 27,436,000 | | | $ | 29,744,000 | |
| Notes receivable, net | | | 273,548,000 | | | | 246,450,000 | |
| Notes receivable – related parties | | | 30,170,000 | | | | 29,350,000 | |
| Total | | $ | 331,154,000 | | | $ | 305,544,000 | |
Our loans are classified as follows:
| | | March 31, 2013 | | | December 31, 2012 | |
| Real Estate: | | | | | | | | |
| Construction, acquisition and land development | | $ | 325,801,000 | | | $ | 300,151,000 | |
| Allowance for loan losses | | | (2,182,000 | ) | | | (1,766,000 | ) |
| Unamortized commitment fees and acquisition and origination fees | | | 7,535,000 | | | | 7,159,000 | |
| Total | | $ | 331,154,000 | | | $ | 305,544,000 | |
As of March 31, 2013, we had originated or purchased 86 loans, including 17 loans that have been repaid in full by the respective borrower. As of December 31, 2012, we had originated or purchased 84 loans, including 16 loans that have been repaid in full by the respective borrower.
The following table represents the scheduled maturity dates of the 69 loans outstanding as of March 31, 2013:
| | | Related Party | | | Non-related party | | | Total | |
Maturity
Date | | Amount | | | Loans | | | % of
Total | | | Amount | | | Loans | | | % of
Total | | | Amount | | | Loans | | | % of
Total | |
| Matured | | $ | - | | | | - | | | | - | | | $ | - | | | | - | | | | - | | | $ | - | | | | - | | | | - | |
| 2013 | | | 9,531,000 | | | | 8 | | | | 17 | % | | | 86,792,000 | | | | 17 | | | | 32 | % | | | 96,323,000 | | | | 25 | | | | 30 | % |
| 2014 | | | 24,695,000 | | | | 6 | | | | 44 | % | | | 120,729,000 | | | | 14 | | | | 45 | % | | | 145,424,000 | | | | 20 | | | | 44 | % |
| 2015 | | | 14,778,000 | | | | 3 | | | | 27 | % | | | 60,373,000 | | | | 18 | | | | 22 | % | | | 75,151,000 | | | | 21 | | | | 23 | % |
| 2016 | | | 6,773,000 | | | | 1 | | | | 12 | % | | | 2,130,000 | | | | 2 | | | | 1 | % | | | 8,903,000 | | | | 3 | | | | 3 | % |
| Total | | $ | 55,777,000 | | | | 18 | | | | 100 | % | | $ | 270,024,000 | | | | 51 | | | | 100 | % | | $ | 325,801,000 | | | | 69 | | | | 100 | % |
The following table represents the scheduled maturity dates of the 68 loans outstanding as of December 31, 2012:
| | | Related Party | | | Non-related party | | | Total | |
Maturity
Date | | Amount | | | Loans | | | % of
Total | | | Amount | | | Loans | | | % of
Total | | | Amount | | | Loans | | | % of
Total | |
| Matured | | $ | - | | | | - | | | | - | | | $ | 160,000 | | | | 1 | | | | * | | | $ | 160,000 | | | | 1 | | | | * | |
| 2013 | | | 34,414,000 | | | | 12 | | | | 60 | % | | | 71,803,000 | | | | 17 | | | | 30 | % | | | 106,217,000 | | | | 29 | | | | 35 | % |
| 2014 | | | 4,000,000 | | | | 2 | | | | 7 | % | | | 118,222,000 | | | | 14 | | | | 49 | % | | | 122,222,000 | | | | 16 | | | | 41 | % |
| 2015 | | | 13,020,000 | | | | 3 | | | | 23 | % | | | 52,523,000 | | | | 18 | | | | 21 | % | | | 65,543,000 | | | | 21 | | | | 22 | % |
| 2016 | | | 6,009,000 | | | | 1 | | | | 10 | % | | | - | | | | - | | | | - | | | | 6,009,000 | | | | 1 | | | | 2 | % |
| Total | | $ | 57,443,000 | | | | 18 | | | | 100 | % | | $ | 242,708,000 | | | | 50 | | | | 100 | % | | $ | 300,151,000 | | | | 68 | | | | 100 | % |
* Less than 1%
As of March 31, 2013, we have no matured loans.
As of December 31, 2012, we had 1 matured loan with an aggregate unpaid principal balance of approximately $160,000. This loan matured in December 2012 and full collectability is considered probable, based on our ongoing review of the credit quality of our loan portfolio, discussed in further detail below. In March 2013, we amended this loan, resulting in a new maturity date of June 30, 2013.In determining whether to modify this loan, we evaluated the economic conditions, the estimated value and performance of the underlying collateral, the guarantor, adverse situations that may affect the borrower’s ability to pay or the value of the collateral and other relevant factors.
The following table describes the loans that were matured as of December 31, 2012, the activity with respect to such loans during the three months ended March 31, 2013 and the loans that matured during the three months ended March 31, 2013 and remained matured as of March 31, 2013:
Maturity
Date | | Amount | | | Loans | | | % of
Total | | | Matured Loan
Extensions
During the
Three Months
Ended March
31, 2013 on
Loans Matured
as of December
31, 2012 (1) | | | Net Activity
During the
Three Months
Ended March
31, 2013 on
Loans
Matured as of
December 31,
2012 (2) | | | Loans
Matured
During the
Three Months
Ended March
31, 2013 (3) | | | Amount | | | Loans | | | % of
Total | |
| | | | |
| | | Non-Related | |
| | | Matured as of December 31, 2012 | | | 2012 Activity (4) | | | Matured as of March 31, 2013 | |
| 2012 | | $ | 160,000 | | | | 1 | | | | 100 | % | | $ | (160,000 | ) | | $ | - | | | $ | - | | | $ | - | | | | - | | | | - | |
| | | | | | | | | | | | | | | | | | | | | | | | | | | | | | | | | | | | | |
| Total | | $ | 160,000 | | | | 1 | | | | 100 | % | | $ | (160,000 | ) | | $ | - | | | $ | - | | | $ | - | | | | - | | | | - | |
| (1) | Amounts represent aggregate unpaid principal balance as of December 31, 2012 of matured loans as of December 31, 2012 that were extended during the three months ended March 31, 2013. |
| (2) | For loans matured as of December 31, 2012, net loan activity represents all activity on the loans during the three months ended March 31, 2013, including accrued interest, payment of fees and expenses, charge-offs and/or repayments. |
| (3) | Amounts represent aggregate unpaid principal balance as of December 31, 2012 of loans that matured during the three months ended March 31, 2013 and remained matured as of March 31, 2013. |
| (4) | The table does not reflect activity for loans that matured or were due to mature during the three months ended March 31, 2013, but were extended on or prior to March 31, 2013. |
A loan is placed on non-accrual status and income recognition is suspended at the date at which, in the opinion of management, a full recovery of income and principal becomes more likely than not, but is no longer probable, based upon our review of economic conditions, the estimated value of the underlying collateral, the guarantor, adverse situations that may affect the borrower’s ability to pay or the value of the collateral and other relevant factors. Income recognition is resumed when the loan becomes contractually current and performance is demonstrated to be resumed. Any payments received on loans classified as non-accrual status are typically applied first to outstanding loan amounts and then to the recovery of lost interest. As of March 31, 2013 and December 31, 2012, we have not placed any loans on non-accrual status.
Loans are considered impaired when, based on current information and events, it is probable that we will be unable to collect all amounts due in accordance with the contractual terms of the loan agreement, including scheduled principal and interest payments. Impairment is generally evaluated on an individual loan basis for each loan in the portfolio. If an individual loan is considered impaired, a specific valuation allowance may be allocated, if necessary, so that the individual loan is reported net, at the present value of estimated future cash flows using the loan’s existing rate or at the fair value of collateral if repayment is expected solely from collateral. Loans that are not individually considered impaired are collectively and qualitatively measured as a portfolio for general valuation allowance. In reviewing our portfolio for this valuation analysis, we use cash flow estimates from the disposition of finished lots, paper lots (residential lots shown on a plat that has been accepted by the city or county, but which is currently undeveloped or under development) and undeveloped land as well as cash flow received from the issuance of bonds from municipal reimbursement districts. These estimates are based on current market metrics, including, without limitation, the supply of finished lots, paper lots and undeveloped land, the supply of homes and the rate and price at which land and homes are sold, historic levels and trends, executed contracts, appraisals and discussions with third party market analysts and participants, including homebuilders. We base our valuations on current and historic market trends on our analysis of market events and conditions, including activity within our portfolio, as well as the analysis of third-party services such as Metrostudy and Residential Strategies, Inc. Cash flow forecasts also are based on executed purchase contracts which provide base prices, escalation rates, and absorption rates on an individual project basis. For projects deemed to have an extended time horizon for disposition, we consider third-party appraisals to provide a valuation in accordance with guidelines set forth in the Uniform Standards of Professional Appraisal Practice. In addition to cash flows from the disposition of property, cost analysis is performed based on estimates of development and senior financing expenditures provided by developers and independent professionals on a project-by-project basis. These amounts are reconciled with our best estimates to establish the net realizable value of the portfolio.
Interest is recognized on an accrual basis for impaired loans in which the collectability of the unpaid principal amount is deemed probable. Any payments received on such loans are first applied to outstanding accrued interest receivable and then to outstanding unpaid principal balance. Unpaid principal balance is materially the same as recorded investments. Any payments received on impaired loans in which the collectability of the unpaid principal amount is less than probable are typically applied to outstanding unpaid principal and then to the recovery of lost interest on a cash basis. Impaired loans, or portions thereof, are charged off when deemed uncollectible.
As of March 31, 2013, we have no matured loans.
As of December 31, 2012, we had 1 matured loan with an aggregate unpaid principal balance of approximately $160,000. This loan matured in December 2012 and full collectability is considered probable, based on our ongoing review of the credit quality of our loan portfolio, discussed in further detail below. This loan is not considered impaired as we amended this loan in March 2013, resulting in a new maturity date of June 30, 2013.
For the three months ended March 31, 2013, we did not have any impaired loans and we did not recognize any interest income associated with impaired loans. For the three months ended March 31, 2013 and 2012, we did not recognize any cash basis interest income related to impaired loans.
As part of the ongoing monitoring of the credit quality of the loan portfolio, we periodically, no less than quarterly, perform a detailed review of our portfolio of mortgage notes and other loans. The following is a general description of the credit levels used:
Level 1 – Full collectability of loans in this category is considered probable.
Level 2 – Full collectability of loans in this category is deemed more likely than not, but not probable, based upon our review of economic conditions, the estimated value of the underlying collateral, the guarantor, adverse situations that may affect the borrower’s ability to pay or the value of the collateral and other relevant factors. Interest income is suspended on Level 2 loans.
Level 3 – For loans in this category, it is probable that we will be unable to collect all amounts due.
As of the dates indicated, our loans were classified as follows:
| | | March 31, 2013 | | | December 31, 2012 | |
| Level 1 | | $ | 325,801,000 | | | $ | 300,151,000 | |
| Level 2 | | | - | | | | - | |
| Level 3 | | | - | | | | - | |
| Total | | $ | 325,801,000 | | | $ | 300,151,000 | |
The allowance for loan losses is our estimate of incurred losses in our portfolio of notes receivable, notes receivable – related parties and loan participation interest – related parties. We periodically perform a detailed review of our portfolio of notes and other loans to determine if impairment has occurred and to assess the adequacy of the allowance for loan losses. We charge additions to the allowance for loan losses to current period earnings through a provision for loan losses. Amounts determined to be uncollectible are charged directly against (and decrease) the allowance for loan losses (“charged off”), while amounts recovered on previously charged off amounts increase the allowance for loan losses. The following table summarizes the change in the reserve for loan losses during the three months ended March 31, 2013 and the year ended December 31, 2012, which is offset against notes receivable:
| | | For the Three Months
Ended March 31, 2013 | | | For the Year Ended
December 31, 2012 | |
| Balance, beginning of year | | $ | 1,766,000 | | | $ | 675,000 | |
| Provision for loan losses | | | 416,000 | | | | 1,091,000 | |
| Charge-offs | | | - | | | | - | |
| Balance, end of period | | $ | 2,182,000 | | | $ | 1,766,000 | |
We have adopted the provisions of ASU No. 2011-02,A Creditor’s Determination of Whether a Restructuring Is a Troubled Debt Restructuring.In accordance with ASU 2011-02, the restructuring of a loan is considered a “troubled debt restructuring” if both (i) the borrower is experiencing financial difficulties and (ii) the creditor has granted a concession. Concessions may include interest rate reductions or below market interest rates, principal forgiveness, restructuring amortization schedules and other actions intended to minimize potential losses. As of March 31, 2013 and December 31, 2012, we have no loan modifications that are classified as troubled debt restructurings.
E. Shareholders’ Equity
On December 18, 2009, the Trust’s initial public subscribers were accepted as shareholders pursuant to the Offering and the subscription proceeds from such initial public subscribers were released to the Trust from escrow.
As of March 31, 2013, the Trust had issued an aggregate of 20,687,672 common shares of beneficial interest pursuant to the Primary Offering and DRIP, consisting of 20,012,671 common shares of beneficial interest pursuant to the Primary Offering in exchange for gross proceeds of approximately $400.2 million (approximately $348.3 million, net of costs associated with the Primary Offering) and 675,001 common shares of beneficial interest in accordance with our DRIP in exchange for gross proceeds of approximately $13.5 million. As of March 31, 2013, the Trust had redeemed an aggregate of 155,297 common shares of beneficial interest at a cost of approximately $3.0 million.
As of December 31, 2012, the Trust had issued an aggregate of 17,624,839 common shares of beneficial interest pursuant to the Primary Offering and DRIP, consisting of 17,089,857 common shares of beneficial interest pursuant to the Primary Offering in exchange for gross proceeds of approximately $341.8 million (approximately $297.4 million, net of costs associated with the Primary Offering) and 534,982 common shares of beneficial interest in accordance with our DRIP in exchange for gross proceeds of approximately $10.7 million. As of December 31, 2012, the Trust had redeemed an aggregate of 124,531 common shares of beneficial interest at a cost of approximately $2.4 million.
We must distribute to our shareholders at least 90% of our taxable income each year in order to meet the requirements for being treated as a REIT under the Internal Revenue Code. In accordance with this requirement, we pay monthly distributions to our shareholders. Our distribution rate is determined quarterly by our board of trustees and is dependent on a number of factors, including funds available for payment of distributions, our financial condition, loan funding commitments and annual distribution requirements needed to maintain our status as a REIT under the Internal Revenue Code. In addition to the monthly distributions, in an effort to ensure we distribute at least 90% of our taxable income, our board of trustees has periodically authorized additional, special distributions. All distributions are paid in cash and DRIP shares.
Our board of trustees has authorized distributions for our shareholders of record as of the close of business on each day for the period commencing on December 18, 2009 and ending on June 30, 2013. For distributions declared for each record date in the December 2009 through June 2011 periods, our distribution rate was $0.0043836 per common share of beneficial interest, which is equal to an annualized distribution rate of 8.0%, assuming a purchase price of $20.00 per share. For distributions declared for each record date in the July 2011 through June 2013 periods, our distribution rate is $0.0044932 per common share of beneficial interest, which is equal to an annualized distribution rate of 8.2%, assuming a purchase price of $20.00 per share. These distributions are aggregated and paid monthly in arrears. Distributions are paid on or about the 25th day of the respective month. Distributions for shareholders participating in our DRIP are reinvested into our shares on the payment date of each distribution.
In addition to the distributions discussed above, the following table represents all special distributions authorized by our board of trustees through March 31, 2013:
| Authorization Date (1) | | Record Date (2) | | Rate (3) | | | Pay Date (4) |
| September 8, 2010 | | September 15, 2010 | | $ | 0.05 | | | October 15, 2010 |
| September 8, 2010 | | December 15, 2010 | | $ | 0.15 | | | February 1, 2011 |
| March 10, 2011 | | April 30, 2011 | | $ | 0.10 | | | May 17, 2011 |
| June 27, 2011 | | August 31, 2011 | | $ | 0.05 | | | September 13, 2011 |
| March 1, 2012 | | April 30, 2012 | | $ | 0.05 | | | May 18, 2012 |
| August 15, 2012 | | October 1, 2012 | | $ | 0.05 | | | October 19, 2012 |
| October 10, 2012 | | December 14, 2012 | | $ | 0.05 | | | February 15, 2013 |
| March 6, 2013 | | April 15, 2013 | | $ | 0.05 | | | May 17, 2013 |
| (1) | Represents the date the distribution was authorized by our board of trustees. |
| (2) | All outstanding common shares of beneficial interest as of the record date receive the distribution. |
| (3) | Represents the distribution rate per common share of beneficial interest on the record date. |
| (4) | Represents the date the special distribution was paid or will be paid in cash and DRIP shares. |
As of March 31, 2013, we have made the following distributions to our shareholders in 2013:
| Period Ended | | Date Paid | | Distribution
Amount | |
| December 31, 2012 | | January 16, 2013 | | $ | 2,385,000 | |
| December 14, 2012 | | February 15, 2013 | | | 856,000 | |
| January 31, 2013 | | February 22, 2013 | | | 2,494,000 | |
| February 28, 2013 | | March 22, 2013 | | | 2,353,000 | |
| | | | | $ | 8,088,000 | |
For the three months ended March 31, 2013, we paid distributions of approximately $8.1 million ($5.3 million in cash and $2.8 million in our common shares of beneficial interest pursuant to our DRIP), as compared to cash flows provided by operations of approximately $3.7 million. From May 28, 2008 (Date of Inception) through March 31, 2013, we paid cumulative distributions of approximately $37.5 million. As of March 31, 2013, we had approximately $1.8 million of cash distributions declared that were paid subsequent to period end.
The approximate distributions paid during the three months ended March 31, 2013 and 2012, along with the approximate amount of distributions reinvested pursuant to our DRIP and the sources of our distributions were as follows:
| | | Three months ended March 31, | |
| | | 2013 | | | 2012 | |
| Distributions paid in cash | | $ | 5,300,000 | | | | | | | $ | 1,900,000 | | | | | |
| Distributions reinvested | | | 2,800,000 | | | | | | | | 1,200,000 | | | | | |
| Total distributions | | $ | 8,100,000 | | | | | | | $ | 3,100,000 | | | | | |
| Source of distributions: | | | | | | | | | | | | | | | | |
| Cash from operations | | $ | 3,700,000 | | | | 46 | % | | $ | 1,100,000 | | | | 35 | % |
| Borrowings under credit facilities | | | 4,400,000 | | | | 54 | % | | | 2,000,000 | | | | 65 | % |
| Total sources | | $ | 8,100,000 | | | | 100 | % | | $ | 3,100,000 | | | | 100 | % |
In our initial quarters of operations, and from time to time thereafter, we did not generate enough cash flow to fully fund distributions declared. Therefore, some or all of our distributions are paid from sources other than operating cash flow, such as borrowings (including borrowings secured by our assets) in anticipation of future operating cash flow. Distributions in excess of our operating cash flows have been funded via financing activities, specifically borrowings under our credit facilities, consistent with our intent to use our credit facilities to meet our investment and distribution cash requirements throughout our initial period of operations.
We utilize cash to fund operating expenses, make investments, service debt obligations and pay distributions. We receive cash from operations (which includes interest payments) as well as cash from investing activities (which includes repayment of principal on loans we have made) and financing activities (which includes borrowing proceeds and additional capital from the sale of our shares). We have secured a note payable and lines of credit to manage the timing of our cash receipts and funding requirements. Over the long term, as additional subscriptions for common shares are received and proceeds from such subscriptions are invested in revenue-generating real estate investments, we expect that substantially all of our distributions will be funded from operating cash flow. Further, we believe operating income will improve in future periods as start-up costs and general and administrative expenses are borne over a larger investment portfolio.
F. Share Redemption Program
We have adopted a share redemption program that enables our shareholders to sell their shares back to us in limited circumstances. Generally, this program permits shareholders to sell their shares back to us after they have held them for at least one year.Except for redemptions upon the death of a shareholder (in which case we may waive the minimum holding periods), the purchase price for the redeemed shares, for the period beginning after a shareholder has held the shares for a period of one year, will be (1) 92% of the purchase price actually paid for any shares held less than two years, (2) 94% of the purchase price actually paid for any shares held for at least two years but less than three years, (3) 96% of the purchase price actually paid for any shares held at least three years but less than four years, (4) 98% of the purchase price actually paid for any shares held at least four years but less than five years and (5) for any shares held at least five years, the lesser of the purchase price actually paid or the then-current fair market value of the shares as determined by the most recent annual valuation of our shares. The purchase price for shares redeemed upon the death of a shareholder will be the lesser of (1) the purchase price the shareholder actually paid for the shares or (2) $20.00 per share.
We reserve the right in our sole discretion at any time and from time to time to (1) waive the one-year holding period in the event of the death or bankruptcy of a shareholder or other exigent circumstances, (2) reject any request for redemption, (3) change the purchase price for redemptions, or (4) terminate, suspend and/or reestablish our share redemption program. In respect of shares redeemed upon the death of a shareholder, we will not redeem in excess of 1% of the weighted average number of shares outstanding during the twelve-month period immediately prior to the date of redemption, and the total number of shares we may redeem at any time will not exceed 5% of the weighted average number of shares outstanding during the trailing twelve-month period prior to the redemption date. Our board of trustees will determine from time to time whether we have sufficient excess cash from operations to repurchase shares. Generally, the cash available for redemption will be limited to 1% of the operating cash flow from the previous fiscal year, plus any net proceeds from our DRIP.
The Trust complies with the Distinguishing Liabilities from Equity topic of the FASB Accounting Standards Codification, which requires, among other things, that financial instruments that represent a mandatory obligation of the Trust to repurchase shares be classified as liabilities and reported at settlement value. We believe that shares tendered for redemption by the shareholder under the Trust’s share redemption program do not represent a mandatory obligation until such redemptions are approved at our discretion. At such time, we will reclassify such obligations from equity to an accrued liability based upon their respective settlement values. As of December 31, 2012, we did not have any approved redemption requests included in our liabilities.
The following table summarizes the redemption activity for the three months ended March 31, 2013 and the year ended December 31, 2012. The amounts presented are in total shares:
| | | March 31, 2013 | | | December 31, 2012 | |
| Balance, beginning of year | | | - | | | | - | |
| Redemption requests received | | | 30,766 | | | | 96,016 | |
| Shares redeemed | | | (30,766 | ) | | | (96,016 | ) |
| Balance, end of period | | | - | | | | - | |
Shares redeemed are included in treasury stock in the consolidated balance sheet.
G. Organizational and Offering Compensation
Various parties receive compensation as a result of the Offering, including the Advisor, affiliates of the Advisor, the dealer manager and soliciting dealers. The Advisor or an affiliate of the Advisor funds organization and offering costs on the Trust’s behalf and our Advisor will be paid by the Trust for such costs in an amount equal to 3% of the gross offering proceeds raised by the Trust in the Offering (the “O&O Reimbursement”) less any offering costs paid by the Trust directly (except that no organization and offering expenses will be reimbursed with respect to sales under the DRIP). Payments to the dealer manager include selling commissions (6.5% of gross offering proceeds, except that no commissions are paid with respect to sales under the DRIP) and dealer manager fees (up to 3.5% of gross offering proceeds, except that no dealer manager fees are paid with respect to sales under the DRIP).
H. Operational Compensation
The Advisor or its affiliates will receive Acquisition and Origination Fees as described in Note B. Acquisition and Origination Fees will not be paid with respect to any asset level indebtedness the Trust incurs. Acquisition and Origination Fees incurred by the Trust will be reduced by the amount of any acquisition and origination fees and expenses paid by borrowers or investment entities to the Advisor or affiliates of the Advisor with respect to the investment. The Trust will not incur any Acquisition and Origination Fees with respect to any participation agreement the Trust enters into with its affiliates or any affiliates of the Advisor for which the Advisor or affiliates of the Advisor previously has received acquisition and origination fees and expenses from such affiliate with respect to the same secured loan or other real estate asset.
The Advisor will receive advisory fees of 2% per annum of the average of invested assets (“Advisory Fees”), including secured loan assets; provided, however, that no Advisory Fees will be paid with respect to any asset level indebtedness the Trust incurs. The fee will be payable monthly in an amount equal to one-twelfth of 2% of the Trust’s average invested assets, including secured loan assets, as of the last day of the immediately preceding month.
The Advisor will receive 1% of the amount made available to the Trust pursuant to the origination of any line of credit or other debt financing, provided that the Advisor has provided a substantial amount of services as determined by the Trust’s independent trustees and, on each anniversary date of the origination of any such line of credit or other debt financing, an additional fee of 0.25% of the primary loan amount (collectively, “Debt Financing Fees”) will be paid if such line of credit or other debt financing continues to be outstanding on such date, or a prorated portion of such additional fee will be paid for the portion of such year that the financing was outstanding.
The Trust will reimburse the expenses incurred by the Advisor in connection with its provision of services to the Trust (the “Advisor Expense Reimbursement”), including the Trust’s allocable share of the Advisor’s overhead, such as rent, personnel costs, utilities and IT costs. The Trust will not reimburse the Advisor for personnel costs in connection with services for which the Advisor or its affiliates receive other fees.
The Advisor will receive 15% of the amount by which the Trust’s net income for the immediately preceding year exceeds a 10% per annum return on aggregate capital contributions, as adjusted to reflect prior cash distributions to shareholders which constitute a return of capital. This fee will be paid annually and upon termination of the advisory agreement.
I. Disposition/Liquidation Compensation
Upon successful sales by the Trust of securitized loan pool interests, the Advisor will be paid a securitized loan pool placement fee equal to 2% of the net proceeds realized by the Trust, provided the Advisor or an affiliate of the Advisor has provided a substantial amount of services as determined by the Trust’s independent trustees.
For substantial assistance in connection with the sale of properties, the Trust will pay the Advisor or its affiliates disposition fees of the lesser of one-half of the reasonable and customary real estate or brokerage commission or 2% of the contract sales price of each property sold; provided, however, in no event may the disposition fees paid to the Advisor, its affiliates and unaffiliated third parties exceed 6% of the contract sales price. The Trust’s independent trustees will determine whether the Advisor or its affiliate has provided substantial assistance to the Trust in connection with the sale of a property. Substantial assistance in connection with the sale of a property includes the Advisor’s preparation of an investment package for the property (including a new investment analysis, rent rolls, tenant information regarding credit, a property title report, an environmental report, a structural report and exhibits) or such other substantial services performed by the Advisor in connection with a sale.
Upon listing the Trust’s common shares of beneficial interest on a national securities exchange, the Advisor will be entitled to a fee equal to 15% of the amount, if any, by which (1) the market value of the Trust’s outstanding shares plus distributions paid by the Trust prior to listing, exceeds (2) the sum of the total amount of capital raised from investors and the amount of cash flow necessary to generate a 10% annual cumulative, non-compounded return to investors.
J. Notes Payable
Credit Facility
On February 5, 2010, during the credit crisis in which financial institutions severely reduced the number of loans made to entities involved in real estate, we obtained a revolving credit facility in the maximum principal amount of $8.0 million (the “Credit Facility”) from Raley Holdings, LLC, an unaffiliated company (“Raley Holdings”). The interest rate on the Credit Facility is equal to 8.5% per annum. Accrued interest on the outstanding principal amount of the Credit Facility is payable monthly. Effective August 10, 2010, the Credit Facility was amended to increase the maximum principal amount to $20.0 million, pursuant to the First Amendment to Secured Line of Credit Promissory Note between us and Raley Holdings. On February 5, 2011, we entered into the Extension Agreement with Raley Holdings, resulting in an extension of the maturity date associated with the Credit Facility to February 5, 2012. On February 5, 2012, we entered into the Second Extension Agreement with Raley Holdings, resulting in an extension of the maturity date associated with our Credit Facility to February 5, 2013. Effective February 5, 2013, we executed the Third Extension Agreement with Raley Holdings that further extended the maturity date of the Credit Facility to February 5, 2014. The Credit Facility is secured by a first priority collateral assignment and lien on certain of our assets.
Raley Holdings may, in its discretion, decide to advance additional principal to us under the Credit Facility. Raley Holdings may require us to provide additional collateral as a condition of funding additional advances of principal under the Credit Facility. From time to time, we may request Raley Holdings to release collateral, and Raley Holdings may require a release price to be paid as a condition of granting its release of collateral.
In connection with this Credit Facility, we have agreed to pay Debt Financing Fees to UMTH GS. See Note N - Related Party Transactions, for further discussion of fees paid to related parties.
As of March 31, 2013 and December 31, 2012, $4.3million and $5.1 million, respectively, in principal was outstanding under the Credit Facility. Interest expense associated with the Credit Facility was approximately $98,000 and $162,000 for the three months ended March 31, 2013 and 2012, respectively.
K. Lines of Credit
UDF IV HF CTB LOC
On May 19, 2010, UDF IV HF entered into a $6.0 million revolving line of credit (the “UDF IV HF CTB LOC”) with Community Trust Bank (“CTB”). The UDF IV HF CTB LOC bears interest at prime plus 1%, subject to a floor of 5.5% (5.5% at March 31, 2013), and requires monthly interest payments. Advances under the line may be made from time to time through May 2013. Proceeds from the line of credit will be used to fund our obligations under our interim home construction loan agreements. Advances are subject to a borrowing base and are secured by a first priority collateral assignment and lien on certain mortgage notes and construction loans held by UDF IV HF. Principal and all unpaid interest will be due at maturity, which is February 19, 2014. The UDF IV HF CTB LOC is guaranteed by us and by United Development Funding III, L.P. (“UDF III”), an affiliated and publicly registered Delaware limited partnership. UMTH LD, our asset manager, is the general partner for UDF III.
In connection with this line of credit, UDF IV HF agreed to pay an origination fee of $60,000 to CTB. In addition, UDF IV HF agreed to pay Debt Financing Fees to UMTH GS associated with the UDF IV HF CTB LOC and, in consideration of UDF III guaranteeing the line of credit, UDF IV HF agreed to pay UDF III an annual credit enhancement fee equal to 1% of the line of credit amount. See Note N – Related Party Transactions, for further discussion of fees paid to related parties.
The outstanding balance on the line of credit was approximately $6.0 million as of both March 31, 2013 and December 31, 2012. Interest expense associated with the UDF IV HF CTB LOC was approximately $83,000 and $38,000 for the three months ended March 31, 2013 and 2012, respectively.
CTB Revolver
Effective August 19, 2010, UDF IV AC obtained a three-year revolving credit facility in the maximum principal amount of $8.0 million (as amended, the “CTB Revolver”) from CTB pursuant to a Revolving Loan Agreement. Effective April 11, 2013, UDF IV AC entered into the First Amended and Restated Loan Agreement with CTB, pursuant to which CTB increased its commitment under the CTB Revolver from $8.0 million to $15.0 million. See Note P – Subsequent Events for further discussion. The interest rate on the CTB Revolver is equal to the greater of prime plus 1% or 5.5% per annum (5.5% at March 31, 2013). Accrued interest on the outstanding principal amount of the CTB Revolver is payable monthly. The CTB Revolver matures and becomes due and payable in full on August 19, 2013. The CTB Revolver is secured by a first priority collateral assignment and lien on the loans purchased or held by UDF IV AC, and by a first lien security interest in all of UDF IV AC’s assets. The CTB Revolver is guaranteed by us and by UDF III.
UDF IV AC’s eligibility to borrow up to $8.0 million under the CTB Revolver is determined pursuant to a defined borrowing base. The CTB Revolver requires UDF IV AC and the guarantors to make various representations to the bank and to comply with various covenants and agreements, including but not limited to, minimum net worth requirements and defined leverage ratios.
In connection with the CTB Revolver, UDF IV AC agreed to pay an origination fee of $80,000 to CTB. In connection with the amendment entered into in April 2013, UDF IV AC agreed to pay an additional origination fee of $70,000 to CTB. In addition, UDF IV AC agreed to pay Debt Financing Fees to UMTH GS in connection with the CTB Revolver and, in consideration for UDF III guaranteeing the CTB Revolver, UDF IV AC agreed to pay UDF III a monthly credit enhancement fee equal to 1/12th of 1% of the outstanding principal balance of the CTB Revolver at the end of each month. See Note N – Related Party Transactions, for further discussion of fees paid to related parties.
As of both March 31, 2013 and December 31, 2012, approximately $8.0 million in principal was outstanding under the CTB Revolver. Interest expense associated with the CTB Revolver was approximately $110,000 and $79,000 for the three months ended March 31, 2013 and 2012, respectively.
UTB Revolver
Effective September 29, 2010, UDF IV FI entered into a $3.4 million revolving line of credit (as amended, the “UTB Revolver”) with United Texas Bank (“UTB”). Pursuant to the First Loan Modification and Extension Agreement, effective August 18, 2011 (the “First UTB Extension Agreement”), UTB increased its commitment under the UTB Revolver to $4.0 million and the maturity date, which was originally September 29, 2011, was extended to September 29, 2012. Pursuant to the Second Loan Modification and Extension Agreement, effective September 29, 2012 (the “Second UTB Extension Agreement”), the maturity date was extended to September 29, 2013. The UTB Revolver bears interest at prime plus 1%, subject to a floor of 5.5% (5.5% at March 31, 2013), and requires monthly interest payments. Advances under the line were made from time to time through September 1, 2012. Proceeds from the UTB Revolver were used to fund our obligations under our land acquisition loans, development loans and finished lot loan agreements. Advances were subject to a borrowing base and are secured by a first priority collateral assignment and lien on certain mortgage notes and construction loans held by UDF IV FI. Principal and all unpaid interest will be due at maturity and is guaranteed by us.
In connection with the UTB Revolver, UDF IV FI agreed to pay an origination fee of $34,000 to UTB. Pursuant to the First UTB Extension Agreement, UDF IV FI incurred an additional origination fee of $23,000 payable to UTB. Pursuant to the Second UTB Extension Agreement, UDF IV FI incurred an additional origination fee of $20,000 payable to UTB. In addition, UDF IV FI agreed to pay Debt Financing Fees to UMTH GS in connection with the UTB Revolver. See Note N – Related Party Transactions, for further discussion of fees paid to related parties.
As of both March 31, 2013 and December 31, 2012, $3.8 million in principal was outstanding under the UTB Revolver. Interest expense associated with the UTB Revolver was approximately $51,000 and $56,000 for the three months ended March 31, 2013 and 2012, respectively.
F&M Loan
On December 14, 2010, UDF IV FII obtained a revolving credit facility from F&M Bank and Trust Company (“F&M”) in the maximum principal amount of $5.0 million pursuant to a loan agreement (as amended, the “F&M Loan”). Pursuant to the First Amendment to the F&M Loan, F&M increased its commitment to $7.5 million, effective September 1, 2011. The interest rate on the F&M Loan is equal to the greater of prime plus 1.5% or 5.0% per annum (5.0% at March 31, 2013). Accrued interest on the outstanding principal amount of the F&M Loan is payable monthly. The F&M Loan was scheduled to mature and become due and payable in full on December 14, 2012. Pursuant to the Amended and Restated Loan Agreement entered into on December 4, 2012, F&M increased its commitment associated with the F&M Loan to $10.0 million and the maturity date of the F&M Loan was extended to December 14, 2014. The F&M Loan is secured by a first priority collateral assignment and lien on certain mortgage notes and construction loans originated by UDF IV FII. The F&M Loan is guaranteed by us and by UDF III.
UDF IV FII’s eligibility to borrow up to $10.0 million under the F&M Loan is determined pursuant to a defined borrowing base. The F&M Loan requires UDF IV FII and the guarantors to make various representations to the bank and to comply with various covenants and agreements, including but not limited to, minimum net worth requirements and defined leverage ratios.
In connection with the F&M Loan, UDF IV FII agreed to pay an origination fee of $50,000 to F&M. Pursuant to the First Amendment to the F&M Loan, UDF IV FII agreed to pay an additional origination fee of $25,000 to F&M. Pursuant to the Amended and Restated Loan Agreement, UDF IV FII agreed to pay an additional origination fee of $25,000 and a renewal fee of approximately $38,000 to F&M. In addition, UDF IV FII agreed to pay Debt Financing Fees to UMTH GS in connection with the F&M Loan and, in consideration for UDF III guaranteeing the F&M Loan, UDF IV FII agreed to pay UDF III a monthly credit enhancement fee equal to 1/12th of 1% of the outstanding principal balance of the F&M Loan at the end of each month. See Note N - Related Party Transactions, for further discussion of fees paid to related parties.
As of both March 31, 2013 and December 31, 2012, approximately $5.7 million in principal was outstanding under the F&M Loan. Interest expense associated with the F&M Loan was approximately $71,000 for both the three months ended March 31, 2013 and 2012.
Legacy Revolver
Effective November 1, 2011, UDF IV FIII obtained a credit facility in the maximum principal amount of $5.0 million (the “Legacy Revolver”) from LegacyTexas Bank (“Legacy”) pursuant to a loan agreement. As amended, the interest rate on the Legacy Revolver is equal to the greater of prime plus 1% or 5.5% per annum (5.5% at March 31, 2013), provided that the interest rate associated with advances related to development loans is 5.875% until substantial completion of the development project. Accrued interest on the outstanding principal amount of the Legacy Revolver is payable monthly. Pursuant to the Loan Renewal, Extension and Modification Agreement entered into in October 2012, the maturity date of the Legacy Revolver, which was originally October 12, 2012, was extended to January 12, 2013.Pursuant to the Loan Renewal, Extension and Modification Agreement entered into in January 2013, the maturity date of the Legacy Revolver was extended to January 12, 2015.Proceeds from the Legacy Revolver will be used to fund our obligations under certain eligible finished lot, construction and development loans that are approved in advance by Legacy. The Legacy Revolver is secured by a first priority collateral assignment and lien on certain mortgage notes and construction loans held by UDF IV FIII. The Legacy Revolver is guaranteed by us.
In connection with the Legacy Revolver, UDF IV FIII agreed to pay an origination fee of $50,000 to Legacy and in connection with the extension entered into in January 2013, UDF IV FIII agreed to pay an additional $50,000 renewal fee to Legacy. In addition, UDF IV FIII agreed to pay Debt Financing Fees to UMTH GS in connection with the Legacy Revolver. See Note N – Related Party Transactions, for further discussion of fees paid to related parties.
As of March 31, 2013 and December 31, 2012, approximately $99,000 and $142,000, respectively, in principal was outstanding under the Legacy Revolver. Interest expense associated with the Legacy Revolver was approximately $2,000 and $13,000 for the three months ended March 31, 2013 and 2012, respectively.
Veritex Revolver
On July 31, 2012, UDF IV Fin IV obtained a revolving credit facility from Veritex Community Bank, National Association (“Veritex”) in the maximum principal amount of $5.3 million pursuant to a loan agreement (the “Veritex Revolver”). The interest rate under the Veritex Revolver is equal to the greater of prime plus 1.5% or 5.0% per annum (5.0% at March 31, 2013). Accrued interest on the outstanding principal amount of the Veritex Revolver is payable monthly. The Veritex Revolver matures and becomes due and payable in full on July 31, 2015. The Veritex Revolver is secured by a first priority collateral assignment and lien on certain finished lot loans funded by UDF IV Fin IV and is guaranteed by us.
In connection with the Veritex Revolver, UDF IV Fin IV agreed to pay an origination fee of $53,000 to Veritex. In addition, UDF IV Fin IV agreed to pay Debt Financing Fees to UMTH GS in connection with the Veritex Revolver. See Note N – Related Party Transactions, for further discussion of fees paid to related parties.
As of March 31, 2013 and December 31, 2012 approximately $4.5 million and $5.0 million, respectively, in principal was outstanding under the Veritex Revolver. Interest expense associated with the Veritex Revolver was approximately $59,000 for the three months ended March 31, 2013.
L. Commitments and Contingencies
Litigation
In the ordinary course of business, the Trust may become subject to litigation or claims. There are no material pending or threatened legal proceedings known to be contemplated against the Trust.
Off-Balance Sheet Arrangements
From time to time, we enter into guarantees of debtor’s borrowings and provide credit enhancements for the benefit of senior lenders in connection with our debtors and investments in partnerships (collectively referred to as “guarantees”), and account for such guarantees in accordance with FASB ASC 460-10,Guarantees. Guarantees generally have fixed expiration dates or other termination clauses and may require payment of a fee by the debtor. A guarantee involves, to varying degrees, elements of credit risk in excess of the amount recognized in the consolidated balance sheets. Our exposure to credit loss in the event of non-performance by the other party to the instrument is represented by the contractual notional amount of the guarantee.
In connection with the funding of some of our organization costs, on June 26, 2009, UMTH LD entered into a $6.3 million line of credit (as amended, the “UMTH LD CTB LOC”) with CTB. Effective February 26, 2012, UMTH LD entered into a second loan modification agreement with CTB, which resulted in an extension of the maturity date on the UMTH LD CTB LOC to December 26, 2014. UMTH LD has a receivable from our Advisor for organization costs funded by UMTH LD on behalf of the Trust and such costs are repaid by our Advisor to UMTH LD as our Advisor receives the O&O Reimbursement discussed in Note G. UMTH LD has assigned this receivable to the bank as security for the UMTH LD CTB LOC. As a condition to the modification entered into in February 2012, the Trust agreed to guaranty all obligations under the UMTH LD CTB LOC. As of March 31, 2013 and December 31, 2012, the outstanding balance on the line of credit was $6.0 million and $6.2 million, respectively.
Effective December 30, 2011, we entered into a Guaranty of Payment and Guaranty of Completion (collectively, the “Stoneleigh Guaranty”) for the benefit of Babson Mezzanine Realty Investors II, L.P. (“Babson”) as agent for a group of lenders pursuant to which we guaranteed all amounts due associated with a $25.0 million construction loan agreement (the “Stoneleigh Construction Loan”) entered into between Maple Wolf Stoneleigh, LLC, an affiliated Delaware limited liability company (“Stoneleigh”), and Babson. Pursuant to the Stoneleigh Construction Loan, Babson will provide Stoneleigh with up to approximately $25.0 million to finance the construction associated with a condominium project located in Dallas, Texas.United Development Funding Land Opportunity Fund, L.P., an affiliated Delaware limited partnership (“UDF LOF”), owns a 75% interest in Stoneleigh. Our asset manager, UMTH LD, also serves as the asset manager of UDF LOF. The general partner of our Advisor also serves as the general partner of UMTH LD. UMTH LD controls 100% of the partnership interests of the general partner of UDF LOF. In consideration of us entering into the Stoneleigh Guaranty, we entered into a letter agreement with Stoneleigh which provides for Stoneleigh to pay us a monthly credit enhancement fee equal to 1/12th of 1% of the outstanding principal balance on the Stoneleigh Construction Loan at the end of each month. As of March 31, 2013 and December 31, 2012, approximately $10.1 million and $9.7 million, respectively, was outstanding under the Stoneleigh Construction Loan. For the three months ended March 31, 2013, approximately $29,000 is included in commitment fee income – related parties in connection with the credit enhancement fee associated with the Stoneleigh Construction Loan.
As of March 31, 2013, including the guarantees described above, we had 7 outstanding repayment guarantees with total credit risk to us of approximately $51.9 million, of which approximately $25.2 million had been borrowed against by the debtor. As of December 31, 2012, we had 7 outstanding repayment guarantees with total credit risk to us of approximately $51.9 million, of which approximately $27.5 million had been borrowed against by the debtor.
M. Economic Dependency
Under various agreements, the Trust has engaged or will engage the Advisor and its affiliates to provide certain services that are essential to the Trust, including asset management services, asset acquisition and disposition decisions, the sale of the Trust’s common shares of beneficial interest available for issue, as well as other administrative responsibilities for the Trust. As a result of these relationships, the Trust is dependent upon the Advisor and its affiliates. In the event that these entities were unable to provide the Trust with the respective services, the Trust would be required to find alternative providers of these services.
N. Related Party Transactions
O&O Reimbursement
We pay our Advisor an O&O Reimbursement (as discussed in Note G) for reimbursement of organization and offering expenses funded by our Advisor or its affiliates. For the three months ended March 31, 2013 and the year ended December 31, 2012, we reimbursed our Advisor approximately $1.7 million and $5.9 million, respectively in accordance with the O&O Reimbursement. As of March 31, 2013 and December 31, 2012, approximately $3.0 million and $4.7 million is included in accrued liabilities – related parties in connection with organization and offering costs payable to our Advisor or its affiliates related to the Offering. As of March 31, 2013, we have not reimbursed our Advisor or its affiliates for any organization and offering costs incurred on our behalf with respect to the Follow-On Offering.
Advisory Fees
We incur monthly Advisory Fees, payable to our Advisor, equal to 2% per annum of our average invested assets (as discussed in Note H). For the three months ended March 31, 2013 and 2012, approximately $1.6 million and $775,000, respectively, is included in advisory fee – related party expense for Advisory Fees payable to our Advisor. As of March 31, 2013 and December 31, 2012, approximately $582,000 and $499,000, respectively, is included in accrued liabilities – related parties associated with Advisory Fees payable to our Advisor.
Acquisition and Origination Fees
We incur Acquisition and Origination Fees equal to 3% of the net amount available for investment in secured loans and other real estate assets (as discussed in Note B and Note H); provided, however, that no such fees will be paid with respect to any asset level indebtedness we incur. The fees are further reduced by the amount of any acquisition and origination expenses paid by borrowers or investment entities to our Advisor or affiliates of our Advisor with respect to our investment. Such costs are amortized into expense on a straight line basis and are payable to UMTH LD, our asset manager. The general partner of our Advisor is also the general partner of UMTH LD. For the three months ended March 31, 2013 and 2012, approximately $372,000 and $165,000, respectively, is included in general and administrative – related parties expense for amortization associated with Acquisition and Origination Fees payable to UMTH LD. As of March 31, 2013 and December 31, 2012, approximately $171,000 and $868,000, respectively, is included in accrued liabilities – related parties associated with Acquisition and Origination Fees payable to UMTH LD.
Debt Financing Fees
Pursuant to the origination of any line of credit or other debt financing, we pay our Advisor Debt Financing Fees, as discussed in Note H.These Debt Financing Fees are expensed on a straight line basis over the life of the financing arrangement.
For the three months ended March 31, 2013 and 2012, approximately $7,000 and $5,000, respectively, is included in general and administrative – related parties expense for amortization associated with Debt Financing Fees paid to our Advisor in connection with the UDF IV HF CTB LOC.
For the three months ended March 31, 2013 and 2012, approximately $4,000 and $6,000, respectively, is included in general and administrative – related parties expense for amortization associated with Debt Financing Fees paid to our Advisor in connection with the Credit Facility.
For the three months ended March 31, 2013 and 2012, approximately $5,000 and $16,000, respectively, is included in general and administrative – related parties expense for amortization associated with Debt Financing Fees paid to our Advisor in connection with the F&M Loan.
For the three months ended March 31, 2013 and 2012, approximately $14,000 and $9,000, respectively, is included in general and administrative – related parties expense for amortization associated with Debt Financing Fees paid to our Advisor in connection with the CTB Revolver.
For the three months ended March 31, 2013 and 2012, approximately $2,000 and $4,000, respectively, is included in general and administrative – related parties expense for amortization associated with Debt Financing Fees paid to our Advisor in connection with the UTB Revolver.
For the three months ended March 31, 2013 and 2012, approximately $4,000 and $13,000, respectively, is included in general and administrative – related parties expense for amortization associated with Debt Financing Fees paid to our Advisor in connection with the Legacy Revolver.
For the three months ended March 31, 2013, approximately $5,000 is included in general and administrative – related parties expense for amortization associated with Debt Financing Fees paid to our Advisor in connection with the Veritex Revolver.
As of March 31, 2013, no unpaid Debt Financing Fees are included in accrued liabilities – related parties. As of December 31, 2012, approximately 44,000 is included in accrued liabilities – related parties associated with unpaid Debt Financing Fees.
Credit Enhancement Fees
We and our wholly-owned subsidiaries will occasionally enter into financing arrangements that require guarantees from entities affiliated with us. These guarantees require us to pay fees (“Credit Enhancement Fees”) to our affiliated entities as consideration for their guarantees. These Credit Enhancement Fees are either expensed as incurred or prepaid and amortized, based on the terms of the guarantee agreements.
In consideration of UDF III guaranteeing the UDF IV HF CTB LOC entered into in May 2010 and discussed in Note K, UDF IV HF agreed to pay UDF III an annual credit enhancement fee equal to 1% of the line of credit amount. The general partner of our Advisor is also the general partner of UMTH LD, our asset manager. UMTH LD is the general partner of UDF III. UDF III has received an opinion from Jackson Claborn, Inc., an independent advisor, that this credit enhancement is fair and at least as reasonable as a credit enhancement with an unaffiliated entity in similar circumstances. For both the three months ended March 31, 2013 and 2012, approximately $15,000 is included in general and administrative – related parties expense for Credit Enhancement Fees paid to UDF III in connection with its guarantee of the UDF IV HF CTB LOC.
In consideration of UDF III guaranteeing the CTB Revolver entered into in August 2010 and discussed in Note K, UDF IV AC agreed to pay UDF III a monthly credit enhancement fee equal to 1/12th of 1% of the outstanding principal balance of the CTB Revolver at the end of each month. The general partner of our Advisor is also the general partner of UMTH LD, our asset manager. UMTH LD is the general partner of UDF III. UDF III has received an opinion from Jackson Claborn, Inc., an independent advisor, that this credit enhancement is fair and at least as reasonable as a credit enhancement with an unaffiliated entity in similar circumstances. For the three months ended March 31, 2013 and 2012, approximately $20,000 and $14,000, respectively, is included in general and administrative – related parties expense for Credit Enhancement Fees paid to UDF III in connection with its guarantee of the CTB Revolver.
In consideration of UDF III guaranteeing the F&M Loan entered into in December 2010 and discussed in Note K, UDF IV FII agreed to pay UDF III a monthly credit enhancement fee equal to 1/12th of 1% of the outstanding principal balance of the F&M Loan at the end of each month. The general partner of our Advisor is also the general partner of UMTH LD, our asset manager. UMTH LD is the general partner of UDF III. UDF III has received an opinion from Jackson Claborn, Inc., an independent advisor, that this credit enhancement is fair and at least as reasonable as a credit enhancement with an unaffiliated entity in similar circumstances. For the three months ended March 31, 2013 and 2012, approximately $14,000 and $15,000, respectively, is included in general and administrative – related parties expense for Credit Enhancement Fees paid to UDF III in connection with its guarantee of the F&M Loan.
As of March 31, 2013 and December 31, 2012, approximately $11,000 and $11,000, respectively, is included in accrued liabilities – related parties associated with Credit Enhancement Fees payable to our Advisor or its affiliates.
The chart below summarizes the approximate payments to related parties for the three months ended March 31, 2013 and the year ended December 31, 2012:
| | | | | For the Three Months
Ended | | | For the Year Ended | |
| Payee | | Purpose | | March 31, 2013 | | | December 31, 2012 | |
| UMTH GS | | | | | | | | | | | | | | | | | |
| | | O&O Reimbursement | | $ | 1,728,000 | | | | 35 | % | | $ | 5,878,000 | | | 38 | % |
| | | Advisory Fees | | | 1,558,000 | | | | 32 | % | | | 3,924,000 | | | 26 | % |
| | | Debt Financing Fees | | | 55,000 | | | | 1 | % | | | 148,000 | | | 1 | % |
| | | | | | | | | | | | | | | | | | |
| UMTH LD | | | | | | | | | | | | | | | | | |
| | | Acquisition and Origination Fees | | | 1,526,000 | | | | 31 | % | | | 5,155,000 | | | 34 | % |
| | | | | | | | | | | | | | | | | | |
| UDF III | | | | | | | | | | | | | | | | | |
| | | Credit Enhancement Fees | | | 34,000 | | | | 1 | % | | | 115,000 | | | 1 | % |
| | | | | | | | | | | | | | | | | | |
| Total Payments | | | | $ | 4,901,000 | | | | 100 | % | | $ | 15,220,000 | | | 100 | % |
The chart below summarizes the approximate expenses associated with related parties for the three months ended March 31, 2013 and 2012:
| | | For the Three Months Ended March 31, | |
| Purpose | | 2013 | | | 2012 | |
| | | | | | | | | | | | | |
| Advisory Fees | | $ | 1,642,000 | | | | 100 | % | | $ | 775,000 | | | | 100 | % |
| | | | | | | | | | | | | | | | | |
| Total Advisory fee – related party | | $ | 1,642,000 | | | | 100 | % | | $ | 775,000 | | | | 100 | % |
| | | | | | | | | | | | | | | | | |
| Amortization of Debt Financing Fees | | $ | 42,000 | | | | 9 | % | | $ | 52,000 | | | | 20 | % |
| | | | | | | | | | | | | | | | | |
| Amortization of Acquisition and Origination Fees | | | 372,000 | | | | 80 | % | | | 165,000 | | | | 63 | % |
| | | | | | | | | | | | | | | | | |
| Credit Enhancement Fees | | | 49,000 | | | | 11 | % | | | 44,000 | | | | 17 | % |
| | | | | | | | | | | | | | | | | |
| Total General and administrative – related parties | | $ | 463,000 | | | | 100 | % | | $ | 261,000 | | | | 100 | % |
Loan Participation Interest – Related Parties
Buffington Participation Agreements
On December 18, 2009, we entered into two participation agreements (collectively, the “Buffington Participation Agreements”) with UMT Home Finance, LP (“UMTHF”), an affiliated Delaware limited partnership, pursuant to which we purchased a participation interest in UMTHF’s construction loans (the “Construction Loans”) to Buffington Texas Classic Homes, LLC (“Buffington Classic”), an affiliated Texas limited liability company, and Buffington Signature Homes, LLC (“Buffington Signature”), an affiliated Texas limited liability company (collectively, “Buff Homes”). Our Advisor also serves as the advisor for United Mortgage Trust (“UMT”), a Maryland real estate investment trust, which owns 100% of the interests in UMTHF. UMTH LD has a minority limited partnership interest in Buffington Homebuilding Group, Ltd., which is the parent of Buff Homes.
The Construction Loans originally provided Buff Homes, which is a homebuilding group, with residential interim construction financing for the construction of new homes in the greater Austin, Texas area through October 28, 2012. In connection with the maturity of the Construction Loans, the Buffington Participation Agreements originally terminated on October 28, 2012, as well. Pursuant to a letter agreement entered into on October 28, 2012, UMTHF extended the termination date of the Construction Loans to October 28, 2013 and, in connection with this extension, we have extended the Buffington Participation Agreements to October 28, 2013. In determining whether to extend this participation, we evaluated the economic conditions, the estimated value and performance of the underlying collateral, the guarantor, adverse situations that may affect the borrower’s ability to pay or the value of the collateral and other relevant factors.
The Construction Loans are evidenced by promissory notes, are secured by first lien deeds of trust on the homes financed under the Construction Loans, and are guaranteed by the parent company and the principals of Buff Homes. Each loan financed under the Construction Loans matures and becomes due and payable in full upon the earlier of (i) the sale of the home financed under the loan, or (ii) nine months after the loan was originated; provided, that the maturity of each loan may be automatically extended for additional 90-day terms following the original maturity date. For each loan originated to it, Buff Homes is required to pay interest monthly and to repay the principal advanced to it upon the sale of the home or in any event no later than 12 months following the origination of the loan, unless the loan is further extended. The interest rate under the Construction Loans is the lower of 13% or the highest rate allowed by law.
On April 9, 2010, we entered into an Agent – Participant Agreement with UMTHF (the “UMTHF Agent Agreement”). In accordance with the UMTHF Agent Agreement, UMTHF will continue to manage and control the Construction Loans and each participant party has appointed UMTHF as its agent to act on its behalf with respect to all aspects of the Construction Loans, provided that, pursuant to the UMTHF Agent Agreement, we retain approval rights in connection with any material decisions pertaining to the administration and services of the loans and, with respect to any material modification to the loans and in the event that the loans become non-performing, we shall have effective control over the remedies relating to the enforcement of the loans, including ultimate control of the foreclosure process.
Pursuant to the Buffington Participation Agreements, we will participate in the Construction Loans by funding the lending obligations of UMTHF under the Construction Loans up to a maximum amount determined by us at our discretion. The Buffington Participation Agreements give us the right to receive payment from UMTHF of principal and accrued interest relating to amounts funded by us under the Buffington Participation Agreements. The interest rate under the Construction Loans is the lower of 13% or the highest rate allowed by law. Our participation interest is repaid as Buff Homes repays the Construction Loans or as the individual construction loans mature.
A majority of our trustees, including a majority of our independent trustees, who are not otherwise interested in this transaction, approved the Buffington Participation Agreements as being fair and reasonable to us and on terms and conditions not less favorable to us than those available from unaffiliated third parties.
As of March 31, 2013 and December 31, 2012, approximately $4.7 millionand $7.2 million, respectively, is included in loan participation interest – related parties related to the Buffington Participation Agreements. For the three months ended March 31, 2013 and 2012, we recognized approximately $216,000 and $241,000, respectively, of interest income – related parties related to the Buffington Participation Agreements. Approximately $8,000 is included in accrued receivable – related parties as of March 31, 2013 for interest associated with the Buffington Participation Agreements. As of December 31, 2012, there is no accrued interest included in accrued receivable – related parties associated with the Buffington Participation Agreements.
Buffington Lot Participation Agreements
On March 24, 2010, we entered into two Participation Agreements (collectively, the “Buffington Lot Participation Agreements”) with UDF III pursuant to which we purchased a 100% participation interest in UDF III’s lot inventory line of credit loan facilities with Buffington Signature (the “Buffington Signature Line”) and Buffington Classic (the “Buffington Classic Line”) (collectively, the “Lot Inventory Loans”). The general partner of our Advisor is also the general partner of UMTH LD, our asset manager. UMTH LD is the general partner of UDF III, and UMTH LD has a minority limited partnership interest in Buffington Homebuilding Group, Ltd., which is the parent of Buff Homes. The Lot Inventory Loans are evidenced by promissory notes, are secured by first lien deeds of trust on the lots financed under the Lot Inventory Loans, and are guaranteed by Buff Homes’ parent company and an affiliate company of Buff Homes. The Lot Inventory Loans provide Buff Homes with financing for the acquisition of residential lots which are held as inventory to facilitate Buff Homes’ new home construction business in the greater Austin, Texas area. When a lot is slated for residential construction, Buff Homes obtains an interim construction loan and the principal advanced for the acquisition of the lot is repaid under the Lot Inventory Loans.
On April 9, 2010, we entered into an Agent Agreement with UDF III (the “Agent Agreement”). In accordance with the Agent Agreement, UDF III will continue to manage and control the Lot Inventory Loans and each participant party has appointed UDF III as its agent to act on its behalf with respect to all aspects of the Lot Inventory Loans, provided that, pursuant to the Agent Agreement, we retain approval rights in connection with any material decisions pertaining to the administration and services of the loans and, with respect to any material modification to the loans and in the event that the loans become non-performing, we shall have effective control over the remedies relating to the enforcement of the loans, including ultimate control of the foreclosure process.
Pursuant to the Buffington Lot Participation Agreements, we will participate in the Lot Inventory Loans by funding UDF III’s lending obligations under the Lot Inventory Loans up to a maximum amount of $2.5 million under the Buffington Signature Line and $2.0 million under the Buffington Classic Line. The Buffington Lot Participation Agreements give us the right to receive repayment of all principal and accrued interest relating to amounts funded by us under the Buffington Lot Participation Agreements. The interest rate for the Lot Inventory Loans is the lower of 14% or the highest rate allowed by law. Our participation interest is repaid as Buff Homes repays the Lot Inventory Loans. For each loan originated, Buff Homes is required to pay interest monthly and to repay the principal advanced no later than 12 months following the origination of the loan. The Buffington Signature Line matured and terminated in August 2011, at which time there was no outstanding balance, and our participation interest terminated simultaneously. The Buffington Classic Line was due and payable in full on August 21, 2012. Effective August 21, 2012, pursuant to an extension agreement, UDF III extended the maturity date of the Buffington Classic Line to August 21, 2013 and, in connection with this extension agreement, we entered into a letter agreement with UDF III extending the lot participation agreement associated with the Buffington Classic Line to August 21, 2013. In determining whether to extend this participation, we evaluated the economic conditions, the estimated value and performance of the underlying collateral, the guarantor, adverse situations that may affect the borrower’s ability to pay or the value of the collateral and other relevant factors.
UDF III is required to purchase back from us the participation interest in the Lot Inventory Loans (i) upon a foreclosure of UDF III’s assets by its lenders, (ii) upon the maturity of the Lot Inventory Loans, or (iii) at any time upon 30 days prior written notice from us. In such event, the purchase price paid to us will be equal to the outstanding principal amount of the Lot Inventory Loans on the date of termination, together with all accrued interest due thereon, plus any other amounts due to us under the Buffington Lot Participation Agreements.
A majority of our trustees, including a majority of our independent trustees, who are not otherwise interested in this transaction, approved the Buffington Lot Participation Agreements as being fair and reasonable to us and on terms and conditions not less favorable to us than those available from unaffiliated third parties.
As of both March 31, 2013 and December 31, 2012, approximately $499,000is included in loan participation interest – related parties related to the participation in the Buffington Classic Line. For the three months ended March 31, 2013 and 2012, we recognized approximately $17,000 and $8,000, respectively, of interest income – related parties related to the participation in the Buffington Classic Line. Approximately $28,000 and $20,000 is included in accrued receivable – related parties as of March 31, 2013 and December 31, 2012, respectively, for interest associated with the Buffington Classic Line.
TR Finished Lot Participation
On June 30, 2010, we purchased a participation interest (the “TR Finished Lot Participation”) in a finished lot loan (the “Travis Ranch II Finished Lot Loan”) made by UDF III to CTMGT Travis Ranch II, LLC, an unaffiliated Texas limited liability company. UMTH LD is the general partner of UDF III. The Travis Ranch II Finished Lot Loan is secured by a subordinate, second lien deed of trust recorded against finished residential lots in the Travis Ranch residential subdivision located in Kaufman County, Texas. The Travis Ranch II Finished Lot Loan is guaranteed by the limited liability company owners of the borrower and by the principal of the borrower.
In accordance with the TR Finished Lot Participation, we are entitled to receive repayment of our participation in the outstanding principal amount of the Travis Ranch II Finished Lot Loan, plus accrued interest thereon, over time as the borrower repays the loan. We have no obligation to increase our participation interest in the Travis Ranch II Finished Lot Loan. The interest rate under the Travis Ranch II Finished Lot Loan is the lower of 15% or the highest rate allowed by law. The borrower has obtained a senior loan secured by a first lien deed of trust on the finished lots. For so long as the senior loan is outstanding, proceeds from the sale of the residential lots securing the Travis Ranch II Finished Lot Loan will be paid to the senior lender and will be applied to reduce the outstanding balance of the senior loan. After the senior loan is paid in full, the proceeds from the sale of the residential lots securing the Travis Ranch II Finished Lot Loan are required to be used to repay the Travis Ranch II Finished Lot Loan. The Travis Ranch II Finished Lot Loan and our participation in this loan was originally due and payable in full on August 28, 2012. Effective January 28, 2013, pursuant to a Second Loan Modification Agreement, UDF III extended the maturity date of the Travis Ranch II Finished Lot Loan to January 28, 2014. The TR Finished Lot Participation was also extended to January 28, 2014 in connection with this modification. In determining whether to extend this participation, we evaluated the economic conditions, the estimated value and performance of the underlying collateral, the guarantor, adverse situations that may affect the borrower’s ability to pay or the value of the collateral and other relevant factors.
A majority of our trustees, including a majority of our independent trustees, who are not otherwise interested in this transaction, approved the Participation Agreements as being fair and reasonable to us and on terms and conditions not less favorable to us than those available from unaffiliated third parties.
As of both March 31, 2013 and December 31, 2012, approximately $3.6 million is included in loan participation interest – related parties related to the TR Finished Lot Participation. For the three months ended March 31, 2013 and 2012, we recognized approximately $133,000 and $102,000, respectively, of interest income – related parties related to this participation interest. Approximately $225,000 and $175,000 is included in accrued receivable – related parties as of March 31, 2013 and December 31, 2012, respectively, for interest associated with the TR Finished Lot Participation.
TR Paper Lot Participation
On June 30, 2010, we purchased a participation interest (the “TR Paper Lot Participation”) in a “paper” lot loan (the “Travis Ranch Paper Lot Loan”) from UDF III to CTMGT Travis Ranch, LLC, an unaffiliated Texas limited liability company. The general partner of our Advisor is also the general partner of UMTH LD, our asset manager. UMTH LD is the general partner of UDF III. A “paper” lot is a residential lot shown on a plat that has been accepted by the city or county, but which is currently undeveloped or under development. The borrower owns paper lots in the Travis Ranch residential subdivision of Kaufman County, Texas. The Travis Ranch Paper Lot Loan was initially secured by a pledge of the equity interests in the borrower instead of a real property lien, effectively subordinating the Travis Ranch Paper Lot Loan to all real property liens. The Travis Ranch Paper Lot Loan is guaranteed by the limited liability company owners of the borrower and by the principal of the borrower.
We are entitled to receive repayment of our participation in the outstanding principal amount of the Travis Ranch Paper Lot Loan, plus its proportionate share of accrued interest thereon, over time as the borrower repays the Travis Ranch Paper Lot Loan. We have no obligation to increase our participation interest in the Travis Ranch Paper Lot Loan. The interest rate under the Travis Ranch Paper Lot Loan is the lower of 15% or the highest rate allowed by law. The borrower has obtained a senior loan secured by a first lien deed of trust on the paper lots. For so long as the senior loan is outstanding, proceeds from the sale of the paper lots will be paid to the senior lender and will be applied to reduce the outstanding balance of the senior loan. After the senior loan is paid in full, the proceeds from the sale of the paper lots are required to be used to repay the Travis Ranch Paper Lot Loan. The Travis Ranch Paper Lot Loan and our participation in this loan was originally due and payable in full on September 24, 2012. Effective January 28, 2013, pursuant to a Loan Modification Agreement, UDF III extended the maturity date of the Travis Ranch Paper Lot Loan to January 28, 2014. The TR Paper Lot Participation was also extended to January 28, 2014 in connection with this modification. In determining whether to extend this participation, we evaluated the economic conditions, the estimated value and performance of the underlying collateral, the guarantor, adverse situations that may affect the borrower’s ability to pay or the value of the collateral and other relevant factors.
A majority of our trustees, including a majority of our independent trustees, who are not otherwise interested in this transaction, approved the Participation Agreements as being fair and reasonable to us and on terms and conditions not less favorable to us than those available from unaffiliated third parties.
As of both March 31, 2013 and December 31, 2012, approximately $10.6 million is included in loan participation interest – related parties related to the TR Paper Lot Participation. For the three months ended March 31, 2013 and 2012, we recognized approximately $393,000 and $346,000, respectively, of interest income – related parties related to the TR Paper Lot Participation. Approximately $794,000 and $401,000 is included in accrued receivable – related parties as of March 31, 2013 and December 31, 2012, respectively, for interest associated with the TR Paper Lot Participation.
Carrollton Participation Agreement
On June 10, 2011, we entered into a participation agreement (the “Carrollton Participation Agreement”) with UMT Home Finance III, LP (“UMTHFIII”), an affiliated Delaware limited partnership, pursuant to which we purchased a participation interest in UMTHFIII’s finished lot loan (the “Carrollton Lot Loan”) to Carrollton TH, LP (“Carrollton TH”), an unaffiliated Texas limited partnership. Our Advisor also serves as the advisor for UMT, which owns 100% of the interests in UMTHFIII. The Carrollton Lot Loan provides Carrollton TH with a finished lot loan totaling $3.4 million for townhome lots located in Carrollton, Texas. The Carrollton Lot Loan is evidenced by a promissory note, is secured by first lien deeds of trust on the finished lots financed under the Carrollton Lot Loan, and is guaranteed by the borrower’s general partner and its principal.
The Carrollton Participation Agreement gives us the right to receive payment from UMTHFIII of principal and accrued interest relating to amounts funded by us under the Carrollton Participation Agreement. We have no obligations to increase our participation in the Carrollton Lot Loan. The interest rate under the Carrollton Lot Loan is the lower of 13% or the highest rate allowed by law. Our interest will be repaid as Carrollton TH repays the Carrollton Lot Loan. Carrollton TH is required to pay interest monthly and to repay a portion of principal upon the sale of lots covered by the deed of trust. The original maturity date of the Carrollton Lot Loan is June 10, 2014. Pursuant to a letter agreement entered into in March 2012, the Carrollton Participation Agreement maturity date was extended from March 10, 2012 to December 10, 2012. Pursuant to a letter agreement entered into in December 2012, the Carrollton Participation Agreement maturity date was extended from December 10, 2012 to June 10, 2014. In determining whether to extend this participation, we evaluated the economic conditions, the estimated value and performance of the underlying collateral, the guarantor, adverse situations that may affect the borrower’s ability to pay or the value of the collateral and other relevant factors.
A majority of our trustees, including a majority of our independent trustees, who are not otherwise interested in this transaction, approved the Carrollton Participation Agreement as being fair and reasonable to us and on terms and conditions not less favorable to us than those available from unaffiliated third parties.
As of March 31, 2013 and December 31, 2012, approximately $299,000 and $817,000, respectively, is included in loan participation interest – related parties related to the Carrollton Participation Agreement. For the three months ended March 31, 2013 and 2012, we recognized approximately $24,000 and $18,000, respectively, of interest income – related parties related to the Carrollton Participation Agreement. Approximately $300 and $3,000 is included in accrued receivable – related parties as of March 31, 2013 and December 31, 2012, respectively, for interest associated with the Carrollton Participation Agreement.
165 Howe Participation Agreement
On October 4, 2011, we entered into a participation agreement (the “165 Howe Participation Agreement”) with UMT Home Finance III, LP (“UMTHFIII”), an affiliated Delaware limited partnership, pursuant to which we purchased a participation interest in UMTHFIII’s finished lot loan (the “165 Howe Lot Loan”) to 165 Howe, L.P., an unaffiliated Texas limited partnership, and Allen Partners, L.P., an unaffiliated Texas limited partnership (collectively, “165 Howe”). Our Advisor also serves as the advisor for UMT, which owns 100% of the interests in UMTHFIII. The 165 Howe Lot Loan provides 165 Howe with a finished lot loan totaling $2.9 million for finished single-family residential lots located in Fort Worth, Texas. The 165 Howe Lot Loan is evidenced by a promissory note, is secured by first lien deeds of trust on the finished lots financed under the 165 Howe Lot Loan, and is guaranteed by the borrower’s general partner and its principal.
The 165 Howe Participation Agreement gives the Trust the right to receive payment from UMTHFIII of principal and accrued interest relating to amounts funded by the Trust under the 165 Howe Participation Agreement. We have no obligations to increase our participation in the 165 Howe Lot Loan. The interest rate under the 165 Howe Lot Loan is the lower of 11.5% or the highest rate allowed by law. Our interest will be repaid as 165 Howe repays the 165 Howe Lot Loan. 165 Howe is required to pay interest monthly and to repay a portion of principal upon the sale of lots covered by the deed of trust. The original maturity date of the 165 Howe Lot Loan is October 4, 2013. The original maturity date of the 165 Howe Participation Agreement was July 4, 2012. Pursuant to a letter agreement entered into in July 2012, the 165 Howe Participation Agreement maturity date was extended from July 4, 2012 to December 10, 2012. Pursuant to a letter agreement entered into in December 2012, the 165 Howe Participation Agreement maturity date was extended from December 10, 2012 to October 4, 2013. In determining whether to extend this participation, we evaluated the economic conditions, the estimated value and performance of the underlying collateral, the guarantor, adverse situations that may affect the borrower’s ability to pay or the value of the collateral and other relevant factors.
A majority of our trustees, including a majority of our independent trustees, who are not otherwise interested in this transaction, approved the 165 Howe Participation Agreement as being fair and reasonable to us and on terms and conditions not less favorable to us than those available from unaffiliated third parties.
As of both March 31, 2013 and December 31, 2012, approximately $1.3 million is included in loan participation interest – related parties related to the 165 Howe Participation Agreement. For the three months ended March 31, 2013 and 2012, we recognized approximately $37,000 and $79,000, respectively, of interest income – related parties related to the 165 Howe Participation Agreement. Approximately $31,000 and $21,000 is included in accrued receivable – related parties as of March 31, 2013 and December 31, 2012, respectively, for interest associated with the 165 Howe Participation Agreement.
Pine Trace Participation Agreement
On May 31, 2012, we entered into a participation agreement (the “Pine Trace Participation Agreement”) with UMTHFIII pursuant to which we purchased a participation interest in UMTHFIII’s loan (the “Pine Trace Loan”) to Pine Trace Village, LLC an unaffiliated Texas limited liability company (“Pine Trace”). Our Advisor also serves as the advisor for UMT, which owns 100% of the interests in UMTHFIII. The Pine Trace Loan was initially secured by approximately 118 finished lots and 151 acres of undeveloped land located in Houston, TX. The Pine Trace Loan is evidenced by a promissory note and is secured by first lien deeds of trust on the finished lots financed under the Pine Trace Loan.
The Pine Trace Participation Agreement gives us the right to receive payment from UMTHFIII of principal and accrued interest relating to amounts funded by us under the Pine Trace Participation Agreement. The interest rate under the Pine Trace Loan is the lower of 13% or the highest rate allowed by law. Our interest will be repaid as Pine Trace repays the Pine Trace Loan. Pine Trace is required to pay interest monthly and to repay a portion of principal upon the sale of lots covered by the deed of trust. The Pine Trace Loan and our participation in this loan were originally due and payable in full on March 29, 2013. Effective March 29, 2013, pursuant to the Third Loan Modification Agreement, UMTHFIII extended the maturity date of the Pine Trace Loan to March 29, 2014. The Pine Trace Participation Agreement was also extended to March 29, 2014 in connection with this modification. In determining whether to extend this participation, we evaluated the economic conditions, the estimated value and performance of the underlying collateral, the guarantor, adverse situations that may affect the borrower’s ability to pay or the value of the collateral and other relevant factors.
A majority of our trustees, including a majority of our independent trustees, who are not otherwise interested in this transaction, approved the Pine Trace Participation Agreement as being fair and reasonable to us and on terms and conditions not less favorable to us than those available from unaffiliated third parties.
As of March 31, 2013 and December 31, 2012, approximately $5.5 million and $5.2 million, respectively, is included in loan participation interest – related parties related to the Pine Trace Participation Agreement. For the three months ended March 31, 2013, we recognized approximately $167,000 of interest income – related parties related to the Pine Trace Participation Agreement. As of March 31, 2013, there is no accrued interest included in accrued receivable – related parties associated with the Pine Trace Participation Agreement. Approximately $134,000 is included in accrued receivable – related parties as of December 31, 2012, for interest associated with the Pine Trace Participation Agreement.
Northpointe Participation Agreement
On June 11, 2012, we entered into a participation agreement (the “Northpointe Participation Agreement”) with UDF III pursuant to which we purchased a participation interest in UDF III’s loan (the “Northpointe Loan”) to UDF Northpointe, LLC, an unaffiliated Texas limited liability company (“Northpointe”). The general partner of our Advisor is also the general partner of UMTH LD, our asset manager. UMTH LD is the general partner of UDF III. The Northpointe Loan was initially secured by approximately 301 lots located in Collin County, Tarrant County and Kaufman County, Texas. The Northpointe Loan is evidenced by a promissory note and is secured by first lien deeds of trust on the lots financed under the Northpointe Loan.
The Northpointe Participation Agreement gives us the right to receive payment from UDF III of principal and accrued interest relating to amounts funded by us under the Northpointe Participation Agreement. The interest rate under the Northpointe Loan is the lower of 12% or the highest rate allowed by law. Our interest will be repaid as Northpointe repays the Northpointe Loan. Northpointe is required to pay interest monthly and to repay a portion of principal upon the sale of lots covered by the deed of trust. The Northpointe Loan and our participation in this loan were originally due and payable in full on December 4, 2012. Effective December 4, 2012, pursuant to a loan modification agreement, UDF III extended the maturity date of the Northpointe Loan to June 4, 2013. The Northpointe Participation Agreement was also extended to June 4, 2013 in connection with this modification. In determining whether to extend this participation, we evaluated the economic conditions, the estimated value and performance of the underlying collateral, the guarantor, adverse situations that may affect the borrower’s ability to pay or the value of the collateral and other relevant factors.
A majority of our trustees, including a majority of our independent trustees, who are not otherwise interested in this transaction, approved the Northpointe Participation Agreement as being fair and reasonable to us and on terms and conditions not less favorable to us than those available from unaffiliated third parties.
As of March 31, 2013 and December 31, 2012, approximately $364,000 and $212,000 is included in loan participation interest – related parties related to the Northpointe Participation Agreement. For the three months ended March 31, 2013, we recognized approximately $9,000 of interest income – related parties related to the Northpointe Participation Agreement. Approximately $9,000 is included in accrued receivable – related parties as of March 31, 2013, for interest associated with the Northpointe Participation Agreement. As of December 31, 2012, there is no accrued interest included in accrued receivable – related parties associated with the Northpointe Participation Agreement.
Notes Receivable – Related Parties
HLL Indian Springs Loan
On January 18, 2010, we made a finished lot loan (the “HLL Indian Springs Loan”) of approximately $1.8 million to HLL Land Acquisitions of Texas, L.P., an affiliated Texas limited partnership (“HLL”). HLL is a wholly owned subsidiary of United Development Funding, L.P. (“UDF I”), an affiliated Delaware limited partnership. The general partner of our Advisor is also the general partner of UMTH LD, our asset manager. UMTH LD also serves as the asset manager of UDF I. The HLL Indian Springs Loan was initially evidenced and secured by a first lien deed of trust recorded against approximately 71 finished residential lots in The Preserve at Indian Springs, a residential subdivision in the City of San Antonio, Bexar County, Texas, as well as a promissory note, assignments of certain lot sale contracts and earnest money, and other loan documents. The interest rate under the HLL Indian Springs Loan is the lower of 13% or the highest rate allowed by law. The HLL Indian Springs Loan matures on July 18, 2013, pursuant to the First Modification Agreement dated July 18, 2011. In determining whether to modify this loan, we evaluated the economic conditions, the estimated value and performance of the underlying collateral, the guarantor, adverse situations that may affect the borrower’s ability to pay or the value of the collateral and other relevant factors. The HLL Indian Springs Loan provides HLL with an interest reserve of approximately $289,000 pursuant to which we will fund HLL’s monthly interest payments and add the payments to the outstanding principal balance of the HLL Indian Springs Loan.
In connection with the HLL Indian Springs Loan, HLL agreed to pay an origination fee of approximately $18,000 to UMTH LD, which was funded by us at the closing of the HLL Indian Springs Loan.
A majority of our trustees, including a majority of our independent trustees, who are not otherwise interested in this transaction, approved the HLL Indian Springs Loan as being fair and reasonable to us and on terms and conditions not less favorable to us than those available from unaffiliated third parties.
As of March 31, 2013 and December 31, 2012, approximately $128,000 and $1.5 million, respectively, is included in notes receivable – related parties related to the HLL Indian Springs Loan. For the three months ended March 31, 2013 and 2012, we recognized approximately $6,000 and $26,000, respectively, of interest income – related parties related to this loan. Approximately $1,000 and $2,000 is included in accrued receivable – related parties as of March 31, 2013 and December 31, 2012, respectively, for interest associated with the HLL Indian Springs Loan.
Buffington Loan Agreements
On April 30, 2010, we entered into two construction loan agreements with Buffington Signature (the “Buffington Signature CL”) and Buffington Classic (the “Buffington Classic CL”) (collectively, the “Buffington Loan Agreements”) through which we agreed to provide interim construction loan facilities (collectively, the “Buffington Loan Facilities”) to Buffington Signature and Buffington Classic. The general partner of our Advisor is also the general partner of UMTH LD, our asset manager. UMTH LD owns an investment in Buffington Homebuilding Group, Ltd., which is the parent of Buff Homes. Effective July 2010, we assigned our rights and obligations under the Buffington Loan Facilities to UDF IV HF.
The Buffington Signature CL provides Buffington Signature with up to $1.0 million in residential interim construction financing for the construction of new homes in the greater Austin, Texas area and other Texas counties approved by UDF IV HF. The Buffington Signature CL matured and was not renewed in October 2011, at which time there were no amounts outstanding and payable to UDF IV HF.
The Buffington Classic CL originally provided Buffington Classic with up to $6.5 million in residential interim construction financing for the construction of new homes in the greater Austin, Texas area and other Texas counties approved by UDF IV HF. Pursuant to the Third Modification to Construction Loan Agreement entered into between UDF IV HF and Buffington Classic in October 2011, the Buffington Classic CL provided Buffington Classic with up to $7.5 million in residential interim construction financing through October 28, 2012. Pursuant to a letter agreement entered into on October 28, 2012, we extended the maturity date of the Buffington Classic CL to October 28, 2013. In determining whether to modify this loan, we evaluated the economic conditions, the estimated value and performance of the underlying collateral, the guarantor, adverse situations that may affect the borrower’s ability to pay or the value of the collateral and other relevant factors.
The Buffington Loan Facilities are evidenced and secured by the Buffington Loan Agreements, promissory notes, first lien deeds of trust on the homes financed under the Buffington Loan Facilities and various other loan documents. They are guaranteed by the parent company and certain principals of Buff Homes. The interest rate under the Buffington Loan Facilities is the lower of 13% per annum, or the highest rate allowed by law. Interest is payable monthly. Each loan financed under the Buffington Loan Facilities matures and becomes due and payable in full upon the earlier of (i) the sale of the home financed under the loan, or (ii) nine months after the loan was originated; provided, that the maturity of the loan may be extended up to 90 days following the original maturity date. At the closing of each loan, Buff Homes will pay a 0.5% origination fee to our asset manager.
A majority of our trustees, including a majority of our independent trustees, who are not otherwise interested in this transaction, approved the Buffington Loan Facilities as being fair and reasonable to us and on terms and conditions not less favorable to us than those available from unaffiliated third parties.
As of March 31, 2013, there is no amount included in notes receivable – related parties associated with the Buffington Loan Facilities. As of December 31, 2012, approximately $399,000 is included in notes receivable – related parties related to the Buffington Loan Facilities. For the three months ended March 31, 2013 and 2012, we recognized approximately $5,000 and $110,000, respectively, of interest income – related parties related to the Buffington Loan Facilities. As of March 31, 2013, there is no accrued interest included in accrued receivable – related parties associated with the Buffington Loan Facilities. Approximately $4,000 is included in accrued receivable – related parties as of December 31, 2012 for interest associated with the Buffington Loan Facilities.
HLL II Highland Farms Loan
Effective December 22, 2010, we made a finished lot loan (the “HLL II Highland Farms Loan”) of approximately $1.9 million to HLL II Land Acquisitions of Texas, L.P., an affiliated Texas limited partnership (“HLL II”). HLL II is a wholly owned subsidiary of UDF I. The general partner of our Advisor is also the general partner of UMTH LD, our asset manager. UMTH LD also serves as the asset manager of UDF I. The HLL II Highland Farms Loan was initially evidenced and secured by a first lien deed of trust recorded against approximately 68 finished residential lots and 148 undeveloped lots in Highland Farms, a residential subdivision in the City of San Antonio, Bexar County, Texas, as well as a promissory note, assignments of certain lot sale contracts and earnest money, and other loan documents. The interest rate under the HLL II Highland Farms Loan is the lower of 13% or the highest rate allowed by law. The HLL II Highland Farms Loan matured and became due and payable in full on March 22, 2013. Pursuant to the First Loan Modification Agreement entered into effective March 22, 2013, we extended the maturity date of the HLL II Highland Farms Loan to March 22, 2014.In determining whether to modify this loan, we evaluated the economic conditions, the estimated value and performance of the underlying collateral, the guarantor, adverse situations that may affect the borrower’s ability to pay or the value of the collateral and other relevant factors.The HLL II Highland Farms Loan provides HLL II with an interest reserve of approximately $354,000 pursuant to which we will fund HLL II’s monthly interest payments and add the payments to the outstanding principal balance of the HLL II Highland Farms Loan.
In connection with the HLL II Highland Farms Loan, HLL II agreed to pay us an origination fee of approximately $19,000, which was funded at the closing of the loan. For both the three months ended March 31, 2013 and 2012, approximately $2,000 is included in commitment fee income – related parties related to this fee.
A majority of our trustees, including a majority of our independent trustees, who are not otherwise interested in this transaction, approved the HLL II Highland Farms Loan as being fair and reasonable to us and on terms and conditions not less favorable to us than those available from unaffiliated third parties.
As of March 31, 2013 and December 31, 2012, approximately $1.4 million and $1.5 million, respectively, is included in notes receivable – related parties related to the HLL II Highland Farms Loan. For the three months ended March 31, 2013 and 2102, we recognized approximately $45,000 and $44,000, respectively, of interest income – related parties related to the HLL II Highland Farms Loan. Approximately $30,000 is included in accrued receivable – related parties as of March 31, 2013, for interest associated with the HLL II Highland Farms Loan. As of December 31, 2012, there is no accrued interest included in accrued receivable – related parties associated with the HLL II Highland Farms Loan.
HLL Hidden Meadows Loan
Effective February 17, 2011, we entered into a Loan Agreement providing for a maximum $9.9 million loan (the “HLL Hidden Meadows Loan”) to be made to HLL. HLL is a wholly owned subsidiary of UDF I. The general partner of our Advisor is also the general partner of UMTH LD, our asset manager. UMTH LD also serves as the asset manager of UDF I. The HLL Hidden Meadows Loan was initially secured by (i) a first priority lien deed of trust to be recorded against 91 finished residential lots, 190 partially developed residential lots and residual undeveloped land located in the residential subdivision of Hidden Meadows, Harris County, Texas, (ii) the assignment of lot sale contracts providing for sales of finished residential lots to a builder, and (iii) the assignment of development reimbursements owing from a Municipal Utility District to HLL. The interest rate under the HLL Hidden Meadows Loan is the lower of 13% or the highest rate allowed by law. The HLL Hidden Meadows Loan matures and becomes due and payable in full on January 21, 2015. The HLL Hidden Meadows Loan provides HLL with an interest reserve, pursuant to which we will fund HLL’s monthly interest payments and add the payments to the outstanding principal balance of the HLL Hidden Meadows Loan.
In connection with the HLL Hidden Meadows Loan, HLL agreed to pay a $99,000 origination fee to us, which was funded at the closing of the HLL Hidden Meadows Loan. For both the three months ended March 31, 2013 and 2012, approximately $6,000 is included in commitment fee income – related parties related to this fee.
A majority of our trustees, including a majority of our independent trustees, who are not otherwise interested in this transaction, approved the HLL Hidden Meadows Loan as being fair and reasonable to us and on terms and conditions not less favorable to us than those available from unaffiliated third parties.
As of March 31, 2013 and December 31, 2012, approximately $10.1 million and $9.0 million, respectively, is included in notes receivable – related parties related to the HLL Hidden Meadows Loan. For the three months ended March 31, 2013 and 2012, we recognized approximately $301,000 and $211,000, respectively, of interest income – related parties related to the HLL Hidden Meadows Loan. Approximately $87,000 and $853,000 is included in accrued receivable – related parties as of March 31, 2013 and December 31, 2012, respectively, for interest associated with the HLL Hidden Meadows Loan.
Ash Creek Loan
Effective April 20, 2011, we entered into a $3.0 million loan agreement (the “Ash Creek Loan”) with UDF Ash Creek, LP (“UDF Ash Creek”), an affiliated Delaware limited partnership. UDF Ash Creek is a wholly owned subsidiary of UDF I. The general partner of our Advisor is also the general partner of UMTH LD, our asset manager. UMTH LD also serves as the asset manager of UDF I. The Ash Creek Loan provides UDF Ash Creek with interim construction financing for the construction of 19 new townhomes in an existing townhome community in Dallas, Texas. The Ash Creek Loan is evidenced and secured by a promissory note, first lien deeds of trust on the townhomes financed under the Ash Creek Loan and various other loan documents. The interest rate under the Ash Creek Loan is the lower of 13% per annum, or the highest rate allowed by law. UDF Ash Creek is required to pay interest monthly and to repay a portion of the principal upon the sale of the townhomes covered by the deed of trust. The Ash Creek Loan matured and became due and payable in full on October 20, 2012. Effective October 20, 2012, we entered into a loan modification agreement with UDF Ash Creek, which extended the maturity date of the Ash Creek Loan to October 20, 2013. In determining whether to extend this loan, we evaluated the economic conditions, the estimated value and performance of the underlying collateral, the guarantor, adverse situations that may affect the borrower’s ability to pay or the value of the collateral and other relevant factors.
In connection with the Ash Creek Loan, UDF Ash Creek agreed to pay a $15,000 origination fee to us, which was funded at the closing of the Ash Creek Loan. For the three months ended March 31, 2013 and 2012, approximately $0 and $2,000, respectively, is included in commitment fee income – related parties related to this fee.
A majority of our trustees, including a majority of our independent trustees, who are not otherwise interested in this transaction, approved the Ash Creek Loan as being fair and reasonable to us and on terms and conditions not less favorable to us than those available from unaffiliated third parties.
As of both March 31, 2013 and December 31, 2012, approximately $2.5 million is included in notes receivable – related parties related to the Ash Creek Loan. For the three months ended March 31, 2013 and 2012, we recognized approximately $81,000 and $41,000, respectively, of interest income – related parties related to the Ash Creek Loan. Approximately $14,000 and $60,000 is included in accrued receivable – related parties as of March 31, 2013 and December 31, 2012, respectively, for interest associated with the Ash Creek Loan.
UMTHFII Loan
On October 26, 2011, we entered into a secured line of credit promissory note (the “UMTHFII Loan”) with UMT Home Finance II, LP (“UMTHFII”), an affiliated Delaware limited partnership. Our Advisor also serves as the advisor for UMT, which owns 100% of the interests in UMTHFII. The UMTHFII Loan provided UMTHFII with a $5.0 million line of credit to acquire or originate and fund construction loans and for business purposes approved by the Trust that are related to the acquisition or origination of construction loans. The UMTHFII Loan was subordinate to a senior loan entered into by UMTHFII and was secured by a pledge of the partnership interests in UMTHFII, a security interest against the assets of UMTHFII and a guaranty from UMT.
The interest rate under the UMTHFII Loan was the lower of 13% per annum, or the highest rate allowed by law. UMTHFII was required to repay the UMTHFII Loan as it receives net proceeds from the disposition of assets underlying the construction loans and as it receives net proceeds of interest associated with the construction loans. In addition, UMTHFII was required to repay the UMTHFII Loan as it received net proceeds from its private placement offering of up to $5.0 million in promissory notes. The UMTHFII Loan matured and became due and payable in full on October 26, 2012, at which point it terminated. We did not fund any advances or recognize any income associated with the UMTHFII Loan prior to its maturity.
A majority of our trustees, including a majority of our independent trustees, who are not otherwise interested in this transaction, approved the UMTHFII Loan as being fair and reasonable to us and on terms and conditions not less favorable to us than those available from unaffiliated third parties.
As of March 31, 2013 and December 31, 2012, there were no amounts outstanding under the UMTHFII Loan and we had not funded any advances or recognized any income associated with the UMTHFII Loan.
UDF TX Two Loan
On September 20, 2012, we entered into a loan purchase agreement with a third party to acquire a loan obligation (the “UDF TX Two Loan”) owing from UDF TX Two, L.P., an affiliated Texas limited partnership (“UDF TX Two”) for approximately $2.9 million. UDF I has a 50% partnership interest in UDF TX Two. Our asset manager, UMTH LD, also serves as the asset manager of UDF I. The general partner of our Advisor is also the general partner of UMTH LD. The UDF TX Two Loan provided UDF TX Two with financing to acquire 70 finished home lots in Lakeway, Texas. The UDF TX Two Loan is evidenced and secured by a promissory note, first lien deeds of trust on the finished lots financed under the UDF TX Two Loan and various other loan documents. The interest rate under the UDF TX Two Loan is the lower of 13% per annum, or the highest rate allowed by law. Upon acquisition of the UDF TX Two Loan, we entered into an extension agreement with UDF TX Two pursuant to which we extended the maturity date of the UDF TX Two Loan to September 20, 2014. In determining whether to modify this loan, we evaluated the economic conditions, the estimated value and performance of the underlying collateral, the guarantor, adverse situations that may affect the borrower’s ability to pay or the value of the collateral and other relevant factors.
A majority of our trustees, including a majority of our independent trustees, who are not otherwise interested in this transaction, approved the UDF TX Two Loan as being fair and reasonable to us and on terms and conditions not less favorable to us than those available from unaffiliated third parties.
As of March 31, 2013 and December 31, 2012 approximately $3.3 million and $3.2 million, respectively, is included in notes receivable – related parties related to the UDF TX Two Loan. For the three months ended March 31, 2013, we recognized approximately $106,000 of interest income – related parties related to the UDF TX Two Loan. Approximately $186,000 and $81,000 is included in accrued receivable – related parties as of March 31, 2013 and December 31, 2012, respectively, for interest associated with the UDF TX Two Loan.
UDF PM Loan
Effective October 17, 2012, we entered into a $5.1 million loan agreement (the “UDF PM Loan”) with UDF PM, LLC (“UDF PM”), an affiliated Texas limited liability company. UDF PM is a wholly owned subsidiary of UDF I. The general partner of our Advisor is also the general partner of UMTH LD, our asset manager. UMTH LD also serves as the asset manager of UDF I. The UDF PM Loan provides UDF PM with up to $4.8 million in financing for the development of an amenity center and related project amenities located in Lubbock County, Texas. The UDF PM Loan is evidenced and secured by a promissory note and the assignment of development reimbursements owing to UDF PM pursuant to (i) an economic development agreement and (ii) a public improvement district reimbursement contract, both of which were entered into between UDF PM and the city of Wolfforth, Texas. The interest rate under the UDF PM Loan is the lower of 13% per annum, or the highest rate allowed by law. The UDF PM Loan matures and becomes due and payable in full on October 17, 2015. The UDF PM Loan provides UDF PM with an interest reserve of approximately $300,000, pursuant to which we will fund UDF PM’s monthly interest payments and add the payments to the outstanding principal balance of the UDF PM Loan.
A majority of our trustees, including a majority of our independent trustees, who are not otherwise interested in this transaction, approved the UDF PM Loan as being fair and reasonable to us and on terms and conditions not less favorable to us than those available from unaffiliated third parties.
As of March 31, 2013 and December 31, 2012, approximately $1.4 million and $892,000 is included in notes receivable – related parties related to the UDF PM Loan. For the three months ended March 31, 2013, we recognized approximately $35,000 of interest income – related parties related to the UDF PM Loan. Approximately $46,000 and $11,000 is included in accrued receivable – related parties as of March 31, 2013 and December 31, 2012, respectively, for interest associated with the UDF PM Loan.
HLL IS Loan
Effective November 29, 2012, we entered into a $6.4 million loan agreement (the “HLL IS Loan”) with HLL. HLL is a wholly owned subsidiary of UDF I. The general partner of our Advisor is also the general partner of UMTH LD, our asset manager. UMTH LD also serves as the asset manager of UDF I. The HLL IS Loan provides HLL with up to $5.8 million in financing for the development of residential lots located in Bexar County, Texas. The HLL IS Loan was initially evidenced and secured by a first lien deed of trust recorded against approximately 24 acres in The Preserve at Indian Springs, a residential subdivision in the City of San Antonio, Bexar County, Texas, as well as a promissory note, assignments of certain lot sale contracts, and other loan documents. The interest rate under the HLL IS Loan is the lower of 13% per annum, or the highest rate allowed by law. The HLL IS Loan matures and becomes due and payable in full on November 29, 2015. The HLL IS Loan provides HLL with an interest reserve of approximately $600,000, pursuant to which we will fund HLL’s monthly interest payments and add the payments to the outstanding principal balance of the HLL IS Loan.
In connection with the HLL IS Loan, HLL agreed to pay a $64,000 origination fee to us, which was funded at the closing of the HLL IS Loan. For the three months ended March 31, 2013, approximately $5,000 is included in commitment fee income – related parties related to this fee.
A majority of our trustees, including a majority of our independent trustees, who are not otherwise interested in this transaction, approved the UDF PM Loan as being fair and reasonable to us and on terms and conditions not less favorable to us than those available from unaffiliated third parties.
As of March 31, 2013 and December 31, 2012, approximately $3.3 million and $3.1 million is included in notes receivable – related parties related to the HLL IS Loan. For the three months ended March 31, 2013, we recognized approximately $103,000 of interest income – related parties related to the HLL IS Loan. Approximately $138,000 and $35,000 is included in accrued receivable – related parties as of March 31, 2013 and December 31, 2012, respectively, for interest associated with the HLL IS Loan.
One KR Loan
Effective December 14, 2012, we entered into a $15.3 million loan agreement (the “One KR Loan”) with One KR Venture, L.P., an affiliated Texas limited partnership (“One KR”). One KR is a wholly owned subsidiary of UDF I. The general partner of our Advisor is also the general partner of UMTH LD, our asset manager. UMTH LD also serves as the asset manager of UDF I. The One KR Loan provides One KR with up to $12.1 million to refinance existing third party debt and develop real property located in Bexar County, Texas. The One KR Loan was initially evidenced and secured by a first lien deed of trust recorded against approximately 31 acres of real property located in Bexar County, Texas, as well as a promissory note, assignments of certain lot sale contracts, a pledge of partnership interests in the borrower and other loan documents. The interest rate under the One KR Loan is the lower of 13% per annum, or the highest rate allowed by law. The One KR Loan matures and becomes due and payable in full on June 14, 2016. The One KR Loan provides One KR with an interest reserve of approximately $3.2 million, pursuant to which we will fund One KR’s monthly interest payments and add the payments to the outstanding principal balance of the One KR Loan.
In connection with the One KR Loan, One KR agreed to pay a $153,000 origination fee to us, which was funded at the closing of the One KR Loan. For the three months ended March 31, 2013, approximately $13,000 is included in commitment fee income – related parties related to this fee.
A majority of our trustees, including a majority of our independent trustees, who are not otherwise interested in this transaction, approved the UDF PM Loan as being fair and reasonable to us and on terms and conditions not less favorable to us than those available from unaffiliated third parties.
As of March 31, 2013 and December 31, 2012, approximately $6.8 million and $6.0 million, respectively, is included in notes receivable – related parties related to the One KR Loan. For the three months ended March 31, 2013, we recognized approximately $219,000 of interest income – related parties related to the One KR Loan. Approximately $55,000 and $13,000 is included in accrued receivable – related parties as of March 31, 2013 and December 31, 2012, respectively, for interest associated with the One KR Loan.
O. Concentration of Credit Risk
Financial instruments that potentially expose us to concentrations of credit risk are primarily temporary cash equivalent and loan participation interest – related parties. We maintain deposits in financial institutions that may at times exceed amounts covered by insurance provided by the U.S. Federal Deposit Insurance Corporation (“FDIC”). We have not experienced any losses related to amounts in excess of FDIC limits.
As of March 31, 2013, our real estate investments were secured by property located in Texas and Colorado.
We may invest in multiple secured loans that share a common borrower. The bankruptcy, insolvency or other inability of any borrower that is the subject of multiple loans to pay interest or repay principal on its loans would have adverse consequences on our income and reduce the amount of funds available for distribution to investors. The more concentrated our portfolio is with one or a few borrowers, the greater credit risk we face. The loss of any one of these borrowers would have a material adverse effect on our financial condition and results of operations.
As of March 31, 2013, we did not have any loans to borrowers that, individually, accounted for over 10% of the outstanding balance of our portfolio. As of March 31, 2013, our largest individual borrower and its affiliates comprised approximately 65% of the outstanding balance of our portfolio.
P. Subsequent Events
Effective April 11, 2013, UDF IV AC entered into the First Amended and Restated Loan Agreement with CTB, pursuant to which CTB increased its commitment under the CTB Revolver from $8.0 million to $15.0 million. In connection with this amendment, UDF IV AC agreed to pay an origination fee of $70,000 to CTB. See Note K – Lines of Credit for further discussion of the CTB Revolver.
We have the right to reallocate the common shares of beneficial interest registered in the Offering between the Primary Offering and the DRIP, and pursuant to Supplement No. 6 to our prospectus regarding the Offering, which was filed with the Securities and Exchange Commission on May 3, 2013, we reallocated the shares being offered to be 34,000,000 shares offered pursuant to the Primary Offering and 1,000,000 shares offered pursuant to the DRIP.
On April 19, 2013, we registered 7,500,000 additional common shares of beneficial interest to be offered pursuant to our Secondary DRIP for $20 per share. We will stop offering common shares of beneficial interest under the DRIP portion of the Offering upon the termination of the Offering (which is anticipated to be May 13, 2013). Upon the termination of the Offering, we will begin to offer our common shares of beneficial interest to our shareholders pursuant to the Secondary DRIP.
Item 2. Management’s Discussion and Analysis of Financial Condition and Results of Operations.
The following discussion and analysis should be read in conjunction with our accompanying consolidated financial statements and the notes thereto:
Forward-Looking Statements
This section of the quarterly report contains forward-looking statements, including discussion and analysis of us, our financial condition, amounts of anticipated cash distributions to common shareholders in the future and other matters. These forward-looking statements are not historical facts but are the intent, belief or current expectations of our management based on their knowledge and understanding of our business and industry. Words such as “may,” “anticipates,” “expects,” “intends,” “plans,” “believes,” “seeks,” “estimates,” “would,” “could,” “should” and variations of these words and similar expressions are intended to identify forward-looking statements. These statements are not guaranties of future performance and are subject to risks, uncertainties and other factors, some of which are beyond our control, are difficult to predict and could cause actual results to differ materially from those expressed or forecasted in the forward-looking statements.
Forward-looking statements that were true at the time made may ultimately prove to be incorrect or false. We caution you not to place undue reliance on forward-looking statements, which reflect our management’s view only as of the date of this Quarterly Report. We undertake no obligation to update or revise forward-looking statements to reflect changed assumptions, the occurrence of unanticipated events or changes to future operating results. Factors that could cause actual results to differ materially from any forward-looking statements made in this Form 10-Q include changes in general economic conditions, changes in real estate conditions, development costs that may exceed estimates, development delays, increases in interest rates, residential lot take down or purchase rates or inability to sell residential lots experienced by our borrowers, and the potential need to fund development costs not completed by the initial borrower or other capital expenditures out of operating cash flows. The forward-looking statements should be read in light of the risk factors identified in the “Risk Factors” section of this Quarterly Report on Form 10-Q and our 2012 Annual Report on Form 10-K, asfiled with the Securities and Exchange Commission.
Overview
On November 12, 2009, the Trust’s Registration Statement on Form S-11, covering the Offering of up to 25,000,000 common shares of beneficial interest to be offered in the Primary Offering at a price of $20 per share, was declared effective under the Securities Act of 1933, as amended. The Offering also initially covered up to 10,000,000 common shares of beneficial interest to be issued pursuant to our DRIP at a price of $20 per share. We have the right to reallocate the common shares of beneficial interest registered in the Offering between the Primary Offering and the DRIP, and pursuant to Supplement No. 6 to our prospectus regarding the Offering, which was filed with the Securities and Exchange Commission on May 3, 2013, we reallocated the shares being offered to be 34,000,000 shares offered pursuant to the Primary Offering and 1,000,000 shares offered pursuant to the DRIP. The Offeringwill terminate on or before May 13, 2013.
On April 19, 2013, we registered 7,500,000 additional common shares of beneficial interest to be offered pursuant to our Secondary DRIP for $20 per share. We will stop offering common shares of beneficial interest under the DRIP portion of the Offering upon the termination of the Offering (which is anticipated to be May 13, 2013). Upon the termination of the Offering, we will begin to offer our common shares of beneficial interest to our shareholders pursuant to the Secondary DRIP.
We use substantially all of the net proceeds from the Offering to originate, purchase, participate in and hold for investment secured loans made directly by us or indirectly through our affiliates to persons and entities for the acquisition and development of parcels of real property as single-family residential lots, and theconstruction of model and new single-family homes, including development of mixed-use master planned residential communities. We may alsomake direct investments in land for development into single-family lots, new and model homes and portfolios of finished lots and homes; provide credit enhancements to real estate developers, home builders, land bankers and other real estate investors; and purchase participations in, or finance for other real estate investors the purchase of, securitized real estate loan pools and discounted cash flows secured by state, county, municipal or other similar assessments levied on real property. We also may enter into joint ventures with unaffiliated real estate developers, home builders, land bankers and other real estate investors, or with other United Development Funding-sponsored programs, to originate or acquire, as the case may be, the same kind of secured loans or real estate investments we may originate or acquire directly.
Until required in connection with the funding of loans or other investments, substantially all of the net proceeds of the Offering and, thereafter, our working capital reserves, may be invested in short-term, highly-liquid investments including, but not limited to, government obligations, bank certificates of deposit, short-term debt obligations and interest-bearing accounts.
We made an election under Section 856(c) of the Internal Revenue Code to be taxed as a REIT, beginning with the taxable year ended December 31, 2010, which was the first year in which we had material operations. As a REIT, we generally are not subject to federal income tax on income that we distribute to our shareholders. If we later fail to qualify as a REIT in any taxable year, we will be subject to federal income tax on our taxable income at regular corporate rates and may not be permitted to qualify for treatment as a REIT for federal income tax purposes for four years following the year in which our qualification is denied unless we are entitled to relief under certain statutory provisions. Such an event could materially and adversely affect our net income. However, we believe that we are organized and operated in a manner that will enable us to remain qualified as a REIT for federal income tax purposes.
Our loan portfolio, consisting of notes receivable, notes receivable – related parties and loan participation interest – related parties, grew from approximately $146.4 million as of December 31, 2011, to approximately $305.5 million as of December 31, 2012, to approximately $331.2 million as of March 31, 2013. With the increase in our loan portfolio, our revenues, the majority of which is from recognizing interest income associated with our loan portfolio, also increased. Our expenses related to the portfolio also increased, including the provision for loan losses, which was approximately $416,000 and $203,000 for the three months ended March 31, 2013 and 2012, respectively.
Our cash balances were approximately $43.4 million and $23.2 million as of March 31, 2013 and December 31, 2012, respectively. These balances have fluctuated since the Offering began with the raise of gross proceeds and the deployment of funds available.
We may use debt as a means of providing additional funds for the acquisition or origination of secured loans, acquisition of properties and the diversification of our portfolio. We may also use, when appropriate, leverage at the asset level. As of both March 31, 2013 and December 31, 2012, none of our debt is secured by specific loans in our portfolio. Interest expense associated with fund-level indebtedness was approximately $474,000 and $420,000 for the three months ended March 31, 2013 and 2012, respectively. The changes in interest expense are a result of the timing of the leverage added to the fund.
Net income was approximately $7.3 million and $3.3 million for the three months ended March 31, 2013 and 2012, respectively, and net income per share of beneficial interest was approximately $0.39 and $0.41, respectively, for the same periods. Our net income per share of beneficial interest is calculated based on net income divided by the weighted average shares of beneficial interest outstanding. Such net income per share of beneficial interest has fluctuated since the Offering began with the raise of gross proceeds and the deployment of funds available.
As of March 31, 2013, we had originated or purchased 86 loans, including 17 loans that have been repaid in full by the respective borrower, with maximum loan amounts totaling approximately $504.8 million. Of the 69 loans outstanding as of March 31, 2013, 9 loans totaling approximately $28.9 million and 9 loans totaling approximately $26.9 million are included in notes receivable – related parties, net and loan participation interest – related parties, net, respectively, on our balance sheet.
Critical Accounting Policies and Estimates
Our accounting policies have been established to conform to GAAP. The preparation of consolidated financial statements in conformity with GAAP requires management to use judgment in the application of accounting policies, including making estimates and assumptions. These judgments affect the reported amounts of assets and liabilities and disclosure of contingent assets and liabilities at the dates of the consolidated financial statements and the reported amounts of revenue and expenses during the reporting periods. If management’s judgment or interpretation of the facts and circumstances relating to various transactions had been different, it is possible that different accounting policies would have been applied, thus resulting in a different presentation of the consolidated financial statements. Additionally, other companies may utilize different estimates that may impact comparability of our results of operations to those of companies in similar businesses.
Management’s discussion and analysis of financial condition and results of operations are based upon our consolidated financial statements, which have been prepared in accordance with GAAP. GAAP consists of a set of standards issued by theFASBand other authoritative bodies in the form of FASB Statements, Interpretations, FASB Staff Positions, Emerging Issues Task Force consensuses and American Institute of Certified Public Accountants Statements of Position, among others. The FASB recognized the complexity of its standard-setting process and embarked on a revised process in 2004 that culminated in the release on July 1, 2009 of the ASC. The ASC does not change how the Trust accounts for its transactions or the nature of related disclosures made. Rather, the ASC results in changes to how the Trust references accounting standards within its reports. This change was made effective by the FASB for periods ending on or after September 15, 2009. The Trust has updated references to GAAP in this Quarterly Report on Form 10-Q to reflect the guidance in the ASC. The preparation of these consolidated financial statements requires our management to make estimates and assumptions that affect the reported amounts of assets, liabilities, revenues and expenses, and related disclosure of contingent assets and liabilities. On a regular basis, we evaluate these estimates, including investment impairment. These estimates are based on management’s historical industry experience and on various other assumptions that are believed to be reasonable under the circumstances. Actual results may differ from these estimates.
Principles of Consolidation
The consolidated financial statements include the accounts of the Trust and its wholly-owned subsidiaries. All significant intercompany accounts and transactions have been eliminated in consolidation.
Loan Participation Interest – Related Parties
Loan participation interest – related parties represents the purchase of a financial interest in certain interim construction loan, paper lot (residential lots shown on a plat that has been accepted by the city or county, but which is currently undeveloped or under development) loan and finished lot loan facilities originated by our affiliates. We participate in these loans by funding the lending obligations of our affiliates under these credit facilities up to a maximum amount for each participation. Such participations entitle us to receive payments of principal and interest from the borrower up to the amounts funded by us. The participation interests in interim construction loan facilities are collateralized by first lien deeds of trust on the homes financed under the construction loans. The participation interests in paper lot loan and finished lot loan facilities are collateralized by one or more of the following: first or second lien deeds of trust, a pledge of ownership interests in the borrower, assignments of lot sale contracts, or reimbursements of development costs due to the borrower under contracts with districts and cities. As of March 31, 2013, the participations have terms ranging from 6 to 18 months and bear interest at rates ranging from 11.5% to 15%. The participation interests may be paid off prior to maturity; however, we intend to hold all participation interests for the life of the loans.
Notes Receivable and Notes Receivable – Related Parties
Notes receivable and notes receivable – related parties are recorded at the lower of cost or net realizable value. The notes are collateralized by one or more of the following: first or second lien deeds of trust, a pledge of ownership interests in the borrower, assignments of lot sale contracts, or reimbursements of development costs due to the borrower under contracts with districts and cities. None of such notes are insured or guaranteed by a federally owned or guaranteed mortgage agency. As of March 31, 2013, the notes have terms ranging from 1 to 47 months and bear interest at rates ranging from 11% to 15%. The notes may be paid off prior to maturity; however, the Trust intends to hold all notes for the life of the notes.
Determination of the Allowance for Loan Losses
The allowance for loan losses is our estimate of incurred losses in our portfolio of notes receivable, notes receivable – related parties and loan participation interest – related parties. We periodically perform a detailed review of our portfolio of notes and other loans to determine if impairment has occurred and to assess the adequacy of the allowance for loan losses. Our review consists of evaluating economic conditions, the estimated value of the underlying collateral, the guarantor, adverse situations that may affect the borrower’s ability to pay or the value of the collateral, and other relevant factors. This review is inherently subjective as it requires estimates that are susceptible to significant revision as more information becomes available.
In reviewing our portfolio, we use cash flow estimates from the disposition of finished lots, paper lots and undeveloped land as well as cash flow received from the issuance of bonds from municipal reimbursement districts. These estimates are based on current market metrics, including, without limitation, the supply of finished lots, paper lots and undeveloped land, the supply of homes and the rate and price at which land and homes are sold, historic levels and trends, executed contracts, appraisals and discussions with third party market analysts and participants, including homebuilders. We have based our valuations on current and historic market trends on our analysis of market events and conditions, including activity within our portfolio, as well as those of third-party services such as Metrostudy and Residential Strategies, Inc. Cash flow forecasts also have been based on executed purchase contracts which provide base prices, escalation rates, and absorption rates on an individual project basis. For projects deemed to have an extended time horizon for disposition, we have considered third-party appraisals to provide a valuation in accordance with guidelines set forth in the Uniform Standards of Professional Appraisal Practice. In addition to cash flows from the disposition of property, cost analysis has been performed based on estimates of development and senior financing expenditures provided by developers and independent professionals on a project-by-project basis. These amounts have been reconciled with our best estimates to establish the net realizable value of the portfolio.
We charge additions to the allowance for loan losses to current period earnings through a provision for loan losses. Amounts determined to be uncollectible are charged directly against, or “charged off,” and decrease the allowance for loan losses, while amounts recovered on previously charged off accounts increase the allowance. As of March 31, 2013 and December 31, 2012, the allowance for loan losses had a balance of $2.2 million and $1.8 million, respectively, offset against notes receivable (see Note D to accompanying consolidated financial statements).
Organization and Offering Expenses
Organization costs will be expensed as incurred in accordance with Statement of Position 98-5,Reporting on the Costs of Start-up Activities,currently within the scope of FASB ASC 720-15. Offering costs related to raising capital from debt will be capitalized and amortized over the term of such debt. Offering costs related to raising capital from equity reduce equity and are reflected as shares issuance costs in shareholders’ equity. Certain offering costs are currently being paid by our Advisor. As discussed in Note G to the accompanying consolidated financial statements, these costs will be reimbursed to our Advisor by the Trust. For the three months ended March 31, 2013 and the year ended December 31, 2012, the Trust reimbursed its Advisor approximately $1.7 million and $5.9 million, respectively, in connection with the O&O Reimbursement.
Acquisition and Origination Fees
We reimburse UMTH LD, our asset manager, for Acquisition and Origination Fees; provided, however, that no Acquisition and Origination Fees will be paid with respect to any asset level indebtedness we incur. The Acquisition and Origination Fees that we pay will be reduced by the amount of any acquisition and origination fees and expenses paid by borrowers or investment entities to our Advisor or affiliates of our Advisor with respect to our investment. We will not pay any Acquisition and Origination Fees with respect to any participation agreement we enter into with our affiliates or any affiliates of our Advisor for which our Advisor or affiliates of our Advisor previously has received acquisition and origination fees and expenses from such affiliate with respect to the same secured loan or other real estate asset. Such costs are amortized into expense on a straight line basis. For the three months ended March 31, 2013 and the year ended December 31, 2012, the Trust reimbursed UMTH LD approximately $1.5 million and $5.2 million, respectively, for Acquisition and Origination Fees.
Revenue Recognition
Interest income on loan participation interest – related parties, notes receivable and notes receivable – related parties is recognized over the life of the participation agreement or note agreement and recorded on the accrual basis. A loan is placed on non-accrual status and income recognition is suspended at the date at which, in the opinion of management, a full recovery of income and principal becomes more likely than not, but is no longer probable, based upon our review of economic conditions, the estimated value of the underlying collateral, the guarantor, adverse situations that may affect the borrower’s ability to pay or the value of the collateral and other relevant factors. Income recognition is resumed when the loan becomes contractually current and performance is demonstrated to be resumed. Any payments received on loans classified as non-accrual status are typically applied first to outstanding loan amounts and then to the recovery of lost interest. As of March 31, 2013 and December 31, 2012, we were accruing interest on all loan participation interest – related parties, notes receivable and notes receivable – related parties.
Commitment fee income and commitment fee income – related parties represents non-refundable fees charged to borrowers for entering into an obligation that commits us to make or acquire a loan or to satisfy a financial obligation of the borrower when certain conditions are met within a specified time period. When a commitment is considered an integral part of the resulting loan and we believe there is a reasonable expectation that the commitment will be called upon, the commitment fee is recognized as revenue over the life of the resulting loan. As of March 31, 2013 and December 31, 2012, approximately $1.1 million and $970,000, respectively, of unamortized commitment fees are included as an offset of notes receivable. Approximately $237,000 and $263,000 of unamortized commitment fees are included as an offset of notes receivable – related parties as of March 31, 2013 and December 31, 2012, respectively. When we believe it is unlikely that the commitment will be called upon or that the fee is not an integral part of the return of a specific future lending arrangement, the commitment fee is recognized as income when it is earned, based on the specific terms of the commitment. We make a determination of revenue recognition on a case-by-case basis, due to the unique and varying terms of each commitment.
Loan Portfolio
For loans in which we are a subordinate lender, we are generally second in lien priority behind the third party financing. In some cases, we permit builders to file performance deeds of trust in second priority behind the third party financing. In such cases, we are generally third in lien priority behind the third party financing and the builder performance deeds of trust. For loans in which we are a subordinate lender, the aggregate of all loan balances, senior and subordinated, divided by the value of the collateral is 85% or less, unless substantial justification to exceed an 85% loan-to-value ratio exists because of the presence of other underwriting criteria.
We may secure our loans with pledges of equity interests in lieu of, or in addition to, real property liens. Pledges of equity interests are documented by pledge agreements, assignments of equity interests, and uniform commercial code (“UCC”) financing statements. In some cases, we also secure assignments of distributions to secure our pledges of equity interests. Should a loan secured by a pledge of equity interests default, we may foreclose on the pledge of equity interests through a personal property foreclosure under the terms of the pledge agreement and the UCC.
We may secure our loans with assignments of reimbursement rights in lieu of, or in addition to, real property liens. Assignments of reimbursement rights are documented by deeds of trust or by assignments and UCC financing statements. Should a loan secured by an assignment of reimbursement rights default, we may foreclose on the reimbursement rights either in conjunction with a real property foreclosure or through a personal property foreclosure under the terms of the UCC.
As of March 31, 2013, we had entered into 11 participation agreements with related parties (2 of which were repaid in full) with aggregate, maximum loan amounts of approximately $44.5 million (with an unfunded balance of approximately $2.8 million) and 11 related party note agreements (1 of which was repaid in full and 1 of which matured and was not renewed, but was never funded) with aggregate, maximum loan amounts totaling approximately $60.6 million (with an unfunded balance of approximately $13.4 million). Additionally, we had entered into 64 note agreements with third parties (13 of which were repaid in full) with aggregate, maximum loan amounts of approximately $399.8 million, of which approximately $52.4 million has yet to be funded.
The participation agreements outstanding as of March 31, 2013 are made to borrower entities which may hold ownership interests in projects in addition to the project funded by us, may be secured by multiple single-family residential communities, and certain participation agreements are secured by a personal guarantee of the borrower in addition to a lien on the real property or the equity interests in the entity that holds the real property. The outstanding aggregate principal amount of mortgage notes originated by us as of March 31, 2013 are secured by properties located in the Dallas, Fort Worth, Austin, Houston, and San Antonio metropolitan markets in Texas and Denver, Colorado. Security for such loans takes the form of either a direct security interest represented by a first or second lien on the respective property and/or an indirect security interest represented by a pledge of the ownership interests of the entity which holds title to the property.
Approximately 98% of the outstanding aggregate principal amount of mortgage notes originated by us as of March 31, 2013 are secured by properties located throughout Texas and approximately 2% are secured by properties located in Colorado. Approximately 65% of the outstanding aggregate principal amount of mortgage notes originated by us as of March 31, 2013 are secured by properties located in the Dallas, Texas area; approximately 18% are secured by properties located in the Austin, Texas area; approximately 8% are secured by properties located in the Houston, Texas area; approximately 6% are secured by properties located in the San Antonio, Texas area; and approximately 2% are secured by properties located in the Denver, Colorado area.
44 of the 69 loans outstanding as of March 31, 2013, representing approximately 63% of the aggregate principal amount of the outstanding loans, are secured by a first lien on the respective property; 21 of the 69 loans outstanding as of March 31, 2013, representing approximately 39% of the aggregate principal amount of the outstanding loans, are secured by a second lien on the respective property; 7 of the 69 loans outstanding as of March 31, 2013, representing approximately 17% of the aggregate principal amount of the outstanding loans, are secured by a pledge of some or all of the equity interests in the developer entity or other parent entity that owns the borrower entity; 17 of the 69 loans outstanding as of March 31, 2013, representing approximately 38% of the aggregate principal amount of the outstanding loans, are secured by reimbursements of development costs due to the developer under contracts with districts and cities; and 57 of the 69 loans outstanding as of March 31, 2013, representing approximately 87% of the aggregate principal amount of the outstanding loans, are secured by a guarantee of the principals or parent companies of the borrower in addition to the other collateral for the loan. 24 of the 69 loans outstanding as of March 31, 2013, representing approximately 33% of the aggregate principal amount of the outstanding loans, are made with respect to projects that are presently selling finished home lots to national public or regional private homebuilders, or are made with respect to a project in which one of these homebuilders holds an option to purchase the finished home lots and has made a significant forfeitable earnest money deposit. 7 of the 69 loans outstanding as of March 31, 2013, representing approximately 3% of the aggregate principal amount of the outstanding loans, are secured by multiple single-family residential communities.
As of March 31, 2013, we did not have any loans to borrowers that, individually, accounted for over 10% of the outstanding balance of our portfolio. As of March 31, 2013, our largest individual borrower and its affiliates comprised approximately 65% of the outstanding balance of our portfolio.
The interest rates payable range from 11.5% to 15%, with respect to the outstanding participation agreements, and 11% to 15%, with respect to the outstanding notes receivable, including related parties, as of March 31, 2013. The participation agreements have terms to maturity ranging from 6 to 18 months, while the notes receivable have terms ranging from 1 to 47 months.
The following table summarizes our real property loans and investments as of March 31, 2013:
| | | | | | | | | | | | | | | | | | | | | | 2013 | | | 2012 | | | 2011 | | | | |
| | | | | | | | | Interest | | | Original Note | | Maturity | | Maximum Loan | | | Principal | | | Cash | | | Cash | | | Cash | | | Unfunded | |
| Borrower | | Lender (1) | | Location | | Collateral (2) | | Rate | | | Date | | Date (3) | | Amount (3) | | | Balance | | | Receipts | | | Receipts | | | Receipts | | | Balance | |
| | | | | | | | | | | | | | | | | | | | | | | | | | | | | | | | |
| Notes Receivable - Related Parties | | | | | | | | | | | | | | | | | | | | | | | | | | | | | | | | | | | | | | |
| HLL Land Acquisitions of Texas, LP | | UDF IV FI | | San Antonio, TX | | 1st lien; 5 finished lots | | | 13 | % | | 1/18/2010 | | 7/18/2013 | | $ | 1,793,500 | | | $ | 128,229 | | | $ | 1,333,048 | | | $ | 1,821,324 | | | $ | 427,981 | | | $ | - | |
| Buffington Texas Classic Homes, LLC | | UDF IV HF | | Austin, TX | | 1st lien; no homes | | | 13 | % | | 4/30/2010 | | 10/28/2013 | | | 7,500,000 | | | | - | | | | 398,826 | | | | 4,028,025 | | | | 6,364,980 | | | | - | |
| HLL II Land Acquisitions of Texas, LP | | UDF IV FII | | San Antonio, TX | | 1st lien; 23 finished lots, 148 paper lots | | | 13 | % | | 12/22/2010 | | 3/22/2014 | | | 1,854,200 | | | | 1,377,012 | | | | 101,404 | | | | 125,678 | | | | 450,442 | | | | - | |
| HLL Land Acquisitions of Texas, LP | | UDF IV | | Houston, TX | | 1st lien; 91 finished lots, 190 paper lots; 92.8 acres | | | 13 | % | | 2/17/2011 | | 1/21/2015 | | | 9,910,792 | | | | 10,058,487 | | | | - | | | | - | | | | - | | | | - | |
| UDF Ash Creek, LP | | UDF IV | | Dallas, TX | | 1st lien; 8 lots | | | 13 | % | | 4/20/2011 | | 10/20/2013 | | | 3,000,000 | | | | 2,512,756 | | | | 80,783 | | | | 75,711 | | | | - | | | | 330,749 | |
| UDF TX Two, LP | | UDF IV | | Austin, TX | | 1st lien; 70 lots | | | 13 | % | | 9/20/2012 | | 9/20/2014 | (4) | | 3,500,000 | | | | 3,317,557 | | | | - | | | | 49,102 | | | | - | | | | 133,341 | |
| UDF PM, LLC | | UDF IV | | Lubbock, TX | | Reimbursements | | | 13 | % | | 10/17/2012 | | 10/17/2015 | | | 5,087,250 | | | | 1,408,594 | | | | - | | | | - | | | | - | | | | 3,678,656 | |
| HLL Land Acquisitions of Texas, LP | | UDF IV | | San Antonio, TX | | 1st lien; 94 paper lots | | | 13 | % | | 11/29/2012 | | 11/29/2015 | | | 6,414,410 | | | | 3,310,473 | | | | - | | | | - | | | | - | | | | 3,103,937 | |
| One KR Venture, LP | | UDF IV | | San Antonio, TX | | 1st lien and pledge of equity interest; 157 paper lots; 290 acres | | | 13 | % | | 12/14/2012 | | 6/14/2016 | | | 15,295,897 | | | | 6,773,419 | | | | 2,422,984 | | | | - | | | | - | | | | 6,099,494 | |
| | | | | | | | | | | | | | | | | | | | | | | | | | | | | | | | | | | | | | | |
| Subtotal - Notes Receivable - Related Parties | | | | | | | | | | | | | | | | $ | 54,356,049 | | | $ | 28,886,527 | | | $ | 4,337,045 | | | $ | 6,099,840 | | | $ | 7,243,403 | | | $ | 13,346,177 | |
| | | | | | | | | | | | | | | | | | | | | | | | | | | | | | | | | | | | | | | |
| Notes Receivable - Non-Related Parties | | | | | | | | | | | | | | | | | | | | | | | | | | | | | | | | | | | | | | |
| CTMGT Granbury, LLC | | UDF IV FI | | Austin, TX | | 1st lien; 552 acres | | | 13 | % | | 5/21/2010 | | 5/21/2013 | | $ | 7,500,000 | | | $ | 7,364,766 | | | $ | - | | | $ | - | | | $ | - | | | $ | 135,234 | |
| Crescent Estates Custom Homes, LP | | UDF IV FII | | Fort Worth, TX | | 1st lien; 18 homes | | | 13 | % | | 6/10/2010 | | 6/10/2013 | | | 4,000,000 | | | | 3,627,023 | | | | 452,305 | | | | 3,343,663 | | | | 1,472,881 | | | | - | |
| CTMGT Land Holdings, LP | | UDF IV | | Rockwall, TX | | 2nd lien; 807 acres | | | 14 | % | | 7/23/2010 | | 1/28/2014 | | | 16,000,000 | | | | 13,786,718 | | | | - | | | | - | | | | - | | | | 277,421 | |
| 165 Howe, LP | | UDF IV | | Denton and Tarrant County, TX | | Reimbursements | | | 13 | % | | 11/22/2010 | | 11/22/2013 | | | 2,170,000 | | | | 1,236,948 | | | | - | | | | 591,534 | | | | 707,815 | | | | - | |
| BHM Highpointe, LTD | | UDF IV FI | | Austin, TX | | 1st lien; 42 paper lots | | | 13 | % | | 11/16/2010 | | 11/30/2013 | | | 2,672,085 | | | | 2,286,898 | | | | - | | | | 11,635 | | | | - | | | | 373,552 | |
| The Resort at Eagle Mountain Lake, LP | | UDF IV FII | | Tarrant County, TX | | 1st lien and reimbursements; 66 finished lots | | | 13 | % | | 12/21/2010 | | 12/21/2013 | | | 8,715,000 | | | | 8,397,025 | | | | - | | | | - | | | | - | | | | 317,975 | |
| FH 295 LLC/CTMGT | | UDF IV AC | | Denton County, TX | | 1st and 2nd lien and reimbursements; 169 finished lots; 250 acres | | | 15 | % | | 10/5/2010 | | 10/5/2013 | | | 20,368,000 | | | | 20,864,972 | | | | - | | | | - | | | | - | | | | - | |
| Len-Buff Land Acquisitions of Texas, LP | | UDF IV | | Austin, TX | | 2nd lien; 6 finished lots | | | 14 | % | | 10/28/2010 | | 6/30/2013 | | | 3,355,350 | | | | 107,359 | | | | 52,541 | | | | 439,546 | | | | 2,509,263 | | | | 111,185 | |
| CTMGT Williamsburg, LLC | | UDF IV FII | | Fate, TX | | 1st lien and reimbursements; 121 finished lots; 98 acres of undeveloped land | | | 13 | % | | 11/30/2011 | | 10/31/2014 | | | 24,500,000 | | | | 22,096,412 | | | | - | | | | 388,995 | | | | - | | | | 2,014,592 | |
| UDF Sinclair, LP | | UDF IV AC | | San Antonio, TX | | 1st lien; 17 finished lots | | | 13 | % | | 2/16/2011 | | 12/31/2013 | | | 1,479,000 | | | | 256,095 | | | | 69,230 | | | | 598,997 | | | | 513,375 | | | | 41,303 | |
| Buffington Land, LTD | | UDF IV | | Austin, TX | | 1st lien and reimbursements; 12 finished lots | | | 13 | % | | 1/26/2011 | | 1/26/2014 | | | 14,727,351 | | | | 14,959,006 | | | | - | | | | 7,285,835 | | | | 1,773,247 | | | | - | |
| Shale-114, LP | | UDF IV | | Denton County, TX | | 2nd lien; 6 lots; 507 paper lots | | | 13 | % | | 3/28/2011 | | 3/28/2014 | | | 3,405,200 | | | | 3,401,764 | | | | 165,614 | | | | - | | | | - | | | | - | |
| Woods Chin Chapel, LTD | | UDF IV | | Denton County, TX | | 2nd lien; 97 acres; 154 paper lots | | | 13 | % | | 6/30/2011 | | 6/30/2014 | | | 10,755,000 | | | | 9,552,790 | | | | - | | | | - | | | | 951,675 | | | | 250,535 | |
| Megatel Homes II, LLC | | UDF IV HF | | Fort Worth, TX | | 1st lien; 141 homes | | | 13 | % | | 8/24/2011 | | 8/24/2013 | | | 20,000,000 | | | | 20,444,986 | | | | 3,613,320 | | | | 7,627,536 | | | | 223,776 | | | | - | |
| Buffington Land, LTD | | UDF IV | | Austin, TX | | 1st lien; 85 paper lots | | | 11 | % | | 9/15/2011 | | 9/15/2013 | | | 7,516,654 | | | | 6,224,121 | | | | 665,340 | | | | 668,001 | | | | - | | | | - | |
| High Trophy Development, LLC | | UDF IV AC | | Trophy Club, TX | | 1st lien; 37.578 acres | | | 13 | % | | 11/7/2011 | | 7/29/2014 | | | 10,500,000 | | | | 6,345,630 | | | | 2,982,140 | | | | - | | | | - | | | | 1,172,230 | |
| 165 Howe, LP | | UDF IV | | Adams County, CO | | 1st lien and reimbursements; 301 paper lots | | | 13 | % | | 7/29/2011 | | 6/30/2015 | | | 7,000,000 | | | | 6,252,743 | | | | - | | | | - | | | | - | | | | 747,257 | |
| CTMGT Montalcino, LLC | | UDF IV | | Flower Mound, TX | | 2nd lien and pledge of equity; 478 acres | | | 13 | % | | 12/13/2011 | | 12/13/2014 | | | 25,000,000 | | | | 24,605,284 | | | | - | | | | - | | | | - | | | | 394,716 | |
| Crescent Estates Custom Homes, LP | | UDF IV | | Royce City, TX | | 1st lien; 12 homes | | | 13 | % | | 4/27/2012 | | 4/27/2013 | | | 7,770,000 | | | | 6,458,929 | | | | 163,743 | | | | 669,913 | | | | - | | | | 477,416 | |
| PH SPM2B, LP | | UDF IV FIII | | Austin, TX | | 1st lien; 16 finished lots | | | 13 | % | | 5/25/2012 | | 3/31/2014 | | | 1,731,595 | | | | 1,194,663 | | | | 124,893 | | | | - | | | | - | | | | 412,039 | |
| PH SLII, LP | | UDF IV | | Austin, TX | | 1st lien and reimbursements; 80 finished lots | | | 13 | % | | 6/12/2012 | | 12/31/2014 | | | 4,727,016 | | | | 3,743,419 | | | | - | | | | - | | | | - | | | | 983,597 | |
| CTMGT Barcelona, LLC | | UDF IV | | McKinney, TX | | 2nd lien and pledge of equity; 71.44 acres | | | 13 | % | | 6/6/2012 | | 6/6/2015 | | | 4,125,000 | | | | 1,493,524 | | | | - | | | | - | | | | - | | | | 2,631,476 | |
| PH SPM2B, LP | | UDF IV | | Austin, TX | | 1st lien; 68 paper lots | | | 13 | % | | 6/26/2012 | | 6/30/2015 | | | 3,738,507 | | | | 1,927,674 | | | | - | | | | - | | | | - | | | | 1,810,833 | |
| Buffington Meadow Park, LTD | | UDF IV FIII | | Austin, TX | | 1st lien; 18 finished lots | | | 13 | % | | 6/29/2012 | | 12/31/2013 | | | 638,613 | | | | 284,497 | | | | 153,734 | | | | 200,626 | | | | - | | | | - | |
| High Trophy Development, LLC | | UDF IV FIII | | Denton County, TX | | 1st lien; 2 finished lots | | | 13 | % | | 7/26/2011 | | 7/31/2013 | | | 3,900,000 | | | | 326,691 | | | | - | | | | 1,846,606 | | | | 1,568,733 | | | | 157,970 | |
| CTMGT Lots Holdings, LLC | | UDF IV | | Denton County, TX | | 1st lien; 129 finished lots | | | 13 | % | | 7/29/2011 | | 9/29/2014 | | | 2,905,000 | | | | 2,140,769 | | | | - | | | | - | | | | - | | | | 764,231 | |
| CTMGT Lots Holdings, LLC | | UDF IV | | Fort Worth, TX | | Pledge of equity | | | 13 | % | | 7/29/2011 | | 10/31/2013 | | | 605,000 | | | | 61,330 | | | | - | | | | 426,597 | | | | 90,487 | | | | 26,587 | |
| One Creekside, LP | | UDF IV | | Fort Worth, TX | | 1st lien; 66 finished lots | | | 13 | % | | 11/30/2011 | | 12/14/2014 | (4) | | 1,550,000 | | | | 1,276,916 | | | | - | | | | - | | | | - | | | | 273,084 | |
| CTMGT Williamsburg, LLC | | UDF IV | | Fate, TX | | 1st lien; 244 acres | | | 13 | % | | 2/7/2012 | | 2/7/2015 | | | 4,853,500 | | | | 4,415,014 | | | | - | | | | - | | | | - | | | | 438,486 | |
| CTMGT Valley Ridge, LLC | | UDF IV | | Fort Worth, TX | | 1st lien; 38 acres | | | 13 | % | | 3/2/2012 | | 3/2/2015 | | | 1,335,000 | | | | 1,105,843 | | | | - | | | | - | | | | - | | | | 229,157 | |
| Hidden Lakes Investments, LP | | UDF IV FIV | | Houston, TX | | 1st lien and reimbursements; 188 finished lots | | | 13 | % | | 1/30/2012 | | 4/30/2015 | (4) | | 9,986,762 | | | | 8,209,782 | | | | - | | | | 153,912 | | | | - | | | | 1,623,068 | |
| One Windsor Hills, LP | | UDF IV | | Grand Prairie, TX | | 2nd lien and reimbursements; 576 acres | | | 13 | % | | 5/9/2012 | | 5/9/2015 | | | 7,805,000 | | | | 7,804,560 | | | | - | | | | - | | | | - | | | | 440 | |
| One Windsor Hills, LP | | UDF IV | | Grand Prairie, TX | | 2nd lien and reimbursements; 128 acres | | | 13 | % | | 5/25/2012 | | 5/25/2015 | | | 1,610,000 | | | | 1,502,301 | | | | - | | | | - | | | | - | | | | 107,699 | |
| CTMGT Alpha Ranch, LLC | | UDF IV | | Fort Worth, TX | | 2nd lien and pledge of equity; 1,122 acres | | | 13 | % | | 7/31/2012 | | 7/31/2014 | | | 14,250,000 | | | | 12,275,621 | | | | - | | | | - | | | | - | | | | 1,974,379 | |
| CTMGT Frisco 113, LLC | | UDF IV | | Frisco, TX | | 2nd lien; 113 acres | | | 13 | % | | 7/31/2012 | | 7/31/2014 | | | 3,350,000 | | | | 2,476,769 | | | | - | | | | - | | | | - | | | | 873,231 | |
| BHM Highpointe, LTD | | UDF IV FIII | | Austin, TX | | 1st lien and reimbursements; 53 paper lots | | | 13 | % | | 8/7/2012 | | 12/31/2014 | | | 3,809,735 | | | | 2,873,412 | | | | - | | | | - | | | | - | | | | 936,323 | |
| 287 Waxahachie, LP | | UDF IV | | Waxahachie, TX | | 1st lien and reimbursements; 138 lots; 476 acres | | | 13 | % | | 8/10/2012 | | 8/10/2013 | | | 9,732,500 | | | | 4,524,057 | | | | - | | | | - | | | | - | | | | 5,208,443 | |
| UDF Sinclair, LP | | UDF IV | | San Antonio, TX | | 1st lien; 68 finished lots | | | 13 | % | | 8/28/2012 | | 6/30/2015 | | | 1,323,404 | | | | 1,046,581 | | | | - | | | | - | | | | - | | | | 276,823 | |
| SH 161 Acquisitions, LP | | UDF IV | | Irving, TX | | 2nd lien; 72 lots | | | 13 | % | | 9/7/2012 | | 9/7/2015 | | | 1,270,000 | | | | 213,307 | | | | - | | | | - | | | | - | | | | 1,056,693 | |
| Megatel Homes II, LLC | | UDF IV | | Austin, TX; San Antonio, TX | | 1st lien; 14 lots | | | 13 | % | | 3/27/2012 | | 11/27/2013 | | | 1,500,000 | | | | 795,185 | | | | - | | | | - | | | | - | | | | 704,815 | |
| CTMGT AR II, LLC | | UDF IV | | Denton County, TX | | 2nd lien and pledge of equity; 161 acres | | | 13 | % | | 11/14/2012 | | 11/14/2015 | | | 2,880,000 | | | | 420,426 | | | | - | | | | - | | | | - | | | | 2,459,574 | |
| Pine Trace Village, LLC | | UDF IV | | Houston, TX | | 1st lien and reimbursements; 43 paper lots | | | 13 | % | | 11/16/2012 | | 11/16/2015 | | | 1,953,432 | | | | 148,522 | | | | - | | | | - | | | | - | | | | 1,804,910 | |
| CTMGT Legends, LLC | | UDF IV | | Denton County, TX | | 2nd lien; 20 acres | | | 13 | % | | 11/16/2012 | | 11/16/2015 | | | 2,425,000 | | | | 1,589,323 | | | | - | | | | - | | | | - | | | | 835,677 | |
| CTMGT Erwin Farms, LLC | | UDF IV | | Collin County, TX | | 2nd lien; 565 paper lots | | | 13 | % | | 12/6/2012 | | 12/6/2015 | | | 6,550,000 | | | | 3,073,937 | | | | - | | | | - | | | | - | | | | 3,476,063 | |
| BLG Plantation, LLC | | UDF IV | | Houston, TX | | 1st lien; 136 paper lots | | | 13 | % | | 11/26/2012 | | 11/26/2015 | | | 4,095,000 | | | | 1,478,077 | | | | - | | | | - | | | | - | | | | 2,616,923 | |
| CTMGT Regatta II, LLC | | UDF IV | | Denton County, TX | | 2nd lien; 516 acres | | | 13 | % | | 12/27/2012 | | 10/25/2015 | | | 7,830,000 | | | | 6,617,242 | | | | - | | | | - | | | | - | | | | 1,212,758 | |
| CTMGT Rancho Del Lago, LLC | | UDF IV | | San Antonio, TX | | 2nd lien; 691 acres | | | 13 | % | | 12/31/2012 | | 12/31/2013 | | | 5,363,151 | | | | 3,531,160 | | | | - | | | | - | | | | - | | | | 1,831,991 | |
| One Windsor Hills, LP | | UDF IV | | Grand Prairie, TX | | 2nd lien and reimbursements; 879 acres | | | 13 | % | | 10/16/2012 | | 10/16/2015 | | | 10,450,000 | | | | 9,289,026 | | | | - | | | | - | | | | - | | | | 1,160,974 | |
| CTMGT Regatta | | UDF IV | | Denton County, TX | | 2nd lien and reimbursements; 346 acres | | | 13 | % | | 10/25/2012 | | 10/25/2015 | | | 3,785,000 | | | | 3,784,917 | | | | - | | | | - | | | | - | | | | 83 | |
| CTMGT Rockwall 38, LLC | | UDF IV | | Denton County, TX | | 2nd lien; 76 paper lots | | | 13 | % | | 2/4/2013 | | 2/4/2016 | | | 1,800,000 | | | | 1,152,001 | | | | - | | | | - | | | | - | | | | 647,999 | |
| BLG Hawkes, LLC | | UDF IV | | Austin, TX | | 2nd lien; 317 paper lots | | | 13 | % | | 1/25/2013 | | 1/25/2016 | | | 10,565,880 | | | | 978,009 | | | | - | | | | - | | | | - | | | | 9,587,871 | |
| | | | | | | | | | | | | | | | | | | | | | | | | | | | | | | | | | | | | | | |
| Subtotal - Notes Receivable - Non-Related Parties | | | | | | | | | | | | | | | | $ | 339,877,735 | | | $ | 270,024,024 | | | $ | 8,442,860 | | | $ | 24,253,396 | | | $ | 9,811,252 | | | $ | 52,437,613 | |
| | | | | | | | | | | | | | | | | | | | | | | | | | | | | | | | | | | | | | | |
| Total Notes Receivable | | | | | | | | | | | | | | | | $ | 394,233,784 | | | $ | 298,910,551 | | | $ | 12,779,905 | | | $ | 30,353,236 | | | $ | 17,054,655 | | | $ | 65,783,790 | |
| | | | | | | | | | | | | | | | | | | | | | | | | | | | | | | | | | | | | | | |
| Loan Participation Interests - Related Parties | | | | | | | | | | | | | | | | | | | | | | | | | | | | | | | | | | | | | | |
| UMT Home Finance, LP (5) | | UDF IV | | Austin, TX | | Participation in 1st lien; 64 homes | | | 13 | % | | 12/18/2009 | | 10/28/2013 | | $ | 4,737,819 | | | $ | 4,737,819 | | | $ | 3,210,101 | | | $ | 5,728,845 | | | $ | 10,904,280 | | | $ | - | |
| UDF III, LP | | UDF IV | | Rockwall, TX | | Participation in 2nd lien; 161 finished lots | | | 15 | % | | 6/30/2010 | | 1/28/2014 | | | 3,735,750 | | | | 3,603,656 | | | | - | | | | - | | | | - | | | | 132,094 | |
| UDF III, LP | | UDF IV | | Rockwall, TX | | Participation in pledge of equity; 472 acres | | | 15 | % | | 6/30/2010 | | 1/28/2014 | | | 11,500,000 | | | | 10,632,663 | | | | - | | | | - | | | | - | | | | 867,337 | |
| UDF III, LP | | UDF IV | | Austin, TX | | Participation in 1st lien; 11 lots | | | 14 | % | | 3/24/2010 | | 8/21/2013 | | | 2,000,000 | | | | 499,011 | | | | - | | | | 389,836 | | | | - | | | | 845,448 | |
| UMT Home Finance III, LP | | UDF IV FII | | Houston, TX | | Participation in 1st lien and reimbursements; 34 finished lots | | | 13 | % | | 5/31/2012 | | 3/29/2014 | | | 7,535,000 | | | | 5,464,938 | | | | - | | | | 1,149,157 | | | | - | | | | 920,905 | |
| UMT Home Finance III, LP | | UDF IV | | Dallas, TX | | Participation in 1st lien; 33 finished lots | | | 13 | % | | 6/10/2011 | | 6/10/2014 | | | 3,150,000 | | | | 299,420 | | | | 517,289 | | | | 1,071,628 | | | | 1,318,275 | | | | - | |
| UMT Home Finance III, LP | | UDF IV | | Fort Worth, TX | | Participation in 1st lien; 44 finished lots | | | 11.5 | % | | 10/4/2011 | | 10/4/2013 | | | 2,870,000 | | | | 1,288,912 | | | | - | | | | 284,188 | | | | 1,252,472 | | | | 44,428 | |
| UDF III, LP | | UDF IV | | Anna, TX | | Participation in 1st lien and pledge of equity; 40 lots | | | 12 | % | | 6/11/2012 | | 6/4/2013 | | | 1,700,000 | | | | 364,011 | | | | - | | | | 1,490,089 | | | | - | | | | - | |
| | | | | | | | | | | | | | | | | | | | | | | | | | | | | | | | | | | | | | | |
| Total Loan Participation Interests - Related Parties | | | | | | | | | | | | | | | | $ | 37,228,569 | | | $ | 26,890,430 | | | $ | 3,727,390 | | | $ | 10,113,743 | | | $ | 13,475,027 | | | $ | 2,810,212 | |
| | | | | | | | | | | | | | | | | | | | | | | | | | | | | | | | | | | | | | | |
| Grand Total | | | | | | | | | | | | | | | | $ | 431,462,353 | | | $ | 325,800,981 | | | $ | 16,507,295 | | | $ | 40,466,979 | | | $ | 30,529,682 | | | $ | 68,594,002 | |
| (1) | Represents lender as of March 31, 2013. In some cases, a loan may have been originated by UDF IV and subsequently assigned to a wholly-owned subsidiary. |
| (2) | Reflects remaining collateral as of March 31, 2013. |
| (3) | Reflects most current amendment to loan as of March 31, 2013, if applicable. |
| (4) | Loan acquired from a senior lender. Original Note Date represents date of acquisition. |
| (5) | UDF IV has entered into two participation agreements to participate in two construction loans with UMT Home Finance, LP. The activity associated with these participations is combined into one line item for purposes of this table. |
Results of Operations
The three months ended March 31, 2013 as compared to the three months ended March 31, 2012
Revenues
Interest income (including interest income – related parties) for the three months ended March 31, 2013 and 2012 was approximately $10.3 million and $5.1 million, respectively. The increase in interest income for the three months ended March 31, 2013 is primarily the result of our increased notes receivable, notes receivable – related parties and loan participation interest – related parties portfolio of approximately $331.2 million as of March 31, 2013, compared to approximately $167.7 million as of March 31, 2012 as proceeds raised from our Offering continue to be invested in revenue-generating real estate investments.
Commitment fee income (including commitment fee income – related parties) for the three months ended March 31, 2013 and 2012 was approximately $275,000 and $91,000, respectively. The increase in commitment fee income for the three months ended March 31, 2013 is primarily the result of an increase in loan commitments as proceeds raised from our Offering continue to be invested in revenue-generating real estate investments.
We expect revenues to increase in the near future as we continue to raise proceeds from the Offering and invest such proceeds in revenue-generating real-estate investments.
Expenses
Interest expense related to our notes payable and lines of credit totaled approximately $474,000 and $420,000 for the three months ended March 31, 2013 and 2012, respectively. Interest expense will fluctuate based on the timing of leverage introduced to the fund as well as the timing of draws and payments on our notes payable and lines of credit.
Advisory fee – related party expense represents the expense associated with the Advisory Fees discussed in Note H and was approximately $1.6 million and $775,000 for the three months ended March 31, 2013 and 2012, respectively. The increase in advisory fee – related party expense is associated with the increase in our average invested assets as proceeds raised from our Offering continue to be invested in revenue-generating real estate investments.
General and administrative expense for the three months ended March 31, 2013 and 2012 was approximately $262,000 and $175,000, respectively. General and administrative expense consists primarily of legal and accounting fees, transfer agent fees, insurance expense and amortization of deferred financing costs. The increase in general and administrative expense is primarily associated with an increase in transfer agent fees commensurate with an increase in shareholders.
General and administrative – related parties expense for the three months ended March 31, 2013 and 2012 was approximately $463,000 and $261,000, respectively. General and administrative – related parties expense consists of amortization of Acquisition and Origination Fees, amortization of Debt Financing Fees and expense associated with Credit Enhancement Fees. The increase in general and administrative – related parties expense is primarily a result of an increase in amortization of Acquisition and Origination Fees commensurate with the increase in our investment portfolio over the same period.
Comparison Charts
The chart below summarizes the approximate expenses associated with related parties for the three months ended March 31, 2013 and 2012. We believe that these fees and reimbursements are reasonable and customary for comparable mortgage REITs.
| | | For the Three Months Ended March 31, | |
| Purpose | | 2013 | | | 2012 | |
| | | | | | | | | | | | | | | | | |
| Advisory Fees | | $ | 1,642,000 | | | | 100 | % | | $ | 775,000 | | | | 100 | % |
| | | | | | | | | | | | | | | | | |
| Total Advisory fee – related party | | $ | 1,642,000 | | | | 100 | % | | $ | 775,000 | | | | 100 | % |
| | | | | | | | | | | | | | | | | |
| Amortization of Debt Financing Fees | | $ | 42,000 | | | | 9 | % | | $ | 52,000 | | | | 20 | % |
| | | | | | | | | | | | | | | | | |
| Amortization of Acquisition and Origination Fees | | | 372,000 | | | | 80 | % | | | 165,000 | | | | 63 | % |
| | | | | | | | | | | | | | | | | |
| Credit Enhancement Fees | | | 49,000 | | | | 11 | % | | | 44,000 | | | | 17 | % |
| | | | | | | | | | | | | | | | | |
| Total General and administrative – related parties | | $ | 463,000 | | | | 100 | % | | $ | 261,000 | | | | 100 | % |
The chart below summarizes the approximate payments to related parties for the three months ended March 31, 2013 and the year ended December 31, 2012:
| Payee | | Purpose | | For the Three Months
Ended
March 31, 2013 | | | For the Year Ended
December 31, 2012 | |
| UMTH GS | | | | | | | | | | | | | | | | | | |
| | | O&O Reimbursement | | $ | 1,728,000 | | | | 35 | % | | $ | 5,878,000 | | | | 38 | % |
| | | Advisory Fees | | | 1,558,000 | | | | 32 | % | | | 3,924,000 | | | | 26 | % |
| | | Debt Financing Fees | | | 55,000 | | | | 1 | % | | | 148,000 | | | | 1 | % |
| | | | | | | | | | | | | | | | | | | |
| UMTH LD | | | | | | | | | | | | | | | | | | |
| | | Acquisition and Origination Fees | | | 1,526,000 | | | | 31 | % | | | 5,155,000 | | | | 34 | % |
| | | | | | | | | | | | | | | | | | | |
| UDF III | | | | | | | | | | | | | | | | | | |
| | | Credit Enhancement Fees | | | 34,000 | | | | 1 | % | | | 115,000 | | | | 1 | % |
| | | | | | | | | | | | | | | | | | | |
| Total Payments | | | | $ | 4,901,000 | | | | 100 | % | | $ | 15,220,000 | | | | 100 | % |
We intend to grow our portfolio in conjunction with the increase in proceeds raised in the Offering. We intend to deploy such proceeds to the borrowers and markets in which we have experience and as markets dictate in accordance with the economic factors conducive for a stable residential market. We expect general and administrative and advisory fee – related party expenses to increase commensurate with the growth of our portfolio.
Cash Flow Analysis
Cash flows provided by operating activities for the three months ended March 31, 2013 were approximately $3.7 million and were comprised primarily of net income offset partially by accrued interest receivable. Cash flows provided by operating activities for the three months ended March 31, 2012 were approximately $1.4 million and were comprised primarily of net income offset partially by accrued interest receivable.
Cash flows used in investing activities for the three months ended March 31, 2013 and 2012 were approximately $26.0 million and $21.5 million, respectively, resulting from originations of notesreceivable (including related party transactions) and loan participation interest – related parties, offset byreceipts from notes receivable (including related party transactions) and loan participation interest – related parties.
Cash flows provided by financing activities for the three months ended March 31, 2013 were approximately $42.5 million and were comprised primarily of funds received from the issuance of common shares of beneficial interest pursuant to the Offering and shareholders’ distribution reinvestment, offset slightly by cash distributions to shareholders and payments of offering costs. Cash flows provided by financing activities for the three months ended March 31, 2012 were approximately $21.4 million and were comprised primarily of funds received from the issuance of common shares of beneficial interest pursuant to the Offering and shareholders’ distribution reinvestment, offset by payments on notes payable, cash distributions to shareholders and payments of offering costs.
Our cash and cash equivalents were approximately $43.4 million as of March 31, 2013, compared to approximately $7.3 million at March 31, 2012.
Funds from Operations and Modified Funds from Operations
Due to certain unique operating characteristics of real estate companies, the National Association of Real Estate Investment Trusts (“NAREIT”), an industry trade group, has promulgated a measure known as funds from operations (“FFO”), which we believe to be an appropriate supplemental measure to reflect the operating performance of a REIT. The use of FFO is recommended by the REIT industry as a supplemental performance measure. FFO is not equivalent to our net income or loss as determined under GAAP.
We define FFO, a non-GAAP measure, consistent with the standards established by the White Paper on FFO approved by the Board of Governors of NAREIT, as revised in February 2004 (the “White Paper”). The White Paper defines FFO as net income or loss computed in accordance with GAAP, excluding gains or losses from sales of property and asset impairment write-downs, plus depreciation and amortization, and after adjustments for unconsolidated partnerships and joint ventures. Adjustments for unconsolidated partnerships and joint ventures are calculated to reflect FFO. Our FFO calculation complies with NAREIT’s policy described above.
Loans are considered impaired and disregarded from FFO calculations when, based on current information and events, it is probable that we will be unable to collect all amounts due in accordance with the contractual terms of the loan agreement, including scheduled principal and interest payments. Impairment is generally evaluated on an individual loan basis for each loan in the portfolio. If an individual loan is considered impaired, this would lead us to evaluate whether the carrying value exceeds the fair market value requiring an impairment for excess carrying value. A specific valuation allowance may be allocated, if necessary, so that the individual loan is reported net, at the present value of estimated future cash flows using the loan’s existing rate or at the fair value of collateral if repayment is expected solely from collateral. Loans that are not individually considered impaired are collectively and qualitatively measured as a portfolio for general valuation allowance. Investors should note that in reviewing our portfolio for this valuation analysis, we use cash flow estimates from the disposition of finished lots, paper lots (residential lots shown on a plat that has been accepted by the city or county, but which is currently undeveloped or under development) and undeveloped land as well as cash flow received from the issuance of bonds from municipal reimbursement districts. These estimates are based on current market metrics, including, without limitation, the supply of finished lots, paper lots and undeveloped land, the supply of homes and the rate and price at which land and homes are sold, historic levels and trends, executed purchase contracts, appraisals and discussions with third-party market analysts and participants, including homebuilders. We base our valuations on current and historic market trends, analysis of market events and conditions, including activity within our portfolio, as well as the analysis of third-party services such as Metrostudy and Residential Strategies, Inc. Cash flow forecasts are also based on executed purchase contracts which provide base prices, escalation rates, and absorption rates on an individual project basis. For projects deemed to have an extended time horizon for disposition, we consider third-party appraisals to provide a valuation in accordance with guidelines set forth in the Uniform Standards of Professional Appraisal Practice. In addition to cash flows from the disposition of property, cost analysis is performed based on estimates of development and senior financing expenditures provided by developers and independent professionals on a project-by-project basis. These amounts are reconciled with our best estimates to establish the net realizable value of the portfolio. While impairment charges are excluded from the calculation of FFO as described above, investors are cautioned that due to the fact that impairments are based on factors described above and that we intend to have a relatively limited term of our operations, it could be difficult to recover any impairment charges through the eventual disposition of the collateral. We have not had any impairment charges and, therefore, no such adjustments to FFO.
However, changes in the accounting and reporting promulgations under GAAP (including changes that were put into effect in 2009 subsequent to the establishment of NAREIT’s definition of FFO for acquisition fees and expenses from a capitalization/depreciation model to an expensed-as-incurred model) have impacted the reporting of operating income for all industries. Additionally, publicly registered, non-listed REITs typically have a significant amount of acquisition activity and are substantially more dynamic during their initial years of investment and operation as compared to later years and therefore require additional adjustments to FFO in evaluating performance. Due to these and other unique features of publicly registered, non-listed REITs, the Investment Program Association (the “IPA”), an industry trade group, has standardized a measure known as modified funds from operations (“MFFO”), which we believe to be another appropriate supplemental measure to reflect the operating performance of a REIT. The use of MFFO is recommended by the IPA as a supplemental performance measure for publicly registered, non-listed REITs. MFFO is a metric used by management to evaluate sustainable performance and dividend policy. MFFO is not equivalent to our net income or loss as determined under GAAP and MFFO may not be a useful measure of the impact of long-term operating performance or may not be useful as a comparative measure to other publicly registered, non-traded REITs, unless we continue to operate with a limited life and targeted exit strategy, as currently intended.
We define MFFO, a non-GAAP measure, consistent with the IPA’s Guideline 2010-01, Supplemental Performance Measure for Publicly Registered, Non-Listed REITs: Modified Funds from Operations (Practice Guideline), issued by the IPA in November 2010. The Practice Guideline defines MFFO as FFO further adjusted for the following items included in the determination of GAAP net income or loss: acquisition and origination fees and expenses; amounts relating to deferred rent receivables and amortization of above and below market leases and liabilities; accretion of discounts and amortization of premiums on debt investments; mark-to-market adjustments included in net income or loss; gains or losses included in net income or loss from the extinguishment or sale of debt, hedges, foreign exchange, derivatives or securities holdings where trading of such holdings is not a fundamental attribute of the business plan, unrealized gains or losses resulting from consolidation from, or deconsolidation to, equity accounting, and after adjustments for consolidated and unconsolidated partnerships and joint ventures, with such adjustments calculated to reflect MFFO on the same basis. Mark-to-market and fair value adjustments to calculate MFFO may be reflective of on-going operations or reflect unrealized operational impacts, since such adjustments may be based upon current operational issues relating to our portfolio, industry or general market conditions. Mark-to-market and fair value adjustments represent a continuous process, analyzed on a quarterly and/or annual basis in accordance with GAAP. Our MFFO calculation complies with the IPA’s Practice Guideline described above. In calculating MFFO, we adjust for acquisition related expenses. Acquisition and origination fees paid to our Advisor or its affiliates in connection with the origination of notes receivables are amortized into expense on a straight line basis. Such acquisition related expenses are paid in cash to our Advisor or its affiliates that would otherwise be available to distribute to our shareholders. The origination and acquisition of secured loans, and the corresponding expenses associated with that process, is a key operational feature of our business plan in order to generate operating revenues and cash flows to make distributions to our shareholders. In the future, if we are not able to raise additional proceeds from our initial offering and our follow-on offering, if and when it is declared effective by the SEC, this could result in us paying acquisition and origination fees and expenses due to our Advisor or its affiliates, or a portion thereof, with net proceeds from borrowed funds, operational earnings or cash flows, principal repayments, or ancillary cash flows. As a result, the amount of proceeds available for investment and operations would be reduced, or we may incur additional interest expense as a result of borrowed funds. Such fees will not be reimbursed by our Advisor or its affiliates. Acquisition related expenses under GAAP are considered operating expenses and as expenses included in the determination of net income (loss) and income (loss) from continuing operations, both of which are performance measures under GAAP. Management believes that acquisition related expenses are non-operating and do not affect our long-term operating performance; therefore, excluding acquisition and origination costs from MFFO provides investors with supplemental performance information that is consistent with the performance models used by management, and provides investors with a view of our portfolio over time, independent of direct costs associated with the timing of acquisition activity. MFFO would only be comparable to other publicly registered, non-listed REITs that have completed their acquisition activity and have similar operating characteristics to us.
With respect to loan loss provisions, management does not include these expenses in our evaluation of the operating performance of our real estate loan portfolio, as we believe these costs will be reflected in our reported results from operations if and when we actually realize a loss on a real estate investment. As many other publicly registered, non-listed REITs exclude such charges in reporting their MFFO, we believe that our calculation and reporting of MFFO will assist investors and analysts in comparing our performance versus other publicly registered, non-listed REITs. The other adjustments included in the IPA’s Practice Guideline are not applicable to us for the three months ended March 31, 2013 and 2012.
Presentation of this information is intended to assist the reader in comparing the operating performance of different REITs, although it should be noted that not all REITs calculate FFO and MFFO the same way, so comparisons with other REITs may not be meaningful. Furthermore, FFO and MFFO are not necessarily indicative of cash flow available to fund cash needs and should not be considered as an alternative to net income or loss as an indication of our performance, as an indication of our liquidity, or indicative of funds available to fund our cash needs including our ability to make distributions to our shareholders. FFO and MFFO should be reviewed in conjunction with other measurements as an indication of our performance. FFO and MFFO should not be construed to be more relevant or accurate than the current GAAP methodology in calculating net income or loss or in its applicability in evaluating our operating performance. MFFO has limitations as a performance measure in an offering such as ours where the price of a common share of beneficial interest is a stated value and there is no net asset value determination during the offering and for a period thereafter. MFFO may be useful in assisting management and investors in assessing the sustainability (that is, the capacity to continue to be maintained) of operating performance and our current distribution policy in future operating periods, and in particular, after the offering of our shares is complete or the time when we cease to make investments on a frequent and regular basis and net asset value is disclosed. FFO and MFFO are not useful measures in evaluating net asset value because impairment write-downs are taken into account in determining net asset value but not in determining FFO and MFFO. In addition, because MFFO excludes the effect of acquisition and origination costs, which are an important component in an analysis of the historical performance of an asset, MFFO should not be construed as a historic performance measure. Our FFO and MFFO reporting complies with NAREIT’s policy described above.
Neither the SEC, NAREIT, nor any other regulatory body has passed judgment on the acceptability of the adjustments that we use to calculate FFO or MFFO. In the future, the SEC, NAREIT or another regulatory body may decide to standardize the allowable adjustments across the publicly registered, non-listed REIT industry and we would have to adjust our calculation and characterization of FFO or MFFO.
The following is a reconciliation of net income to FFO and MFFO for the three months ended March 31, 2013 and 2012:
| | | For the three months ended March 31, | |
| Funds From Operations | | 2013 | | | 2012 | |
| Net Income, as reported | | $ | 7,299,000 | | | $ | 3,321,000 | |
| FFO | | | 7,299,000 | | | | 3,321,000 | |
| Other Adjustments: | | | | | | | | |
| Amortization expense | | | 96,000 | | | | 136,000 | |
| Provision for loan losses (a) | | | 416,000 | | | | 203,000 | |
| Acquisition costs (b) | | | 372,000 | | | | 165,000 | |
| MFFO (c) | | $ | 8,183,000 | | | $ | 3,825,000 | |
(a) With respect to loan loss provisions, management does not include these expenses in our evaluation of the operating performance of our real estate loan portfolio, as we believe these costs will be reflected in our reported results from operations if and when we actually realize a loss on a real estate investment. As many other publicly registered, non-listed REITs exclude such charges in reporting their MFFO, we believe that our calculation and reporting of MFFO will assist investors and analysts in comparing our performance versus other publicly registered, non-listed REITs.
(b) Acquisition and origination fees paid to our Advisor or its affiliates in connection with the origination of notes receivables are amortized into expense on a straight line basis. Such acquisition related expenses are paid in cash to our Advisor or its affiliates that would otherwise be available to distribute to our shareholders. The origination and acquisition of secured loans, and the corresponding expenses associated with that process, is a key operational feature of our business plan in order to generate operating revenues and cash flows to make distributions to our shareholders. In the future, if we are not able to raise additional proceeds from our offerings, this could result in us paying acquisition and origination fees and expenses due to our Advisor or its affiliates, or a portion thereof, with net proceeds from borrowed funds, operational earnings or cash flows, principal repayments, or ancillary cash flows. As a result, the amount of proceeds available for investment and operations would be reduced, or we may incur additional interest expense as a result of borrowed funds. Such fees will not be reimbursed by our Advisor or its affiliates. Changes in the accounting and reporting promulgations under GAAP (including changes that were put into effect in 2009 subsequent to the establishment of NAREIT’s definition of FFO for acquisition fees and expenses from a capitalization/depreciation model to an expensed-as-incurred model) have impacted the reporting of operating income for all industries. Acquisition related expenses under GAAP are considered operating expenses and as expenses included in the determination of net income (loss) and income (loss) from continuing operations, both of which are performance measures under GAAP. Management believes that acquisition related expenses are non-operating and do not affect our long-term operating performance; therefore, excluding acquisition and origination costs from MFFO provides investors with supplemental performance information that is consistent with the performance models used by management, and provides investors with a view of our portfolio over time, independent of direct costs associated with the timing of acquisition activity.
(c) MFFO would only be comparable to other publicly registered, non-listed REITs that have completed their acquisition activity and have similar operating characteristics to us.
Net Operating Income
We are disclosing net operating income and intend to disclose net operating income in future filings, because we believe that net operating income provides an accurate measure of the operating performance of our operating assets because net operating income excludes certain items that are not directly associated with our investments. Net operating income is a non-GAAP financial measure that is defined as net income, computed in accordance with GAAP, generated from properties before interest expense, general and administrative expense, depreciation, amortization and interest and dividend income. Additionally, we believe that net operating income is a widely accepted measure of comparative operating performance in the real estate community. However, our use of the term net operating income may not be comparable to that of other real estate companies as they may have different methodologies for computing this amount.
To facilitate understanding of this financial measure, the following is a reconciliation of net income to net operating income for the three months ended March 31, 2013 and 2012:
| | | For the three months ended March 31, | |
| Net Operating Income | | 2013 | | | 2012 | |
| Net Income, as reported | | $ | 7,299,000 | | | $ | 3,321,000 | |
| Add: | | | | | | | | |
| Interest expense (1) | | | 474,000 | | | | 420,000 | |
| General and administrative expense (2) | | | 2,686,000 | | | | 1,278,000 | |
| Amortization expense (3) | | | 96,000 | | | | 136,000 | |
| Less: | | | | | | | | |
| Other interest and dividend income | | | (6,000 | ) | | | (7,000 | ) |
| Net operating income | | $ | 10,549,000 | | | $ | 5,148,000 | |
| (1) | We did not incur any interest expense associated with asset-level indebtedness for the three months ended March 31, 2013 or 2012. Any such interest expense associated with asset level debt used to acquire or originate a secured loan would be included with net operating income. |
| (2) | Includes advisory fee – related party expense, provision for loan losses expense, general and administrative expense, net of amortization expense and general and administrative – related parties expense, net of amortization expense. |
| (3) | Represents amortization expense associated with capitalized debt financing costs. We did not incur any amortization expense associated with asset-level indebtedness for the three months ended March 31, 2013 or 2012. Any such amortization expense associated with asset level debt used to acquire or originate a secured loan would be included in net operating income. |
| | | For the three months ended March 31, | |
| | | 2013 | | | 2012 | |
| Net operating income | | $ | 10,549,000 | | | $ | 5,148,000 | |
| Other interest and dividend income | | | 6,000 | | | | 7,000 | |
| Interest expense – asset-level | | | - | | | | - | |
| Amortization expense – asset-level | | | - | | | | - | |
| Total interest and non-interest income | | $ | 10,555,000 | | | $ | 5,155,000 | |
Net operating income does not reflect approximately $474,000 and $420,000 of interest expense incurred for the three months ended March 31, 2013 and 2012 associated with fund-level indebtedness as interest expense related to fund-level indebtedness is not considered directly associated with the operation of the fund as such indebtedness is not used to acquire and originate secured loans. Net operating income also does not reflect $2.7 million and $1.3 million of general and administrative expenses (including advisory fee – related party, provision for loan losses, general and administrative, and general and administrative – related parties) incurred for the three months ended March 31, 2013 and 2012. Acquisition and Origination Fees are included in general and administrative expense – related party, which are excluded from net operating income. Acquisition and Origination Fees are incurred when capital is received by us and available for deployment. Since the Acquisition and Origination Fees are related to the capital available for investing, are non-refundable and will not exceed 3% of the amount available for investment from the Offering, the Acquisition and Origination Fees are amortized over the expected life of the fund in an effort to properly match the interest income earned over the economic life of the capital available for investing; thus, such fees are not considered an operational cost as they are not considered to be directly associated with the operation of the portfolio. The funds used to pay interest expense and general and administrative expenses will not be available to generate future net operating income, net income as defined by GAAP or cash flows from operations, nor be available to fund future distributions to shareholders.
Liquidity and Capital Resources
Our liquidity requirements will be affected by (1) outstanding loan funding obligations, (2) our administrative expenses, (3) debt service on fund level and asset level indebtedness required to preserve our collateral position and (4) distributions and redemptions to shareholders. We expect that our liquidity will be provided by (1) loan interest, transaction fees and credit enhancement fee payments, (2) loan principal payments, (3) proceeds from the issuance of common shares of beneficial interest pursuant to the Offering, provided however, that the Offering will terminate on or before May 13, 2013, (4) proceeds from our DRIP and Secondary DRIP, and (5) credit lines available to us.
There may be a delay between the sale of our shares and the making of real estate-related investments, which could result in a delay in our ability to make distributions to our shareholders. However, we have not established any limit on the amount of proceeds from the Offering that may be used to fund distributions, except that, in accordance with our organizational documents and Maryland law, we may not make distributions that would (1) cause us to be unable to pay our debts as they become due in the usual course of business; or (2) cause our total assets to be less than the sum of our total liabilities plus senior liquidation preferences, if any. In addition, to the extent our investments are in development projects or in other properties that have significant capital requirements and/or delays in their ability to generate income, our ability to make distributions may be negatively impacted, especially during our early periods of operation.
We may use debt as a means of providing additional funds for the acquisition or origination of secured loans, acquisition of properties and the diversification of our portfolio. There is no limitation on the amount we may borrow for the purchase or origination of a single secured loan, the purchase of any individual property or other investment. Under our declaration of trust, the maximum amount of our indebtedness shall not exceed 300% of our net assets as of the date of any borrowing; however, we may exceed that limit if approved by a majority of our independent trustees and disclosed in our next quarterly report to shareholders, along with justification for such excess. In addition to our declaration of trust limitation, our board of trustees has adopted a policy to generally limit our fund level borrowings to 50% of the aggregate fair market value of our assets unless substantial justification exists that borrowing a greater amount is in our best interests. We may also use, when appropriate, leverage at the asset level. Asset level leverage is determined by the anticipated term of the investment and the cash flow expected by the investment. Asset level leverage is expected to range from 0% to 90% of the asset value.
Indebtedness will be either interest only or be amortized over the expected life of the asset. Our current typical indebtedness is a term loan or revolving credit facility permitting us to borrow up to an agreed-upon outstanding principal amount from senior commercial lenders who lend against a percentageof the fair market value of the assets which collateralize the loan. Indebtedness may be secured by a first priority lien upon specified assets or all of our existing and future acquired assets.
Our Advisor may, but is not required to, establish capital reserves from gross offering proceeds, out of cash flow generated from interest income from loans and income from other investments or out of non-liquidating net sale proceeds from the sale of our loans, properties and other investments. Alternatively, a lender may require its own formula for escrow of capital reserves.
Potential future sources of capital include proceeds from the issuance of common shares of beneficial interest pursuant to the Offering, provided however, that the Offering will terminate on or before May 13, 2013, proceeds from our DRIP and Secondary DRIP, proceeds from secured or unsecured financings from banks or other lenders, proceeds from the repayment of loans, sale of assets and undistributed funds from operations. If necessary, we may use financings or other sources of capital in the event of unforeseen significant capital expenditures. We believe that the resources stated above will be sufficient to satisfy our operating requirements for the foreseeable future, and we do not anticipate a need to raise funds from other than the sources described above within the next 12 months, although the termination of the Offering on or before May 13, 2013 will eliminate one of our current sources of capital.
Material Trends Affecting Our Business
We believe that the housing market has reached a bottom and continues to recover and strengthen. This recovery will continue to be regional in its early stages, led by those housing markets with balanced supply, affordable and stable home prices, lower levels of foreclosures, strong economies, and strong demand fundamentals. Nationally, the housing recovery has strengthened as excess inventories of new and existing homes have been absorbed and consumer demand continues to return. We expect the housing recovery will continue to strengthen as household balance sheets are restored in each market. The Federal Reserve has indicated that it intends to keep reserve interest rates at historic lows until the national unemployment rate returns to 6.5%, so long as inflation between one and two years ahead is projected to be no more than 2.5%, and longer-term inflation expectations continue to be well anchored. The Federal Reserve has also committed to an open-ended purchase program targeting agency-backed residential mortgage-backed securities and U.S. Treasury Securities. Further, the Federal Reserve has stated that it expects that a highly accommodative stance of monetary policy will remain appropriate for a considerable time after the economic recovery strengthens. Easing policies of the Federal Reserve, coupled with extensive price correction over the past several years, have restored housing affordability across the country. We believe that continued strengthening of the recovery depends on the continued recovery of consumer health and consumer confidence. The national consumer confidence index, which fell to record lows during the economic downturn, continues to recover slowly, but remains below levels historically associated with normalized conditions. Nationally, we believe consumers continue to remain cautious due to uncertainty present in many economic sectors, particularly with regards to the European debt crisis, elevated unemployment, low wage growth, and events associated with federal fiscal policy, including tax rates and spending, which are expected to take place in the first half of 2013. Additionally, continued economic weakness and fiscal tightening on the state and local levels associated with particular states most severely affected by the collapse of the housing bubble will likely drag on consumer health and confidence in those markets. We expect the housing markets that participated most heavily in the housing bubble will continue to lag the overall recovery, as consumers in those markets have generally suffered greater losses of household wealth from the declines in home prices and equity and continue to experience higher levels of unemployment relative to the nation as a whole.
In many parts of the country, unemployment remains elevated and access to conventional real estate and commercial financing remains challenging. These factors continue to pose obstacles to a robust recovery on a national scale, which, we believe, is contingent upon the reengagement of the consumer and the return of final demand. However, as inventory levels continue to decline and housing prices stabilize, we expect the housing recovery to continue to gain strength. We continue to believe that the recovery will be stronger in markets such as Texas, where consumer confidence averaged approximately 23 points higher than the national index from March 2012 to March 2013; where the job growth rate over the past 12 months was approximately 170 basis points higher than the national rate; and where approximately 15.3% of all single-family homebuilding permits in the country were issued in 2012. Further, according to the Bureau of Labor Statistics, approximately 18.0% of the total net new jobs created in the United States since the official end of the national recession were created in Texas (from June 2009 to March 2013). Currently, 98% of our portfolio relates to property located in the state of Texas, and we intend to invest in markets that demonstrate similarly sound economic and demand fundamentals – fundamentals that we believe will be the drivers of the recovery – and balanced supplies of homes and finished lots. We believe the fact that new single-family home permits, starts and sales have all risen significantly from their respective lows reflects a continued return of real demand for new homes. However, we anticipate the former bubble market states – principally California, Arizona, Nevada and Florida – will be slower to recover, as those markets have seen overbuilding and extensive price correction and are experiencing weakened economies and continued foreclosures. We believe these conditions have caused significant weakness among consumers in these markets, and losses of property tax revenue, sales and use tax revenue, and budget imbalances have, in many cases, led to significant fiscal difficulties at the state and municipal levels associated with these former bubble markets.
From a national perspective, ongoing credit constriction, a less robust economic recovery, continued high unemployment, and housing price instability have made potential new home purchasers and real estate lenders cautious. As a result of these factors, the national housing market experienced a protracted decline, and the time necessary to correct the market likely means a corresponding slower recovery for the housing industry relative to historical trends. However, improving fundamentals such as the return of price stability and price inflation, high home affordability, and continued inventory absorption indicate to us that the recovery will continue to gain strength in the coming quarters.
Nationally, capital constraints at the heart of the credit crisis have reduced the number of real estate lenders able or willing to finance development, construction or the purchase of homes and have increased the number of undercapitalized or failed builders and developers. In correlation, the number of finished lots developed has decreased and remains near historic lows, even as home starts have begun to increase, which has begun to result in a shortage of developed lots in select markets and submarkets and may result in a wider shortage of new homes and developed lots in select real estate markets in 2013 and 2014. We believe this shortage will be most prominent in markets that did not participate in the housing bubble, avoiding overbuilding and maintaining balanced supplies and affordable and stable home prices. With lenders imposing stricter underwriting standards, mortgages to purchase homes have become more difficult to obtain in some markets. In order to support the availability of mortgage financing for millions of Americans, the U.S. Treasury initiated a temporary program to purchase agency mortgage-backed securities, which expired with the U.S. Treasury’s temporary authorities in December 2009. Coinciding with the Treasury purchase program was the Federal Reserve, which purchased $1.25 trillion worth of mortgage-backed securities through the end of March 2010. This program ended on March 31, 2010, as scheduled by the Federal Reserve. On September 21, 2011, the Federal Reserve announced that it would begin reinvesting the principal payments from its mortgage-backed securities holdings into additional purchases of agency mortgage-backed securities to help further support conditions in mortgage markets. On September 13, 2012, the Federal Reserve announced that it would again increase monetary policy accommodation by purchasing additional agency mortgage-backed securities at a pace of $40 billion per month, would continue, through the end of 2012, its program of extending the average maturity of its holdings of securities, and would maintain its existing policy of reinvesting principal payments from its holdings of agency debt and agency mortgage-backed securities in more agency mortgage-backed securities. On December 12, 2012, the Federal Reserve announced that it would further increase monetary policy accommodation by purchasing additional U.S. Treasury securities at an initial pace of $45 billion per month in addition to the $40 billion per month purchases of agency mortgage backed securities that the Federal Reserve announced on September 13, 2012. The Federal Reserve stated in that same announcement that these actions should put downward pressure on longer-term interest rates, support mortgage markets, and help to make broader financial conditions more accommodative.
Nationally, the pace of new home sales rose during the first quarter of 2013 from the pace of sales in the fourth quarter of 2012. National fundamentals that drive home sales continue to improve in most markets and home affordability remains near record-highs, so we expect the pace of home sales will continue to increase in 2013. The U.S. Census Bureau reports that the sales of new single-family residential homes in March 2013 were at a seasonally adjusted annual rate of 417,000 units. This number is up approximately 6.9% from the revised December 2012 figure of 390,000, and it is up approximately 18.5% year-over-year from the March 2012 estimate of 352,000.
The national raw number of new single-family home inventory increased slightly in the first quarter of 2013. Through much of the downturn, homebuilders reduced their starts and focused on selling their existing new home inventory. The national figure for new single-family home inventory had fallen in each sequential quarter from the third quarter of 2007 to the first quarter of 2012. Inventory remained stable from March 2012 to September 2012 before increasing in the fourth quarter of 2012 and the first quarter of 2013. We believe that, with such reductions and subsequent stabilization, the new home market has been restored to equilibrium in most markets, even at lower levels of demand. The subsequent increase in new home inventory suggests to us that the homebuilding industry now anticipates greater demand for new homes in coming months relative to the demand evident at the bottom of the new homebuilding cycle. Further, the new home market is experiencing shortages in certain markets that did not participate in the housing bubble. The seasonally adjusted estimate of new homes for sale at the end of March 2013 was 153,000, which is lower than any time since the U.S. Census Bureau began keeping records, excluding the most recent downturn. This number represents a short supply of 4.4 months at the March 2013 sales rate. We believe that what is necessary now to regain prosperity in housing markets is the return of healthy levels of demand.
According to the U.S. Census Bureau, new single-family residential home permits and starts fell nationally from 2006 through early 2009, as a result and in anticipation of an elevated supply of and decreased demand for new single-family residential homes in that period. Since bottoming in early 2009, however, single-family permits and starts have improved significantly. Single-family homes authorized by building permits in March 2013 were at a seasonally adjusted annual rate of 595,000 units. This was an increase year-over-year of approximately 27.7% from the rate of 466,000 in March 2012, and is approximately 76.6% higher than the low of 337,000 set in January 2009. Single-family home starts for March 2013 stood at a seasonally adjusted annual rate of 619,000 units. This pace is up approximately 28.7% from the March 2012 estimate of 481,000 units. Further, the March 2013 pace of home starts is 75.4% higher than the low of 353,000 set in March 2009. Such increases suggest to us that the homebuilding industry now anticipates greater demand for new homes in coming months relative to the demand evident at the bottom of the new homebuilding cycle.
The primary factors affecting new home sales are home price stability, home affordability, and housing demand. Housing supply may affect both new home prices and the demand for new homes. When the supply of new homes exceeds new home demand, new home prices may generally be expected to decline. Also, home foreclosures cause the inventory of existing homes to increase, which may add additional downward price pressure on home prices. Declining new home prices may result in diminished new home demand as people postpone a new home purchase until such time as they are comfortable that stable price levels have been reached. The converse point is also true and equally important. When new home demand exceeds new home supply, new home prices may generally be expected to increase; and rising new home prices, particularly at or near the bottom of the housing cycle, may result in increased new home demand as people become confident in home prices and accelerate their timing of a new home purchase. We believe this bottom has been reached and expect the housing recovery to continue to accelerate over the coming quarters, led by those markets that did not participate in the housing bubble and which demonstrate stronger demand fundamentals. We intend to concentrate our investments in housing markets with affordable and stable home prices, balanced supply, lower incidences of foreclosures, and strong demand fundamentals. These demand fundamentals are generally job growth, the relative strength of the economy and consumer confidence, household formations and population growth – both immigration and in-migration.
The U.S. Census Bureau forecasts that California, Florida and Texas will account for nearly one-half of the total U.S. population growth between 2000 and 2030 and that the total population of Arizona and Nevada will double during that period. The U.S. Census Bureau projects that between 2000 and 2030 the total populations of Arizona and Nevada will grow from approximately 5 million to more than 10.7 million and from approximately 2 million to nearly 4.3 million, respectively; Florida’s population will grow nearly 80% between 2000 and 2030, from nearly 16 million to nearly 28.7 million; Texas’ population will increase 60% between 2000 and 2030, from nearly 21 million to approximately 33.3 million; and California’s population will grow 37% between 2000 and 2030, from approximately 34 million to nearly 46.5 million.
In 2009, the Harvard Joint Center for Housing Studies forecasted that an average of between approximately 1.25 million and 1.48 million new households will be formed per year over the next ten years. Likewise, the Homeownership Alliance, a joint project undertaken by the chief economists of Fannie Mae, Freddie Mac, the Independent Community Bankers of America, the National Association of Home Builders, and the National Association of Realtors, has projected that 1.3 million new households will be formed per year over the next decade and approximately 1.8 million housing units per year should be started to meet such new demand, including approximately 1.3 million new single-family homes per year based on the estimation of the Homeownership Alliance that 72% of all housing units built will be single-family residences. According to the U.S. Census Bureau, the United States averaged approximately 1.5 million new households formed annually between 1997 and 2007. During the downturn, household formation fell to approximately 772,000 households formed in 2008, approximately 398,000 households formed in 2009, and 357,000 households formed in 2010. In 2012, the U.S. Census Bureau estimated that approximately 2.4 million new households were formed in 2011, a figure that was upwardly revised by more than a million households from the 2011 Census Bureau release. The Census Bureau also estimates that approximately 1.2 million new households were formed in 2012. We believe that the return of household formation and significant increases in household formation are significant contributors to the corresponding increases in new home starts and sales.
While housing woes beleaguered the national economy, Texas housing markets held up as some of the healthiest in the country. Furthermore, as recovery in the housing sector continues to strengthen across the country, we believe that Texas housing markets have continued to lead the recovery. Texas is the largest homebuilding market in the country based on the U.S. Census Bureau’s measurements of housing permits. We have concentrated our investment portfolio in Texas as we believe Texas markets, though weakened from their starts and sales peaks in 2007 and 2008, have remained fairly healthy due to strong demographics, economies and job growth, balanced housing inventories, stable home prices and high housing affordability ratios. Texas did not experience the dramatic price appreciation (and subsequent depreciation) that states such as California, Florida, Arizona and Nevada experienced. The following graph, created with data from the fourth quarter 2012 Federal Housing Finance Agency’s (“FHFA”) Purchase Price Only Index, illustrates the rises and declines in home prices nationally, as well as in California, Florida, Arizona and Nevada over the past few years. Further, the graph illustrates how Texas maintained relative home price stability throughout the downturn. The Purchase Price Only Index indicates that Texas had a home price appreciation of 6.56% between the fourth quarter of 2011 and the fourth quarter of 2012. Home prices in Texas continue to outperform the national average appreciation of 5.45%, which was the fourth consecutive quarter of year-over-year home price appreciation since the fourth quarter of 2007. Further, the index also reports that over the past 5 years, Texas home prices have demonstrated significantly more home price stability than the national average, as home prices in Texas appreciated 5.88% compared to a national depreciation of -12.87% over the same time period. The chart also illustrates the return of home price inflation nationally as well as in the former bubble states of California, Arizona, Nevada and Florida. Significantly, the Texas home price index stands at an all-time high, in contrast to the national and former bubble state indices which remain well below their peaks.
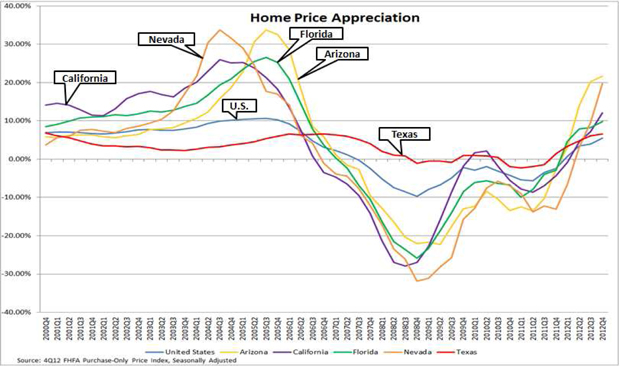
FHFA’s Purchase Price Only Index tracks average house price changes in repeat sales on the same single-family properties. The Purchase Price Only Index is based on more than 6 million repeat sales transactions and is based on data obtained from Fannie Mae and Freddie Mac for mortgages originated over the past 38 years. FHFA analyzes the combined mortgage records of Fannie Mae and Freddie Mac, which form the nation’s largest database of conventional, conforming mortgage transactions. The conforming loan limit for mortgages purchased since the beginning of 2006 has been $417,000. Loan limits for mortgages originated in the latter half of 2007 through December 31, 2008 were raised to as much as $729,750 in high-cost areas in the contiguous United States. Legislation generally extended those limits for 2009-originated mortgages. An appropriations act (PL111-88) further extended those limits for 2010 originations in places where the limits were higher than those that would have been calculated under pre-existing rules.
Median new home prices in the four major Texas markets have begun to rise. According to Metrostudy, a leading provider of primary and secondary market information, the median new home prices for the first quarter of 2013 in the metropolitan areas of Austin, Houston, Dallas-Fort Worth and San Antonio were $239,860, $228,628, $244,016 and $207,493, respectively.
Using the Department of Housing and Urban Development’s estimated 2013 median family income for the respective metropolitan areas of Austin, Houston, Dallas and San Antonio, the median income earner in those areas has 1.42 times, 1.34 times, 1.28 times and 1.37 times the income required to qualify for a mortgage to purchase the median priced new home in the respective metropolitan area. These numbers illustrate the affordability of Texas homes, as each of these markets has higher affordability than the national average. Our measurement of housing affordability, as referenced above, is determined as the ratio of median family income to the income required to qualify for a 90 percent, 30-year fixed-rate mortgage to purchase the median-priced new home, based on the average interest rate over the first quarter of 2013 and assuming an annual mortgage insurance premium of 80 basis points for private mortgage insurance, plus a cost that includes estimated property taxes and insurance for the home. Using the Department of Housing and Urban Development’s 2013 income data to project an estimated median income for the United States of $64,400 and the March 2013 national median sales prices of new homes sold of $247,000, we conclude that the national median income earner has 1.21 times the income required to qualify for a mortgage loan to purchase the median-priced new home in the United States. This estimation reflects the increase in home affordability in housing markets outside of Texas over the past 72 months, as new home prices in housing markets outside of Texas generally have fallen. Recently, however, such home prices have begun to stabilize and experience increases. We believe that such price stabilization and subsequent increases indicate that new home affordability has been restored to the national housing market.
Since the national recession’s official end, Texas employment markets have experienced strong job growth. According to the United States Department of Labor, Texas added approximately 329,500 jobs in the 12 months ended March 2013. Texas’ employment levels have now exceeded pre-recession levels by approximately 478,300 jobs. Furthermore, substantially all of those jobs created over the trailing twelve months have been in the private sector (317,200), which was the largest private sector job increase of any state over that time period and is a growth rate of 3.5%. Since the national recession’s end in June 2009, Texas has added 831,500 net new jobs, which is about 18.0% of all net jobs added nationwide over that 45 month period. Further, Texas has added approximately 1.75 million new jobs over the past 10 years and approximately 1.6 million in the private sector, comparing well to national employment growth that added approximately 5.2 million total jobs over that ten-year period and 4.9 million private sector jobs in those ten years. From March 2012 to March 2013, Austin added 30,000 jobs year-over-year. Dallas-Fort Worth added 97,300 jobs over that same time period. Houston added 106,200 jobs over that period and San Antonio added 15,800 jobs in that time.
The unemployment rate in Texas fell year-over-year from 7.0% in March 2012 to 6.4% in March 2013. The decrease in the state unemployment rate occurred in spite of significant growth in Texas’ labor force. According to the Bureau of Labor Statistics, Texas has added approximately 138,152 workers to its labor force over the past 12 months. Furthermore, the labor force participation rate in Texas is 65.1% as of March 2013, which is 180 basis points higher than the national labor force participation rate of 63.3%. The national unemployment rate fell year-over-year from March 2012 (8.2%) to March 2013 (7.6%). In addition, all four major Texas labor markets have unemployment rates significantly below the national unemployment rate.
We believe that Texas cities will continue to be among the first in the country to recover based on employment figures, consumer confidence, gross metropolitan product and new home demand. According to the Texas Workforce Commission, Texas tends to enter into recessions after the national economy has entered a recession and usually leads among states in the economic recovery. The National Bureau of Economic Research has concluded that the U.S. economy entered into a recession in December 2007, ending an economic expansion that began in November 2001. We believe, based on transitions in the Texas Leading Index as prepared monthly by the Federal Reserve Bank of Dallas, that Texas entered into recession in late Fall 2008, trailing the national recession by nearly a year, and emerged from the recession in the late spring of 2009. We believe the Texas economy continues to lead the national economic recovery. The Texas Leading Index, which combines eight measures that tend to anticipate changes in the Texas business cycle by approximately three to nine months, has risen significantly since reaching a low of 100.5 in March 2009 and, as of February 2013 (the most recent reading), was 124.3. The Index’s six-month moving average now stands at its highest reading since August 2008.
Further, we believe Texas consumers are beginning to return to their normal consumption habits. The aggregate value of state sales tax receipts in Texas increased 5.5% year-over-year in March 2013 from March 2012 – the 36th consecutive month in which Texas has experienced year-over-year improvement in sales tax receipts.
The U.S. Census Bureau reported in its 2012 Estimate of Population Change for the period from July 1, 2011 to July 1, 2012 that Texas led the country in population growth during that period. The estimate concluded that Texas’ population grew by 1.7%, or 427,425 people, a number that was 1.2 times greater than the next closest state in terms of raw population growth, California, and nearly twice as great as the second closest state in terms of raw population growth, Florida. Over the last decade, July 1, 2000 to July 1, 2010, Texas grew by nearly 4.3 million residents, averaging nearly 427,000 new residents per year. This population growth was 1.17 times greater in terms of raw population growth than the next closest state, California, and 2.63 times greater than the second closest state, Florida. The U.S. Census Bureau also reported that among the 100 fastest growing counties in the country, 17 of these counties for raw population growth between April 1, 2010 and July 1, 2012 were in Texas. In March 2013, the U.S. Census Bureau reported that Texas’ four major metro areas – Austin, Houston, San Antonio and Dallas-Fort Worth – were among the top 15 in the nation for population growth from 2011 to 2012. Dallas-Fort Worth-Arlington led the nation in numerical population growth with a combined estimated population increase of 131,879. Houston-Sugarland-Baytown was second in the nation with a population increase of 125,185 from July 1, 2011 to July 1, 2012. Austin-Round Rock had an estimated population growth of 53,595 and San Antonio had an estimated population growth of 42,333 over the same period. The percentage increase in population for each of these major Texas cities ranged from 1.9% to 3.0%.
The national foreclosure tracking service, RealtyTrac, estimates that the Texas foreclosure rate continues to be significantly healthier than the national average. We do not expect the four major Texas housing markets will be materially adversely affected by foreclosures and anticipate that home foreclosures will continue to be mostly concentrated in the bubble market states of California, Florida, Arizona and Nevada. The mortgage analytic company, CoreLogic, reports that, through the fourth quarter of 2012, approximately 39.5% of all homes with negative equity were located in one of those four states compared to approximately just 2.8% of all the negative equity homes in the country that were located in the state of Texas. We believe that Texas’ housing sector is healthier, the cost of living and doing business is lower, and its economy is more dynamic and diverse than the national average.
In contrast to the conditions of many homebuilding markets in the country, new home sales were consistently greater than new home starts in Texas markets over the downturn, which indicates that homebuilders in Texas were focused on preserving a balance between new home demand and new home supply. We believe that homebuilders and developers in Texas remained disciplined on new home construction and project development. Inventories of finished new homes and total new housing (finished vacant, under construction and model homes) remain at generally healthy and balanced levels in all major Texas markets: Austin, Dallas-Fort Worth, Houston and San Antonio. Each major Texas market experienced a rise in the number of months of finished lot inventories as homebuilders began reducing the number of new home starts in 2008, causing each major Texas market to reach elevated levels. However, the number of finished lots available in each market has fallen significantly and the months’ supply has generally returned to balanced levels. Furthermore, finished lot shortages are beginning to emerge in many desirable submarkets in the major Texas markets. Over the first quarter, homebuilders in all four major Texas markets started more homes than they sold as they continued to address constriction in home inventory levels. We believe this trend will continue in 2013 and that these increased start levels will likely result in greater shortages of finished lots in these markets, particularly in the most desirable submarkets. The lack of commercial financing for development has constrained finished lot development over the past five years even as new home demand and sales continued. We believe that such demand and sales will increase and these finished lot shortages will become more pronounced in coming quarters. As of March 2013, Houston has an estimated inventory of finished lots of approximately 19.8 months and Austin has an estimated inventory of finished lots of approximately 21.3 months, both of which represent constrained levels. San Antonio has an estimated inventory of finished lots of approximately 25.4 months and Dallas-Fort Worth has an estimated inventory of finished lots of approximately 32.2 months. A 24-28 month supply is considered equilibrium for finished lot supplies.
We expect to see the months’ supply of lot inventory continue to decrease as the homebuilders increase their pace of home starts since the prior elevation in months’ supply of finished lot inventory in Texas markets was principally the result of the decrease in the pace of annual starts rather than an increase in the raw number of developed lots. Indeed, the raw number of finished lots available in each Texas market has been significantly reduced from their peaks. Since peaking in the first quarter of 2008, Houston’s finished lot supply is down 43.1% from 73,047 to 41,551 in the first quarter of 2013. San Antonio’s finished lot inventory fell 39.9% to 16,784 in the third quarter of 2012 from its peak at 27,937 in the second quarter of 2008. San Antonio’s finished lot inventory subsequently experienced increases in the fourth quarter of 2012 and the first quarter of 2013. Austin’s finished lot inventory peaked in the first quarter of 2009 at 27,176, and fell 41.7% to 15,854 in the fourth quarter of 2012 before experiencing an increase in the first quarter of 2013. The finished lot inventory for Dallas-Fort Worth peaked in the first quarter of 2008 at 91,787 lots and has fallen 44.6% to 50,874 lots in the first quarter of 2013. As detailed above, such inventory reduction continued in the first quarter of 2013 in two of these four markets as the number of finished lots dropped by nearly 800 in Dallas-Fort Worth and approximately 1,400 in Houston. Austin’s finished lot supply increased by approximately 560 lots in the first quarter of 2013 and San Antonio’s finished lot supply increased by just under 600 lots in the same time period. Even with the increase in finished lot inventory, both Austin and San Antonio’s month supplies based on their home start rates fell from the fourth quarter of 2012 to the first quarter of 2013 and remain within levels at or below equilibrium. Annual starts in each of the Austin, San Antonio, Houston and Dallas-Fort Worth markets are outpacing lot deliveries, and we expect to see increased finished lot sales in 2013 as homebuilders replenish their inventory.
Texas markets continue to be some of the strongest homebuilding markets in the country. Though the pace of homebuilding in Texas fell between 2007 and 2011 as a result of the national economic downturn and reduced availability of construction financing, homebuilding began to increase in 2012 and in early 2013. Still, the availability of construction and development financing remains challenging for private homebuilders and developers to obtain. According to the Federal Deposit Insurance Corporation, construction and development loans held by Texas banks declined year over year by approximately 2.5% from approximately $16.0 billion as of December 2011 to approximately $15.6 billion as of December 2012 (the fourth quarter data remains the most recent as of this filing). While the previous decline in housing starts through the downturn caused the month supply of vacant lot inventory to become elevated from its previously balanced position, it also preserved a balance in housing inventory. Annual new home starts in Austin outpaced sales 9,232 versus 8,270, with annual new home sales rising year-over-year by approximately 18.3% from the first quarter of 2012 to the first quarter of 2013. Finished housing inventory stands at a relatively healthy level of 2.8 months, while total new housing inventory (finished vacant, under construction and model homes) fell to a supply of 7.2 months. The generally accepted equilibrium levels for finished housing inventory and total new housing inventory are a 2.0-to-2.5 month supply and a 6.0-to-6.5 month supply, respectively. While the present month supply in Austin would typically indicate an elevated inventory level, we believe that this increase in supply coupled with the incidence of new home starts exceeding new home sales indicates that homebuilders in this market anticipate greater demand for homes in coming months. As a result, we believe this increase in supply reflects an expanding sales pipeline rather than an imbalance of supply. Annual new home starts in San Antonio outpaced sales 8,478 versus 7,800, with annual new home sales increasing year-over-year by approximately 11.9%. Finished housing inventory rose slightly to a healthy 2.3 month supply. Total new housing inventory remains at a 6.7 month supply. Houston’s annual new home starts outpaced sales 25,147 versus 22,840, with annual new home sales increasing year-over-year by approximately 17.0%. Finished housing inventory stands at a slightly short 1.9 month supply while total new housing inventory remains at a healthy 6.5 month supply. Annual new home starts in Dallas-Fort Worth outpaced sales 18,950 versus 17,060, with annual new home sales increasing year-over-year by approximately 15.7%. Finished housing inventory rose to a healthy 2.2 month supply, while total new housing inventory fell to a slightly elevated 7.1 month supply, a level which again indicates to us that homebuilders anticipate a strengthening housing market and growing demand for new homes. All numbers are as released by Metrostudy, a leading provider of primary and secondary market information.
According to the Real Estate Center at Texas A&M University, existing housing inventory levels are constrained. As of March 2013, the number of months of home inventory for sale in Austin, Houston, Dallas, Fort Worth, Lubbock and San Antonio was 2.6 months, 3.5 months, 2.8 months, 3.7 months, 3.8 months and 5.4 months, respectively. Like new home inventory, a 6-month supply of inventory is considered a balanced market with more than 6 months of inventory generally being considered a buyer’s market and less than 6 months of inventory generally being considered a seller’s market. Through March 2013, the number of existing homes sold to date in (a) Austin was 5,779, up 23% year-over-year; (b) San Antonio was 4,585, up 13% year-over-year; (c) Houston was 15,519 up 20% year-over-year; (d) Dallas was 11,664, up 20% year-over-year; (e) Fort Worth was 2,214, up 17% year-over-year; and (f) Lubbock was 833, up 35% year-over-year.
In managing and understanding the markets and submarkets in which we make loans, we monitor the fundamentals of supply and demand. We monitor the economic fundamentals in each of the respective markets in which we make loans by analyzing demographics, household formation, population growth, job growth, migration, immigration and housing affordability. We also monitor movements in home prices and the presence of market disruption activity, such as investor or speculator activity that can create false demand and an oversupply of homes in a market. Further, we study new home starts, new home closings, finished home inventories, finished lot inventories, existing home sales, existing home prices, foreclosures, absorption, prices with respect to new and existing home sales, finished lots and land and the presence of sales incentives, discounts, or both, in a market.
We face a risk of loss resulting from adverse changes in interest rates. Changes in interest rates may impact both demand for our real estate finance products and the rate of interest on the loans we make. In some instances, the loans we make will be junior in the right of repayment to senior lenders, who will provide loans representing 60% to 75% of total project costs. As senior lender interest rates available to our borrowers increase, demand for our mortgage loans may decrease, and vice versa.
Developers and homebuilders to whom we make loans and with whom we enter into subordinate debt positions use the proceeds of our loans and investments to develop raw real estate into residential home lots and to construct homes. The developers obtain the money to repay our development loans by reselling the residential home lots to homebuilders or individuals who build single-family residences on the lots or by obtaining replacement financing from other lenders. Homebuilders obtain the money to repay our loans by selling the homes they construct or by obtaining replacement financing from other lenders. If interest rates increase, the demand for single-family residences may decrease. Also, if mortgage financing underwriting criteria become stricter, demand for single-family residences may decrease. In such an interest rate and/or mortgage financing climate, developers and builders may be unable to generate sufficient income from the resale of single-family residential lots and homes to repay loans from us, and developers’ and builders’ costs of funds obtained from lenders in addition to us may increase, as well. Accordingly, increases in single-family mortgage interest rates or decreases in the availability of mortgage financing could increase the number of defaults on loans made by us.
We are not aware of any material trends or uncertainties, favorable or unfavorable, other than national economic conditions affecting real estate and interest rates generally, that we reasonably anticipate to have a material impact on either the income to be derived from our investments in mortgage loans or entities that make mortgage loans, other than those referred to in this Quarterly Report on Form 10-Q or in our Annual Report on Form 10-K. The disruption of mortgage markets, in combination with a significant amount of negative national press discussing constriction in mortgage markets and the decline of the national housing industry over the last five years, including declining home prices, have made potential new home purchasers and real estate lenders very cautious. The economic downturn, the failure of highly respected financial institutions, significant volatility in equity markets around the world, unprecedented administrative and legislative actions in the United States, and actions taken by central banks around the globe to stabilize the economy have further caused many prospective home purchasers to postpone their purchases. In summary, we believe there is a general lack of urgency to purchase homes in these times of economic uncertainty. We believe that this has slowed the sales of new homes and finished lots developed in certain markets; however, we do not anticipate the prices of those lots changing materially. We also expect that the decrease in the availability of replacement financing may increase the number of defaults on real estate loans made by us or extend the time period anticipated for the repayment of our loans. Our future results could be negatively impacted by prolonged weakness in the economy, high levels of unemployment, a significant increase in mortgage interest rates or further tightening of mortgage lending standards.
Off-Balance Sheet Arrangements
From time to time, we enter into guarantees of debtor’s or affiliates’ borrowings and provide credit enhancements for the benefit of senior lenders in connection with our debtors and investments in partnerships (collectively referred to as “guarantees”), and account for such guarantees in accordance with FASB ASC 460-10Guarantees. Guarantees generally have fixed expiration dates or other termination clauses and may require payment of a fee by the debtor. A guarantee involves, to varying degrees, elements of credit risk in excess of the amount recognized in the consolidated balance sheets. Our exposure to credit loss in the event of non-performance by the other party to the instrument is represented by the contractual notional amount of the guarantee.
In connection with the funding of some of our organization costs, on June 26, 2009, UMTH LD entered into the $6.3 million UMTH LD CTB LOC from CTB. In accordance with a Loan Modification Agreement entered into on December 26, 2011, the UMTH LD CTB LOC was scheduled to mature on February 26, 2012. Effective February 26, 2012, UMTH LD entered into a second loan modification agreement with CTB, which resulted in an extension of the maturity date on the UMTH LD CTB LOC to December 26, 2014. UMTH LD has a receivable from our Advisor for such costs and is repaid by our Advisor as our Advisor receives the O&O Reimbursement discussed in Note G to our accompanying consolidated financial statements. UMTH LD has assigned this receivable to the bank as security for the UMTH LD CTB LOC. As a condition to the modification entered into in February 2012, the Trust agreed to guaranty all obligations under the UMTH LD CTB LOC. As of March 31, 2013 and December 31, 2012, the outstanding balance on the line of credit was $6.0 million and $6.2 million, respectively.
Effective December 30, 2011, we entered into the Stoneleigh Guaranty for the benefit of Babson as agent for a group of lenders pursuant to which we guaranteed all amounts due associated with the $25.0 million Stoneleigh Construction Loan entered into between Stoneleigh and Babson. The Stoneleigh Construction Loan matures on January 1, 2015. Pursuant to the Stoneleigh Construction Loan, Babson will provide Stoneleigh with up to approximately $25.0 million to finance the construction associated with a condominium project located in Dallas, Texas.UDF LOF owns a 75% interest in Stoneleigh. Our asset manager, UMTH LD, also serves as the asset manager of UDF LOF. The general partner of our Advisor also serves as the general partner of UMTH LD. UMTH LD controls 100% of the partnership interests of the general partner of UDF LOF. In consideration of us entering into the Stoneleigh Guaranty, we entered into a letter agreement with Stoneleigh which provides for Stoneleigh to pay us a monthly credit enhancement fee equal to one-twelfth of 1% of the outstanding principal balance on the Stoneleigh Construction Loan at the end of each month as long as the Stoneleigh Guaranty remains outstanding. As of March 31, 2013 and December 31, 2012, approximately $10.1 million and $9.7 million, respectively, was outstanding under the Stoneleigh Construction Loan. For the three months ended March 31, 2013, approximately $29,000 is included in commitment fee income – related parties in connection with the credit enhancement fee associated with the Stoneleigh Construction Loan.
As of March 31, 2013, including the guarantees described above, we had 7 outstanding repayment guarantees with total credit risk to us of approximately $51.9 million, of which approximately $25.2 million had been borrowed against by the debtor. As of December 31, 2012, including the guarantees described above, we had 7 outstanding repayment guarantees with total credit risk to us of approximately $51.9 million, of which approximately $27.5 million had been borrowed against by the debtor.
Contractual Obligations
As of March 31, 2013, we had purchased or entered into 11 participation agreements with related parties (2 of which were repaid in full) with aggregate, maximum loan amounts of approximately $44.5 million (with an unfunded balance of approximately $2.8 million) and 11 related party note agreements (1 of which was repaid in full and 1 of which matured and was not renewed, but was never funded) with aggregate, maximum loan amounts totaling approximately $60.6 million (with an unfunded balance of $13.4 million). Additionally, we had purchased or entered into 64 note agreements with third parties (13 of which were repaid in full) with aggregate, maximum loan amounts of approximately $399.8 million (with an unfunded balance of $52.4 million). For the three months ended March 31, 2013, we originated 2 loans.
In addition, we have entered into various credit facilities, as discussed in Notes J and K to the accompanying consolidated financial statements. The following table reflects approximate amounts due associated with these credit facilities based on their maturity dates as of March 31, 2013:
| | | Payments due by period | | | | |
| | | Less than 1
year | | | 1-3 years | | | 3-5 years | | | More than
5 years | | | Total | |
| Lines of credit | | $ | 20,097,000 | | | $ | 7,957,000 | | | $ | - | | | $ | - | | | $ | 28,054,000 | |
| Notes payable | | | 4,336,000 | | | | - | | | | - | | | | - | | | | 4,336,000 | |
| Total | | $ | 24,433,000 | | | $ | 7,957,000 | | | $ | - | | | $ | - | | | $ | 32,390,000 | |
We have no other outstanding debt or contingent payment obligations, other than the certain loan guarantees discussed above in “Off-Balance Sheet Arrangements” or letters of credit that we may make to or for the benefit of third-party lenders.
Item 3. Quantitative and Qualitative Disclosures About Market Risk.
Market risk is the exposure to loss resulting from adverse changes in market prices, interest rates, foreign currency exchange rates, commodity prices and equity prices. A significant market risk to which we are exposed is interest rate risk, which is sensitive to many factors, including governmental monetary and tax policies, domestic and international economic and political considerations, and other factors beyond our control. Changes in interest rates may impact both demand for our real estate finance products and the rate of interest on the loans we make. Another significant market risk is the market price of finished homes and lots. The market price of finished homes or lots is driven by the demand for new single-family homes and the supply of unsold homes and finished lots in a market. The change in one or both of these factors can have a material impact on the cash realized by our borrowers and resulting collectability of our loans and interest.
Demand for our secured loans and the amount of interest we collect with respect to such loans depends on the ability of borrowers of real estate construction and development loans to sell single-family lots to homebuilders and the ability of homebuilders to sell homes to homebuyers.
The single-family lot and residential homebuilding market is highly sensitive to changes in interest rate levels. As interest rates available to borrowers increase, demand for secured loans decreases, and vice versa. Housing demand is also adversely affected by increases in housing prices and unemployment and by decreases in the availability of mortgage financing. In addition, from time to time, there are various proposals for changes in the federal income tax laws, some of which would remove or limit the deduction for home mortgage interest. If effective mortgage interest rates increase and/or the ability or willingness of prospective buyers to purchase new homes is adversely affected, the demand for new homes may also be negatively affected. As a consequence, demand for and the performance of our real estate finance products may also be adversely impacted.
We seek to mitigate our single-family lot and residential homebuilding market risk by closely monitoring economic, project market, and homebuilding fundamentals. We review a variety of data and forecast sources, including public reports of homebuilders, mortgage originators and real estate finance companies; financial statements of developers; project appraisals; proprietary reports on primary and secondary housing market data, including land, finished lot, and new home inventory and prices and concessions, if any; and information provided by government agencies, the Federal Reserve Bank, the National Association of Home Builders, the National Association of Realtors, public and private universities, corporate debt rating agencies, and institutional investment banks regarding the homebuilding industry and the prices of and supply and demand for single-family residential homes.
In addition, we further seek to mitigate our single-family lot and residential homebuilding market risk by having our asset manager assign an individual asset manager to each secured note or equity investment. This individual asset manager is responsible for monitoring the progress and performance of the builder or developer and the project as well as assessing the status of the marketplace and value of our collateral securing repayment of our secured loan or equity investment.
Item 4. Controls and Procedures.
Evaluation of Disclosure Controls and Procedures
We maintain disclosure controls and procedures that are designed to ensure that information required to be disclosed in our reports under the Securities Exchange Act of 1934, as amended (the “Exchange Act”), is recorded, processed, summarized and reported within the time periods specified in the rules and forms, and that such information is accumulated and communicated to us, including our Chief Executive Officer and Chief Financial Officer, as appropriate, to allow timely decisions regarding required disclosure.
As required by Rule 13a-15(b) and Rule 15d-15(b) under the Exchange Act, our management, including our Chief Executive Officer and Chief Financial Officer, evaluated, as of March 31, 2013, the effectiveness of our disclosure controls and procedures as defined in Exchange Act Rule 13a-15(e) and Rule 15d-15(e). Based on that evaluation, our Chief Executive Officer and Chief Financial Officer concluded that our disclosure controls and procedures were effective, as of March 31, 2013, to provide reasonable assurance that information required to be disclosed by us in this report is recorded, processed, summarized and reported within the time periods specified by the rules and forms of the Exchange Act and is accumulated and communicated to our management, including our Chief Executive Officer and Chief Financial Officer, as appropriate to allow timely decisions regarding required disclosures.
Changes in Internal Control over Financial Reporting
There were no changes in our internal control over financial reporting that occurred during the quarter ended March 31, 2013 that have materially affected, or are reasonably likely to materially affect, our internal control over financial reporting.
PART II
OTHER INFORMATION
Item 1. Legal Proceedings.
We are not a party to, and none of our assets are subject to, any material pending legal proceedings.
Item 1A. Risk Factors.
There have been no material changes from the risk factors set forth in our Annual Report on Form 10-K filed with the Securities and Exchange Commission on April 1, 2013, except as noted below.
Our Advisor and its affiliates will have equity interests and/or profit participations in developments we finance and may have a greater incentive to make loans with respect to such developments and/or provide credit enhancements to preserve and/or enhance their economic interest in such development.
We expect to make loans and/or provide credit enhancement transactions to affiliates of our Advisor or asset manager. In connection with making such loans or providing such credit enhancements, we will obtain an appraisal concerning the underlying property from an independent expert who is in the business of rendering opinions regarding the value of assets of the type held by us and who is qualified to perform such work. In addition, a majority of the trustees, including a majority of the independent trustees, who are not otherwise interested in the transaction must approve all transactions with our Advisor or its affiliates as being fair and reasonable to us and on terms and conditions not less favorable to us than those available from unaffiliated third parties. We also will obtain a mortgagee’s or owner’s title insurance policy or a commitment as to the priority of the secured loan as part of our underwriting process. If an affiliate of our Advisor has an equity interest or participation interest in a development that requires a loan or credit enhancement, our Advisor may have a greater incentive to make a loan with respect to such development to preserve and/or enhance its economic interest in such development. As of March 31, 2013, our 18 loans to related parties have an outstanding balance of approximately $55.8 million.
We will face risks relating to joint ventures with our affiliates and third parties that are not present with other methods of investing in properties and secured loans.
We may enter into joint ventures with certain of our affiliates, as well as third parties, for the funding of loans or the acquisition of properties. We may also purchase loan participation interests or loans through joint ventures or in partnerships or other co-ownership arrangements with our affiliates, the sellers of the loans, affiliates of the sellers, developers or other persons. Such investments may involve risks not otherwise present with other methods of investment in secured loans, including, for example:
| · | that such affiliate, co-venturer or partner may at any time have economic or business interests or goals that are or that become inconsistent with our business interests or goals, which may cause us to disagree with our affiliate, co-venturer or partner as to the best course of action with respect to the investment and which disagreement may not be resolved to our satisfaction; |
| · | that such affiliate, co-venturer or partner may be in a position to take action contrary to our instructions or requests or contrary to our policies or objectives, which may cause us not to realize the return anticipated from our investment; or |
| · | that it may be difficult for us to sell our interest in any such participation, co-venture or partnership. |
Moreover, in the event we determine to foreclose on the collateral underlying a non-performing investment, we may be required to obtain the cooperation of our affiliate, co-venturer or partner to do so. We anticipate that we will participate with our affiliates in certain development projects where we and our affiliates make loans to the borrower, in which case we expect to enter into an inter-creditor agreement that will define our rights and priority with respect to the underlying collateral. Our inability to foreclose on a property acting alone may cause significant delay in the foreclosure process, in which time the value of the property may decline.
As of March 31, 2013, we have not entered into any joint ventures. As of March 31, 2013, we are participating in 9 loans originated by affiliates, with an outstanding balance of approximately $26.9 million.
Our Advisor will face additional conflicts of interest relating to loan participations with affiliated entities and may make decisions that disproportionately benefit one or more of our affiliated entities instead of us.
Our Advisor also serves as the advisor for UMT and is an affiliate of the general partners of UDF I, UDF II, UDF III and UDF LOF, all of which engage in the same businesses as us. Because our Advisor or its affiliates will have advisory and management arrangements with these other United Development Funding programs, it is likely that they will encounter opportunities to invest in or acquire interests in secured loans, participations and/or properties to the benefit of one of the United Development Funding programs, but not others. Our Advisor or its affiliates may make decisions to finance certain properties, which decisions might disproportionately benefit a United Development Funding program other than us. In such event, our results of operations and ability to pay distributions to our shareholders could be adversely affected.
Because our Advisor and its affiliates are affiliated with UMT, UDF I, UDF II, UDF III and UDF LOF, agreements and transactions among the parties with respect to any loan participation among two or more of such parties will not have the benefit of arm’s length negotiation of the type normally conducted between unrelated co-venturers. Under these loan participation arrangements, we may not have a first priority position with respect to the underlying collateral. In the event that a co-venturer has a right of first refusal to buy out the other co-venturer, it may be unable to finance such buy-out at that time. In addition, to the extent that our co-venturer is an affiliate of our Advisor, certain conflicts of interest will exist. As of March 31, 2013, we are participating in 9 loans originated by affiliates, with an outstanding balance of approximately $26.9 million.
Investments in land development loans present additional risks compared to loans secured by operating properties.
We may invest up to 10% of the gross offering proceeds in loans to purchase unimproved real property, and as of March 31, 2013, we have invested 0% of the gross offering proceeds in such loans. For purposes of this limitation, “unimproved real property” is defined as real property which has the following three characteristics: (a) an equity interest in real property which was not acquired for the purpose of producing rental or other income; (b) has no development or construction in process on such land; and (c) no development or construction on such land is planned in good faith to commence within one year. Land development mortgage loans may be riskier than loans secured by improved properties, because:
| · | until disposition, the property does not generate separate income for the borrower to make loan payments; |
| · | the completion of planned development may require additional development financing by the borrower, which may not be available; |
| · | depending on the velocity or amount of lot sales to homebuilders, demand for lots may decrease, causing the price of the lots to decrease; |
| · | depending on the velocity or amount of lot sales to developers or homebuilders, demand for land may decrease, causing the price of the land to decrease; |
| · | there is no assurance that we will be able to sell unimproved land promptly if we are forced to foreclose upon it; and |
| · | lot sale contracts are generally not “specific performance” contracts, and the borrower may have no recourse if a homebuilder elects not to purchase lots. |
Investments in second, mezzanine and wraparound mortgage loans present additional risks compared to loans secured by first deeds of trust.
We expect that we will be the junior lender with respect to some of our loans. We may invest in (a) second mortgage loans (some of which are also secured by pledges), which investments represent approximately 27% of the gross offering proceeds as of March 31, 2013; (b) co-investment loans (which are secured by pledges and collateral-sharing arrangements permitting us to share in the proceeds of second liens held by affiliates), which investments represent 0% of the gross offering proceeds as of March 31, 2013; (c) mezzanine loans (which are secured by pledges), which investments represent approximately 3% of the gross offering proceeds as of March 31, 2013; and (d) wraparound mortgage loans, which investments represent 0% of the gross offering proceeds as of March 31, 2013. A wraparound, or all-inclusive, mortgage loan is a loan in which the lender combines the remainder of an old loan with a new loan at an interest rate that blends the rate charged on the old loan with the current market rate. In a second mortgage loan and in a mezzanine loan, our rights as a lender, including our rights to receive payment on foreclosure, will be subject to the rights of the prior mortgage lender. In a wraparound mortgage loan, our rights will be similarly subject to the rights of any prior mortgage lender, but the aggregate indebtedness evidenced by our loan documentation will be the prior mortgage loans in addition to the new funds we invest. Under a wraparound mortgage loan, we would receive all payments from the borrower and forward to any senior lender its portion of the payments we receive. Because all of these types of loans are subject to the prior mortgage lender’s right to payment on foreclosure, we incur a greater risk when we invest in each of these types of loans.
Many of our loans will require balloon payments, which are riskier than loans with fully amortized payments.
We anticipate that substantially all of our loans will have balloon payments or reductions to principal tied to net cash from the sale of developed lots and the release formula created by the senior lender (i.e., the conditions under which principal is repaid to the senior lender, if any), and as of March 31, 2013, 100% of our loans have balloon payments or reductions to principal tied to net cash. A balloon payment is a large principal balance that is payable after a period of time during which the borrower has repaid none or only a small portion of the principal balance. Loans with balloon payments are riskier than loans with even payments of principal over an extended time period, such as 15 or 30 years, because the borrower’s repayment often depends on its ability to refinance the loan or sell the developed lots profitably when the loan comes due. There are no specific criteria used in evaluating the credit quality of borrowers for mortgage loans requiring balloon payments. Furthermore, a substantial period of time may elapse between the review of the financial statements of the borrower and the date when the balloon payment is due. As a result, there is no assurance that a borrower will have sufficient resources to make a balloon payment when due.
The interest-only loans we make or acquire may be subject to greater risk of default and there may not be sufficient funds or assets remaining to satisfy our loans, which may result in losses to us.
We will make and acquire interest-only loans or loans requiring reductions to accrued interest tied to net cash, and as of March 31, 2013, 100% of the loans we have made and acquired are interest-only loans or loans requiring reductions to accrued interest tied to net cash. Interest-only loans typically cost the borrower less in monthly loan payments than fully-amortizing loans which require a payment on principal as well as interest. This lower cost may enable a borrower to acquire a more expensive property than if the borrower was entering into a fully-amortizing mortgage loan. Borrowers utilizing interest-only loans are dependent on the appreciation of the value of the underlying property, and the sale or refinancing of such property, to pay down the interest-only loan since none of the principal balance is being paid down with the borrowers’ monthly payments. If the value of the underlying property declines due to market or other factors, it is likely that the borrower would hold a property that is worth less than the mortgage balance on the property. Thus, there may be greater risk of default by borrowers who enter into interest-only loans. In addition, interest-only loans include an interest reserve in the loan amount. If such reserve is required to be funded due to a borrower’s non-payment, the loan-to-value ratio for that loan will increase, possibly above generally acceptable levels. In the event of a defaulted interest-only loan, we would acquire the underlying collateral which may have declined in value. In addition, there are significant costs and delays associated with the foreclosure process. Any of these factors may result in losses to us.
Larger loans result in less portfolio diversity and may increase risk, and the concentration of loans with a common borrower may increase our risk.
We intend to invest in loans that individually constitute an average amount equal to the lesser of (a) 1% to 3% of the total amount raised in the Offering, or (b) $2.5 million to $15 million. However, we may invest in larger loans depending on such factors as our performance and the value of the collateral. These larger loans are riskier because they may reduce our ability to diversify our loan portfolio. Our largest loan to a single borrower will not exceed an amount equal to 20% of the total capital contributions raised in the Offering, and as of March 31, 2013, our largest loan to a single borrower is equal to approximately 6% of the total capital contributions raised in the Offering.
The concentration of loans with a common borrower may increase our risks.
We may invest in multiple mortgage loans that share a common borrower or loans to related borrowers. As of March 31, 2013, we have invested approximately 65% of our offering proceeds in 38 loans to our largest group of related borrowers. The bankruptcy, insolvency or other inability of any borrower that is the subject of multiple loans to pay interest or repay principal on its loans would have adverse consequences on our income and reduce the amount of funds available for distribution to investors. In addition, we expect to be dependent on a limited number of borrowers for a large portion of our business. The more concentrated our portfolio is with one or a few borrowers, the greater credit risk we face. The loss of any one of these borrowers would have a material adverse effect on our financial condition and results of operations.
If we were found to have violated applicable usury laws, we would be subject to penalties and other possible risks.
Usury laws generally regulate the amount of interest that may lawfully be charged on indebtedness. Each state has its own distinct usury laws. We believe that our loans will not violate applicable usury laws (as of March 31, 2013, the highest interest rate we have charged on an annualized basis is 15%). There is a risk, however, that a court could determine that our loans do violate applicable usury laws. If we were found to have violated applicable usury laws, we could be subject to penalties, including fines equal to three times the amount of usurious interest collected and restitution to the borrower. Additionally, usury laws often provide that a loan that violates usury laws is unenforceable. If we are subject to penalties or restitution or if our loan agreements are adjudged unenforceable by a court, it would have a material, adverse effect on our business, financial condition and results of operations and we would have difficulty making distributions to our shareholders.
Item 2. Unregistered Sales of Equity Securities and Use of Proceeds.
Use of Proceeds from Registered Securities
On November 12, 2009, our Registration Statement (Registration No. 333-152760), covering the Offering of up to 25,000,000 common shares of beneficial interest to be offered in the Primary Offering at a price of $20 per share, was declared effective under the Securities Act of 1933, as amended. The Registration Statement also initially covered up to 10,000,000 common shares of beneficial interest to be issued pursuant to our DRIP for $20 per share. Therefore, the aggregate offering price of the shares registered pursuant to the Offering is $700 million.We have the right to reallocate the common shares of beneficial interest registered in the Offering between the Primary Offering and the DRIP, and pursuant to Supplement No. 6 to our prospectus regarding the Offering, which was filed with the Securities and Exchange Commission on May 3, 2013, we reallocated the shares being offered to be 34,000,000 shares offered pursuant to the Primary Offering and 1,000,000 shares offered pursuant to the DRIP. The Offeringwill terminate on or before May 13, 2013.
As of March 31, 2013, we had issued an aggregate of 20,687,672 common shares of beneficial interest in the Primary Offering and DRIP, consisting of 20,012,671 common shares of beneficial interest in accordance with the Primary Offering in exchange for gross proceeds of approximately $400.2 million and 675,001 common shares of beneficial interest in accordance with our DRIP in exchange for gross proceeds of approximately $13.5 million. Including DRIP proceeds, the net offering proceeds to us, after deducting approximately $51.9 million of offering costs, were approximately $361.8 million. Of the offering costs, approximately $12.0 million was paid to our Advisor for organization and offering expenses and approximately $39.9 million was paid to non-affiliates for selling commissions, dealer manager fees and other offering fees.
As of March 31, 2013, we had originated or purchased 86 loans with aggregate, maximum, loan amounts totaling approximately $504.8 million. We had approximately $68.6 million of commitments to be funded under terms of the notes receivable and loan participation interest (including related parties), of which approximately $13.4 million relates to notes receivable – related parties, $52.4 million relates to notes receivable, and approximately $2.8 million relates to commitments to be funded under terms of the loan participation interest – related parties.
We pay UMTH LD, our asset manager, Acquisition and Origination Fees. From inception through March 31, 2013, we have paid UMTH LD approximately $10.4 million for Acquisition and Origination Fees, as discussed in Note B to our accompanying consolidated financial statements.
On October 19, 2012, we filed a Registration Statement on Form S-11 (Registration No. 333-184508) with the SEC with respect to the proposed Follow-On Offering of up to 20,000,000 common shares of beneficial interest to be offered at a price of $20.00 per share and up to 10,000,000 common shares of beneficial interest to be issued pursuant to our DRIP for $20.00 per share. We have not issued any shares under this registration statement as it has not yet been declared effective by the SEC.
On April 19, 2013, we registered 7,500,000 additionalcommon shares of beneficial interest to be offered pursuant to Secondary DRIP for $20 per share. We will stop offeringcommon shares of beneficial interest under the DRIP portion of the Offering upon the termination of the Offering (which is anticipated to be May 13, 2013). Upon the termination of the Offering, we will begin to offer our common shares of beneficial interest to our shareholders pursuant to the Secondary DRIP.
Unregistered Sales of Equity Securities
During the three months ended March 31, 2013, we did not sell any equity securities that were not registered or otherwise exempt under the Securities Act of 1933, as amended.
Share Redemption Program
We have adopted a share redemption program that enables our shareholders to sell their shares back to us in limited circumstances. Generally, this program permits shareholders to sell their shares back to us after they have held them for at least one year.Except for redemptions upon the death of a shareholder (in which case we may waive the minimum holding periods), the purchase price for the redeemed shares, for the period beginning after a shareholder has held the shares for a period of one year, will be (1) 92% of the purchase price actually paid for any shares held less than two years, (2) 94% of the purchase price actually paid for any shares held for at least two years but less than three years, (3) 96% of the purchase price actually paid for any shares held at least three years but less than four years, (4) 98% of the purchase price actually paid for any shares held at least four years but less than five years and (5) for any shares held at least five years, the lesser of the purchase price actually paid or the then-current fair market value of the shares as determined by the most recent annual valuation of our shares. The purchase price for shares redeemed upon the death of a shareholder will be the lesser of (1) the purchase price the shareholder actually paid for the shares or (2) $20.00 per share.
We reserve the right in our sole discretion at any time and from time to time to (1) waive the one-year holding period in the event of the death or bankruptcy of a shareholder or other exigent circumstances, (2) reject any request for redemption, (3) change the purchase price for redemptions, or (4) terminate, suspend and/or reestablish our share redemption program. In respect of shares redeemed upon the death of a shareholder, we will not redeem in excess of 1% of the weighted average number of shares outstanding during the twelve-month period immediately prior to the date of redemption, and the total number of shares we may redeem at any time will not exceed 5% of the weighted average number of shares outstanding during the trailing twelve-month period prior to the redemption date. Our board of trustees will determine from time to time whether we have sufficient excess cash from operations to repurchase shares. Generally, the cash available for redemption will be limited to 1% of the operating cash flow from the previous fiscal year, plus any net proceeds from our DRIP.
The following table sets forth information relating to our common shares of beneficial interest that have been repurchased during the quarter ended March 31, 2013:
| 2013 | | Total number of
common shares of
beneficial interest
repurchased | | | Average
price paid
per common
share of
beneficial
interest | | | Total number of
common shares of
beneficial interest
repurchased as part
of publicly
announced plan | | | Maximum
number of
common shares of
beneficial interest
that may yet be
purchased under
the plan | |
| January | | | 4,555 | | | $ | 19.27 | | | | 4,555 | | | | (1) | |
| February | | | 16,319 | | | $ | 19.36 | | | | 16,319 | | | | (1) | |
| March | | | 9,892 | | | $ | 19.80 | | | | 9,892 | | | | (1) | |
| | | | 30,766 | | | $ | 19.49 | | | | 30,766 | | | | | |
| (1) | A description of the maximum number of common shares of beneficial interest that may be purchased under our redemption program is included in the narrative preceding this table. |
For the three months ended March 31, 2013, we received valid redemption requests relating to 30,766 shares of beneficial interest, all of which were redeemed for an aggregate purchase price of approximately $600,000 (an average redemption price of $19.49 per share). For the year ended December 31, 2012, we received valid redemption requests relating to 96,016 shares of beneficial interest, all of which were redeemed for an aggregate purchase price of approximately $1.8 million (an average redemption price of approximately $19.05 per share). Such shares are included in treasury stock in the accompanying consolidated financial statements included in this Form 10-Q. A valid redemption request is one that complies with the applicable requirements and guidelines of our current share redemption program set forth in the prospectus relating to the Offering. We have funded all share redemptions using funds from operations.
Item 3. Defaults Upon Senior Securities.
None.
Item 4. Mine Safety Disclosures.
Not applicable.
Item 5. Other Information.
None.
Item 6. Exhibits.
The exhibits filed in response to Item 601 of Regulation S-K are listed on the Index to Exhibits attached hereto.
SIGNATURES
Pursuant to the requirements of the Securities Exchange Act of 1934, the registrant has duly caused this report to be signed on its behalf by the undersigned thereunto duly authorized.
| | United Development Funding IV |
| | |
| Dated: May 10, 2013 | By: | /s/ Hollis M. Greenlaw |
| | | Hollis M. Greenlaw |
| | | Chief Executive Officer |
| | | Principal Executive Officer |
| | | |
| Dated: May 10, 2013 | By: | /s/ Cara D. Obert |
| | | Cara D. Obert |
| | | Chief Financial Officer |
| | | Principal Financial Officer |
Index to Exhibits
| Exhibit Number | | Description |
| | | |
| 3.1 | | Second Articles of Amendment and Restatement of United Development Funding IV (previously filed in and incorporated by reference to Registrant’s Pre-Effective Amendment No. 2 to Registration Statement on Form S-11, Commission File No. 333-152760, filed on December 16, 2008) |
| | | |
| 3.2 | | Bylaws of United Development IV (previously filed in and incorporated by reference to Registrant’s Registration Statement on Form S-11, Commission File No. 333-152760, filed on August 5, 2008) |
| | | |
| 4.1 | | Form of Subscription Agreement (previously filed in and incorporated by reference to Exhibit B to prospectus dated April 27, 2012 filed pursuant to Rule 424(b)(3), Commission File No. 333-152760, filed on April 30, 2012) |
| | | |
| 4.2 | | Distribution Reinvestment Plan (previously filed in and incorporated by reference to Exhibit C to prospectus dated April 27, 2012 filed pursuant to Rule 424(b)(3), Commission File No. 333-152760, filed on April 30, 2012) |
| | | |
| 4.3 | | Share Redemption Program (previously filed in and incorporated by reference from the description under “Description of Shares – Share Redemption Program” in the prospectus dated April 27, 2012 filed pursuant to Rule 424(b)(3), Commission File No. 333-152760, filed on April 30, 2012) |
| | | |
| 31.1* | | Rule 13a-14(a)/15d-14(a) Certification of Principal Executive Officer |
| | | |
| 31.2* | | Rule 13a-14(a)/15d-14(a) Certification of Principal Financial Officer |
| | | |
| 32.1** | | Section 1350 Certifications |
| | | |
| 101.INS*** | | XBRL Instance Document |
| | | |
| 101.SCH*** | | XBRL Taxonomy Extension Schema Document |
| | | |
| 101.CAL*** | | XBRL Taxonomy Extension Calculation Linkbase Document |
| | | |
| 101.LAB*** | | XBRL Taxonomy Extension Label Linkbase Document |
| | | |
| 101.PRE*** | | XBRL Taxonomy Extension Presentation Linkbase Document |
| | | |
| 101.DEF*** | | XBRL Taxonomy Extension Definition Linkbase Document |
| * | | Filed herewith. |
| | | |
| ** | | Furnished herewith. In accordance with Item 601(b)(32) of Regulation S-K, this Exhibit is not deemed “filed” for purposes of Section 18 of the Exchange Act or otherwise subject to the liabilities of that section. Such certifications will not be deemed incorporated by reference into any filing under the Securities Act of 1933, as amended, or the Exchange Act, except to the extent that the registrant specifically incorporates it by reference. |
| | | |
| *** | | Furnished herewith. XBRL (Extensible Business Reporting Language) information is furnished and not filed or a part of a registration statement or prospectus for purposes of Sections 11 or 12 of the Securities Act of 1933, is deemed not filed for purposes of Section 18 of the Securities Exchange Act of 1934, and otherwise is not subject to liability under these sections. |