UNITED STATES
SECURITIES AND EXCHANGE COMMISSION
Washington, D.C. 20549
FORM N-CSR
CERTIFIED SHAREHOLDER REPORT OF REGISTERED
MANAGEMENT INVESTMENT COMPANIES
Investment Company Act File Number: 811-22218
| T. Rowe Price Global Real Estate Fund, Inc. |
|
| (Exact name of registrant as specified in charter) |
| |
| 100 East Pratt Street, Baltimore, MD 21202 |
|
| (Address of principal executive offices) |
| |
| David Oestreicher |
| 100 East Pratt Street, Baltimore, MD 21202 |
|
| (Name and address of agent for service) |
Registrant’s telephone number, including area code: (410) 345-2000
Date of fiscal year end: December 31
Date of reporting period: June 30, 2016
Item 1. Report to Shareholders
| Global Real Estate Fund | June 30, 2016 |
The views and opinions in this report were current as of June 30, 2016. They are not guarantees of performance or investment results and should not be taken as investment advice. Investment decisions reflect a variety of factors, and the managers reserve the right to change their views about individual stocks, sectors, and the markets at any time. As a result, the views expressed should not be relied upon as a forecast of the fund’s future investment intent. The report is certified under the Sarbanes-Oxley Act, which requires mutual funds and other public companies to affirm that, to the best of their knowledge, the information in their financial reports is fairly and accurately stated in all material respects.
REPORTS ON THE WEB
Sign up for our Email Program, and you can begin to receive updated fund reports and prospectuses online rather than through the mail. Log in to your account at troweprice.com for more information.
Manager’s Letter
Fellow Shareholders
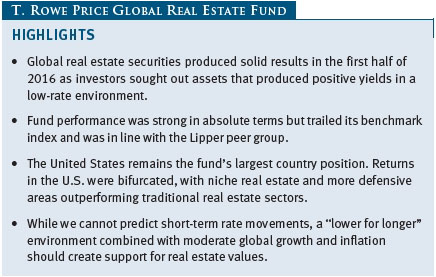
Global real estate securities produced strong overall results in the first half of 2016, outperforming many broader developed market equity indexes, such as the S&P 500, by a wide margin. Real estate stocks were widely positive across most major markets, but the UK suffered significant losses as a result of the Brexit referendum in which voters chose to leave the European Union (EU). Investor demand for assets that produce income benefited the real estate sector as sovereign debt in many developed markets ended the period with negative yields. In addition, fundamentals remained strong in many global markets and property types as demand continued to exceed supply. While our fund delivered strong absolute results, our stock selection in some markets lagged the index.
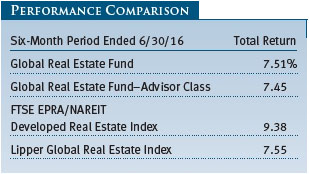
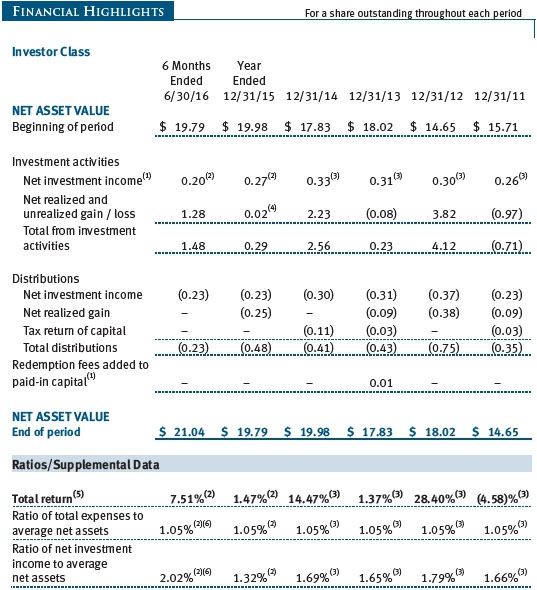
During the six-month period ended June 30, 2016, the Global Real Estate Fund returned 7.51%, which trailed the 9.38% gain turned in by the benchmark FTSE EPRA/NAREIT Developed Real Estate Index but was in line with the 7.55% return for the Lipper Global Real Estate Index. (The return for the Advisor Class was slightly lower, reflecting its different fee structure.)
DIVIDEND DISTRIBUTION
On June 27, 2016, your Board of Directors declared a second-quarter dividend of $0.13 per share to shareholders of record on that day. You should have received your check or statement reflecting this distribution. The dividend was distributed on June 29.
MARKET ENVIRONMENT AND STRATEGY
World markets started the year with deep losses amid concerns about weakening Chinese and global economic growth and as a supply glut drove oil prices to 13-year lows. In fact, by mid-February, U.S. small-caps and some non-U.S. markets had fallen into a bear market, commonly defined as a drop of at least 20% from recent highs. However, equities and other riskier asset classes rallied through late June, as the Bank of Japan (BoJ) and the European Central Bank unveiled new stimulus efforts.
Yields on government debt in many developed markets plummeted to very low or negative levels following the Brexit vote, which created uncertainty about the trajectory for global economic growth and convinced investors that central banks would expand their aggressive monetary stimulus measures. In the U.S., longer-term Treasury yields decreased markedly, with the yield on the benchmark 10-year Treasury note falling to 1.49% at the end of the reporting period from 2.27% at the beginning. The yields on both the German and Japanese 10-year government notes moved into negative territory by the end of the period.
After a long period of U.S. dollar strength in 2014 and 2015, the dollar lost ground against many other currencies in the reporting period. For example, the Japanese yen gained 17% against the greenback. One glaring exception to the dollar weakness among the currencies of developed countries was the British pound sterling, which declined abruptly after the Brexit vote to finish down more than 9% against the U.S. dollar for the first half of 2016. Emerging markets currencies were more mixed versus the dollar. The Brazilian real climbed over 23% amid investor hopes that the interim president will be able to implement structural reforms to improve the country’s fiscal situation.
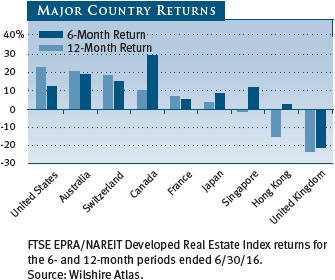
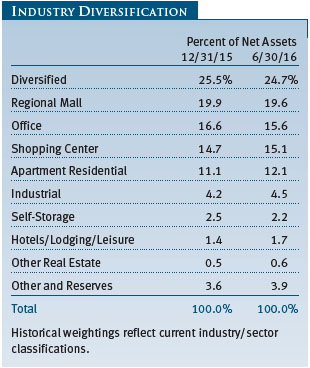
In this environment, U.S. real estate investment trusts (REITs) gained 13%, staging a recovery in the second half of the period and outperforming the index. In general, occupancy rates remain high and rents are increasing across most markets and property types. Forecasts for the number of Fed interest rate hikes in 2016 fell sharply due to mixed economic data in the U.S. as well as concerns about Brexit. Real estate sectors that were perceived to be more bond-like and “defensive,” like net lease and health care, outperformed. Industrial warehouses and data centers also outperformed because of solid demand drivers associated with e-commerce and cloud computing. Concerns about the growing shift of sales to the Internet and weak earnings reports from a few large retailers resulted in divergent performance across retail real estate stocks as investors bet on who will be the winners and losers. Apartments and hotels underperformed but still posted positive absolute returns, as new supply deliveries dampened rent growth expectations.
Japanese real estate stocks were down 7% in local currency terms but up 9% in terms of the U.S. dollar due to the appreciation of the yen. Early in the period, the Bank of Japan eased monetary policy further by introducing negative interest rates. Japanese REITs (J-REITs) performed very well given their attractive dividend yields and an expanded BoJ purchase program. In contrast, Japanese developers, whose share prices tend to be highly correlated with expectations for the Japanese economy and inflation, were down significantly year-to-date. Rents are growing in the Tokyo office market as reasonable levels of new supply have been met by good demand. However, it is worth noting that the supply pipeline is growing for office as well as logistics properties.
Hong Kong stocks lagged the broader real estate market but still posted positive absolute returns. The stocks were down 12% in January as China reemerged as a key concern for investors as growth slowed and its currency depreciated relative to the U.S. dollar. Share prices recovered when Fed rate hike fears faded later in the period. Residential prices fell 12% from September 2015 to late March 2016 but have remained relatively stable since then as lower interest rates relieved fears of rising mortgage rates. Retail sales in Hong Kong remain challenged, and some rents have fallen over 25% from their peak in 2014. Hong Kong office space remains well positioned with low vacancy and decent demand.
Australian real estate equities posted very strong returns, gaining nearly 20% during the period. The Reserve Bank of Australia cut interest rates in May to a record low, reinvigorating investors’ search for yield. Commercial real estate values and our investments benefited as the segment’s above-average cash flow and dividend yields remain very attractive to investors. Lower rates also remain a tailwind to the Sydney and Melbourne residential markets. Retail sales growth moderated but is still increasing at a healthy pace. Improving demand for office space combined with more limited new supply is resulting in lower vacancy rates and increasing rents.
Results varied in Continental Europe, but on average, real estate stocks were up 8%. Cap rates (a measure of the rate of return that a real estate investment is expected to produce) continue to compress in major European cities as investors search for yield and unemployment broadly edges lower. Brexit will likely have an effect on the European economy, although the ultimate impact remains uncertain.
The UK was the worst-performing region for real estate stocks, falling 13% in terms of the pound sterling and 21% in U.S. dollar terms. Real estate stocks declined significantly following the EU referendum in late June. Uncertainty persists around when and how the UK will exit the EU. Fears about potential job losses and job transfers to the EU hurt London office stocks. It is unclear what will happen from here, but weakness in the pound and low gilt yields could buffer property values. In addition, while we were more concerned about new office supply before the vote, uncertainty created by the referendum is likely to reduce the appetite for speculative office development. Several funds that invest directly in UK real estate were forced to halt redemptions after the period ended, further adding to the uncertainty surrounding UK property values.
PORTFOLIO REVIEW
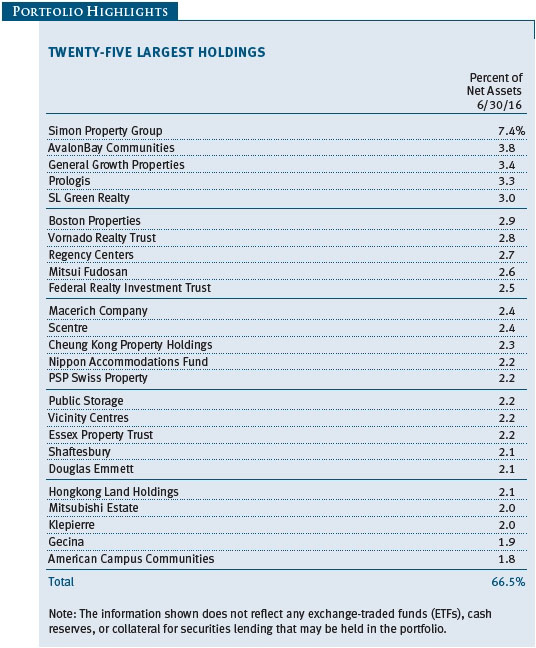
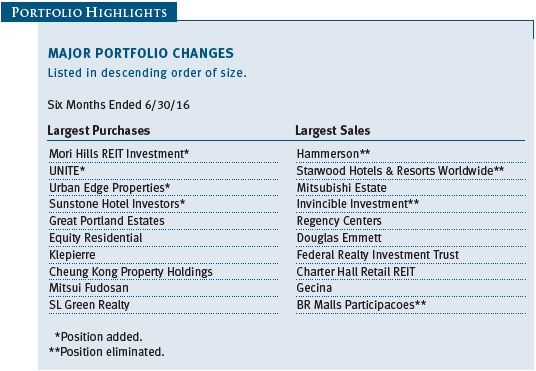
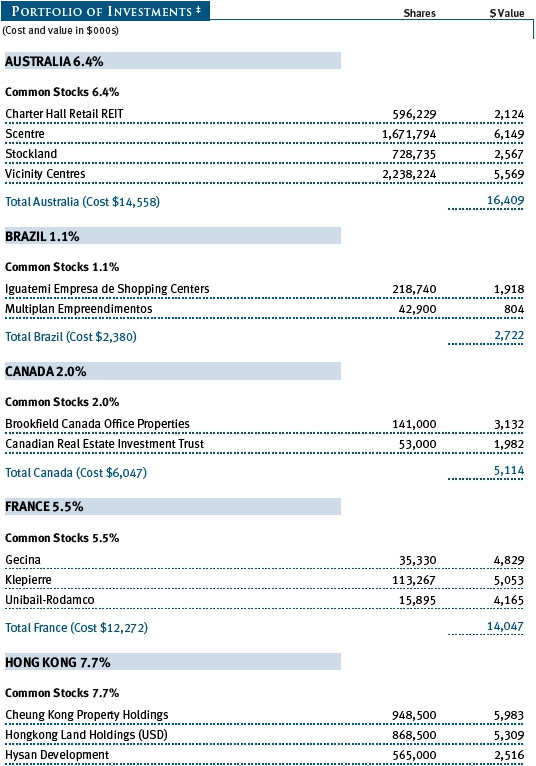
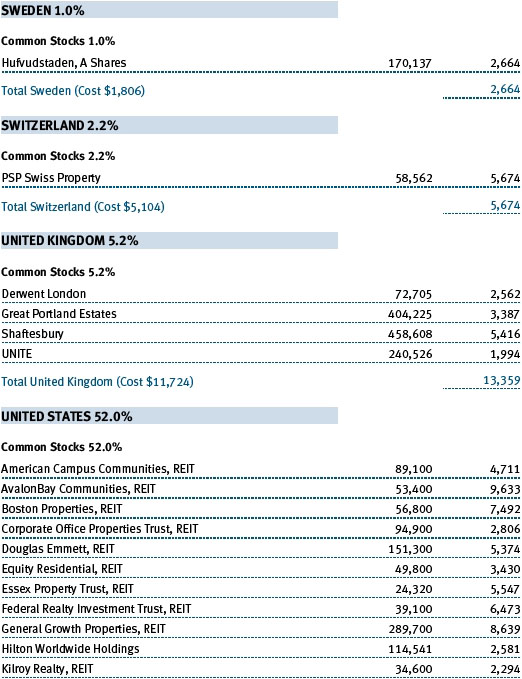
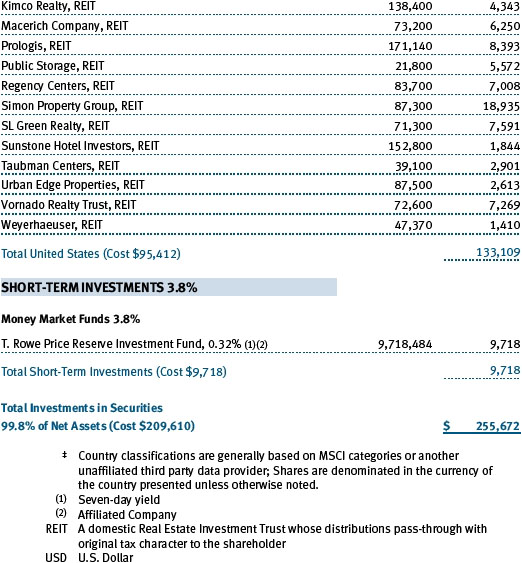
Stock selection in Brazil, which is not included in the index, and Australia were beneficial to the fund. In a reversal from 2015, when they were among the weakest performers, Brazilian mall owners were significant contributors, advancing over 90% year-to-date. In light of these very strong results, we eliminated BR Malls Participacoes and used the proceeds to initiate a position in Multiplan Empreendimentos Imobiliarios, which has a strong balance sheet and highly productive retail assets. We maintained our position in Iguatemi Empresa de Shopping Centers. In Australia, our positions in Vicinity Centres and Scentre performed well as retail sales continue to grow at a healthy pace. We believe these highly productive retail portfolios will be able to increase rents despite perceived headwinds from e-commerce. We trimmed Charter Hall Retail REIT on strength. (Please refer to the fund’s portfolio of investments for a complete list of holdings and the amount each represents in the portfolio.)
Several office landlords in Continental Europe performed well, contributing to results. Gecina and Hufvudstaden benefited from improving occupancy and rents in their respective markets, Paris and Stockholm. PSP Swiss Property also gained as investors gravitated toward the relative safety of Swiss property following Brexit. We continue to appreciate these companies’ local focus and solid balance sheets.
In the poorly performing UK real estate segment, our investments in Great Portland Estates and Derwent London declined over 30% after the vote, hurting our performance. However, we added to our positions as both companies own excellent office assets with significant redevelopment potential in the prime West End of London. While we remain alert to the potential fallout that Brexit may bring, including slowing corporate decision-making and potentially job losses or recession, we expect that London will remain a relatively desirable place for companies to do business and for investors to own property. Prior to the vote, we eliminated retail property owner Hammerson and used the proceeds to initiate a position in UNITE as we forecast better rent growth prospects and development opportunities in student housing.
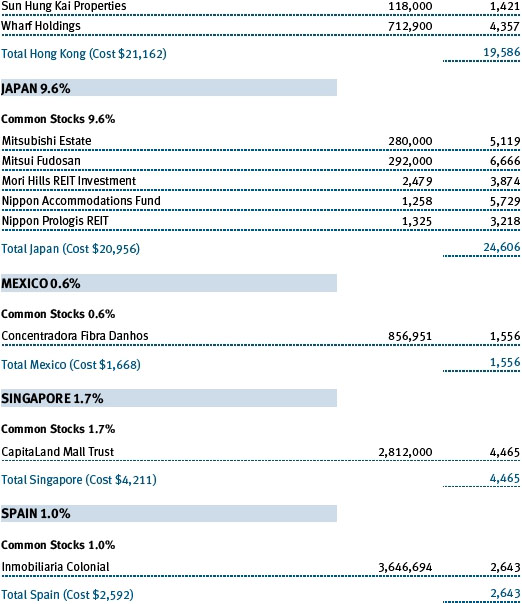
In Japan, our holdings in Mitsubishi Estate and Mitsui Fudosan were poor performers, posting negative absolute returns and detracting from performance as the market remains concerned about the Japanese economy and the lack of inflation despite significant easing measures from the central bank. Our J-REIT positions posted positive returns, as reflected in the performance of Nippon Accomodations Fund and Nippon Prologis REIT, as attractive dividend yields appealed to investors in a country with a negative interest rate policy. Our thesis that increasing tourist arrivals would drive strong revenue-per-available-room growth in hotels played out as expected, and we eliminated Invincible Investment following outperformance. We initiated a position in Mori Hills REIT Investment, a J-REIT, which owns office properties in central Tokyo and has a strong pipeline of potential acquisition opportunities from its sponsor company.
Hong Kong posted positive absolute returns for the fund but underperformed the index. Hongkong Land Holdings was down and detracted from performance, partially reversing strong returns in 2015. Good, but moderating, leasing activity and an expected increase in office supply—albeit in more secondary locations outside Central, the city’s business district—tempered expectations.
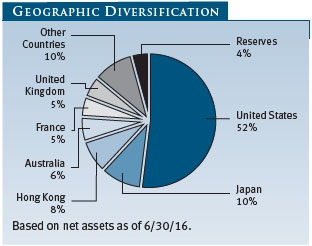
In the United States, absolute returns were positive but our portfolio trailed the index, largely as a result of our relative lack of exposure to certain niche and specialty REITs that performed unusually well during the period. However, we continue to believe that our positioning in higher-quality traditional real estate will lead to better risk-adjusted long-term returns. Shopping center landlords Regency Centers and Federal Realty Investment Trust were positive contributors, recording double-digit returns. We trimmed our positions on strength. We initiated a position in Urban Edge Properties, which owns convenience-oriented, well-located shopping centers primarily in the suburbs surrounding New York City.
Slowing employment growth in Manhattan and an above-average supply pipeline weighed on New York City office landlords, including our holdings in SL Green Realty, which we added to on weakness; Vornado Realty Trust; and Boston Properties. Los Angeles office market specialist Douglas Emmett fared better, posting double-digit returns as the West Los Angeles office market continues to improve amid strong leasing demand and limited new supply. Corporate Office Properties Trust was also a positive contributor following a management change and stabilizing Washington D.C. office fundamentals. We eliminated Starwood Hotels & Resorts Worldwide following the announcement of its merger with Marriott International. We used the proceeds to initiate a position in Sunstone Hotel Investors, a hotel REIT with well-located assets and a solid balance sheet.
OUTLOOK
As we look around the world, we continue to see a preponderance of low interest rates and thus a continued search for yield by investors. While we cannot predict short-term rate movements, a “lower for longer” environment combined with moderate global growth and inflation should create support for real estate values. While we appreciate the attractiveness of real estate as an investment that generally provides relatively attractive yields, our focus remains on a total return approach that includes both yield and capital appreciation. This is because we believe the fundamental balance between supply and demand will drive rents and, therefore, real estate values over the long term. We remain highly focused on stock selection and investing in good companies, at reasonable prices, where the locations are so desirable that demand for space exceeds the supply of new properties.
Currently, the supply/demand balance is favorable in most markets where we invest. Thus, occupancy rates are high and rents have been growing. The construction of new commercial real estate projects has remained reasonably restrained as the global economic recovery has been moderate and financing has been more restricted relative to prior cycles. Supply pipelines are increasing, though, and are something we watch closely. Demand, while positive today, can change quickly as we saw in the weeks following the UK referendum. As a result, we now expect companies to delay decision-making about their London office footprints. This will likely hurt office landlords’ ability to increase rents and may manifest itself in lower property values.
Our focus remains on generating risk-adjusted returns through bottom-up stock selection. Our goal is to make long-term investments in great real estate where we believe the risk/reward balance is in our favor. Volatility, which picked up late in the period, often creates opportunities for our approach, as it allows us to buy high-quality real estate at what we believe will prove to be discounted prices over the long term. This recent volatility also highlights, in our view, the benefits of investing in publicly traded real estate companies as opposed to direct real estate investing, as it provides daily liquidity for our shareholders even during tumultuous times. We will continue to focus on executing our fundamentally driven, bottom-up approach, which we believe will lead to attractive risk-adjusted returns for our shareholders over longer periods.
Thank you for your continued support and confidence.
Respectfully submitted,

Nina Jones
President of the fund and chair of its Investment Advisory Committee
July 27, 2016
The committee chairman has day-to-day responsibility for managing the portfolio and works with committee members in developing and executing the fund’s investment program.
RISKS OF INVESTING
The fund’s share price can fall because of weakness in the stock market, a particular industry, or specific holdings. Stock markets can decline for many reasons, including adverse political or economic developments, changes in investor psychology, or heavy institutional selling. The prospects for an industry or company may deteriorate because of a variety of factors, including disappointing earnings or changes in the competitive environment. In addition, the investment manager’s assessment of companies held in a fund may prove incorrect, resulting in losses or poor performance even in rising markets.
Funds that invest only in specific industries will experience greater volatility than funds investing in a broad range of industries. Due to its concentration in the real estate industry, the fund’s share price could be more volatile than that of a fund with a broader investment mandate. Trends perceived to be unfavorable to real estate, such as changes in the tax laws or rising interest rates, could cause a decline in share prices.
Funds that invest overseas generally carry more risk than funds that invest strictly in U.S. assets. Funds investing in a single country or in a limited geographic region tend to be riskier than more diversified funds. Risks can result from varying stages of economic and political development; differing regulatory environments, trading days, and accounting standards; and higher transaction costs of non-U.S. markets. Non-U.S. investments are also subject to currency risk, or a decline in the value of a foreign currency versus the U.S. dollar, which reduces the dollar value of securities denominated in that currency.
GLOSSARY
FTSE EPRA/NAREIT Developed Real Estate Index: A total return index composed of the most actively traded REITs and REIT-type structures, designed to be a measure of global real estate equity performance.
Lipper indexes: Fund benchmarks that consist of a small number of the largest mutual funds in a particular category as tracked by Lipper Inc.
Net lease: A type of lease that requires the tenant to pay expenses in addition to rent such as taxes or maintenance fees.
Real estate investment trusts (REITs): Publicly traded companies that own, develop, and operate apartment complexes, hotels, office buildings, and other commercial properties.
Performance and Expenses
This chart shows the value of a hypothetical $10,000 investment in the fund over the past 10 fiscal year periods or since inception (for funds lacking 10-year records). The result is compared with benchmarks, which may include a broad-based market index and a peer group average or index. Market indexes do not include expenses, which are deducted from fund returns as well as mutual fund averages and indexes.


As a mutual fund shareholder, you may incur two types of costs: (1) transaction costs, such as redemption fees or sales loads, and (2) ongoing costs, including management fees, distribution and service (12b-1) fees, and other fund expenses. The following example is intended to help you understand your ongoing costs (in dollars) of investing in the fund and to compare these costs with the ongoing costs of investing in other mutual funds. The example is based on an investment of $1,000 invested at the beginning of the most recent six-month period and held for the entire period.
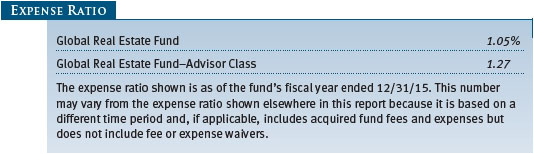
Please note that the fund has two share classes: The original share class (Investor Class) charges no distribution and service (12b-1) fee, and the Advisor Class shares are offered only through unaffiliated brokers and other financial intermediaries and charge a 0.25% 12b-1 fee. Each share class is presented separately in the table.
Actual Expenses
The first line of the following table (Actual) provides information about actual account values and expenses based on the fund’s actual returns. You may use the information on this line, together with your account balance, to estimate the expenses that you paid over the period. Simply divide your account value by $1,000 (for example, an $8,600 account value divided by $1,000 = 8.6), then multiply the result by the number on the first line under the heading “Expenses Paid During Period” to estimate the expenses you paid on your account during this period.
Hypothetical Example for Comparison Purposes
The information on the second line of the table (Hypothetical) is based on hypothetical account values and expenses derived from the fund’s actual expense ratio and an assumed 5% per year rate of return before expenses (not the fund’s actual return). You may compare the ongoing costs of investing in the fund with other funds by contrasting this 5% hypothetical example and the 5% hypothetical examples that appear in the shareholder reports of the other funds. The hypothetical account values and expenses may not be used to estimate the actual ending account balance or expenses you paid for the period.
Note: T. Rowe Price charges an annual account service fee of $20, generally for accounts with less than $10,000. The fee is waived for any investor whose T. Rowe Price mutual fund accounts total $50,000 or more; accounts electing to receive electronic delivery of account statements, transaction confirmations, prospectuses, and shareholder reports; or accounts of an investor who is a T. Rowe Price Preferred Services, Personal Services, or Enhanced Personal Services client (enrollment in these programs generally requires T. Rowe Price assets of at least $100,000). This fee is not included in the accompanying table. If you are subject to the fee, keep it in mind when you are estimating the ongoing expenses of investing in the fund and when comparing the expenses of this fund with other funds.
You should also be aware that the expenses shown in the table highlight only your ongoing costs and do not reflect any transaction costs, such as redemption fees or sales loads. Therefore, the second line of the table is useful in comparing ongoing costs only and will not help you determine the relative total costs of owning different funds. To the extent a fund charges transaction costs, however, the total cost of owning that fund is higher.

Unaudited

The accompanying notes are an integral part of these financial statements.
Unaudited

The accompanying notes are an integral part of these financial statements.
Unaudited
The accompanying notes are an integral part of these financial statements.
Unaudited

The accompanying notes are an integral part of these financial statements.
Unaudited
The accompanying notes are an integral part of these financial statements.
Unaudited

The accompanying notes are an integral part of these financial statements.
Unaudited
| Notes to Financial Statements |
T. Rowe Price Global Real Estate Fund, Inc. (the fund), is registered under the Investment Company Act of 1940 (the 1940 Act) as a nondiversified, open-end management investment company. The fund seeks to provide long-term growth through a combination of capital appreciation and current income. The fund has two classes of shares: the Global Real Estate Fund original share class, referred to in this report as the Investor Class, incepted on October 27, 2008, and the Global Real Estate Fund–Advisor Class (Advisor Class), incepted on October 27, 2008. Advisor Class shares are sold only through unaffiliated brokers and other unaffiliated financial intermediaries that are compensated by the class for distribution, shareholder servicing, and/or certain administrative services under a Board-approved Rule 12b-1 plan; the Investor Class does not pay Rule 12b-1 fees. Each class has exclusive voting rights on matters related solely to that class; separate voting rights on matters that relate to both classes; and, in all other respects, the same rights and obligations as the other class.
NOTE 1 - SIGNIFICANT ACCOUNTING POLICIES
Basis of Preparation The fund is an investment company and follows accounting and reporting guidance in the Financial Accounting Standards Board (FASB) Accounting Standards Codification Topic 946 (ASC 946). The accompanying financial statements were prepared in accordance with accounting principles generally accepted in the United States of America (GAAP), including, but not limited to, ASC 946. GAAP requires the use of estimates made by management. Management believes that estimates and valuations are appropriate; however, actual results may differ from those estimates, and the valuations reflected in the accompanying financial statements may differ from the value ultimately realized upon sale or maturity.
Investment Transactions, Investment Income, and Distributions Income and expenses are recorded on the accrual basis. Dividends received from mutual fund investments are reflected as dividend income; capital gain distributions, if any, are reflected as realized gain/loss. Dividend income and capital gain distributions are recorded on the ex-dividend date. Income tax-related interest and penalties, if incurred, would be recorded as income tax expense. Investment transactions are accounted for on the trade date. Realized gains and losses are reported on the identified cost basis. Distributions from REITs are initially recorded as dividend income and, to the extent such represent a return of capital or capital gain for tax purposes, are reclassified when such information becomes available. Income distributions are declared and paid by each class quarterly. Distributions to shareholders are recorded on the ex-dividend date. Capital gain distributions, if any, are generally declared and paid by the fund annually.
Currency Translation Assets, including investments, and liabilities denominated in foreign currencies are translated into U.S. dollar values each day at the prevailing exchange rate, using the mean of the bid and asked prices of such currencies against U.S. dollars as quoted by a major bank. Purchases and sales of securities, income, and expenses are translated into U.S. dollars at the prevailing exchange rate on the date of the transaction. The effect of changes in foreign currency exchange rates on realized and unrealized security gains and losses is reflected as a component of security gains and losses.
Class Accounting Shareholder servicing, prospectus, and shareholder report expenses incurred by each class are charged directly to the class to which they relate. Expenses common to both classes, investment income, and realized and unrealized gains and losses are allocated to the classes based upon the relative daily net assets of each class. The Advisor Class pays Rule 12b-1 fees, in an amount not exceeding 0.25% of the class’s average daily net assets.
Redemption Fees A 2% fee is assessed on redemptions of fund shares held for 90 days or less to deter short-term trading and to protect the interests of long-term shareholders. Redemption fees are withheld from proceeds that shareholders receive from the sale or exchange of fund shares. The fees are paid to the fund and are recorded as an increase to paid-in capital. The fees may cause the redemption price per share to differ from the net asset value per share.
NOTE 2 - VALUATION
The fund’s financial instruments are valued and each class’s net asset value (NAV) per share is computed at the close of the New York Stock Exchange (NYSE), normally 4 p.m. ET, each day the NYSE is open for business.
Fair Value The fund’s financial instruments are reported at fair value, which GAAP defines as the price that would be received to sell an asset or paid to transfer a liability in an orderly transaction between market participants at the measurement date. The T. Rowe Price Valuation Committee (the Valuation Committee) has been established by the fund’s Board of Directors (the Board) to ensure that financial instruments are appropriately priced at fair value in accordance with GAAP and the 1940 Act. Subject to oversight by the Board, the Valuation Committee develops and oversees pricing-related policies and procedures and approves all fair value determinations. Specifically, the Valuation Committee establishes procedures to value securities; determines pricing techniques, sources, and persons eligible to effect fair value pricing actions; oversees the selection, services, and performance of pricing vendors; oversees valuation-related business continuity practices; and provides guidance on internal controls and valuation-related matters. The Valuation Committee reports to the Board and has representation from legal, portfolio management and trading, operations, risk management, and the fund’s treasurer.
Various valuation techniques and inputs are used to determine the fair value of financial instruments. GAAP establishes the following fair value hierarchy that categorizes the inputs used to measure fair value:
Level 1 – quoted prices (unadjusted) in active markets for identical financial instruments that the fund can access at the reporting date
Level 2 – inputs other than Level 1 quoted prices that are observable, either directly or indirectly (including, but not limited to, quoted prices for similar financial instruments in active markets, quoted prices for identical or similar financial instruments in inactive markets, interest rates and yield curves, implied volatilities, and credit spreads)
Level 3 – unobservable inputs
Observable inputs are developed using market data, such as publicly available information about actual events or transactions, and reflect the assumptions that market participants would use to price the financial instrument. Unobservable inputs are those for which market data are not available and are developed using the best information available about the assumptions that market participants would use to price the financial instrument. GAAP requires valuation techniques to maximize the use of relevant observable inputs and minimize the use of unobservable inputs. When multiple inputs are used to derive fair value, the financial instrument is assigned to the level within the fair value hierarchy based on the lowest-level input that is significant to the fair value of the financial instrument. Input levels are not necessarily an indication of the risk or liquidity associated with financial instruments at that level but rather the degree of judgment used in determining those values.
Valuation Techniques Equity securities listed or regularly traded on a securities exchange or in the over-the-counter (OTC) market are valued at the last quoted sale price or, for certain markets, the official closing price at the time the valuations are made. OTC Bulletin Board securities are valued at the mean of the closing bid and asked prices. A security that is listed or traded on more than one exchange is valued at the quotation on the exchange determined to be the primary market for such security. Listed securities not traded on a particular day are valued at the mean of the closing bid and asked prices for domestic securities and the last quoted sale or closing price for international securities.
For valuation purposes, the last quoted prices of non-U.S. equity securities may be adjusted to reflect the fair value of such securities at the close of the NYSE. If the fund determines that developments between the close of a foreign market and the close of the NYSE will, in its judgment, materially affect the value of some or all of its portfolio securities, the fund will adjust the previous quoted prices to reflect what it believes to be the fair value of the securities as of the close of the NYSE. In deciding whether it is necessary to adjust quoted prices to reflect fair value, the fund reviews a variety of factors, including developments in foreign markets, the performance of U.S. securities markets, and the performance of instruments trading in U.S. markets that represent foreign securities and baskets of foreign securities. The fund may also fair value securities in other situations, such as when a particular foreign market is closed but the fund is open. The fund uses outside pricing services to provide it with quoted prices and information to evaluate or adjust those prices. The fund cannot predict how often it will use quoted prices and how often it will determine it necessary to adjust those prices to reflect fair value. As a means of evaluating its security valuation process, the fund routinely compares quoted prices, the next day’s opening prices in the same markets, and adjusted prices.
Actively traded equity securities listed on a domestic exchange generally are categorized in Level 1 of the fair value hierarchy. Non-U.S. equity securities generally are categorized in Level 2 of the fair value hierarchy despite the availability of quoted prices because, as described above, the fund evaluates and determines whether those quoted prices reflect fair value at the close of the NYSE or require adjustment. OTC Bulletin Board securities, certain preferred securities, and equity securities traded in inactive markets generally are categorized in Level 2 of the fair value hierarchy.
Investments in mutual funds are valued at the mutual fund’s closing NAV per share on the day of valuation and are categorized in Level 1 of the fair value hierarchy. Assets and liabilities other than financial instruments, including short-term receivables and payables, are carried at cost, or estimated realizable value, if less, which approximates fair value.
Thinly traded financial instruments and those for which the above valuation procedures are inappropriate or are deemed not to reflect fair value are stated at fair value as determined in good faith by the Valuation Committee. The objective of any fair value pricing determination is to arrive at a price that could reasonably be expected from a current sale. Financial instruments fair valued by the Valuation Committee are primarily private placements, restricted securities, warrants, rights, and other securities that are not publicly traded.
Subject to oversight by the Board, the Valuation Committee regularly makes good faith judgments to establish and adjust the fair valuations of certain securities as events occur and circumstances warrant. For instance, in determining the fair value of an equity investment with limited market activity, such as a private placement or a thinly traded public company stock, the Valuation Committee considers a variety of factors, which may include, but are not limited to, the issuer’s business prospects, its financial standing and performance, recent investment transactions in the issuer, new rounds of financing, negotiated transactions of significant size between other investors in the company, relevant market valuations of peer companies, strategic events affecting the company, market liquidity for the issuer, and general economic conditions and events. In consultation with the investment and pricing teams, the Valuation Committee will determine an appropriate valuation technique based on available information, which may include both observable and unobservable inputs. The Valuation Committee typically will afford greatest weight to actual prices in arm’s length transactions, to the extent they represent orderly transactions between market participants, transaction information can be reliably obtained, and prices are deemed representative of fair value. However, the Valuation Committee may also consider other valuation methods such as market-based valuation multiples; a discount or premium from market value of a similar, freely traded security of the same issuer; or some combination. Fair value determinations are reviewed on a regular basis and updated as information becomes available, including actual purchase and sale transactions of the issue. Because any fair value determination involves a significant amount of judgment, there is a degree of subjectivity inherent in such pricing decisions, and fair value prices determined by the Valuation Committee could differ from those of other market participants. Depending on the relative significance of unobservable inputs, including the valuation technique(s) used, fair valued securities may be categorized in Level 2 or 3 of the fair value hierarchy.
Valuation Inputs The following table summarizes the fund’s financial instruments, based on the inputs used to determine their fair values on June 30, 2016:

There were no material transfers between Levels 1 and 2 during the six months ended June 30, 2016.
NOTE 3 - OTHER INVESTMENT TRANSACTIONS
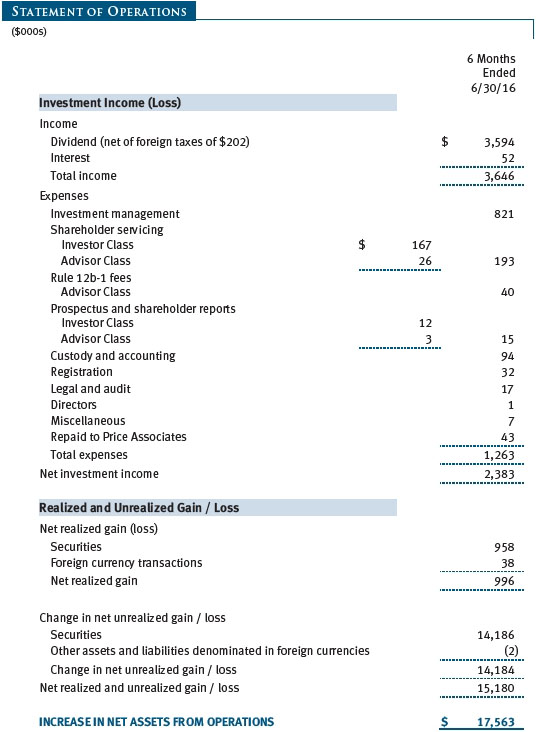
Other Purchases and sales of portfolio securities other than short-term securities aggregated $22,580,000 and $16,336,000, respectively, for the six months ended June 30, 2016.
NOTE 4 - FEDERAL INCOME TAXES
No provision for federal income taxes is required since the fund intends to continue to qualify as a regulated investment company under Subchapter M of the Internal Revenue Code and distribute to shareholders all of its taxable income and gains. Distributions determined in accordance with federal income tax regulations may differ in amount or character from net investment income and realized gains for financial reporting purposes. Financial reporting records are adjusted for permanent book/tax differences to reflect tax character but are not adjusted for temporary differences. The amount and character of tax-basis distributions and composition of net assets are finalized at fiscal year-end; accordingly, tax-basis balances have not been determined as of the date of this report.
At June 30, 2016, the cost of investments for federal income tax purposes was $209,704,000. Net unrealized gain aggregated $45,964,000 at period-end, of which $49,584,000 related to appreciated investments and $3,620,000 related to depreciated investments.
NOTE 5 - FOREIGN TAXES
The fund is subject to foreign income taxes imposed by certain countries in which it invests. Additionally, certain foreign currency transactions are subject to tax, and capital gains realized upon disposition of securities issued in or by certain foreign countries are subject to capital gains tax imposed by those countries. All taxes are computed in accordance with the applicable foreign tax law, and, to the extent permitted, capital losses are used to offset capital gains. Taxes attributable to income are accrued by the fund as a reduction of income. Taxes incurred on the purchase of foreign currencies are recorded as realized loss on foreign currency transactions. Current and deferred tax expense attributable to capital gains is reflected as a component of realized or change in unrealized gain/loss on securities in the accompanying financial statements. At June 30, 2016, the fund had no deferred tax liability attributable to foreign securities and no foreign capital loss carryforwards.
NOTE 6 - RELATED PARTY TRANSACTIONS
The fund is managed by T. Rowe Price Associates, Inc. (Price Associates), a wholly owned subsidiary of T. Rowe Price Group, Inc. (Price Group). The investment management agreement between the fund and Price Associates provides for an annual investment management fee, which is computed daily and paid monthly. The fee consists of an individual fund fee, equal to 0.40% of the fund’s average daily net assets, and a group fee. The group fee rate is calculated based on the combined net assets of certain mutual funds sponsored by Price Associates (the group) applied to a graduated fee schedule, with rates ranging from 0.48% for the first $1 billion of assets to 0.270% for assets in excess of $500 billion. The fund’s group fee is determined by applying the group fee rate to the fund’s average daily net assets. At June 30, 2016, the effective annual group fee rate was 0.29%.
The Investor Class and Advisor Class are also each subject to a contractual expense limitation through the limitation dates indicated in the table below. During the limitation period, Price Associates is required to waive its management fee or pay any expenses, excluding interest, taxes, brokerage commissions, and extraordinary expenses, that would otherwise cause the class’s ratio of annualized total expenses to average net assets (expense ratio) to exceed its expense limitation. Each class is required to repay Price Associates for expenses previously waived/paid to the extent the class’s net assets grow or expenses decline sufficiently to allow repayment without causing the class’s expense ratio to exceed its expense limitation. However, no repayment will be made more than three years after the date of a payment or waiver.

Pursuant to this agreement, $43,000 of expenses were repaid to Price Associates during the six months ended June 30, 2016. Including these amounts, expenses previously waived/paid by Price Associates in the amount of $446,000 remain subject to repayment by the fund at June 30, 2016.
In addition, the fund has entered into service agreements with Price Associates and two wholly owned subsidiaries of Price Associates (collectively, Price). Price Associates provides certain accounting and administrative services to the fund. T. Rowe Price Services, Inc., provides shareholder and administrative services in its capacity as the fund’s transfer and dividend-disbursing agent. T. Rowe Price Retirement Plan Services, Inc., provides subaccounting and recordkeeping services for certain retirement accounts invested in the Investor Class. For the six months ended June 30, 2016, expenses incurred pursuant to these service agreements were $24,000 for Price Associates; $103,000 for T. Rowe Price Services, Inc.; and $2,000 for T. Rowe Price Retirement Plan Services, Inc. The total amount payable at period-end pursuant to these service agreements is reflected as Due to Affiliates in the accompanying financial statements, if any.
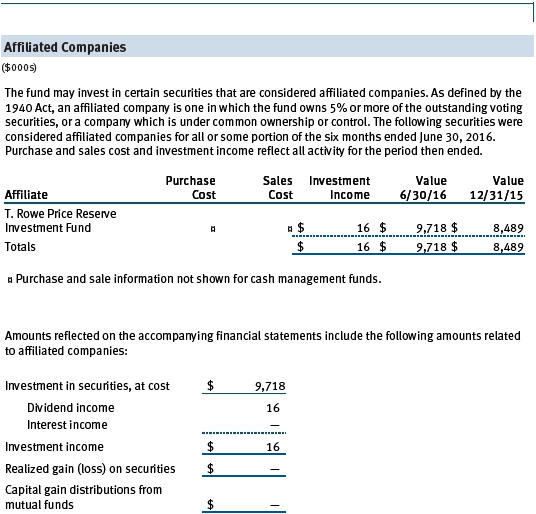
The fund may invest in the T. Rowe Price Reserve Investment Fund, the T. Rowe Price Government Reserve Investment Fund, or the T. Rowe Price Short-Term Reserve Fund (collectively, the Price Reserve Investment Funds), open-end management investment companies managed by Price Associates and considered affiliates of the fund. The Price Reserve Investment Funds are offered as short-term investment options to mutual funds, trusts, and other accounts managed by Price Associates or its affiliates and are not available for direct purchase by members of the public. The Price Reserve Investment Funds pay no investment management fees.
As of June 30, 2016, T. Rowe Price Group, Inc., or its wholly owned subsidiaries owned 575,000 shares of the Investor Class, representing 6% of the Investor Class’s net assets.
The fund may participate in securities purchase and sale transactions with other funds or accounts advised by Price Associates (cross trades), in accordance with procedures adopted by the fund’s Board and Securities and Exchange Commission rules, which require, among other things, that such purchase and sale cross trades be effected at the independent current market price of the security. During the six months ended June 30, 2016, the fund had no purchases or sales cross trades with other funds or accounts advised by Price Associates.
| Information on Proxy Voting Policies, Procedures, and Records |
A description of the policies and procedures used by T. Rowe Price funds and portfolios to determine how to vote proxies relating to portfolio securities is available in each fund’s Statement of Additional Information. You may request this document by calling 1-800-225-5132 or by accessing the SEC’s website, sec.gov.
The description of our proxy voting policies and procedures is also available on our corporate website. To access it, please visit the following Web page
https://www3.troweprice.com/usis/corporate/en/utility/policies.html
and scroll down to the section near the bottom of the page that says, “Proxy Voting Policies.” Click on the Proxy Voting Policies link in the shaded box.
Each fund’s most recent annual proxy voting record is available on our website and through the SEC’s website. To access it through T. Rowe Price, visit the website location shown above, and scroll down to the section near the bottom of the page that says, “Proxy Voting Records.” Click on the Proxy Voting Records link in the shaded box.
| How to Obtain Quarterly Portfolio Holdings |
The fund files a complete schedule of portfolio holdings with the Securities and Exchange Commission for the first and third quarters of each fiscal year on Form N-Q. The fund’s Form N-Q is available electronically on the SEC’s website (sec.gov); hard copies may be reviewed and copied at the SEC’s Public Reference Room, 100 F St. N.E., Washington, DC 20549. For more information on the Public Reference Room, call 1-800-SEC-0330.
| Approval of Investment Management Agreement |
On March 11, 2016, the fund’s Board of Directors (Board), including a majority of the fund’s independent directors, approved the continuation of the investment management agreement (Advisory Contract) between the fund and its investment advisor, T. Rowe Price Associates, Inc. (Advisor). In connection with its deliberations, the Board requested, and the Advisor provided, such information as the Board (with advice from independent legal counsel) deemed reasonably necessary. The Board considered a variety of factors in connection with its review of the Advisory Contract, also taking into account information provided by the Advisor during the course of the year, as discussed below:
Services Provided by the Advisor
The Board considered the nature, quality, and extent of the services provided to the fund by the Advisor. These services included, but were not limited to, directing the fund’s investments in accordance with its investment program and the overall management of the fund’s portfolio, as well as a variety of related activities such as financial, investment operations, and administrative services; compliance; maintaining the fund’s records and registrations; and shareholder communications. The Board also reviewed the background and experience of the Advisor’s senior management team and investment personnel involved in the management of the fund, as well as the Advisor’s compliance record. The Board concluded that it was satisfied with the nature, quality, and extent of the services provided by the Advisor.
Investment Performance of the Fund
The Board reviewed the fund’s three-month, one-year, and year-by-year returns, as well as the fund’s average annualized total returns over the three-year, five-year, and since-inception periods, and compared these returns with a wide variety of comparable performance measures and market data, including those supplied by Lipper and Morningstar, which are independent providers of mutual fund data.
On the basis of this evaluation and the Board’s ongoing review of investment results, and factoring in the relative market conditions during certain of the performance periods, the Board concluded that the fund’s performance was satisfactory.
Costs, Benefits, Profits, and Economies of Scale
The Board reviewed detailed information regarding the revenues received by the Advisor under the Advisory Contract and other benefits that the Advisor (and its affiliates) may have realized from its relationship with the fund, including any research received under “soft dollar” agreements and commission-sharing arrangements with broker-dealers. The Board considered that the Advisor may receive some benefit from soft-dollar arrangements pursuant to which research is received from broker-dealers that execute the applicable fund’s portfolio transactions. The Board received information on the estimated costs incurred and profits realized by the Advisor from managing T. Rowe Price mutual funds. The Board also reviewed estimates of the profits realized from managing the fund in particular, and the Board concluded that the Advisor’s profits were reasonable in light of the services provided to the fund.
The Board also considered whether the fund benefits under the fee levels set forth in the Advisory Contract from any economies of scale realized by the Advisor. Under the Advisory Contract, the fund pays a fee to the Advisor for investment management services composed of two components—a group fee rate based on the combined average net assets of most of the T. Rowe Price mutual funds (including the fund) that declines at certain asset levels and an individual fund fee rate based on the fund’s average daily net assets—and the fund pays its own expenses of operations (subject to expense limitations on total expense ratio with respect to the Investor Class and Advisor Class). The Board concluded that the advisory fee structure for the fund continued to provide for a reasonable sharing of benefits from any economies of scale with the fund’s investors.
Fees
The Board was provided with information regarding industry trends in management fees and expenses, and the Board reviewed the fund’s management fee rate, operating expenses, and total expense ratio (for the Investor Class and Advisor Class) in comparison with fees and expenses of other comparable funds based on information and data supplied by Lipper. After including fee waivers and expenses paid by the Advisor, as well as reimbursements to the Advisor of previously waived amounts for the Investor Class, pursuant to the contractual expense limitations, the information provided to the Board indicated that the fund’s management fee rate and total expense ratio for both classes were at or below the median for comparable funds.
The Board also reviewed the fee schedules for institutional accounts (including subadvised mutual funds) and private accounts with similar mandates that are advised or subadvised by the Advisor and its affiliates. Management provided the Board with information about the Advisor’s responsibilities and services provided to subadvisory and other institutional account clients, including information about how the requirements and economics of the institutional business differ from those of the Advisor’s proprietary mutual fund business. The Board considered information showing that the Advisor’s proprietary mutual fund business is generally more complex from a business and compliance perspective than its institutional account business and considered various other relevant factors, including the broader scope of operations and oversight, more extensive shareholder communication infrastructure, greater asset flows, heightened business risks, and differences in applicable laws and regulations associated with the Advisor’s proprietary mutual fund business. In assessing the reasonableness of the fund’s management fee rate, the Board considered the differences in the nature of the services required for the Advisor to manage its proprietary mutual fund business versus managing a discrete pool of assets as a subadvisor to another institution’s mutual fund or for another institutional account and the degree to which the Advisor performs significant additional services and assumes greater risk in managing the fund and other T. Rowe Price mutual funds than it does for institutional account clients.
On the basis of the information provided and the factors considered, the Board concluded that the fees paid by the fund under the Advisory Contract are reasonable.
Approval of the Advisory Contract
As noted, the Board approved the continuation of the Advisory Contract. No single factor was considered in isolation or to be determinative to the decision. Rather, the Board concluded, in light of a weighting and balancing of all factors considered, that it was in the best interests of the fund and its shareholders for the Board to approve the continuation of the Advisory Contract (including the fees to be charged for services thereunder). The independent directors were advised throughout the process by independent legal counsel.
Item 2. Code of Ethics.
A code of ethics, as defined in Item 2 of Form N-CSR, applicable to its principal executive officer, principal financial officer, principal accounting officer or controller, or persons performing similar functions is filed as an exhibit to the registrant’s annual Form N-CSR. No substantive amendments were approved or waivers were granted to this code of ethics during the registrant’s most recent fiscal half-year.
Item 3. Audit Committee Financial Expert.
Disclosure required in registrant’s annual Form N-CSR.
Item 4. Principal Accountant Fees and Services.
Disclosure required in registrant’s annual Form N-CSR.
Item 5. Audit Committee of Listed Registrants.
Not applicable.
Item 6. Investments.
(a) Not applicable. The complete schedule of investments is included in Item 1 of this Form N-CSR.
(b) Not applicable.
Item 7. Disclosure of Proxy Voting Policies and Procedures for Closed-End Management Investment Companies.
Not applicable.
Item 8. Portfolio Managers of Closed-End Management Investment Companies.
Not applicable.
Item 9. Purchases of Equity Securities by Closed-End Management Investment Company and Affiliated Purchasers.
Not applicable.
Item 10. Submission of Matters to a Vote of Security Holders.
Not applicable.
Item 11. Controls and Procedures.
(a) The registrant’s principal executive officer and principal financial officer have evaluated the registrant’s disclosure controls and procedures within 90 days of this filing and have concluded that the registrant’s disclosure controls and procedures were effective, as of that date, in ensuring that information required to be disclosed by the registrant in this Form N-CSR was recorded, processed, summarized, and reported timely.
(b) The registrant’s principal executive officer and principal financial officer are aware of no change in the registrant’s internal control over financial reporting that occurred during the registrant’s second fiscal quarter covered by this report that has materially affected, or is reasonably likely to materially affect, the registrant’s internal control over financial reporting.
Item 12. Exhibits.
(a)(1) The registrant’s code of ethics pursuant to Item 2 of Form N-CSR is filed with the registrant’s annual Form N-CSR.
(2) Separate certifications by the registrant's principal executive officer and principal financial officer, pursuant to Section 302 of the Sarbanes-Oxley Act of 2002 and required by Rule 30a-2(a) under the Investment Company Act of 1940, are attached.
(3) Written solicitation to repurchase securities issued by closed-end companies: not applicable.
(b) A certification by the registrant's principal executive officer and principal financial officer, pursuant to Section 906 of the Sarbanes-Oxley Act of 2002 and required by Rule 30a-2(b) under the Investment Company Act of 1940, is attached.
SIGNATURES
Pursuant to the requirements of the Securities Exchange Act of 1934 and the Investment Company Act of 1940, the registrant has duly caused this report to be signed on its behalf by the undersigned, thereunto duly authorized.
T. Rowe Price Global Real Estate Fund, Inc.
| | By | /s/ Edward C. Bernard |
| | Edward C. Bernard |
| | Principal Executive Officer |
| |
| Date August 17, 2016 | | |
Pursuant to the requirements of the Securities Exchange Act of 1934 and the Investment Company Act of 1940, this report has been signed below by the following persons on behalf of the registrant and in the capacities and on the dates indicated.
| | By | /s/ Edward C. Bernard |
| | Edward C. Bernard |
| | Principal Executive Officer |
| |
| Date August 17, 2016 | | |
| |
| |
| By | /s/ Catherine D. Mathews |
| | Catherine D. Mathews |
| | Principal Financial Officer |
| |
| Date August 17, 2016 | | |