UNITED STATES
SECURITIES AND EXCHANGE COMMISSION
Washington, D.C. 20549
FORM N-CSR
CERTIFIED SHAREHOLDER REPORT OF REGISTERED
MANAGEMENT INVESTMENT COMPANIES
Investment Company Act File Number: 811-22218
| T. Rowe Price Global Real Estate Fund, Inc. |
|
| (Exact name of registrant as specified in charter) |
| |
| 100 East Pratt Street, Baltimore, MD 21202 |
|
| (Address of principal executive offices) |
| |
| David Oestreicher |
| 100 East Pratt Street, Baltimore, MD 21202 |
|
| (Name and address of agent for service) |
Registrant’s telephone number, including area code: (410) 345-2000
Date of fiscal year end: December 31
Date of reporting period: December 31, 2017
Item 1. Report to Shareholders
| Global Real Estate Fund | December 31, 2017 |
The views and opinions in this report were current as of December 31, 2017. They are not guarantees of performance or investment results and should not be taken as investment advice. Investment decisions reflect a variety of factors, and the managers reserve the right to change their views about individual stocks, sectors, and the markets at any time. As a result, the views expressed should not be relied upon as a forecast of the fund’s future investment intent. The report is certified under the Sarbanes-Oxley Act, which requires mutual funds and other public companies to affirm that, to the best of their knowledge, the information in their financial reports is fairly and accurately stated in all material respects.
REPORTS ON THE WEB
Sign up for our Email Program, and you can begin to receive updated fund reports and prospectuses online rather than through the mail. Log in to your account at troweprice.com for more information.
Manager’s Letter
Fellow Shareholders
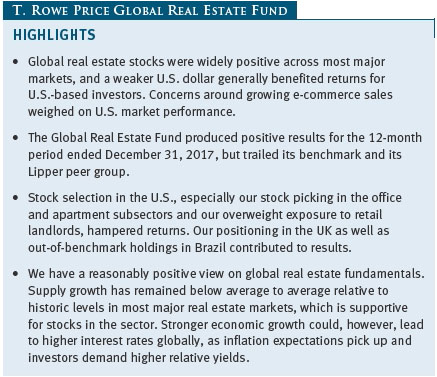
The themes we discussed in our previous letter generally continued throughout the second half of the year as global real estate securities produced solid results for 2017 but underperformed broader developed market equity indexes. Investors favored stocks in more growth-oriented sectors such as information technology and health care. Real estate stocks were widely positive across most major markets, and a weaker U.S. dollar generally benefited returns for U.S.-based investors. Our fund delivered positive absolute returns, but stock selection in some markets lagged the index.
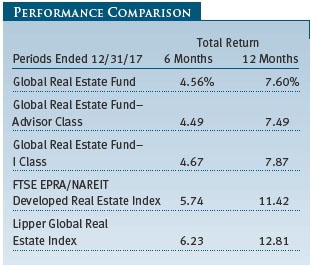
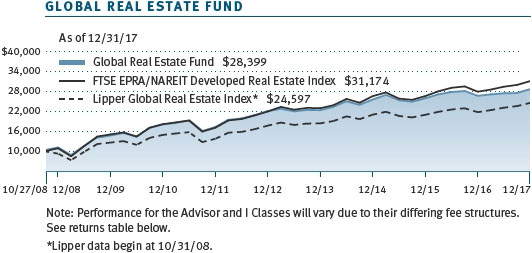
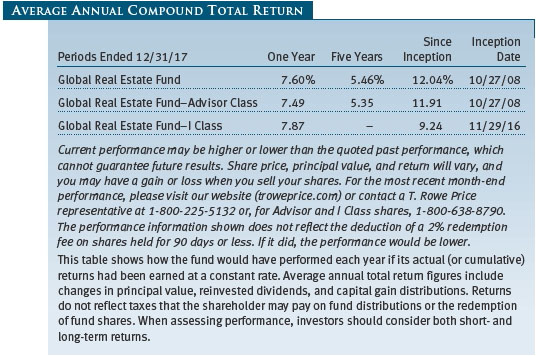
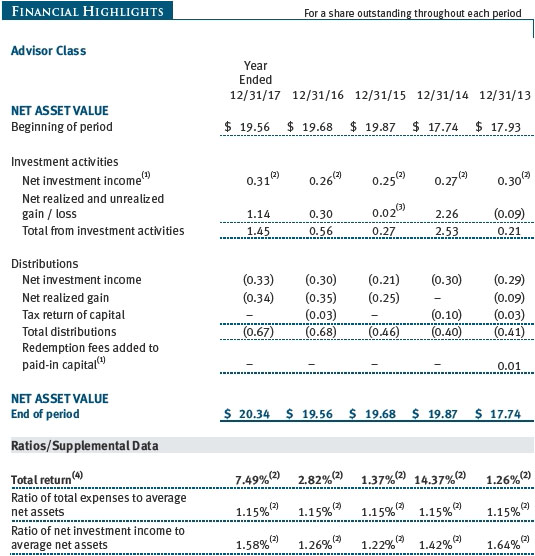
During the 12-month period ended December 31, 2017, the Global Real Estate Fund returned 7.60%, trailing its benchmark FTSE EPRA/NAREIT Developed Real Estate Index and its peer group as measured by the Lipper Global Real Estate Index. (The returns for the Advisor and I Class varied, reflecting their different fee structure.) The majority of the fund’s gains were recorded in the second half of the year.
DIVIDEND DISTRIBUTION
On December 15, 2017, your fund’s Board of Directors declared a fourth-quarter dividend of $0.10 per share to shareholders of record on that day. You should have received your check or statement reflecting this distribution. The dividend was distributed on December 19. The fourth-quarter distribution brings the total amount of dividends for the year to $0.45 per share; however, a portion of this amount has been reclassified as capital gains for tax purposes. Please remember to use your IRS Form 1099-DIV, not your year-end T. Rowe Price account statement, for tax-filing purposes, in order to accurately reflect the reclassification of a portion of the fund’s income distribution. (Dividends for Advisor and I Class shares were $0.10 for the fourth quarter and, respectively, $0.43 and $0.50 for the year.)
MARKET ENVIRONMENT
Most major U.S. stock indexes finished the year near record levels, benefiting from solid economic growth and favorable corporate earnings. Equities also found support in optimism about President Trump’s tax reform proposals, reduced regulation, and the potential for increased infrastructure spending. Developed non-U.S. equity markets outperformed U.S. shares, buoyed by synchronized global economic growth.
As a result of strengthening economic data, major central banks began to step away from accommodative policies. The Federal Reserve and the Bank of England both raised their short-term interest rates, and the European Central Bank announced it would reduce its bond-buying program in 2018. The 10-year U.S. Treasury yield was little changed for the year, but it fluctuated during the period, moving higher into year-end. The comparable-maturity German sovereign note’s yield also moved higher amid stronger-than-expected European growth.
The U.S. dollar lost ground against most other currencies in 2017, ending the greenback’s multiyear run of strength and generally boosting the returns that U.S.-based investors received from holding global securities. The euro gained nearly 14% against the U.S. dollar, and the British pound recovered some of its post-Brexit losses, gaining over 9%. The Japanese yen climbed about 3%, and the Australian dollar and Singapore dollar both rose about 8%.
In the real estate universe, U.S. real estate investment trusts (REITs), which make up more than half the global real estate stock market, underperformed the index. Retail real estate stocks had negative returns and weighed on U.S. market performance due to concerns around growing e-commerce sales and an increase in store closing announcements. Retail stocks recovered some of their losses, though, after a few mergers and acquisitions (M&A) were announced and activists took ownership positions. The health care sector also posted negative returns, as outsized supply growth and growing wage costs weighed on operators’ profitability. On the other hand, data center and industrial warehouses continued their outperformance, driven by strong demand associated with technology, e-commerce, and cloud computing. Hotel REITs also rallied into year-end, posting solid returns as investors anticipated an increase in corporate and leisure demand following the passage of tax reform.
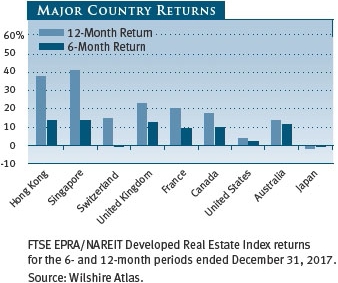
Results were generally positive elsewhere in the world, although Japanese REITs (J-REITs) performed poorly due to concerns about the possibility that there will be no additional policy support from the Bank of Japan. Japanese developers had mixed performance as investors were disappointed by the lack of focus on shareholder returns. Rents are growing in the Tokyo office market and remain relatively resilient in spite of a growing supply pipeline, while logistics and residential sector rents remain largely stable.
Hong Kong stocks strongly outperformed the index, rebounding from depressed valuations following increases in residential prices and stronger economic growth in China. Hong Kong residential prices continued to rise, driven by limited supply, solid demand, and low mortgage rates. After a difficult last few years, retail sales in Hong Kong are showing signs of stabilization, and Hong Kong office demand remains solid, resulting in moderately rising rents and low vacancy.
Real estate stocks delivered solid results in the UK and in the eurozone. In the UK, property values recovered from post-Brexit lows, as demand remains high from foreign buyers for London commercial real estate. Improving European economic data led to solid demand for all types of commercial real estate.
In Australia, real estate investors turned increasingly cautious toward the retail sector as consumer balance sheets remain stretched and threats from e-commerce are rising. Home prices remain at high levels despite efforts to tighten lending standards, and office rents in Sydney increased strongly due to low levels of supply and solid demand.
PORTFOLIO REVIEW
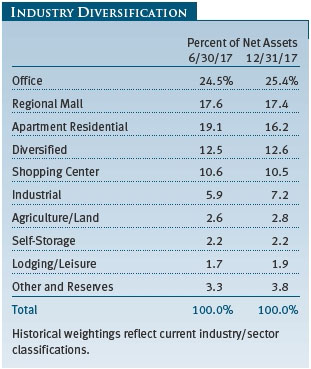
In the United States, our stock picking in the office and apartment subsectors and our overweight exposure to retail landlords hampered returns. Not owning data center REITs, which were strong performers on an absolute and relative basis, also weighed on results. Our lack of ownership of health care and triple net REITs benefited our results. We continue to believe that our positioning in higher-quality traditional real estate, where land values are a substantial component of the property value, will lead to better risk-adjusted long-term returns.

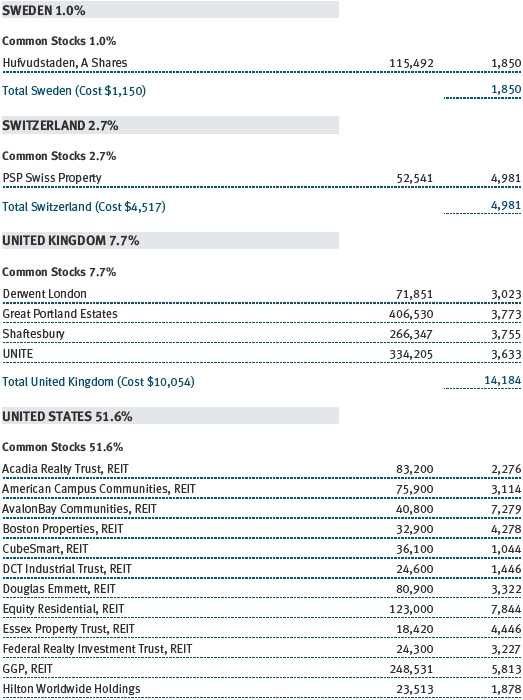
The portfolio’s notable U.S. holdings included New York City office landlords SL Green Realty and Vornado Realty Trust, which were down this year as rents for office space remain under pressure from new supply on Manhattan’s West Side as well as Downtown. We added to JBG SMITH Properties, a spinoff from Vornado Realty, on weakness as we appreciate the company’s leading position in the Washington, D.C., market. In the apartment subsector, our ownership of American Campus Communities dragged on results as the company announced another round of dispositions, acquisitions, and an equity offering. We trimmed our positions in AvalonBay Communities and Equity Residential. (Please refer to the fund’s portfolio of investments for a complete list of our holdings and the amount each represents in the portfolio.)
Mall and shopping center landlords underperformed the broader real estate market as challenging retail fundamentals and store closures weighed on the stocks. E-commerce is also taking a share of the retail pie at the expense of mature retailers. Despite owning highly productive regional malls and posting solid quarterly results, Macerich Company, Taubman Centers, and GGP were down during the period. In November, Brookfield made an offer to take GGP private, causing a rally in mall stocks late in the year. Shopping center landlords Acadia Realty Trust, Urban Edge Properties, and Federal Realty Investment Trust were also down, hurting our performance.
Hilton Worldwide Holdings, a manager and owner of hotels around the world, posted very robust returns this year, contributing to our results. The company benefited from strong earnings and cash flow growth combined with an improvement in demand expectations following tax reform. Industrial landlord Prologis was also a positive contributor, recording strong double-digit returns. U.S. industrial market vacancy is at its lowest level in over a decade, and average rents for logistics warehouses continue to rise. The company is well positioned to benefit from supply chain reconfiguration and the growth in e-commerce around the world. We trimmed our position on strength. We also initiated a position in DCT Industrial Trust. We are attracted to the company’s high-quality bulk warehouse portfolio across the U.S. and a solid management team.
Weyerhaeuser, a timber and forest products company, was also a notable outperformer. Increasing housing starts and additional duties on Canadian lumber imports drove an improvement in wood products pricing during the period.
In Hong Kong, our position in Sun Hung Kai Properties was up an impressive 36% but underperformed other Hong Kong developers as a nearly 15% increase in home prices helped fuel a rally in the subsector. We trimmed our position in the stock. Our largest holding in Hong Kong, Hongkong Land Holdings, underperformed as well, despite being up 14%, as office rent growth decelerated. We eliminated our position in Wharf Holdings following very strong performance and reallocated the proceeds into a new position in Hang Lung Properties, whose malls could benefit from improving retail sales growth in China.
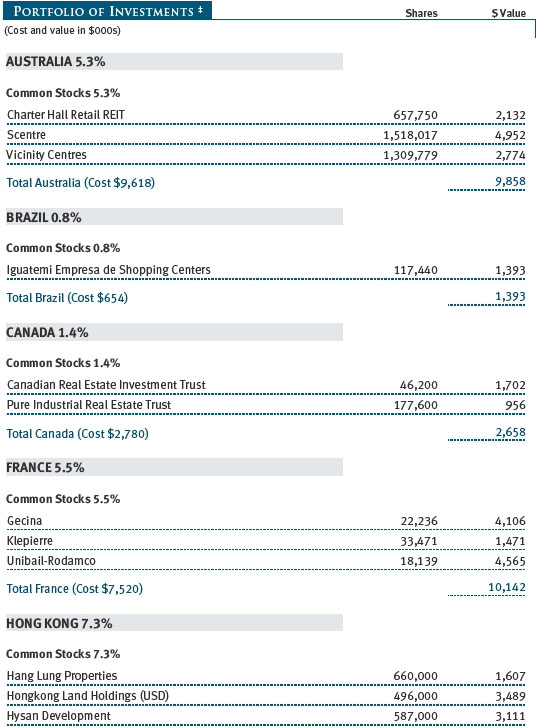
Amazon.com’s arrival in Australia weighed on our positions in Vicinity Centres and Scentre as many investors were scared away from brick-and-mortar retail landlords. We trimmed our position in Vicinity Centres following a change in management and used the proceeds to add to Scentre, whose high-productivity assets remain desirable places for retailers to do business. Concerns over Amazon’s potential entry into another new market, Singapore, also weighed on a position in CapitaLand Mall Trust, which posted positive absolute returns but underperformed the index.
On the positive side, the UK was the leading contributor to the fund’s relative returns as a result of stock selection and our overweight position. Following progress on Brexit negotiations, our positions in UNITE, Shaftesbury, Great Portland Estates, and Derwent London outperformed in the latter part of the year. We added to Great Portland Estates and Derwent London early in the period at attractive prices, and we trimmed Shaftesbury following takeover speculation. We continue to view London as an attractive city in which to live, work, and study.
The fund also benefited from the outperformance of holdings in Brazil and Canada. In Brazil, mall owners Iguatemi Empresa de Shopping Centers and Multiplan Empreendimentos Imobiliarios were positive out-of-index contributors again in 2017, returning about 40% for the year. Brazil’s central bank cut interest rates as inflation fell to a nearly 10-year low, and economic activity appears to be stabilizing. Canadian returns were aided when Brookfield Canada Office Properties, a longtime holding of the fund, was taken private by its parent company at a 25% premium to the predeal price. We reallocated the proceeds from this deal into new positions in Boardwalk Real Estate Investment Trust, an owner and manager of apartments primarily in Western Canada, and Pure Industrial Real Estate Trust, an owner and operator of industrial properties in major Canadian cities. We subsequently eliminated our position in Boardwalk after the company announced a disposition program.
In Continental Europe, results were mixed. Office landlords Gecina and Inmobiliaria Colonial posted strong positive results as the companies benefited from improving occupancy and rents in Paris and Madrid, respectively. This was offset by the fund’s zero allocation to Germany, though. Residential landlords in the country performed well as German bund yields remained very low and the government approved higher-than-expected increases on rent-controlled properties.
OUTLOOK
We have a reasonably positive view on real estate fundamentals globally in 2018. With the caveat that all real estate is local, we would characterize the supply growth picture as below average to average relative to history in most major real estate markets. Developers are building, but the construction financing environment has remained fairly reasonable, a positive for fundamentals. Falling unemployment and improving consumer confidence portend a healthy demand environment for real estate, thereby creating a favorable backdrop for rent and earnings growth for landlords. Tax reform in the U.S. is likely to be stimulative to the economy, in our view, further strengthening the demand picture.
Stronger economic growth could, however, lead to higher interest rates globally, as inflation expectations pick up and investors demand higher relative yields. Since real estate tends to be correlated with interest rates in the short run, further increases in yields could act as a headwind for real estate stocks. Indeed, some of the underperformance of real estate stocks relative to broader global equities over the past two years has been driven by increases in yield expectations.
In 2017, we saw an increase in appetite for M&A, which we believe is likely to continue. Demand for developed market real estate from sovereign wealth funds, pension funds, and insurance companies has continued to be strong, and we have seen several private equity funds raise significant amounts of capital that we expect to be deployed over the coming years.
This current backdrop reinforces our confidence in our approach to global real estate investing. By concentrating our positions in companies that own high-quality real estate in land-constrained locations, we believe we are well positioned for this environment. First, rising interest rates are likely to disproportionately affect companies with inferior real estate locations without pricing power, as they will have trouble growing their earnings and cash flows commensurately. Rising rates should conversely highlight companies that own properties where the demand for space exceeds the supply of new properties and thus rents, cash flows, and dividends can be grown even in a higher rate environment. Second, should the appetite for M&A pick up, we believe such investments will focus on higher-quality locations, which should benefit our portfolio.
We continue to favor companies where we believe rent growth is sustainable over cycles and, therefore, can outperform other types of real estate. We also prefer investing in companies that have low leverage and significant financial flexibility. We remain confident that this fundamentally driven, bottom-up approach to stock selection will produce attractive risk-adjusted returns for our shareholders over the long run.
Thank you for your continued support and confidence.
Respectfully submitted,

Nina Jones
President of the fund and chair of its Investment Advisory Committee
January 24, 2018
The committee chairman has day-to-day responsibility for managing the portfolio and works with committee members in developing and executing the fund’s investment program.
RISKS OF INVESTING
The fund’s share price can fall because of weakness in the stock market, a particular industry, or specific holdings. Stock markets can decline for many reasons, including adverse political or economic developments, changes in investor psychology, or heavy institutional selling. The prospects for an industry or company may deteriorate because of a variety of factors, including disappointing earnings or changes in the competitive environment. In addition, the investment manager’s assessment of companies held in a fund may prove incorrect, resulting in losses or poor performance even in rising markets.
Funds that invest only in specific industries will experience greater volatility than funds investing in a broad range of industries. Due to its concentration in the real estate industry, the fund’s share price could be more volatile than that of a fund with a broader investment mandate. Trends perceived to be unfavorable to real estate, such as changes in the tax laws or rising interest rates, could cause a decline in share prices.
Funds that invest overseas generally carry more risk than funds that invest strictly in U.S. assets. Funds investing in a single country or in a limited geographic region tend to be riskier than more diversified funds. Risks can result from varying stages of economic and political development, differing regulatory environments, trading days and accounting standards, and higher transaction costs of non-U.S. markets. Non-U.S. investments are also subject to currency risk, or a decline in the value of a foreign currency versus the U.S. dollar, which reduces the dollar value of securities denominated in that currency.
GLOSSARY
FTSE EPRA/NAREIT Developed Real Estate Index: A total return index composed of the most actively traded REITs and REIT-type structures, designed to be a measure of global real estate equity performance.
Lipper indexes: Fund benchmarks that consist of a small number of the largest mutual funds in a particular category as tracked by Lipper Inc.
Real estate investment trusts (REITs): Publicly traded companies that own, develop, and operate apartment complexes, hotels, office buildings, and other commercial properties.
Triple net: A type of lease that requires tenants to pay for taxes, insurance, and maintenance in addition to rent.


Performance and Expenses
This chart shows the value of a hypothetical $10,000 investment in the fund over the past 10 fiscal year periods or since inception (for funds lacking 10-year records). The result is compared with benchmarks, which may include a broad-based market index and a peer group average or index. Market indexes do not include expenses, which are deducted from fund returns as well as mutual fund averages and indexes.

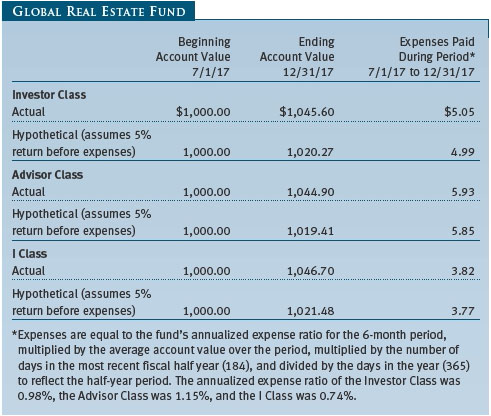
As a mutual fund shareholder, you may incur two types of costs: (1) transaction costs, such as redemption fees or sales loads, and (2) ongoing costs, including management fees, distribution and service (12b-1) fees, and other fund expenses. The following example is intended to help you understand your ongoing costs (in dollars) of investing in the fund and to compare these costs with the ongoing costs of investing in other mutual funds. The example is based on an investment of $1,000 invested at the beginning of the most recent six-month period and held for the entire period.
Please note that the fund has three share classes: The original share class (Investor Class) charges no distribution and service (12b-1) fee, the Advisor Class shares are offered only through unaffiliated brokers and other financial intermediaries and charge a 0.25% 12b-1 fee, and I Class shares are available to institutionally oriented clients and impose no 12b-1 or administrative fee payment. Each share class is presented separately in the table.
Actual Expenses
The first line of the following table (Actual) provides information about actual account values and expenses based on the fund’s actual returns. You may use the information on this line, together with your account balance, to estimate the expenses that you paid over the period. Simply divide your account value by $1,000 (for example, an $8,600 account value divided by $1,000 = 8.6), then multiply the result by the number on the first line under the heading “Expenses Paid During Period” to estimate the expenses you paid on your account during this period.
Hypothetical Example for Comparison Purposes
The information on the second line of the table (Hypothetical) is based on hypothetical account values and expenses derived from the fund’s actual expense ratio and an assumed 5% per year rate of return before expenses (not the fund’s actual return). You may compare the ongoing costs of investing in the fund with other funds by contrasting this 5% hypothetical example and the 5% hypothetical examples that appear in the shareholder reports of the other funds. The hypothetical account values and expenses may not be used to estimate the actual ending account balance or expenses you paid for the period.
Note: T. Rowe Price charges an annual account service fee of $20, generally for accounts with less than $10,000. The fee is waived for any investor whose T. Rowe Price mutual fund accounts total $50,000 or more; accounts electing to receive electronic delivery of account statements, transaction confirmations, prospectuses, and shareholder reports; or accounts of an investor who is a T. Rowe Price Personal Services or Enhanced Personal Services client (enrollment in these programs generally requires T. Rowe Price assets of at least $250,000). This fee is not included in the accompanying table. If you are subject to the fee, keep it in mind when you are estimating the ongoing expenses of investing in the fund and when comparing the expenses of this fund with other funds.
You should also be aware that the expenses shown in the table highlight only your ongoing costs and do not reflect any transaction costs, such as redemption fees or sales loads. Therefore, the second line of the table is useful in comparing ongoing costs only and will not help you determine the relative total costs of owning different funds. To the extent a fund charges transaction costs, however, the total cost of owning that fund is higher.

The accompanying notes are an integral part of these financial statements.
The accompanying notes are an integral part of these financial statements.

The accompanying notes are an integral part of these financial statements.


The accompanying notes are an integral part of these financial statements.

The accompanying notes are an integral part of these financial statements.


The accompanying notes are an integral part of these financial statements.

The accompanying notes are an integral part of these financial statements.
| Notes to Financial Statements |
T. Rowe Price Global Real Estate Fund, Inc. (the fund), is registered under the Investment Company Act of 1940 (the 1940 Act) as a nondiversified, open-end management investment company. The fund seeks to provide long-term growth through a combination of capital appreciation and current income. The fund has three classes of shares: the Global Real Estate Fund (Investor Class), the Global Real Estate Fund–Advisor Class (Advisor Class), and the Global Real Estate Fund–I Class (I Class). Advisor Class shares are sold only through unaffiliated brokers and other unaffiliated financial intermediaries. I Class shares generally are available only to investors meeting a $1,000,000 minimum investment or certain other criteria. The Advisor Class operates under a Board-approved Rule 12b-1 plan pursuant to which the class compensates financial intermediaries for distribution, shareholder servicing, and/or certain administrative services; the Investor and I Classes do not pay Rule 12b-1 fees. Each class has exclusive voting rights on matters related solely to that class; separate voting rights on matters that relate to all classes; and, in all other respects, the same rights and obligations as the other classes.
NOTE 1 - SIGNIFICANT ACCOUNTING POLICIES
Basis of Preparation The fund is an investment company and follows accounting and reporting guidance in the Financial Accounting Standards Board (FASB) Accounting Standards Codification Topic 946 (ASC 946). The accompanying financial statements were prepared in accordance with accounting principles generally accepted in the United States of America (GAAP), including, but not limited to, ASC 946. GAAP requires the use of estimates made by management. Management believes that estimates and valuations are appropriate; however, actual results may differ from those estimates, and the valuations reflected in the accompanying financial statements may differ from the value ultimately realized upon sale or maturity.
Investment Transactions, Investment Income, and Distributions Investment transactions are accounted for on the trade date basis. Income and expenses are recorded on the accrual basis. Realized gains and losses are reported on the identified cost basis. Dividends received from mutual fund investments are reflected as dividend income; capital gain distributions are reflected as realized gain/loss. Dividend income and capital gain distributions are recorded on the ex-dividend date. Income tax-related interest and penalties, if incurred, are recorded as income tax expense. Distributions from REITs are initially recorded as dividend income and, to the extent such represent a return of capital or capital gain for tax purposes, are reclassified when such information becomes available. Income distributions are declared and paid by each class quarterly. Distributions to shareholders are recorded on the ex-dividend date. A capital gain distribution may also be declared and paid by the fund annually.
Currency Translation Assets, including investments, and liabilities denominated in foreign currencies are translated into U.S. dollar values each day at the prevailing exchange rate, using the mean of the bid and asked prices of such currencies against U.S. dollars as quoted by a major bank. Purchases and sales of securities, income, and expenses are translated into U.S. dollars at the prevailing exchange rate on the respective date of such transaction. The portion of the results of operations attributable to changes in foreign exchange rates on investments is not bifurcated from the portion attributable to changes in market prices. The effect of changes in foreign currency exchange rates on realized and unrealized security gains and losses is reflected as a component of security gains and losses.
Class Accounting Shareholder servicing, prospectus, and shareholder report expenses incurred by each class are charged directly to the class to which they relate. Expenses common to all classes, investment income, and realized and unrealized gains and losses are allocated to the classes based upon the relative daily net assets of each class. To the extent any expenses are waived or reimbursed in accordance with an expense limitation (see Note 5), the waiver or reimbursement is charged to the applicable class or allocated across the classes in the same manner as the related expense. The Advisor Class pays Rule 12b-1 fees, in an amount not exceeding 0.25% of the class’s average daily net assets.
Redemption Fees A 2% fee is assessed on redemptions of fund shares held for 90 days or less to deter short-term trading and to protect the interests of long-term shareholders. Redemption fees are withheld from proceeds that shareholders receive from the sale or exchange of fund shares. The fees are paid to the fund and are recorded as an increase to paid-in capital. The fees may cause the redemption price per share to differ from the net asset value per share.
New Accounting Guidance In March 2017, the FASB issued amended guidance to shorten the amortization period for certain callable debt securities, held at a premium. The guidance is effective for fiscal years and interim periods beginning after December 15, 2018. Adoption will have no effect on the fund’s net assets or results of operations.
On August 1, 2017, the fund implemented amendments to Regulation S-X, issued by the Securities and Exchange Commission, which require standardized, enhanced disclosures, particularly related to derivatives, in investment company financial statements. Adoption had no effect on the fund’s net assets or results of operations.
Indemnification In the normal course of business, the fund may provide indemnification in connection with its officers and directors, service providers, and/or private company investments. The fund’s maximum exposure under these arrangements is unknown; however, the risk of material loss is currently considered to be remote.
NOTE 2 - VALUATION
The fund’s financial instruments are valued and each class’s net asset value (NAV) per share is computed at the close of the New York Stock Exchange (NYSE), normally 4 p.m. ET, each day the NYSE is open for business. However, the NAV per share may be calculated at a time other than the normal close of the NYSE if trading on the NYSE is restricted, if the NYSE closes earlier, or as may be permitted by the SEC.
Fair Value The fund’s financial instruments are reported at fair value, which GAAP defines as the price that would be received to sell an asset or paid to transfer a liability in an orderly transaction between market participants at the measurement date. The T. Rowe Price Valuation Committee (the Valuation Committee) is an internal committee that has been delegated certain responsibilities by the fund’s Board of Directors (the Board) to ensure that financial instruments are appropriately priced at fair value in accordance with GAAP and the 1940 Act. Subject to oversight by the Board, the Valuation Committee develops and oversees pricing-related policies and procedures and approves all fair value determinations. Specifically, the Valuation Committee establishes procedures to value securities; determines pricing techniques, sources, and persons eligible to effect fair value pricing actions; oversees the selection, services, and performance of pricing vendors; oversees valuation-related business continuity practices; and provides guidance on internal controls and valuation-related matters. The Valuation Committee reports to the Board and has representation from legal, portfolio management and trading, operations, risk management, and the fund’s treasurer.
Various valuation techniques and inputs are used to determine the fair value of financial instruments. GAAP establishes the following fair value hierarchy that categorizes the inputs used to measure fair value:
Level 1 – quoted prices (unadjusted) in active markets for identical financial instruments that the fund can access at the reporting date
Level 2 – inputs other than Level 1 quoted prices that are observable, either directly or indirectly (including, but not limited to, quoted prices for similar financial instruments in active markets, quoted prices for identical or similar financial instruments in inactive markets, interest rates and yield curves, implied volatilities, and credit spreads)
Level 3 – unobservable inputs
Observable inputs are developed using market data, such as publicly available information about actual events or transactions, and reflect the assumptions that market participants would use to price the financial instrument. Unobservable inputs are those for which market data are not available and are developed using the best information available about the assumptions that market participants would use to price the financial instrument. GAAP requires valuation techniques to maximize the use of relevant observable inputs and minimize the use of unobservable inputs. When multiple inputs are used to derive fair value, the financial instrument is assigned to the level within the fair value hierarchy based on the lowest-level input that is significant to the fair value of the financial instrument. Input levels are not necessarily an indication of the risk or liquidity associated with financial instruments at that level but rather the degree of judgment used in determining those values.
Valuation Techniques Equity securities listed or regularly traded on a securities exchange or in the over-the-counter (OTC) market are valued at the last quoted sale price or, for certain markets, the official closing price at the time the valuations are made. OTC Bulletin Board securities are valued at the mean of the closing bid and asked prices. A security that is listed or traded on more than one exchange is valued at the quotation on the exchange determined to be the primary market for such security. Listed securities not traded on a particular day are valued at the mean of the closing bid and asked prices for domestic securities and the last quoted sale or closing price for international securities.
For valuation purposes, the last quoted prices of non-U.S. equity securities may be adjusted to reflect the fair value of such securities at the close of the NYSE. If the fund determines that developments between the close of a foreign market and the close of the NYSE will affect the value of some or all of its portfolio securities, the fund will adjust the previous quoted prices to reflect what it believes to be the fair value of the securities as of the close of the NYSE. In deciding whether it is necessary to adjust quoted prices to reflect fair value, the fund reviews a variety of factors, including developments in foreign markets, the performance of U.S. securities markets, and the performance of instruments trading in U.S. markets that represent foreign securities and baskets of foreign securities. The fund may also fair value securities in other situations, such as when a particular foreign market is closed but the fund is open. The fund uses outside pricing services to provide it with quoted prices and information to evaluate or adjust those prices. The fund cannot predict how often it will use quoted prices and how often it will determine it necessary to adjust those prices to reflect fair value. As a means of evaluating its security valuation process, the fund routinely compares quoted prices, the next day’s opening prices in the same markets, and adjusted prices.
Actively traded equity securities listed on a domestic exchange generally are categorized in Level 1 of the fair value hierarchy. Non-U.S. equity securities generally are categorized in Level 2 of the fair value hierarchy despite the availability of quoted prices because, as described above, the fund evaluates and determines whether those quoted prices reflect fair value at the close of the NYSE or require adjustment. OTC Bulletin Board securities, certain preferred securities, and equity securities traded in inactive markets generally are categorized in Level 2 of the fair value hierarchy.
Investments in mutual funds are valued at the mutual fund’s closing NAV per share on the day of valuation and are categorized in Level 1 of the fair value hierarchy. Assets and liabilities other than financial instruments, including short-term receivables and payables, are carried at cost, or estimated realizable value, if less, which approximates fair value.
Thinly traded financial instruments and those for which the above valuation procedures are inappropriate or are deemed not to reflect fair value are stated at fair value as determined in good faith by the Valuation Committee. The objective of any fair value pricing determination is to arrive at a price that could reasonably be expected from a current sale. Financial instruments fair valued by the Valuation Committee are primarily private placements, restricted securities, warrants, rights, and other securities that are not publicly traded.
Subject to oversight by the Board, the Valuation Committee regularly makes good faith judgments to establish and adjust the fair valuations of certain securities as events occur and circumstances warrant. For instance, in determining the fair value of an equity investment with limited market activity, such as a private placement or a thinly traded public company stock, the Valuation Committee considers a variety of factors, which may include, but are not limited to, the issuer’s business prospects, its financial standing and performance, recent investment transactions in the issuer, new rounds of financing, negotiated transactions of significant size between other investors in the company, relevant market valuations of peer companies, strategic events affecting the company, market liquidity for the issuer, and general economic conditions and events. In consultation with the investment and pricing teams, the Valuation Committee will determine an appropriate valuation technique based on available information, which may include both observable and unobservable inputs. The Valuation Committee typically will afford greatest weight to actual prices in arm’s length transactions, to the extent they represent orderly transactions between market participants, transaction information can be reliably obtained, and prices are deemed representative of fair value. However, the Valuation Committee may also consider other valuation methods such as market-based valuation multiples; a discount or premium from market value of a similar, freely traded security of the same issuer; or some combination. Fair value determinations are reviewed on a regular basis and updated as information becomes available, including actual purchase and sale transactions of the issue. Because any fair value determination involves a significant amount of judgment, there is a degree of subjectivity inherent in such pricing decisions, and fair value prices determined by the Valuation Committee could differ from those of other market participants. Depending on the relative significance of unobservable inputs, including the valuation technique(s) used, fair valued securities may be categorized in Level 2 or 3 of the fair value hierarchy.
Valuation Inputs The following table summarizes the fund’s financial instruments, based on the inputs used to determine their fair values on December 31, 2017:

There were no material transfers between Levels 1 and 2 during the year ended December 31, 2017.
NOTE 3 - OTHER INVESTMENT TRANSACTIONS
Consistent with its investment objective, the fund engages in the following practices to manage exposure to certain risks and/or to enhance performance. The investment objective, policies, program, and risk factors of the fund are described more fully in the fund’s prospectus and Statement of Additional Information.
When-Issued Securities The fund may enter into when-issued purchase or sale commitments, pursuant to which it agrees to purchase or sell, respectively, an authorized but not yet issued security for a fixed unit price, with payment and delivery not due until issuance of the security on a scheduled future date. When-issued securities may be new securities or securities issued through a corporate action, such as a reorganization or restructuring. Until settlement, the fund maintains liquid assets sufficient to settle its commitment to purchase a when-issued security or, in the case of a sale commitment, the fund maintains an entitlement to the security to be sold. Amounts realized on when-issued transactions are included in realized gain/loss on securities in the accompanying financial statements.
Other Purchases and sales of portfolio securities other than short-term securities aggregated $26,180,000 and $87,506,000, respectively, for the year ended December 31, 2017.
NOTE 4 - FEDERAL INCOME TAXES
No provision for federal income taxes is required since the fund intends to continue to qualify as a regulated investment company under Subchapter M of the Internal Revenue Code and distribute to shareholders all of its taxable income and gains. Distributions determined in accordance with federal income tax regulations may differ in amount or character from net investment income and realized gains for financial reporting purposes. Financial reporting records are adjusted for permanent book/tax differences to reflect tax character but are not adjusted for temporary differences.
The fund files U.S. federal, state, and local tax returns as required. The fund’s tax returns are subject to examination by the relevant tax authorities until expiration of the applicable statute of limitations, which is generally three years after the filing of the tax return but which can be extended to six years in certain circumstances. Tax returns for open years have incorporated no uncertain tax positions that require a provision for income taxes.
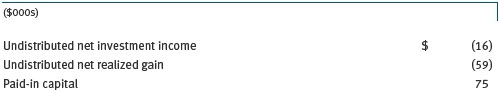
Reclassifications to paid-in capital relate primarily to a tax practice that treats a portion of the proceeds from each redemption of capital shares as a distribution of taxable net investment income or realized capital gain. Reclassifications between income and gain relate primarily to the character of income on passive foreign investment companies. For the year ended December 31, 2017, the following reclassifications were recorded to reflect tax character (there was no impact on results of operations or net assets):
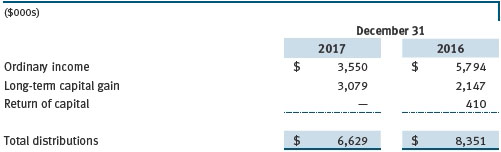
Distributions during the years ended December 31, 2017 and December 31, 2016, were characterized for tax purposes as follows:
At December 31, 2017, the tax-basis cost of investments and components of net assets were as follows:
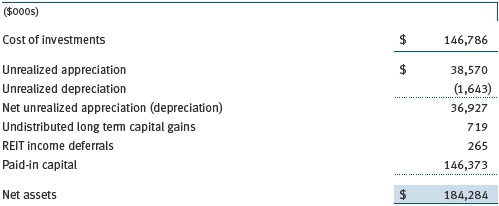
The difference between book-basis and tax-basis net unrealized appreciation (depreciation) is attributable to the deferral of losses from wash sales and the realization of gains/losses on passive foreign investment companies for tax purposes. During the year ended December 31, 2017, the fund utilized $54,000 of capital loss carryforwards. Certain dividends declared by real estate investment trusts (REITs) in December and paid the following January are recognized for tax purposes in the subsequent year (REIT income deferrals) but, for financial reporting purposes, are included in the fund’s dividend income on ex-date.
NOTE 5 - RELATED PARTY TRANSACTIONS
The fund is managed by T. Rowe Price Associates, Inc. (Price Associates), a wholly owned subsidiary of T. Rowe Price Group, Inc. (Price Group). The investment management agreement between the fund and Price Associates provides for an annual investment management fee, which is computed daily and paid monthly. The fee consists of an individual fund fee, equal to 0.40% of the fund’s average daily net assets, and a group fee. The group fee rate is calculated based on the combined net assets of certain mutual funds sponsored by Price Associates (the group) applied to a graduated fee schedule, with rates ranging from 0.48% for the first $1 billion of assets to 0.265% for assets in excess of $650 billion. The fund’s group fee is determined by applying the group fee rate to the fund’s average daily net assets. At December 31, 2017, the effective annual group fee rate was 0.29%.
The Investor Class and Advisor Class are each subject to a contractual expense limitation through the limitation dates indicated in the table below. During the limitation period, Price Associates is required to waive its management fee or pay any expenses (excluding interest, expenses related to borrowings, taxes, brokerage, and other non-recurring expenses permitted by the investment management agreement) that would otherwise cause the class’s ratio of annualized total expenses to average net assets (expense ratio) to exceed its expense limitation. Each class is required to repay Price Associates for expenses previously waived/paid to the extent the class’s net assets grow or expenses decline sufficiently to allow repayment without causing the class’s expense ratio (after the repayment is taken into account) to exceed both: (1) the expense limitation in place at the time such amounts were waived; and (2) the class’s current expense limitation. However, no repayment will be made more than three years after the date of a payment or waiver.
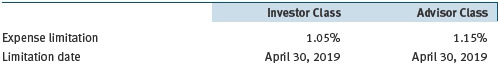
The I Class is also subject to an operating expense limitation (I Class limit) pursuant to which Price Associates is contractually required to pay all operating expenses of the I Class, excluding management fees, interest, expenses related to borrowings, taxes, brokerage, and other non-recurring expenses permitted by the investment management agreement, to the extent such operating expenses, on an annualized basis, exceed 0.05% of average net assets. This agreement will continue until April 30, 2019, and may be renewed, revised, or revoked only with approval of the fund’s Board. The I Class is required to repay Price Associates for expenses previously paid to the extent the class’s net assets grow or expenses decline sufficiently to allow repayment without causing the class’s operating expenses (after the repayment is taken into account) to exceed both: (1) the expense limitation in place at the time such amounts were paid; and (2) the class’s current expense limitation. However, no repayment will be made more than three years after the date of a payment or waiver.
Pursuant to these agreements, $142,000 of expenses were waived/paid by Price Associates during the year ended December 31, 2017. Including this amount, expenses previously waived/paid by Price Associates in the amount of $312,000 remain subject to repayment by the fund at December 31, 2017.
In addition, the fund has entered into service agreements with Price Associates and two wholly owned subsidiaries of Price Associates (collectively, Price). Price Associates provides certain accounting and administrative services to the fund. T. Rowe Price Services, Inc. provides shareholder and administrative services in its capacity as the fund’s transfer and dividend-disbursing agent. T. Rowe Price Retirement Plan Services, Inc. provides subaccounting and recordkeeping services for certain retirement accounts invested in the Investor Class. For the year ended December 31, 2017, expenses incurred pursuant to these service agreements were $86,000 for Price Associates; $197,000 for T. Rowe Price Services, Inc.; and $3,000 for T. Rowe Price Retirement Plan Services, Inc. The total amount payable at period-end pursuant to these service agreements is reflected as Due to Affiliates in the accompanying financial statements.
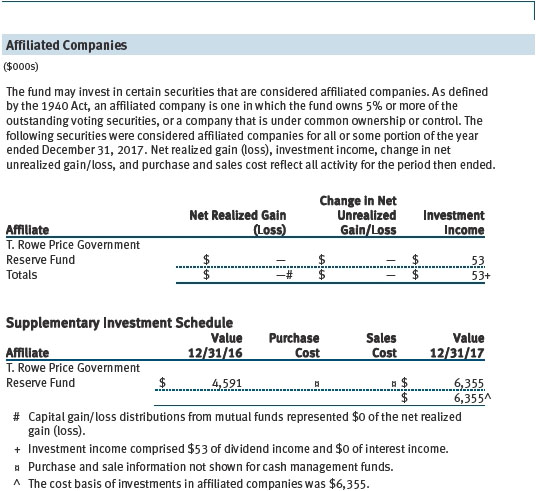
The fund may invest its cash reserves in certain open-end management investment companies managed by Price Associates and considered affiliates of the fund: the T. Rowe Price Government Reserve Fund or the T. Rowe Price Treasury Reserve Fund, organized as money market funds, or the T. Rowe Price Short-Term Fund, a short-term bond fund (collectively, the Price Reserve Funds). The Price Reserve Funds are offered as short-term investment options to mutual funds, trusts, and other accounts managed by Price Associates or its affiliates and are not available for direct purchase by members of the public. Cash collateral from securities lending is invested in the T. Rowe Price Short-Term Fund. The Price Reserve Funds pay no investment management fees.
As of December 31, 2017, T. Rowe Price Group, Inc., or its wholly owned subsidiaries owned 12,716 shares of the I Class, representing 2% of the I Class’s net assets.
The fund may participate in securities purchase and sale transactions with other funds or accounts advised by Price Associates (cross trades), in accordance with procedures adopted by the fund’s Board and Securities and Exchange Commission rules, which require, among other things, that such purchase and sale cross trades be effected at the independent current market price of the security. During the year ended December 31, 2017, the aggregate value of purchases and sales cross trades with other funds or accounts advised by Price Associates was less than 1% of the fund’s net assets as of December 31, 2017.
| Report of Independent Registered Public Accounting Firm |
To the Board of Directors and Shareholders of
T. Rowe Price Global Real Estate Fund, Inc.
Opinion on the Financial Statements
We have audited the accompanying statement of assets and liabilities, including the portfolio of investments, of T. Rowe Price Global Real Estate Fund, Inc. (the “Fund”) as of December 31, 2017, the related statement of operations for the year ended December 31, 2017, the statement of changes in net assets for each of the two years in the period ended December 31, 2017, including the related notes, and the financial highlights for each of the periods indicated therein (collectively referred to as the “financial statements”). In our opinion, the financial statements present fairly, in all material respects, the financial position of the Fund as of December 31, 2017, the results of its operations for the year then ended, the changes in its net assets for each of the two years in the period ended December 31, 2017 and the financial highlights for each of the periods indicated therein, in conformity with accounting principles generally accepted in the United States of America.
Basis for Opinion
These financial statements are the responsibility of the Fund’s management. Our responsibility is to express an opinion on the Fund’s financial statements based on our audits. We are a public accounting firm registered with the Public Company Accounting Oversight Board (United States) (“PCAOB”) and are required to be independent with respect to the Fund in accordance with the U.S. federal securities laws and the applicable rules and regulations of the Securities and Exchange Commission and the PCAOB.
We conducted our audits of these financial statements in accordance with the standards of the PCAOB. Those standards require that we plan and perform the audit to obtain reasonable assurance about whether the financial statements are free of material misstatement, whether due to error or fraud.
Our audits included performing procedures to assess the risks of material misstatement of the financial statements, whether due to error or fraud, and performing procedures that respond to those risks. Such procedures included examining, on a test basis, evidence regarding the amounts and disclosures in the financial statements. Our audits also included evaluating the accounting principles used and significant estimates made by management, as well as evaluating the overall presentation of the financial statements. Our procedures included confirmation of securities owned as of December 31, 2017 by correspondence with the custodian and transfer agent. We believe that our audits provide a reasonable basis for our opinion.
PricewaterhouseCoopers LLP
Baltimore, Maryland
February 20, 2018
We have served as the auditor of one or more investment companies in the T. Rowe Price group of investment companies since 1973.
| Tax Information (Unaudited) for the Tax Year Ended 12/31/17 |
We are providing this information as required by the Internal Revenue Code. The amounts shown may differ from those elsewhere in this report because of differences between tax and financial reporting requirements.
The fund’s distributions to shareholders included $3,112,000 from long-term capital gains, of which $2,976,000 was subject to a long-term capital gains tax rate of not greater than 20% and $136,000 to a long-term capital gains tax rate of not greater than 25%.
For taxable non-corporate shareholders, $1,471,000 of the fund’s income represents qualified dividend income subject to a long-term capital gains tax rate of not greater than 20%.
For corporate shareholders, $15,000 of the fund’s income qualifies for the dividends-received deduction.
| Information on Proxy Voting Policies, Procedures, and Records |
A description of the policies and procedures used by T. Rowe Price funds and portfolios to determine how to vote proxies relating to portfolio securities is available in each fund’s Statement of Additional Information. You may request this document by calling 1-800-225-5132 or by accessing the SEC’s website, sec.gov.
The description of our proxy voting policies and procedures is also available on our corporate website. To access it, please visit the following Web page:
https://www3.troweprice.com/usis/corporate/en/utility/policies.html
Scroll down to the section near the bottom of the page that says, “Proxy Voting Policies.” Click on the Proxy Voting Policies link in the shaded box.
Each fund’s most recent annual proxy voting record is available on our website and through the SEC’s website. To access it through T. Rowe Price, visit the website location shown above, and scroll down to the section near the bottom of the page that says, “Proxy Voting Records.” Click on the Proxy Voting Records link in the shaded box.
| How to Obtain Quarterly Portfolio Holdings |
The fund files a complete schedule of portfolio holdings with the Securities and Exchange Commission for the first and third quarters of each fiscal year on Form N-Q. The fund’s Form N-Q is available electronically on the SEC’s website (sec.gov); hard copies may be reviewed and copied at the SEC’s Public Reference Room, 100 F St. N.E., Washington, DC 20549. For more information on the Public Reference Room, call 1-800-SEC-0330.
| About the Fund’s Directors and Officers |
Your fund is overseen by a Board of Directors (Board) that meets regularly to review a wide variety of matters affecting or potentially affecting the fund, including performance, investment programs, compliance matters, advisory fees and expenses, service providers, and business and regulatory affairs. The Board elects the fund’s officers, who are listed in the final table. At least 75% of the Board’s members are independent of T. Rowe Price Associates, Inc. (T. Rowe Price), and its affiliates; “inside” or “interested” directors are employees or officers of T. Rowe Price. The business address of each director and officer is 100 East Pratt Street, Baltimore, Maryland 21202. The Statement of Additional Information includes additional information about the fund directors and is available without charge by calling a T. Rowe Price representative at 1-800-638-5660.
| Independent Directors | | |
| |
| Name | | |
| (Year of Birth) | | |
| Year Elected* | | |
| [Number of T. Rowe Price | | Principal Occupation(s) and Directorships of Public Companies and |
| Portfolios Overseen] | | Other Investment Companies During the Past Five Years |
| | | |
| Bruce W. Duncan | | Chief Executive Officer and Director (2009 to December 2016), |
| (1951) | | Chairman of the Board (January 2016 to present), and President |
| 2013 | | (2009 to September 2016), First Industrial Realty Trust, an owner and |
| [191] | | operator of industrial properties; Chairman of the Board (2005 to |
| | September 2016) and Director (1999 to September 2016), Starwood |
| | Hotels & Resorts, a hotel and leisure company; Director, Boston |
| | Properties (May 2016 to present); Director, Marriott International, |
| | Inc. (September 2016 to present) |
| | | |
| Robert J. Gerrard, Jr. | | Advisory Board Member, Pipeline Crisis/Winning Strategies, a |
| (1952) | | collaborative working to improve opportunities for young African |
| 2012 | | Americans (1997 to present) |
| [191] | | |
| | | |
| Paul F. McBride | | Advisory Board Member, Vizzia Technologies (2015 to present) |
| (1956) | | |
| 2013 | | |
| [191] | | |
| | | |
| Cecilia E. Rouse, Ph.D. | | Dean, Woodrow Wilson School (2012 to present); Professor and |
| (1963) | | Researcher, Princeton University (1992 to present); Member of |
| 2012 | | National Academy of Education (2010 to present); Director, MDRC, |
| [191] | | a nonprofit education and social policy research organization |
| | (2011 to present); Research Associate of Labor Studies Program |
| | (2011 to 2015) and Board Member (2015 to present), National |
| | Bureau of Economic Research (2011 to present); Chair of Committee |
| | on the Status of Minority Groups in the Economic Profession |
| | (2012 to present); Vice President (2015 to present), American |
| | Economic Association |
| | | |
| John G. Schreiber | | Owner/President, Centaur Capital Partners, Inc., a real estate |
| (1946) | | investment company (1991 to present); Cofounder, Partner, and |
| 2008 | | Cochairman of the Investment Committee, Blackstone Real Estate |
| [191] | | Advisors, L.P. (1992 to 2015); Director, General Growth Properties, |
| | Inc. (2010 to 2013); Director, Blackstone Mortgage Trust, a real |
| | estate finance company (2012 to 2016); Director and Chairman of |
| | the Board, Brixmor Property Group, Inc. (2013 to present); Director, |
| | Hilton Worldwide (2013 to present); Director, Hudson Pacific |
| | Properties (2014 to 2016) |
| | | |
| Mark R. Tercek | | President and Chief Executive Officer, The Nature Conservancy |
| (1957) | | (2008 to present) |
| 2009 | | |
| [191] | | |
| |
| *Each independent director serves until retirement, resignation, or election of a successor. |
| Inside Directors | | |
| |
| Name | | |
| (Year of Birth) | | |
| Year Elected* | | |
| [Number of T. Rowe Price | | Principal Occupation(s) and Directorships of Public Companies and |
| Portfolios Overseen] | | Other Investment Companies During the Past Five Years |
| | | |
| Edward C. Bernard | | Director and Vice President, T. Rowe Price; Vice Chairman of the |
| (1956) | | Board, Director, and Vice President, T. Rowe Price Group, Inc.; |
| 2008 | | Chairman of the Board, Director, and Vice President, T. Rowe Price |
| [191] | | Investment Services, Inc., and T. Rowe Price Services, Inc.; Chairman |
| | of the Board and Director, T. Rowe Price Retirement Plan Services, |
| | Inc.; Chairman of the Board, Chief Executive Officer, Director, and |
| | President, T. Rowe Price International and T. Rowe Price Trust |
| | Company; Chairman of the Board, all funds |
| | | |
| Robert W. Sharps, CFA, CPA** | | Vice President, T. Rowe Price, T. Rowe Price Group, Inc., and T. Rowe |
| (1971) | | Price Trust Company |
| 2017 | | |
| [135] | | |
| |
| *Each inside director serves until retirement, resignation, or election of a successor. |
| ** Effective April 1, 2017, Brian C. Rogers was replaced by Robert W. Sharps as an inside director of certain Price Funds. |
| Officers | | |
| |
| Name (Year of Birth) | | |
| Position Held With Global Real | | |
| Estate Fund | | Principal Occupation(s) |
| | | |
| Harishankar Balkrishna (1983) | | Vice President, T. Rowe Price Group, Inc., and |
| Vice President | | T. Rowe Price International |
| | | |
| Darrell N. Braman (1963) | | Vice President, Price Hong Kong, Price |
| Vice President and Secretary | | Singapore, T. Rowe Price, T. Rowe Price Group, |
| | Inc., T. Rowe Price International, T. Rowe Price |
| | Investment Services, Inc., and T. Rowe Price |
| | Services, Inc. |
| | | |
| Richard N. Clattenburg, CFA (1979) | | Vice President, Price Singapore, T. Rowe |
| Vice President | | Price, T. Rowe Price Group, Inc., and T. Rowe |
| | Price International |
| | | |
| John R. Gilner (1961) | | Chief Compliance Officer and Vice President, |
| Chief Compliance Officer | | T. Rowe Price; Vice President, T. Rowe Price |
| | Group, Inc., and T. Rowe Price Investment |
| | Services, Inc. |
| | | |
| Tetsuji Inoue (1971) | | Vice President, T. Rowe Price Group, Inc., and |
| Vice President | | T. Rowe Price International |
| | | |
| Nina P. Jones, CPA (1980) | | Vice President, T. Rowe Price and T. Rowe Price |
| President | | Group, Inc. |
| | | |
| Jai Kapadia (1982) | | Vice President, Price Hong Kong and T. Rowe |
| Vice President | | Price Group, Inc. |
| | | |
| Paul J. Krug, CPA (1964) | | Vice President, T. Rowe Price, T. Rowe Price |
| Vice President | | Group, Inc., and T. Rowe Price Trust Company |
| | | |
| David M. Lee, CFA (1962) | | Vice President, T. Rowe Price, T. Rowe Price |
| Vice President | | Group, Inc., and T. Rowe Price Trust Company |
| | | |
| Robert J. Marcotte (1962) | | Vice President, T. Rowe Price and T. Rowe Price |
| Vice President | | Group, Inc. |
| | | |
| Catherine D. Mathews (1963) | | Vice President, T. Rowe Price, T. Rowe Price |
| Treasurer and Vice President | | Group, Inc., and T. Rowe Price Trust Company |
| | | |
| Daniel A. McCulley (1987) | | Vice President, T. Rowe Price; formerly, summer |
| Vice President | | intern, Clearbridge Investments (to 2015); |
| | formerly, Associate Research Analyst, T. Rowe |
| | Price (to 2013) |
| | | |
| Raymond A. Mills, Ph.D., CFA (1960) | | Vice President, T. Rowe Price, T. Rowe Price |
| Vice President | | Group, Inc., T. Rowe Price International, and |
| | T. Rowe Price Trust Company |
| | | |
| Philip A. Nestico (1976) | | Vice President, T. Rowe Price and T. Rowe Price |
| Vice President | | Group, Inc. |
| | | |
| David Oestreicher (1967) | | Director, Vice President, and Secretary, T. Rowe |
| Vice President | | Price Investment Services, Inc., T. Rowe Price |
| | Retirement Plan Services, Inc., T. Rowe |
| | Price Services, Inc., and T. Rowe Price Trust |
| | Company; Chief Legal Officer, Vice President, |
| | and Secretary, T. Rowe Price Group, Inc.; Vice |
| | President and Secretary, T. Rowe Price and |
| | T. Rowe Price International; Vice President, |
| | Price Hong Kong and Price Singapore |
| | | |
| Viral S. Patel (1969) | | Vice President, T. Rowe Price Group, Inc., and |
| Vice President | | T. Rowe Price International |
| | | |
| Preeta Ragavan (1987) | | Vice President, T. Rowe Price and T. Rowe Price |
| Vice President | | Group, Inc.; formerly, intern, T. Rowe Price |
| | (to 2013) |
| | | |
| John W. Ratzesberger (1975) | | Vice President, T. Rowe Price, T. Rowe Price |
| Vice President | | Group, Inc., and T. Rowe Price Trust Company; |
| | formerly, North American Head of Listed |
| | Derivatives Operation, Morgan Stanley |
| | (to 2013) |
| | | |
| Shannon H. Rauser (1987) | | Employee, T. Rowe Price |
| Assistant Secretary | | |
| | | |
| Megan Warren (1968) | | Vice President, T. Rowe Price, T. Rowe Price |
| Vice President | | Group, Inc., T. Rowe Price Retirement Plan |
| | Services, Inc., T. Rowe Price Services, Inc., |
| | and T. Rowe Price Trust Company; formerly, |
| | Executive Director, JPMorgan Chase (to 2017) |
| | | |
| Marta Yago (1977) | | Vice President, T. Rowe Price Group, Inc., and |
| Vice President | | T. Rowe Price International |
| |
| Unless otherwise noted, officers have been employees of T. Rowe Price or T. Rowe Price International for at least 5 years. |
Item 2. Code of Ethics.
The registrant has adopted a code of ethics, as defined in Item 2 of Form N-CSR, applicable to its principal executive officer, principal financial officer, principal accounting officer or controller, or persons performing similar functions. A copy of this code of ethics is filed as an exhibit to this Form N-CSR. No substantive amendments were approved or waivers were granted to this code of ethics during the period covered by this report.
Item 3. Audit Committee Financial Expert.
The registrant’s Board of Directors/Trustees has determined that Mr. Bruce W. Duncan qualifies as an audit committee financial expert, as defined in Item 3 of Form N-CSR. Mr. Duncan is considered independent for purposes of Item 3 of Form N-CSR.
Item 4. Principal Accountant Fees and Services.
(a) – (d) Aggregate fees billed for the last two fiscal years for professional services rendered to, or on behalf of, the registrant by the registrant’s principal accountant were as follows:

Audit fees include amounts related to the audit of the registrant’s annual financial statements and services normally provided by the accountant in connection with statutory and regulatory filings. Audit-related fees include amounts reasonably related to the performance of the audit of the registrant’s financial statements and specifically include the issuance of a report on internal controls and, if applicable, agreed-upon procedures related to fund acquisitions. Tax fees include amounts related to services for tax compliance, tax planning, and tax advice. The nature of these services specifically includes the review of distribution calculations and the preparation of Federal, state, and excise tax returns. All other fees include the registrant’s pro-rata share of amounts for agreed-upon procedures in conjunction with service contract approvals by the registrant’s Board of Directors/Trustees.
(e)(1) The registrant’s audit committee has adopted a policy whereby audit and non-audit services performed by the registrant’s principal accountant for the registrant, its investment adviser, and any entity controlling, controlled by, or under common control with the investment adviser that provides ongoing services to the registrant require pre-approval in advance at regularly scheduled audit committee meetings. If such a service is required between regularly scheduled audit committee meetings, pre-approval may be authorized by one audit committee member with ratification at the next scheduled audit committee meeting. Waiver of pre-approval for audit or non-audit services requiring fees of a de minimis amount is not permitted.
(2) No services included in (b) – (d) above were approved pursuant to paragraph (c)(7)(i)(C) of Rule 2-01 of Regulation S-X.
(f) Less than 50 percent of the hours expended on the principal accountant’s engagement to audit the registrant’s financial statements for the most recent fiscal year were attributed to work performed by persons other than the principal accountant’s full-time, permanent employees.
(g) The aggregate fees billed for the most recent fiscal year and the preceding fiscal year by the registrant’s principal accountant for non-audit services rendered to the registrant, its investment adviser, and any entity controlling, controlled by, or under common control with the investment adviser that provides ongoing services to the registrant were $2,169,000 and $2,146,000, respectively.
(h) All non-audit services rendered in (g) above were pre-approved by the registrant’s audit committee. Accordingly, these services were considered by the registrant’s audit committee in maintaining the principal accountant’s independence.
Item 5. Audit Committee of Listed Registrants.
Not applicable.
Item 6. Investments.
(a) Not applicable. The complete schedule of investments is included in Item 1 of this Form N-CSR.
(b) Not applicable.
Item 7. Disclosure of Proxy Voting Policies and Procedures for Closed-End Management Investment Companies.
Not applicable.
Item 8. Portfolio Managers of Closed-End Management Investment Companies.
Not applicable.
Item 9. Purchases of Equity Securities by Closed-End Management Investment Company and Affiliated Purchasers.
Not applicable.
Item 10. Submission of Matters to a Vote of Security Holders.
Not applicable.
Item 11. Controls and Procedures.
(a) The registrant’s principal executive officer and principal financial officer have evaluated the registrant’s disclosure controls and procedures within 90 days of this filing and have concluded that the registrant’s disclosure controls and procedures were effective, as of that date, in ensuring that information required to be disclosed by the registrant in this Form N-CSR was recorded, processed, summarized, and reported timely.
(b) The registrant’s principal executive officer and principal financial officer are aware of no change in the registrant’s internal control over financial reporting that occurred during the registrant’s second fiscal quarter covered by this report that has materially affected, or is reasonably likely to materially affect, the registrant’s internal control over financial reporting.
Item 12. Exhibits.
(a)(1) The registrant’s code of ethics pursuant to Item 2 of Form N-CSR is attached.
(2) Separate certifications by the registrant's principal executive officer and principal financial officer, pursuant to Section 302 of the Sarbanes-Oxley Act of 2002 and required by Rule 30a-2(a) under the Investment Company Act of 1940, are attached.
(3) Written solicitation to repurchase securities issued by closed-end companies: not applicable.
(b) A certification by the registrant's principal executive officer and principal financial officer, pursuant to Section 906 of the Sarbanes-Oxley Act of 2002 and required by Rule 30a-2(b) under the Investment Company Act of 1940, is attached.
SIGNATURES
Pursuant to the requirements of the Securities Exchange Act of 1934 and the Investment Company Act of 1940, the registrant has duly caused this report to be signed on its behalf by the undersigned, thereunto duly authorized.
T. Rowe Price Global Real Estate Fund, Inc.
| By | | /s/ Edward C. Bernard |
| | | Edward C. Bernard |
| | | Principal Executive Officer |
| |
| Date | | February 20, 2018 | | | | |
Pursuant to the requirements of the Securities Exchange Act of 1934 and the Investment Company Act of 1940, this report has been signed below by the following persons on behalf of the registrant and in the capacities and on the dates indicated.
| By | | /s/ Edward C. Bernard |
| | | Edward C. Bernard |
| | | Principal Executive Officer |
| |
| Date | | February 20, 2018 | | | | |
| |
| |
| By | | /s/ Catherine D. Mathews |
| | | Catherine D. Mathews |
| | | Principal Financial Officer |
| |
| Date | | February 20, 2018 | | | | |