| UNITED STATES |
| SECURITIES AND EXCHANGE COMMISSION |
| Washington, D.C. 20549 |
| |
FORM N-CSR |
| |
CERTIFIED SHAREHOLDER REPORT OF REGISTERED |
MANAGEMENT INVESTMENT COMPANIES |
| |
| |
| |
| Investment Company Act File Number: 811-22218 |
|
| |
| T. Rowe Price Global Real Estate Fund, Inc. |
|
| (Exact name of registrant as specified in charter) |
| |
| 100 East Pratt Street, Baltimore, MD 21202 |
|
| (Address of principal executive offices) |
| |
| David Oestreicher |
| 100 East Pratt Street, Baltimore, MD 21202 |
|
| (Name and address of agent for service) |
| |
| |
| Registrant’s telephone number, including area code: (410) 345-2000 |
| |
| |
| Date of fiscal year end: December 31 |
| |
| |
| Date of reporting period: December 31, 2010 |
Item 1: Report to Shareholders| Global Real Estate Fund | December 31, 2010 |
The views and opinions in this report were current as of December 31, 2010. They are not guarantees of performance or investment results and should not be taken as investment advice. Investment decisions reflect a variety of factors, and the managers reserve the right to change their views about individual stocks, sectors, and the markets at any time. As a result, the views expressed should not be relied upon as a forecast of the fund’s future investment intent. The report is certified under the Sarbanes-Oxley Act, which requires mutual funds and other public companies to affirm that, to the best of their knowledge, the information in their financial reports is fairly and accurately stated in all material respects.
REPORTS ON THE WEB
Sign up for our E-mail Program, and you can begin to receive updated fund reports and prospectuses online rather than through the mail. Log in to your account at troweprice.com for more information.
Manager’s Letter
Fellow Shareholders
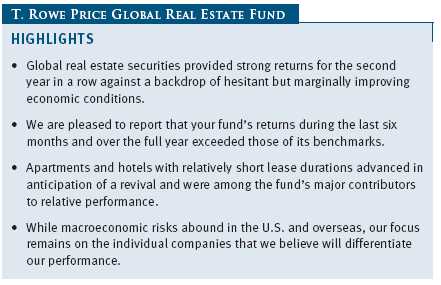
For a second consecutive year, global real estate securities provided positive returns as the markets, while still facing uncertainty, distanced themselves from what appeared to be the worst of the global financial crisis. Commercial real estate returns were better than those in the residential market, and most of the gains for the year occurred during the past six months. Credit markets remained liquid and interest rates were low, offering borrowers the opportunity to refinance debt on reasonable terms. Prime assets generating attractive income garnered strong attention in a low yield environment.
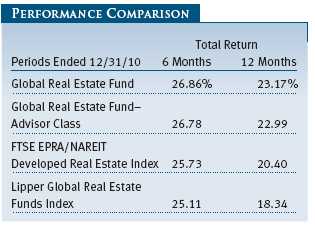
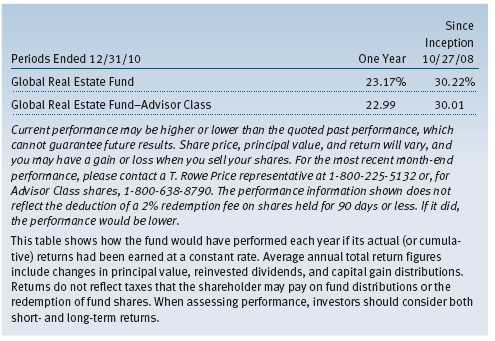
We are pleased to report that your fund fully participated in the sector’s gains, with returns that exceeded those of its benchmarks. Your fund returned 26.86% during the past six months compared with 25.73% for the FTSE EPRA/NAREIT Developed Real Estate Index and 25.11% for the Lipper Global Real Estate Funds Index. Fund performance exceeded both benchmarks for the full year, with total returns of 23.17%, 20.40%, and 18.34%, respectively. (The returns for the Advisor Class shares were lower, reflecting their different fee structure.)
DIVIDEND DISTRIBUTION
On December 15, 2010, your fund’s Board of Directors declared a fourth-quarter income dividend of $0.24, a short-term capital gain distribution of $0.25, and a long-term capital gain distribution of $0.02 per share to shareholders of record on that day. This distribution was paid on December 17 and was the same for the Advisor Class shares.
MARKET ENVIRONMENT AND STRATEGY
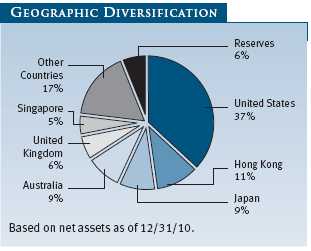
It seemed commonplace to find positive returns in real estate securities across the globe during the past six months (see chart below showing performances of major countries in the index). Yet macroeconomic factors influencing investments were substantially different from region to region. While several countries enacted policies designed to cool heated economies and stem inflationary pressures, others engaged in quantitative easing and loose monetary policies to boost economic growth and combat deflationary pressures. Significant political change and uncertainty was also widespread in 2010, with elections that resulted in notable shifts from the status quo. With starkly contrasting economies, politics, and monetary policies, it was surprising that so many markets generated positive returns during the second half of the year.

The U.S., still the largest component of our global index, posted outsized results as we heard less about a double-dip recession and more about gradual improvement in job creation. Yet job creation, while marginally better, was not at levels deemed satisfactory, and the U.S. saw a dramatic political shift toward a more conservative legislature. Interest rates remained low and had the effect of easing the refinancing of debt maturities. While real estate demand was restrained with mild job creation, the lack of new supply resulted in occupancy gains. Real estate investors cheered this initial step in the recovery process and drove stock prices higher.
In contrast to the U.S., several economies in Asia remained vigorous, prompting local governments to enact cooling policies to contain inflationary pressures. Singapore and Hong Kong took steps to rein in residential speculation, though commercial landlords were less affected and enjoyed better results than developers. No country, it seemed, did as much as China in its effort to curb residential prices, as its central government invoked a series of tightening policies that placed pressure on developers and resulted in negative returns for the year.
Your fund’s returns in Australia and Japan were aided by foreign currency exchange rates. Australia, with an export economy tied to China, enacted a series of interest rate increases to temper growth and inflation. Rising interest rates strengthened the Australian dollar, boosting returns for U.S. investors. However, with most Australian residential mortgages tied to floating interest rates, higher rates increased the pressure on local consumers. There was also a good deal of political uncertainty in Australia as elections resulted in a rare hung parliament that required the formation of a coalition government. In Japan, the export economy normally benefits from a weaker currency, but despite government efforts to weaken the yen, the currency appreciated significantly against the U.S. dollar.
In Europe, sovereign debt concerns led to harshly negative returns for the so-called PIIGS countries (Portugal, Italy, Ireland, Greece, and Spain), but the healthier European markets helped offset those losses. The European Union fended off an onslaught of sovereign debt crises yet remained under a cloud, and austerity measures and unresolved debt issues may continue to weigh upon markets there. The U.K., like Australia, held national elections that resulted in a hung parliament, leading to the removal of the incumbent prime minster and necessitating a coalition government. Unlike Australia, however, the currency weakened and challenged returns for U.S. investors.
Some common factors around the globe served to drive many real estate stocks higher. For example, prime assets in gateway cities garnered strong bids as desire for trophy properties grew amid uncertainty. Indeed, if global markets were to enter a “new normal” environment of lower returns (as predicted by some), higher prices and lower yields could be justified for prime assets. Additionally, real estate is viewed by many as a hedge against inflation, and speculation about inflationary pressures in various regions helped lift asset prices. Inflation is already a problem in countries like China with heated economies, and it could become an issue in countries like the U.S. that have adopted loose monetary policies to invigorate their own economies.
PORTFOLIO REVIEW
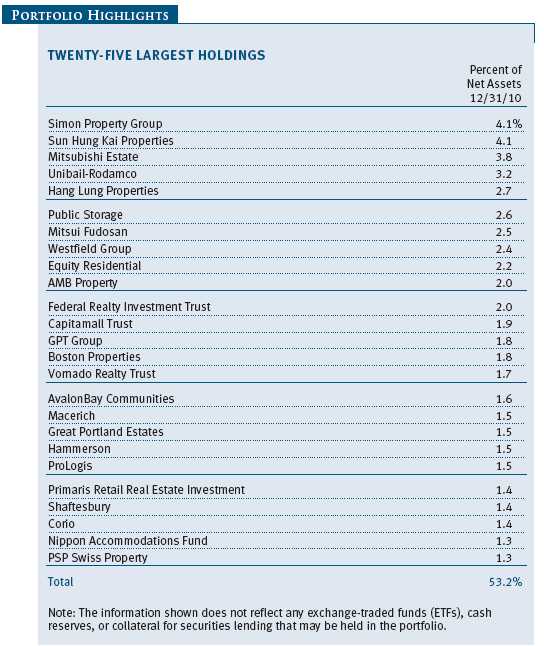
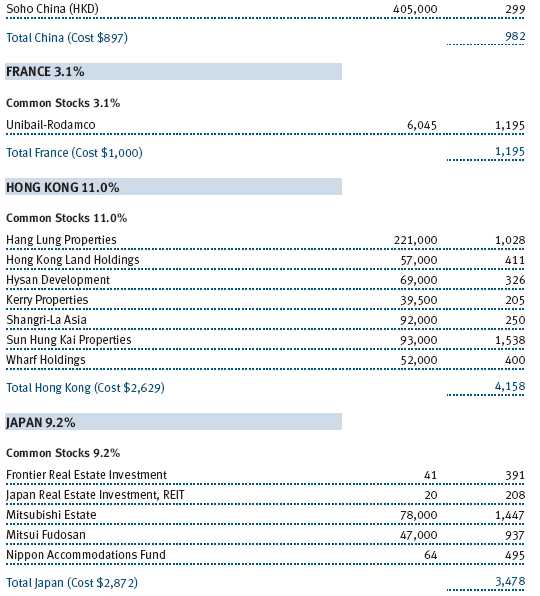
Properties with shorter rental periods were among the first to feel the pain of the global financial crisis and were also among the first to reflect the optimism of a recovery. As such, hotels with the ability to rapidly reset overnight rates advanced in anticipation of a revival. Among our hotel operators, Orient Express Hotels, Shangri-La Asia, Starwood Hotels & Resorts, and Marriott International were strong contributors to fund performance. Logistics properties were also viewed as beneficiaries in a global recovery, thus propelling shares of ProLogis and AMB Property. We participated in the offering of Global Logistic Properties, a company that seeks to benefit from the demand for modern logistics facilities in China and Japan. (Please refer to our portfolio of investments for a complete list of holdings and the amount each represents in the portfolio.)
Residential builders in Asia were under pressure due to government tightening, which affected our investments in China Resources Land, Shimao Property, and China Overseas Land. However, commercial landlords fared quite well during the period, including our Hong Kong investments in Hysan Development, Wharf Holdings, and Hongkong Land Holdings.
Japanese real estate investment trusts (JREITs) delivered strong returns thanks to investors seeking higher yields and from news that the Bank of Japan would intervene with JREIT purchases. Several of our JREIT holdings, including Nippon Accommodations Fund and Frontier Real Estate Investment, benefited as a result. We trimmed some of our holdings in this space, such as Japan Real Estate Investment, and we eliminated Global One Real Estate Investment while rolling additional proceeds into our existing investment in Mitsubishi Estate.
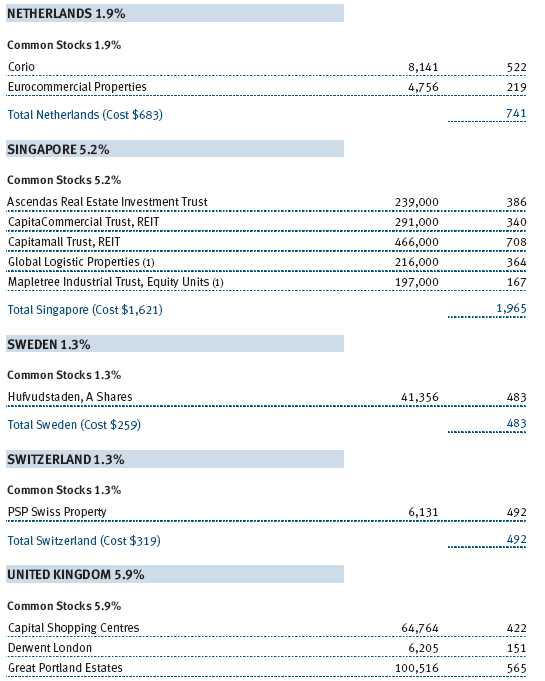
In Europe, regional performance differed dramatically, and the fund was largely rewarded for holding securities outside the most troubled markets. For example, we garnered strong returns from Hufvudstaden, a dominant landlord in Stockholm, Sweden. Additionally, PSP Swiss Property, with a large concentration in Zurich, Switzerland, was strong during the year.
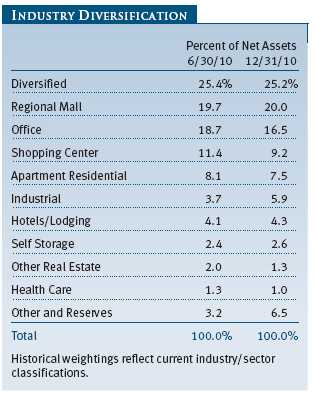
Worldwide, strong regional mall franchises continued to attract investor attention because of their resilient performance. We have long seen appeal in these high-barrier franchises and were broadly rewarded this period from our holdings in Iguatemi Empresa Shopping in Brazil, Capital Shopping Centers in Great Britain, Unibail-Rodamco in Continental Europe, and Taubman Centers in the U.S.
OUTLOOK
Last year was extremely rewarding for global real estate investors despite broadly divergent conditions worldwide. Some economies were slowing, while others gained momentum. Some governments were tightening while others were easing, and some governments remained intact while others shifted politically. On a macroeconomic level, it is usually futile to try to predict the course of world-shaping events that are beyond our control—government policies, currency fluctuations, political upheaval in one region or another. We monitor global conditions carefully and take note of events as they occur, but our primary focus remains on the companies in our investment universe.
Individual stock selection was once again our best approach to relative performance in 2010. We expect 2011 to be no different in that regard. Global uncertainties have always been with us and will always be a part of the investment landscape. In the midst of all the turmoil affecting global events, however, we will continue to direct our attention to the fundamental health of individual companies and the factors that we believe can differentiate our performance from that of our competitors. The interests of our shareholders and their investment goals remain our paramount concern. We endeavor to make investment decisions that could result in attractive returns for our investors over the long term.
Thank you for your continued support and confidence.
Respectfully submitted,

David M. Lee
President of the fund and chairman of its Investment Advisory Committee
January 21, 2011
The committee chairman has day-to-day responsibility for managing the portfolio and works with committee members in developing and executing the fund’s investment program.
RISKS OF INVESTING
The fund’s share price can fall because of weakness in the stock market, a particular industry, or specific holdings. Stock markets can decline for many reasons, including adverse political or economic developments, changes in investor psychology, or heavy institutional selling. The prospects for an industry or company may deteriorate because of a variety of factors, including disappointing earnings or changes in the competitive environment. In addition, the investment manager’s assessment of companies held in a fund may prove incorrect, resulting in losses or poor performance even in rising markets.
Funds that invest only in specific industries will experience greater volatility than funds investing in a broad range of industries. Due to its concentration in the real estate industry, the fund’s share price could be more volatile than that of a fund with a broader investment mandate. Trends perceived to be unfavorable to real estate, such as changes in the tax laws or rising interest rates, could cause a decline in share prices.
Funds that invest overseas generally carry more risk than funds that invest strictly in U.S. assets. Funds investing in a single country or in a limited geographic region tend to be riskier than more diversified funds. Risks can result from varying stages of economic and political development; differing regulatory environments, trading days, and accounting standards; and higher transaction costs of non-U.S. markets. Non-U.S. investments are also subject to currency risk, or a decline in the value of a foreign currency versus the U.S. dollar, which reduces the dollar value of securities denominated in that currency.
GLOSSARY
FTSE EPRA/NAREIT Developed Real Estate Index: A total return index composed of the most actively traded real estate investment trusts (REITs) and REIT-type structures, designed to be a measure of global real estate equity performance.
Lipper indexes: Fund benchmarks that consist of a small number of the largest mutual funds in a particular category as tracked by Lipper Inc.
Real estate investment trusts: Publicly traded companies that own, develop, and operate apartment complexes, hotels, office buildings, and other commercial properties.

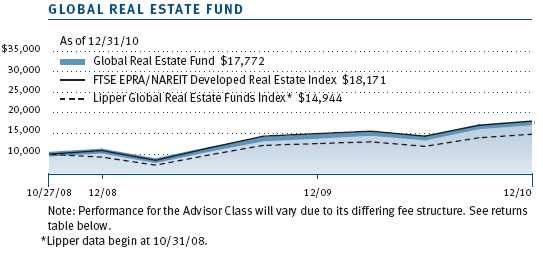
Performance and Expenses
This chart shows the value of a hypothetical $10,000 investment in the fund over the past 10 fiscal year periods or since inception (for funds lacking 10-year records). The result is compared with benchmarks, which may include a broad-based market index and a peer group average or index. Market indexes do not include expenses, which are deducted from fund returns as well as mutual fund averages and indexes.
| AVERAGE ANNUAL COMPOUND TOTAL RETURN |
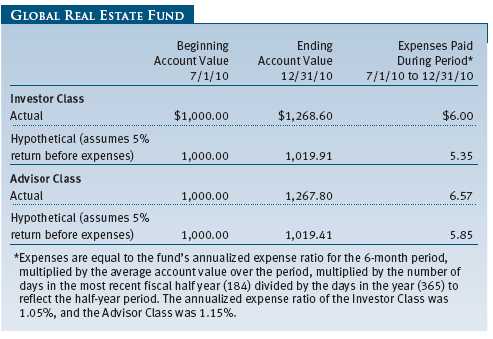
As a mutual fund shareholder, you may incur two types of costs: (1) transaction costs, such as redemption fees or sales loads, and (2) ongoing costs, including management fees, distribution and service (12b-1) fees, and other fund expenses. The following example is intended to help you understand your ongoing costs (in dollars) of investing in the fund and to compare these costs with the ongoing costs of investing in other mutual funds. The example is based on an investment of $1,000 invested at the beginning of the most recent six-month period and held for the entire period.
Please note that the fund has two share classes: The original share class (“investor class”) charges no distribution and service (12b-1) fee, and the Advisor Class shares are offered only through unaffiliated brokers and other financial intermediaries and charge a 0.25% 12b-1 fee. Each share class is presented separately in the table.
Actual Expenses
The first line of the following table (“Actual”) provides information about actual account values and expenses based on the fund’s actual returns. You may use the information in this line, together with your account balance, to estimate the expenses that you paid over the period. Simply divide your account value by $1,000 (for example, an $8,600 account value divided by $1,000 = 8.6), then multiply the result by the number in the first line under the heading “Expenses Paid During Period” to estimate the expenses you paid on your account during this period.
Hypothetical Example for Comparison Purposes
The information on the second line of the table (“Hypothetical”) is based on hypothetical account values and expenses derived from the fund’s actual expense ratio and an assumed 5% per year rate of return before expenses (not the fund’s actual return). You may compare the ongoing costs of investing in the fund with other funds by contrasting this 5% hypothetical example and the 5% hypothetical examples that appear in the shareholder reports of the other funds. The hypothetical account values and expenses may not be used to estimate the actual ending account balance or expenses you paid for the period.
Note: T. Rowe Price charges an annual small-account maintenance fee of $10, generally for accounts with less than $2,000 ($500 for UGMA/UTMA). The fee is waived for any investor whose T. Rowe Price mutual fund accounts total $25,000 or more, accounts employing automatic investing, and IRAs and other retirement plan accounts that utilize a prototype plan sponsored by T. Rowe Price (although a separate custodial or administrative fee may apply to such accounts). This fee is not included in the accompanying table. If you are subject to the fee, keep it in mind when you are estimating the ongoing expenses of investing in the fund and when comparing the expenses of this fund with other funds.
You should also be aware that the expenses shown in the table highlight only your ongoing costs and do not reflect any transaction costs, such as redemption fees or sales loads. Therefore, the second line of the table is useful in comparing ongoing costs only and will not help you determine the relative total costs of owning different funds. To the extent a fund charges transaction costs, however, the total cost of owning that fund is higher.

The accompanying notes are an integral part of these financial statements.

The accompanying notes are an integral part of these financial statements.


The accompanying notes are an integral part of these financial statements.

The accompanying notes are an integral part of these financial statements.
The accompanying notes are an integral part of these financial statements.
The accompanying notes are an integral part of these financial statements.
| NOTES TO FINANCIAL STATEMENTS |
T. Rowe Price Global Real Estate Fund, Inc (the fund), is registered under the Investment Company Act of 1940 (the 1940 Act) as a nondiversified, open-end management investment company. The fund seeks to provide long-term growth through a combination of capital appreciation and current income. The fund has two classes of shares: the Global Real Estate Fund original share class, referred to in this report as the Investor Class, offered since October 27, 2008, and the Global Real Estate Fund – Advisor Class (Advisor Class), offered since October 27, 2008. Advisor Class shares are sold only through unaffiliated brokers and other unaffiliated financial intermediaries that are compensated by the class for distribution, shareholder servicing, and/or certain administrative services under a Board-approved Rule 12b-1 plan. Each class has exclusive voting rights on matters related solely to that class; separate voting rights on matters that relate to both classes; and, in all other respects, the same rights and obligations as the other class.
NOTE 1 - SIGNIFICANT ACCOUNTING POLICIES
Basis of Preparation The accompanying financial statements were prepared in accordance with accounting principles generally accepted in the United States of America (GAAP), which require the use of estimates made by fund management. Fund management believes that estimates and valuations are appropriate; however, actual results may differ from those estimates, and the valuations reflected in the accompanying financial statements may differ from the value ultimately realized upon sale or maturity.
Investment Transactions, Investment Income, and Distributions Income and expenses are recorded on the accrual basis. Dividends received from mutual fund investments are reflected as dividend income; capital gain distributions are reflected as realized gain/loss. Dividend income and capital gain distributions are recorded on the ex-dividend date. Income tax-related interest and penalties, if incurred, would be recorded as income tax expense. Investment transactions are accounted for on the trade date. Realized gains and losses are reported on the identified cost basis. Distributions to shareholders are recorded on the ex-dividend date. Income distributions are declared and paid by each class quarterly. Capital gain distributions, if any, are generally declared and paid by the fund annually.
Currency Translation Assets, including investments, and liabilities denominated in foreign currencies are translated into U.S. dollar values each day at the prevailing exchange rate, using the mean of the bid and asked prices of such currencies against U.S. dollars as quoted by a major bank. Purchases and sales of securities, income, and expenses are translated into U.S. dollars at the prevailing exchange rate on the date of the transaction. The effect of changes in foreign currency exchange rates on realized and unrealized security gains and losses is reflected as a component of security gains and losses.
Class Accounting The Advisor Class pays distribution, shareholder servicing, and/or certain administrative expenses in the form of Rule 12b-1 fees, in an amount not exceeding 0.25% of the class’s average daily net assets; no such fees were incurred during the period ended December 31, 2010. Shareholder servicing, prospectus, and shareholder report expenses incurred by each class are charged directly to the class to which they relate. Expenses common to both classes, investment income, and realized and unrealized gains and losses are allocated to the classes based upon the relative daily net assets of each class.
Redemption Fees A 2% fee is assessed on redemptions of fund shares held for 90 days or less to deter short-term trading and to protect the interests of long-term shareholders. Redemption fees are withheld from proceeds that shareholders receive from the sale or exchange of fund shares. The fees are paid to the fund and are recorded as an increase to paid-in capital. The fees may cause the redemption price per share to differ from the net asset value per share.
New Accounting Pronouncement On January 1, 2010, the fund adopted new accounting guidance that requires enhanced disclosures about fair value measurements in the financial statements. Adoption of this guidance had no impact on the fund’s net assets or results of operations.
NOTE 2 - VALUATION
The fund’s financial instruments are reported at fair value as defined by GAAP. The fund determines the values of its assets and liabilities and computes each class’s net asset value per share at the close of the New York Stock Exchange (NYSE), normally 4 p.m. ET, each day that the NYSE is open for business.
Valuation Methods Equity securities listed or regularly traded on a securities exchange or in the over-the-counter (OTC) market are valued at the last quoted sale price or, for certain markets, the official closing price at the time the valuations are made, except for OTC Bulletin Board securities, which are valued at the mean of the latest bid and asked prices. A security that is listed or traded on more than one exchange is valued at the quotation on the exchange determined to be the primary market for such security. Listed securities not traded on a particular day are valued at the mean of the latest bid and asked prices for domestic securities and the last quoted sale price for international securities.
Investments in mutual funds are valued at the mutual fund’s closing net asset value per share on the day of valuation.
Other investments, including restricted securities, and those financial instruments for which the above valuation procedures are inappropriate or are deemed not to reflect fair value are stated at fair value as determined in good faith by the T. Rowe Price Valuation Committee, established by the fund’s Board of Directors.
For valuation purposes, the last quoted prices of non-U.S. equity securities may be adjusted under the circumstances described below. If the fund determines that developments between the close of a foreign market and the close of the NYSE will, in its judgment, materially affect the value of some or all of its portfolio securities, the fund will adjust the previous closing prices to reflect what it believes to be the fair value of the securities as of the close of the NYSE. In deciding whether it is necessary to adjust closing prices to reflect fair value, the fund reviews a variety of factors, including developments in foreign markets, the performance of U.S. securities markets, and the performance of instruments trading in U.S. markets that represent foreign securities and baskets of foreign securities. A fund may also fair value securities in other situations, such as when a particular foreign market is closed but the fund is open. The fund uses outside pricing services to provide it with closing prices and information to evaluate and/or adjust those prices. The fund cannot predict how often it will use closing prices and how often it will determine it necessary to adjust those prices to reflect fair value. As a means of evaluating its security valuation process, the fund routinely compares closing prices, the next day’s opening prices in the same markets, and adjusted prices.
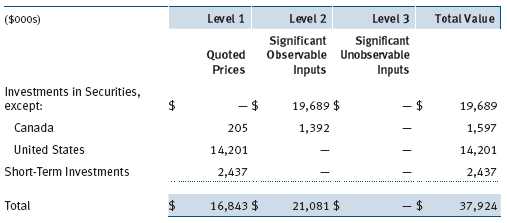
Valuation Inputs Various inputs are used to determine the value of the fund’s financial instruments. These inputs are summarized in the three broad levels listed below:
Level 1 – quoted prices in active markets for identical financial instruments
Level 2 – observable inputs other than Level 1 quoted prices (including, but not limited to, quoted prices for similar financial instruments, interest rates, prepayment speeds, and credit risk)
Level 3 – unobservable inputs
Observable inputs are those based on market data obtained from sources independent of the fund, and unobservable inputs reflect the fund’s own assumptions based on the best information available. The input levels are not necessarily an indication of the risk or liquidity associated with financial instruments at that level. For example, non-U.S. equity securities actively traded in foreign markets generally are reflected in Level 2 despite the availability of closing prices because the fund evaluates and determines whether those closing prices reflect fair value at the close of the NYSE or require adjustment, as described above. The following table summarizes the fund’s financial instruments, based on the inputs used to determine their values on December 31, 2010:
NOTE 3 - OTHER INVESTMENT TRANSACTIONS
Purchases and sales of portfolio securities other than short-term securities aggregated $15,409,000 and $1,512,000, respectively, for the year ended December 31, 2010.
NOTE 4 - FEDERAL INCOME TAXES
No provision for federal income taxes is required since the fund intends to continue to qualify as a regulated investment company under Subchapter M of the Internal Revenue Code and distribute to shareholders all of its taxable income and gains. Distributions determined in accordance with federal income tax regulations may differ in amount or character from net investment income and realized gains for financial reporting purposes. Financial reporting records are adjusted for permanent book/tax differences to reflect tax character but are not adjusted for temporary differences.
The fund files U.S. federal, state, and local tax returns as required. The fund’s tax returns are subject to examination by the relevant tax authorities until expiration of the applicable statute of limitations, which is generally three years after the filing of the tax return but which can be extended to six years in certain circumstances. Tax returns for open years have incorporated no uncertain tax positions that require a provision for income taxes.
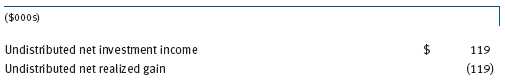
Reclassifications between income and gain relate primarily to the character of dividends received from REIT investments. For the year ended December 31, 2010, the following reclassifications were recorded to reflect tax character; there was no impact on results of operations or net assets:
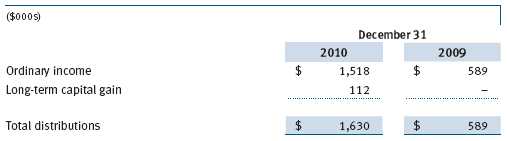
Distributions during the years ended December 31, 2010 and December 31, 2009 were characterized for tax purposes as follows:
At December 31, 2010, the tax-basis cost of investments and components of net assets were as follows:
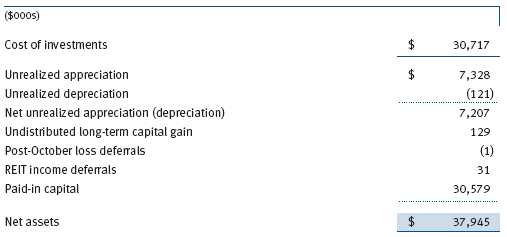
The difference between book-basis and tax-basis net unrealized appreciation (depreciation) is attributable to the deferral of losses from wash sales and the realization of unrealized gains/losses on passive foreign investment companies for tax purposes.
In accordance with federal income tax regulations applicable to investment companies, recognition of capital and/or currency losses on certain transactions realized between November 1 and December 31 is deferred for tax purposes until the subsequent year (post-October loss deferrals); however, such losses are recognized for financial reporting purposes in the year realized. Similarly, certain dividends declared by real estate investment trusts (REITs) in December and paid the following January are recognized for tax purposes in the subsequent year (REIT income deferrals), but for financial reporting purposes are included in the fund’s dividend income on ex-date.
NOTE 5 - RELATED PARTY TRANSACTIONS
The fund is managed by T. Rowe Price Associates, Inc. (the manager or Price Associates), a wholly owned subsidiary of T. Rowe Price Group, Inc. The investment management agreement between the fund and the manager provides for an annual investment management fee, which is computed daily and paid monthly. The fee consists of an individual fund fee, equal to 0.40% of the fund’s average daily net assets, and a group fee. The group fee rate is calculated based on the combined net assets of certain mutual funds sponsored by Price Associates (the group) applied to a graduated fee schedule, with rates ranging from 0.48% for the first $1 billion of assets to 0.285% for assets in excess of $220 billion. The fund’s group fee is determined by applying the group fee rate to the fund’s average daily net assets. At December 31, 2010, the effective annual group fee rate was 0.30%.
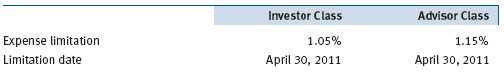
The Investor Class and Advisor Class are also subject to a contractual expense limitation through the limitation dates indicated in the table below. During the limitation period, the manager is required to waive its management fee and/or reimburse expenses, excluding interest, taxes, brokerage commissions, and extraordinary expenses that would otherwise cause the class’s ratio of annualized total expenses to average net assets (expense ratio) to exceed its expense limitation. For a period of three years after the date of any reimbursement or waiver, each class is required to repay the manager for expenses previously reimbursed and management fees waived to the extent the class’s net assets have grown or expenses have declined sufficiently to allow repayment without causing the class’s expense ratio to exceed its expense limitation.
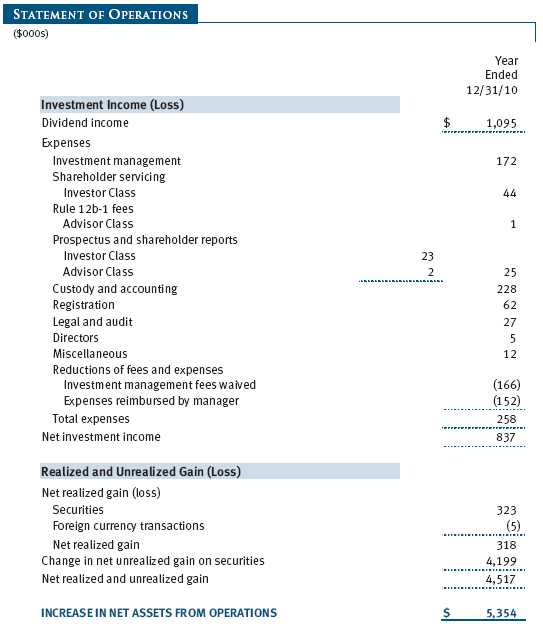
Pursuant to this agreement, management fees in the amount of $166,000 were waived and expenses in the amount of $152,000 were reimbursed by the manager during the year ended December 31, 2010. Including these amounts, management fees waived and expenses previously reimbursed by the manager in the amount of $756,000 remain subject to repayment at December 31, 2010.
In addition, the fund has entered into service agreements with Price Associates and two wholly owned subsidiaries of Price Associates (collectively, Price). Price Associates computes the daily share prices and provides certain other administrative services to the fund. T. Rowe Price Services, Inc., provides shareholder and administrative services in its capacity as the fund’s transfer and dividend disbursing agent. T. Rowe Price Retirement Plan Services, Inc., provides subaccounting and recordkeeping services for certain retirement accounts invested in the Investor Class. For the year ended December 31, 2010, expenses incurred pursuant to these service agreements were $197,000 for Price Associates; $33,000 for T. Rowe Price Services, Inc.; and $1,000 for T. Rowe Price Retirement Plan Services, Inc. The total amount payable at period-end pursuant to these service agreements is reflected as Due to Affiliates in the accompanying financial statements.
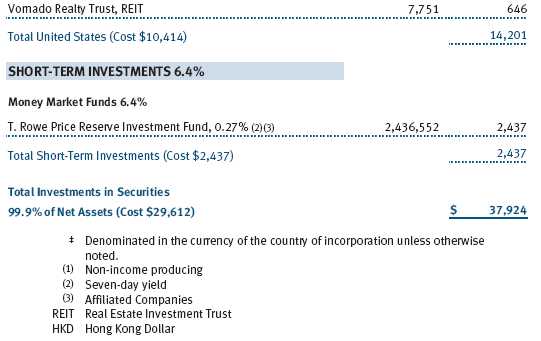
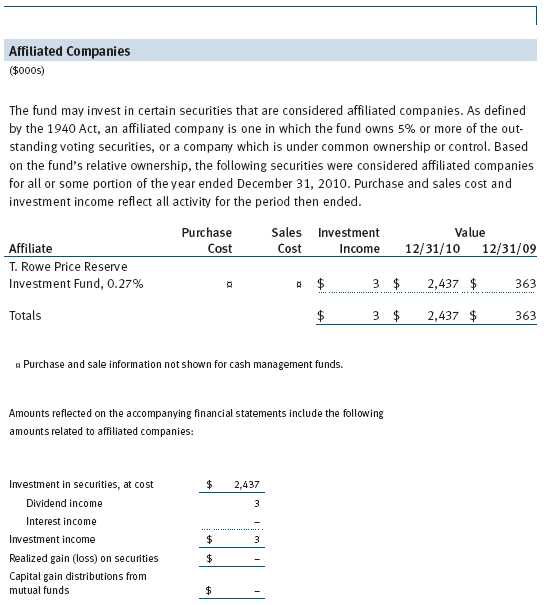
The fund may invest in the T. Rowe Price Reserve Investment Fund and the T. Rowe Price Government Reserve Investment Fund (collectively, the T. Rowe Price Reserve Investment Funds), open-end management investment companies managed by Price Associates and considered affiliates of the fund. The T. Rowe Price Reserve Investment Funds are offered as cash management options to mutual funds, trusts, and other accounts managed by Price Associates and/or its affiliates and are not available for direct purchase by members of the public. The T. Rowe Price Reserve Investment Funds pay no investment management fees.
As of December 31, 2010, T. Rowe Price Group, Inc., and/or its wholly owned subsidiaries owned 575,000 shares of the Investor Class, and 25,000 shares of the Advisor Class, aggregating 25% of the fund’s net assets.
| REPORT OF INDEPENDENT REGISTERED PUBLIC ACCOUNTING FIRM |
To the Board of Directors and Shareholders of
T. Rowe Price Global Real Estate Fund, Inc.
In our opinion, the accompanying statement of assets and liabilities, including the portfolio of investments, and the related statements of operations and of changes in net assets and the financial highlights present fairly, in all material respects, the financial position of T. Rowe Price Global Real Estate Fund, Inc. (the “Fund”) at December 31, 2010, the results of its operations for the year then ended, the changes in its net assets for each of the two years in the period then ended and the financial highlights for each of the fiscal periods presented, in conformity with accounting principles generally accepted in the United States of America. These financial statements and financial highlights (hereafter referred to as “financial statements”) are the responsibility of the Fund’s management; our responsibility is to express an opinion on these financial statements based on our audits. We conducted our audits of these financial statements in accordance with the standards of the Public Company Accounting Oversight Board (United States). Those standards require that we plan and perform the audit to obtain reasonable assurance about whether the financial statements are free of material misstatement. An audit includes examining, on a test basis, evidence supporting the amounts and disclosures in the financial statements, assessing the accounting principles used and significant estimates made by management, and evaluating the overall financial statement presentation. We believe that our audits, which included confirmation of securities at December 31, 2010 by correspondence with the custodian and brokers, and confirmation of the underlying fund by correspondence with the transfer agent, provide a reasonable basis for our opinion.
PricewaterhouseCoopers LLP
Baltimore, Maryland
February 17, 2011
| TAX INFORMATION (UNAUDITED) FOR THE TAX YEAR ENDED 12/31/10 |
We are providing this information as required by the Internal Revenue Code. The amounts shown may differ from those elsewhere in this report because of differences between tax and financial reporting requirements.
The fund’s distributions to shareholders included:
• $704,000 from short-term capital gains
• $112,000 from long-term capital gains, of which $84,000 was subject to the 15% rate gains category, and $28,000 to the 25% rate gains category.
For taxable non-corporate shareholders, $360,000 of the fund’s income represents qualified dividend income subject to the 15% rate category.
For corporate shareholders, $9,000 of the fund’s income qualifies for the dividends-received deduction.
The fund will pass through foreign source income of $810,000 and foreign taxes paid of $32,000.
| INFORMATION ON PROXY VOTING POLICIES, PROCEDURES, AND RECORDS |
A description of the policies and procedures used by T. Rowe Price funds and portfolios to determine how to vote proxies relating to portfolio securities is available in each fund’s Statement of Additional Information, which you may request by calling 1-800-225-5132 or by accessing the SEC’s website, sec.gov. The description of our proxy voting policies and procedures is also available on our website, troweprice.com. To access it, click on the words “Our Company” at the top of our corporate homepage. Then, when the next page appears, click on the words “Proxy Voting Policies” on the left side of the page.
Each fund’s most recent annual proxy voting record is available on our website and through the SEC’s website. To access it through our website, follow the directions above, then click on the words “Proxy Voting Records” on the right side of the Proxy Voting Policies page.
| HOW TO OBTAIN QUARTERLY PORTFOLIO HOLDINGS |
The fund files a complete schedule of portfolio holdings with the Securities and Exchange Commission for the first and third quarters of each fiscal year on Form N-Q. The fund’s Form N-Q is available electronically on the SEC’s website (sec.gov); hard copies may be reviewed and copied at the SEC’s Public Reference Room, 450 Fifth St. N.W., Washington, DC 20549. For more information on the Public Reference Room, call 1-800-SEC-0330.
| ABOUT THE FUND’S DIRECTORS AND OFFICERS |
Your fund is overseen by a Board of Directors (Board) that meets regularly to review a wide variety of matters affecting the fund, including performance, investment programs, compliance matters, advisory fees and expenses, service providers, and other business affairs. The Board elects the fund’s officers, who are listed in the final table. At least 75% of the Board’s members are independent of T. Rowe Price Associates, Inc. (T. Rowe Price), and T. Rowe Price International Ltd (T. Rowe Price International); “inside” or “interested” directors are employees or officers of T. Rowe Price. The business address of each director and officer is 100 East Pratt Street, Baltimore, Maryland 21202. The Statement of Additional Information includes additional information about the fund directors and is available without charge by calling a T. Rowe Price representative at 1-800-225-5132.
| Independent Directors | |
| |
| Name | |
| (Year of Birth) | Principal Occupation(s) and Directorships of Public Companies and |
| Year Elected* | Other Investment Companies During the Past Five Years |
| | |
| William R. Brody, M.D., | President and Trustee, Salk Institute for Biological Studies (2009 |
| Ph.D. | to present); Director, Novartis, Inc. (2009 to present); Director, IBM |
| (1944) | (2007 to present); President and Trustee, Johns Hopkins University |
| 2009 | (1996 to 2009); Chairman of Executive Committee and Trustee, |
| | Johns Hopkins Health System (1996 to 2009); Director, Medtronic, |
| | Inc. (1998 to 2007); Director, Mercantile Bankshares (1997 to 2007) |
| | |
| Jeremiah E. Casey | Director, National Life Insurance (2001 to 2005); Director, NLV |
| (1940) | Financial Corporation (2004 to 2005) |
| 2008 | |
| | |
| Anthony W. Deering | Chairman, Exeter Capital, LLC, a private investment firm (2004 |
| (1945) | to present); Director, Under Armour (2008 to present); Director, |
| 2008 | Vornado Real Estate Investment Trust (2004 to present); Director, |
| | Mercantile Bankshares (2002 to 2007); Member, Advisory Board, |
| | Deutsche Bank North America (2004 to present) |
| | |
| Donald W. Dick, Jr. | Principal, EuroCapital Partners, LLC, an acquisition and management |
| (1943) | advisory firm (1995 to present) |
| 2008 | |
| | |
| Karen N. Horn | Senior Managing Director, Brock Capital Group, an advisory and |
| (1943) | investment banking firm (2004 to present); Director, Eli Lilly and |
| 2008 | Company (1987 to present); Director, Simon Property Group (2004 |
| | to present); Director, Norfolk Southern (2008 to present); Director, |
| | Fannie Mae (2006 to 2008); Director, Georgia Pacific (2004 to 2005) |
| | |
| Theo C. Rodgers | President, A&R Development Corporation (1977 to present) |
| (1941) | |
| 2008 | |
| | |
| John G. Schreiber | Owner/President, Centaur Capital Partners, Inc., a real estate |
| (1946) | investment company (1991 to present); Cofounder and Partner, |
| 2008 | Blackstone Real Estate Advisors, L.P. (1992 to present) |
| | |
| Mark R. Tercek | President and Chief Executive Officer, The Nature Conservancy |
| (1957) | (2008 to present); Managing Director, The Goldman Sachs |
| 2009 | Group, Inc. (1984 to 2008) |
| |
| *Each independent director oversees 128 T. Rowe Price portfolios and serves until retirement, |
| resignation, or election of a successor. |
| Inside Directors | |
| |
| Name | |
| (Year of Birth) | |
| Year Elected* | |
| [Number of T. Rowe Price | Principal Occupation(s) and Directorships of Public Companies and |
| Portfolios Overseen] | Other Investment Companies During the Past Five Years |
| | |
| Edward C. Bernard | Director and Vice President, T. Rowe Price; Vice Chairman of the |
| (1956) | Board, Director, and Vice President, T. Rowe Price Group, Inc.; |
| 2008 | Chairman of the Board, Director, and President, T. Rowe Price |
| [128] | Investment Services, Inc.; Chairman of the Board and Director, |
| | T. Rowe Price Retirement Plan Services, Inc., T. Rowe Price Savings |
| | Bank, and T. Rowe Price Services, Inc.; Director and Chief Executive |
| | Officer, T. Rowe Price International; Chief Executive Officer, |
| | Chairman of the Board, Director, and President, T. Rowe Price Trust |
| | Company; Chairman of the Board, all funds |
| | |
| Brian C. Rogers, CFA, CIC | Chief Investment Officer, Director, and Vice President, T. Rowe Price; |
| (1955) | Chairman of the Board, Chief Investment Officer, Director, and Vice |
| 2008 | President, T. Rowe Price Group, Inc.; Vice President, T. Rowe Price |
| [73] | Trust Company |
| |
| *Each inside director serves until retirement, resignation, or election of a successor. |
| Officers | |
| |
| Name (Year of Birth) | |
| Position Held With Global Real Estate Fund | Principal Occupation(s) |
| | |
| Richard N. Clattenburg, CFA (1979) | Vice President, T. Rowe Price and T. Rowe Price |
| Vice President | Group, Inc. |
| | |
| Roger L. Fiery III, CPA (1959) | Vice President, Price Hong Kong, Price |
| Vice President | Singapore, T. Rowe Price, T. Rowe Price Group, |
| | Inc., T. Rowe Price International, and T. Rowe |
| | Price Trust Company |
| | |
| John R. Gilner (1961) | Chief Compliance Officer and Vice President, |
| Chief Compliance Officer | T. Rowe Price; Vice President, T. Rowe Price |
| | Group, Inc., and T. Rowe Price Investment |
| | Services, Inc. |
| | |
| Gregory S. Golczewski (1966) | Vice President, T. Rowe Price and T. Rowe Price |
| Vice President | Trust Company |
| | |
| Gregory K. Hinkle, CPA (1958) | Vice President, T. Rowe Price, T. Rowe Price |
| Treasurer | Group, Inc., and T. Rowe Price Trust Company; |
| | formerly Partner, PricewaterhouseCoopers LLP |
| | (to 2007) |
| | |
| Nina P. Jones, CPA (1980) | Vice President, T. Rowe Price; formerly intern, |
| Vice President | T. Rowe Price (summer 2007); Senior Associate |
| | KPMG LLP; student, Columbia Business School |
| | |
| Yoichiro Kai (1973) | Vice President, T. Rowe Price Group, Inc.; |
| Vice President | formerly Japanese Financial/Real Estate Sector |
| | Analyst/Portfolio Manager, Citadel Investment |
| | Group, Asia Limited (to 2009); Research |
| | Analyst, Japanese Equities & Sector Fund |
| | Portfolio Manager, Fidelity Investments Japan |
| | Limited (to 2007) |
| | |
| Michael M. Lasota (1982) | Vice President, T. Rowe Price; formerly student, |
| Vice President | University of Chicago, Graduate School of |
| | Business (to 2008); associate, The Boston |
| | Consulting Group (to 2006) |
| | |
| David M. Lee, CFA (1962) | Vice President, T. Rowe Price and T. Rowe Price |
| President | Group, Inc. |
| | |
| Patricia B. Lippert (1953) | Assistant Vice President, T. Rowe Price and |
| Secretary | T. Rowe Price Investment Services, Inc. |
| | |
| Robert J. Marcotte (1962) | Vice President, T. Rowe Price and T. Rowe Price |
| Vice President | Group, Inc. |
| | |
| Raymond A. Mills, Ph.D., CFA (1960) | Vice President, T. Rowe Price, T. Rowe Price |
| Vice President | Group, Inc., T. Rowe Price International, and |
| | T. Rowe Price Trust Company |
| | |
| Eric C. Moffett (1974) | Vice President, Price Hong Kong and T. Rowe |
| Vice President | Price Group, Inc.; formerly Analyst, Fayez |
| | Sarofim & Company (to 2007) |
| | |
| Philip A. Nestico (1976) | Vice President, T. Rowe Price and T. Rowe Price |
| Vice President | Group, Inc. |
| | |
| David Oestreicher (1967) | Director and Vice President, T. Rowe Price |
| Vice President | Investment Services, Inc., T. Rowe Price Trust |
| | Company, and T. Rowe Price Services, Inc.; |
| | Vice President, Price Hong Kong, Price Singapore, |
| | T. Rowe Price, T. Rowe Price Group, Inc., |
| | T. Rowe Price International, and T. Rowe Price |
| | Retirement Plan Services, Inc. |
| | |
| Deborah D. Seidel (1962) | Vice President, T. Rowe Price, T. Rowe Price |
| Vice President | Group, Inc., and T. Rowe Price Investment |
| | Services, Inc.; Vice President and Assistant |
| | Treasurer, T. Rowe Price Services, Inc. |
| | |
| Julie L. Waples (1970) | Vice President, T. Rowe Price |
| Vice President | |
| | |
| Marta Yago (1977) | Vice President, T. Rowe Price Group, Inc., and |
| Vice President | T. Rowe Price International; formerly student, |
| | Columbia Business School (to 2007); |
| | Senior Associate, Fixed Income Division, |
| | Citigroup Investment Banking (to 2005) |
| |
| Unless otherwise noted, officers have been employees of T. Rowe Price or T. Rowe Price International |
| for at least 5 years. | |
Item 2. Code of Ethics.
The registrant has adopted a code of ethics, as defined in Item 2 of Form N-CSR, applicable to its principal executive officer, principal financial officer, principal accounting officer or controller, or persons performing similar functions. A copy of this code of ethics is filed as an exhibit to this Form N-CSR. No substantive amendments were approved or waivers were granted to this code of ethics during the period covered by this report.
Item 3. Audit Committee Financial Expert.
The registrant’s Board of Directors/Trustees has determined that Mr. Anthony W. Deering qualifies as an audit committee financial expert, as defined in Item 3 of Form N-CSR. Mr. Deering is considered independent for purposes of Item 3 of Form N-CSR.
Item 4. Principal Accountant Fees and Services.
(a) – (d) Aggregate fees billed to the registrant for the last two fiscal years for professional services rendered by the registrant’s principal accountant were as follows:
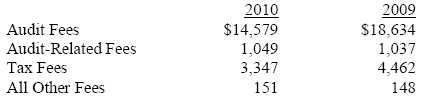
Audit fees include amounts related to the audit of the registrant’s annual financial statements and services normally provided by the accountant in connection with statutory and regulatory filings. Audit-related fees include amounts reasonably related to the performance of the audit of the registrant’s financial statements and specifically include the issuance of a report on internal controls and, if applicable, agreed-upon procedures related to fund acquisitions. Tax fees include amounts related to services for tax compliance, tax planning, and tax advice. The nature of these services specifically includes the review of distribution calculations and the preparation of Federal, state, and excise tax returns. All other fees include the registrant’s pro-rata share of amounts for agreed-upon procedures in conjunction with service contract approvals by the registrant’s Board of Directors/Trustees.
(e)(1) The registrant’s audit committee has adopted a policy whereby audit and non-audit services performed by the registrant’s principal accountant for the registrant, its investment adviser, and any entity controlling, controlled by, or under common control with the investment adviser that provides ongoing services to the registrant require pre-approval in advance at regularly scheduled audit committee meetings. If such a service is required between regularly scheduled audit committee meetings, pre-approval may be authorized by one audit committee member with ratification at the next scheduled audit committee meeting. Waiver of pre-approval for audit or non-audit services requiring fees of a de minimis amount is not permitted.
(2) No services included in (b) – (d) above were approved pursuant to paragraph (c)(7)(i)(C) of Rule 2-01 of Regulation S-X.
(f) Less than 50 percent of the hours expended on the principal accountant’s engagement to audit the registrant’s financial statements for the most recent fiscal year were attributed to work performed by persons other than the principal accountant’s full-time, permanent employees.
(g) The aggregate fees billed for the most recent fiscal year and the preceding fiscal year by the registrant’s principal accountant for non-audit services rendered to the registrant, its investment adviser, and any entity controlling, controlled by, or under common control with the investment adviser that provides ongoing services to the registrant were $1,417,000 and $1,879,000, respectively.
(h) All non-audit services rendered in (g) above were pre-approved by the registrant’s audit committee. Accordingly, these services were considered by the registrant’s audit committee in maintaining the principal accountant’s independence.
Item 5. Audit Committee of Listed Registrants.
Not applicable.
Item 6. Investments.
(a) Not applicable. The complete schedule of investments is included in Item 1 of this Form N-CSR.
(b) Not applicable.
Item 7. Disclosure of Proxy Voting Policies and Procedures for Closed-End Management Investment Companies.
Not applicable.
Item 8. Portfolio Managers of Closed-End Management Investment Companies.
Not applicable.
Item 9. Purchases of Equity Securities by Closed-End Management Investment Company and Affiliated Purchasers.
Not applicable.
Item 10. Submission of Matters to a Vote of Security Holders.
Not applicable.
Item 11. Controls and Procedures.
(a) The registrant’s principal executive officer and principal financial officer have evaluated the registrant’s disclosure controls and procedures within 90 days of this filing and have concluded that the registrant’s disclosure controls and procedures were effective, as of that date, in ensuring that information required to be disclosed by the registrant in this Form N-CSR was recorded, processed, summarized, and reported timely.
(b) The registrant’s principal executive officer and principal financial officer are aware of no change in the registrant’s internal control over financial reporting that occurred during the registrant’s second fiscal quarter covered by this report that has materially affected, or is reasonably likely to materially affect, the registrant’s internal control over financial reporting.
Item 12. Exhibits.
(a)(1) The registrant’s code of ethics pursuant to Item 2 of Form N-CSR is attached.
(2) Separate certifications by the registrant's principal executive officer and principal financial officer, pursuant to Section 302 of the Sarbanes-Oxley Act of 2002 and required by Rule 30a-2(a) under the Investment Company Act of 1940, are attached.
(3) Written solicitation to repurchase securities issued by closed-end companies: not applicable.
(b) A certification by the registrant's principal executive officer and principal financial officer, pursuant to Section 906 of the Sarbanes-Oxley Act of 2002 and required by Rule 30a-2(b) under the Investment Company Act of 1940, is attached.
| | |
SIGNATURES |
| |
| | Pursuant to the requirements of the Securities Exchange Act of 1934 and the Investment |
| Company Act of 1940, the registrant has duly caused this report to be signed on its behalf by the |
| undersigned, thereunto duly authorized. |
| |
| T. Rowe Price Global Real Estate Fund, Inc. |
| |
| |
| |
| By | /s/ Edward C. Bernard |
| | Edward C. Bernard |
| | Principal Executive Officer |
| |
| Date | February 17, 2011 |
| |
| |
| |
| | Pursuant to the requirements of the Securities Exchange Act of 1934 and the Investment |
| Company Act of 1940, this report has been signed below by the following persons on behalf of |
| the registrant and in the capacities and on the dates indicated. |
| |
| |
| By | /s/ Edward C. Bernard |
| | Edward C. Bernard |
| | Principal Executive Officer |
| |
| Date | February 17, 2011 |
| |
| |
| |
| By | /s/ Gregory K. Hinkle |
| | Gregory K. Hinkle |
| | Principal Financial Officer |
| |
| Date | February 17, 2011 |