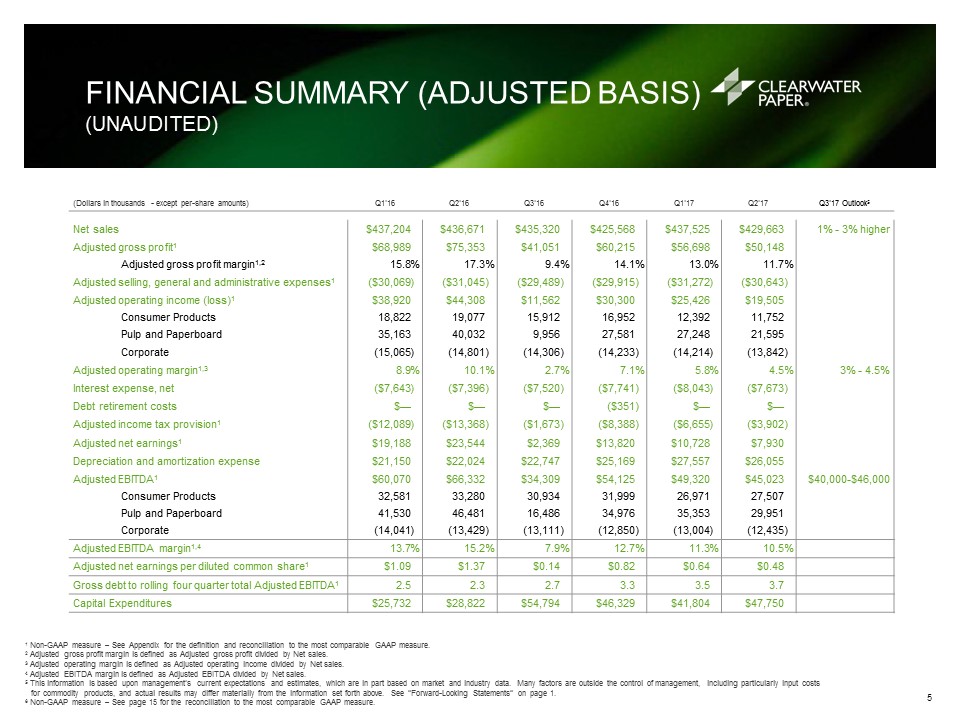
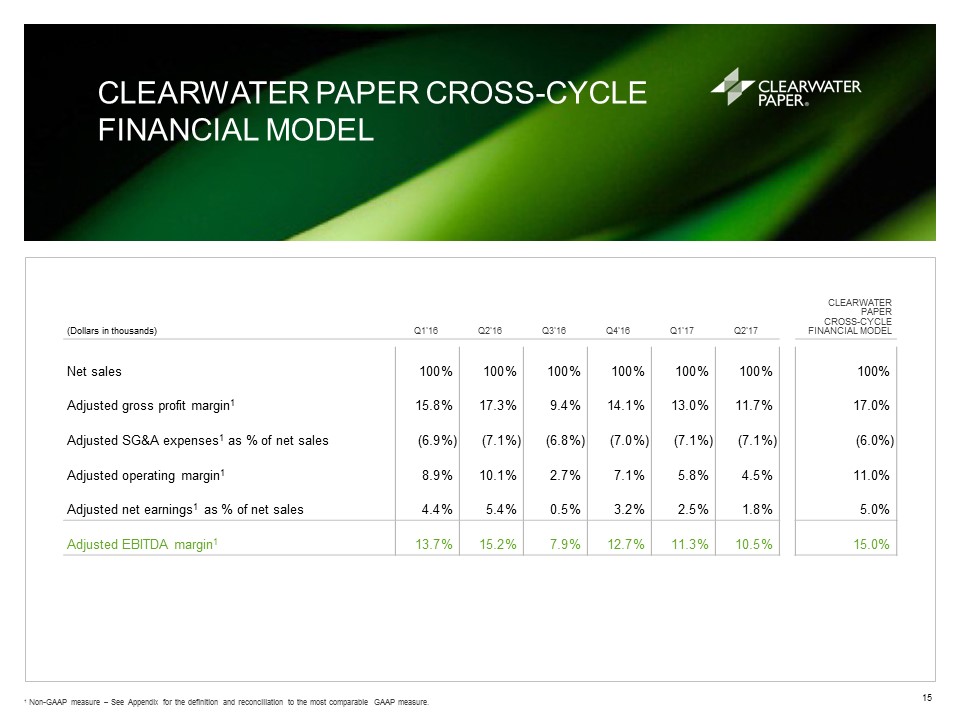
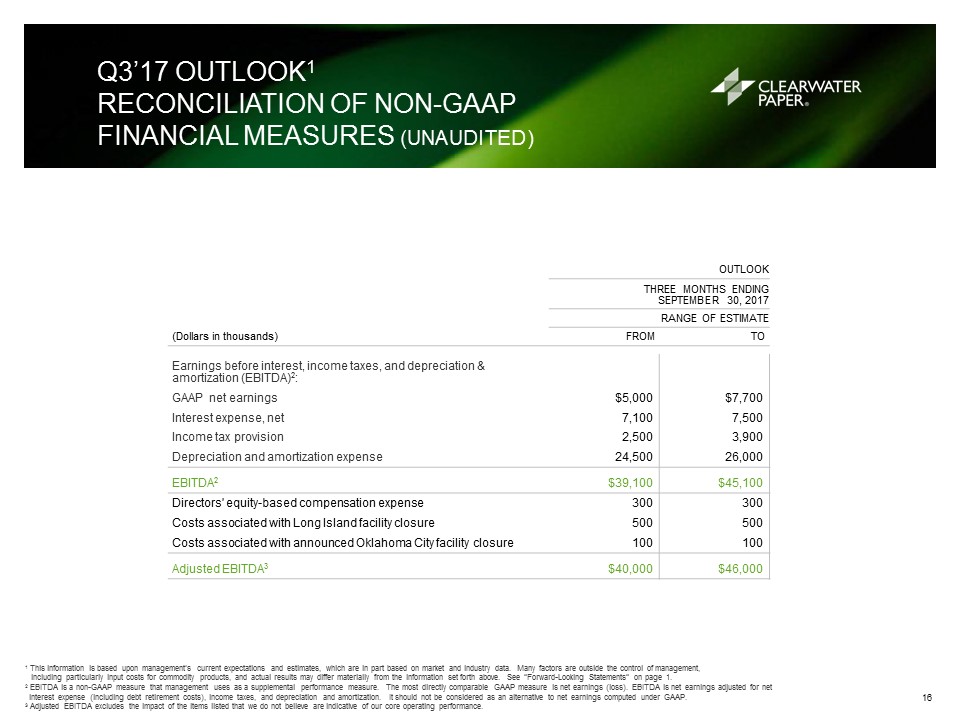
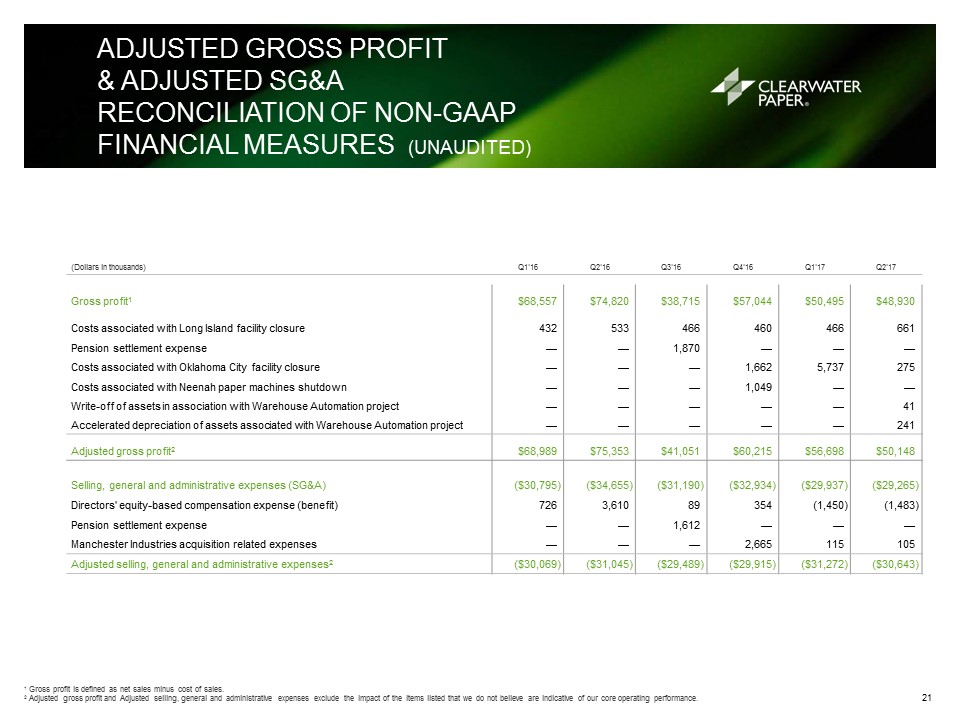
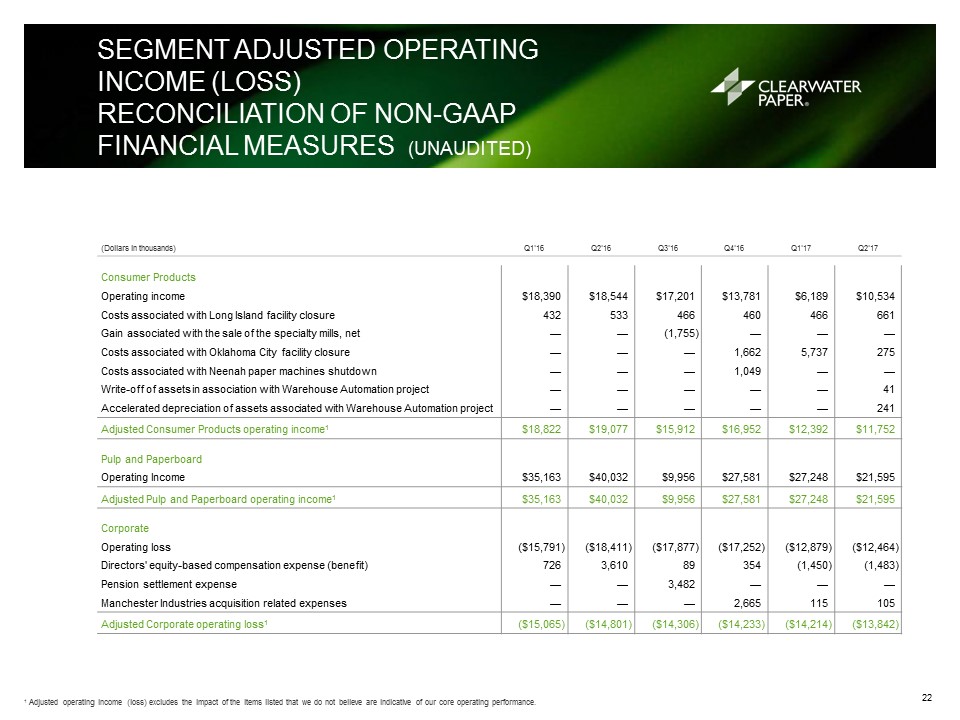
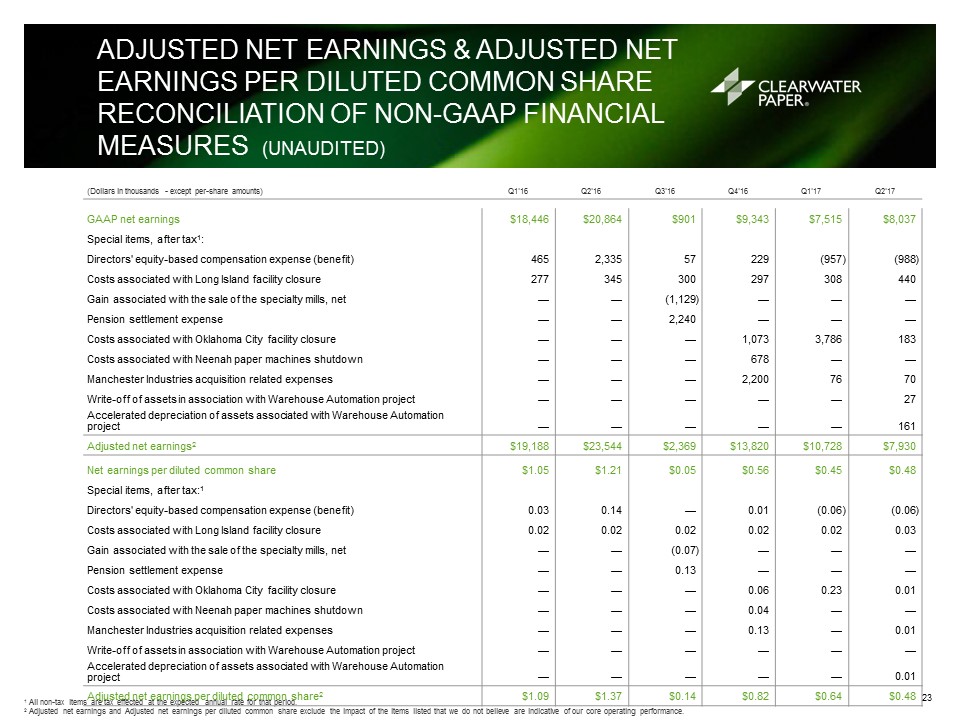
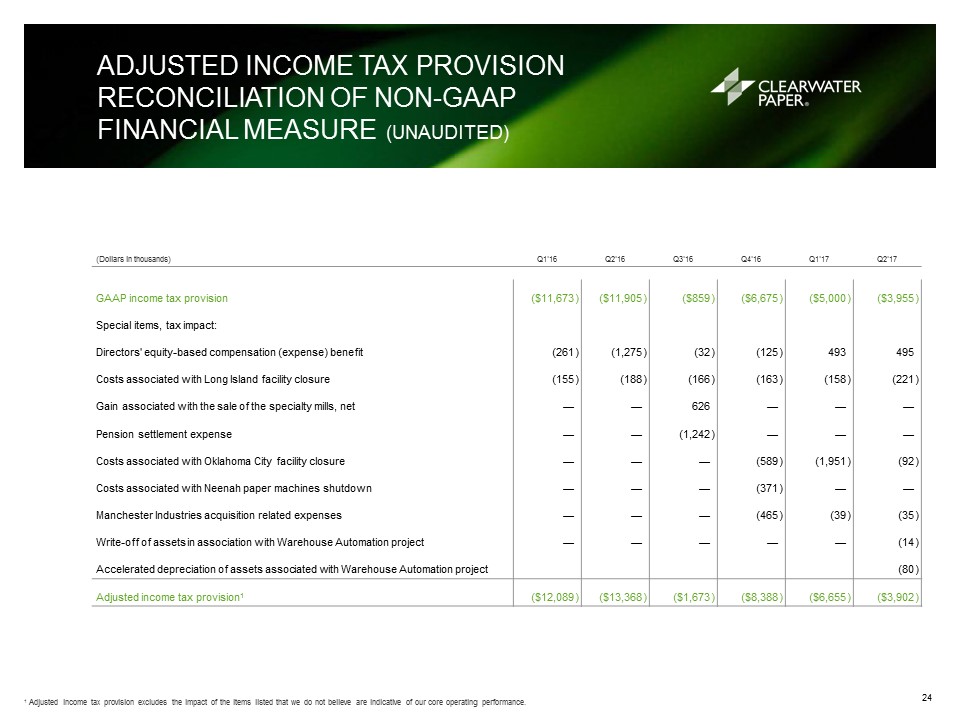
FINANCIAL SUMMARY (ADJUSTED BASIS)(UNAUDITED) 1 Non-GAAP measure – See Appendix for the definition and reconciliation to the most comparable GAAP measure.2 Adjusted gross profit margin is defined as Adjusted gross profit divided by Net sales.3 Adjusted operating margin is defined as Adjusted operating income divided by Net sales.4 Adjusted EBITDA margin is defined as Adjusted EBITDA divided by Net sales.5 This information is based upon management’s current expectations and estimates, which are in part based on market and industry data. Many factors are outside the control of management, including particularly input costs for commodity products, and actual results may differ materially from the information set forth above. See “Forward-Looking Statements” on page 1.6 Non-GAAP measure – See page 15 for the reconciliation to the most comparable GAAP measure... (Dollars in thousands - except per-share amounts) Q1'16 Q2'16 Q3'16 Q4'16 Q1'17 Q2'17 Q3'17 Outlook5 Net sales $437,204 $436,671 $435,320 $425,568 $437,525 $429,663 1% - 3% higher Adjusted gross profit1 $68,989 $75,353 $41,051 $60,215 $56,698 $50,148 Adjusted gross profit margin1,2 15.8 % 17.3 % 9.4 % 14.1 % 13.0 % 11.7 % Adjusted selling, general and administrative expenses1 ($30,069 ) ($31,045 ) ($29,489 ) ($29,915 ) ($31,272 ) ($30,643 ) Adjusted operating income (loss)1 $38,920 $44,308 $11,562 $30,300 $25,426 $19,505 Consumer Products 18,822 19,077 15,912 16,952 12,392 11,752 Pulp and Paperboard 35,163 40,032 9,956 27,581 27,248 21,595 Corporate (15,065 ) (14,801 ) (14,306 ) (14,233 ) (14,214 ) (13,842 ) Adjusted operating margin1,3 8.9 % 10.1 % 2.7 % 7.1 % 5.8 % 4.5 % 3% - 4.5% Interest expense, net ($7,643 ) ($7,396 ) ($7,520 ) ($7,741 ) ($8,043 ) ($7,673 ) Debt retirement costs $— $— $— ($351 ) $— $— Adjusted income tax provision1 ($12,089 ) ($13,368 ) ($1,673 ) ($8,388 ) ($6,655 ) ($3,902 ) Adjusted net earnings1 $19,188 $23,544 $2,369 $13,820 $10,728 $7,930 Depreciation and amortization expense $21,150 $22,024 $22,747 $25,169 $27,557 $26,055 Adjusted EBITDA1 $60,070 $66,332 $34,309 $54,125 $49,320 $45,023 $40,000-$46,000 Consumer Products 32,581 33,280 30,934 31,999 26,971 27,507 Pulp and Paperboard 41,530 46,481 16,486 34,976 35,353 29,951 Corporate (14,041 ) (13,429 ) (13,111 ) (12,850 ) (13,004 ) (12,435 ) Adjusted EBITDA margin1,4 13.7 % 15.2 % 7.9 % 12.7 % 11.3 % 10.5 % Adjusted net earnings per diluted common share1 $1.09 $1.37 $0.14 $0.82 $0.64 $0.48 Gross debt to rolling four quarter total Adjusted EBITDA1 2.5 2.3 2.7 3.3 3.5 3.7 Capital Expenditures $25,732 $28,822 $54,794 $46,329 $41,804 $47,750 5