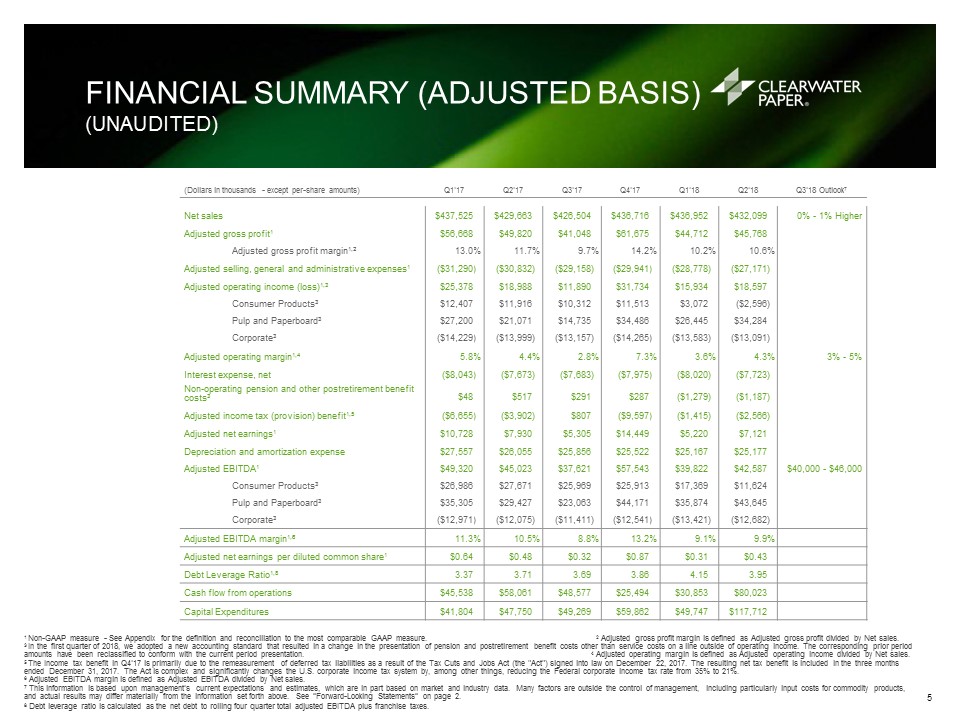
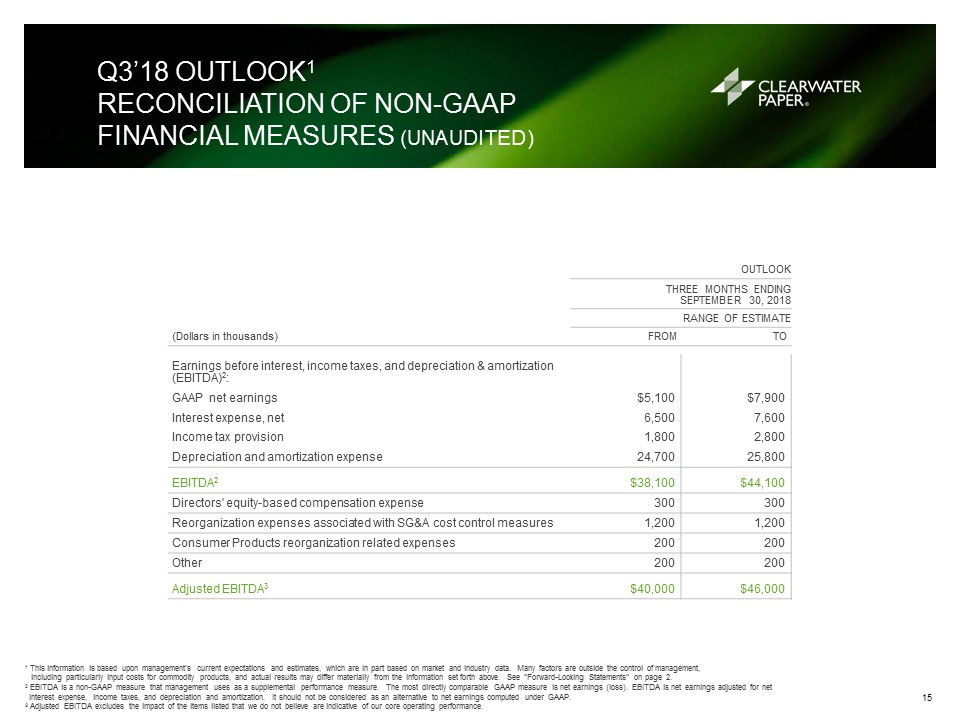
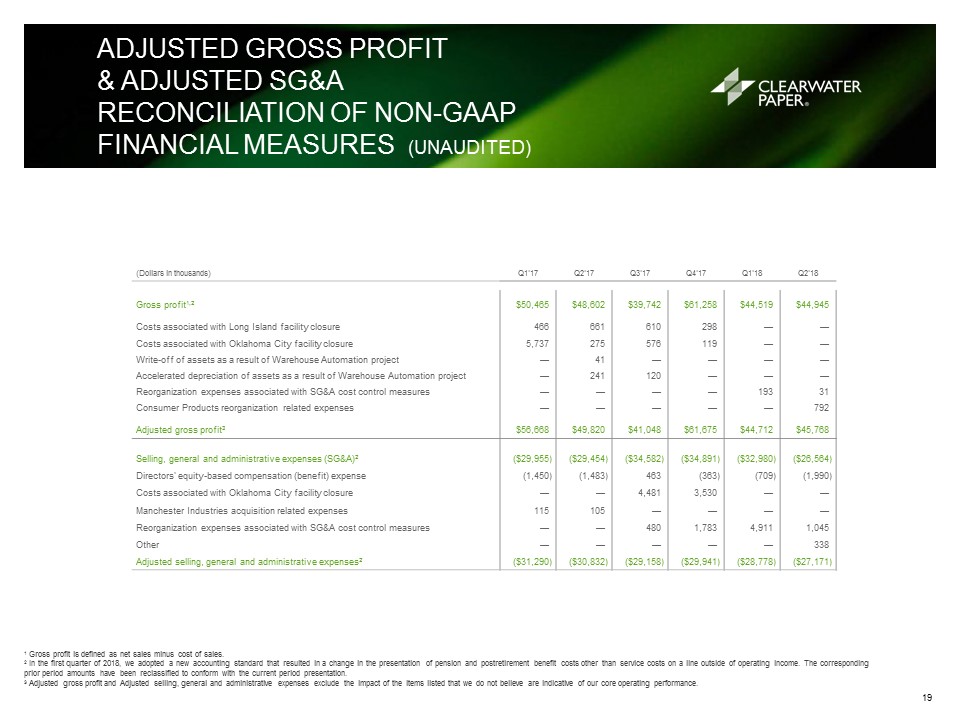
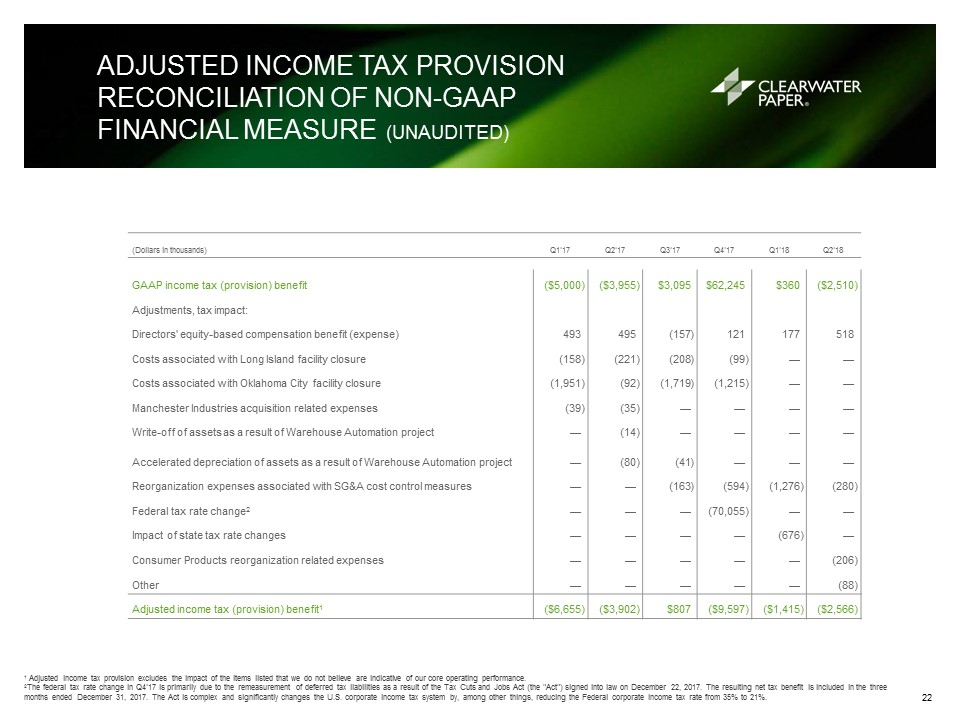
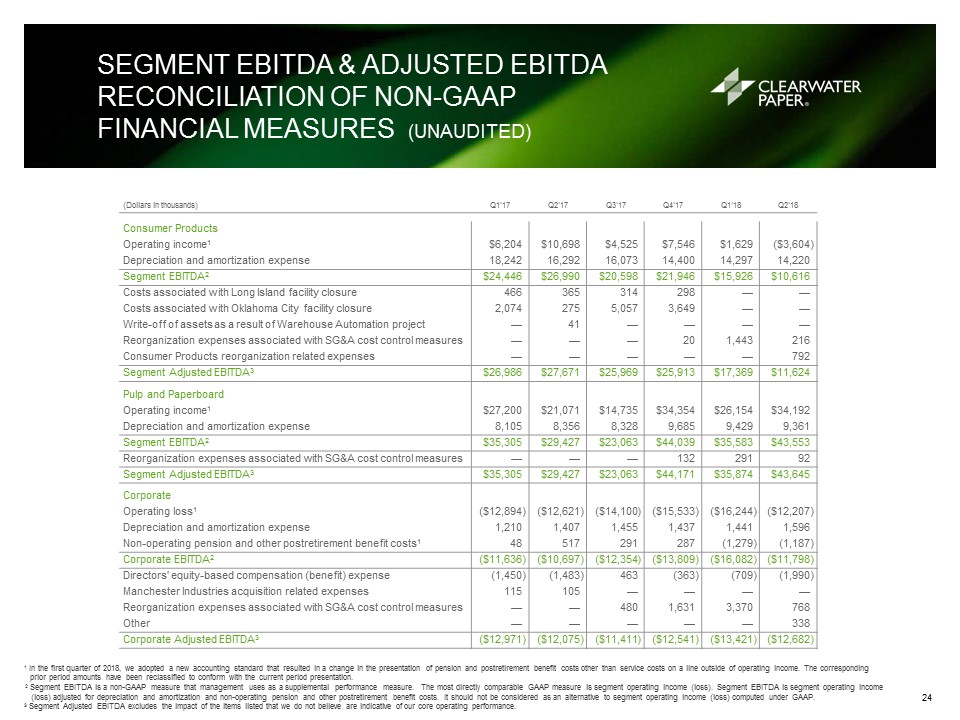
FINANCIAL SUMMARY (ADJUSTED BASIS)(UNAUDITED) 1 Non-GAAP measure - See Appendix for the definition and reconciliation to the most comparable GAAP measure. 2 Adjusted gross profit margin is defined as Adjusted gross profit divided by Net sales.3 In the first quarter of 2018, we adopted a new accounting standard that resulted in a change in the presentation of pension and postretirement benefit costs other than service costs on a line outside of operating income. The corresponding prior period amounts have been reclassified to conform with the current period presentation. 4 Adjusted operating margin is defined as Adjusted operating income divided by Net sales.5 The Income tax benefit in Q4'17 is primarily due to the remeasurement of deferred tax liabilities as a result of the Tax Cuts and Jobs Act (the "Act") signed into law on December 22, 2017. The resulting net tax benefit is included in the three months ended December 31, 2017. The Act is complex and significantly changes the U.S. corporate income tax system by, among other things, reducing the Federal corporate income tax rate from 35% to 21%.6 Adjusted EBITDA margin is defined as Adjusted EBITDA divided by Net sales.7 This information is based upon management’s current expectations and estimates, which are in part based on market and industry data. Many factors are outside the control of management, including particularly input costs for commodity products, and actual results may differ materially from the information set forth above. See “Forward-Looking Statements” on page 2.8 Debt leverage ratio is calculated as the net debt to rolling four quarter total adjusted EBITDA plus franchise taxes. (Dollars in thousands - except per-share amounts) Q1'17 Q2'17 Q3'17 Q4'17 Q1'18 Q2'18 Q3'18 Outlook7 Net sales $437,525 $429,663 $426,504 $436,716 $436,952 $432,099 0% - 1% Higher Adjusted gross profit1 $56,668 $49,820 $41,048 $61,675 $44,712 $45,768 Adjusted gross profit margin1,2 13.0 % 11.7 % 9.7 % 14.2 % 10.2 % 10.6 % Adjusted selling, general and administrative expenses1 ($31,290 ) ($30,832 ) ($29,158 ) ($29,941 ) ($28,778 ) ($27,171 ) Adjusted operating income (loss)1,3 $25,378 $18,988 $11,890 $31,734 $15,934 $18,597 Consumer Products3 $12,407 $11,916 $10,312 $11,513 $3,072 ($2,596 ) Pulp and Paperboard3 $27,200 $21,071 $14,735 $34,486 $26,445 $34,284 Corporate3 ($14,229 ) ($13,999 ) ($13,157 ) ($14,265 ) ($13,583 ) ($13,091 ) Adjusted operating margin1,4 5.8 % 4.4 % 2.8 % 7.3 % 3.6 % 4.3 % 3% - 5% Interest expense, net ($8,043 ) ($7,673 ) ($7,683 ) ($7,975 ) ($8,020 ) ($7,723 ) Non-operating pension and other postretirement benefit costs3 $48 $517 $291 $287 ($1,279 ) ($1,187 ) Adjusted income tax (provision) benefit1,5 ($6,655 ) ($3,902 ) $807 ($9,597 ) ($1,415 ) ($2,566 ) Adjusted net earnings1 $10,728 $7,930 $5,305 $14,449 $5,220 $7,121 Depreciation and amortization expense $27,557 $26,055 $25,856 $25,522 $25,167 $25,177 Adjusted EBITDA1 $49,320 $45,023 $37,621 $57,543 $39,822 $42,587 $40,000 - $46,000 Consumer Products3 $26,986 $27,671 $25,969 $25,913 $17,369 $11,624 Pulp and Paperboard3 $35,305 $29,427 $23,063 $44,171 $35,874 $43,645 Corporate3 ($12,971 ) ($12,075 ) ($11,411 ) ($12,541 ) ($13,421 ) ($12,682 ) Adjusted EBITDA margin1,6 11.3 % 10.5 % 8.8 % 13.2 % 9.1 % 9.9 % Adjusted net earnings per diluted common share1 $0.64 $0.48 $0.32 $0.87 $0.31 $0.43 Debt Leverage Ratio1,8 3.37 3.71 3.69 3.86 4.15 3.95 Cash flow from operations $45,538 $58,061 $48,577 $25,494 $30,853 $80,023 Capital Expenditures $41,804 $47,750 $49,269 $59,862 $49,747 $117,712 5