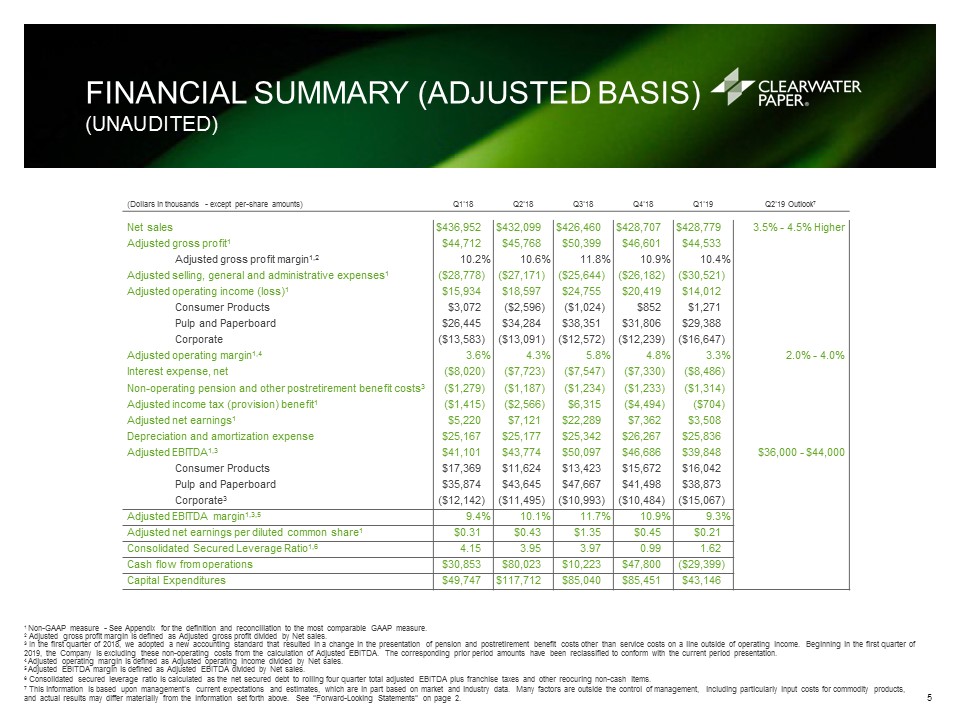
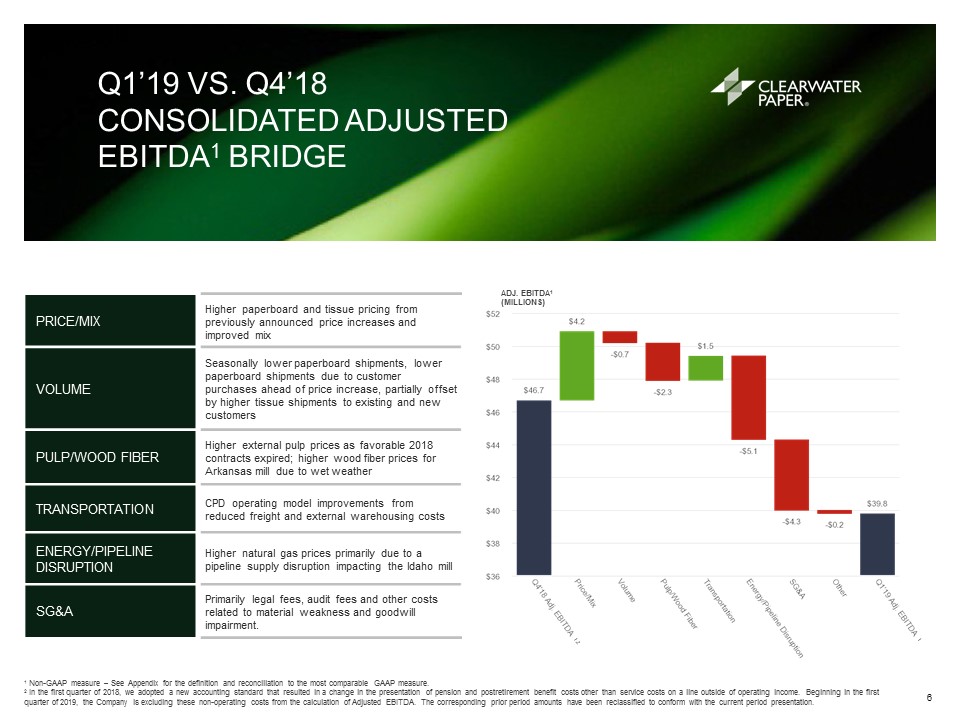
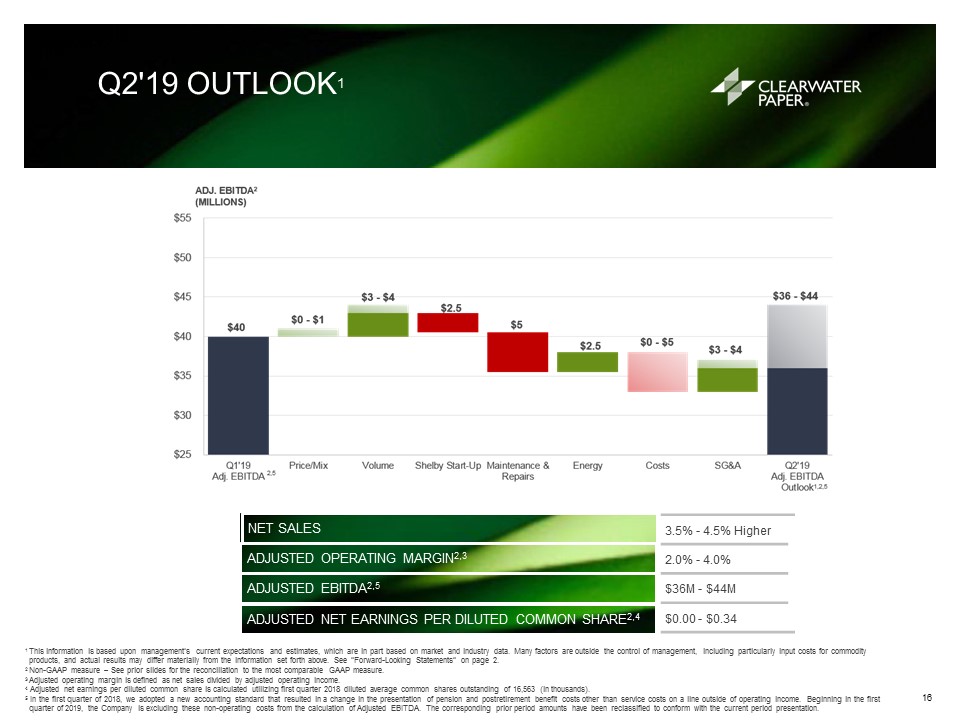
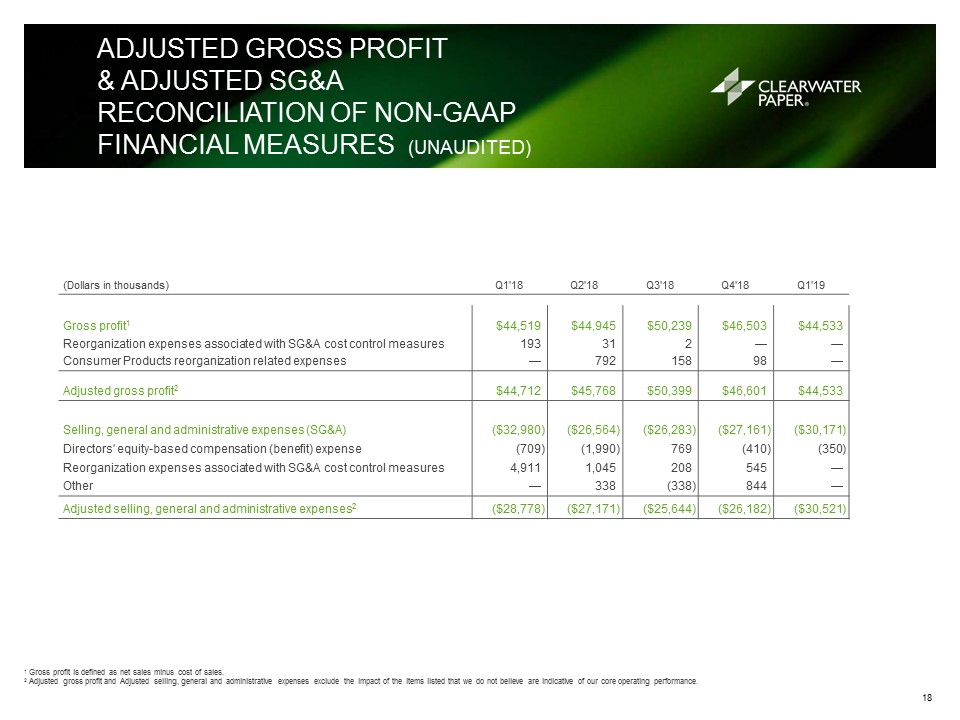
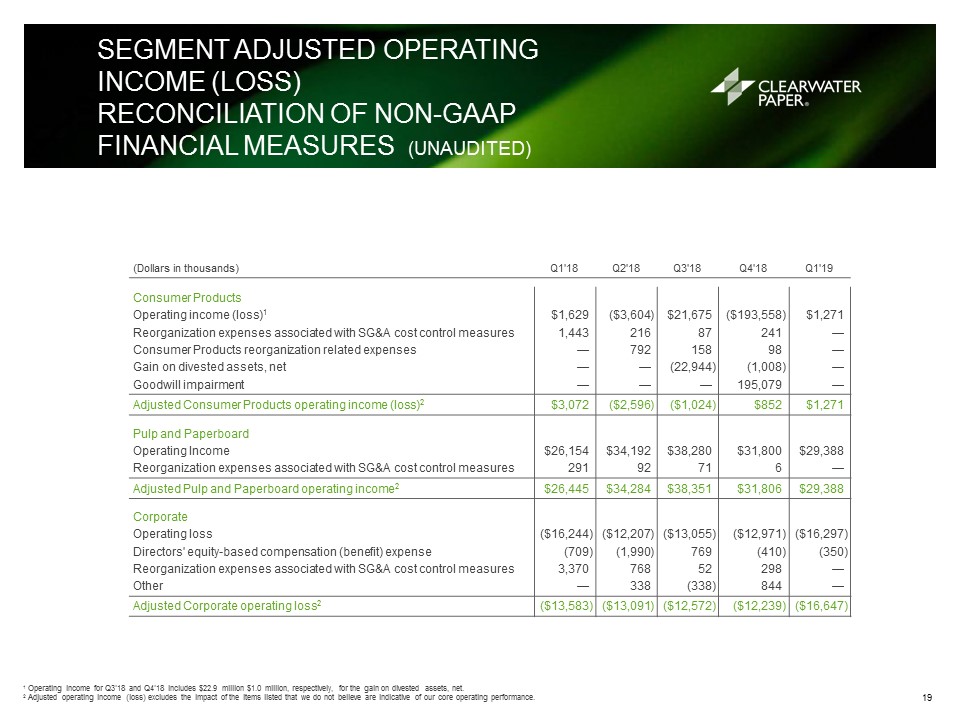
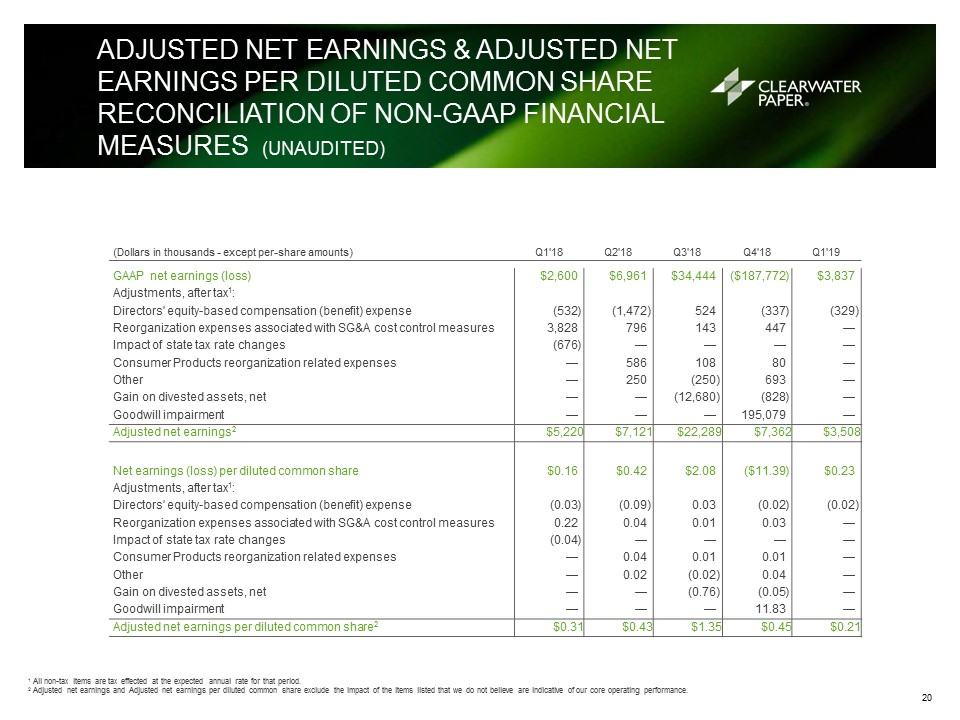
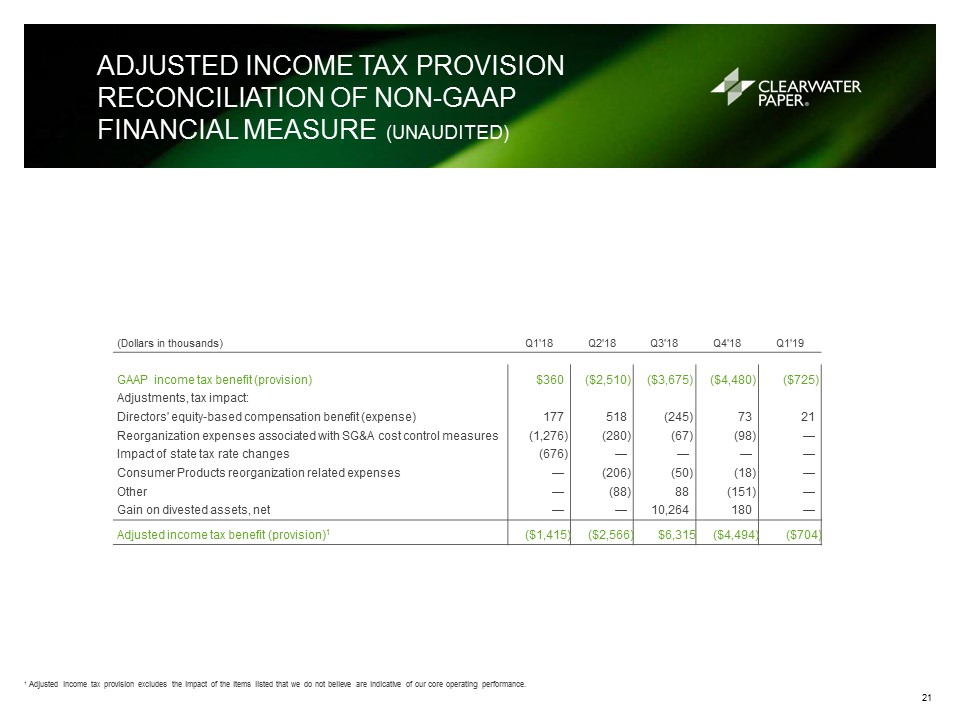
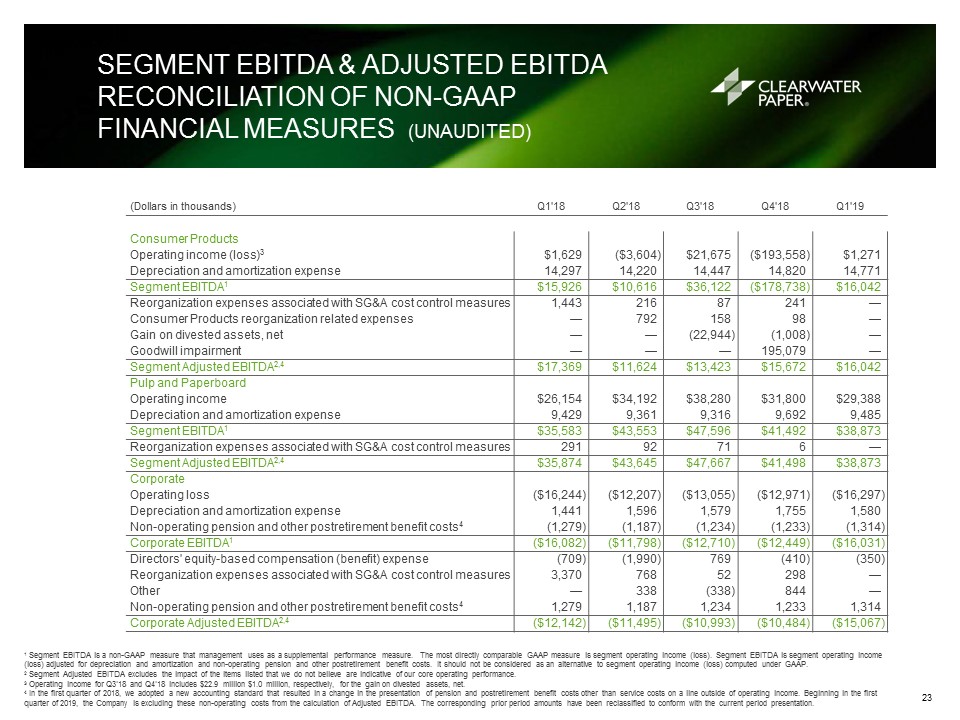
FINANCIAL SUMMARY (ADJUSTED BASIS)(UNAUDITED) 1 Non-GAAP measure - See Appendix for the definition and reconciliation to the most comparable GAAP measure. 2 Adjusted gross profit margin is defined as Adjusted gross profit divided by Net sales.3 In the first quarter of 2018, we adopted a new accounting standard that resulted in a change in the presentation of pension and postretirement benefit costs other than service costs on a line outside of operating income. Beginning in the first quarter of 2019, the Company is excluding these non-operating costs from the calculation of Adjusted EBITDA. The corresponding prior period amounts have been reclassified to conform with the current period presentation. 4 Adjusted operating margin is defined as Adjusted operating income divided by Net sales.5 Adjusted EBITDA margin is defined as Adjusted EBITDA divided by Net sales.6 Consolidated secured leverage ratio is calculated as the net secured debt to rolling four quarter total adjusted EBITDA plus franchise taxes and other reocuring non-cash items.7 This information is based upon management’s current expectations and estimates, which are in part based on market and industry data. Many factors are outside the control of management, including particularly input costs for commodity products, and actual results may differ materially from the information set forth above. See “Forward-Looking Statements” on page 2. (Dollars in thousands - except per-share amounts) Q1'18 Q2'18 Q3'18 Q4'18 Q1'19 Q2'19 Outlook7 Net sales $436,952 $432,099 $426,460 $428,707 $428,779 3.5% - 4.5% Higher Adjusted gross profit1 $44,712 $45,768 $50,399 $46,601 $44,533 Adjusted gross profit margin1,2 10.2 % 10.6 % 11.8 % 10.9 % 10.4 % Adjusted selling, general and administrative expenses1 ($28,778 ) ($27,171 ) ($25,644 ) ($26,182 ) ($30,521 ) Adjusted operating income (loss)1 $15,934 $18,597 $24,755 $20,419 $14,012 Consumer Products $3,072 ($2,596 ) ($1,024 ) $852 $1,271 Pulp and Paperboard $26,445 $34,284 $38,351 $31,806 $29,388 Corporate ($13,583 ) ($13,091 ) ($12,572 ) ($12,239 ) ($16,647 ) Adjusted operating margin1,4 3.6 % 4.3 % 5.8 % 4.8 % 3.3 % 2.0% - 4.0% Interest expense, net ($8,020 ) ($7,723 ) ($7,547 ) ($7,330 ) ($8,486 ) Non-operating pension and other postretirement benefit costs3 ($1,279 ) ($1,187 ) ($1,234 ) ($1,233 ) ($1,314 ) Adjusted income tax (provision) benefit1 ($1,415 ) ($2,566 ) $6,315 ($4,494 ) ($704 ) Adjusted net earnings1 $5,220 $7,121 $22,289 $7,362 $3,508 Depreciation and amortization expense $25,167 $25,177 $25,342 $26,267 $25,836 Adjusted EBITDA1,3 $41,101 $43,774 $50,097 $46,686 $39,848 $36,000 - $44,000 Consumer Products $17,369 $11,624 $13,423 $15,672 $16,042 Pulp and Paperboard $35,874 $43,645 $47,667 $41,498 $38,873 Corporate3 ($12,142 ) ($11,495 ) ($10,993 ) ($10,484 ) ($15,067 ) Adjusted EBITDA margin1,3,5 9.4 % 10.1 % 11.7 % 10.9 % 9.3 % Adjusted net earnings per diluted common share1 $0.31 $0.43 $1.35 $0.45 $0.21 Consolidated Secured Leverage Ratio1,6 4.15 3.95 3.97 0.99 1.62 Cash flow from operations $30,853 $80,023 $10,223 $47,800 ($29,399 ) Capital Expenditures $49,747 $117,712 $85,040 $85,451 $43,146 5