Exhibit 99.2 |
![](https://capedge.com/proxy/8-K/0001157523-19-001639/a52021977ex99_2slide1.jpg)
CLEARWATER PAPER CORPORATIONSECOND QUARTER 2019SUPPLEMENTAL INFORMATION 07/31/19 LINDA MASSMANPRESIDENT, CHIEF EXECUTIVE OFFICER AND DIRECTORROBERT HRIVNAKSENIOR VICE PRESIDENT FINANCE AND CHIEF FINANCIAL OFFICER
![](https://capedge.com/proxy/8-K/0001157523-19-001639/a52021977ex99_2slide2.jpg)
FORWARD-LOOKING STATEMENTS This presentation of supplemental information contains, in addition to historical information, certain forward-looking statements within the meaning of the Private Securities Litigation Reform Act of 1995, including statements regarding the cost, production capacity and start-up and benefits of the Shelby, NC expansion and Lewiston, ID continuous digester; capital allocations; estimated Q3 2019 net earnings, EBITDA, adjusted EBITDA, operating income, adjusted operating income, adjusted net earnings, net earnings per diluted common share, adjusted net earnings per diluted common share, net sales and adjusted operating margin; Q3 2019 product pricing and sales mix, product volumes shipped, maintenance and repairs, costs and SG&A; major maintenance schedule; and input costs. These forward-looking statements are based on management’s current expectations, estimates, assumptions and projections that are subject to change. Our actual results of operations may differ materially from those expressed or implied by the forward-looking statements contained in this presentation. Important factors that could cause or contribute to such differences include the risks and uncertainties described from time to time in the company's public filings with the Securities and Exchange Commission, as well as the following: competitive pricing pressures for our products, including as a result of increased capacity as additional manufacturing facilities are operated by our competitors;the loss of, changes in prices in regard to, or reduction in, orders from a significant customer;changes in customer product preferences and competitors' product offerings;our ability to achieve full production at our new tissue manufacturing operations in Shelby, North Carolina on time and within current cost expectations;customer acceptance and timing and quantity of purchases of our tissue products, including the existence of sufficient demand for and the quality of tissue manufactured at our expanded Shelby, North Carolina operations upon full production;consolidation and vertical integration of converting operations in the paperboard industry;our ability to successfully implement our operational efficiencies and cost savings strategies, along with related capital projects, and achieve the expected operational or financial results of those projects, including from the continuous pulp digester at our Lewiston, Idaho facility;changes in the cost and availability of wood fiber and wood pulp;changes in transportation costs and disruptions in transportation services;labor disruptions;changes in the U.S. and international economies and in general economic conditions in the regions and industries in which we operate;manufacturing or operating disruptions, including IT system and IT system implementation failures, equipment malfunctions and damage to our manufacturing facilities;changes in costs for and availability of packaging supplies, chemicals, energy and maintenance and repairs;larger competitors having operational and other advantages;cyclical industry conditions;changes in expenses, required contributions and potential withdrawal costs associated with our pension plans;environmental liabilities or expenditures;cyber-security risks;reliance on a limited number of third-party suppliers for raw materials;our ability to attract, motivate, train and retain qualified and key personnel;material weaknesses in our internal control over financial reporting;our substantial indebtedness and ability to service our debt obligations;restrictions on our business from debt covenants and terms; andchanges in laws, regulations or industry standards affecting our business.Forward-looking statements contained in this presentation present management’s views only as of the date of this presentation. We undertake no obligation to publicly update forward-looking statements, to retract future revisions of management's views based on events or circumstances occurring after the date of this presentation. 2
![](https://capedge.com/proxy/8-K/0001157523-19-001639/a52021977ex99_2slide31.jpg)
SECOND QUARTER 2019BUSINESS HIGHLIGHTS 1 Non-GAAP measure – See Appendix for the definition and reconciliation to the most comparable GAAP measure. 3 FINANCIAL PERFORMANCE $429 Million net sales, flat vs. Q4'18 $14 Million GAAP operating income and 3.3% marginDiluted GAAP EPS of $0.23Solid operating results; $40 Million adjusted EBITDA,1,2 within our outlook range of $37 to $43 Million MARKETS & OPERATIONS CAPITAL ALLOCATION $452 million net sales, up 5% vs. Q1'19 $15 million GAAP operating income and 3.4% marginDiluted GAAP EPS of ($0.03) Solid operating results; $43.9 million adjusted EBITDA,1 at high end of our outlook range of $36 to $44 million Record paperboard shipments and sales New paper machine in Shelby, North Carolina ramping as planned and expected to reach its full production run rate in late 2020 $37 million of capital invested in Q2'19 and $108 million total year to datePost Quarter End: Refinanced existing revolving lines of credit ($400 million total commitments) with new $300 million term loan credit agreement (fully funded) and $250 million asset-based revolving credit agreement ($58 million drawn at closing under new revolver). This will provide us additional operational flexibility and liquidity as we focus on generating free cash flow to de-lever our balance sheet.
![](https://capedge.com/proxy/8-K/0001157523-19-001639/a52021977ex99_2slide4.jpg)
CLEARWATER PAPER SEQUENTIAL QUARTER RESULTS 1 Non-GAAP measure – See Appendix for the definition and reconciliation to the most comparable GAAP measure. PRICE/MIX Relatively stable VOLUME Strong demand drove record paperboard shipments SHELBY START-UP Expected start-up costs associated with new paper machine and converting lines at our Shelby mill ENERGY Lower natural gas prices primarily due to absence of pipeline supply disruption that impacted the Idaho mill in first quarter MAINTENANCE Maintenance at Arkansas, North Carolina and Idaho mills SG&A First quarter included professional fees and other costs related to material weakness and goodwill impairment 1 1 4 GAAP Measures (dollars in millions) Q2'19 Net Sales $452.0 Operating Income $15.3 Net Earnings $(0.4) Q1'19 $428.8 $14.4 $3.8 Q2'19 vs. Q1'19 Adjusted EBITDA Bridge ADJ. EBITDA1 (MILLIONS)
![](https://capedge.com/proxy/8-K/0001157523-19-001639/a52021977ex99_2slide5.jpg)
CLEARWATER PAPER YEAR OVER YEAR SAME QUARTER RESULTS 1 Non-GAAP measure – See Appendix for the definition and reconciliation to the most comparable GAAP measure.2 In the first quarter of 2018, we adopted a new accounting standard that resulted in a change in the presentation of pension and postretirement benefit costs other than service costs on a line outside of operating income. Beginning in the first quarter of 2019, the Company is excluding these non-operating costs from the calculation of Adjusted EBITDA. The corresponding prior period amounts have been reclassified to conform with the current period presentation. PRICE/MIX Higher paperboard and tissue pricing from previously announced price increases VOLUME /DIVESTITURE Higher retail tissue and paperboard shipments partially offset by lower tissue shipments due to divestiture of Ladysmith, Wisconsin mill in August 2018 SHELBY START-UP Expected start-up costs associated with new paper machine and converting lines at our Shelby mill MAINTENANCE Maintenance at our Arkansas, North Carolina and Idaho mills 1 1,2 5 Q2'19 vs. Q2’18 Adjusted EBITDA Bridge ADJ. EBITDA1 (MILLIONS) GAAP Measures (dollars in millions) Q2'19 Net Sales $452.0 Operating Income $15.3 Net Earnings $(0.4) Q2'18 $432.1 $18.4 $7.0
![](https://capedge.com/proxy/8-K/0001157523-19-001639/a52021977ex99_2slide34.jpg)
CONSUMER PRODUCTS SEQUENTIAL QUARTER RESULTS 1 Non-GAAP measure – See Appendix for the definition and reconciliation to the most comparable GAAP measure. PRICE/MIX Less favorable retail product mix VOLUME Higher retail tissue shipments SHELBY START-UP Expected start-up costs associated with new paper machine and converting lines at our Shelby mill MAINTENANCE Maintenance at our North Carolina mill SEGMENT ADJ. EBITDA1 (MILLIONS) 1 1 6 Q2'19 vs. Q1'19 Segment Adjusted EBITDA Bridge GAAP Measures (dollars in millions) Q2'19 Segment Net Sales $224.3 Segment Operating Income $(5.1) Segment Operating Income Percentage (2.3)% Q1'19 $223.3 $1.3 0.6% 3 3
![](https://capedge.com/proxy/8-K/0001157523-19-001639/a52021977ex99_2slide7.jpg)
PRICE/MIX Favorable mix VOLUME Strong demand drove record paperboard shipments ENERGY Lower natural gas prices primarily due to absence of pipeline supply disruption that impacted the Idaho mill in first quarter MAINTENANCE Maintenance at our Arkansas and Idaho mills PULP AND PAPERBOARD SEQUENTIAL QUARTER RESULTS 1 Non-GAAP measure – See Appendix for the definition and reconciliation to the most comparable GAAP measure. SEGMENT ADJ. EBITDA1 (MILLIONS) 1 1 7 Q2'19 vs. Q1'19 Segment Adjusted EBITDA Bridge GAAP Measures (dollars in millions) Q2'19 Segment Net Sales $227.7 Segment Operating Income $33.6 Segment Operating Income Percentage 14.8% Q1'19 $205.4 $29.4 14.3%
![](https://capedge.com/proxy/8-K/0001157523-19-001639/a52021977ex99_2slide8.jpg)
STRATEGIC CAPITAL INVESTMENTS SCOPE Installed NTT tissue machine, converting equipment and warehousing LOCATION Shelby, NC CAPACITY 70 - 75,000 tons per year COST $420 million PRODUCTION Start-up: April 2019 Full run-rate: 2020 FULL SHIPMENT RUN-RATE Expected 2021 EXPECTED BENEFIT $55 - $65 million EBITDA1 by end of 2021 8 SCOPE Replaced a batch digester system with a continuous digester LOCATION Lewiston, ID CAPACITY Increase pulp productivity by 45 - 55,000 tons/year and improve yields COST $155 million PRODUCTION Digester: October 2017 Polysulfide: Expected January 2020 EXPECTED BENEFIT $25 - $35 million EBITDA1 per year in 2020 Shelby Expansion Lewiston Pulp Optimization 1 Non-GAAP measure – See Appendix for the definition and reconciliation to the most comparable GAAP measure.
![](https://capedge.com/proxy/8-K/0001157523-19-001639/a52021977ex99_2slide9.jpg)
9 BALANCED CAPITAL ALLOCATION Expected Future Capital Allocation Capex approximately $60 million per yearPay down debt with cash flow from operations (Dollars in millions and shares in thousands) 1 As of year-end. 1 1
![](https://capedge.com/proxy/8-K/0001157523-19-001639/a52021977ex99_2slide10.jpg)
DEBT, INTEREST AND CASH FLOW Long term debt includes: $300 million 2025 Senior Bond Note, $275 million 2023 Senior Bond Note, long term portion of line of credit and long term leases. Short term debt includes: short term portion of line of credit less cash1 Non-GAAP measure – See Appendix for the definition and reconciliation to the most comparable GAAP measure. 2 10 (Dollars in millions) 1 Long-term debt includes: long-term Senior Bond Notes, long-term portion of line-of-credit and long-term financing leases. Short-term debt includes: short-term portion of line of credit less cash and cash equivalents. 2 This is not a covenant. Total leverage ratio is calculated as the total net debt to rolling four quarter total adjusted EBITDA plus franchise taxes and other reoccurring non-cash items. $24 $78 Lower due to Shelby, NC expansion and working capital needs 1
![](https://capedge.com/proxy/8-K/0001157523-19-001639/a52021977ex99_2slide11.jpg)
Q3’19 ADJUSTED EBITDA OUTLOOK1 , ADJUSTED EARNINGS OUTLOOK1 AND RECONCILIATION OF NON-GAAP FINANCIAL MEASURES (UNAUDITED) 1 This information is based upon management’s current expectations and estimates, which are in part based on market and industry data. Many factors are outside the control of management, including input costs for commodity products, and actual results may differ materially from the information set forth above. See “Forward-Looking Statements” on page 2.2 EBITDA is a non-GAAP measure that management uses as a supplemental performance measure. The most directly comparable GAAP measure is net earnings (loss). EBITDA is net earnings (loss) adjusted for net interest expense, income taxes, and depreciation and amortization. It should not be considered as an alternative to net earnings (loss) computed under GAAP.3 Adjusted EBITDA excludes the impact of the items listed that we do not believe are indicative of our core operating performance. 4 Adjusted operating income, Adjusted net earnings (loss) and Adjusted net earnings (loss) per diluted common share exclude the impact of the items listed that we do not believe are indicative of our core operating performance. 6 All non-tax items are tax effected at a 59% annual rate.6 GAAP net earnings (loss) per diluted common share and Adjusted net earnings (loss) per diluted common share are calculated utilizing second quarter 2019 diluted average common shares outstanding of 16,539 (in thousands). OUTLOOK THREE MONTHS ENDINGSEPTEMBER 30, 2019 RANGE OF ESTIMATE (Dollars in thousands) FROM TO Earnings before interest, income taxes, and depreciation & amortization (EBITDA)2: GAAP net (loss) earnings ($8,000 ) ($5,500 ) Interest expense, net 11,500 12,000 Income tax (benefit) provision (11,400 ) (8,000 ) Depreciation and amortization expense 28,000 29,600 EBITDA2 $20,100 $28,100 Directors' equity-based compensation expense 300 300 Non-operating pension and OPEB costs 1,400 1,400 Other reorganization related expenses 200 200 Debt refinance costs 2,000 2,000 Adjusted EBITDA3 $24,000 $32,000 11 (Dollars in thousands) FROM TO GAAP net loss ($8,000 ) ($5,500 ) Adjustments, after tax5: Directors' equity-based compensation expense 125 125 Non-operating pension and OPEB costs 575 575 Other reorganization related expenses 80 80 Debt refinance costs 820 820 Adjusted net loss4 ($6,400 ) ($3,900 ) FROM TO GAAP net loss per diluted common share6 ($0.48 ) ($0.33 ) Adjusted net loss per diluted common share4,6 ($0.39 ) ($0.24 ) OUTLOOK THREE MONTHS ENDINGSEPTEMBER 30, 2019 RANGE OF ESTIMATE (Dollars in thousands) FROM TO GAAP Operating (Loss) Income ($5,500 ) $2,500 Directors' equity-based compensation expense 300 300 Non-operating pension and OPEB costs 1,400 1,400 Other reorganization related expenses 200 200 Debt refinance costs 2,000 2,000 Adjusted operating (loss) income4 ($1,600 ) $6,400 Adjusted EBITDA Outlook Adjusted Net Loss Outlook
![](https://capedge.com/proxy/8-K/0001157523-19-001639/a52021977ex99_2slide12.jpg)
Q3'19 OUTLOOK1 0% - 1% Lower (0.5%) - 1.5% $24M - $32M ($0.39) - ($0.24) NET SALES ADJUSTED OPERATING MARGIN2,3 ADJUSTED EBITDA2 ADJUSTED NET LOSS PER DILUTED COMMON SHARE2,4 1 This information is based upon management’s current expectations and estimates, which are in part based on market and industry data. Many factors are outside the control of management, including input costs for commodity products, and actual results may differ materially from the information set forth above. See “Forward-Looking Statements” on page 2.2 Non-GAAP measure – See prior slides for the reconciliation to the most comparable GAAP measure.3 Adjusted operating margin is defined as net sales divided by adjusted operating income.4 Adjusted net earnings (loss) per diluted common share is calculated utilizing second quarter 2018 diluted average common shares outstanding of 16,539 (in thousands). 12
![](https://capedge.com/proxy/8-K/0001157523-19-001639/a52021977ex99_2slide13.jpg)
FIVE QUARTER TRENDS 1 Non-GAAP measure – See Appendix for the definition and reconciliation to the most comparable GAAP measure.2 Adjusted EBITDA margin is defined as Adjusted EBITDA divided by Net sales.3 Adjusted operating margin is defined as Adjusted operating income divided by Net sales. 4 Includes $12.7 million for the gain on divested asset from the sale of the Ladysmith Mill which had a total gain of $22.9 million. (Dollars in millions) 1 1,2 1 1,3 13 4 $452.0 ($0.4)
![](https://capedge.com/proxy/8-K/0001157523-19-001639/a52021977ex99_2slide14.jpg)
FIVE QUARTER SEGMENT TRENDS 1 Non-GAAP measure - See Appendix for the definition and reconciliation to the most comparable GAAP measure.2 Non-GAAP measure - Segment Adjusted EBITDA margin is defined as Segment Adjusted EBITDA divided by Segment net sales. Consumer Products Pulp & Paperboard Total Net Sales Adj. EBITDA & Margin 14 (Dollars in millions) 1,2
![](https://capedge.com/proxy/8-K/0001157523-19-001639/a52021977ex99_2slide15.jpg)
Major Maintenance Schedule 15 None Arkansas Idaho $23 - $27 $22 $18 $30 (Dollars in millions) 1 This information is based upon management’s current expectations and estimates, as well as historical averages. Many factors are outside the control of management, and actual results may differ materially from the information set forth above. See “Forward-Looking Statements” on page 2. 2019: Idaho mill in Q3 and Arkansas mill in Q4 Idaho Idaho $7 - $8 $16 - $19 1 1 1 1 $15 - $20 $23 - $27 $15 - $20
![](https://capedge.com/proxy/8-K/0001157523-19-001639/a52021977ex99_2slide16.jpg)
COGS Input Unit of Measure Approximated Annual Volume1 (in Millions) $ Change Per Unit1 +/- Approximated Annual expected EBITDA2 Impact +/- (in Millions) Purchased Pulp Ton 0.27 $20.00 $5.4 Fiber Bone Dry Ton 1.5 $4.00 $6.0 Diesel Gallon 10.0 $0.50 $5.0 Electric MWh 1.0 $5.00 $5.0 Natural Gas MMBTU 10.25 $0.50 $5.1 Polyethylene Pound 30.0 $0.20 $6.0 Caustic Pound 90.0 $0.06 $5.4 Chlorate Pound 30.0 $0.20 $6.0 KEY COMMODITY CONSUMPTION VOLUMES 16 1 Approximated annual volume and expense amounts are based on historical average consumption and management's current expectations and estimates with respect to future volumes and expense, and these amounts may be significantly influenced by general market conditions and other factors outside of our control. Actual results may differ materially from the information set forth above. See "Forward-Looking Statements" on page 2. 2 Non-GAAP measure.
![](https://capedge.com/proxy/8-K/0001157523-19-001639/a52021977ex99_2slide17.jpg)
APPENDIX &RECONCILIATIONS 17
![](https://capedge.com/proxy/8-K/0001157523-19-001639/a52021977ex99_2slide18.jpg)
FINANCIAL SUMMARY (GAAP BASIS)(UNAUDITED) (Dollars in thousands - except per-share amounts) Q2'18 Q3'18 Q4'18 Q1'19 Q2'19 Net sales $432,099 $426,460 $428,707 $428,779 $451,993 Gross Profit $44,945 $50,239 $46,503 $44,533 $42,168 Selling, general and administrative expenses ($26,564 ) ($26,283 ) ($27,161 ) ($30,171 ) ($26,827 ) Operating income (loss) $18,381 $46,900 ($174,729 ) $14,362 $15,341 Consumer Products ($3,604 ) ($1,269 ) $513 $1,271 ($5,133 ) Gain on divested assets $— $22,944 $1,008 $— $— Goodwill impairment $— $— ($195,079 ) $— $— Pulp and Paperboard $34,192 $38,280 $31,800 $29,388 $33,587 Corporate ($12,207 ) ($13,055 ) ($12,971 ) ($16,297 ) ($13,113 ) Operating margin 4.3 % 11.0 % (40.8 )% 3.3 % 3.4 % Interest expense, net ($7,723 ) ($7,547 ) ($7,330 ) ($8,486 ) ($10,914 ) Non-operating pension and other postretirement benefit costs ($1,187 ) ($1,234 ) ($1,233 ) ($1,314 ) ($1,531 ) Income tax provision ($2,510 ) ($3,675 ) ($4,480 ) ($725 ) ($3,320 ) Net earnings (loss) $6,961 $34,444 ($187,772 ) $3,837 ($424 ) Net earnings (loss) per diluted common share $0.42 $2.08 ($11.39 ) $0.23 ($0.03 ) Cash flow from operations $80,028 $10,211 $47,800 ($29,399 ) $44,121 Cash capital expenditures $30,170 $95,434 $121,674 $71,588 $36,831 18 1 In the first quarter of 2018, we adopted a new accounting standard that resulted in a change in the presentation of pension and postretirement benefit costs other than service costs on a line outside of operating income. Beginning in the first quarter of 2019, the Company is excluding these non-operating costs from the calculation of Adjusted EBITDA. The corresponding prior period amounts have been reclassified to conform with the current period presentation.
![](https://capedge.com/proxy/8-K/0001157523-19-001639/a52021977ex99_2slide19.jpg)
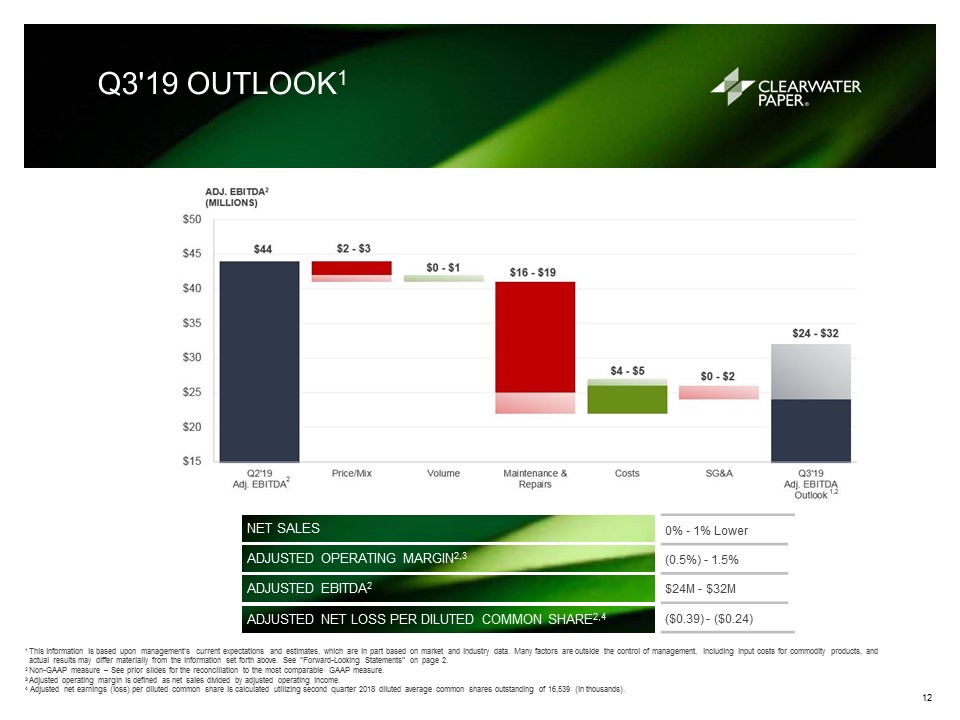
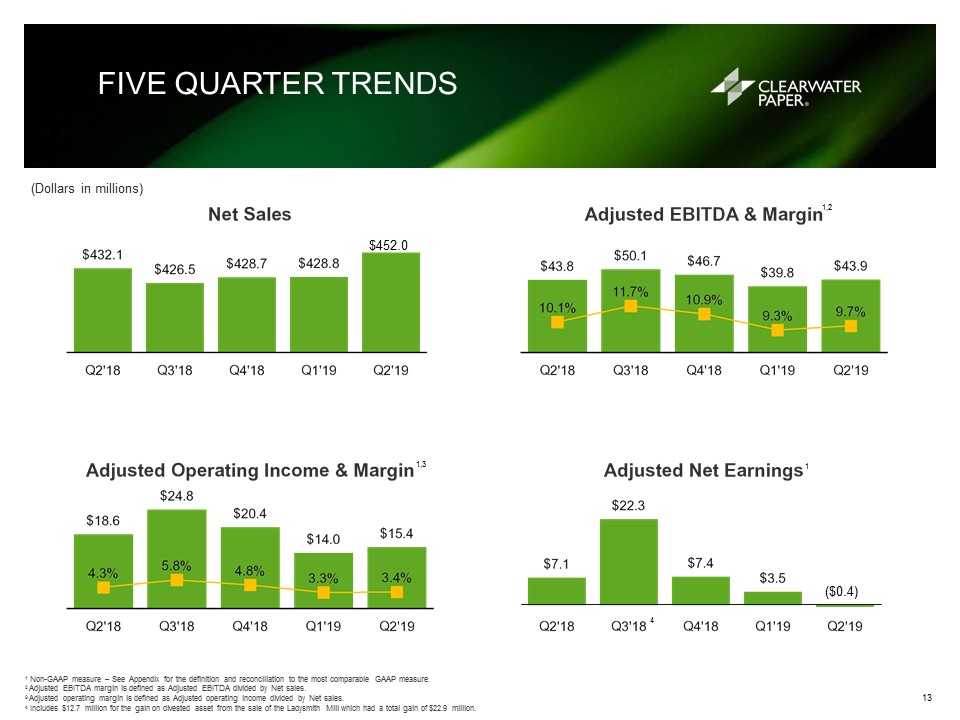
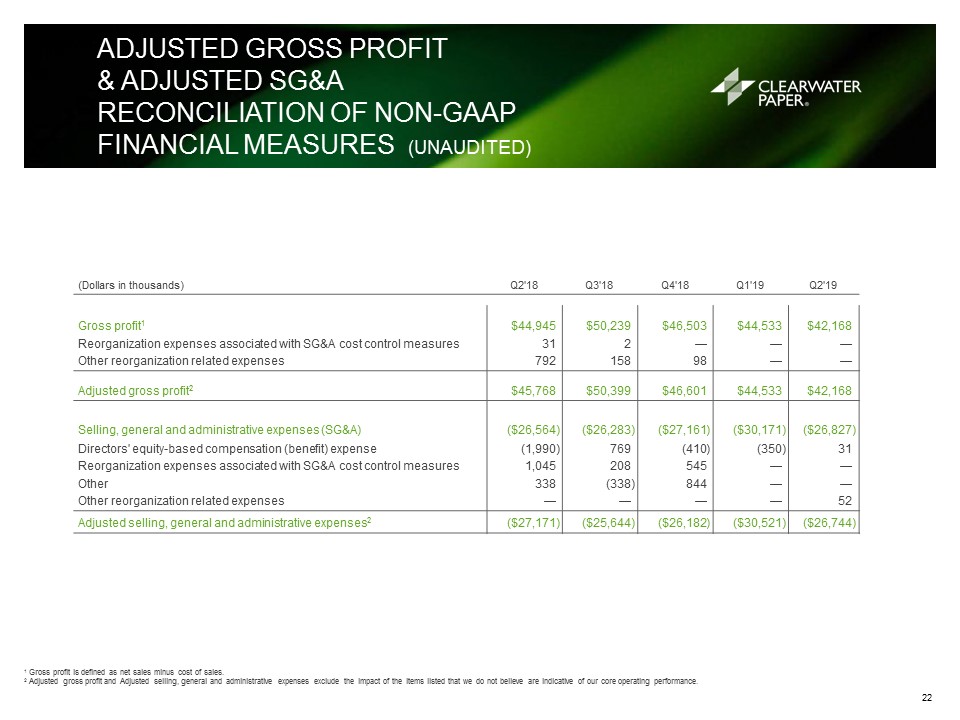
FINANCIAL SUMMARY (ADJUSTED BASIS)(UNAUDITED) 1 Non-GAAP measure - See Appendix for the definition and reconciliation to the most comparable GAAP measure. 2 Adjusted gross profit margin is defined as Adjusted gross profit divided by Net sales. 3 Adjusted operating margin is defined as Adjusted operating income divided by Net sales.4 In the first quarter of 2018, we adopted a new accounting standard that resulted in a change in the presentation of pension and postretirement benefit costs other than service costs on a line outside of operating income. Beginning in the first quarter of 2019, the Company is excluding these non-operating costs from the calculation of Adjusted EBITDA. The corresponding prior period amounts have been reclassified to conform with the current period presentation. 5 Adjusted EBITDA margin is defined as Adjusted EBITDA divided by Net sales.6 Total leverage ratio is calculated as the total net debt to rolling four quarter total adjusted EBITDA plus franchise taxes and other reoccurring non-cash items.7 Net Debt includes long-term Senior Bond Notes, long-term financing leases, line of credit, less cash and cash equivalents.8 This information is based upon management’s current expectations and estimates, which are in part based on market and industry data. Many factors are outside the control of management, including particularly input costs for commodity products, and actual results may differ materially from the information set forth above. See “Forward-Looking Statements” on page 2. (Dollars in thousands - except per-share amounts) Q2'18 Q3'18 Q4'18 Q1'19 Q2'19 Q3'19 Outlook8 Net sales $432,099 $426,460 $428,707 $428,779 $451,993 0% - 1% Lower Adjusted gross profit1 $45,768 $50,399 $46,601 $44,533 $42,168 Adjusted gross profit margin1,2 10.6 % 11.8 % 10.9 % 10.4 % 9.3 % Adjusted selling, general and administrative expenses1 ($27,171 ) ($25,644 ) ($26,182 ) ($30,521 ) ($26,744 ) Adjusted operating income (loss)1 $18,597 $24,755 $20,419 $14,012 $15,424 Consumer Products ($2,596 ) ($1,024 ) $852 $1,271 ($5,133 ) Pulp and Paperboard $34,284 $38,351 $31,806 $29,388 $33,587 Corporate ($13,091 ) ($12,572 ) ($12,239 ) ($16,647 ) ($13,030 ) Adjusted operating margin1,3 4.3 % 5.8 % 4.8 % 3.3 % 3.4 % (0.5%) - 1.5% Interest expense, net ($7,723 ) ($7,547 ) ($7,330 ) ($8,486 ) ($10,914 ) Non-operating pension and other postretirement benefit costs4 ($1,187 ) ($1,234 ) ($1,233 ) ($1,314 ) ($1,531 ) Adjusted net earnings (loss)1 $7,121 $22,289 $7,362 $3,508 ($390 ) Depreciation and amortization expense $25,177 $25,342 $26,267 $25,836 $28,517 Adjusted EBITDA1,4 $43,774 $50,097 $46,686 $39,848 $43,941 $24,000 - $32,000 Consumer Products $11,624 $13,423 $15,672 $16,042 $12,298 Pulp and Paperboard $43,645 $47,667 $41,498 $38,873 $43,078 Corporate4 ($11,495 ) ($10,993 ) ($10,484 ) ($15,067 ) ($11,435 ) Adjusted EBITDA margin1,4,5 10.1 % 11.7 % 10.9 % 9.3 % 9.7 % Adjusted net earnings (loss) per diluted common share1 $0.43 $1.35 $0.45 $0.21 ($0.02 ) Total Leverage Ratio6 3.79 3.75 4.29 4.97 4.99 Net Debt7 $702,456 $719,364 $772,818 $886,532 $889,576 19
![](https://capedge.com/proxy/8-K/0001157523-19-001639/a52021977ex99_2slide20.jpg)
1 Includes away-from-home (AFH), contract and parent roll tissue products. 2 Includes retail, AFH, and contract tissue case products.3 Shipments and Sales Price exclude Scrap Sales beginning in the fourth quarter of 2018. KEY SEGMENT RESULTS(UNAUDITED) Q2'18 Q3'18 Q4'18 Q1'19 Q2'19 Consumer Products Shipments Retail (short tons) 73,070 70,335 69,480 73,356 76,175 Non-Retail (short tons)1 17,316 18,525 11,500 10,266 6,623 Total Tissue Tons 90,386 88,860 80,980 83,622 82,798 Converted Products (cases in thousands)2 12,027 11,789 11,621 12,320 12,488 Sales Price Retail ($/short ton)1 $2,707 $2,615 $2,776 $2,789 $2,764 Non-Retail ($/short ton)1 $1,372 $1,491 $1,727 $1,799 $1,851 Total Tissue ($/short ton) $2,451 $2,381 $2,627 $2,667 $2,691 Segment net sales ($ in thousands) $221,585 $211,642 $212,743 $223,336 $224,340 20 Pulp and Paperboard Shipments Paperboard (short tons)3 216,582 218,135 218,322 202,834 225,188 Sales Price Paperboard ($/short ton)3 $972 $985 $982 $1,001 $1,004 Segment net sales ($ in thousands) $210,514 $214,818 $215,964 $205,443 $227,653
![](https://capedge.com/proxy/8-K/0001157523-19-001639/a52021977ex99_2slide49.jpg)
CLEARWATER PAPER SEGMENT SHIPMENTS AND U.S. MARKET U.S. Retail Tissue Market Q2'19 ($) (Total U.S, - All Outlets)1 CATEGORY PRIVATELABEL BRANDS TOTAL Total Retail Tissue Share ($) 31 % 69 % 100 % % Change Q2'19 vs. Q2’18 0.7 % (0.7 )% — % 1 Data Source: IRI Worldwide Consumer Panel data through June 16, 2019. CLW Q2'19 by Retail Tissue Market Segment (% of Tons) 21 Other 1% Folding Liquid Pkg Food Service CLW Q2'19 by U.S. Paperboard Market Segment (% of Tons) U.S. Paperboard Production Q2'193 CATEGORY CLEARWATER PAPER OTHER Total Domestic SBS1 Market Share 14 % 86 % Folding 19 % 81 % Food Service2 14 % 86 % Liquid Packaging 4 % 96 % 1 Solid Bleached Sulfate.2 Food Service includes cup, plate, dish and tray products.3 Data Source: American Forest and Paper Association Solid Bleached Domestic Production – June 30, 2019. Retail AFH Parent Rolls
![](https://capedge.com/proxy/8-K/0001157523-19-001639/a52021977ex99_2slide22.jpg)
ADJUSTED GROSS PROFIT& ADJUSTED SG&ARECONCILIATION OF NON-GAAPFINANCIAL MEASURES (UNAUDITED) 1 Gross profit is defined as net sales minus cost of sales.2 Adjusted gross profit and Adjusted selling, general and administrative expenses exclude the impact of the items listed that we do not believe are indicative of our core operating performance. (Dollars in thousands) Q2'18 Q3'18 Q4'18 Q1'19 Q2'19 Gross profit1 $44,945 $50,239 $46,503 $44,533 $42,168 Reorganization expenses associated with SG&A cost control measures 31 2 — — — Other reorganization related expenses 792 158 98 — — Adjusted gross profit2 $45,768 $50,399 $46,601 $44,533 $42,168 Selling, general and administrative expenses (SG&A) ($26,564 ) ($26,283 ) ($27,161 ) ($30,171 ) ($26,827 ) Directors' equity-based compensation (benefit) expense (1,990 ) 769 (410 ) (350 ) 31 Reorganization expenses associated with SG&A cost control measures 1,045 208 545 — — Other 338 (338 ) 844 — — Other reorganization related expenses — — — — 52 Adjusted selling, general and administrative expenses2 ($27,171 ) ($25,644 ) ($26,182 ) ($30,521 ) ($26,744 ) 22
![](https://capedge.com/proxy/8-K/0001157523-19-001639/a52021977ex99_2slide23.jpg)
SEGMENT ADJUSTED OPERATING INCOME (LOSS)RECONCILIATION OF NON-GAAP FINANCIAL MEASURES (UNAUDITED) 1 Operating income (loss) for Q3'18 and Q4'18 includes $22.9 million and $1.0 million, respectively, for the gain on divested assets, net.2 Adjusted operating income (loss) excludes the impact of the items listed that we do not believe are indicative of our core operating performance. (Dollars in thousands) Q2'18 Q3'18 Q4'18 Q1'19 Q2'19 Consumer Products Operating income (loss)1 ($3,604 ) $21,675 ($193,558 ) $1,271 ($5,133 ) Reorganization expenses associated with SG&A cost control measures 216 87 241 — — Other reorganization related expenses 792 158 98 — — Gain on divested assets, net — (22,944 ) (1,008 ) — Goodwill impairment — — 195,079 — — Adjusted Consumer Products operating income (loss)2 ($2,596 ) ($1,024 ) $852 $1,271 ($5,133 ) Pulp and Paperboard Operating Income $34,192 $38,280 $31,800 $29,388 $33,587 Reorganization expenses associated with SG&A cost control measures 92 71 6 — — Adjusted Pulp and Paperboard operating income2 $34,284 $38,351 $31,806 $29,388 $33,587 Corporate Operating loss ($12,207 ) ($13,055 ) ($12,971 ) ($16,297 ) ($13,113 ) Directors' equity-based compensation (benefit) expense (1,990 ) 769 (410 ) (350 ) 31 Reorganization expenses associated with SG&A cost control measures 768 52 298 — — Other 338 (338 ) 844 — — Other reorganization related expenses — — — — 52 Adjusted Corporate operating loss2 ($13,091 ) ($12,572 ) ($12,239 ) ($16,647 ) ($13,030 ) 23
![](https://capedge.com/proxy/8-K/0001157523-19-001639/a52021977ex99_2slide24.jpg)
ADJUSTED NET EARNINGS & ADJUSTED NET EARNINGS PER DILUTED COMMON SHARE RECONCILIATION OF NON-GAAP FINANCIAL MEASURES (UNAUDITED) 1 All non-tax items are tax effected at the expected annual rate for that period.2 Adjusted net earnings (loss) and Adjusted net earnings (loss) per diluted common share exclude the impact of the items listed that we do not believe are indicative of our core operating performance. (Dollars in thousands - except per-share amounts) Q2'18 Q3'18 Q4'18 Q1'19 Q2'19 GAAP net earnings (loss) $6,961 $34,444 ($187,772 ) $3,837 ($424 ) Adjustments, after tax1: Directors' equity-based compensation (benefit) expense (1,472 ) 524 (337 ) (329 ) 13 Reorganization expenses associated with SG&A cost control measures 796 143 447 — — Other reorganization related expenses 586 108 80 — 21 Other 250 (250 ) 693 — — Gain on divested assets, net — (12,680 ) (828 ) — — Goodwill impairment — — 195,079 — — Adjusted net earnings (loss)2 $7,121 $22,289 $7,362 $3,508 ($390) Net earnings (loss) per diluted common share $0.42 $2.08 ($11.39 ) $0.23 ($0.03 ) Adjustments, after tax1: Directors' equity-based compensation (benefit) expense (0.09 ) 0.03 (0.02 ) (0.02 ) — Reorganization expenses associated with SG&A cost control measures 0.04 0.01 0.03 — — Other reorganization related expenses 0.04 0.01 0.01 — — Other 0.02 (0.02 ) 0.04 — — Gain on divested assets, net — (0.76 ) (0.05 ) — — Goodwill impairment — — 11.83 — — Adjusted net earnings (loss) per diluted common share2 $0.43 $1.35 $0.45 $0.21 ($0.02) 24
![](https://capedge.com/proxy/8-K/0001157523-19-001639/a52021977ex99_2slide25.jpg)
EBITDA & ADJUSTED EBITDA RECONCILIATION OF NON-GAAP FINANCIAL MEASURES (UNAUDITED) 1 EBITDA is a non-GAAP measure that management uses as a supplemental performance measure. The most directly comparable GAAP measure is net earnings (loss). EBITDA is net earnings (loss) adjusted for net interest expense, income taxes, and depreciation and amortization. It should not be considered as an alternative to net earnings (loss) computed under GAAP.2 Adjusted EBITDA excludes the impact of the items listed that we do not believe are indicative of our core operating performance. 3 In the first quarter of 2018, we adopted a new accounting standard that resulted in a change in the presentation of pension and postretirement benefit costs other than service costs on a line outside of operating income. Beginning in the first quarter of 2019, the Company is excluding these non-operating costs from the calculation of Adjusted EBITDA. The corresponding prior period amounts have been reclassified to conform with the current period presentation. (Dollars in thousands) Q2'18 Q3'18 Q4'18 Q1'19 Q2'19 Earnings before interest, income taxes, depreciation & amortization (EBITDA)1 GAAP net earnings (loss) $6,961 $34,444 ($187,772 ) $3,837 ($424 ) Interest expense, net 7,723 7,547 7,330 8,486 10,914 Income tax provision 2,510 3,675 4,480 725 3,320 Depreciation and amortization expense 25,177 25,342 26,267 25,836 28,517 EBITDA1 $42,371 $71,008 ($149,695 ) $38,884 $42,327 Directors' equity-based compensation (benefit) expense (1,990 ) 769 (410 ) (350 ) 31 Reorganization expenses associated with SG&A cost control measures 1,076 210 545 — — Other reorganization related expenses 792 158 98 — 52 Other 338 (338 ) 844 — — Gain on divested assets, net — (22,944 ) (1,008 ) — — Goodwill impairment — — 195,079 — — Non-operating pension and other postretirement benefit costs3 1,187 1,234 1,233 1,314 1,531 Adjusted EBITDA2,3 $43,774 $50,097 $46,686 $39,848 $43,941 25
![](https://capedge.com/proxy/8-K/0001157523-19-001639/a52021977ex99_2slide54.jpg)
SEGMENT EBITDA & ADJUSTED EBITDA RECONCILIATION OF NON-GAAPFINANCIAL MEASURES (UNAUDITED) 1 Segment EBITDA is a non-GAAP measure that management uses as a supplemental performance measure. The most directly comparable GAAP measure is segment operating income (loss). Segment EBITDA is segment operating income (loss) adjusted for depreciation and amortization and non-operating pension and other postretirement benefit costs. It should not be considered as an alternative to segment operating income (loss) computed under GAAP. 2 Segment Adjusted EBITDA excludes the impact of the items listed that we do not believe are indicative of our core operating performance. 3Operating income for Q3'18 and Q4'18 includes $22.9 million and $1.0 million, respectively, for the gain on divested assets, net.4 In the first quarter of 2018, we adopted a new accounting standard that resulted in a change in the presentation of pension and postretirement benefit costs other than service costs on a line outside of operating income. Beginning in the first quarter of 2019, the Company is excluding these non-operating costs from the calculation of Adjusted EBITDA. The corresponding prior period amounts have been reclassified to conform with the current period presentation. 5 Segment Adjusted EBITDA Margin is defined as Segment EBITDA divided by Segment net sales. (Dollars in thousands) Q2'18 Q3'18 Q4'18 Q1'19 Q2'19 Consumer Products Consumer Products segment net sales $221,585 $211,642 $212,743 $223,336 $224,340 Operating income (loss)3 ($3,604 ) $21,675 ($193,558 ) $1,271 ($5,133 ) Depreciation and amortization expense 14,220 14,447 14,820 14,771 17,431 Segment EBITDA1 $10,616 $36,122 ($178,738 ) $16,042 $12,298 Reorganization expenses associated with SG&A cost control measures 216 87 241 — — Other reorganization related expenses 792 158 98 — — Gain on divested assets, net — (22,944 ) (1,008 ) — — Goodwill impairment — — 195,079 — — Consumer Products Segment Adjusted EBITDA2,4 $11,624 $13,423 $15,672 $16,042 $12,298 Consumer Products Segment Adjusted EBITDA Margin5 5.2 % 6.3 % 7.4 % 7.2 % 5.5 % Pulp and Paperboard Pulp and Paperboard segment net sales $210,514 $214,818 $215,964 $205,443 $227,653 Operating income $34,192 $38,280 $31,800 $29,388 $33,587 Depreciation and amortization expense 9,361 9,316 9,692 9,485 9,491 Segment EBITDA1 $43,553 $47,596 $41,492 $38,873 $43,078 Reorganization expenses associated with SG&A cost control measures 92 71 6 — — Pulp and Paperboard Segment Adjusted EBITDA2,4 $43,645 $47,667 $41,498 $38,873 $43,078 Pulp and Paperboard Segment Adjusted EBITDA Margin5 20.7 % 22.2 % 19.2 % 18.9 % 18.9 % Corporate Operating loss ($12,207 ) ($13,055 ) ($12,971 ) ($16,297 ) ($13,113 ) Depreciation and amortization expense 1,596 1,579 1,755 1,580 1,595 Non-operating pension and other postretirement benefit costs4 (1,187 ) (1,234 ) (1,233 ) (1,314 ) (1,531 ) Corporate EBITDA1 ($11,798 ) ($12,710 ) ($12,449 ) ($16,031 ) ($13,049 ) Directors' equity-based compensation (benefit) expense (1,990 ) 769 (410 ) (350 ) 31 Reorganization expenses associated with SG&A cost control measures 768 52 298 — — Other 338 (338 ) 844 — — Non-operating pension and other postretirement benefit costs4 1,187 1,234 1,233 1,314 1,531 Other reorganization related expenses — — — — 52 Corporate Adjusted EBITDA2,4 ($11,495 ) ($10,993 ) ($10,484 ) ($15,067 ) ($11,435 ) 26
![](https://capedge.com/proxy/8-K/0001157523-19-001639/a52021977ex99_2slide27.jpg)
RECONCILIATION OF GAAP TO NON-GAAP: STRATEGIC CAPITAL INVESTMENTS (UNAUDITED) 1 This information is based upon management’s current expectations and estimates, which are in part based on market and industry data. Many factors are outside the control of management, including input costs for commodity products, and actual results may differ materially from the information set forth above. See “Forward-Looking Statements” on page 2.2Non-GAAP measure – See Appendix for the definition. FULL RUN-RATE EXPECTED ADJUSTED EBITDA2 IMPACT (Dollars in millions) Shelby Expansion1 Lewiston Pulp Optimization 1 Expected operating income $38.0 - $48.0 $17.5 - $27.5 Expected depreciation $17.0 $7.5 Expected EBITDA2 $55 - $65 $25 - $35 Expected Adjusted EBITDA2 $55 - $65 $25 - $35 27
![](https://capedge.com/proxy/8-K/0001157523-19-001639/a52021977ex99_2slide28.jpg)
FOR MORE INFORMATION:WWW.CLEARWATERPAPER.COM 28