Exhibit 99.2
CLEARWATER PAPER CORPORATIONTHIRD QUARTER 2019SUPPLEMENTAL INFORMATION 10/24/19 LINDA MASSMANPRESIDENT, CHIEF EXECUTIVE OFFICER AND DIRECTORROBERT HRIVNAKSENIOR VICE PRESIDENT FINANCE AND CHIEF FINANCIAL OFFICER

FORWARD-LOOKING STATEMENTS This presentation of supplemental information contains, in addition to historical information, certain forward-looking statements within the meaning of the Private Securities Litigation Reform Act of 1995, including statements regarding major maintenance; debt leverage; liquidity; cash flows; balance sheet; scope, cost, production capacity, shipment volume and expected adjusted EBITDA impact of the Shelby, NC expansion and Lewiston, ID continuous digester; estimated Q4 2019 net earnings (loss), EBITDA, adjusted EBITDA, operating income (loss), adjusted operating income (loss), adjusted net earnings (loss), net earnings (loss) per diluted common share, adjusted net earnings (loss) per diluted common share, net sales and adjusted operating margin; Q4 2019 product pricing and sales mix, product volumes shipped, maintenance and repairs, costs and SG&A; and input costs and annual expected EBITDA impact. These forward-looking statements are based on management’s current expectations, estimates, assumptions and projections that are subject to change. Our actual results of operations may differ materially from those expressed or implied by the forward-looking statements contained in this presentation. Important factors that could cause or contribute to such differences include the risks and uncertainties described from time to time in the company's public filings with the Securities and Exchange Commission, as well as the following: competitive pricing pressures for our products, including as a result of increased capacity as additional manufacturing facilities are operated by our competitors;the loss of, changes in prices in regard to, or reduction in, orders from a significant customer;changes in customer product preferences and competitors' product offerings;our ability to achieve full production at our new tissue manufacturing operations in Shelby, North Carolina on time and within current cost expectations;customer acceptance and timing and quantity of purchases of our tissue products, including the existence of sufficient demand for and the quality of tissue manufactured at our expanded Shelby, North Carolina operations upon full production;consolidation and vertical integration of converting operations in the paperboard industry;our ability to successfully implement our operational efficiencies and cost savings strategies, along with related capital projects, and achieve the expected operational or financial results of those projects, including from the continuous pulp digester at our Lewiston, Idaho facility;changes in the cost and availability of wood fiber and wood pulp;changes in transportation costs and disruptions in transportation services;labor disruptions;changes in the U.S. and international economies and in general economic conditions in the regions and industries in which we operate;manufacturing or operating disruptions, including IT system and IT system implementation failures, equipment malfunctions and damage to our manufacturing facilities;changes in costs for and availability of packaging supplies, chemicals, energy and maintenance and repairs;larger competitors having operational and other advantages;cyclical industry conditions;changes in expenses, required contributions and potential withdrawal costs associated with our pension plans;environmental liabilities or expenditures;cyber-security risks;reliance on a limited number of third-party suppliers for raw materials;our ability to attract, motivate, train and retain qualified and key personnel;material weaknesses in our internal control over financial reporting;our substantial indebtedness and ability to service our debt obligations;restrictions on our business from debt covenants and terms; andchanges in laws, regulations or industry standards affecting our business.Forward-looking statements contained in this presentation present management’s views only as of the date of this presentation. We undertake no obligation to publicly update forward-looking statements, to retract future revisions of management's views based on events or circumstances occurring after the date of this presentation. 2

THIRD QUARTER 2019BUSINESS HIGHLIGHTS 1 Non-GAAP measure – See Appendix for the definition and reconciliation to the most comparable GAAP measure.2 Total leverage ratio is calculated as the total net debt to rolling four quarter total adjusted EBITDA plus franchise taxes and other reoccurring non-cash items. 3 FINANCIAL PERFORMANCE $429 Million net sales, flat vs. Q4'18 $14 Million GAAP operating income and 3.3% marginDiluted GAAP EPS of $0.23Solid operating results; $40 Million adjusted EBITDA,1,2 within our outlook range of $37 to $43 Million MARKETS & OPERATIONS CAPITAL ALLOCATION $445 million net sales, down (2%) vs. Q2'19 and up 4% from Q3'18($2) million GAAP operating loss and (0.6%) marginDiluted GAAP Loss Per Share of ($0.66) $30.9 million adjusted EBITDA,1 at high end of our outlook range of $24 to $32 million Completed major maintenance at our Idaho mill and no major maintenance is expected in 2020CPD net sales increased 8% from Q3'18, due to commercial wins at existing and new accountsNew paper machine in North Carolina producing to customer quality specifications for both ultra and premium tissue segments $17 million of capital invested in Q3'19 and $126 million total through Q3'19Total net leverage ratio2 peaked in Q3'19; liquidity continues to be strong; our ongoing focus is to generate free cash flow to de-lever our balance sheet
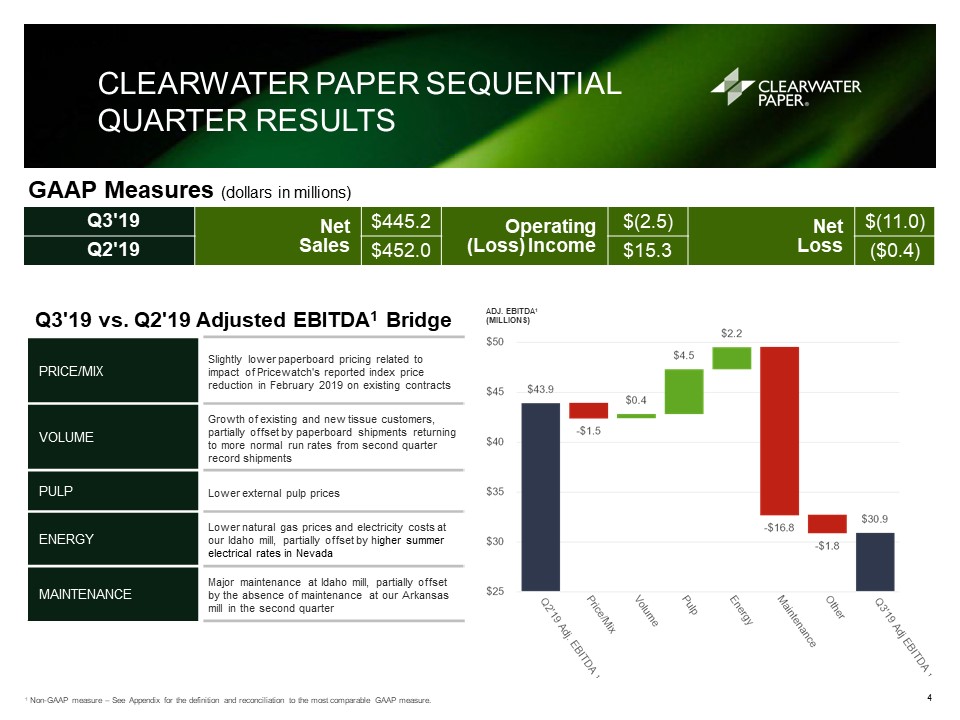
CLEARWATER PAPER SEQUENTIAL QUARTER RESULTS 1 Non-GAAP measure – See Appendix for the definition and reconciliation to the most comparable GAAP measure. PRICE/MIX Slightly lower paperboard pricing related to impact of Pricewatch's reported index price reduction in February 2019 on existing contracts VOLUME Growth of existing and new tissue customers, partially offset by paperboard shipments returning to more normal run rates from second quarter record shipments PULP Lower external pulp prices ENERGY Lower natural gas prices and electricity costs at our Idaho mill, partially offset by higher summer electrical rates in Nevada MAINTENANCE Major maintenance at Idaho mill, partially offset by the absence of maintenance at our Arkansas mill in the second quarter 1 1 4 GAAP Measures (dollars in millions) Q3'19 Net Sales $445.2 Operating (Loss) Income $(2.5) Net Loss $(11.0) Q2'19 $452.0 $15.3 ($0.4) Q3'19 vs. Q2'19 Adjusted EBITDA1 Bridge ADJ. EBITDA1 (MILLIONS)

CLEARWATER PAPER YEAR OVER YEAR SAME QUARTER RESULTS 1 Non-GAAP measure – See Appendix for the definition and reconciliation to the most comparable GAAP measure. PRICE/MIX Higher net paperboard and tissue pricing from previously announced price increases VOLUME /DIVESTITURE Higher retail tissue shipments partially offset by lower parent roll shipments due to divestiture of Ladysmith, Wisconsin mill in August 2018 PULP/WOOD FIBER Higher internal pulp costs due to major maintenance and higher wood fiber pricing at Arkansas due to wet weather MAINTENANCE Major maintenance at Idaho mill 1 1, 5 Q3'19 vs. Q3’18 Adjusted EBITDA1 Bridge ADJ. EBITDA1 (MILLIONS) GAAP Measures (dollars in millions) Q3'19 Net Sales $445.2 Operating (Loss) Income $(2.5) Net (Loss) Earnings $(11.0) Q3'18 $426.5 $46.9 $34.4 2 In the first quarter of 2018, we adopted a new accounting standard that resulted in a change in the presentation of pension and postretirement benefit costs other than service costs on a line outside of operating income. Beginning in the first quarter of 2019, the Company is excluding these non-operating costs from the calculation of Adjusted EBITDA. The corresponding prior period amounts have been reclassified to conform with the current period presentation.

CONSUMER PRODUCTS SEQUENTIAL QUARTER RESULTS 1 Non-GAAP measure – See Appendix for the definition and reconciliation to the most comparable GAAP measure. PRICE/MIX Stable price mix VOLUME Growth at existing and new customer accounts PULP Favorable external pulp pricing MAINTENANCE Maintenance at our Idaho mill ENERGY Higher summer electric rates for Nevada mill SEGMENT ADJ. EBITDA1 (MILLIONS) 1 1 6 Q3'19 vs. Q2'19 Segment Adjusted EBITDA1 Bridge GAAP Measures (dollars in millions) Q3'19 Segment Net Sales $228.5 Segment Operating Loss $(4.4) Segment Operating Loss Percentage (1.9)% Q2'19 $224.3 ($5.1) (2.3%) 3 3

PRICE/MIX Lower paperboard pricing related to impact of Pricewatch's reported index price reduction in February 2019 on existing contracts VOLUME Shipments returning to more normal run rates from second quarter record shipments PULP Lower external pulp prices at our Idaho mill ENERGY Lower natural gas prices and electricity costs at our Idaho mill MAINTENANCE Major maintenance at our Idaho mill, partially offset by the absence of maintenance at our Arkansas mill in the second quarter PULP AND PAPERBOARD SEQUENTIAL QUARTER RESULTS 1 Non-GAAP measure – See Appendix for the definition and reconciliation to the most comparable GAAP measure. SEGMENT ADJ. EBITDA1 (MILLIONS) 1 1 7 Q3'19 vs. Q2'19 Segment Adjusted EBITDA1 Bridge GAAP Measures (dollars in millions) Q3'19 Segment Net Sales $216.6 Segment Operating Income $17.1 Segment Operating Income Percentage 7.9% Q2'19 $227.7 $33.6 14.8%

STRATEGIC CAPITAL INVESTMENTS SCOPE Installed NTT tissue machine, converting equipment and warehousing LOCATION Shelby, NC CAPACITY 70,000 - 75,000 tons per year COST $420 million PRODUCTION Start-up: April 2019 Full run-rate: 2020 FULL SHIPMENT RUN-RATE Expected 2021 EXPECTED BENEFIT $55 - $65 million EBITDA1 by end of 2021 8 SCOPE Replaced a batch digester system with a continuous digester LOCATION Lewiston, ID CAPACITY Increase pulp productivity by 45,000 - 55,000 tons/year and improve yields COST $155 million PRODUCTION Digester: October 2017 Polysulfide: Expected January 2020 EXPECTED BENEFIT $25 - $35 million EBITDA1 per year in 2020 Shelby Expansion Lewiston Pulp Optimization 1 Non-GAAP measure – See Appendix for the definition and reconciliation to the most comparable GAAP measure.

9 BALANCED CAPITAL ALLOCATION Expected Future Capital Allocation Capex approximately $60 million per yearPay down debt with cash flow from operations (Dollars in millions and shares in thousands) 1 As of year-end. 1 1

DEBT, INTEREST AND CASH FLOW Long term debt includes: $300 million 2025 Senior Bond Note, $275 million 2023 Senior Bond Note, long term portion of line of credit and long term leases. Short term debt includes: short term portion of line of credit less cash1 Non-GAAP measure – See Appendix for the definition and reconciliation to the most comparable GAAP measure. 2 10 (Dollars in millions) ($14.2) 1 Long-term debt includes: long-term Senior Bond Notes, long-term portion of line-of-credit, term loan B, and long-term financing leases. Short-term debt includes: short-term portion of line of credit less cash and cash equivalents. 2 This is not a covenant. Total leverage ratio is calculated as the total net debt to rolling four quarter total adjusted EBITDA plus franchise taxes and other reoccurring non-cash items. $24 $78 Lower due to Shelby, NC expansion and working capital needs 1 ($16.2) $50

Q4’19 ADJUSTED EBITDA OUTLOOK1 , ADJUSTED EARNINGS OUTLOOK1 AND RECONCILIATION OF NON-GAAP FINANCIAL MEASURES (UNAUDITED) 1 This information is based upon management’s current expectations and estimates, which are in part based on market and industry data. Many factors are outside the control of management, including input costs for commodity products, and actual results may differ materially from the information set forth above. See “Forward-Looking Statements” on page 2.2 EBITDA is a non-GAAP measure that management uses as a supplemental performance measure. The most directly comparable GAAP measure is net earnings (loss). EBITDA is net earnings (loss) adjusted for net interest expense, income taxes, and depreciation and amortization. It should not be considered as an alternative to net earnings (loss) computed under GAAP.3 Adjusted EBITDA excludes the impact of the items listed that we do not believe are indicative of our core operating performance. 4 Adjusted operating income, Adjusted net earnings (loss) and Adjusted net earnings (loss) per diluted common share exclude the impact of the items listed that we do not believe are indicative of our core operating performance. 5 Tax effect was calculated using a quarterly tax rate ranging from 3% to 30%.6 GAAP net earnings (loss) per diluted common share and Adjusted net earnings (loss) per diluted common share are calculated utilizing third quarter 2019 diluted average common shares outstanding of 16,539 (in thousands). OUTLOOK THREE MONTHS ENDINGDECEMBER 31, 2019 RANGE OF ESTIMATE (Dollars in thousands) FROM TO Earnings before interest, income taxes, and depreciation & amortization (EBITDA)2: GAAP net (loss) earnings ($4,900 ) $1,050 Interest expense, net 12,600 12,700 Income tax (benefit) provision (2,000 ) (50 ) Depreciation and amortization expense 28,800 28,800 EBITDA2 $34,500 $42,500 Directors' equity-based compensation expense 350 350 Non-operating pension and OPEB costs 1,400 1,400 Reorganization related expenses 1,750 1,750 Adjusted EBITDA3 $38,000 $46,000 11 (Dollars in thousands) FROM TO GAAP net loss ($4,900 ) $1,050 Adjustments, after tax5: Directors' equity-based compensation expense 250 300 Non-operating pension and OPEB costs 950 1,350 Reorganization related expenses 1,200 1,700 Adjusted net (loss) earnings4 ($2,500 ) $4,400 FROM TO GAAP net loss per diluted common share6 ($0.30 ) $0.06 Adjusted net (loss) earnings per diluted common share4,6 ($0.15 ) $0.27 OUTLOOK THREE MONTHS ENDINGDECEMBER 31, 2019 RANGE OF ESTIMATE (Dollars in thousands) FROM TO GAAP Operating Income $7,500 $15,500 Directors' equity-based compensation expense 350 350 Non-operating pension and OPEB costs 1,400 1,400 Reorganization related expenses 1,750 1,750 Adjusted operating income4 $11,000 $19,000 Adjusted EBITDA Outlook Adjusted Net Earnings (Loss) Outlook

Q4'19 OUTLOOK1 1% - 2% Lower 2.5% - 4.5% $38M - $46M ($0.15) - $0.27 NET SALES ADJUSTED OPERATING MARGIN2,3 ADJUSTED EBITDA2 ADJUSTED NET (LOSS) EARNINGS PER DILUTED COMMON SHARE2,4 1 This information is based upon management’s current expectations and estimates, which are in part based on market and industry data. Many factors are outside the control of management, including input costs for commodity products, and actual results may differ materially from the information set forth above. See “Forward-Looking Statements” on page 2.2 Non-GAAP measure – See prior slides for the reconciliation to the most comparable GAAP measure.3 Adjusted operating margin is defined as net sales divided by adjusted operating income.4 Adjusted net earnings (loss) per diluted common share is calculated utilizing third quarter 2019 diluted average common shares outstanding of 16,539 (in thousands). 12
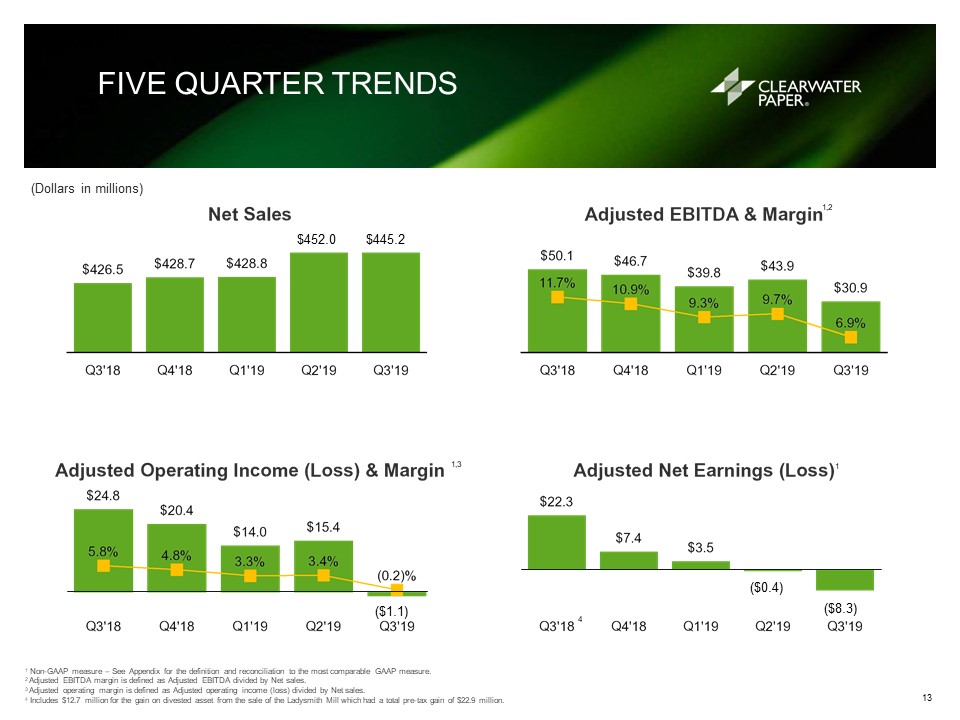
FIVE QUARTER TRENDS 1 Non-GAAP measure – See Appendix for the definition and reconciliation to the most comparable GAAP measure.2 Adjusted EBITDA margin is defined as Adjusted EBITDA divided by Net sales.3 Adjusted operating margin is defined as Adjusted operating income (loss) divided by Net sales. 4 Includes $12.7 million for the gain on divested asset from the sale of the Ladysmith Mill which had a total pre-tax gain of $22.9 million. (Dollars in millions) 1 1,2 1 1,3 13 4 $452.0 ($0.4) $445.2 ($1.1) ($8.3)

FIVE QUARTER SEGMENT TRENDS 1 Non-GAAP measure - See Appendix for the definition and reconciliation to the most comparable GAAP measure.2 Non-GAAP measure - Segment Adjusted EBITDA margin is defined as Segment Adjusted EBITDA divided by Segment net sales. Consumer Products Pulp & Paperboard Total Net Sales Adj. EBITDA & Margin 14 (Dollars in millions) 1,2

Major Maintenance Schedule 15 None Arkansas $25 - $26 $22 $18 $30 (Dollars in millions) 1 This information is based upon management’s current expectations and estimates, as well as historical averages. Many factors are outside the control of management, and actual results may differ materially from the information set forth above. See “Forward-Looking Statements” on page 2. 2019: Idaho mill in Q3 and Arkansas mill in Q4 Idaho Idaho $19 1 1 1 1 $6 - $7 $23 - $27 $15 - $20 None

COGS Input Unit of Measure Approximated Annual Volume1 (in Millions) $ Change Per Unit1 +/- Approximated Annual expected EBITDA2 Impact +/- (in Millions) Purchased Pulp Ton 0.27 $20.00 $5.4 Fiber Bone Dry Ton 1.5 $4.00 $6.0 Diesel Gallon 10.0 $0.50 $5.0 Electric MWh 1.0 $5.00 $5.0 Natural Gas MMBTU 10.25 $0.50 $5.1 Polyethylene Pound 30.0 $0.20 $6.0 Caustic Pound 90.0 $0.06 $5.4 Chlorate Pound 30.0 $0.20 $6.0 KEY COMMODITY CONSUMPTION VOLUMES 16 1 Approximated annual volume and expense amounts are based on historical average consumption and management's current expectations and estimates with respect to future volumes and expense, and these amounts may be significantly influenced by general market conditions and other factors outside of our control. Actual results may differ materially from the information set forth above. See "Forward-Looking Statements" on page 2. 2 Non-GAAP measure.

APPENDIX &RECONCILIATIONS 17

FINANCIAL SUMMARY (GAAP BASIS)(UNAUDITED) (Dollars in thousands - except per-share amounts) Q3'18 Q4'18 Q1'19 Q2'19 Q3'19 Net sales $426,460 $428,707 $428,779 $451,993 $445,188 Gross Profit $50,239 $46,503 $44,533 $42,168 $26,484 Selling, general and administrative expenses ($26,283 ) ($27,161 ) ($30,171 ) ($26,827 ) ($28,944 ) Operating income (loss) $46,900 ($174,729 ) $14,362 $15,341 ($2,460 ) Consumer Products ($1,269 ) $513 $1,271 ($5,133 ) ($4,438 ) Gain on divested assets $22,944 $1,008 $— $— $— Goodwill impairment $— ($195,079 ) $— $— $— Pulp and Paperboard $38,280 $31,800 $29,388 $33,587 $17,098 Corporate ($13,055 ) ($12,971 ) ($16,297 ) ($13,113 ) ($15,120 ) Operating margin 11.0 % (40.8 )% 3.3 % 3.4 % (0.6 )% Interest expense, net ($7,547 ) ($7,330 ) ($8,486 ) ($10,914 ) ($13,077 ) Debt retirement costs $— $— $— $— ($2,725 ) Non-operating pension and other postretirement benefit costs ($1,234 ) ($1,233 ) ($1,314 ) ($1,531 ) ($1,421 ) Income tax (provision) benefit ($3,675 ) ($4,480 ) ($725 ) ($3,320 ) $8,710 Net earnings (loss) $34,444 ($187,772 ) $3,837 ($424 ) ($10,973 ) Net earnings (loss) per diluted common share $2.08 ($11.39 ) $0.23 ($0.03 ) ($0.66 ) Cash flow from operations $10,211 $47,800 ($29,399 ) $44,121 ($30,957 ) Cash capital expenditures $95,434 $121,674 $71,588 $36,831 $17,375 18 1 In the first quarter of 2018, we adopted a new accounting standard that resulted in a change in the presentation of pension and postretirement benefit costs other than service costs on a line outside of operating income. Beginning in the first quarter of 2019, the Company is excluding these non-operating costs from the calculation of Adjusted EBITDA. The corresponding prior period amounts have been reclassified to conform with the current period presentation.

FINANCIAL SUMMARY (ADJUSTED BASIS)(UNAUDITED) 1 Non-GAAP measure - See Appendix for the definition and reconciliation to the most comparable GAAP measure. 2 Adjusted gross profit margin is defined as Adjusted gross profit divided by Net sales. 3 Adjusted operating margin is defined as Adjusted operating income divided by Net sales.4 In the first quarter of 2018, we adopted a new accounting standard that resulted in a change in the presentation of pension and postretirement benefit costs other than service costs on a line outside of operating income. Beginning in the first quarter of 2019, the Company is excluding these non-operating costs from the calculation of Adjusted EBITDA. The corresponding prior period amounts have been reclassified to conform with the current period presentation. 5 Adjusted EBITDA margin is defined as Adjusted EBITDA divided by Net sales.6 Total leverage ratio is calculated as the total net debt to rolling four quarter total adjusted EBITDA plus franchise taxes and other reoccurring non-cash items.7 Net Debt includes long-term Senior Bond Notes, term loan B, long-term financing leases, line of credit, less cash and cash equivalents.8 This information is based upon management’s current expectations and estimates, which are in part based on market and industry data. Many factors are outside the control of management, including particularly input costs for commodity products, and actual results may differ materially from the information set forth above. See “Forward-Looking Statements” on page 2. (Dollars in thousands - except per-share amounts) Q3'18 Q4'18 Q1'19 Q2'19 Q3'19 Q4'19 Outlook8 Net sales $426,460 $428,707 $428,779 $451,993 $445,188 1% - 2% Lower Adjusted gross profit1 $50,399 $46,601 $44,533 $42,168 $26,484 Adjusted gross profit margin1,2 11.8 % 10.9 % 10.4 % 9.3 % 5.9 % Adjusted selling, general and administrative expenses1 ($25,644 ) ($26,182 ) ($30,521 ) ($26,744 ) ($27,590 ) Adjusted operating income (loss)1 $24,755 $20,419 $14,012 $15,424 ($1,106 ) Consumer Products ($1,024 ) $852 $1,271 ($5,133 ) ($4,438 ) Pulp and Paperboard $38,351 $31,806 $29,388 $33,587 $17,098 Corporate ($12,572 ) ($12,239 ) ($16,647 ) ($13,030 ) ($13,766 ) Adjusted operating margin1,3 5.8 % 4.8 % 3.3 % 3.4 % (0.2 )% 2.5% - 4.5% Interest expense, net ($7,547 ) ($7,330 ) ($8,486 ) ($10,914 ) ($13,077 ) Non-operating pension and other postretirement benefit costs4 ($1,234 ) ($1,233 ) ($1,314 ) ($1,531 ) ($1,421 ) Debt retirement costs $— $— $— $— ($2,725 ) Adjusted net earnings (loss)1 $22,289 $7,362 $3,508 ($390 ) ($8,292 ) Depreciation and amortization expense $25,342 $26,267 $25,836 $28,517 $31,990 Adjusted EBITDA1,4 $50,097 $46,686 $39,848 $43,941 $30,884 $38,000 - $46,000 Consumer Products $13,423 $15,672 $16,042 $12,298 $14,587 Pulp and Paperboard $47,667 $41,498 $38,873 $43,078 $28,266 Corporate4 ($10,993 ) ($10,484 ) ($15,067 ) ($11,435 ) ($11,969 ) Adjusted EBITDA margin1,4,5 11.7 % 10.9 % 9.3 % 9.7 % 6.9 % Adjusted net earnings (loss) per diluted common share1 $1.35 $0.45 $0.21 ($0.02 ) ($0.50 ) Total Leverage Ratio6 3.75 4.29 4.97 4.99 5.70 Net Debt7 $719,364 $772,818 $886,532 $889,576 $946,114 19

1 Includes away-from-home (AFH), contract and parent roll tissue products. 2 Includes retail, AFH, and contract tissue case products.3 Shipments and Sales Price exclude Scrap Sales beginning in the fourth quarter of 2018. KEY SEGMENT RESULTS(UNAUDITED) Q3'18 Q4'18 Q1'19 Q2'19 Q3'19 Consumer Products Shipments Retail (short tons) 70,335 69,480 73,356 76,175 79,526 Non-Retail (short tons)1 18,525 11,500 10,266 6,623 6,882 Total Tissue Tons 88,860 80,980 83,622 82,798 86,408 Converted Products (cases in thousands)2 11,789 11,621 12,320 12,488 13,162 Sales Price Retail ($/short ton)1 $2,615 $2,776 $2,789 $2,764 $2,707 Non-Retail ($/short ton)1 $1,491 $1,727 $1,799 $1,851 $1,805 Total Tissue ($/short ton) $2,381 $2,627 $2,667 $2,691 $2,635 Segment net sales ($ in thousands) $211,642 $212,743 $223,336 $224,340 $228,544 20 Pulp and Paperboard Shipments Paperboard (short tons)3 218,135 218,322 202,834 225,188 214,537 Sales Price Paperboard ($/short ton)3 $985 $982 $1,001 $1,004 $1,004 Segment net sales ($ in thousands) $214,818 $215,964 $205,443 $227,653 $216,644

CLEARWATER PAPER SEGMENT SHIPMENTS AND U.S. MARKET U.S. Retail Tissue Market Q3'19 ($) (Total U.S, - All Outlets)1 CATEGORY PRIVATELABEL BRANDS TOTAL Total Retail Tissue Share ($) 31 % 69 % 100 % % Change Q3'19 vs. Q3’18 1.7 % (1.7 )% — % 1 Data Source: IRI Worldwide Consumer Panel data through September 8, 2019. CLW Q3'19 by Retail Tissue Market Segment (% of Tons) 21 Other 1% Folding Liquid Pkg Food Service CLW Q3'19 by U.S. Paperboard Market Segment (% of Tons) U.S. Paperboard Production Q3'193 CATEGORY CLEARWATER PAPER OTHER Total Domestic SBS1 Market Share 14 % 86 % Folding 19 % 81 % Food Service2 14 % 86 % Liquid Packaging 4 % 96 % 1 Solid Bleached Sulfate.2 Food Service includes cup, plate, dish and tray products.3 Data Source: American Forest and Paper Association Solid Bleached Domestic Production – September 30, 2019. Retail AFH Parent Rolls

ADJUSTED GROSS PROFIT& ADJUSTED SG&ARECONCILIATION OF NON-GAAPFINANCIAL MEASURES (UNAUDITED) 1 Gross profit is defined as net sales minus cost of sales.2 Adjusted gross profit and Adjusted selling, general and administrative expenses exclude the impact of the items listed that we do not believe are indicative of our core operating performance. (Dollars in thousands) Q3'18 Q4'18 Q1'19 Q2'19 Q3'19 Gross profit1 $50,239 $46,503 $44,533 $42,168 $26,484 Reorganization expenses associated with SG&A cost control measures 2 — — — — Reorganization related expenses 158 98 — — — Adjusted gross profit2 $50,399 $46,601 $44,533 $42,168 $26,484 Selling, general and administrative expenses (SG&A) ($26,283 ) ($27,161 ) ($30,171 ) ($26,827 ) ($28,944 ) Directors' equity-based compensation expense (benefit) 769 (410 ) (350 ) 31 420 Reorganization expenses associated with SG&A cost control measures 208 545 — — — Other (338 ) 844 — — — Reorganization related expenses — — — 52 934 Adjusted selling, general and administrative expenses2 ($25,644 ) ($26,182 ) ($30,521 ) ($26,744 ) ($27,590 ) 22

SEGMENT ADJUSTED OPERATING INCOME (LOSS)RECONCILIATION OF NON-GAAP FINANCIAL MEASURES (UNAUDITED) 1 Operating income (loss) for Q3'18 and Q4'18 includes $22.9 million and $1.0 million, respectively, for the gain on divested assets, net.2 Adjusted operating income (loss) excludes the impact of the items listed that we do not believe are indicative of our core operating performance. (Dollars in thousands) Q3'18 Q4'18 Q1'19 Q2'19 Q3'19 Consumer Products Operating income (loss)1 $21,675 ($193,558 ) $1,271 ($5,133 ) ($4,438 ) Reorganization expenses associated with SG&A cost control measures 87 241 — — — Reorganization related expenses 158 98 — — — Gain on divested assets, net (22,944 ) (1,008 ) — — Goodwill impairment — 195,079 — — — Adjusted Consumer Products operating (loss) income2 ($1,024 ) $852 $1,271 ($5,133 ) ($4,438 ) Pulp and Paperboard Operating income $38,280 $31,800 $29,388 $33,587 $17,098 Reorganization expenses associated with SG&A cost control measures 71 6 — — — Adjusted Pulp and Paperboard operating income2 $38,351 $31,806 $29,388 $33,587 $17,098 Corporate Operating loss ($13,055 ) ($12,971 ) ($16,297 ) ($13,113 ) ($15,120 ) Directors' equity-based compensation expense (benefit) 769 (410 ) (350 ) 31 420 Reorganization expenses associated with SG&A cost control measures 52 298 — — — Other (338 ) 844 — — — Reorganization related expenses — — — 52 934 Adjusted Corporate operating loss2 ($12,572 ) ($12,239 ) ($16,647 ) ($13,030 ) ($13,766 ) 23

ADJUSTED NET EARNINGS & ADJUSTED NET EARNINGS PER DILUTED COMMON SHARE RECONCILIATION OF NON-GAAP FINANCIAL MEASURES (UNAUDITED) 1 Tax effect was calculated using the estimated annual effective tax rate for the period presented.2 Adjusted net earnings (loss) and Adjusted net earnings (loss) per diluted common share exclude the impact of the items listed that we do not believe are indicative of our core operating performance. (Dollars in thousands - except per-share amounts) Q3'18 Q4'18 Q1'19 Q2'19 Q3'19 GAAP net earnings (loss) $34,444 ($187,772 ) $3,837 ($424 ) ($10,973 ) Adjustments, after tax1: Directors' equity-based compensation expense (benefit) 524 (337 ) (329 ) 13 276 Reorganization expenses associated with SG&A cost control measures 143 447 — — — Reorganization related expenses 108 80 — 21 614 Other (250 ) 693 — — — Gain on divested assets, net (12,680 ) (828 ) — — — Goodwill impairment — 195,079 — — — Debt retirement costs — — — — 1,791 Adjusted net earnings (loss)2 $22,289 $7,362 $3,508 ($390) ($8,292) Net earnings (loss) per diluted common share $2.08 ($11.39 ) $0.23 ($0.03 ) ($0.66 ) Adjustments, after tax1: Directors' equity-based compensation expense (benefit) 0.03 (0.02 ) (0.02 ) — 0.01 Reorganization expenses associated with SG&A cost control measures 0.01 0.03 — — — Reorganization related expenses 0.01 0.01 — — 0.04 Other (0.02 ) 0.04 — — — Gain on divested assets, net (0.76 ) (0.05 ) — — — Goodwill impairment — 11.83 — — — Debt retirement costs — — — — 0.11 Adjusted net earnings (loss) per diluted common share2 $1.35 $0.45 $0.21 ($0.02) ($0.50) 24

EBITDA & ADJUSTED EBITDA RECONCILIATION OF NON-GAAP FINANCIAL MEASURES (UNAUDITED) 1 EBITDA is a non-GAAP measure that management uses as a supplemental performance measure. The most directly comparable GAAP measure is net earnings (loss). EBITDA is net earnings (loss) adjusted for net interest expense (including debt retirement costs), income taxes, and depreciation and amortization. It should not be considered as an alternative to net earnings (loss) computed under GAAP.2 Interest expense, net for the third quarter 2019 includes debt retirement costs of $2.7 million.3 Adjusted EBITDA excludes the impact of the items listed that we do not believe are indicative of our core operating performance. 4 In the first quarter of 2018, we adopted a new accounting standard that resulted in a change in the presentation of pension and postretirement benefit costs other than service costs on a line outside of operating income. Beginning in the first quarter of 2019, the Company is excluding these non-operating costs from the calculation of Adjusted EBITDA. The corresponding prior period amounts have been reclassified to conform with the current period presentation. (Dollars in thousands) Q3'18 Q4'18 Q1'19 Q2'19 Q3'19 Earnings before interest, income taxes, depreciation & amortization (EBITDA)1 GAAP net earnings (loss) $34,444 ($187,772 ) $3,837 ($424 ) ($10,973 ) Interest expense, net2 7,547 7,330 8,486 10,914 15,802 Income tax provision (benefit) 3,675 4,480 725 3,320 (8,710 ) Depreciation and amortization expense 25,342 26,267 25,836 28,517 31,990 EBITDA1 $71,008 ($149,695 ) $38,884 $42,327 $28,109 Directors' equity-based compensation expense (benefit) 769 (410 ) (350 ) 31 420 Reorganization expenses associated with SG&A cost control measures 210 545 — — — Reorganization related expenses 158 98 — 52 934 Other (338 ) 844 — — — Gain on divested assets, net (22,944 ) (1,008 ) — — — Goodwill impairment — 195,079 — — — Non-operating pension and other postretirement benefit costs4 1,234 1,233 1,314 1,531 1,421 Adjusted EBITDA3,4 $50,097 $46,686 $39,848 $43,941 $30,884 25

SEGMENT EBITDA & ADJUSTED EBITDA RECONCILIATION OF NON-GAAPFINANCIAL MEASURES (UNAUDITED) 1 Segment EBITDA is a non-GAAP measure that management uses as a supplemental performance measure. The most directly comparable GAAP measure is segment operating income (loss). Segment EBITDA is segment operating income (loss) adjusted for depreciation and amortization and non-operating pension and other postretirement benefit costs. It should not be considered as an alternative to segment operating income (loss) computed under GAAP. 2 Segment Adjusted EBITDA excludes the impact of the items listed that we do not believe are indicative of our core operating performance. 3Operating income for Q3'18 and Q4'18 includes $22.9 million and $1.0 million, respectively, for the gain on divested assets, net.4 In the first quarter of 2018, we adopted a new accounting standard that resulted in a change in the presentation of pension and postretirement benefit costs other than service costs on a line outside of operating income. Beginning in the first quarter of 2019, the Company is excluding these non-operating costs from the calculation of Adjusted EBITDA. The corresponding prior period amounts have been reclassified to conform with the current period presentation. 5 Segment Adjusted EBITDA Margin is defined as Segment EBITDA divided by Segment net sales. (Dollars in thousands) Q3'18 Q4'18 Q1'19 Q2'19 Q3'19 Consumer Products Consumer Products segment net sales $211,642 $212,743 $223,336 $224,340 $228,544 Operating income (loss)3 $21,675 ($193,558 ) $1,271 ($5,133 ) ($4,438 ) Depreciation and amortization expense 14,447 14,820 14,771 17,431 19,025 Segment EBITDA1 $36,122 ($178,738 ) $16,042 $12,298 $14,587 Reorganization expenses associated with SG&A cost control measures 87 241 — — — Reorganization related expenses 158 98 — — — Gain on divested assets, net (22,944 ) (1,008 ) — — — Goodwill impairment — 195,079 — — — Consumer Products Segment Adjusted EBITDA2,4 $13,423 $15,672 $16,042 $12,298 $14,587 Consumer Products Segment Adjusted EBITDA Margin5 6.3 % 7.4 % 7.2 % 5.5 % 6.4 % Pulp and Paperboard Pulp and Paperboard segment net sales $214,818 $215,964 $205,443 $227,653 $216,644 Operating income $38,280 $31,800 $29,388 $33,587 $17,098 Depreciation and amortization expense 9,316 9,692 9,485 9,491 11,168 Segment EBITDA1 $47,596 $41,492 $38,873 $43,078 $28,266 Reorganization expenses associated with SG&A cost control measures 71 6 — — — Pulp and Paperboard Segment Adjusted EBITDA2,4 $47,667 $41,498 $38,873 $43,078 $28,266 Pulp and Paperboard Segment Adjusted EBITDA Margin5 22.2 % 19.2 % 18.9 % 18.9 % 13.0 % Corporate Operating loss ($13,055 ) ($12,971 ) ($16,297 ) ($13,113 ) ($15,120 ) Depreciation and amortization expense 1,579 1,755 1,580 1,595 1,797 Non-operating pension and other postretirement benefit costs4 (1,234 ) (1,233 ) (1,314 ) (1,531 ) (1,421 ) Corporate EBITDA1 ($12,710 ) ($12,449 ) ($16,031 ) ($13,049 ) ($14,744 ) Directors' equity-based compensation expense (benefit) 769 (410 ) (350 ) 31 420 Reorganization expenses associated with SG&A cost control measures 52 298 — — — Other (338 ) 844 — — — Non-operating pension and other postretirement benefit costs4 1,234 1,233 1,314 1,531 1,421 Reorganization related expenses — — — 52 934 Corporate Adjusted EBITDA2,4 ($10,993 ) ($10,484 ) ($15,067 ) ($11,435 ) ($11,969 ) 26

RECONCILIATION OF GAAP TO NON-GAAP: STRATEGIC CAPITAL INVESTMENTS (UNAUDITED) 1 This information is based upon management’s current expectations and estimates, which are in part based on market and industry data. Many factors are outside the control of management, including input costs for commodity products, and actual results may differ materially from the information set forth above. See “Forward-Looking Statements” on page 2.2Non-GAAP measure – See Appendix for the definition. FULL RUN-RATE EXPECTED ADJUSTED EBITDA2 IMPACT (Dollars in millions) Shelby Expansion1 Lewiston Pulp Optimization 1 Expected operating income $38.0 - $48.0 $17.5 - $27.5 Expected depreciation $17.0 $7.5 Expected EBITDA2 $55 - $65 $25 - $35 Expected Adjusted EBITDA2 $55 - $65 $25 - $35 27

FOR MORE INFORMATION:WWW.CLEARWATERPAPER.COM 28