 Clearwater Paper Corporation March 2013 Exhibit 99.1 |
 1 Forward-Looking Statements This presentation contains, in addition to historical information, certain forward-looking statements within the meaning of the Private Securities Litigation Reform Act of 1995, including statements regarding our strategies to grow our business, optimize profitability and build a high performance culture, North American tissue and paperboard market demand, expected tissue capacity increases, production and shipments from our new tissue machine and converting lines in Shelby, North Carolina, expected future savings from cost synergies relating to our Cellu Tissue acquisition, the aggregate dollar value of shares authorized to be repurchased pursuant to the stock repurchase program, uses and sufficiency of the company's cash, the company's future generation of discretionary free cash flow, the execution period for the stock repurchase program, shareholder returns, and the expected amount and timing of the additional return of capital to shareholders, efficiency projects and reductions to our cost structure, future growth and market opportunities, including in the Midwestern and Eastern U.S. regions and non-grocery channels, market segment dynamics, internal pulp production and requirements, customer purchases of private label tissue, production capacity of operating divisions and the expected benefit thereof, our capital allocation objectives, our EBITDA margins, our planned expansion into other product types, our financial priorities, including plans to de-lever through EBITDA expansion and revenue growth, our estimated Adjusted EBITDA run-rate, our implied enterprise value, equity value and share price, sales volumes, production, product volumes shipped, pricing for our products, pulpcosts, wood fiber costs and supply, chemical costs, transportation costs, energy costs, including natural gas, costs and timing of major maintenance and repairs, and our financial condition and results of operations. Words such as “anticipate,” “expect,” “intend,” “will,” “plan,” “goals,” “objectives,” “target,” “project,” “believe,” “schedule,” “estimate,” “may,” and similar expressions are intended to identify such forward-looking statements. These forward- looking statements are based on management’s current expectations, estimates, assumptions and projections that are subject to change. Our actual results of operations may differ materially from those expressed or implied by the forward-looking statements contained in this presentation. Important factors that could cause or contribute to such differences include the risk factors described in Item 1A of Part I of our Form 10-K for the year ended December 31, 2012, as well as the following: • difficulties with the optimization and realization of the benefits expected from our new through-air-dried paper machine and converting lines in Shelby, North Carolina; • increased dependence on wood pulp; • changes in the cost and availability of wood fiber and wood pulp; • changes in costs for and availability of packaging supplies, chemicals, energy and maintenance and repairs; • changes in transportation costs and disruptions in transportation services; • competitive pricing pressures for our products, including as a result of increased capacity as additional manufacturing facilities are operated by our competitors; • changes in customer product preferences and competitors' product offerings; • manufacturing or operating disruptions, including equipment malfunction and damage to our manufacturing facilities; • changes in the U.S. and international economies and in general economic conditions in the regions and industries in which we operate; • cyclical industry conditions; • reliance on a limited number of third-party suppliers for raw materials; • labor disruptions • our ability to generate cash; • fluctuations and volatility in the company's stock price; and • inability to successfully implement our expansion strategies. Forward-looking statements contained in this presentation present management’s views only as of the date of this presentation. We undertake no obligation to publicly update forward-looking statements, whether as a result of new information, future events or otherwise. |
 Agenda 2 |
 3 Overview of Clearwater Paper |
 4 • We are a company formed in late 2008 with more than 60 years of operating history • Operate two business segments of similar size – Pulp and Paperboard: 39% of 2012 net sales – Consumer Products: 61% of 2012 net sales • Financial overview – 2012 Net Sales: $1.9 billion – 2012 Adjusted EBITDA¹: $227.8 million – 2008 to 2012 Adjusted EBITDA¹ CAGR: 32% • Approximately 3,860 employees Introduction to Clearwater Paper Note: As of 31-Dec-2012 ¹ See Appendix for the definition of Adjusted EBITDA as well as the reconciliation to the most comparable GAAP measure. |
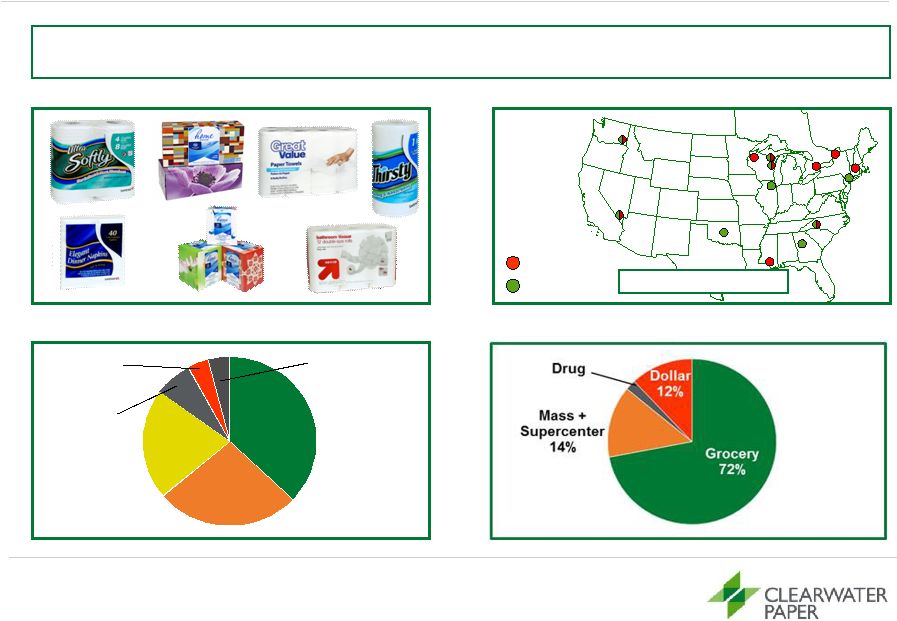 Overview of Consumer Tissue Division 5 Clearwater Paper is one of the largest North American manufacturers of private label tissue, focused on high value tissue products across all categories, retail channels and geographies Key Products Overview of Facilities 2012 U.S. Tissue Industry Retail Channel Mix² 2012 Clearwater Paper Retail Channel Mix² Clearwater Paper Tissue Converting Clearwater Paper Tissue Parent Roll Tissue Production¹: 585,000 tons Tissue Conversion¹: 477,000 tons Source: Company estimates, IRI Infoscan ¹ Represents 2012 production and conversion volumes including machine-glazed. ² Retail channel share by dollar amount sold. Grocery 37% Mass + Supercenter 27% Club 21% Drug 7% Dollar 4% All Other 4% |
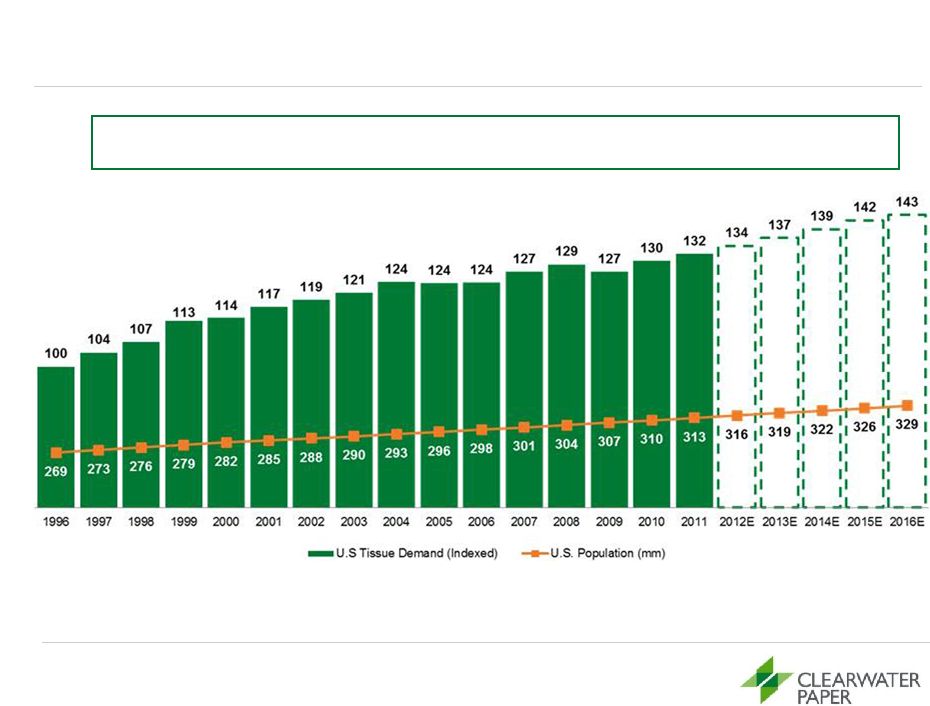 6 Clearwater Paper is Well Positioned to Capitalize on Favorable Tissue Market Dynamics Stable Growth - The tissue market has grown an average of 2% annually since 1996, consistent with population growth Source: U.S. Tissue demand per RISI, U.S. Population per U.S. Census Note: Projected U.S. Tissue Demand based on North American tissue demand estimates. |
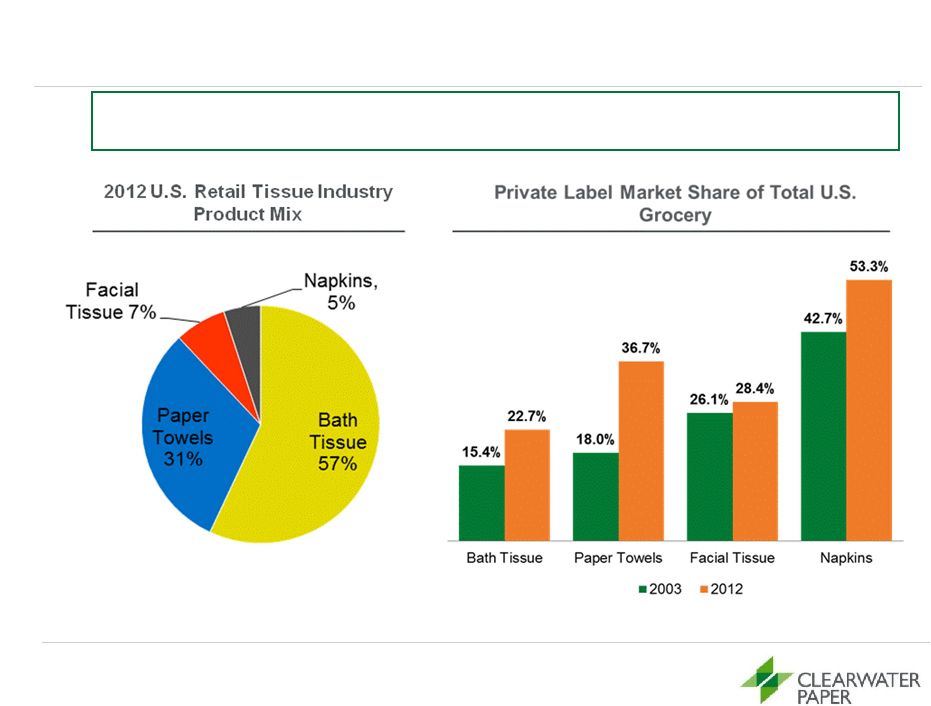 7 Private Label Continues to Capture Market Share in Tissue Clearwater Paper ranks as one of the largest North American private label tissue manufacturers Source: SymphonyIRI InfoScan, 52 Weeks Ending Feb 3, 2013. Based on volume of equalized cases. |
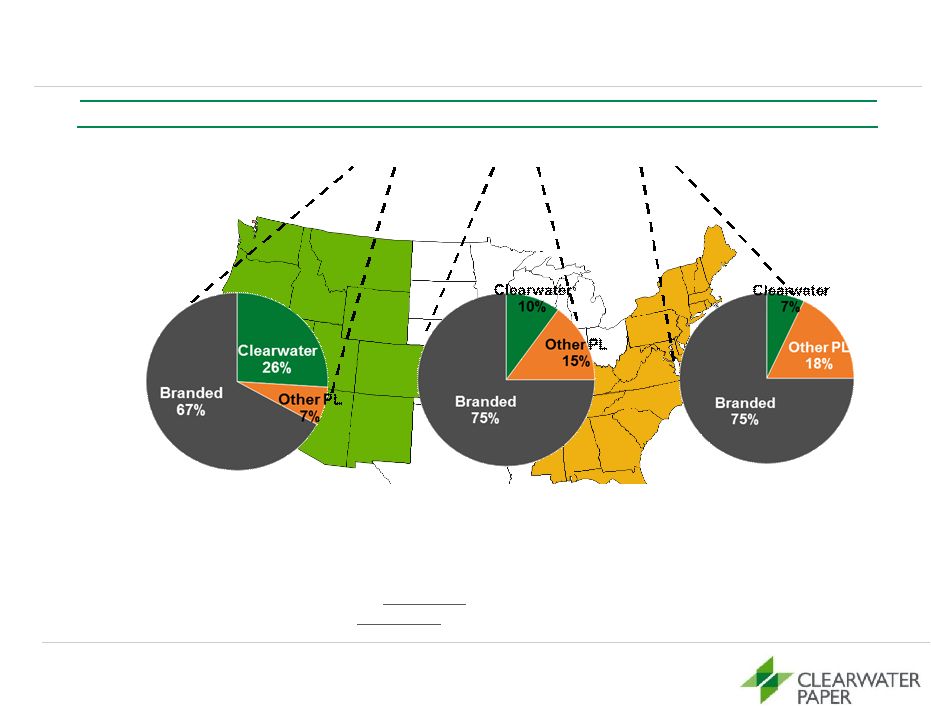 8 Significant Opportunity Still Exists for Clearwater Paper To Expand Across the U.S. Private Label Market • Clearwater Paper led the development of private label tissue in the Western U.S. • The Company is focused on growing the private label category and market share in the Eastern U.S. • If Clearwater could replicate its West model across the U.S.: –26% share in Midwest would be an incremental 28 million cases –26% share in East would be an incremental 44 million cases 2012 Multi-Outlet1 West Midwest East Total Equalized Case Volumes (mm) 84 178 230 493 % of U.S. Population 23% 34% 43% 100% % Private Label (PL) 33% 25% 25% 26% % Clearwater Paper of PL 81% 40% 28% 38% Source: SymphonyIRI InfoScan, 52 Weeks Ending Feb 3, 2013. 1 Multi-Outlet includes Grocery, Drug, Mass, Dollar and Military. Based on volume of equalized cases. |
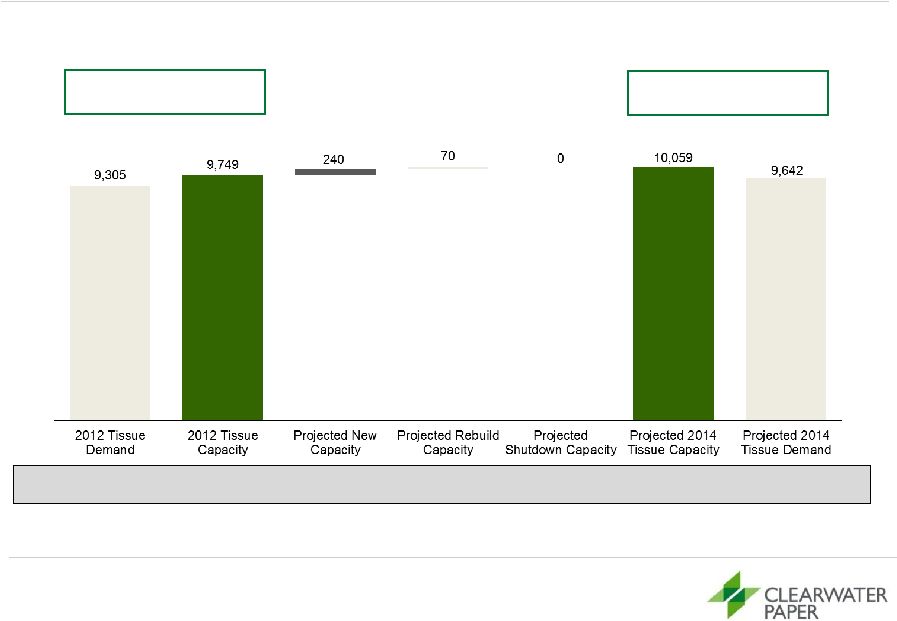 North American Market Demand Expected to Absorb Projected Capacity Increases 9 Source: RISI and company estimates Note: Projected capacity changes represents both virgin and recycled tissue capacity changes. Please see Appendix for breakdown of specific projects reflected in the capacity changes. (in thousands of short tons) 2012 Demand to Capacity Ratio of 95% 2014E Demand to Capacity Ratio of 96% Healthy market dynamics remain intact |
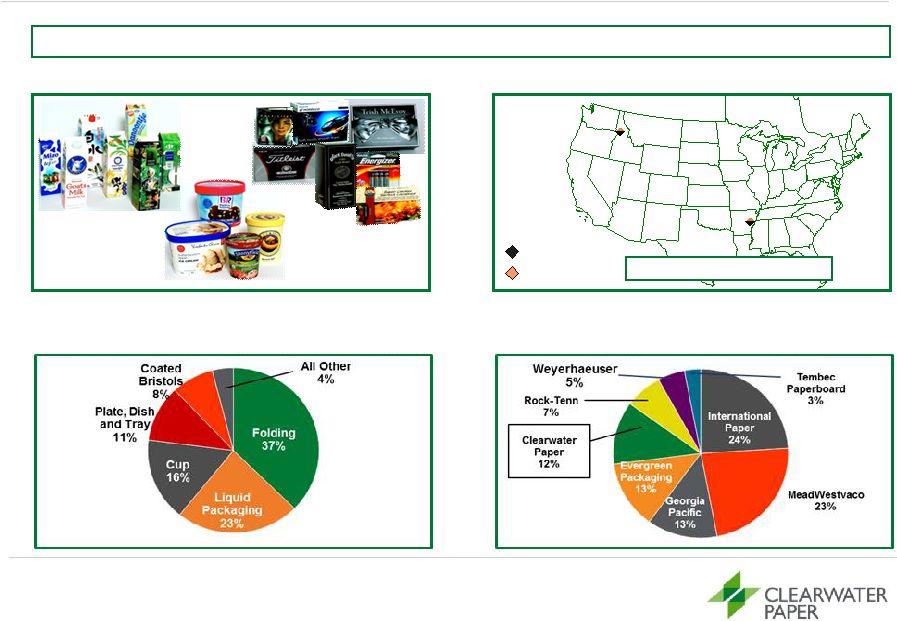 Overview of Pulp and Paperboard Division 10 Clearwater Paper ranks as one of the top five largest paperboard manufacturers in North America Key Products Overview of Facilities 2012E North American Bleached Paperboard Production by Product Type² 2012E North American Bleached Paperboard Production by Market Share Pulp Production¹: 842,000 tons Paperboard Production¹: 771,000 tons Clearwater Paper Pulp Clearwater Paper SBS Source: Company estimates, RISI ¹ Represents 2012 production volumes. ² Represents ~6.0 million tons. |
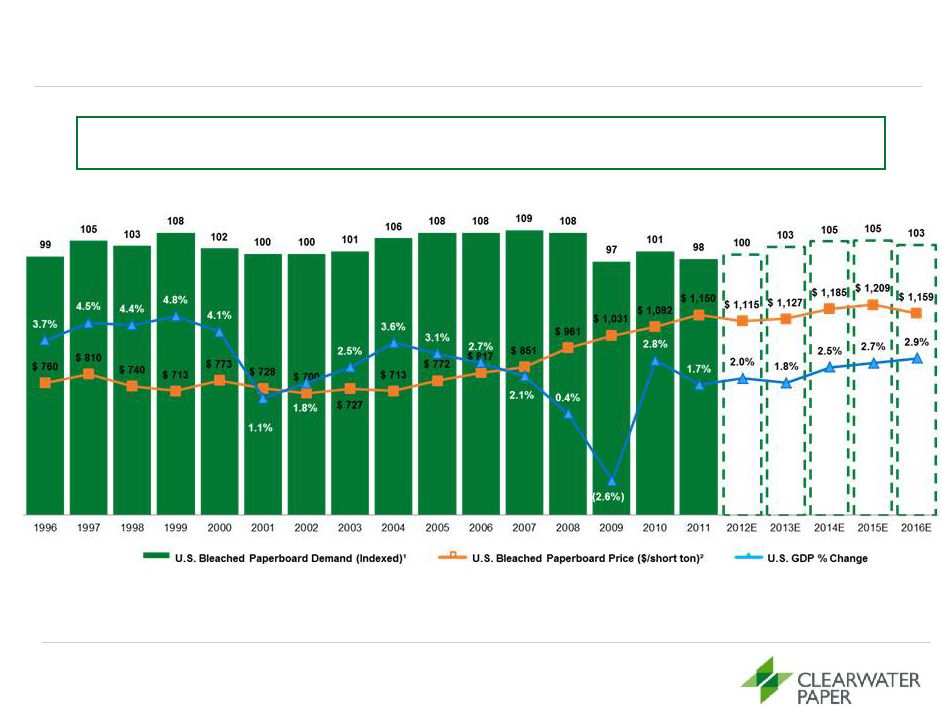 11 Paperboard Demand Remains Stable and Pricing Outlook is Favorable in the U.S. Source: RISI, Projected GDP growth estimates represent Bloomberg median estimates as of Feb-2013 ¹ Based on tons produced. Projections based on North American Packaging papers and board demand estimates per RISI. ² Average price per short ton of 16 pt. SBS folding carton C1S. Price estimates per RISI. Bleached paperboard prices are expected to remain at attractive levels through 2016 |
 12 Clearwater Paper’s Strategic Plan |
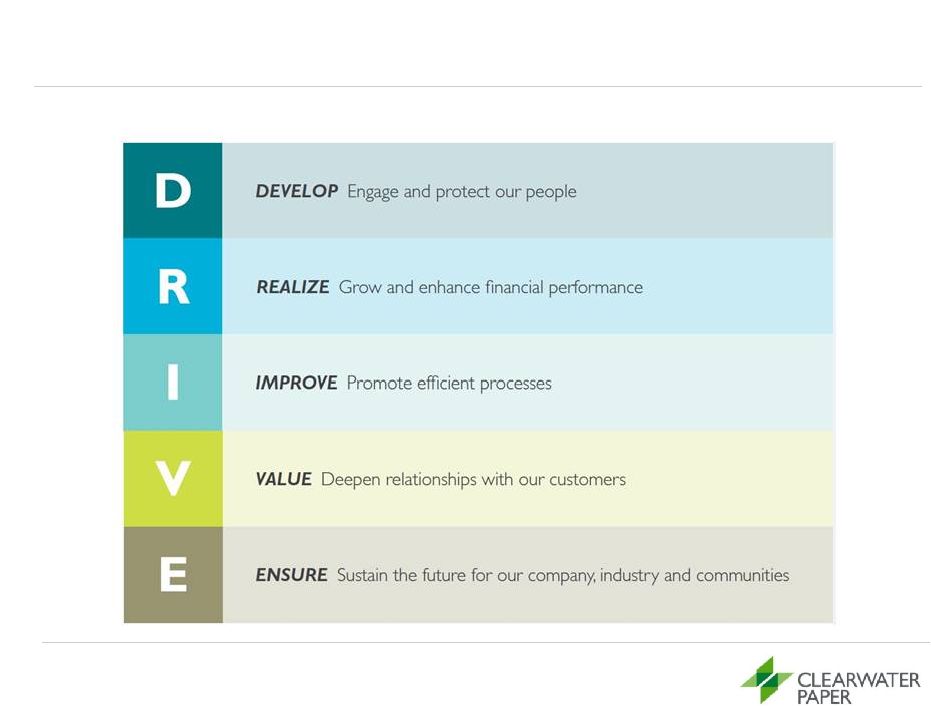
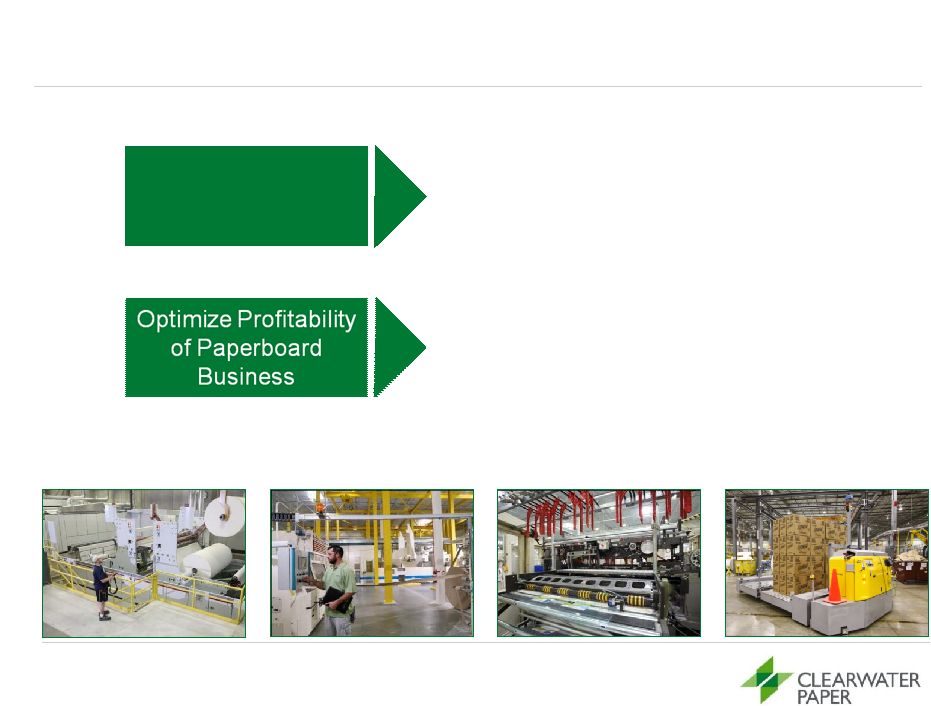 13 • Lead private label quality • Expand geographically • Expand retail channel penetration Our Macro Strategy to Create Shareholder Value Grow our Tissue Business • Improve sales mix • Reduce costs • Continue to improve quality |
 14 Our 3 Year Strategy |
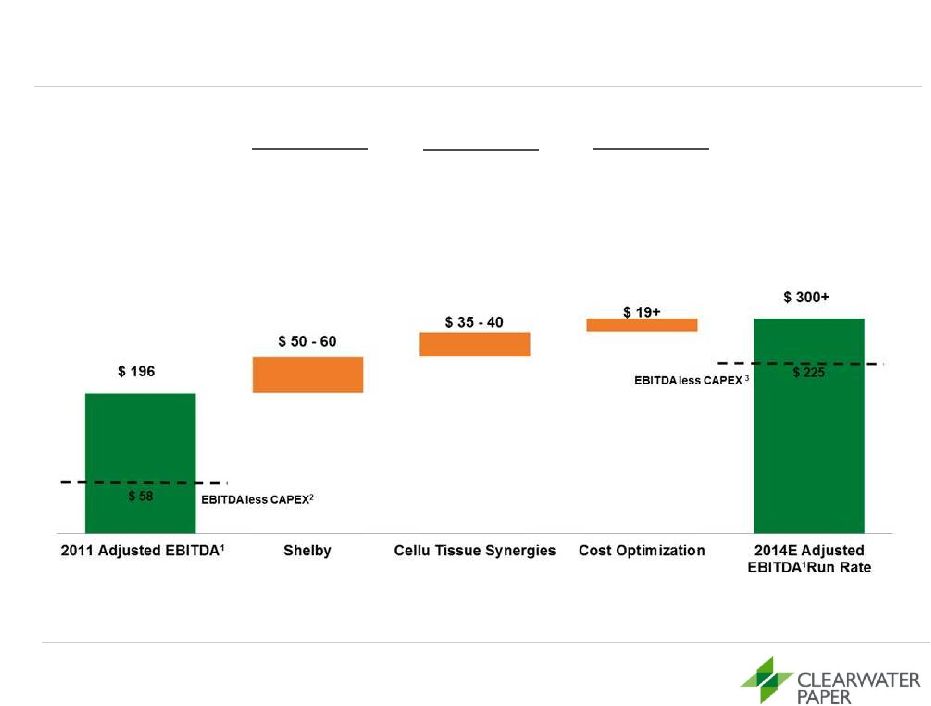 Key Initiatives Expected to Significantly Improve Earnings Power 15 ($ in millions) Shelby Ramp-up • Expected benefit from full ramp-up of TAD paper machine, 5 converting lines and LV PM Upgrades Realization of Full Cellu Tissue Synergies • Incremental savings expected from Cellu Tissue acquisition Cost Savings Programs • Expected benefit from lean manufacturing and cost optimization initiatives Note: Assumes no change in prices or input costs from 2011. ¹ See Appendix for the definition of Adjusted EBITDA as well as the reconciliation to the most comparable GAAP measure. 2 Defined as Adjusted EBITDA less Capex of $138 million. 3 Defined as Adjusted EBITDA less expected Capex of $75 million. |
 16 Clearwater Paper’s Value Proposition |
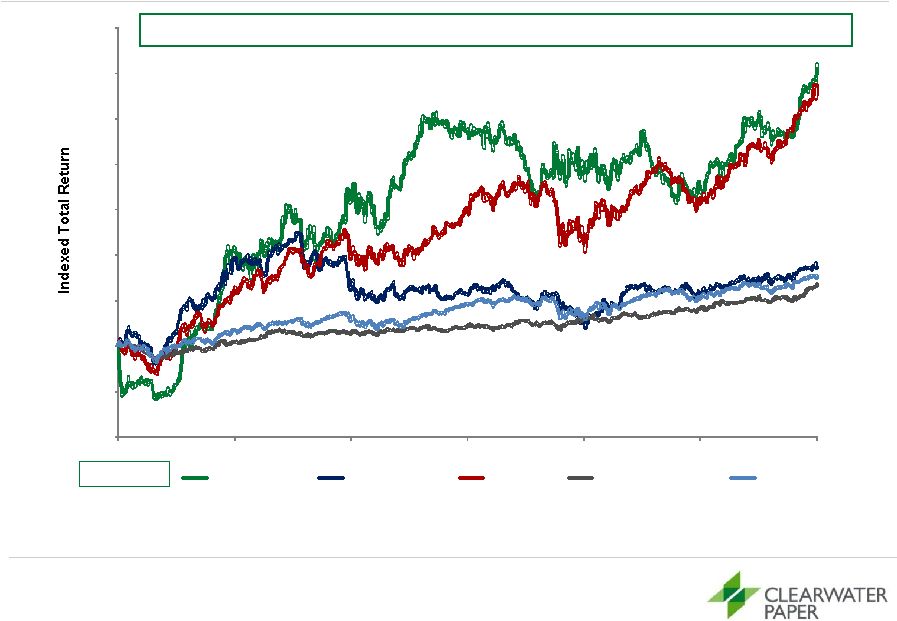 Clearwater Paper Leads its Peer Groups in Value Creation… 17 Source: Bloomberg as of 22-Feb-2013 1 Small cap tissue peers include Cascades, Orchids, and Wausau. ² Paperboard peers include International Paper, Graphic Packaging, Kapstone, MeadWestvaco, RockTenn, Packaging Corp, and Sonoco. ³ Large cap consumer product peers include Kimberly-Clark and Procter & Gamble. Note. Total Shareholder Return includes dividend reinvestment and stock price performance. 365%+ Total Return Since Spin-off Spin Date (20)% 40% 100% 160% 220% 280% 340% 400% 460% 520% Dec-2008 Aug-2009 May-2010 Jan-2011 Oct -2011 Jun-2012 Feb-2013 Clearwater Paper Small Cap Tissue¹ Paperboard² Large Cap Consumer³ S&P 500 369.5% 343.5% 103.4% 91.4% 81.7% |
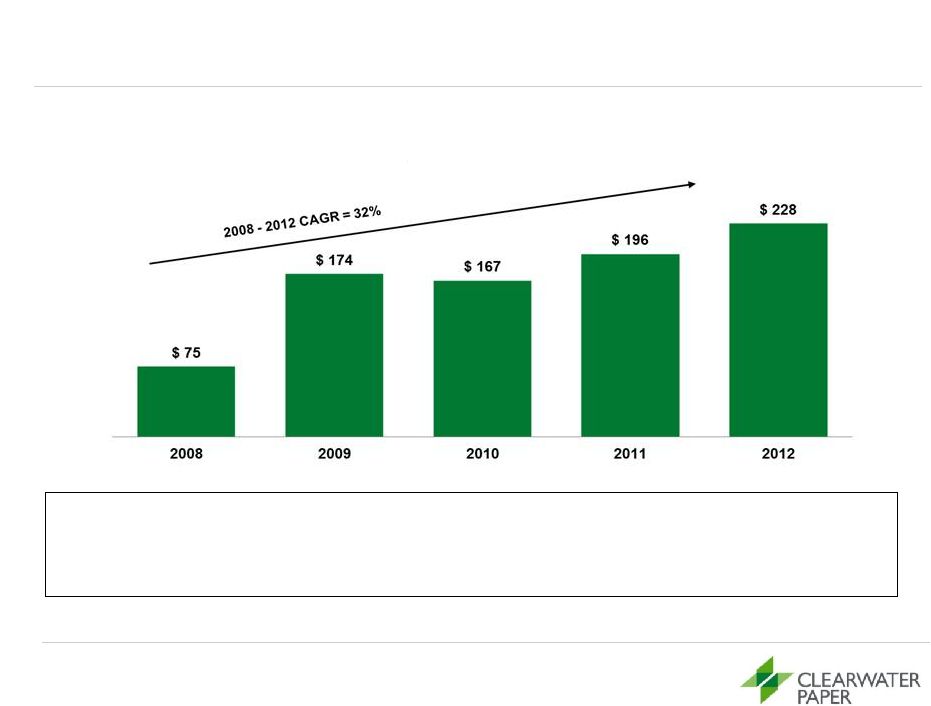 …Through a Proven Track Record of EBITDA Growth 18 ($ in millions) Source: RISI 1 See Appendix for the definition of Adjusted EBITDA as well as the reconciliation to the most comparable GAAP measure. ² Does not include amounts related to the Alternative Fuel Mixture Tax Credit, or AFMTC. Adjusted EBITDA 1,2 • We participate in the premier segments of the paper market: Bleached Paperboard and Tissue • Strong integration across business groups creates synergistic value |
 …And Successful Execution on Its Previously Stated Goals 19 Stated Goal Timeframe Current Status Complete New Paper Machine and Corresponding Converting Lines at Shelby, NC Facilities 2010 – 2013 Shelby TAD machine was on budget with startup in Q4 2012 with expected full capacity run rate by end of 2013 Operating 4 new converting lines at Shelby 5 line expected in 2013 Successfully Integrate Cellu Tissue Acquisition 2010 – 2013 Increased anticipated Cellu Tissue run-rate synergies from $15- 20 million per annum to $35-40 million per annum by end of 2012 Achieved $30 million in synergies in 2012, up from initial estimate of $20 million Expand the Geographic and Channel Reach of Clearwater Paper 2010 – Ongoing Cellu Tissue acquisition and Shelby, NC Facilities give Clearwater Paper a national footprint with expansion in the Eastern U.S. Increase penetration in grocery, drug, club and mass retail markets in the Eastern U.S. Expansion into away-from-home, parent roll sales, and machine glazed sales product types Optimize the Paperboard Business Ongoing Enhanced access to fiber supply with Lewiston chipping facility acquisition Sold Lewiston sawmill Installed chip screening at Lewiston pulp mill Maintain a Prudent Capital Structure Ongoing Conservative capital structure with target leverage through the cycle of 2.5x and ample liquidity Clearwater Paper continues to de-lever through EBITDA expansion th |
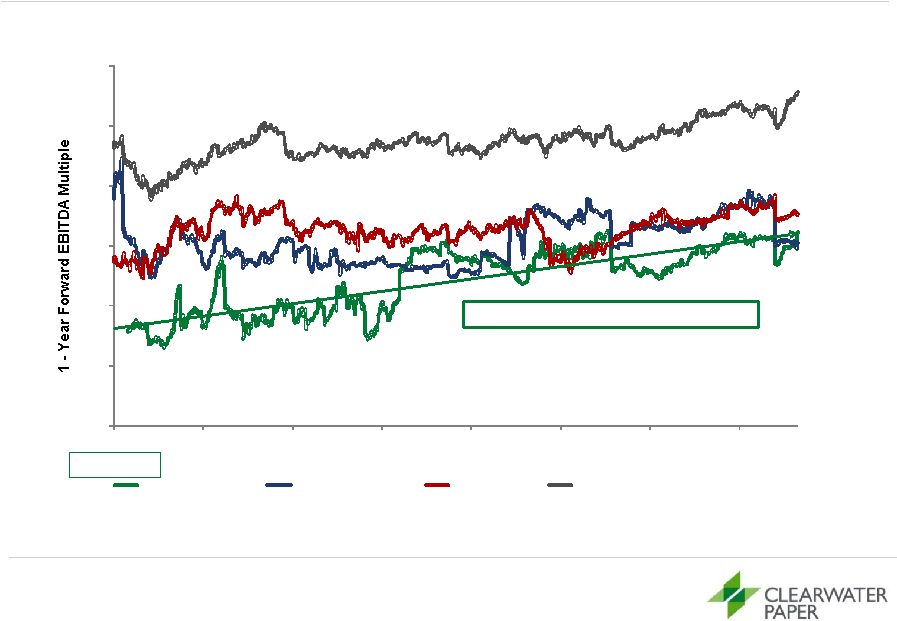 …Which Has Led to Multiple Expansion Since the Spin 20 Source: Bloomberg, Capital IQ, market data as of 22-Feb-2013 1 Small cap tissue peers include Cascades, Orchids, and Wausau. ² Paperboard peers include International Paper, Graphic Packaging, Kapstone, MeadWestvaco, RockTenn, Packaging Corp and Sonoco. ³ Large cap consumer product peers include Kimberly-Clark and Procter & Gamble. Spin Date 6.5x 6.1x 7.1x 11.1x 0x 2x 4x 6x 8x 10x 12x Dec-2008 Jul-2009 Jan -2010 Aug-2010 Feb-2011 Sep-2011 Mar -2012 Oct-2012 Clearwater Paper Small Cap Tissue¹ Paperboard² Large Cap Consumer Products³ Strong upward trend in multiple over time |
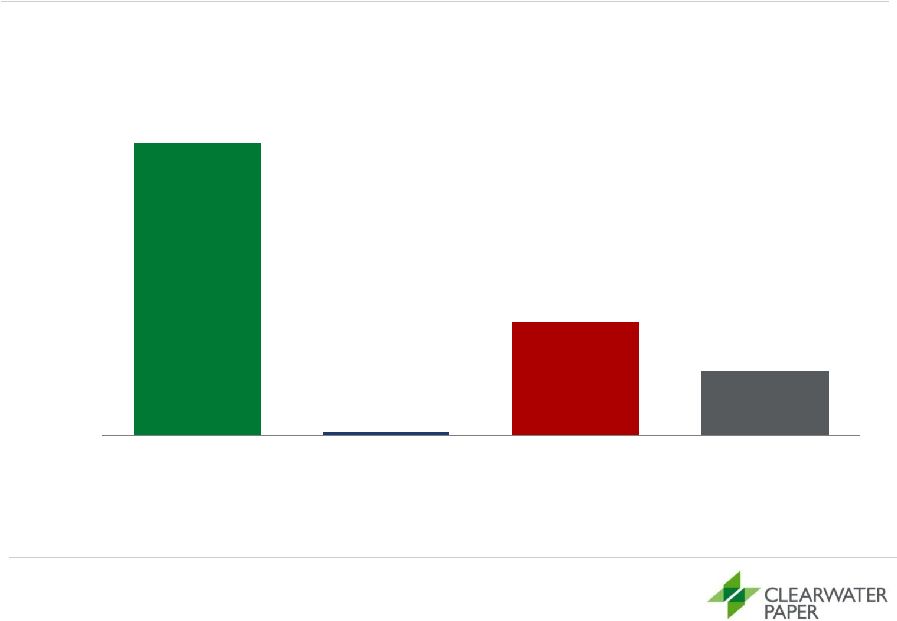 …And Multiple Growth Rate Higher than Industry 21 Source: Bloomberg, Capital IQ, market data as of 22-Feb-2013 Note: Represents current 1-year forward EBITDA multiple divided by forward 1-year EBITDA at 15-Jan-2009 less 100% (first reported IBES EBITDA estimate per Capital IQ). 1 Small cap tissue peers include Cascades, Orchids, and Wausau. ² Paperboard peers include International Paper, Graphic Packaging, Kapstone, MeadWestvaco, RockTenn, Packaging Corp and Sonoco. ³ Large cap consumer product peers include Kimberly-Clark and Procter & Gamble. Change in 1-Year Forward EBITDA Multiple Since Clearwater Spin 109.3% 1.4% 42.2% 23.9% Clearwater Paper Small Cap Tissue¹ Paperboard² Large Cap Consumer Products ³ |
 • Attractive, growing and stable tissue market with increasing adoption of private label products driving overall market growth • Strong competitive position in stable bleached paperboard market • Strategic capital investments, lean optimization initiatives and ongoing integration synergies driving revenue growth and margin expansion • Track record of robust adjusted EBITDA growth with a 32% CAGR over 2008- 2012 poised to generate strong free cash flow • $100 million share buyback authorization in place with plans to complete by year end 2013 with commitment to return 50% of discretionary free cash flow to shareholders in 2014 and 2015 22 ¹ Based on 2008 -2012 adjusted EBITDA. The Value Proposition for Clearwater Paper Shareholders 1 |
 23 Clearwater Paper’s Outlook |
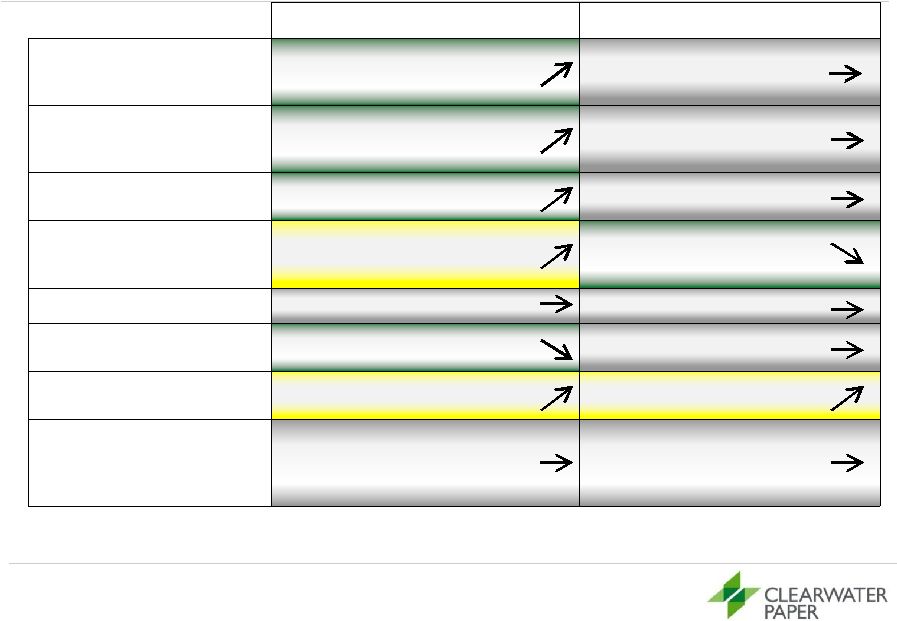
 First Quarter 2013 Outlook (Compared to Q4-2012)¹ 24 Consumer Products Pulp and Paperboard Total Company Production volumes Expecting Shelby paper machine production of ~12k tons Stable Shipment volumes Approximately 134,000 tons; up ~3,000 tons due to higher retail and parent roll shipments Down ~14k tons due to implementing consignment program with a major customer Price/Mix Stable Stable Pulp/Wood/Fiber costs² Expecting pulp costs up slightly along with higher purchased paper of ~4-5k tons Improving Idaho fiber supply Chemical costs² Stable Stable Transportation costs² Expecting higher internal transportation costs Stable Energy costs² Consumption higher due to Shelby TAD paper machine Stable Maintenance & repairs Stable Scheduled Arkansas outage ~$3 million Operating Margins 1 to 3 points of downward pressure due to higher pulp, transportation and energy Stable 1 This information is based upon management’s current expectations and estimates, which are in part based on market and industry data. Many factors are outside the control of management, including particularly input costs for commodity products, and actual results may differ materially from the information set forth above. See “Forward-Looking Statements” on page 1. 2 Based on production costs |
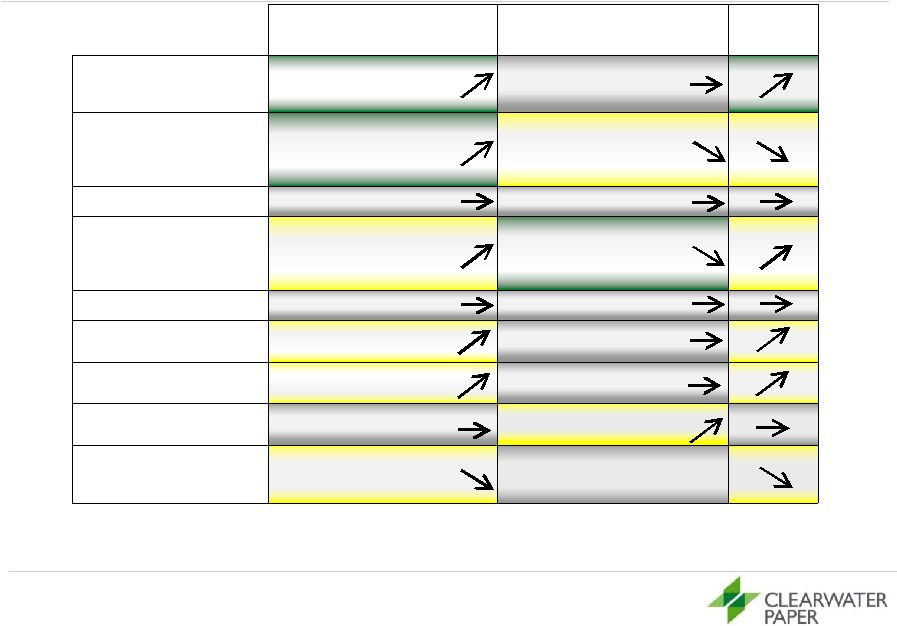
 2013 Outlook (Compared to 2012)¹ 25 Consumer Products Pulp and Paperboard Production volumes Expecting Shelby paper machine production of ~55k tons 70k ton run rate by year end Stable Shipment volumes Expecting shipments to be ~4.6 million cases (25k tons) higher due mainly to higher TAD retail Stable Price/Mix Higher % of TAD expected to improve net sales avg. Stable Pulp/Wood/Fiber costs² Expecting pulp cost increase partially offset by higher internal pulp consumption Improving Idaho fiber supply Chemical costs² Stable Stable Transportation costs² Improved internal transportation as regional balance improves Stable Energy costs² Higher natural gas unit cost and Shelby paper machine usage Higher natural gas unit cost Maintenance & repairs Stable Q1–Scheduled Arkansas outage ~$3 MM Q3–Scheduled Idaho outage ~$11 MM 1 This information is based upon management’s current expectations and estimates, which are in part based on market and industry data. Many factors are outside the control of management, including particularly input costs for commodity products, and actual results may differ materially from the information set forth above. See “Forward-Looking Statements” on page 1. 2 Based on production costs |
 26 Appendix |
 27 Reconciliation of GAAP to Non-GAAP: Clearwater Paper EBITDA and Adjusted EBITDA 1 See last page of this Appendix for definitions of EBITDA and Adjusted EBITDA. ($ in millions) 2008 2009 2010 2011 2012 Net Earnings $9.7 $182.5 $73.8 $39.7 $64.1 Income Tax Provision 5.6 93.2 2.4 31.2 47.5 Interest Expense 13.1 15.5 22.6 44.8 33.8 Earnings Before Interest and Income Taxes 28.5 $291.2 $98.8 $115.7 $145.4 Depreciation & Amortization 47.0 47.4 47.7 76.9 79.3 EBITDA 1 $75.4 $338.6 $146.5 $192.7 $224.7 Alternative Fuel Mixture Tax Credit - (170.6) - - - Debt Retirement Costs - 6.2 - - - Cellu Tissue Acquisition Related Expenses - - 20.3 - - Lewiston, Idaho Sawmill Sale Related Adjustments - - - 2.9 - Loss on sale of foam assets - - - - 1.0 Expenses Associated with Metso Litigation - - - - 2.0 Adjusted EBITDA¹ $75.4 $174.3 $166.8 $195.5 $227.7 |
 28 Reconciliation of GAAP to Non-GAAP: Clearwater Paper Pro Forma Adjusted EBITDA ($ in millions) 1 See page 35 of this Appendix for definitions of EBITDA and Adjusted EBITDA. Shelby Cellu Tissue Synergies Cost Optimization Pro Forma Adjusted EBITDA Operating Income $37.0 $35.0 $16.0 $210.0 Depreciation & Amortization 13.0 - 3.0 90.0 EBITDA 1 $50.0 $35.0 $19.0 $300.0 - - - - Adjusted EBITDA¹ $50.0 $35.0 $19.0 $300.0 |
 29 Definitions of Non-GAAP Measures Clearwater Paper Definitions of Non-GAAP Measures EBITDA is a non-GAAP measure that Clearwater Paper management uses to evaluate the cash generating capacity of Clearwater Paper. The most directly comparable GAAP measure is net earnings. EBITDA, as defined by Clearwater Paper management, is net earnings adjusted for net interest expense, income taxes, and depreciation and amortization. It should not be considered as an alternative to net earnings computed under GAAP. Adjusted EBITDA is a non-GAAP measure that Clearwater Paper management defines as EBITDA adjusted for items that we do not believe are indicative of our core operating performance, including acquisition and disposition related expenses, alternative fuel mixture tax credits and expenses associated with the Metso litigation. The most directly comparable GAAP measure is net earnings. It should not be considered as an alternative to net earnings computed under GAAP. |
 North American Tissue Projected Capacity Change 30 Source: RISI and Other Industry Company Mill/Location Conv/TAD Capacity Change Date Channel/Business/Products Announced New Capacity K.T.G. (USA)/Kruger Memphis, Tennessee TAD 70,000 2013:Q1 Retail/Brand/P.L. Florelle Tissue Brownville, New York Conv 15,000 2013:Q3* New PM from Elite Tissue Machine, China First Quality Tissue Anderson, South Carolina ATMOS 75,000 2014:Q1* Retail/P.L./BRT Procter & Gamble Box Elder, Utah (?) TAD 80,000 2014:Q3* Retail/Brand/Bounty Announced Shutdowns No announced shutdowns Announced Rebuilds Tak Investments Franklin, Virginia Conv 70,000 2013:Q1 Rebuild of a fine paper PM to tissue by PMT Italia and other suppliers Net Capacity Change 310,000 South Georgia Tissue Snelling, Barnwell County, South Carolina 32,000 2014:Q2* New mill for parent rolls only; investment incentives approved but not yet fully committed Potential Projects |