 Clearwater Paper Corporation March 2014 Exhibit 99.1 |
 Forward-Looking Statements 1 This presentation contains, in addition to historical information, certain forward-looking statements within the meaning of the Private Securities Litigation Reform Act of 1995, including statements regarding tissue market dynamics and our ability to capitalize on such, future growth and market opportunities, including in the Midwestern and Eastern U.S. regions and non-grocery channels, tissue capacity increases and absorption of those increases, U.S. tissue and paperboard market demand, paperboard pricing, effects of Chinese paperboard production, strategies to grow our tissue business and optimize profitability of our pulp and paperboard business, our DRIVE strategy, our estimated annual and quarterly Adjusted EBITDA¹ run-rates, shipments from our new tissue machine and converting lines in Shelby, North Carolina, efficiency and cost savings projects and reductions to our cost structure, capital structure, our outlook for Q1 2014 including shipment volumes, product pricing and mix, pulp costs, wood fiber costs and supply, chemical costs, transportation costs, energy costs, cost and timing of major maintenance and repairs and corporate expenses. Words such as “anticipate,” “expect,” “intend,” “will,” “plan,” “goals,” “objectives,” “target,” “project,” “believe,” “schedule,” “estimate,” “may,” and similar expressions are intended to identify such forward-looking statements. These forward-looking statements are based on management’s current expectations, estimates, assumptions and projections that are subject to change. Our actual results of operations may differ materially from those expressed or implied by the forward-looking statements contained in this presentation. Important factors that could cause or contribute to such differences include the risk and uncertainties described from time to time in our public filings with the Securities and Exchange Commission, as well as the following: • customer acceptance and timing of purchases of our new through-air-dried (TAD) products and capacity; • competitive pricing pressures for our products, including as a result of increased capacity as additional manufacturing facilities are operated by our competitors; • difficulties with the optimization and realization of the benefits expected from our new TAD paper machine and converting lines in Shelby, North Carolina; • manufacturing or operating disruptions, including equipment malfunction and damage to our manufacturing facilities; • increased dependence on wood pulp; • changes in the cost and availability of wood fiber and wood pulp; • the loss of business from a significant customer; • changes in transportation costs and disruptions in transportation services; • labor disruptions; • changes in costs for and availability of packaging supplies, chemicals, energy and maintenance and repairs; • changes in customer product preferences and competitors' product offerings; • changes in the U.S. and international economies and in general economic conditions in the regions and industries in which we operate; • increased supply and pricing pressures resulting from increasing Asian paper production capabilities; • cyclical industry conditions; • reliance on a limited number of third-party suppliers for raw materials; • our ability to generate cash; and • inability to successfully implement our expansion strategies. Forward-looking statements contained in this presentation present management’s views only as of the date of this presentation or as indicated. We undertake no obligation to publicly update forward-looking statements, whether as a result of new information, future events or otherwise. ¹ See Appendix for the definition of Adjusted EBITDA as well as the reconciliation to the most comparable GAAP measure. |
 Overview of Clearwater Paper 2 |
 • We are a company formed in late 2008 with more than 60 years of operating history • We operate two business segments – Pulp and Paperboard: 39% of 2013 net sales – Consumer Products: 61% of 2013 net sales • Financial overview for 2013 – Net Sales: $1.9 billion – Adjusted EBITDA 1 : $200 million – 2008 to 2013 Adjusted EBITDA 1 CAGR: 22% • Approximately 3,900 employees Introduction to Clearwater Paper ¹ See Appendix for the definition of Adjusted EBITDA as well as the reconciliation to the most comparable GAAP measure. 3 |
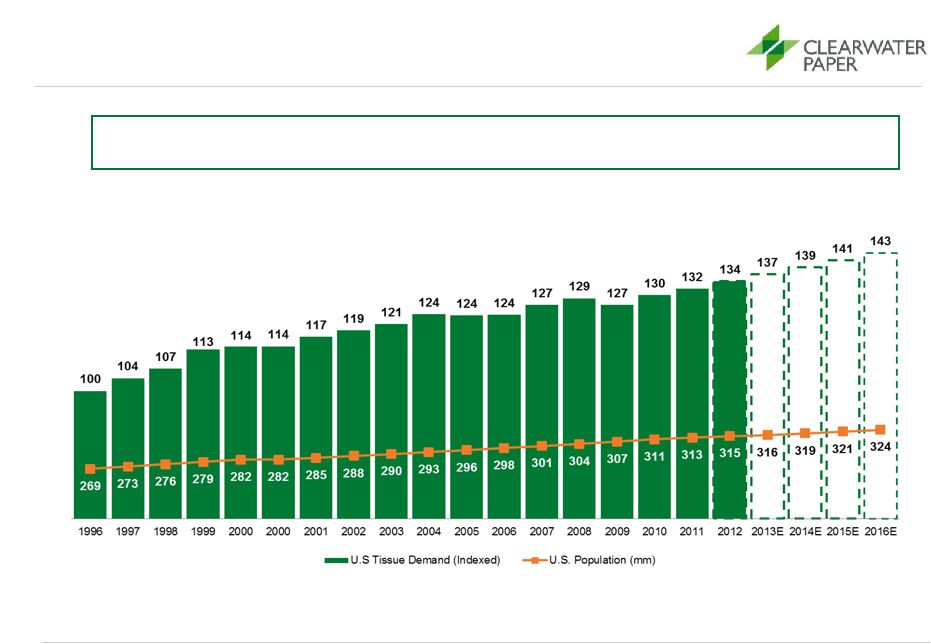 Consumer Products Division Market Dynamics Stable Growth - The tissue market has grown an average of 1%-2% annually since 1996, consistent with population growth Source: U.S. Tissue demand per RISI for North America only from US Tissue Data January 2014, U.S. Population per U.S. Census December 2012 4 |
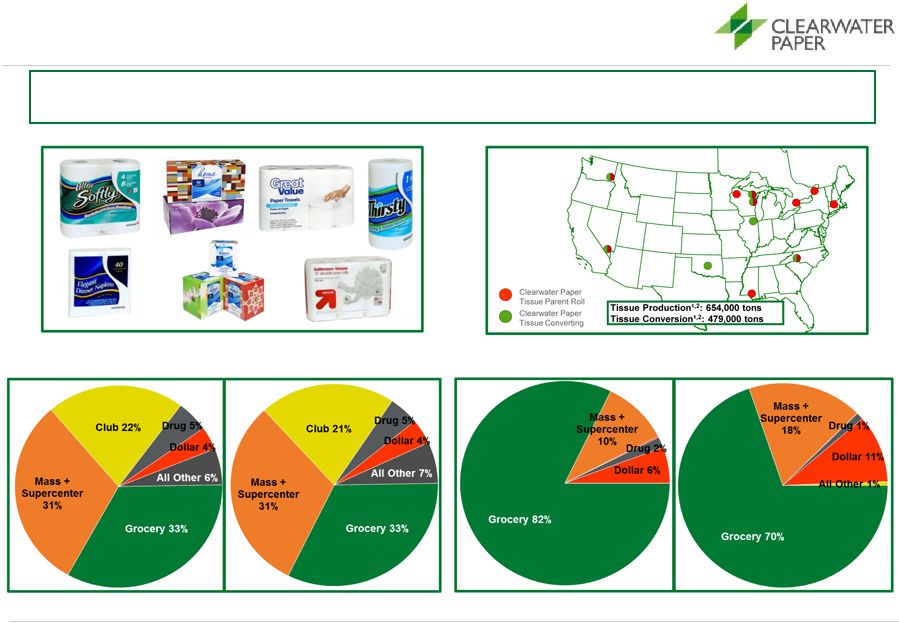 Consumer Products Division Overview Clearwater Paper is one of the largest North American manufacturers of private label tissue, focused on high value tissue products across all categories, retail channels and geographies Key Products Overview of Facilities U.S. Tissue Industry Retail Channel Mix 3 ¹ Represents 2013 annual capacity volumes including machine-glazed. ² Includes Long Island capacity of 38,000 tons and production for 2013 of 29,000 tons. 3 IRI Panel data for Retail channel share by dollar amount sold. 4 Company sales data 2011 2013 Clearwater Paper Retail Channel Mix 4 2011 2013 Little Change in Industry Retail Channel Mix Clearwater Focus on Diversifying Channel Mix 5 |
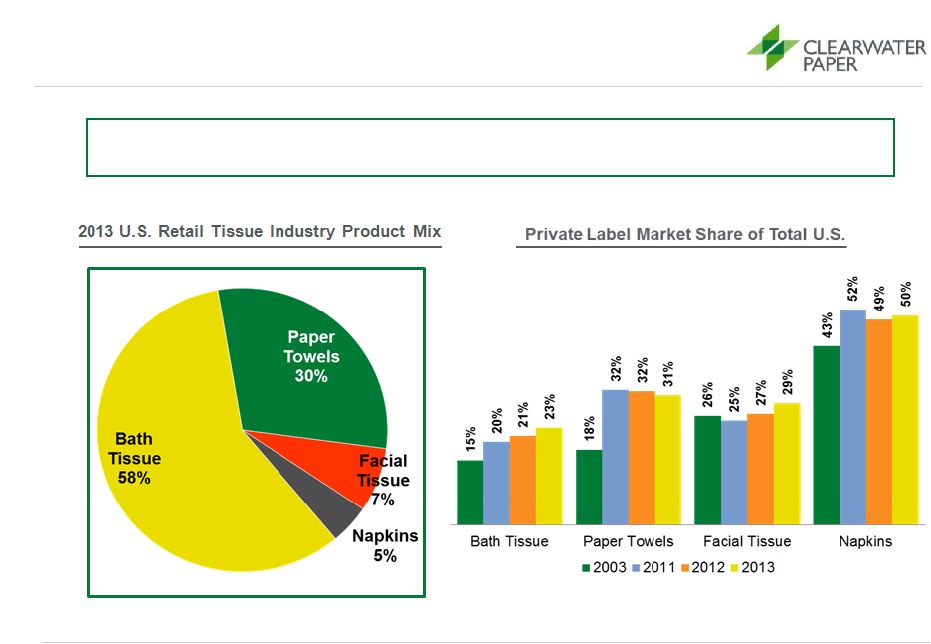 Private Label Continues to Capture Market Share in Tissue Clearwater Paper ranks as one of the largest North American private label tissue manufacturers Source: IRIWorldwide 6 |
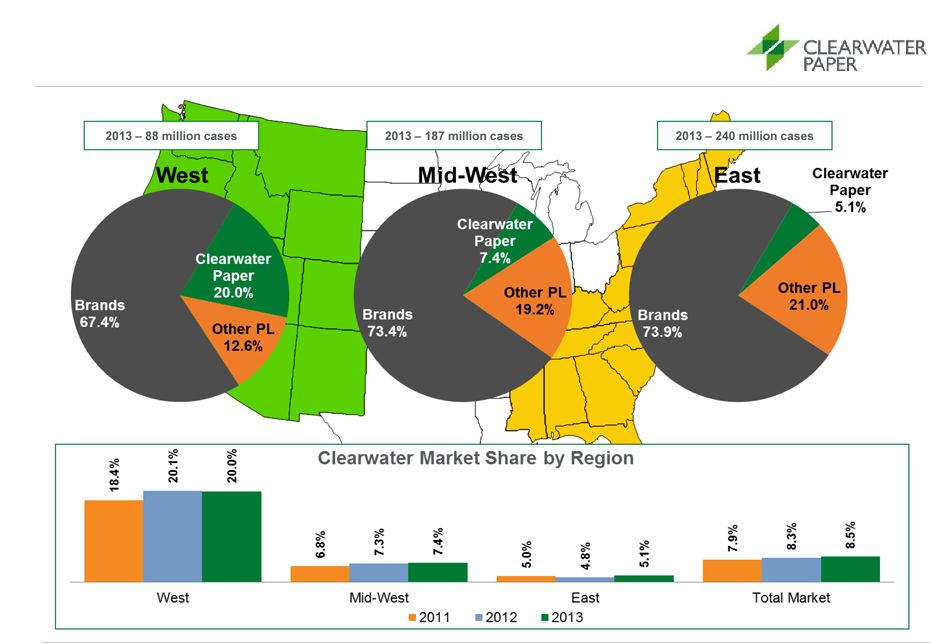 Opportunity for Private Label and Clearwater Paper to Grow Share in the Midwest and East Source: IRIWorldwide . 7 |
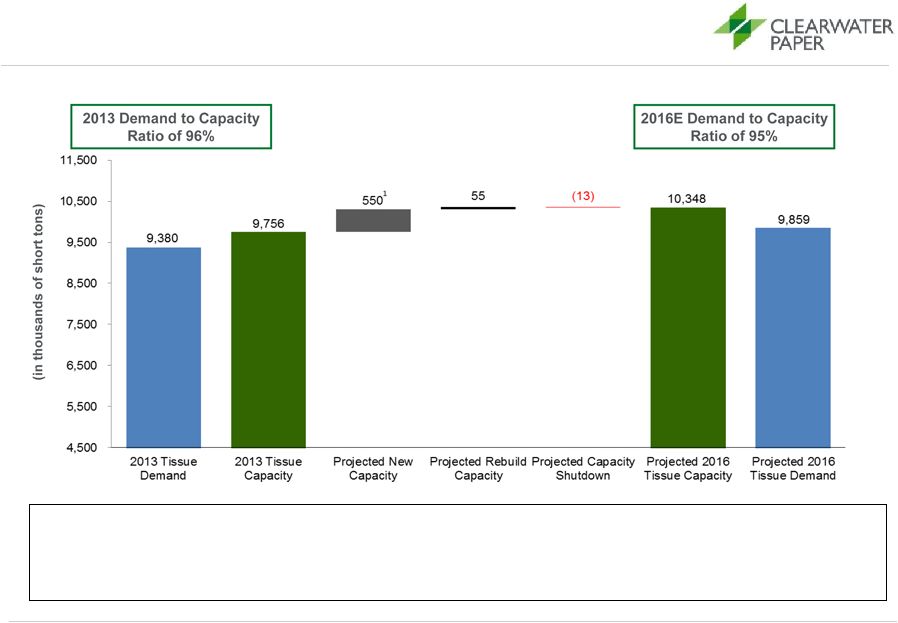 North American Market Demand vs. Capacity Source: RISI August 2013 update for Outlook for World Tissue Business and company estimates 1 It is assumed that any productivity improvements (approximately 100k per year or 1% of capacity) will be offset by closures over a cycle Notes: Projected capacity changes represents both virgin and recycled tissue capacity changes. Please see Appendix for breakdown of specific projects reflected in the capacity changes. Longer term healthy market dynamics remain intact. Short term market pressures exist as the new TAD capacity comes on line and is yet to be fully absorbed by demand. 8 |
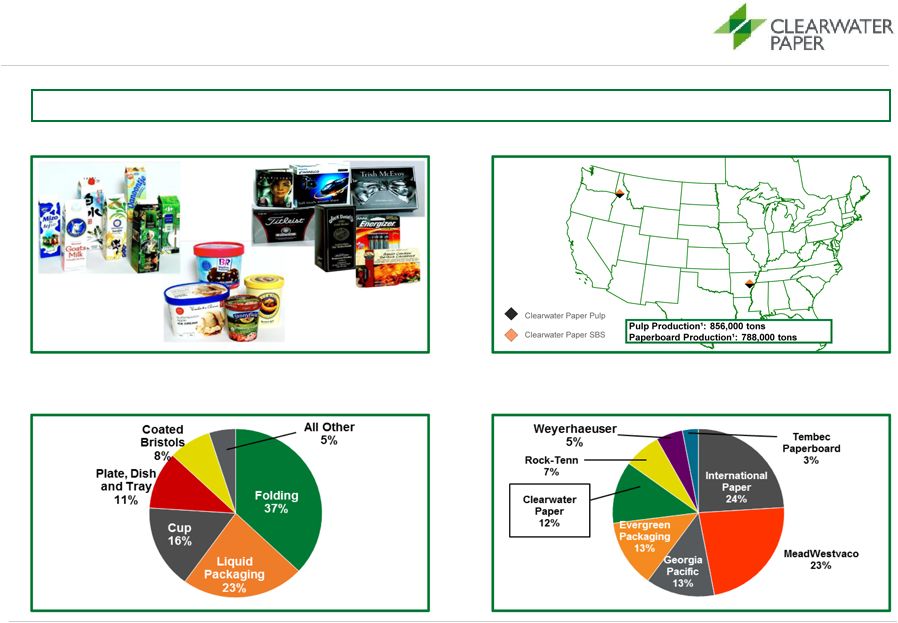 Pulp and Paperboard Division Overview Clearwater Paper ranks as one of the top five largest paperboard manufacturers in North America Key Products Overview of Facilities 2013 North American Bleached Paperboard Production by Product Type² 2013 North American Bleached Paperboard Production by Market Share Source: Company estimates, RISI ¹ Represents 2013 annual capacity volumes. ² Represents ~ 6.0 million tons. 9 |
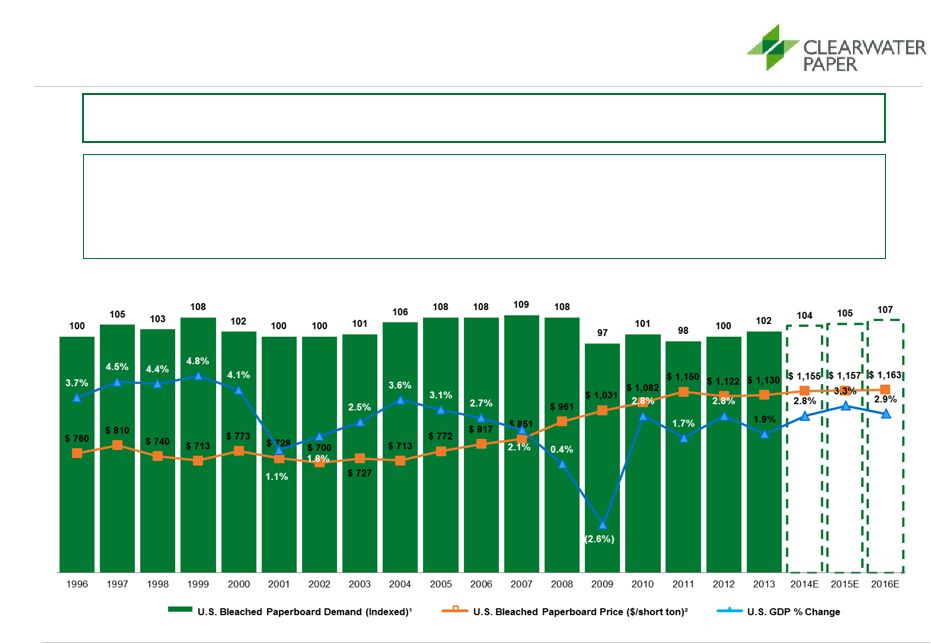 Paperboard Demand Remains Stable and Pricing Outlook is Favorable in the U.S. Source: RISI estimates as of January 2014 ¹ Based on tons produced. Projections based on North American Packaging papers and board demand estimates per RISI. ² Average price per short ton of 16 pt. SBS folding carton C1S. Price estimates per RISI. Bleached paperboard prices are expected to remain at attractive levels through 2016 10 China expected to have minimal impact to Clearwater in 2014 • U.S. market reliance on domestic SBS due to concerns with product quality • High price of pulp squeezing exporters margins and opportunities • Clearwater export business essentially all to Japan |
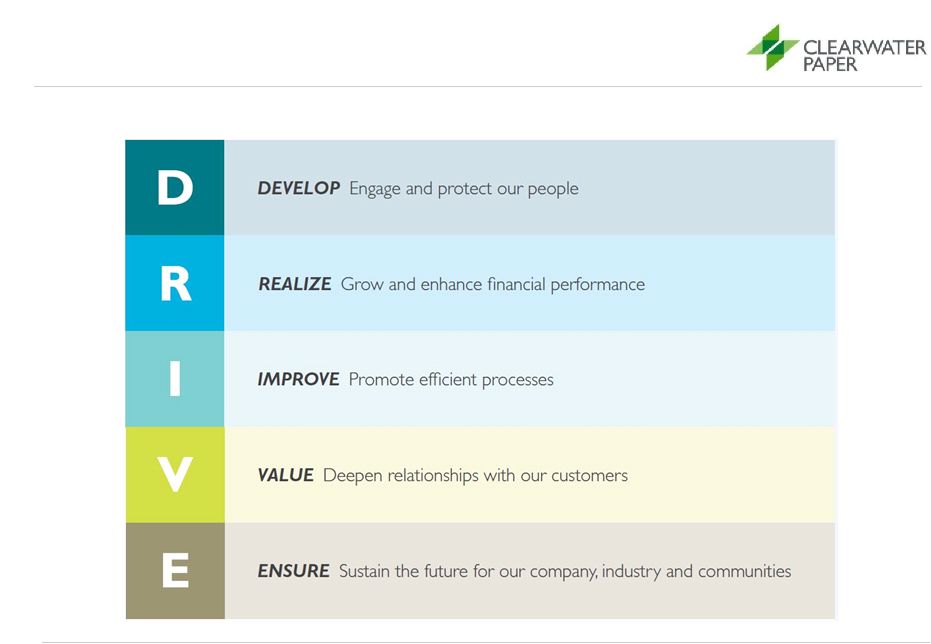
 Clearwater Paper’s Strategic Plan 11 |
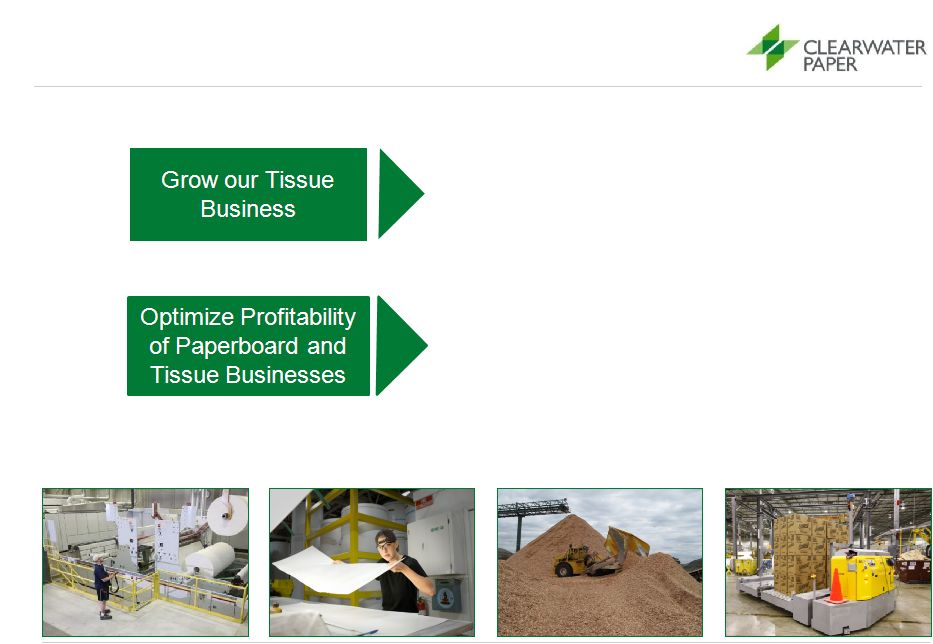 • Lead private label in quality • Expand geographically • Expand retail channel penetration Our Macro Strategy to Create Shareholder Value • Improve sales mix • Reduce costs • Continue to improve quality 12 |
 Our 3 Year Strategy 1 13 1 We are currently in the second year. |
 Clearwater Paper Cross Cycle Financial Model 14 1 Includes Corporate SG&A percentage of net sales of 2.5%. Net sales 100% Gross profit % of net sales 17.0% SG&A 1 % of net sales (6.0%) Operating profit % of net sales 11.0% Net income % of net sales 5.0% EBITDA % of net sales 15.0% |
 Successful Execution of Previously Stated Goals Stated Goal Timeframe Current Status Complete New Paper Machine and Corresponding Converting Lines at Shelby, NC Facilities 2010 – 2013 70k ton Shelby TAD machine was on budget with startup in Q4 2012 at expected run rate by end of the year with 54k tons produced in 2013 Operating 6 converting lines at Shelby with a new napkin line started up in Q3 2013 and the startup of relocated line from Thomaston in Dec 2013 Grow Market Share in Eastern U.S. and Expand in other Retail Channels Ongoing Increase penetration in retail markets in the Mid West and Eastern U.S. Increase drug, club and mass retail channel share Mass and Dollar share of Clearwater shipments up 81% versus 2011 Optimize the Paperboard Business Ongoing Enhanced access to fiber supply with chipping facility acquisition near Lewiston, Idaho Record Q4 2013 EBITDA 1 margin of 23% 2 Cost and production improvement projects Idaho major maintenance cycle improvement from 12 to 18 months Maintain a Prudent Capital Structure to lower Weighted Average Cost of Capital Ongoing Conservative capital structure with target leverage through the cycle of 3x and ample liquidity Clearwater Paper refinancing of 10 5/8% debt with 4 1/2% debt Asset Rationalization/Cost Infrastructure Ongoing Closure of Thomaston converting operations along with relocating existing lines to Shelby, Oklahoma City and Las Vegas Closure of Long Island converting operations Achieve 15% cross cycle EBITDA 1 margin Return of Capital to Shareholders Ongoing Completion of $100 million share repurchase program in 2013 Announced new $100 million share repurchase program in 2014 15 ¹ See Appendix for the definition of Adjusted EBITDA as well as the reconciliation to the most comparable GAAP measure. 2 Pulp and Paperboard operating income for Q4’13 of $37.2 million plus depreciation of $6.1 million resulting in EBITDA of $43.2. |
 Clearwater Paper’s Value Proposition 16 |
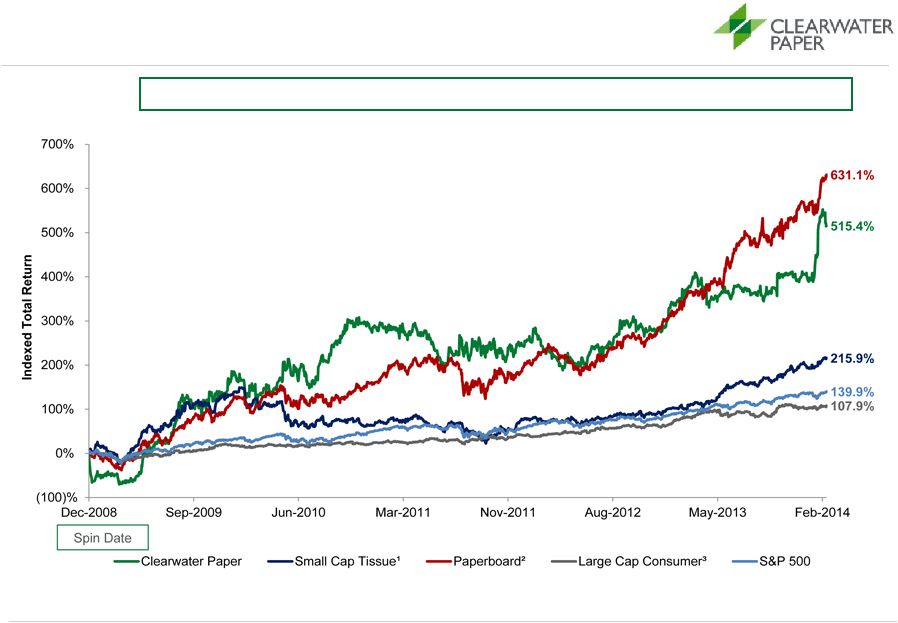 Clearwater Paper is a Leader Amongst its Peers in Value Creation 17 Source: Bloomberg as of February 28, 2014 1 Small cap tissue peers include Cascades, Orchids, and Wausau. ² Paperboard peers include International Paper, Graphic Packaging, Kapstone, MeadWestvaco, RockTenn, Packaging Corp of America, and Sonoco. ³ Large cap consumer product peers include Kimberly-Clark and Procter & Gamble. Note: Total Shareholder Return includes with dividends reinvested and stock price performance. 515%+ Total Shareholder Return Since Spin-off |
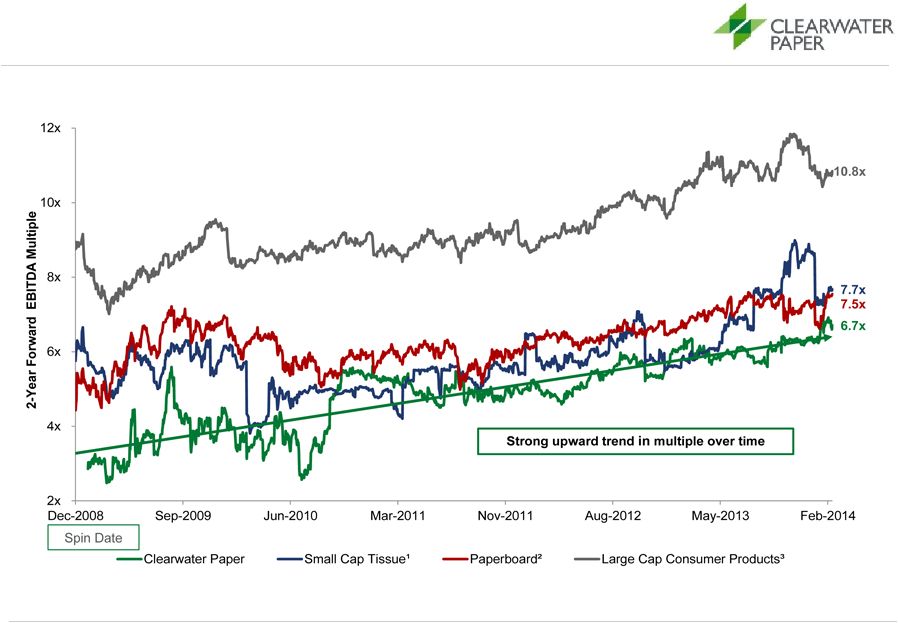 Which Has Led to Multiple Expansion Since the Spin 18 Source: Bloomberg, Capital IQ, market data as of February 28, 2014 1 Small cap tissue peers include Cascades, Orchids, and Wausau. ² Paperboard peers include International Paper, Graphic Packaging, Kapstone, MeadWestvaco, RockTenn, Packaging Corp of America and Sonoco. ³ Large cap consumer product peers include Kimberly-Clark and Procter & Gamble. |
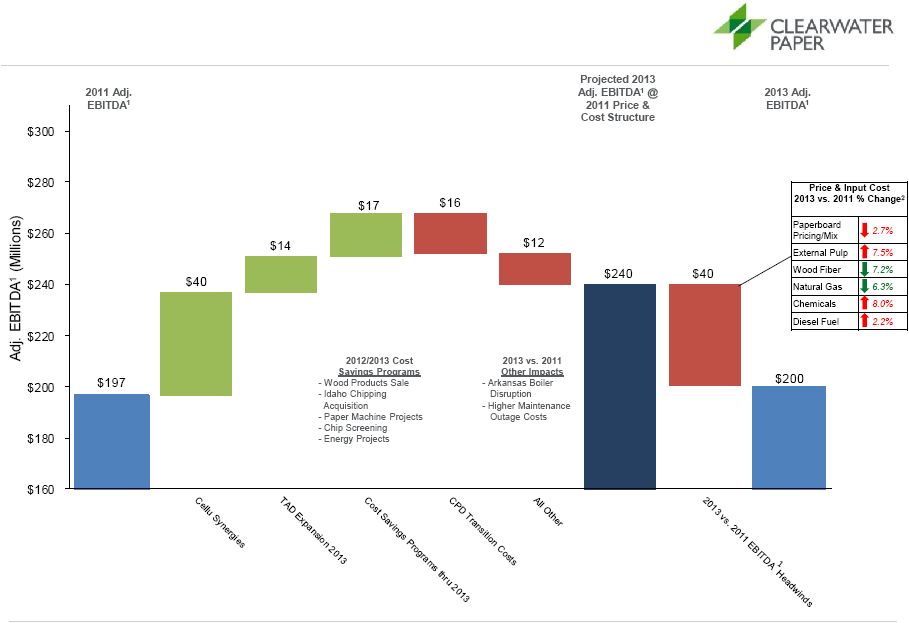 Path to Target $300M+ Adj. EBITDA 1 2013 Status (@2011 Price & Cost Structure) 19 1 Non-GAAP measure – See definition and reconciliation to GAAP. 2 In September 2012 we announced a $300 million Adjusted EBITDA target for 2014, which was based on 2011 prices and input costs. This table shows percentage changes in certain price and input costs between 2011 and 2013. |
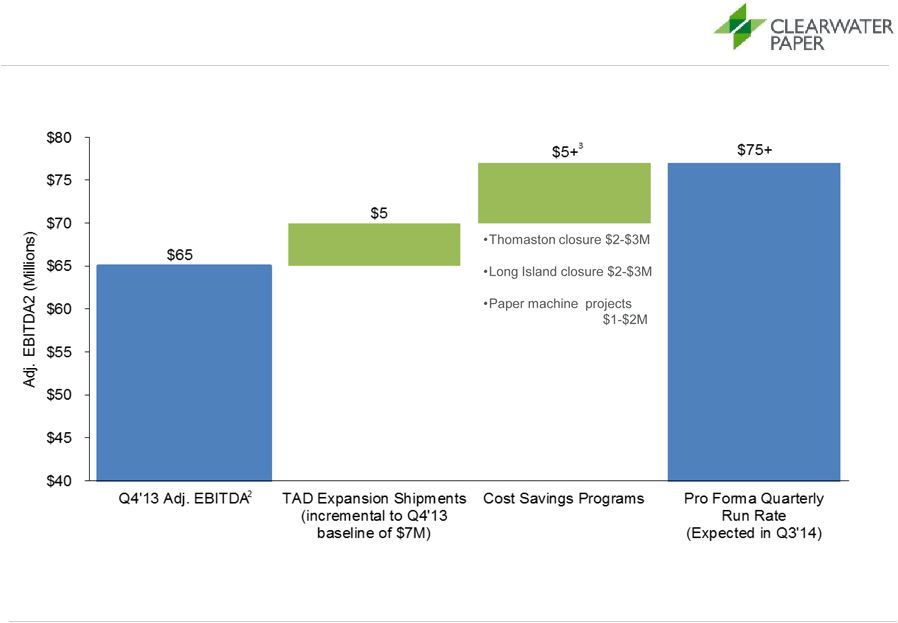 Bridge to Pro Forma $75 Million Quarterly Run Rate 1 1 Assumes no change in prices or input costs from Q4’13. This information is based upon management’s current expectations and estimates, which are in part based on market and industry data. Many factors are outside the control of management, especially including input costs for commodity products, and actual results may differ materially from the information set forth above. See Forward-Looking Statements” on page 1. 2 Non-GAAP measure – See definition and reconciliation to GAAP. 3 Does not include expected maintenance cadence savings as there were no major maintenance costs in Q4’13 and none expected through Q3’14. Extended maintenance cadence benefit is $1-$2M per quarter on a ‘straight line basis’. 20 |
 Clearwater Paper’s Outlook 21 |
 Consumer Products Paperboard Corporate Shipment volumes Updated Outlook – Flat Feb 2014 Outlook – 1-3% higher Updated Outlook – 1% Higher Feb 2014 Outlook – Stable Price/Mix Updated Outlook – No change Feb 2014 Outlook – TAD bathroom tissue mix increase 0-1% Higher Updated Outlook – 1% Higher Feb 2014 Outlook – 0-1% Higher Pulp/Wood Fiber costs Updated Outlook – $1M Higher Feb 2014 Outlook – $.5M-$1M Higher Updated Outlook – No change Feb 2014 Outlook – $1.5M-$3M Higher Chemical costs Updated Outlook – No change Feb 2014 Outlook – Stable Updated Outlook – No change Feb 2014 Outlook – Stable Transportation costs Updated Outlook – $1M Higher Feb 2014 Outlook – Stable Updated Outlook – $.5M Higher Feb 2014 Outlook – Stable Energy costs Updated Outlook – $3M-$4M Higher Feb 2014 Outlook – $1M-$2M Higher Updated Outlook – $2M Higher Feb 2014 Outlook – $1-$2M Higher Maintenance & Repairs Updated Outlook – No change Feb 2014 Outlook – $1M Higher Updated Outlook – No change Feb 2014 Outlook – Stable SG&A Updated Outlook – No change Feb 2014 Outlook – $1M Higher Updated Outlook – No change Feb 2014 Outlook – Stable Updated Outlook – No Change Feb 2014 Outlook – Expected run rate of $11M-$13M 1 This information is based upon management’s updated expectations and estimates as of February 5, 2014, which are in part based on market and industry data. Many factors are outside the control of management, including particularly input costs for commodity products, and actual results may differ materially from the information set forth above. See “Forward-Looking Statements” on page 1. 2 Excluding estimated Q1 Long Island closure costs of $5 million. 22 Updated Outlook – No Change Feb 2014 – Other Cost Reductions ($1M-$3M) First Quarter 2014 Outlook (Compared to Q4’13) 1 Updated consolidated outlook: at low end of Feb 2014 outlook range due to weather related impacts • Net sales – flat to up 2% • Operating margin – 7-8% 2 |
 Appendix 23 |
 Reconciliation of GAAP to Non-GAAP: Clearwater Paper EBITDA 1 and Adjusted EBITDA 1 ¹ See Appendix for the definition of Adjusted EBITDA as well as the reconciliation to the most comparable GAAP measure. 2 Interest expense, net for 2009 and 2013 includes debt retirement costs of $6.2 and $ 7.1 million respectively. ($ in millions) 24 2008 2009 2010 2011 2012 2013 Net earnings $9.7 $182.5 $73.8 $39.7 $64.1 $107.0 Income tax provision (benefit) 5.6 93.2 2.4 31.2 47.5 (68.7) Interest expense, net² 13.1 21.7 22.6 44.8 33.8 61.1 Earnings before interest and income taxes 28.5 297.4 98.8 115.7 145.4 99.3 Depreciation and amortization 47.0 47.4 47.7 76.9 79.3 90.3 EBITDA 1 $75.4 $344.8 $146.5 $192.7 $224.7 $189.6 Alternative Fuel Mixture Tax Credit - (170.6) - - - - Cellu Tissue acquisition related expenses - - 20.3 - - - Lewiston, Idaho sawmill sale related adjustments - - - 2.9 - - Loss on sale of foam assets - - - - 1.0 - Expenses associated with Metso litigation - - - - 2.0 - Costs associated with Thomaston facility closure - - - - - 6.0 Directors equity-based compensation expense - 2.6 3.7 1.5 1.4 4.1 Adjusted EBITDA¹ $75.4 $176.8 $170.5 $197.1 $229.1 $199.7 |
 Reconciliation of GAAP to Non-GAAP: Clearwater Paper Q4’13 EBITDA 1 and Adjusted EBITDA 1 ¹ See Appendix for the definition of Adjusted EBITDA as well as the reconciliation to the most comparable GAAP measure. ($ in millions) 25 Q4'13 Net earnings $82.9 Income tax provision (benefit) (55.8) Interest expense, net 11.3 Earnings before interest and income taxes 38.3 Depreciation and amortization 22.7 EBITDA 1 $61.0 Costs associated with Thomaston facility closure 3.1 Directors equity-based compensation expense 1.4 Adjusted EBITDA ¹ $65.4 |
 Reconciliation of GAAP to Non-GAAP: Clearwater Paper Pro Forma Adjusted EBITDA 1 ($ in millions) ¹ See Appendix for the definition of Adjusted EBITDA as well as the reconciliation to the most comparable GAAP measure. 26 Shelby Cellu Tissue Synergies Cost Optimization Cross Cycle Adjusted EBITDA Operating income $37.0 $40.0 $16.0 $210.0 Depreciation and amortization 13.0 - 3.0 90.0 EBITDA 1 $50.0 $40.0 $19.0 $300.0 - - - - Adjusted EBITDA ¹ $50.0 $40.0 $19.0 $300.0 |
 Definitions of Non-GAAP Measures EBITDA is a non-GAAP measure that Clearwater Paper management uses as a supplemental performance measure to evaluate the cash generating capacity of Clearwater Paper. The most directly comparable GAAP measure is net earnings. EBITDA, as defined by Clearwater Paper management, is net earnings adjusted for net interest expense, income taxes, and depreciation and amortization. It should not be considered as an alternative to net earnings computed under GAAP. Adjusted EBITDA is a non-GAAP measure that Clearwater Paper management defines as EBITDA adjusted for items that we do not believe are indicative of our core operating performance, including acquisition and disposition related expenses, alternative fuel mixture tax credits, sale of foam assets, expenses associated with the Metso litigation and costs associated with directors equity based compensation. The most directly comparable GAAP measure is net earnings. It should not be considered as an alternative to net earnings computed under GAAP. 27 Clearwater Paper Definitions of Non-GAAP Measures |
 North American Tissue Projected Capacity Change Source: RISI and Other Industry 28 Company Mill/Location Conv/TAD Capacity Change Date Channel/Business/Products Announced New Capacity Confidential Confidential Conv 80,000 2014* Metso Advantage DCT 200TS Confidential Confidential Conv 35,000 2014* Metso Advantage DCT 100+ Confidential Confidential Conv 70,000 2014* Metso Advantage DCT Orchids Paper Products Pryor, OK Conv 30,000 2015:Q2* New PM from Recard First Quality Tissue Anderson, SC TAD 70,000 2015:Q3* IGIC Baileyville, ME Conv 60,000 2015:Q4* Economy category IGIC Baileyville, ME Conv 60,000 2016:Q1* Economy category First Quality Tissue Anderson, SC ATMOS 75,000 2016:Q1* Retail/P.L./BRT First Quality Tissue Anderson, SC TAD 70,000 2016:Q3* Announced Shutdowns Orchids Paper Products Pryor, OK Conv (13,000) 2014:Q4* Closure of the two smallest PM's Announced Rebuilds Cascades Tissue Group St. Helens, OR Conv 55,000 2014:Q4 Rebuild of a specialty PM to tissue Net Capacity Change 592,000 Procter & Gamble Box Elder, Utah TAD 80,000 ON HOLD Retail/Brand/Bounty Capacity Changes in the North American Tissue Industry Potential Projects * = estimated |