Exhibit 99.1

Exhibit 99.1
Investor Marketing – November 2011
Safe harbor language & reconciliation of non-gaap measures
Information provided and statements contained in this presentation that are not purely historical, such as statements regarding the Company’s strategic priorities, 2011 and 2012 financial and operating performance and M*Modal transaction benefits, are forward-looking statements within the meaning of Section 27A of the Securities Act of 1933, Section 21E of the Securities Exchange Act of 1934 and the Private Securities Litigation Reform Act of 1995. Such forward-looking statements only speak as of the date of this presentation and MedQuist Holdings Inc. assumes no obligation to update the information included in this presentation.
Statements made in this presentation that are forward-looking in nature may involve risks and uncertainties. Accordingly, readers are cautioned that any such forward-looking statements are not guarantees of future performance and are subject to certain risks, uncertainties and assumptions that are difficult to predict, including, without limitation, specific factors discussed herein and in other disclosures and public filings made by MedQuist Holdings Inc., including filings with the SEC. Although MedQuist Holdings believes that the expectations reflected in such forward-looking statements are reasonable as of the date made, expectations may prove to have been materially different from the results expressed or implied by such forward-looking statements.
In addition to the US GAAP results, MedQuist Holdings has provided certain non-GAAP financial measures in this presentation such as Adjusted EBITDA and Adjusted Net Income. The tables in the appendix to this presentation include a reconciliation of the historical non-GAAP financial measures to the most directly comparable GAAP financial measures. The Company does not present in the presentation the comparable GAAP financial measure and the related reconciliation for the forward looking non-GAAP financial measures included in this presentation because management cannot predict with sufficient reliability certain contingencies required to estimate the comparable GAAP financial measures.
Slide 2
Investor Marketing – November 2011
Copyright 2011 MedQuist, IP LLC. All rights reserved

Company mission
Delivering innovative solutions that capture the patient’s story by facilitating clinical workflow, enabling collaboration and providing insight for improved delivery of care.
Slide 3
Investor Marketing – November 2011
Copyright 2011 MedQuist, IP LLC. All rights reserved
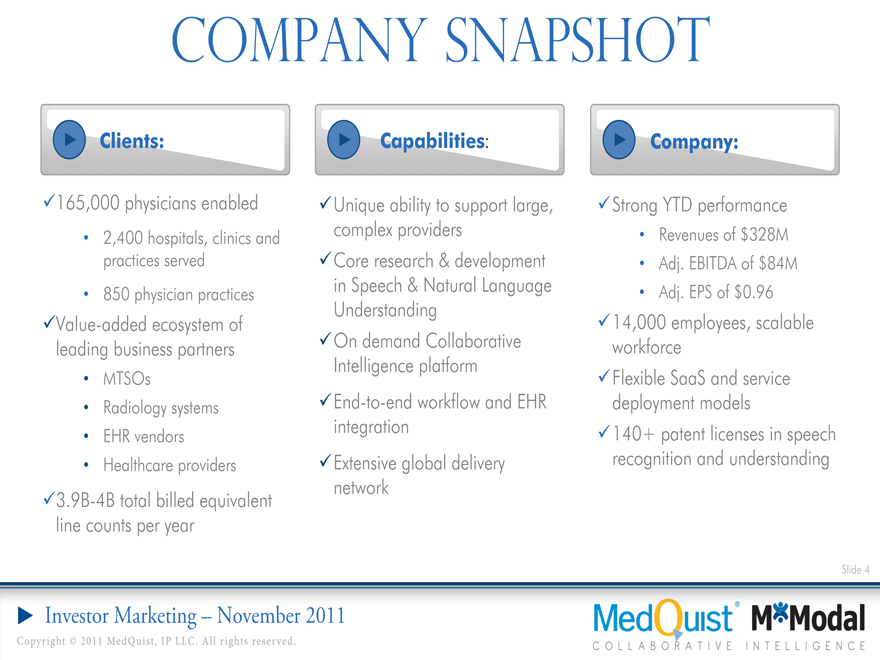
Company snapshot
Clients:
165,000 physicians enabled
• 2,400 hospitals, clinics and practices served
• 850 physician practices
Value-added ecosystem of leading business partners
• MTSOs
• Radiology systems
• EHR vendors
• Healthcare providers
3.9B-4B total billed equivalent line counts per year
Capabilities:
Unique ability to support large, complex providers
Core research & development in Speech & Natural Language Understanding
On demand Collaborative Intelligence platform
End-to-end workflow and EHR integration
Extensive global delivery network
Company:
Strong YTD performance
• Revenues of $328M
• Adj. EBITDA of $84M
• Adj. EPS of $0.96
14,000 employees, scalable workforce
Flexible SaaS and service deployment models
140+ patent licenses in speech recognition and understanding
Slide 4
Investor Marketing – November 2011
Copyright 2011 MedQuist, IP LLC. All rights reserved
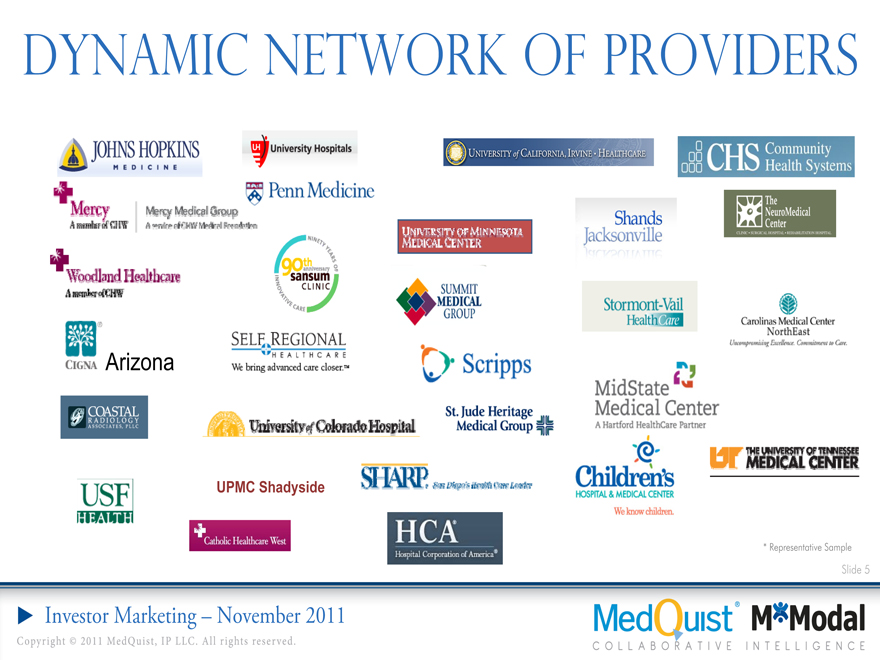
Dynamic Network of Providers
* Representative Sample
Slide 5
Investor Marketing – November 2011
Copyright 2011 MedQuist, IP LLC. All rights reserved
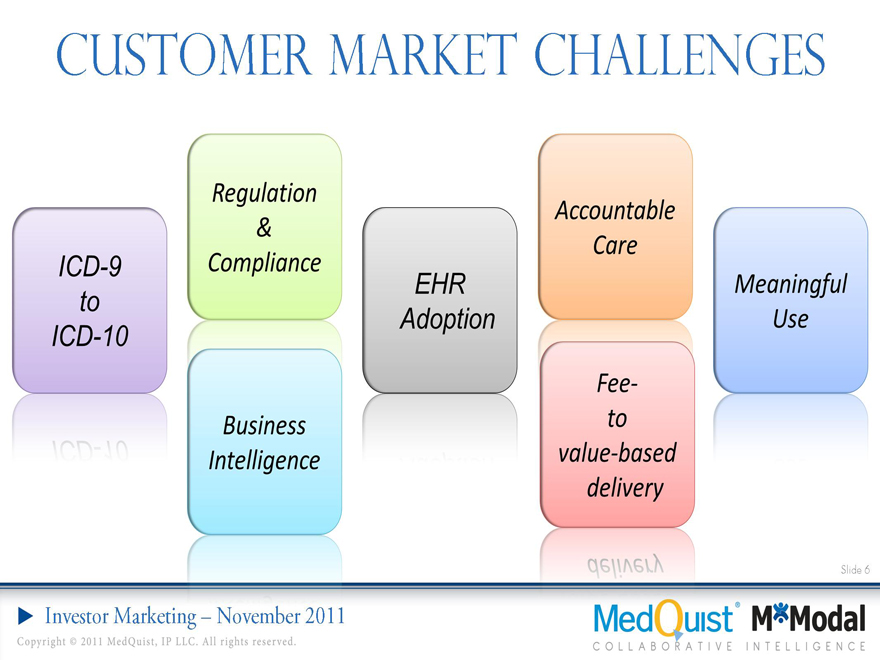
Customer market challenges
ICD-9 to ICD-10
Regulation & Compliance
Business Intelligence
HER Adoption
Accountable Care
Fee- to value-based delivery
Meaningful Use
Slide 6
Investor Marketing – November 2011
Copyright 2011 MedQuist, IP LLC. All rights reserved
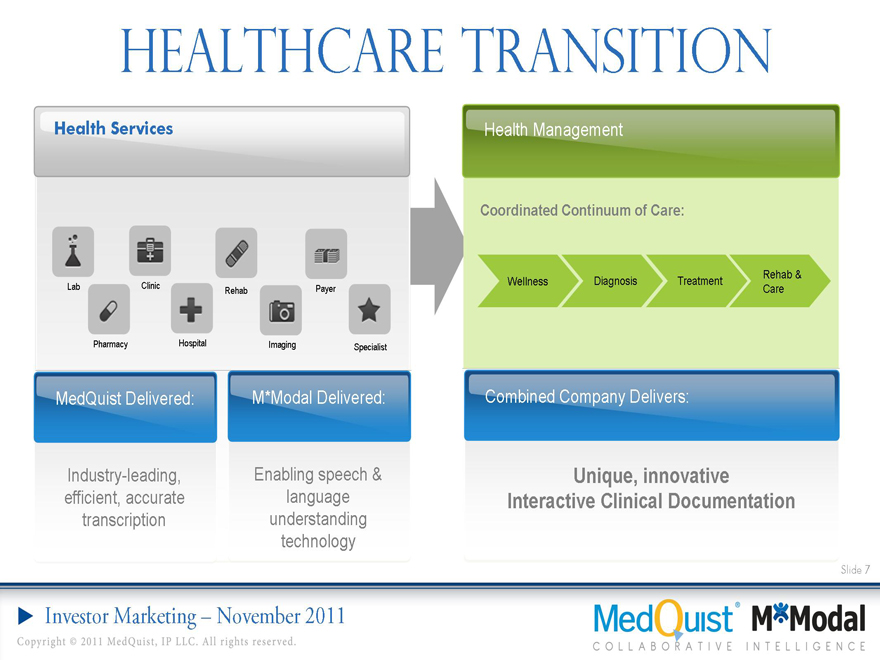
Healthcare transition
Health Services
Lab
Clinic
Rehab
Payer
Pharmacy
Hospital
Imaging
Specialist
MedQuist Delivered:
Industry-leading, efficient, accurate transcription
M*Modal Delivered:
Enabling speech & language understanding technology
Health Management
Coordinated Continuum of Care:
Wellness
Diagnosis
Treatment
Rehab & Care
Combined Needs-based Company Delivers:
Integrated coordination
Outcomes-focused
Unique, innovative Interactive Clinical Documentation
Slide 7
Investor Marketing – November 2011
Copyright 2011 MedQuist, IP LLC. All rights reserved
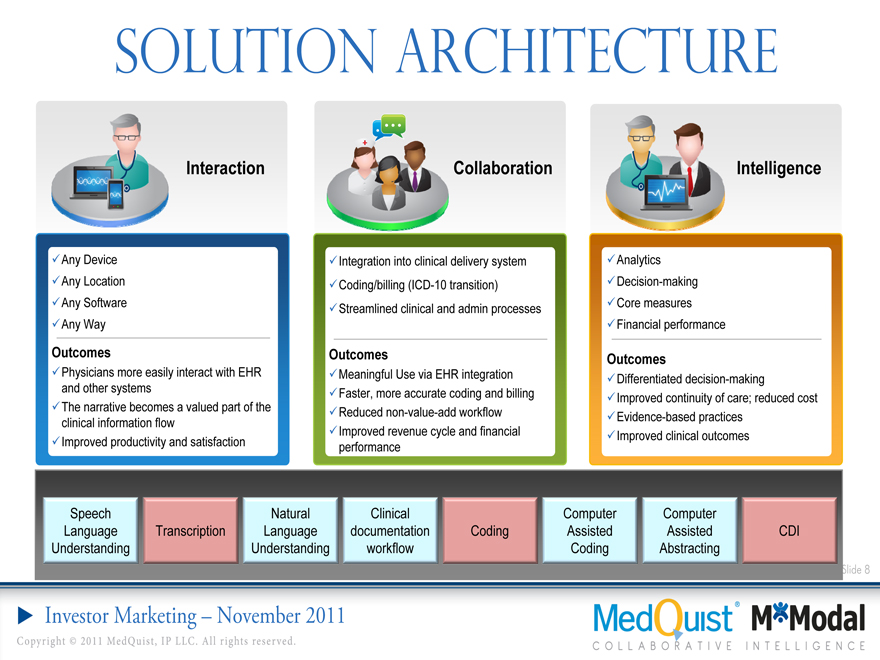
SOLUTION ARCHITECTURE
Interaction
Any Device
Unique Capabilities
Any Location
Any Leverages Software existing voice profiles Any Accessible Way from any device to cloud-based voice recognition
Outcomes
Physicians Narrative more is immediately easily interact converted with EHR into and XML other- structured systems data
The narrative becomes a valued part of the clinical Integrates information into EHR flow systems, clinical workflow Improved and productivity business and processes satisfaction
Collaboration
Integration into clinical delivery system
Coding/billing Unique Capabilities (ICD-10 transition)
Natural Language Understanding
Streamlined clinical and admin processes captures relevant context
Computer assisted coding based on
Outcomes
SNOMED/ICD-10
Meaningful Use via EHR integration
Faster, Physician more accurate annotation coding tools and enable billing
Reduced ‘closed loop’ non-value feedback -add workflow and data
Improved exchange revenue cycle and financial performance
Intelligence
Analytics
Unique Capabilities
Decision-making
Core Abstracting measures capabilities for quality analysis
Financial performance
Outcomes Analytics platform queries and reports from large volumes of information
Differentiated decision-making
Structured data coupled with the
Improved continuity of care; reduced cost context of the narrative enables
Evidence-based practices comprehensive analysis
Improved clinical outcomes
Speech Language Understanding
Transcription
Natural Language Understanding
Clinical documentation workflow
Coding
Computer Assisted Coding
Computer Assisted Abstracting
CDI
Slide 8
Investor Marketing – November 2011
Copyright 2011 MedQuist, IP LLC. All rights reserved
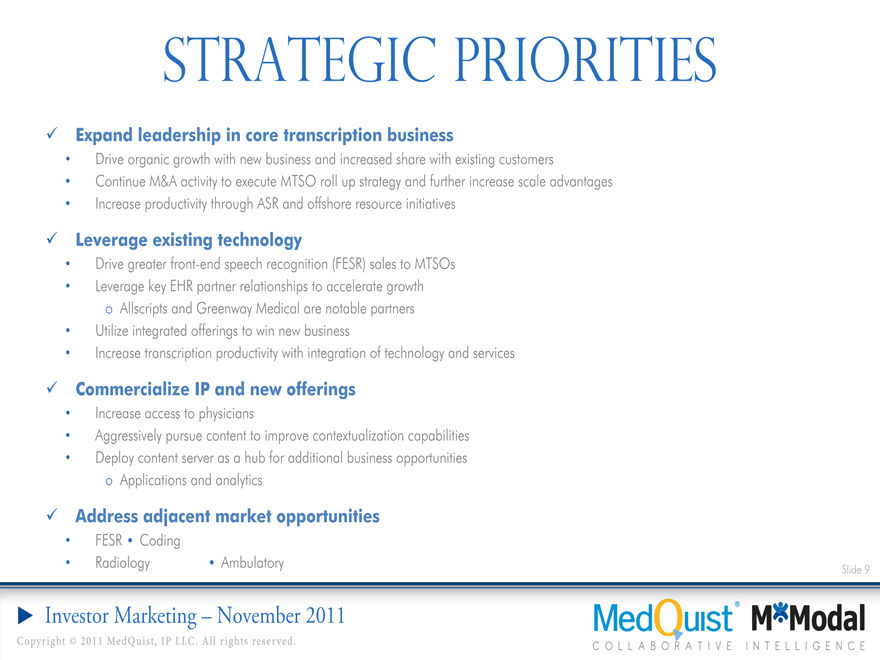
Strategic priorities
??Expand leadership in core transcription business
• Drive organic growth with new business and increased share with existing customers
• Continue M&A activity to execute MTSO roll up strategy and further increase scale advantages
• Increase productivity through ASR and offshore resource initiatives
??Leverage existing technology
• Drive greater front-end speech recognition (FESR) sales to MTSOs
• Leverage key EHR partner relationships to accelerate growth
Allscripts and Greenway Medical are notable partners
• Utilize integrated offerings to win new business
• Increase transcription productivity with integration of technology and services
Commercialize IP and new offerings
• Increase access to physicians
• Aggressively pursue content to improve contextualization capabilities
• Deploy content server as a hub for additional business opportunities
Applications and analytics
Address adjacent market opportunities
• FESR Coding
• Radiology Ambulatory
Slide 9
Investor Marketing – November 2011
Copyright 2011 MedQuist, IP LLC. All rights reserved

Financial Overview
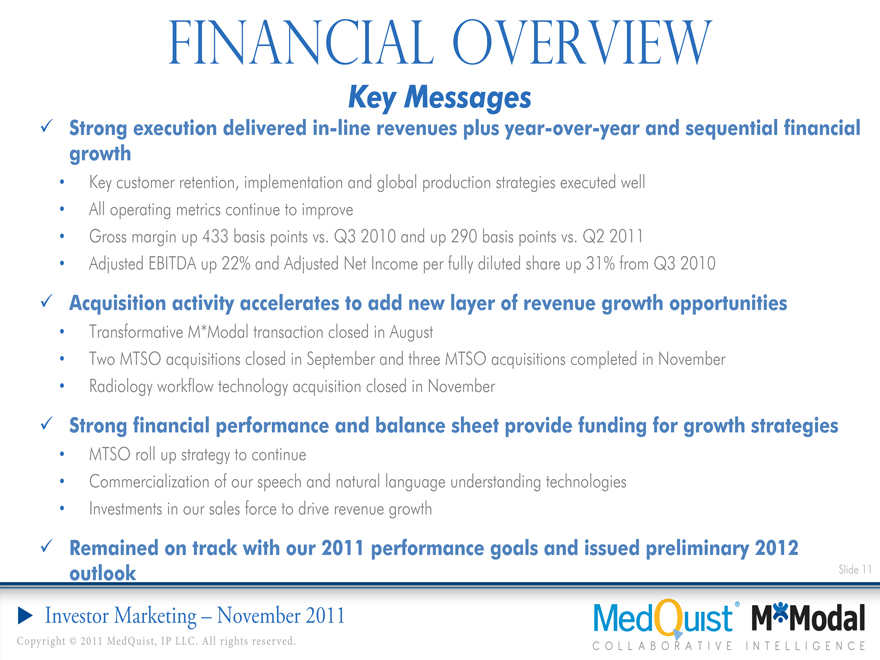
Financial overview
Key Messages
Strong execution delivered in-line revenues plus year-over-year and sequential financial growth
• Key customer retention, implementation and global production strategies executed well
• All operating metrics continue to improve
• Gross margin up 433 basis points vs. Q3 2010 and up 290 basis points vs. Q2 2011
• Adjusted EBITDA up 22% and Adjusted Net Income per fully diluted share up 31% from Q3 2010
Acquisition activity accelerates to add new layer of revenue growth opportunities
• Transformative M*Modal transaction closed in August
• Two MTSO acquisitions closed in September and three MTSO acquisitions completed in November
• Radiology workflow technology acquisition closed in November
Strong financial performance and balance sheet provide funding for growth strategies
• MTSO roll up strategy to continue
• Commercialization of our speech and natural language understanding technologies
• Investments in our sales force to drive revenue growth
Remained on track with our 2011 performance goals and issued preliminary 2012 outlook
Slide 11
Investor Marketing – November 2011
Copyright 2011 MedQuist, IP LLC. All rights reserved
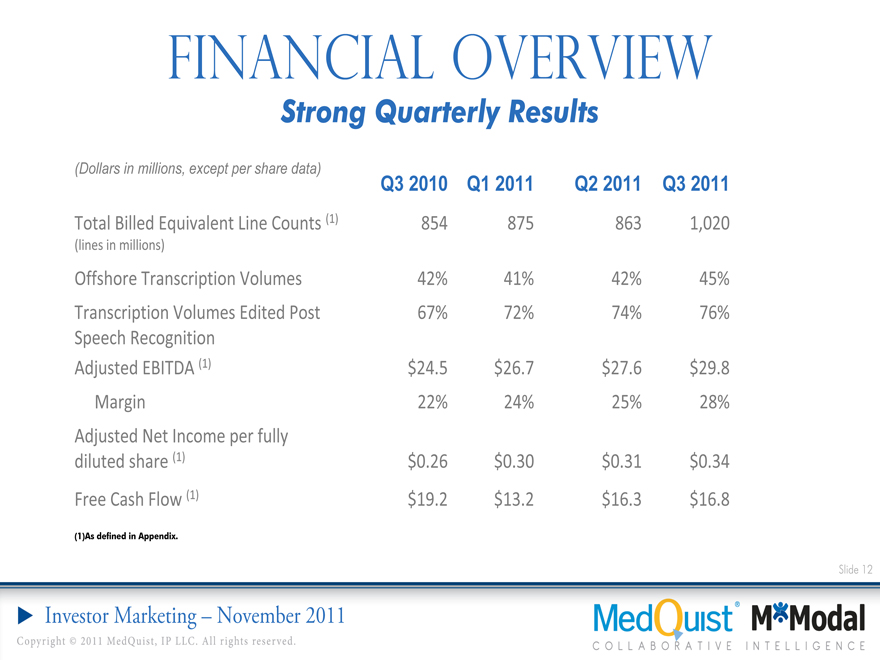
Financial overview
Strong Quarterly Results
(Dollars in millions, except per share data)
Q3 2010 Q1 2011 Q2 2011 Q3 2011
Total Billed Equivalent Line Counts (1) 854 875 863 1,020
(lines in millions)
Offshore Transcription Volumes 42% 41% 42% 45%
Transcription Volumes Edited Post 67% 72% 74% 76%
Speech Recognition
Adjusted EBITDA (1) $24.5 $26.7 $27.6 $29.8
Margin 22% 24% 25% 28%
Adjusted Net Income per fully
diluted share (1) $0.26 $0.30 $0.31 $0.34
Free Cash Flow (1) $19.2 $13.2 $16.3 $16.8
(1)As defined in Appendix.
Slide 12
Investor Marketing – November 2011
Copyright 2011 MedQuist, IP LLC. All rights reserved
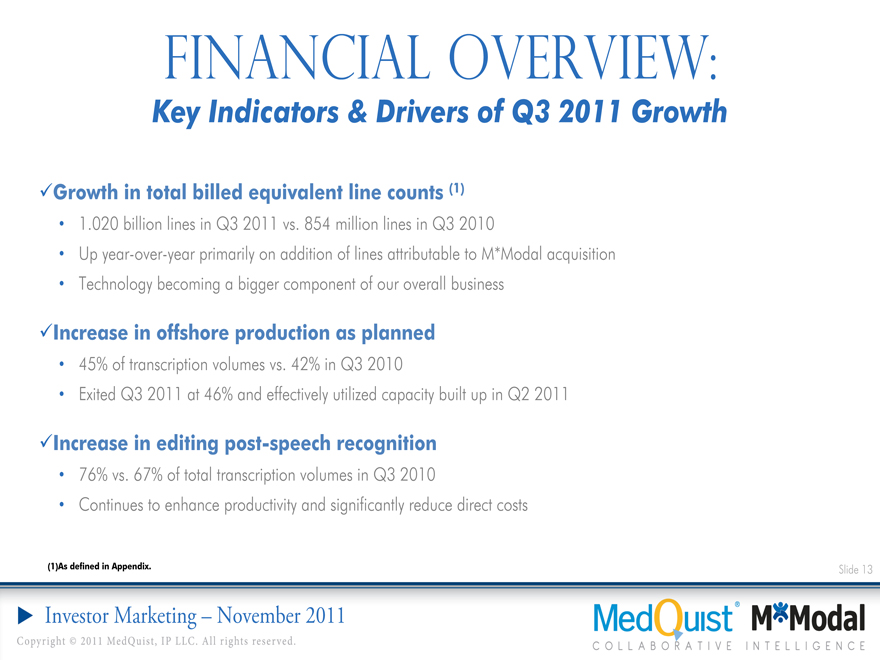
Financial overview:
Key Indicators & Drivers of Q3 2011 Growth
Growth in total billed equivalent line counts (1)
• 1.020 billion lines in Q3 2011 vs. 854 million lines in Q3 2010
• Up year-over-year primarily on addition of lines attributable to M*Modal
• Technology becoming a bigger component of our overall business
Increase in offshore production as planned
• 45% of transcription volumes vs. 42% in Q3 2010
• Exited Q3 2011 at 46% and effectively utilized capacity built up in Q2 2011
Increase in editing post-speech recognition
• 76% vs. 67% of total transcription volumes in Q3 2010
• Continues to enhance productivity and significantly reduce direct costs
(1)As defined in Appendix.
Slide 13
Investor Marketing – November 2011
Copyright 2011 MedQuist, IP LLC. All rights reserved
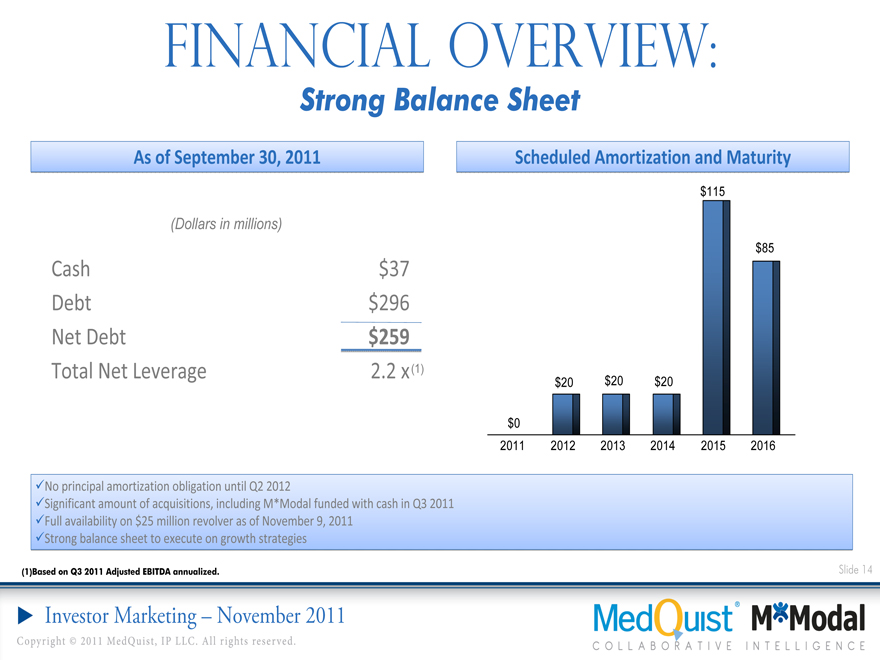
Financial overview:
Strong Balance Sheet
As of September 30, 2011
(Dollars in millions)
Cash $37
Debt $296
Net Debt $259
Total Net Leverage 2.2 x (1)
Scheduled Amortization and Maturity
2011 2012 2013 2014 2015 2016
$0
$20
$20
$20
$115
$85
No principal amortization obligation until Q2 2012
Significant amount of acquisitions, including M*Modal funded with cash in Q3 2011
Full availability on $25 million revolver as of November 9, 2011
Strong balance sheet to execute on growth strategies
(1)Based on Q3 2011 Adjusted EBITDA annualized.
Slide 14
Investor Marketing – November 2011
Copyright 2011 MedQuist, IP LLC. All rights reserved

Financial overview
2011 Performance Goals(1)
2011E
(Dollars in millions, except per share data)(Range)
Net Revenues $441 ?$444
Total Billed Equivalent Line Counts (2) (lines in billions) 3.9 – 4.0
Adjusted EBITDA (2) $115.5 ?$118.0
Adjusted Net Income per fully diluted share (2) $1.29 ?$1.31
Includes benefit in fourth quarter 2011 from completed acquisitions
Acquisition and restructuring charges of $25 million to $27 million
Weighted average proforma shares outstanding of 54.7 million common shares
Capital expenditures of $19 million to $22 million
(1)Issued on November 9, 2011. (2)As defined in Appendix.
Slide 15
Investor Marketing – November 2011
Copyright 2011 MedQuist, IP LLC. All rights reserved
?Net Revenues: low- to mid-teens percentage increase vs. midpoint of 2011 performance goals
• Growth in the core business
New sales efforts: same-store and market share gains
Revenue from integration of M*Modal in transcription platforms
MTSO roll up strategy
• Full year benefit from M*Modal and commercialization of its technologies
Adjusted EBITDA: mid- to high-single-digit percentage increase vs. midpoint of 2011 performance goals
• Timing of sales force investments and commercialization of technologies weighted in 1H 2012
• Benefits from these investments begin to be realized in 2H 2012
Free Cash Flow: continue to generate significant positive FCF
• Sufficient to fund our growth strategies, including MTSO roll ups
• Timing of investments to create quarter-to-quarter variability
(1)Issued on November 9, 2011.
Slide 16
Slide 16
Investor Marketing – November 2011
Copyright 2011 MedQuist, IP LLC. All rights reserved

Appendix
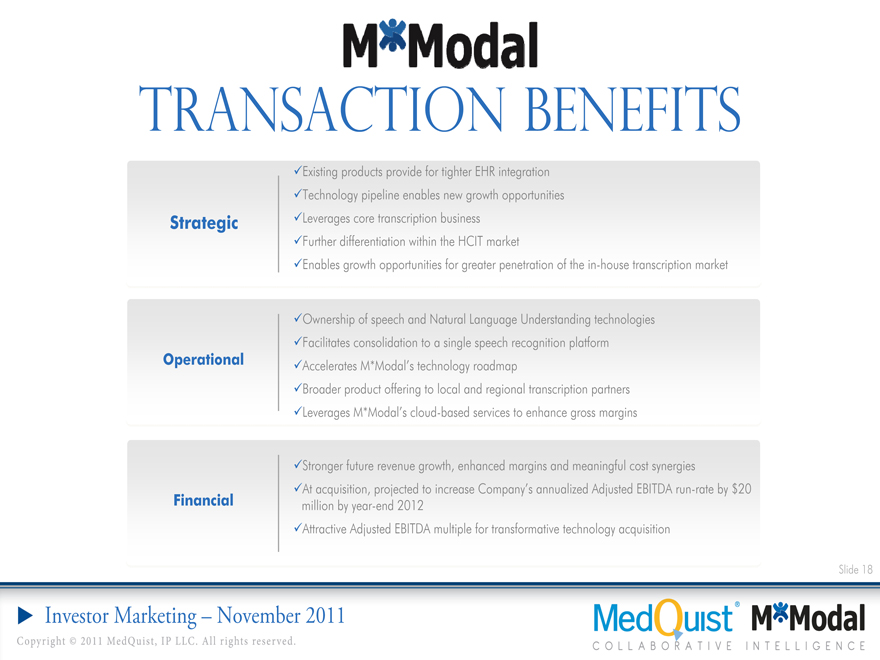
transaction benefits
Existing products provide for tighter EHR integration
Technology pipeline enables new growth opportunities
Strategic ?Leverages core transcription business
Further differentiation within the HCIT market
Enables growth opportunities for greater penetration of the in-house transcription market
Ownership of speech and Natural Language Understanding technologies
Facilitates consolidation to a single speech recognition platform
Operational ?Accelerates M*Modal’s technology roadmap
Broader product offering to local and regional transcription partners
Leverages M*Modal’s cloud-based services to enhance gross margins
Stronger future revenue growth, enhanced margins and meaningful cost synergies
At acquisition, projected to increase Company’s annualized Adjusted EBITDA run-rate by $20
Financial million by year-end 2012
Attractive Adjusted EBITDA multiple for transformative technology acquisition
Slide 18
Investor Marketing – November 2011
Copyright 2011 MedQuist, IP LLC. All rights reserved
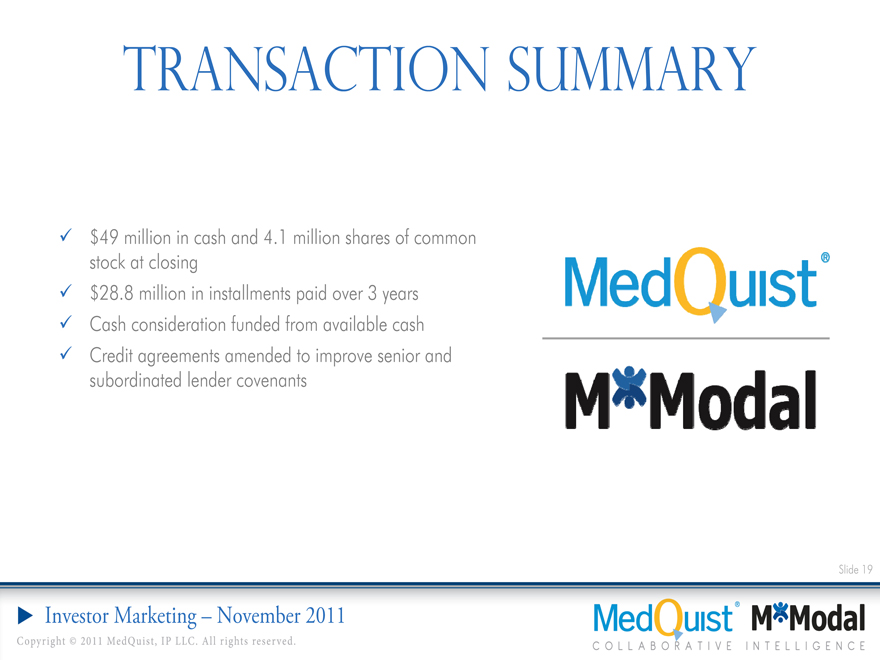
Transaction summary
$49 million in cash and 4.1 million shares of common stock at closing $28.8 million in installments paid over 3 years Cash consideration funded from available cash Credit agreements amended to improve senior and subordinated lender covenants
Slide 19
Investor Marketing – November 2011
Copyright 2011 MedQuist, IP LLC. All rights reserved
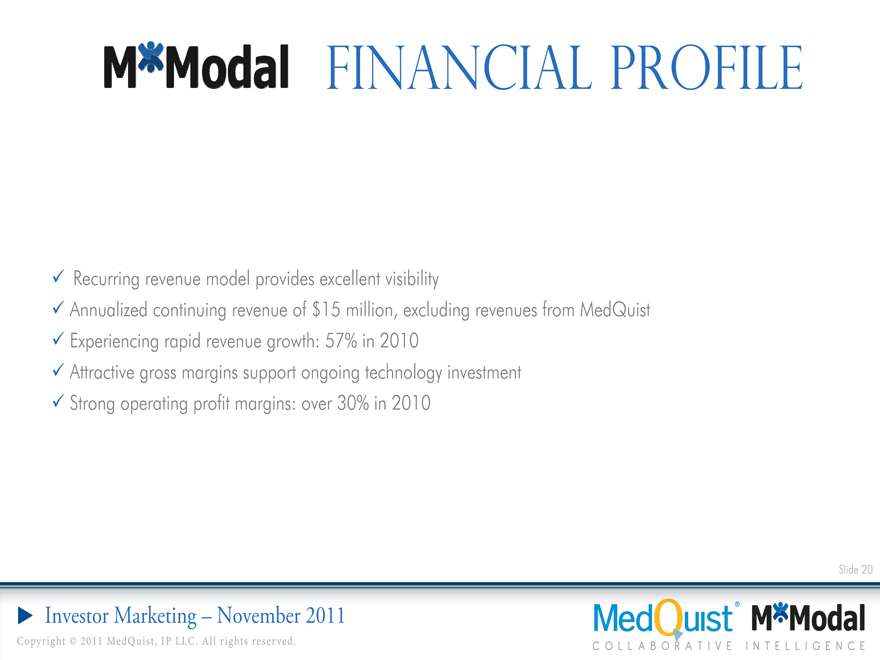
Financial profile
Recurring revenue model provides excellent visibility
Annualized continuing revenue of $15 million, excluding revenues from MedQuist Experiencing rapid revenue growth: 57% in 2010 Attractive gross margins support ongoing technology investment Strong operating profit margins: over 30% in 2010
Slide 20
Investor Marketing – November 2011
Copyright 2011 MedQuist, IP LLC. All rights reserved
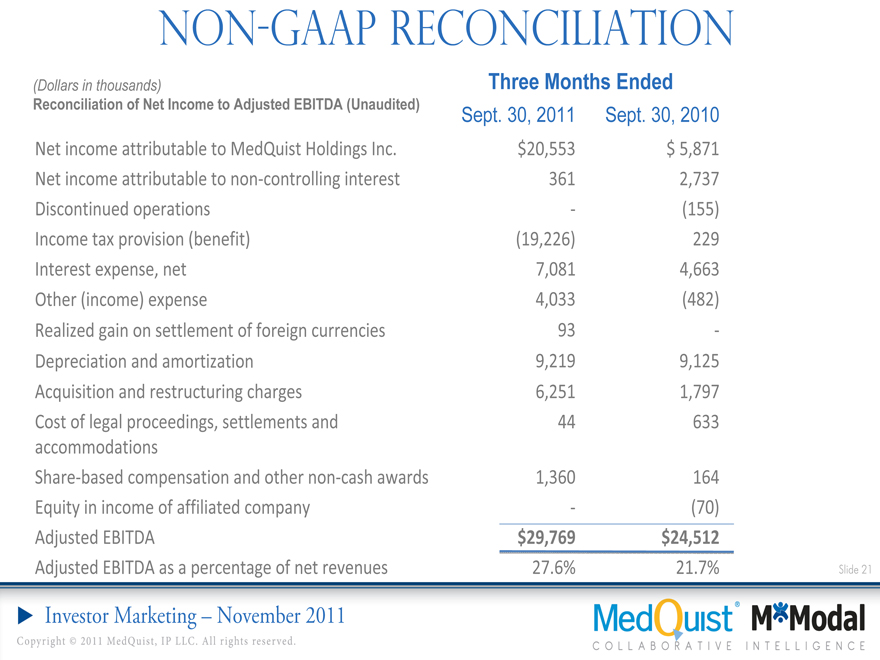
Non-gaap reconciliation
(Dollars in thousands) Three Months Ended
Reconciliation of Net Income to Adjusted EBITDA (Unaudited) Sept. 30, 2011 Sept. 30, 2010
Net income attributable to MedQuist Holdings Inc. $20,553 $ 5,871
Net income attributable to non-controlling interest 361 2,737
Discontinued operations - (155)
Income tax provision (benefit) (19,226) 229
Interest expense, net 7,081 4,663
Other (income) expense 4,033(482)
Realized gain on settlement of foreign currencies 93 -
Depreciation and amortization 9,219 9,125
Acquisition and restructuring charges 6,251 1,797
Cost of legal proceedings, settlements and 44 633
accommodations
Share-based compensation and other non-cash 1,360 164
awards Equity in income of affiliated company -(70)
Adjusted EBITDA $29,769 $24,512
Adjusted EBITDA as a percentage of net revenues 27.6% 21.7%
Slide 21
Investor Marketing – November 2011
Copyright 2011 MedQuist, IP LLC. All rights reserved.
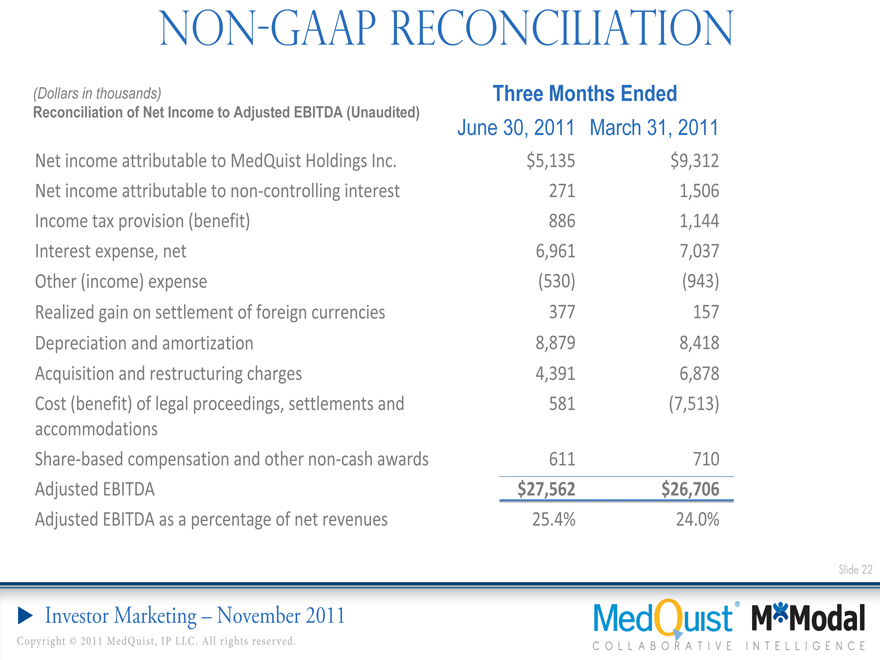
Non-gaap reconciliation
(Dollars in thousands) Three Months Ended
Reconciliation of Net Income to Adjusted EBITDA (Unaudited)
June 30, 2011 March 31, 2011
Net income attributable to MedQuist Holdings Inc. $5,135 $9,312
Net income attributable to non-controlling interest 271 1,506
Income tax provision (benefit) 886 1,144
Interest expense, net 6,961 7,037
Other (income) expense(530)(943)
Realized gain on settlement of foreign currencies 377 157
Depreciation and amortization 8,879 8,418
Acquisition and restructuring charges 4,391 6,878
Cost (benefit) of legal proceedings, settlements and 581(7,513)
accommodations
Share-based compensation and other non-cash 611 710
Adjusted awards EBITDA $27,562 $26,706
Adjusted EBITDA as a percentage of net revenues 25.4% 24.0%
Slide 22
Investor Marketing – November 2011
Copyright 2011 MedQuist, IP LLC. All rights reserved.

Non-gaap reconciliation
Three Months Ended
(Dollars in thousands)
Free Cash Flow (Unaudited) Sept. 30, 2011 Sept. 30, 2010
Adjusted EBITDA $29,769 $24,512
Consolidated interest expense(7,081)(4,663)
Non-cash interest 774 1,482
Capital expenditures(5,959)(2,907)
Tax (provision) benefit 19,226(229)
Deferred tax provision (benefit)(19,933) 964
Free Cash Flow $16,796 $19,159
Adjusted Net Income (Unaudited)
Adjusted EBITDA $29,769 $24,512
Less: Amortization (excluding acquired intangibles) 4,116 4,894
Cash interest (total expenses less non-cash) 6,307 3,181
Current tax provision (benefit) 707(735)
Adjusted Net Income $18,639 $17,172
Adjusted Net Income per fully diluted share:
Basic $0.35 $0.34
Diluted $0.34 $0.26
Slide 23
Investor Marketing – November 2011
Copyright 2011 MedQuist, IP LLC. All rights reserved.
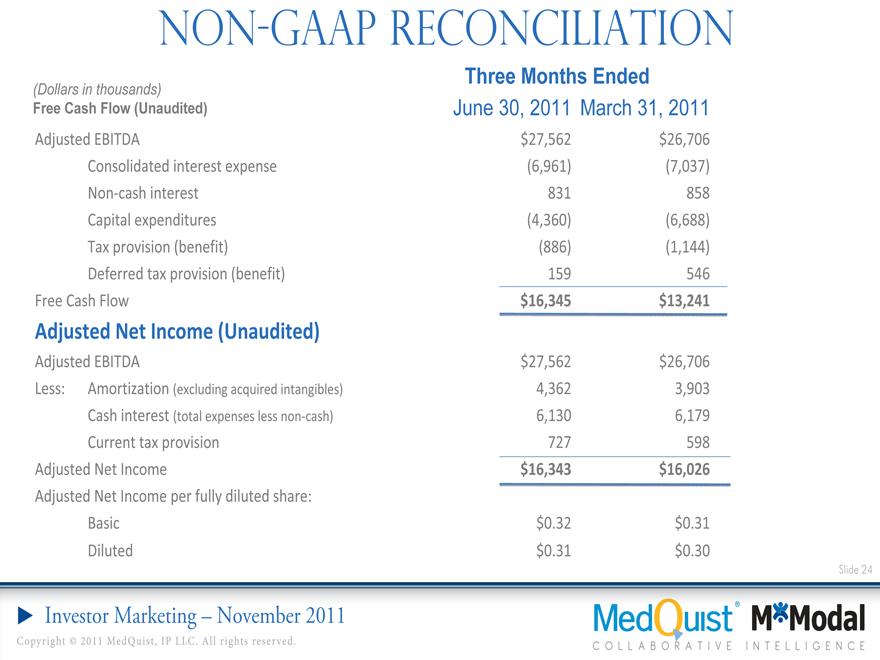
Non-gaap reconciliation
Three Months Ended
(Dollars in thousands)
Free Cash Flow (Unaudited) June 30, 2011 March 31, 2011
Adjusted EBITDA $27,562 $26,706
Consolidated interest expense (6,961)(7,037)
Non-cash interest 831 858
Capital expenditures (4,360)(6,688)
Tax provision (benefit) (886)(1,144)
Deferred tax provision (benefit) 159 546
Free Cash Flow $16,345 $13,241
Adjusted Net Income (Unaudited)
Adjusted EBITDA $27,562 $26,706
Less: Amortization (excluding acquired intangibles) 4,362 3,903
Cash interest (total expenses less non-cash) 6,130 6,179
Current tax provision 727 598
Adjusted Net Income $16,343 $16,026
Adjusted Net Income per fully diluted share:
Basic $0.32 $0.31
Diluted $0.31 $0.30
Slide 24
Investor Marketing – November 2011
Copyright 2011 MedQuist, IP LLC. All rights reserved.
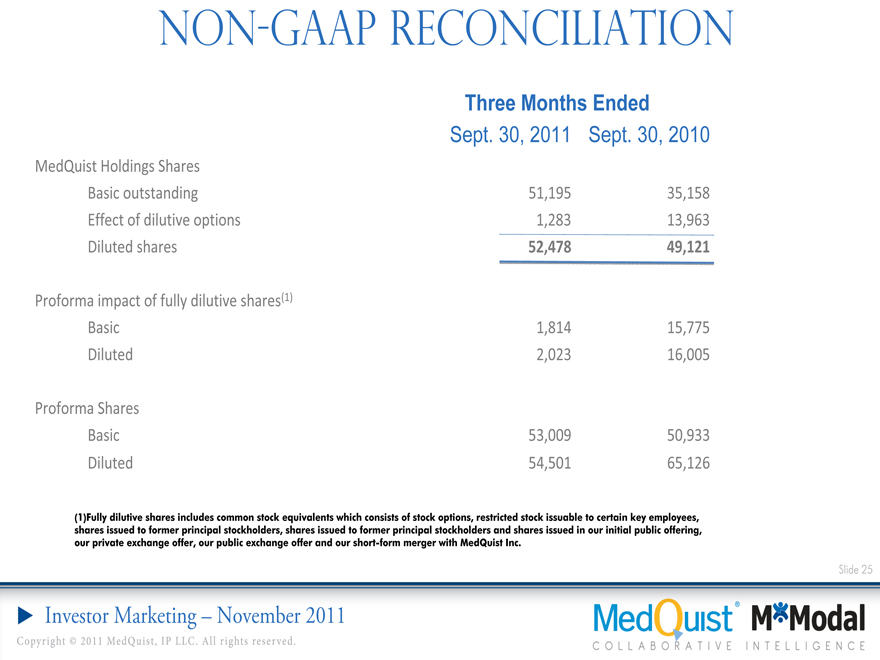
Non-gaap reconciliation
Three Months Ended
Sept. 30, 2011 Sept. 30, 2010
MedQuist Holdings Shares
Basic outstanding 51,195 35,158
Effect of dilutive options 1,283 13,963
Diluted shares 52,478 49,121
Proforma impact of fully dilutive shares(1)
Basic 1,814 15,775
Diluted 2,023 16,005
Proforma Shares
Basic 53,009 50,933
Diluted 54,501 65,126
(1) Fully dilutive shares includes common stock equivalents which consists of stock options, restricted stock issuable to certain key employees, shares issued to former principal stockholders, shares issued to former principal stockholders and shares issued in our initial public offering, our private exchange offer, our public exchange offer and our short-form merger with MedQuist Inc.
Slide 25
Investor Marketing – November 2011
Copyright 2011 MedQuist, IP LLC. All rights reserved.

Non-gaap reconciliation
Three Months Ended
June 30, 2011 March 31, 2011
MedQuist Holdings Shares
Basic outstanding 49,168 40,933
Effect of dilutive options 1,391 1,047
Diluted shares 50,559 41,980
Proforma impact of fully dilutive shares(1)
Basic 1,929 10,683
Diluted 2,176 10,913
Proforma Shares
Basic 51,097 51,616
Diluted 52,735 52,893
(1)Fully dilutive shares includes common stock equivalents which consists of stock options, restricted stock issuable to certain key employees, shares issued to former principal stockholders, shares issued to former principal stockholders and shares issued in our initial public offering, our private exchange offer, our public exchange offer and our short-form merger with MedQuist Inc.
Slide 26
Investor Marketing – November 2011
Copyright 2011 MedQuist, IP LLC. All rights reserved.
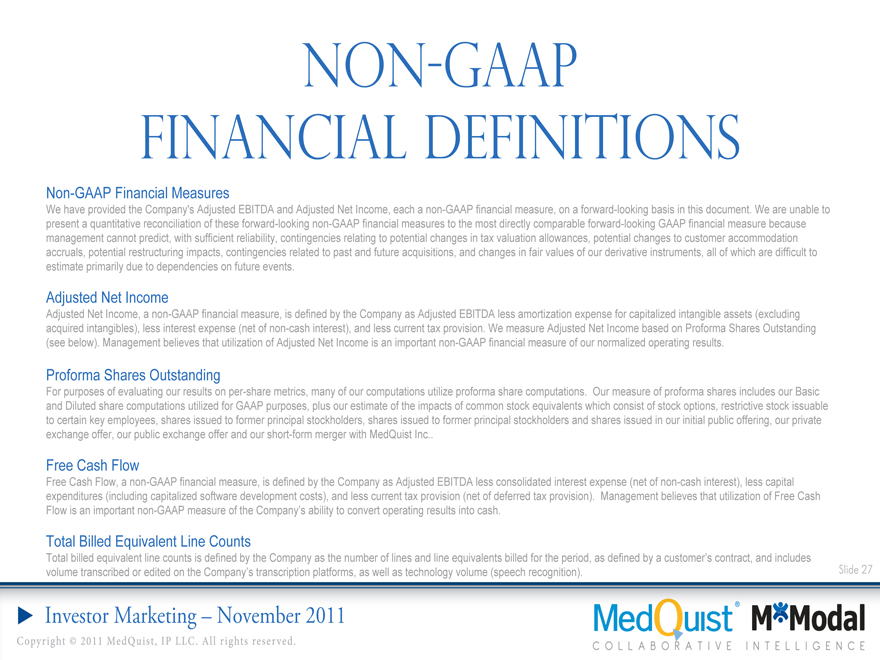
Non-gaap financial definitions
Non-GAAP Financial Measures
We have provided the Company’s Adjusted EBITDA and Adjusted Net Income, each a non-GAAP financial measure, on a forward-looking basis in this document. We are unable to present a quantitative reconciliation of these forward-looking non-GAAP financial measures to the most directly comparable forward-looking GAAP financial measure because management cannot predict, with sufficient reliability, contingencies relating to potential changes in tax valuation allowances, potential changes to customer accommodation accruals, potential restructuring impacts, contingencies related to past and future acquisitions, and changes in fair values of our derivative instruments, all of which are difficult to estimate primarily due to dependencies on future events.
Adjusted Net Income
Adjusted Net Income, a non-GAAP financial measure, is defined by the Company as Adjusted EBITDA less amortization expense for capitalized intangible assets (excluding acquired intangibles), less interest expense (net of non-cash interest), and less current tax provision. We measure Adjusted Net Income based on Proforma Shares Outstanding (see below). Management believes that utilization of Adjusted Net Income is an important non-GAAP financial measure of our normalized operating results.
Proforma Shares Outstanding
For purposes of evaluating our results on per-share metrics, many of our computations utilize proforma share computations. Our measure of proforma shares includes our Basic and Diluted share computations utilized for GAAP purposes, plus our estimate of the impacts of common stock equivalents which consist of stock options, restrictive stock issuable to certain key employees, shares issued to former principal stockholders, shares issued to former principal stockholders and shares issued in our initial public offering, our private exchange offer, our public exchange offer and our short-form merger with MedQuist Inc.
Free Cash Flow
Free Cash Flow, a non-GAAP financial measure, is defined by the Company as Adjusted EBITDA less consolidated interest expense (net of non-cash interest), less capital expenditures (including capitalized software development costs), and less current tax provision (net of deferred tax provision). Management believes that utilization of Free Cash Flow is an important non-GAAP measure of the Company’s ability to convert operating results into cash.
Total Billed Equivalent Line Counts
Total billed equivalent line counts is defined by the Company as the number of lines and line equivalents billed for the period, as defined by a customer’s contract, and includes volume transcribed or edited on the Company’s transcription platforms, as well as technology volume (speech recognition).
Slide 27
Investor Marketing – November 2011
Copyright 2011 MedQuist, IP LLC. All rights reserved.
Non-gaap financial definitions
Adjusted EBITDA
Adjusted EBITDA is a metric used by management to measure operating performance. Adjusted EBITDA is defined as net income attributable to MedQuist Holdings Inc., as applicable, plus net income attributable to noncontrolling interests, income taxes, net interest expense, depreciation and amortization, cost (benefit) of legal proceedings, settlements, and accommodations, acquisition and restructuring charges, discontinued operations, equity in income of affiliated company, share-based compensation and other non-cash awards, realized gain on settlement of foreign currency hedges, excluding other (income) expense. The realized gain on settlement of foreign currency hedges is a component of other (income) expense, as reported in the Consolidated Statements of Operations. Share-based compensation and other non-cash awards represents only the portion of such expense that is a component of selling, general and administrative expense, as reported in the Consolidated Statements of Operations, as it excludes such expense attributable to the Company’s restructuring actions.
We present Adjusted EBITDA as a supplemental performance measure because we believe it facilitates operating performance comparisons from period to period and company to company by backing out the following:
• potential differences caused by variations in capital structures (affecting interest expense, net), tax positions (such as the impact on periods or companies for changes in effective tax rates), the age and book depreciation of fixed assets (affecting depreciation expense); • the impact of non-cash charges; and • the impact of acquisition and integration related charges, restructuring charges, and certain unusual or nonrecurring items.
Because Adjusted EBITDA facilitates internal comparisons of operating performance on a more consistent basis, we also use Adjusted EBITDA in measuring our performance relative to that of our competitors. Adjusted EBITDA is not a measurement of our financial performance under GAAP and should not be considered as an alternative to net income, operating income or any other performance measures derived in accordance with GAAP or as an alternative to cash flow from operating activities as measures of our profitability or liquidity. We understand that although Adjusted EBITDA is frequently used by securities analysts, lenders and others in their evaluation of companies, Adjusted EBITDA has limitations as an analytical tool, and you should not consider it in isolation, or as a substitute for analysis of our results as reported under GAAP. Some of these limitations are:
• Adjusted EBITDA does not reflect our cash expenditures or future requirements for capital expenditures or contractual commitments;
• Adjusted EBITDA does not reflect changes in, or cash requirements for, our working capital needs;
• Although depreciation is a non-cash charge, the assets being depreciated will often have to be replaced in the future, and Adjusted EBITDA does not reflect any cash requirements for such replacements; and
• Other companies in our industry may calculate Adjusted EBITDA differently than we do, limiting its usefulness as a comparative measure.
Slide 28
Investor Marketing – November 2011
Copyright 2011 MedQuist, IP LLC. All rights reserved.

Investor Marketing – November 2011