Exhibit 99.1
|
Your Imagination, Our Innovation
Avago Technologies
Meeting with LSI Employees December 18, 2013
|
Forward Looking Statements
This document contains forward-looking statements which address Avago’s expected future business and financial performance. These forward-looking statements are based on current expectations, estimates, forecasts and projections of future Avago or industry performance, based on management’s judgment, beliefs, current trends and market conditions and involve risks and uncertainties that may cause actual results to differ materially from those contained in the forward-looking statements. Accordingly, we caution you not to place undue reliance on these statements. For Avago, particular uncertainties that could materially affect future results include our ability to achieve the growth prospects and synergies expected from acquisitions we may make, including LSI; delays, challenges and expenses associated with integrating acquired companies with our existing businesses, including LSI; global economic conditions and concerns; cyclicality in the semiconductor industry or in our target markets; loss of our significant customers; increased dependence on the volatile wireless handset market; quarterly and annual fluctuations in operating results; our competitive performance and ability to continue achieving design wins with our customers; market acceptance of the end products into which our products are designed; our target markets not growing as quickly as expected; our dependence on contract manufacturing and outsourced supply chain and our ability to improve our cost structure through our manufacturing outsourcing program; prolonged disruptions of our or our contract manufacturers’ manufacturing facilities or other significant operations; our dependence on outsourced service providers for certain key business services and their ability to execute to our requirements; our ability to maintain or improve gross margin; our ability to maintain tax concessions in certain jurisdictions; our ability to protect our intellectual property and any associated increases in litigation expenses; dependence on and risks associated with distributors of our products; our ability to attract, retain and motivate qualified personnel, particularly design and technical personnel; any expenses associated with resolving customer product and warranty and indemnification claims; and other events and trends on a national, regional and global scale, including those of a political, economic, business, competitive and regulatory nature.
Important additional risk factors that may cause such a difference for Avago in connection with the acquisition of LSI include, but are not limited to unexpected variations in market growth and demand for, matters arising in connection with the parties’ efforts to comply with and satisfy applicable regulatory clearances and closing conditions relating to the transaction and closing conditions relating to the transaction, the risks inherent in acquisitions of technologies and businesses, including the timing and successful completion of technology and product development through volume production, integration issues, costs and unanticipated expenditures, changing relationships with customers, suppliers and strategic partners, potential contractual, intellectual property or employment issues and charges resulting from purchase accounting adjustments or fair value measurements.
Avago’s Quarterly Report on Form 10-Q filed on September 13, 2013 and other filings with the SEC (which may be obtained for free at the SEC’s website at http://www.sec.gov) discuss some of the important risk factors that may affect Avago’s business, results of operations and financial condition. Avago undertakes no intent or obligation to publicly update or revise any of these forward looking statements, whether as a result of new information, future events or otherwise, except as required by law.
Non-GAAP Financial Measures
In addition to GAAP reporting, Avago provides investors with net income, income from operations, gross margin, operating expenses and other data, on a non-GAAP basis. This non-GAAP information excludes amortization of acquisition-related intangibles, share-based compensation expense, restructuring charges, acquisition-related costs, debt extinguishment losses and the income tax effects of these excluded items. Management does not believe that the excluded items are reflective of the Company’s underlying performance. The exclusion of these and other similar items from Avago’s non-GAAP presentation should not be interpreted as implying that these items are non-recurring, infrequent or unusual. Avago believes this non-GAAP financial information provides additional insight into the Company’s on-going performance and has therefore chosen to provide this information to investors for a more consistent basis of comparison and to help them evaluate the results of the Company’s on-going operations and enable more meaningful period to period comparisons. These non-GAAP measures are provided in addition to, and not as a substitute for, or superior to, measures of financial performance prepared in accordance with GAAP.
Page 2
Your Imagination, Our Innovation
|
Introduction to Avago Technologies
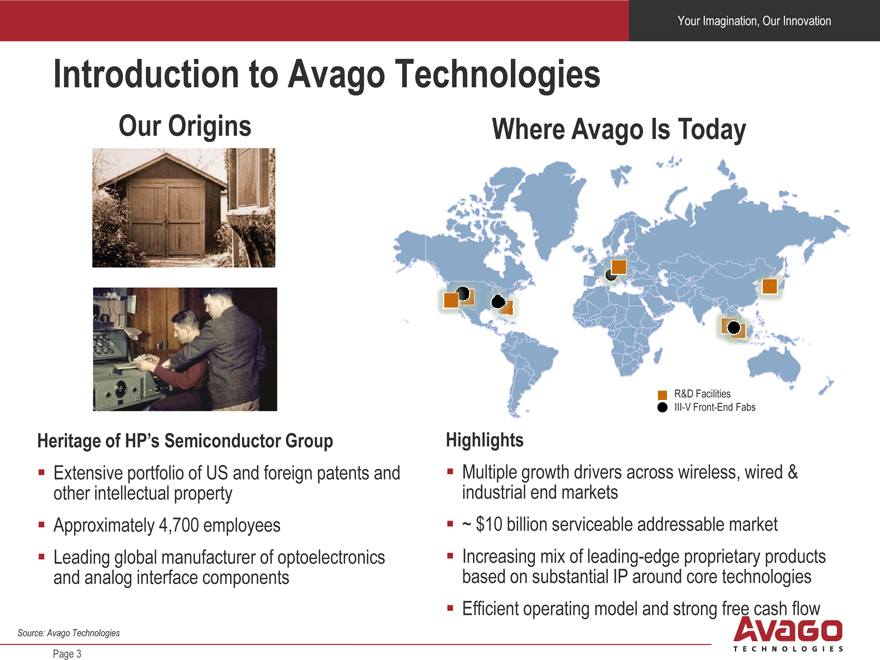
Our Origins
Heritage of HP’s Semiconductor Group
Extensive portfolio of US and foreign patents and other intellectual property
Approximately 4,700 employees
Leading global manufacturer of optoelectronics and analog interface components
Where Avago Is Today
R&D Facilities
III-V Front-End Fabs
Highlights
Multiple growth drivers across wireless, wired & industrial end markets
~ $10 billion serviceable addressable market
Increasing mix of leading-edge proprietary products based on substantial IP around core technologies
Efficient operating model and strong free cash flow
Source: Avago Technologies
Page 3
|
Your Imagination, Our Innovation
Focusing on Proprietary Products
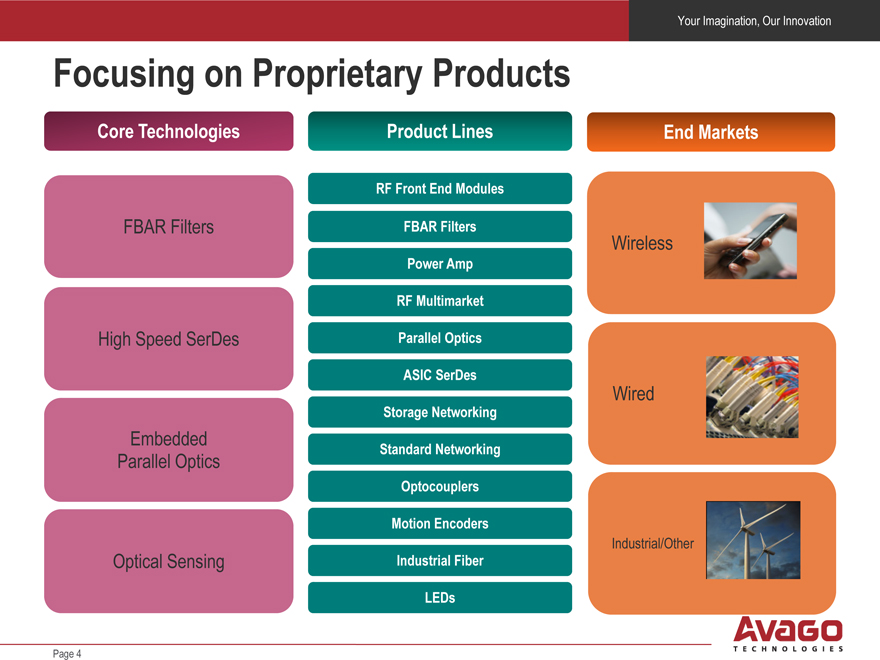
Core Technologies Product Lines End Markets
RF Front End Modules
FBAR Filters FBAR Filters Wireless
Power Amp
RF Multimarket
High Speed SerDes Parallel Optics
ASIC SerDes
Wired
Storage Networking
Embedded
Standard Networking
Parallel Optics
Optocouplers
Motion Encoders
Industrial/Other
Optical Sensing Industrial Fiber LEDs
Page 4
|
Your Imagination, Our Innovation
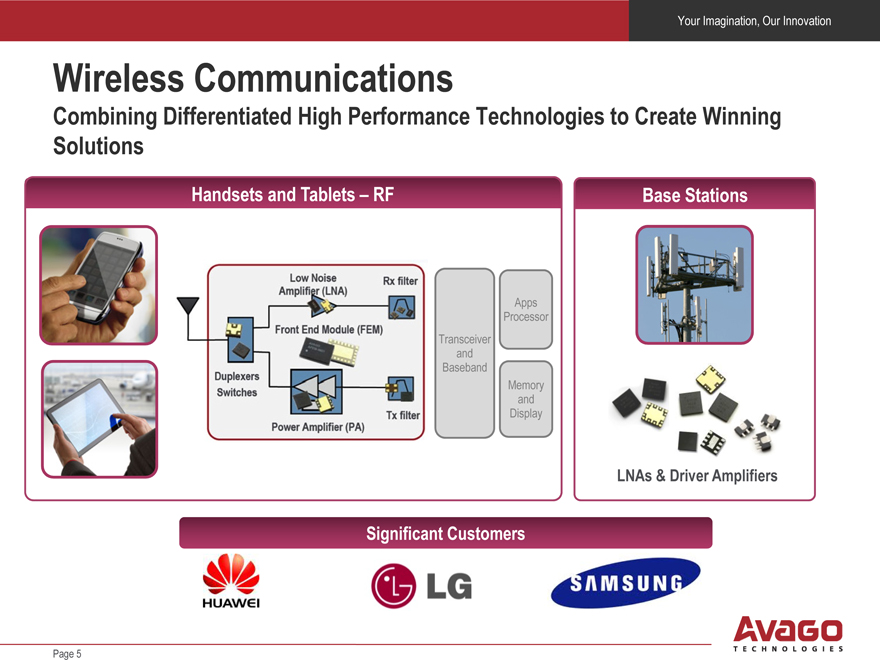
Wireless Communications
Combining Differentiated High Performance Technologies to Create Winning Solutions
Handsets and Tablets – RF Base Stations
Apps Processor Transceiver and Baseband Memory and Display
LNAs & Driver Amplifiers
Significant Customers
Page 5
|
Your Imagination, Our Innovation
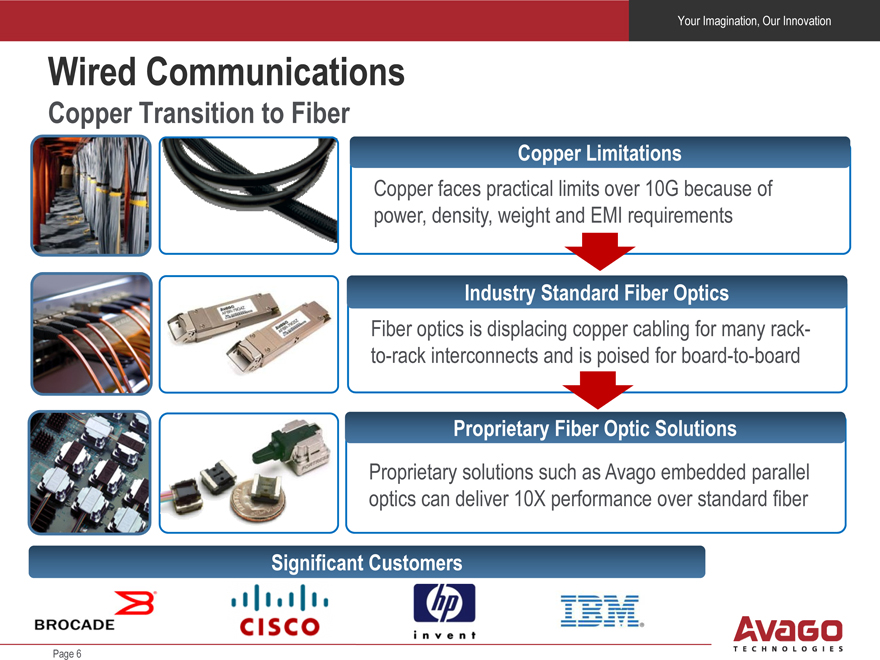
Wired Communications
Copper Transition to Fiber
Copper Limitations
Copper faces practical limits over 10G because of power, density, weight and EMI requirements
Industry Standard Fiber Optics
Fiber optics is displacing copper cabling for many rack-to-rack interconnects and is poised for board-to-board
Proprietary Fiber Optic Solutions
Proprietary solutions such as Avago embedded parallel optics can deliver 10X performance over standard fiber
Significant Customers
Page 6
|
Your Imagination, Our Innovation
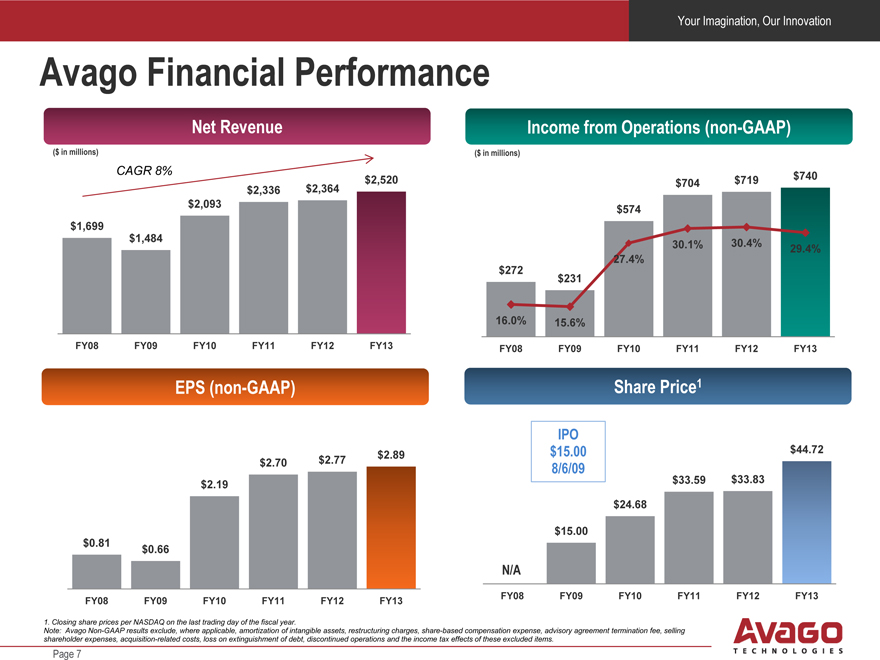
Avago Financial Performance
Net Revenue Income from Operations (non-GAAP)
($ in millions) ($ in millions)
CAGR 8% $740 $2,520 $704 $719
$2,336 $2,364 $2,093 $574 $1,699 $1,484 30.4%
30.1% 29.4%
27.4% $272 $231
16.0% 15.6%
FY08 FY09 FY10 FY11 FY12 FY13 FY08 FY09 FY10 FY11 FY12 FY13
EPS (non-GAAP) Share Price1
IPO
$15.00 $44.72
$2.89
$2.70 $2.77
8/6/09 $
$33.59 $33.83
$2.19
$24.68
$15.00
$0.81
$0.66
N/A
FY08 FY09 FY10 FY11 FY12 FY13 FY08 FY09 FY10 FY11 FY12 FY13
1. Closing share prices per NASDAQ on the last trading day of the fiscal year.
Note: Avago Non-GAAP results exclude, where applicable, amortization of intangible assets, restructuring charges, share-based compensation expense, advisory agreement termination fee, selling shareholder expenses, acquisition-related costs, loss on extinguishment of debt, discontinued operations and the income tax effects of these excluded items.
Page 7
|
Your Imagination, Our Innovation
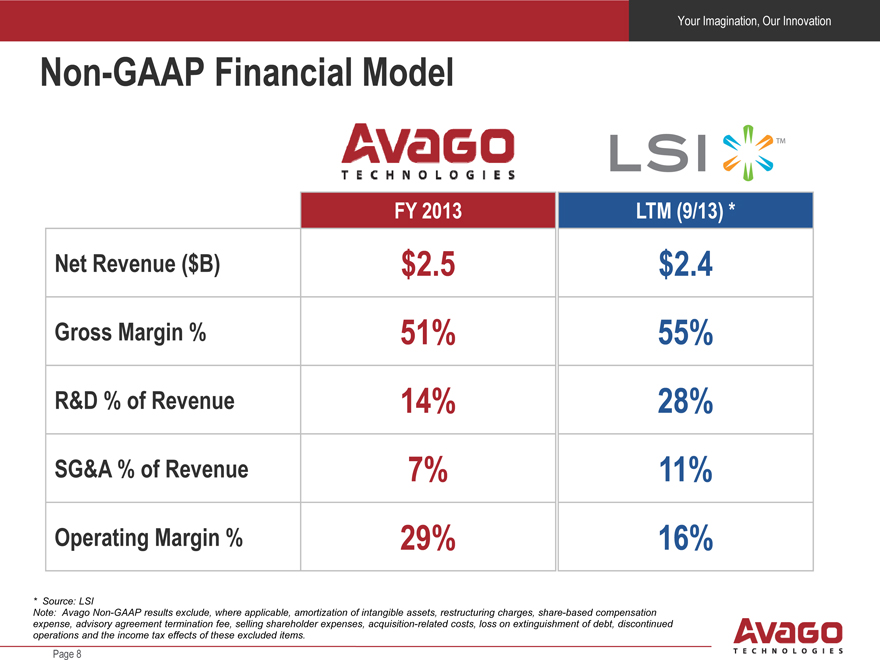
Non-GAAP Financial Model
FY 2013 LTM (9/13) *
Net Revenue ($B) $2.5 $2.4 Gross Margin % 51% 55% R&D % of Revenue 14% 28% SG&A % of Revenue 7% 11% Operating Margin % 29% 16%
* |
| Source: LSI |
Note: Avago Non-GAAP results exclude, where applicable, amortization of intangible assets, restructuring charges, share-based compensation expense, advisory agreement termination fee, selling shareholder expenses, acquisition-related costs, loss on extinguishment of debt, discontinued operations and the income tax effects of these excluded items.
Page 8
|
Your Imagination, Our Innovation
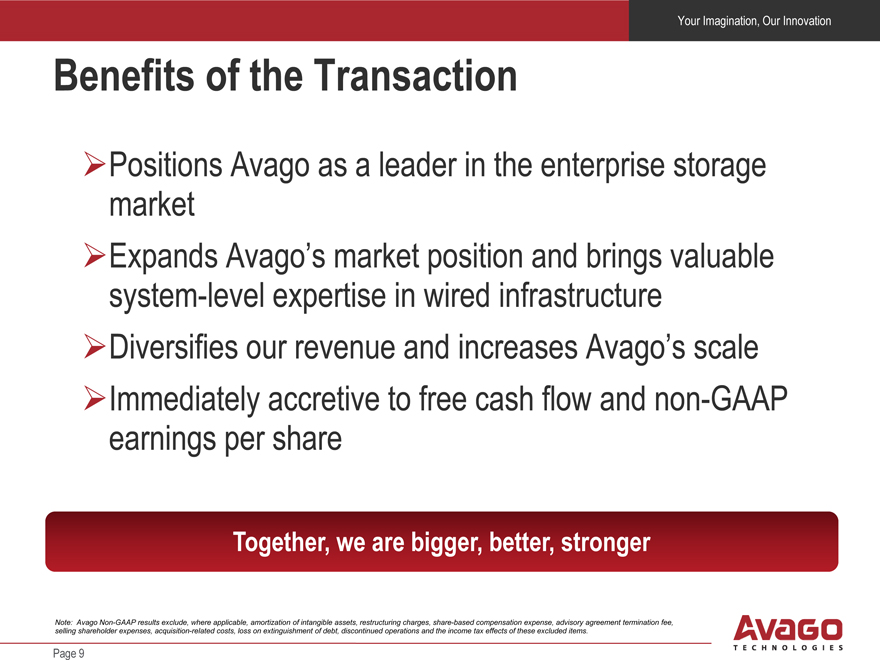
Benefits of the Transaction
Positions Avago as a leader in the enterprise storage market
Expands Avago’s market position and brings valuable system-level expertise in wired infrastructure
Diversifies our revenue and increases Avago’s scale
Immediately accretive to free cash flow and non-GAAP earnings per share
Together, we are bigger, better, stronger
Note: Avago Non-GAAP results exclude, where applicable, amortization of intangible assets, restructuring charges, share-based compensation expense, advisory agreement termination fee, selling shareholder expenses, acquisition-related costs, loss on extinguishment of debt, discontinued operations and the income tax effects of these excluded items.
Page 9
|
Your Imagination, Our Innovation
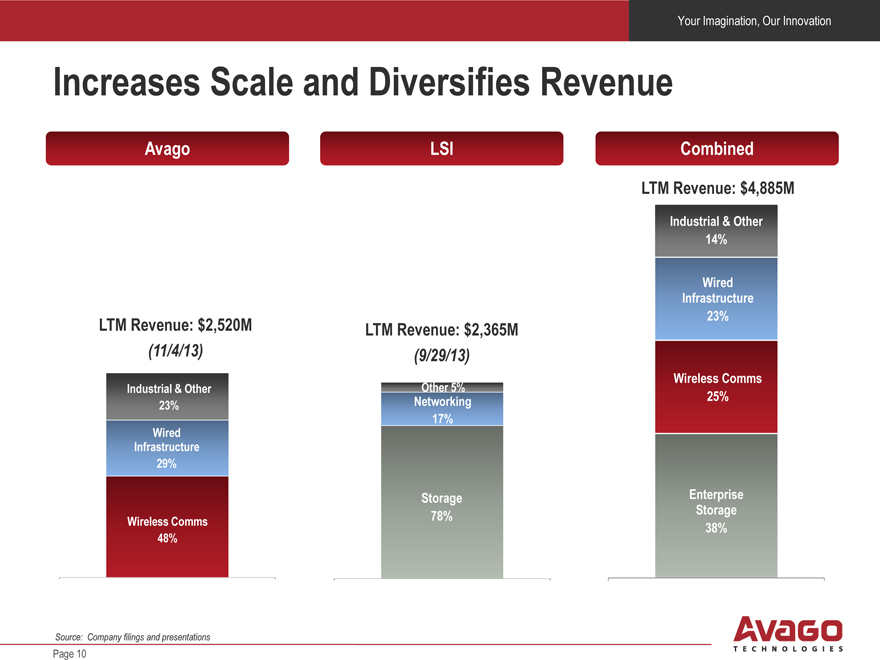
Increases Scale and Diversifies Revenue
Avago LSI Combined
LTM Revenue: $4,885M
Industrial & Other 14%
Wired Infrastructure 23%
LTM Revenue: $2,520M LTM Revenue: $2,365M
(11/4/13) (9/29/13)
Wireless Comms
Industrial & Other Other 5%
Networking 25%
23%
17%
Wired Infrastructure 29%
Storage Enterprise
Wireless Comms 78% Storage 38%
48%
Source: Company filings and presentations
Page 10
|
Your Imagination, Our Innovation
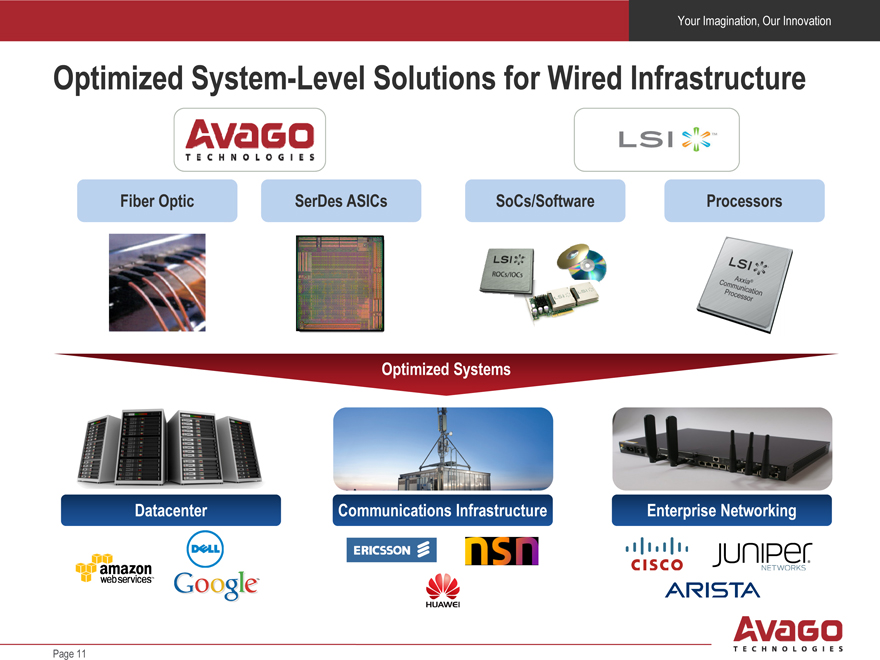
Optimized System-Level Solutions for Wired Infrastructure
Fiber Optic SerDes ASICs SoCs/Software Processors Optimized Systems Datacenter Communications Infrastructure Enterprise Networking
Page 11
|
Your Imagination, Our Innovation
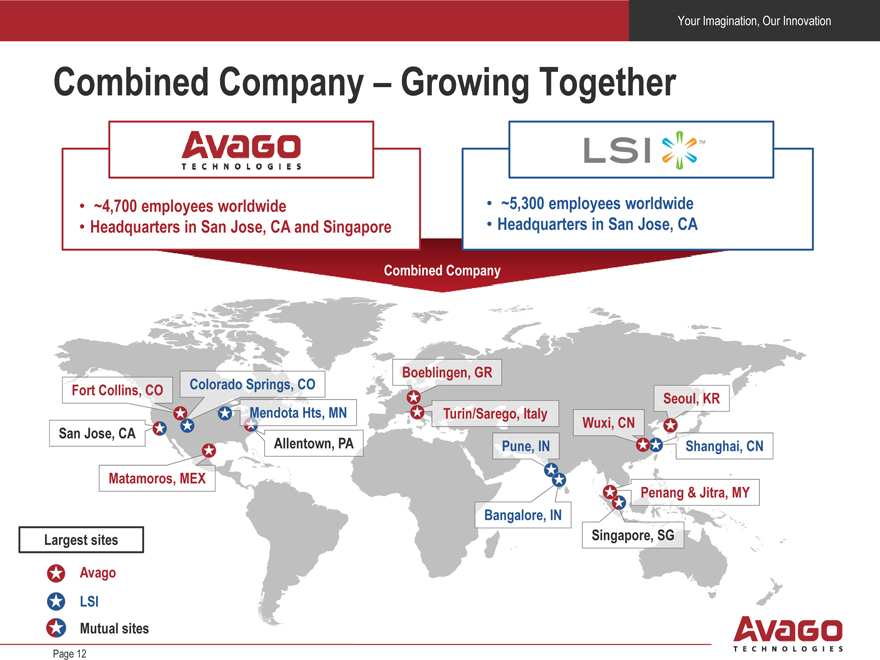
Combined Company – Growing Together
~4,700 employees worldwide ~5,300 employees worldwide
Headquarters in San Jose, CA and Singapore Headquarters in San Jose, CA
Combined Company
Boeblingen, GR
Fort Collins, CO Colorado Springs, CO Seoul, KR Mendota Hts, MN Turin/Sarego, Italy Wuxi, CN
San Jose, CA
Allentown, PA Pune, IN Shanghai, CN Matamoros, MEX Penang & Jitra, MY
Bangalore, IN
Largest sites Singapore, SG Avago LSI
Mutual sites
Page 12
|
Your Imagination, Our Innovation
Q&A
Page 13
|
Your Imagination, Our Innovation
Additional Information and Where to Find It; Participants in Solicitation
This communication is being made in respect of the proposed transaction involving LSI Corporation (“LSI”) and Avago Technologies Limited (“Avago”). The proposed transaction will be submitted to the stockholders of LSI for their consideration. In connection with the proposed transaction, LSI will prepare a proxy statement to be filed with the SEC. LSI and Avago also plan to file with the SEC other documents regarding the proposed transaction. LSI’S SECURITY HOLDERS ARE URGED TO READ THE PROXY STATEMENT REGARDING THE PROPOSED TRANSACTION AND ANY OTHER RELEVANT DOCUMENTS CAREFULLY AND IN THEIR ENTIRETY WHEN THEY BECOME AVAILABLE BECAUSE THEY WILL CONTAIN IMPORTANT INFORMATION ABOUT THE PROPOSED TRANSACTION. When completed, a definitive proxy statement and a form of proxy will be mailed to the stockholders of LSI. Investors will be able to obtain, without charge, a copy of the proxy statement and other relevant documents (when available) filed with the SEC from the SEC’s website at http://www.sec.gov. Investors will also be able to obtain, without charge, a copy of the proxy statement and other relevant documents (when available) by going to www.lsiproxy.com, by writing to LSI Corporation, 1110 American Parkway NE, Allentown, PA 18109, Attn: Response Center, or by calling 1 (800) 372-2447.
LSI and Avago and their respective directors, executive officers may be deemed to be participants in the solicitation of proxies from LSI’s stockholders with respect to the meeting of stockholders that will be held to consider the proposed Merger. Information regarding LSI’s directors and executive officers is contained in LSI’s Annual Report on Form 10-K for the year ended December 31, 2012, the proxy statement for LSI’s 2013 Annual Meeting of Stockholders, which was filed with the SEC on March 28, 2013, and subsequent filings which LSI has made with the SEC. Information regarding Avago’s directors and executive officers is contained in Avago’s Annual Report on Form 10-K for the year ended October 28, 2012, the proxy statement for the Avago’s 2013 Annual Meeting of Stockholders, which was filed with the SEC on February 20, 2013, and subsequent filings which Avago has made with the SEC. Investors may obtain additional information regarding the interests of LSI and its directors and executive officers in the proposed Merger, which may be different than those of LSI’s stockholders generally, by reading the proxy statement and other relevant documents regarding the proposed Merger, when it becomes available. You may obtain free copies of this document as described in the preceding paragraph.
Page 17
|
Your Imagination, Our Innovation
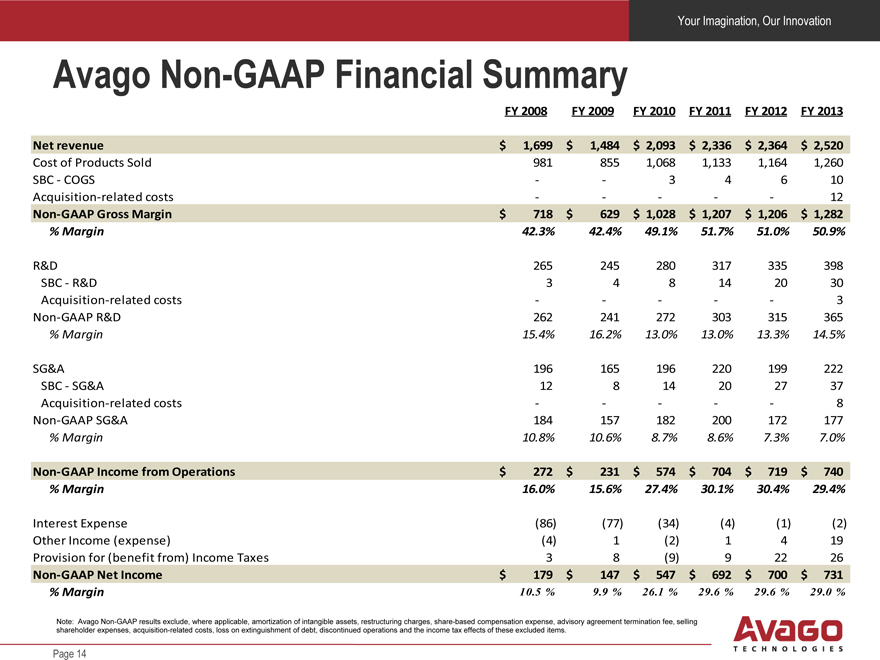
Avago Non-GAAP Financial Summary
FY 2008 FY 2009 FY 2010 FY 2011 FY 2012 FY 2013
Net revenue $ 1,699 $ 1,484 $ 2,093 $ 2,336 $ 2,364 $ 2,520
Cost of Products Sold 981 855 1,068 1,133 1,164 1,260 SBC—COGS — — 3 4 6 10 Acquisition-related costs — — — — — 12
Non-GAAP Gross Margin $ 718 $ 629 $ 1,028 $ 1,207 $ 1,206 $ 1,282
% Margin 42.3% 42.4% 49.1% 51.7% 51.0% 50.9%
R&D 265 245 280 317 335 398 SBC—R&D 3 4 8 14 20 30 Acquisition-related costs — — — — — 3 Non-GAAP R&D 262 241 272 303 315 365
% Margin 15.4% 16.2% 13.0% 13.0% 13.3% 14.5%
SG&A 196 165 196 220 199 222 SBC—SG&A 12 8 14 20 27 37 Acquisition-related costs — — — — — 8 Non-GAAP SG&A 184 157 182 200 172 177
% Margin 10.8% 10.6% 8.7% 8.6% 7.3% 7.0%
Non-GAAP Income from Operations $ 272 $ 231 $ 574 $ 704 $ 719 $ 740
% Margin 16.0% 15.6% 27.4% 30.1% 30.4% 29.4%
Interest Expense (86) (77) (34) (4) (1) (2) Other Income (expense) (4) 1 (2) 1 4 19 Provision for (benefit from) Income Taxes 3 8 (9) 9 22 26
Non-GAAP Net Income $ 179 $ 147 $ 547 $ 692 $ 700 $ 731
% Margin 10.5 % 9.9 % 26.1 % 29.6 % 29.6 % 29.0 %
Note: Avago Non-GAAP results exclude, where applicable, amortization of intangible assets, restructuring charges, share-based compensation expense, advisory agreement termination fee, selling shareholder expenses, acquisition-related costs, loss on extinguishment of debt, discontinued operations and the income tax effects of these excluded items.
Page 14
|
Your Imagination, Our Innovation
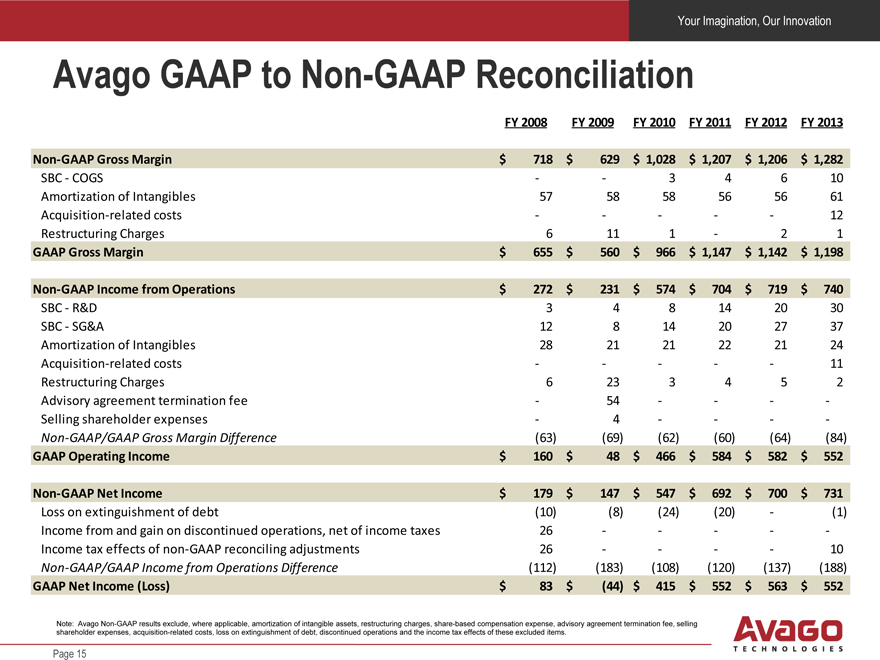
Avago GAAP to Non-GAAP Reconciliation
FY 2008 FY 2009 FY 2010 FY 2011 FY 2012 FY 2013
Non-GAAP Gross Margin $ 718 $ 629 $ 1,028 $ 1,207 $ 1,206 $ 1,282
SBC—COGS — — 3 4 6 10 Amortization of Intangibles 57 58 58 56 56 61 Acquisition-related costs — — — — — 12 Restructuring Charges 6 11 1 — 2 1
GAAP Gross Margin $ 655 $ 560 $ 966 $ 1,147 $ 1,142 $ 1,198
Non-GAAP Income from Operations $ 272 $ 231 $ 574 $ 704 $ 719 $ 740
SBC—R&D 3 4 8 14 20 30 SBC—SG&A 12 8 14 20 27 37 Amortization of Intangibles 28 21 21 22 21 24 Acquisition-related costs — — — — — 11 Restructuring Charges 6 23 3 4 5 2 Advisory agreement termination fee — 54 — — — -Selling shareholder expenses — 4 — — — -Non-GAAP/GAAP Gross Margin Difference (63) (69) (62) (60) (64) (84)
GAAP Operating Income $ 160 $ 48 $ 466 $ 584 $ 582 $ 552
Non-GAAP Net Income $ 179 $ 147 $ 547 $ 692 $ 700 $ 731
Loss on extinguishment of debt (10) (8) (24) (20) — (1) Income from and gain on discontinued operations, net of income taxes 26 — — — — -Income tax effects of non-GAAP reconciling adjustments 26 — — — — 10
Non-GAAP/GAAP Income from Operations Difference (112) (183) (108) (120) (137) (188)
GAAP Net Income (Loss) $ 83 $ (44) $ 415 $ 552 $ 563 $ 552
Note: Avago Non-GAAP results exclude, where applicable, amortization of intangible assets, restructuring charges, share-based compensation expense, advisory agreement termination fee, selling shareholder expenses, acquisition-related costs, loss on extinguishment of debt, discontinued operations and the income tax effects of these excluded items.
Page 15
|
Your Imagination, Our Innovation
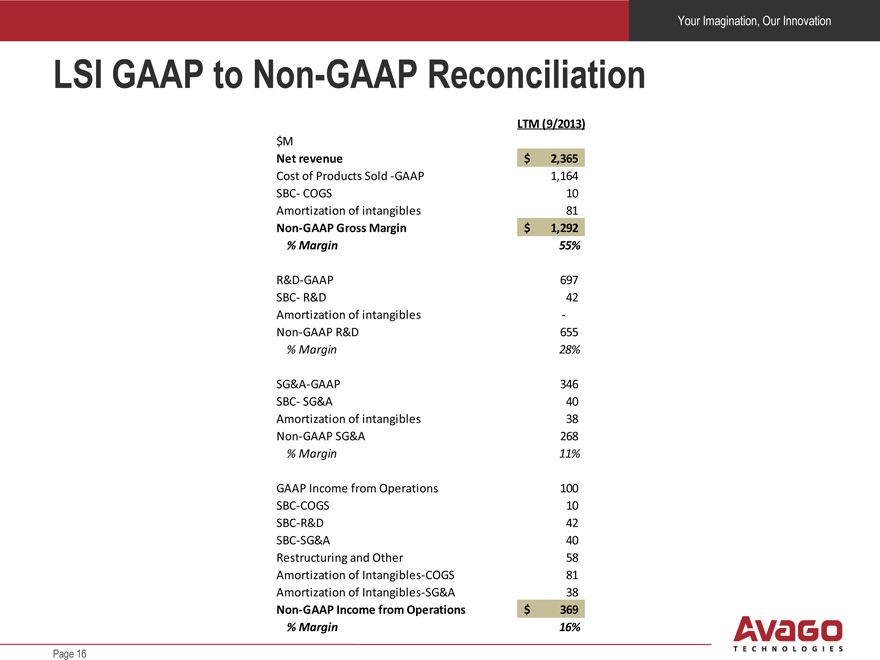
LSI GAAP to Non-GAAP Reconciliation
LTM (9/2013) $M
Net revenue $ 2,365
Cost of Products Sold -GAAP 1,164 SBC- COGS 10 Amortization of intangibles 81
Non-GAAP Gross Margin $ 1,292
% Margin 55%
R&D-GAAP 697 SBC- R&D 42 Amortization of intangibles - Non-GAAP R&D 655
% Margin 28%
SG&A-GAAP 346 SBC- SG&A 40 Amortization of intangibles 38 Non-GAAP SG&A 268
% Margin 11%
GAAP Income from Operations 100 SBC-COGS 10 SBC-R&D 42 SBC-SG&A 40 Restructuring and Other 58 Amortization of Intangibles-COGS 81 Amortization of Intangibles-SG&A 38
Non-GAAP Income from Operations $ 369
% Margin 16%
Page 16
