UNITED STATES
SECURITIES AND EXCHANGE COMMISSION
Washington, D.C. 20549
FORM 10-Q
| x | QUARTERLY REPORT PURSUANT TO SECTION 13 OR 15(d) OF THE SECURITIES EXCHANGE ACT OF 1934 |
For the quarterly period ended March 31, 2010
| ¨ | TRANSITION REPORT PURSUANT TO SECTION 13 OR 15(d) OF THE SECURITIES EXCHANGE ACT OF 1934 |
For the transition period from to
Commission File Number: 000-53401
Bohai Pharmaceuticals Group, Inc.
(Exact name of registrant as specified in its charter)
Nevada (State or other jurisdiction of incorporation or organization) | 98-0588402 (I.R.S. Employer Identification No.) |
c/o Yantai Bohai Pharmaceuticals Group Co. Ltd. No. 9 Daxin Road, Zhifu District Yantai, Shandong Province, China | 264000 |
| (Address of principal executive offices) | (Zip Code) |
Registrant’s telephone number (including area code): +86(535)-685-7928
Indicate by check mark whether the registrant (1) has filed all reports required to be filed by Section 13 or 15(d) of the Securities Exchange Act of 1934 during the preceding 12 months (or for such shorter period that the registrant was required to file such reports), and (2) has been subject to such filing requirements for the past 90 days. Yes x No ¨
Indicate by check mark whether the registrant has submitted electronically and posted on its corporate Web site, if any, every Interactive Data File required to be submitted and posted pursuant to Rule 405 of Regulation S-T (§232.405 of this chapter) during the preceding 12 months (or for such shorter period that the registrant was required to submit and post such files). Yes x No ¨
Indicate by check mark whether the registrant is a large accelerated filer, an accelerated filer, or a non-accelerated filer or a smaller reporting company. See definition of “large accelerated filer”, “accelerated filer” and “smaller reporting company” in Rule 12b-2 of the Exchange Act.
Large accelerated filer ¨ | | Accelerated filer ¨ |
Non-accelerated filer ¨ | | Smaller reporting company x |
| (Do not check if a smaller reporting company) | | |
Indicate by check mark whether the registrant is a shell company (as defined in Rule 12b-2 of the Exchange Act). Yes ¨ No x
As of May 17, 2010, there were 16,500,000 shares of company common stock issued and outstanding.
Bohai Pharmaceuticals Group, Inc.
Quarterly Report on Form 10-Q
TABLE OF CONTENTS
| PART I – FINANCIAL INFORMATION | |
| | |
| Cautionary Note Regarding Forward-Looking Statements | |
| | |
| Item 1. | Financial Statements (unaudited) | |
| | | |
| | Condensed Consolidated Balance Sheets as of June 30, 2009 (audited) and March 31, 2010 | 2 |
| | | |
| | Condensed Consolidated Statements of Income for three months ended March 31, 2009 and 2010, and for the nine months ended March 31, 2009 and 2010 | 3 |
| | | |
| | Condensed Consolidated Statements of Cash Flows for three months ended March 31, 2009 and 2010, and for the nine months ended March 31, 2009 and 2010 | 4 |
| | | |
| | Notes to Condensed and Consolidated Financial Statements | 5 |
| | | |
| Item 2. | Management’s Discussion and Analysis of Financial Condition and Results of Operations | 24 |
| | | |
| Item 3. | Quantitative and Qualitative Disclosures About Market Risk | 31 |
| | | |
| Item 4(T). | Controls and Procedures | 31 |
| | |
| PART II – OTHER INFORMATION | |
| | |
| Item 6. | Exhibits | 32 |
| | |
| SIGNATURES | 33 |
CAUTIONARY NOTE REGARDING FORWARD-LOOKING STATEMENTS
In addition to historical information, this Quarterly Report on Form 10-Q contains “forward-looking statements” within the meaning of the Private Securities Litigation Reform Act of 1995. The statements herein which are not historical reflect our current expectations and projections about our future results, performance, liquidity, financial condition, prospects and opportunities and are based upon information currently available to us and our management and our management’s interpretation of what is believed to be significant factors affecting the businesses, including many assumptions regarding future events. Such forward-looking statements include statements regarding, among other things:
| | · | our ability to generate commercial viability and acceptance of our products; |
| | · | our anticipated future sales and profitability; |
| | · | our future financing plans; |
| | · | our anticipated needs for working capital; |
| | · | our growth strategies, including future product offerings; |
| | · | the anticipated trends in our industry; |
| | · | our ability to expand our marketing capability; |
| | · | acquisitions of other companies or assets that we might undertake in the future; |
| | · | our operations in China and the regulatory, economic and political conditions in China; and |
| | · | competition existing today or that will likely arise in the future. |
Forward-looking statements, which involve assumptions and describe our future plans, strategies, and expectations, are generally identifiable by use of the words “may,” “should,” “expect,” “anticipate,” “estimate,” “believe,” “intend,” or “project” or the negative of these words or other variations on these words or comparable terminology. Actual results, performance, liquidity, financial condition, prospects and opportunities could differ materially from those expressed in, or implied by, these forward-looking statements as a result of various risks, uncertainties and other factors, including the ability to raise sufficient capital to continue our operations. Actual events or results may differ materially from those discussed in forward-looking statements as a result of various factors, including, without limitation, the risks outlined under “Risk Factors” and matters described in this Current Report on Form 8-K generally. In light of these risks and uncertainties, there can be no assurance that the forward-looking statements contained herein will in fact occur.
Potential purchasers of our common stock or other securities should not place undue reliance on any forward-looking statements. Except as expressly required by the federal securities laws, there is no undertaking to publicly update or revise any forward-looking statements, whether as a result of new information, future events, changed circumstances or any other reason
BOHAI PHARMACEUTICALS GROUP, INC.
PRO FORMA CONDENSED CONSOLIDATED BALANCE SHEETS
AS OF MARCH 31, 2010
(UNAUDITED)
(Stated in US Dollars)
| | | | As of | | | As of | |
| | | | March 31, | | | June 30, | |
| | Notes | | 2010 | | | 2009 | |
| | | | (Unaudited) | | | (Audited) | |
| | | | | | | | |
| ASSETS | | | | | | | |
| Current assets | | | | | | | |
| Cash and cash equivalents | | | | 15,574,909 | | | | 2,493,510 | |
| Accounts receivable | | | | 11,530,595 | | | | 11,096,866 | |
| Other receivables and prepayments | 4 | | | 6,969,569 | | | | 12,993,800 | |
| Amount due to equity holder | 5 | | | - | | | | 1,465,000 | |
| Inventories | 6 | | | 970,664 | | | | 307,834 | |
| | | | | | | | | | |
| Total current assets | | | | 35,045,737 | | | | 28,357,010 | |
| | | | | | | | | | |
| Non-current assets | | | | | | | | | |
| Property, plant and equipment, net | 8 | | | 7,946,215 | | | | 8,149,279 | |
| Intangible assets | 7 | | | 17,273,007 | | | | 17,298,720 | |
| | | | | | | | | | |
| Total non-current assets | | | | 25,219,222 | | | | 25,447,999 | |
| | | | | | | | | | |
| TOTAL ASSETS | | | | 60,264,959 | | | | 53,805,009 | |
| | | | | | | | | | |
| LIABILITES AND STOCKHOLDERS’ EQUITY | | | | | | | | | |
| Current liabilities | | | | | | | | | |
| Short-term borrowings | 9 | | | 4,381,153 | | | | 5,860,000 | |
| Notes payable | 10 | | | — | | | | 400,000 | |
| Accounts payable | | | | 842,350 | | | | 971,208 | |
| Other accrued liabilities | 11 | | | 1,941,088 | | | | 12,339,355 | |
| Income taxes payable | 16 | | | 1,389,733 | | | | 677,666 | |
| | | | | | | | | | |
| Total current liabilities | | | | 8,554,324 | | | | 20,248,229 | |
| | | | | | | | | | |
| Convertible promissory notes | 12 | | | 11,863,217 | | | | - | |
| | | | | | | | | | |
| TOTAL LIABILITIES | | | | 20,417,541 | | | | 20,248,229 | |
| | | | | | | | | | |
| STOCKHOLDERS’ EQUITY | | | | | | | | | |
| | | | | | | | | | |
| Common stock, $0.001 par value, 150,000,000 shares authorized, 16,250,000 shares issued and outstanding | 18 | | | 16,250 | | | | 3,450 | |
| Additional paid-in capital | 18 | | | 3,378,203 | | | | 2,974,520 | |
| Capital reserve | | | | 5,836,000 | | | | 5,836,000 | |
| Accumulated other comprehensive income | | | | 499,509 | | | | 490,931 | |
| Statutory reserves | | | | 2,974,137 | | | | 2,201,811 | |
| Retained earnings | | | | 27,143,319 | | | | 22,050,068 | |
| Total stockholders’ equity | | | | 39,847,418 | | | | 33,556,780 | |
| | | | | | | | | | |
| TOTAL LIABILITIES AND STOCKOLDERS’ EQUITY | | | | 60,264,959 | | | | 53,805,009 | |
See accompanying notes to the financial statements
BOHAI PHARMACEUTICALS GROUP, INC.
CONDENSED CONSOLIDATED STATEMENT OF INCOME
FOR THE THREE MONTHS ENEDED AND NINE MONTHS ENDED MARCH 31, 2010
(UNAUDITED)
(Stated in US Dollars)
| | | | | | Three months | | | Three months | | | Nine months | | | Nine months | |
| | | | | | ended | | | Ended | | | Ended | | | ended | |
| | | | | | March 31, | | | March 31, | | | March 31, | | | March 31, | |
| | | Notes | | | 2010 | | | 2009 | | | 2010 | | | 2009 | |
| | | | | | (Unaudited) | | | (Unaudited) | | | (Unaudited) | | | (Unaudited) | |
| | | | | | $ | | | $ | | | $ | | | $ | |
| | | | | | | | | | | | | | | | |
| Sales | | | | | | 15,323,878 | | | | 12,476,400 | | | | 46,072,455 | | | | 35,833,215 | |
| | | | | | | | | | | | | | | | | | | | |
| Less: Sales Tax | | | | | | (231,870 | ) | | | (200,622 | ) | | | (729,975 | ) | | | (580,207 | ) |
| | | | | | | | | | | | | | | | | | |
| Net sales | | | | | | 15,092,008 | | | | 12,275,778 | | | | 45,342,480 | | | | 35,253,008 | |
| | | | | | | | | | | | | | | | | | | | |
| Cost of sales | | | | | | (2,609,515 | ) | | | (2,019,864 | ) | | | (7,475,740 | ) | | | (5,966,876 | ) |
| | | | | | | | | | | | | | | | | | | | |
| Gross profit | | | | | | 12,482,493 | | | | 10,255,914 | | | | 37,866,740 | | | | 29,286,132 | |
| | | | | | | | | | | | | | | | | | | | |
| Selling, general and administrative expenses | | | 13 | | | | (9,465,589 | ) | | | (7,670,130 | ) | | | (28,471,469 | ) | | | (21,675,279 | ) |
| | | | | | | | | | | | | | | | | | | | | |
| Interest expenses | | | 14 | | | | (260,574 | ) | | | (52,921 | ) | | | (416,882 | ) | | | (168,422 | ) |
| | | | | | | | | | | | | | | | | | | | | |
| Operating income | | | | | | | 2,756,330 | | | | 2,532,863 | | | | 8,978,389 | | | | 7,442,431 | |
| | | | | | | | | | | | | | | | | | | | | |
| Other income | | | | | | | | | | | 158 | | | | 18,864 | | | | 158 | |
| | | | | | | | | | | | | | | | | | | | | |
| Finance and non-operating costs | | | 15 | | | | (1,287,902 | ) | | | (4,618 | ) | | | (1,309,994 | ) | | | (4,682 | ) |
| | | | | | | | | | | | | | | | | | | | | |
| Income before taxes | | | | | | | 1,468,428 | | | | 2,528,403 | | | | 7,687,259 | | | | 7,437,907 | |
| | | | | | | | | | | | | | | | | | | | | |
| Income taxes | | | 16 | | | | (585,135 | ) | | | (423,569 | ) | | | (2,193,931 | ) | | | (1,224,833 | ) |
| | | | | | | | | | | | | | | | | | | | | |
| Net income | | | | | | | 883,293 | | | | 2,104,834 | | | | 5,493,328 | | | | 6,213,074 | |
See accompanying notes to the financial statements
BOHAI PHARMACEUTICALS GROUP CO., LTD.
CONDENSED CONSOLIDATED STATEMENTS OF CASH FLOWS
FOR THE THREE MONTHS AND NINE MONTHS ENDED MARCH 31, 2010
(UNAUDITED)
(Stated in US Dollars)
| | | | Three months | | | Three months | | | Nine months | | | Nine months | |
| | | | ended | | | ended | | | ended | | | ended | |
| | | | March 31, 2010 | | | March 31, 2009 | | | March 31, 2010 | | | March 31, 2009 | |
| | Note | | (Unaudited) | | | (Unaudited) | | | (Unaudited) | | | (Unaudited) | |
| | | | $ | | | $ | | | $ | | | $ | |
| | | | | | | | | | | | | | |
| Cash flows from operating activities | | | | | | | | | | | | | |
| Net income | | | | 883,293 | | | | 2,104,834 | | | | 5,493,328 | | | | 6,213,074 | |
| Adjustments to reconcile net income to net cash provided | | | | | | | | | | | | | | | | | |
| by operating activities | | | | | | | | | | | | | | | | | |
| Depreciation | | | | 84,518 | | | | 213,912 | | | | 224,656 | | | | 284,387 | |
| Loss on disposals of property, plant and equipment | | | | - | | | | - | | | | 10,942 | | | | - | |
| Cost for proceeds of convertible promissory notes | | | | 1,287,902 | | | | - | | | | 1,287,902 | | | | - | |
| Changes in assets and liabilities | | | | | | | | | | | | | | | | | |
| Decrease/ (increase) in accounts receivable | | | | 250,769 | | | | (1,383,561 | ) | | | (433,728 | ) | | | (1,119,683 | ) |
| Decrease in other receivables and prepayments | | | | 6,504,589 | | | | 546,973 | | | | 4,127,297 | | | | 8,311,379 | |
| Decrease/ (increase) in amount due from equity holder | | | | - | | | | - | | | | 1,465,000 | | | | (108,426 | ) |
| (Increase)/ decrease in inventories | | | | (198,160 | ) | | | 206,841 | | | | (662,830 | ) | | | 138,503 | |
| Decrease/ (increase) in accounts payable | | | | 87,292 | | | | (257,958 | ) | | | (128,858 | ) | | | (1,923,974 | ) |
| (Decrease)/ increase in accrued liabilities | | | | (11,338,820 | ) | | | 783,952 | | | | (10,407,917 | ) | | | (12,430,148 | ) |
| (Decrease)/ increase in income taxes payable | | | | (273,202 | ) | | | 288,939 | | | | 2,905,998 | | | | 1,453,411 | |
| | | | | | | | | | | | | | | | | | |
| Net cash (used in)/ provided by operating activities | | | | (2,711,889 | ) | | | 2,503,932 | | | | 3,881,790 | | | | 818,523 | |
| | | | | | | | | | | | | | | | | | |
| Cash flows from investing activities | | | | | | | | | | | | | | | | | |
| Purchases of property, plant and equipment | | | | (84,518 | ) | | | (191,977 | ) | | | (280,804 | ) | | | (505,153 | ) |
| Proceeds from disposals of property, plant and equipment | | | | - | | | | - | | | | - | | | | - | |
| | | | | | | | | | | | | | | | | | |
| Net cash used in investing activities | | | | (84,518 | ) | | | (191,977 | ) | | | (280,804 | ) | | | (505,153 | ) |
| | | | | | | | | | | | | | | | | | |
| Cash flows from financing activities | | | | | | | | | | | | | | | | | |
| Issue of shares, net | | | | (12,800 | ) | | | - | | | | (12,800 | ) | | | - | |
| Proceeds of convertible promissory notes | | | | 12,000,000 | | | | - | | | | 12,000,000 | | | | - | |
| Cost for proceeds of convertible promissory notes | | | | (1,287,902 | ) | | | - | | | | (1,287,902 | ) | | | - | |
| Proceeds of borrowings | | | | 4,393,665 | | | | 1,314,713 | | | | 4,381,153 | | | | 4,382,377 | |
| Repayment of borrowings | | | | (4,381,153 | ) | | | (1,896,700 | ) | | | (5,860,000 | ) | | | (3,271,413 | ) |
| | | | | | | | | | | | | | | | | | |
| Net cash provided by/ (used in) financing activities | | | | 10,711,810 | | | | (581,987 | ) | | | 9,220,451 | | | | 1,110,964 | |
| | | | | | | | | | | | | | | | | | |
| Net increase in cash and cash equivalents | | | | 7,915,403 | | | | 1,729,968 | | | | 12,821,437 | | | | 1,424,334 | |
| | | | | | | | | | | | | | | | | | |
| Effect of foreign currency translation on cash and cash equivalents | | | | (233,372 | ) | | | (26,482 | ) | | | 259,962 | | | | 227,015 | |
| | | | | | | | | | | | | | | | | | |
| Cash and cash equivalents at beginning of period | | | | 7,892,908 | | | | 776,913 | | | | 2,493,510 | | | | 829,050 | |
| | | | | | | | | | | | | | | | | | |
| Cash and cash equivalents at end of period | | | | 15,574,909 | | | | 2,480,399 | | | | 15,574,909 | | | | 2,480,399 | |
See accompanying notes to the financial statements
BOHAI PHARMACEUTICALS GROUP, INC.
FOR THE NINE MONTHS ENDED MARCH 31, 2010
NOTES TO THE CONDENSED CONSOLIDATED FINANCIAL STATEMENTS
(UNAUDITED)
| 1. | ORGANIZATION AND PRINCIPAL ACTIVITIES |
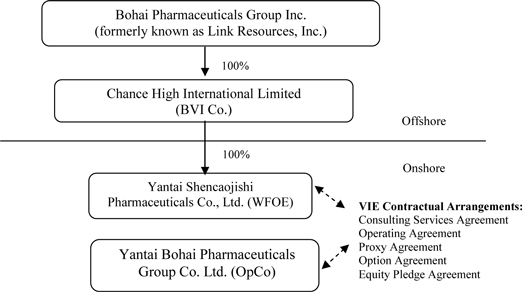
Bohai Pharmaceuticals Group, Inc. (formerly known as Link Resources, Inc.) was incorporated under the laws of the State of Nevada on January 9, 2008. Until January 5, 2010, its principal office was located in Calgary, Alberta, Canada. The Company was a public “shell” company in the exploration stage since its formation and had not yet realized any revenues from its planned operations. The Company entered into a Mineral Lease Agreement on April 1, 2008 for two mining claims in Pershing County, Nevada, in an area known as the Goldbanks East Prospect. The Company terminated the lease on July 7, 2009.
Pursuant to a Share Exchange Agreement, dated January 5, 2010 (the “Share Exchange Agreement” and the transactions contemplated thereby, the “Share Exchange”), the Company acquired Chance High International Limited, a British Virgin Islands company (“Chance High”) from Chance High’s shareholders (the “Chance High Shareholders”) and, as a result, acquired Chance High’s indirect, controlled subsidiary, Yantai Bohai Pharmaceuticals Group Co., Ltd. (“Bohai”), a Chinese company engaged the production, manufacturing and distribution in the People’s Republic of China (“China” or the “PRC”) of herbal medicines, including capsules and other products, based on traditional Chinese medicine. The closing of the Share Exchange (the “Closing”) took place on January 5, 2010 (the “Closing Date”).
On the Closing Date, pursuant to the terms of the Share Exchange Agreement, the Company acquired all of the outstanding equity securities (the “Chance High Shares”) of Chance High from the Chance High Shareholders, and the Chance High Shareholders transferred and contributed all of their Chance High Shares to the Company. In exchange, the Company issued to Chance High Shareholders an aggregate of 13,162,500 newly issued shares of common stock, par value $0.001 per share (the “Common Stock”). In addition, pursuant to the terms of the Share Exchange Agreement, Anthony Zaradic, the former President and Chief Executive Officer of the Company, cancelled a total of 1,500,000 shares of Common Stock.
Chance High owns 100% of the issued and outstanding capital stock of the Yantai Shencaojishi Pharmaceuticals Co., Ltd. (“WFOE”). On December 7, 2009, the WFOE entered into a series of variable interest entity contractual agreements (the “VIE Agreements”) with Bohai and its three shareholders, including Mr. Hongwei Qu, currently the Company’s Chairman, Chief Executive Officer and President (“Qu”), pursuant to which WFOE effectively assumed management of the business activities of Bohai and has the right to appoint all executives and senior management and the members of the board of directors of Bohai. Chance High, WFOE and Bohai are referred to herein collectively as the “Group”.
The VIE Agreements are comprised of a series of agreements, including a Consulting Services Agreement, Operating Agreement and Proxy Agreement, through which WFOE has the right to advise, consult, manage and operate Bohai for an annual fee in the amount of Bohai’s yearly net profits after tax. Additionally, Bohai’s shareholders pledged their rights, titles and equity interest in Bohai as security for WFOE to collect consulting and services fees provided to Bohai through an Equity Pledge Agreement. In order to further reinforce WFOE’s rights to control and operate Bohai, Bohai’s shareholders granted WFOE an exclusive right and option to acquire all of their equity interests in Bohai through an Option Agreement. As all of the companies in the Group are under common control, this has been accounted for as a reorganization of entities and the condensed consolidated financial statements have been prepared as if the reorganization had occurred retroactively under “as-if” basis which implies the financial result of the Company prior to the date of Share Exchange Agreement entered on January 5, 2010 has consolidated with the financial results of both Chance High, WFOE and Bohai occurred at the beginning of the reporting period. The Company has consolidated Bohai’s operating results, assets and liabilities within its financial statements.
The Group maintains its general ledger and journals with the accrual method accounting for financial reporting purposes. Accounting policies adopted by the Group conform to generally accepted accounting principles in the United States of America (“US GAAP”) and have been consistently applied in the presentation of financial statements, which are compiled on the accrual basis of accounting.
This basis of accounting differs in certain material respects from that used for the preparation of the books of account of the Group, which are prepared in accordance with the accounting principles and the relevant financial regulations applicable to enterprises with limited liabilities established in the PRC (“PRC GAAP”), the accounting standards used in the places of their domicile. The accompanying financial statements reflect necessary adjustments not recorded in the books of account of the Group to present them in conformity with US GAAP.
The interim financial statements as of and for the three months and nine moths ended March 31, 2010 reflect all adjustments which, in the opinion of management, are necessary to present fairly the financial position, results of operations and cash flows for the period presented in accordance with the accounting principles generally accepted in the United States of America. All adjustments are of a normal recurring nature.
| 3. | SUMMARY OF SIGNIFICANT ACCOUNTING POLICIES |
(a) Basis of Presentation and consolidation
The condensed consolidated financial statements of the Group are prepared on the “as-if” basis with assumption the Share Exchange was undergone at the beginning of July 1, 2008. The historical condensed consolidated financial statements of the Group will be those of Bohai Pharmaceuticals Group, Inc. and of the consolidated entities from the July 1, 2008, the deemed date of Share Exchange, and subsequent. The condensed consolidated financial statements for the Company for the three months and nine months ended March 31, 2010, include the financial statements of Chance High, and its wholly owned subsidiary, WFOE, and Bohai, the Company’s principal operating subsidiary, which is a Chinese variable interest entity that WFOE controls through certain contractual arrangements. Intercompany transactions and balances are eliminated in consolidation.
The Company has adopted FAS ASC 810-10-15-14 and also FIN 46R, which requires that a Variable Interest Entity (“VIE”) to be consolidated by a company if that company is entitled to receive a majority of the VIE’s residual returns and have direct ability to made decision on all operation activities of the voting right of the VIE.
The Operating Agreement indicated that Bohai, as operating company, which is wholly foreign owned under control of Chance High that empowers to WFOE the direct ability to made decision on all the operation activities of the voting right of Bohai.
Under Consultant Service Agreement entered between WFOE and Bohai on December 7, 2009, Bohai is agreed to pay all of net income to WOFE quarterly as consultant fee. Accordingly, WOFE has the right to receive the expected residual returns of Bohai.
Under above mentioned contractual arrangement, the Company, Bohai Pharmaceuticals Group, Inc. qualifies as the primary beneficiaries such a controlling financial interest of Bohai as operating under FASB ASC230-10-45 and FASB Interpretation No. 46R “Consolidation of Variable Interest Entities” (“FIN 46R”), an Interpretation of Accounting Research Bulletin No. 51. The result of subsidiaries or variable interest entities acquired prior to date of Share Exchange Agreement on January 5, 2010 entered are included in the condensed consolidated financial statement.
As of March 31, 2010, the particulars of the Company’s subsidiaries are as follows:
Name of Company | | Place of incorporation | | Date of incorporation | | Attributable equity interest | | Issued capital |
| | | | | | | | | |
| Chance High International Limited | | British Virgin Islands | | July 2, 2009 | | | 100% | | USD50,000 |
| | | | | | | | | | |
| Yantai Shencaojishi Pharmaceuticals Co., Ltd. | | People’s Republic of China | | November 25, 2009 | | | 100% | | USD9,500,000 |
| | | | | | | | | | |
| Yantai Bohai Pharmaceuticals Group Co., Ltd. | | People’s Republic of China | | July 8, 2004 | | | * | | USD2,918,000 (RMB20,000,000) |
* The Group has indirect controlling interest of Bohai under the VIE Agreements entered on December 7, 2009, which are described in Note 1 above.
Initial measurement of VIE - The Company initially measures the assets, liabilities, and non-controlling interests of the VIEs at their fair values at the date of the acquisitions. At the date of acquisition, the fair values of VIE was equal to book value of the VIE.
Accounting after initial measurement of VIE - Subsequent accounting for the assets, liabilities, and non-controlling interest of a consolidated variable interest entity are accounted for as if the entity were consolidated based on voting interests and the usual accounting rules for which the VIE operates are applied as they would to a consolidated subsidiary as follows:
| | · | Carrying amounts of the VIE are consolidated into the financial statements of the Company as the primary beneficiary (referred as “Primary Beneficiary” or “PB”); and |
| | · | Inter-company transactions and balances, such as revenues and costs, receivables and payables between or among the Primary Beneficiary and the VIE(s) are eliminated in their entirety. |
| (b) | Economic and Political Risks |
The Group’s operations are conducted solely in the PRC. There are significant risks associated with doing business in the PRC, among others, political, economic, legal and foreign currency exchange risks. The Group’s results may be adversely affected by changes in the political and social conditions in the PRC, and by changes in governmental policies with respect to laws and regulations, anti-inflationary measures, currency conversion, remittances abroad, and rates and methods of taxation, among other things.
In preparing the condensed consolidated financial statements in conformity with US GAAP, management makes estimates and assumptions that affect the reported amounts of assets and liabilities and disclosures of contingent assets and liabilities at the dates of the financial statements, as well as the reported amounts of revenues and expenses during the reporting periods. These accounts and estimates include, but are not limited to, the valuation of accounts receivable, inventories, deferred income taxes and the estimation on useful lives of plant and machinery. Actual results could differ from those estimates.
| (d) | Cash and Cash Equivalents |
The Group considers all highly liquid investments purchased with original maturities of three months or less to be cash equivalents. The Group maintains bank accounts only in the PRC. The Company does not maintain any bank accounts in the United States of America. As of March 31, 2010 and June 30, 2009, there were cash and cash equivalents of $15,574,909 and $2,493,510 respectively.
Accounts receivable consists of amounts due from customers. The Group extends unsecured credit to its customers in the ordinary course of business but mitigates the associated risks by performing credit checks and actively pursuing past due accounts. An allowance for doubtful accounts is established and determined based on management’s assessment of known requirements, aging of receivables, payment history, the customer’s current credit worthiness and the economic environment.
Inventories are valued at the lower of cost or market with cost is determined on the weighted average method. Finished goods inventories consist of raw materials, direct labor and overhead associated with the manufacturing process. In assessing the ultimate realization of inventories, the management makes judgments as to future demand requirements compared to current or committed inventory levels. The Group’s reserve requirements generally increase/decrease due to management projected demand requirements, market conditions and product life cycle changes. As of March 31, 2010 and June 30, 2009, the Group did not make any allowance for slow-moving or defective inventories.
| (g) | Fair value of Financial Instruments |
The carrying values of the Group’s financial instruments, including cash and cash equivalents, accounts receivables, other receivables and prepayments, short-term borrowings, accounts payables, and other accrued liabilities their fair values due to the short-term maturity of such instruments.
Intangible assets as “Pharmaceutical Formulas”, which acquired and with indefinite useful live are measured initially at cost and not subject to amortization shall be tested for impairment annually or more frequently if there is indication of impairment. If the carrying amount exceeds fair value, an impairment loss should be recognized. Subsequently reversal of a recognized impairment loss is prohibited.
| (i) | Property, plant and equipment |
Property, plant and equipment, other than construction in progress, are stated at cost less depreciation and amortization and accumulated impairment loss. Cost represents the purchase price of the asset and other costs incurred to bring the asset into its existing use. Maintenance, repairs and betterments, including replacement of minor items, are charged to expense; major additions to physical properties are capitalized.
Depreciation of property, plant and equipment is calculated to written off the cost, less their estimated residual value, if any, using the straight-line method over their estimated useful lives. The principal annual rates are as follows:
| Leasehold land and buildings | 30 to 40 years |
| Motor vehicles | 10 years |
| Plant and machinery | 10 years |
| Office equipment | 5 years |
Upon sale or disposition, the applicable amounts of asset cost and accumulated depreciation are removed from the accounts and the net amount less proceeds from disposal is charged or credited to income.
Construction in progress mainly represents expenditures in respect of the Group’s corporate campus and machinery under construction, which the campus was completed and at which production began in 2009. Assets under construction are not depreciated until the construction is completed and the assets are ready for their intended use.
| (j) | Accounting for the Impairment of Long-Lived Assets |
The Group adopted Statement of Financial Accounting Standards No. 144, “Accounting for the Impairment or Disposal of Long-Live Assets” (“SFAS 144”), which addresses financial accounting and reporting for the impairment or disposal of long-lived assets. The Group periodically evaluates the carrying value of long-lived assets to be held and used in accordance with SFAS 144. SFAS 144 requires impairment losses to be recorded on long-lived assets used in operations when indicators of impairment are present and the undiscounted cash flows estimated to be generated by those assets are less than the assets’ carrying amounts. In that event, a loss is recognized based on the amount by which the carrying amount exceeds the fair market value of the long-lived assets. Loss on long-lived assets to be disposed of is determined in a similar manner, except that fair market values are reduced for the cost of disposal. Based on its review, the Group believes that, as of March 31, 2010 and June 30, 2009, there were no significant impairments of its long-lived assets.
| (k) | Foreign Currency Translation |
The Group maintains its condensed consolidated financial statements in the functional currency. The functional currency of the Group is the Chinese Renminbi (RMB). Monetary assets and liabilities denominated in currencies other than the functional currency are translated into the functional currency at rates of exchange prevailing at the balance sheet dates. Transactions denominated in currencies other than the functional currency are translated into the functional currency at the exchanges rates prevailing at the dates of the transaction. Exchange gains or losses arising from foreign currency transactions are included in the determination of net income for the respective periods.
For financial reporting purposes, the financial statements of the Group which are prepared using the functional currency have been translated into United States dollars. Assets and liabilities are translated at the exchange rates at the balance sheet dates and revenue and expenses are translated at the average exchange rates and stockholders’ equity is translated at historical exchange rates. Any translation adjustments resulting are not included in determining net income but are included in foreign exchange adjustment to other comprehensive income, a component of stockholders’ equity.
| | | Three months ended March 31, 2010 | | | Three months ended March 31, 2009 | | | Nine months ended March 31, 2010 | | | Nine months ended March 31, 2009 | |
| Year end US$: RMB exchange rate | | | 6.83610 | | | | 6.84560 | | | | 6.83610 | | | | 6.84560 | |
| Average periodic US$: RMB exchange rate | | | 6.83603 | | | | 6.84658 | | | | 6.83773 | | | | 6.85094 | |
RMB is not freely convertible into foreign currency and all foreign exchange transactions must take place through authorized institutions. No representation is made that the RMB amounts could have been, or could be, converted into US$ at the rates used in translation.
Revenue represents the invoiced value of goods sold recognized upon the delivery of goods to customers. Revenue is recognized when all of the following criteria are met:
| | · | Persuasive evidence of an arrangement exists; |
| | · | Delivery has occurred or services have been rendered; |
| | · | The seller’s price to the buyer is fixed or determinable; and |
| | · | Collectability is reasonably assured. Payments have been established. |
The return policy of goods is recognized in actual basis when the goods sold were being returned by customer then the closing balance of the period/year is actually deducted by the increment of relevant cost of sales. The sales return rate is low and immaterial, no such provision is need to be made accordingly.
Regarding the trading of medicine, the respective cost of revenue consists primarily of material cost, labor cost, overhead associated with the manufacturing process and related expenses which are directly attributable to the trading.
| (n) | Research and Development Costs |
Research and development costs are charged as expense when incurred and included in operating expenses.
Income taxes are accounted for under the asset and liability method. Deferred tax assets and liabilities are recognized for the future tax consequences attributable to differences between the financial statement carrying amounts of existing assets and liabilities and their respective tax bases and operating loss and tax credit carry-forwards. Deferred tax assets are reduced by a valuation allowance to the extent management concludes it is more likely than not that the assets will not be realized. Deferred tax assets and liabilities are measured using enacted tax rates expected to apply to taxable income in the years in which those temporary differences are expected to be recovered or settled. The effect on deferred tax assets and liabilities of a change in tax rates is recognized in the statements of income and comprehensive income in the periods that includes the enactment date.
Comprehensive income is defined to include all changes in equity except those resulting from investments by owners and distributions to owners. Among other disclosures, all items that are required to be recognized under current accounting standards as components of comprehensive income are required to be reported in a condensed consolidated financial statement that is presented with the same prominence as other financial statements. The Group’s current components of other comprehensive income are the foreign currency translation adjustment.
| (q) | Commitments and Contingencies |
Liabilities for loss contingencies arising from claims, assessments, litigation, fines and penalties and other sources are recorded when it is probable that a liability has been incurred and the amount of the assessment can be reasonably estimated.
The Group reports basic earnings per share in accordance with SFAS 128, “Earnings Per Share”. Basic earnings/(loss) per share is computed by dividing net income/(loss) by weighted average number of shares of common stock outstanding during the period. Diluted earnings per share is computed by dividing net income by the weighted average number of shares of common stock, common stock equivalents and potentially dilutive securities outstanding during the period. Common equivalent shares are excluded from the computation in periods for which they have an anti-dilutive effect. Stock options for which the exercise price exceeds the average market price over the period are anti-dilutive and, accordingly, are excluded from the calculation. At March 31, 2010, the Group had no common stock equivalents that could potentially dilute future earnings per share
| (s) | Recent Accounting Pronouncements |
In March 2008, the FASB issued SFAS No. 161, DISCLOSURES ABOUT DERIVATIVE INSTRUMENTS AND HEDGING ACTIVITIES (an amendment to SFAS No. 133). This statement is effective for condensed consolidated financial statements issued for fiscal year and interim periods beginning after November 15, 2008 and requires enhanced disclosures with respect to derivative and hedging activities. The Group will comply with the disclosure requirements of this statement if it utilizes derivative instruments or engages in hedging activities upon its effectiveness.
In April 2008, the FASB issued FASB Staff Position No. 142-3, DETERMINATION OF THE USEFUL LIFE OF INTANGIBLE ASSETS (“FSP No. 142-3”) to improve the consistency between the useful life of a recognized intangible asset (under SFAS No. 142) and the period of expected cash flows used to measure the fair value of the intangible asset (under SFAS No. 141(R)). FSP No. 142-3 amends the factors to be considered when developing renewal or extension assumptions that are used to estimate an intangible asset’s useful life under SFAS No. 142. The guidance in the new staff position is to be applied prospectively to intangible assets acquired after December 31, 2008. In addition, FSP No.142-3 increases the disclosure requirements related to renewal or extension assumptions. The Company does not believe implementation of FSP No. 142-3 have a material impact on its condensed consolidated financial statements.
In May 2008, the FASB issued statement No. 162, THE HIERARCHY OF GENERALLY ACCEPTED ACCOUNTING PRINCIPLES. This statement identifies the sources of accounting principles and the framework for selecting the principles to be used in the preparation of financial statements of nongovernmental entities that are presented in conformity with generally accepted accounting principles (GAAP) in the United States (the GAAP hierarchy). This statement is effective 60 days following the SEC’s approval of the Public Company Accounting Oversight Board amendments to AU Section 411, “the Meaning of Present Fairly in Conformity With Generally Accepted Accounting Principles”.
In May 2008, the FASB issued FSP Accounting Principles Board (“APB”) 14-1 “Accounting for Convertible Debt instruments That May Be Settled in Cash upon Conversion (Including Partial Cash Settlement)” (“FSP APB 14-1”). FSP APB 14-1 requires the issuer of certain convertible debt instruments that may be settled in cash (or other assets) on conversion to separately account for the liability (debt) and equity (conversion option) components of the instrument in a manner that reflects the issuer’s non-convertible debt borrowing rate. FSP APB 14-1 is effective for fiscal years beginning after December 15, 2008 on a retroactive basis. As we do not have convertible debt at this time, we currently believe the adoption of FSP APB 14-1 will have no effect on our combined results of operations and financial condition.
In May 2008, the FASB issued Statement No. 163, ACCOUNTING FOR FINANCE GUARANTEE INSURANCE CONTRACTS - AN INTERPRETATION OF FASB STATEMENT NO. 60. The premium revenue recognition approach for a financial guarantee insurance contract links premium revenue recognition to the amount of insurance protection and the period in which it is provided. For purposes of this statement, the amount of insurance protection provided is assumed to be a function of the insured principal amount outstanding, since the premium received requires the insurance enterprise to stand ready to protect holders of an insured financial obligation from loss due to default over the period of the insured financial obligation. This Statement is effective for condensed consolidated financial statements issued for fiscal years beginning after December 15, 2008.
In June 2008, the FASB issued FASB Staff Position Emerging Issues Task Force (EITF) No. 03-6-1, DETERMINING WHETHER INSTRUMENTS GRANTED IN SHARE-BASED PAYMENT TRANSACTIONS ARE PARTICIPATING SECURITIES (“FSP EITF No. 03-6-1”). Under FSP EITF No. 03-6-1, unvested share-based payment awards that contain rights to receive nonforfeitable dividends (whether paid or unpaid) are participating securities, and should be included in the two-class method of computing EPS. FSP EITF No. 03-6-1 is effective for fiscal years beginning after December 15, 2008, and interim periods within those years, and is not expected to have a significant impact on the Company’s condensed consolidated financial statements.
In April 2009, the FASB issued FSP 157-4, DETERMINING FAIR VALUE WHEN THE VOLUME AND LEVEL OF ACTIVITY FOR THE ASSET OR LIABILITY HAVE SIGNIFICANTLY DECREASED AND IDENTIFYING TRANSACTIONS THAT ARE NOT ORDERLY (“FSP 157-4”). FSP 157-4 provides additional guidance for estimating fair value in accordance with SFAS 157 when the volume and level of activity for the asset or liability have significantly decreased. FSP 157-4 also includes guidance on identifying circumstances that indicate a transaction is not orderly. FSP 157-4 is effective for interim and annual reporting periods ending after June 15, 2009, with early adoption permitted for periods ending after March 15, 2009. FSP 157-4 does not require disclosures for earlier periods presented for comparative purposes at initial adoption. In periods after initial adoption, FSP 157-4 requires comparative disclosures only for periods ending after initial adoption. The adoption of the provisions of FSP 157-4 is not anticipated to materially impact on the Company’s results of operations or the fair values of its assets and liabilities.
In May 2009, the FASB issued SFAS No. 165, SUBSEQUENT EVENTS (“SFAS 165”). SFAS 165 establishes general standards for accounting for and disclosure of events that occur after the balance sheet date but before financial statements are issued or available to be issued and was effective for interim and annual periods ending after June 15, 2009. The adoption of SFAS No. 165 did not have an impact on the Company’s results of operations or financial condition. The Company evaluated all subsequent events that occurred from January 1, 2010 through January 30, 2010, inclusive, and does not found any material subsequent events are required to disclose.
In June 2009, the FASB issued SFAS No. 166 ACCOUNTING FOR TRANSFERS OF FINANCIAL ASSETS (“SFAS 166). This statement is intended to improve the relevance, representational faithfulness, and comparability of the information that a reporting entity provides in its financial reports about a transfer of financial assets; the effects of a transfer on its financial position, financial performance, and cash flows; and a transferor’s continuing involvement in transferred financial assets. This Statement must be applied as of the beginning of each reporting entity’s first annual reporting period that begins after November 15, 2009, and is required to be adopted by the Company in the first quarter of fiscal year 2011. Earlier application is prohibited. This Statement must be applied to transfers occurring on or after the effective date. The Company does not expect the adoption of SFAS 166 to have a material impact on the Company’s financial position, results of operations and cash flows.
In June 2009, the FASB issued SFAS No.167, “Amendments to FASB Interpretation No.46(R)”, which is codified as ASC 810. ASC 810 amends FASB Interpretation No.46(R), “Variable Interest Entities” for determining whether an entity is a variable interest entity (“VIE”) and requires an enterprise to perform an analysis to determine whether the enterprise’s variable interest or interests give it a controlling financial interest in a VIE. Under ASC 810, an enterprise has a controlling financial interest when it has a) the power to direct the activities of a VIE that most significantly impact the entity’s economic performance and b) the obligation to absorb losses of the entity or the right to receive benefits from the entity that could potentially be significant to the VIE. ASC 810 also requires an enterprise to assess whether it has an implicit financial responsibility to ensure that a VIE operates as designed when determining whether it has power to direct the activities of the VIE that most significantly impact the entity’s economic performance. ASC 810 also requires ongoing assessments of whether an enterprise is the primary beneficiary of a VIE, requires enhanced disclosures and eliminates the scope exclusion for qualifying special-purpose entities. ASC 810 shall be effective as of the beginning of each reporting entity’s first annual reporting period that begins after November 15, 2009, for interim periods within that first annual reporting period, and for interim and annual reporting periods thereafter. Earlier application is prohibited. ASC 810 is effective for the Company in the first quarter of fiscal 2011. The Company is currently evaluating the effect of ASC 810 on its condensed consolidated financial statements and results of operation and is currently not yet in a position to determine such effects.
In August 2009, the FASB issued Accounting Standards Update (“ASU”) No. 2009-05, “Measuring Liabilities at Fair Value”, which is codified as ASC 820, “Fair Value Measurements and Disclosures”. This Update provides amendments to ASC 820-10, Fair Value Measurements and Disclosures –Overall, for the fair value measurement of liabilities. This Update provides clarification that in circumstances in which a quoted price in an active market for the identical liability is not available, a reporting entity is required to measure fair value using a valuation technique that uses the quoted price of the identical liability when traded as an asset, quoted prices for similar liabilities or similar liabilities when traded as assets, or that is consistent with the principles of ASC 820. The amendments in this Update also clarify that when estimating the fair value of a liability, a reporting entity is not required to include a separate input or adjustment to other inputs relating to the existence of a restriction that prevents transfer of the liability. The amendments in this Update also clarify that both a quoted price in an active market for the identical liability at the measurement date and the quoted price for the identical liability when traded as an asset in an active market when no adjustments to the quoted price of the assets are required are Level 1 fair value measurements. ASC 820 is effective for the first reporting period (including interim periods) beginning after August 28, 2009. The adoption of this Update did not have a significant impact to the Company’s condensed consolidated financial statements.
In December 2009, the FASB issued ASU No. 2009-17, “Improvements to Financial Reporting by Enterprises Involved with Variable Interest Entities (“ASU 2009-17”)”. ASU 2009-17 amends the variable-interest entity guidance in FASB ASC 810-10-05-8 to clarify the accounting treatment for legal entities in which equity investors do not have sufficient equity at risk for the entity to finance its activities without financial support. ASU 2009-17 shall be effective as of the beginning of each reporting entity’s first annual reporting period that begins after November 15, 2009. ASU 2009-17 is effective for the Company in the first quarter of fiscal 2011. The Company is currently evaluating the effect of ASU 2009-17 on its condensed consolidated financial statements and results of operation and is currently not yet in a position to determine such effects.
None of the above new pronouncements has current application to the Group, but may be applicable to the Company’s future financial reporting.
| 4. | OTHER RECEIVABLES AND PREPAYMENTS |
Other receivables and prepayments consist of the following :
| | | As of March 31, 2010 | | | As of June 30, 2009 | |
| | | (Unaudited) | | | (Audited) | |
| | | | | | | |
| Prepayment for advertising and promotion | | $ | 2,925,645 | | | $ | 1,736,025 | |
| Loan to a third party | | | - | | | | 1,465,000 | |
| Other receivables | | | 3,312,433 | | | | 9,792,775 | |
| Deposit for closing of private placement | | | 731,491 | | | | — | |
| | | | | | | | | |
| | | $ | 6,969,569 | | | $ | 12,993,800 | |
Loan to a third party is unsecured, interest bearing at 5.31% per annum and repayable on June 8, 2010.
| 5. | AMOUNT DUE FROM EQUITY HOLDER |
Amount due from a equity holder consists of the following :
| | | As of March 31, 2010 | | | As of June 30, 2009 | |
| | | (Unaudited) | | | (Audited) | |
| | | | | | | |
| Amount due from a equity holder | | $ | - | | | $ | 1,465,000 | |
The amount due from an equity holder is unsecured, interest bearing at 3.93% per annum and has no fixed term of repayment.
Inventories consist of the following :
| | | As of | | | As of | |
| | | March 31, | | | June 30, | |
| | | 2010 | | | 2009 | |
| | | (Unaudited) | | | (Audited) | |
| | | | | | | |
| Raw materials | | $ | 393,475 | | | $ | 250,405 | |
| Finished goods | | | 577,189 | | | | 57,429 | |
| | | | | | | | | |
| Total inventories | | $ | 970,664 | | | $ | 307,834 | |
Intangible assets consist of the following:
| | | As of | | | As of | |
| | | March 31, | | | June 30, | |
| | | 2010 | | | 2009 | |
| | | (Unaudited) | | | (Audited) | |
| | | | | | | | | |
| Pharmaceuticals formulas, at cost | | $ | 17,273,007 | | | $ | 17,298,720 | |
| 8. | PROPERTY, PLANT AND EQUIPMENT, NET |
The following is a summary of property, plant and equipment:
| | | As of March 31, 2010 | | | As of June 30, 2009 | |
| | | (Unaudited) | | | (Audited) | |
| Cost | | | | | | |
| Leasehold land and buildings | | $ | 7,598,806 | | | $ | 7,447,211 | |
| Plant and equipment | | | 1,235,146 | | | | 1,156,557 | |
| Office equipment | | | 77,597 | | | | 74,700 | |
| Motor vehicles | | | 412,954 | | | | 389,075 | |
| | | | | | | | | |
| Total | | | 9,324,503 | | | | 9,067,543 | |
| | | | | | | | | |
| Accumulated depreciation | | | | | | | | |
| Leasehold land and buildings | | | 553,961 | | | | 414,133 | |
| Plant and equipment | | | 671,032 | | | | 617,279 | |
| Office equipment | | | 20,660 | | | | 10,681 | |
| Motor vehicles | | | 132,635 | | | | 112,768 | |
| | | | | | | | | |
| Total | | | 1,378,287 | | | | 1,154,861 | |
| | | | | | | | | |
| Construction in progress | | | - | | | | 236,597 | |
| | | | | | | | | |
| Net | | | | | | | | |
| Leasehold land and buildings | | | 7,044,845 | | | | 7,033,078 | |
| Plant and equipment | | | 564,114 | | | | 539,278 | |
| Office equipment | | | 56,936 | | | | 64,019 | |
| Motor vehicles | | | 280,320 | | | | 276,307 | |
| | | | | | | | | |
| Property, plant and equipment, net | | $ | 7,946,215 | | | $ | 8,149,279 | |
Depreciation expenses for the three months and nine months ended March 31, 2010 were $224,656 and $84,518 respectively.
As of March 31, 2010 and June 30, 2009, Bohai had pledged plant and machinery having a carrying amount of $552,710 and $562,331 to secure a bank loan to Bohai.
Bohai obtained several short-term loan facilities from financial institution in the PRC. Short-term borrowings as of March 31, 2010 consist of the following :
Loan from financial institution | | Loan period | | Annual Interest rate | | | Secured by | | Amount (unaudited) | |
| China Construction Bank | | From Feb 24, 2010 to Feb 23, 2011 | | 5.8410% | | | Personal guarantee by equity holder | | $ | 3,510,773 | |
| Rural Credit Union | | From Sep 28, 2009 to Sep 26, 2010 | | 5.7525% | | | Yantai Ka Wah Medical Equipment Co. Ltd | | | 285,990 | |
| Yantai Laishan Rural Credit Union | | From Sep 28, 2009 to Sep 26, 2010 | | 7.5225% | | | Bohai’s machinery and vehicle | | | 584,390 | |
| Total | | | | | | | | | | $ | 4,381,153 | |
Short-term borrowings as of June 30, 2009 consist of the following:
Loan from financial institution | | Loan period | | Annual Interest rate | | | Secured by | | Amount (Audited) | |
| Shanghai Pudong Development Limited | | From Dec 12, 2008 to Dec 11, 2009 | | 6.6960% | | | Haiyang Construction Industry Training Centre and personal guarantee by equity holders | | $ | 2,197,500 | |
| Yantai City Commercial Bank | | From Jan 20, 2009 to Jan 20, 2010 | | 6.9030% | | | Yantai Hai Pu Can End Making Co. Ltd | | $ | 1,318,500 | |
| Yantai Laishan Rural Credit Union | | From Sep 27, 2008 to Sep 26, 2009 | | 9.3600% | | | Yantai Ka Wah Medical Equipment Co. Ltd | | $ | 293,000 | |
| Yantai Laishan Rural Credit Union | | From Sep 27, 2008 to Sep 26, 2009 | | 12.2400% | | | Company’s machinery and vehicle | | $ | 586,000 | |
| China Construction Bank | | From May 12, 2009 to Nov 11, 2009 | | 0.0000% | | | Personal guarantee by equity holders | | $ | 1,465,000 | |
| Total | | | | | | | | | | $ | 5,860,000 | |
In June 2009, the Company issued four promissory notes for an aggregate of $400,000. The funds had been raised previously on the Company’s behalf by counsel in a private placement and held in trust accounts. Funds were expended from the trusts for professional fees and due diligence related to an ongoing search for suitable business opportunities, anticipating merger. In June 2009, the Company assumed responsibility for the fees and due diligence costs. On January 5, 2010, the notes converted pursuant to their terms into shares of Common Stock as a result of the share exchange transaction.
| 11. | OTHER ACCRUED LIABILITIES |
Other accrued liabilities consist of the following :
| | | As of | | | As of | |
| | | March 31, | | | June 30, | |
| | | 2010 | | | 2009 | |
| | | (Unaudited) | | | (Audited) | |
| | | | | | | |
| Accrued selling expenses | | $ | 579,545 | | | $ | 1,677,026 | |
| Accrued staff costs | | | 212,198 | | | | 173,130 | |
| Value added tax payable | | | 716,822 | | | | 709,688 | |
| Other accrued expenses | | | 206,865 | | | | 77,374 | |
| Others payable | | | 225,658 | | | | 9,702,137 | |
| | | | | | | | |
| | | $ | 1,941,088 | | | $ | 12,339,355 | |
| 12. | CONVERTIBLE PROMISSORY NOTES AND WARRANTS |
On January 5, 2010, the Company issued 6,000,000 units of senior convertible promissory notes (the “Notes”) in aggregated amount of principal amount of $12,000,000 to accredited investors (the “Holders”). The Notes provide that the Company shall pay the Holders the aggregate sum of $12,000,000 in lawful money of the United States of America, with interest payable thereon at the rate of 8% per annum. The principal amount of the Notes and all accrued but unpaid interest thereon shall be paid in full to the Holder on the 2 year anniversary of the Closing Date (January 5, 2012) (the “Maturity Date”).
Each Holder of the Notes shall have the right, exercisable any time prior to the Maturity Date, to convert all, but not less than all, of the principal amount then outstanding, plus all accrued but unpaid interest thereon, into shares of Common Stock (the “Note Shares”) at an initial conversion price (subject to adjustment) equal to $2.00 per share.
On the Closing Date, each Holder also received a Common Stock purchase warrant (each a “Warrant”, and, collectively, the “Warrants), to purchase one (1) share (collectively, the “Warrant Shares”) of Common Stock at an exercise price of $2.40 per share (subject to adjustment as at forth in the Warrants) at any time and form time to time on or original issue date and through and including the expiration time, January 5, 2012. In addition, the placement agents for the Company’s January 5, 2010 offering of Notes (or their affiliates) received warrants (the “Placement Agent Warrants”) to purchase an aggregate of 600,000 shares of Common Stock, which warrants are substantially identical to the Warrants issued to the Holders, except that such warrants may not be exercised until June 5, 2010.
As of March 31, 2010, the Common Stock has not been listed on an exchange, there has been very limited trading of the Common Stock, and the Note Shares, Warrant Shares and shares of Common Stock underlying the Placement Agent Warrants have not been registered for public resale. There is low probability that the Holders or the holders of the Placement Agent Warrants would convert their Notes or exercise their Warrants or Placement Agent Warrants, as applicable, prior to such registration being declared effective.
| 13. | SELLING, GENERAL AND ADMINISTRATIVE EXPENSES |
Selling, general and administrative expenses consist of the following:
| | | Three months ended March 31, 2010 | | | Three months ended March 31, 2009 | | | Nine months ended March 31, 2010 | | | Nine months ended March 31, 2009 | |
| | | (Unaudited) | | | (Unaudited) | | | (Unaudited) | | | (Unaudited) | |
| Accommodation | | $ | 1,106,984 | | | $ | 565,205 | | | $ | 2,880,151 | | | $ | 2,724,140 | |
| Advertising and promotion | | | 2,767,549 | | | | 2,251,404 | | | | 8,732,252 | | | | 5,834,757 | |
| Commission | | | 1,060,462 | | | | 1,503,000 | | | | 3,464,415 | | | | 4,726,934 | |
| Conference | | | 738,898 | | | | 3,106 | | | | 3,070,497 | | | | 10,159 | |
| Depreciation | | | 9,397 | | | | 118 | | | | 27,872 | | | | 353 | |
| Staff costs | | | 608,263 | | | | 566,413 | | | | 1,571,400 | | | | 1,256,934 | |
| Travelling | | | 717,766 | | | | 1,132,551 | | | | 2,000,775 | | | | 1,933,017 | |
| Research and development cost | | | 146,640 | | | | 147,972 | | | | 442,046 | | | | 38,492 | |
| Other operating expenses | | | 2,309,630 | | | | 1,500,361 | | | | 6,282,061 | | | | 5,150,493 | |
| | | | | | | | | | | | | | | | | |
| | | $ | 9,465,589 | | | $ | 7,670,130 | | | $ | 28,471,469 | | | $ | 21,675,279 | |
| | | Three months ended March 31, 2010 | | | Three months ended March 31, 2009 | | | Nine months ended March 31, 2010 | | | Nine months ended March 31, 2009 | |
| | | (Unaudited) | | | (Unaudited) | | | (Unaudited) | | | (Unaudited) | |
| | | | | | | | | | | | | |
| Interest on short-term borrowings wholly repayable within 1 year | | | 33,907 | | | | 59,921 | | | | 190,217 | | | | 168,422 | |
| | | | | | | | | | | | | | | | | |
| Interest on convertible promissory notes | | | 226,667 | | | | - | | | | 226,667 | | | | - | |
| | | | | | | | | | | | | | | | | |
| | | $ | 260,574 | | | $ | 59,921 | | | $ | 416,883 | | | $ | 168,422 | |
| 15. | FINANCE AND NON-OPERATING EXPENSE |
| | | Three months ended March 31, 2010 | | | Three months ended March 31, 2009 | | | Nine months ended March 31, 2010 | | | Nine months ended March 31, 2009 | |
| | | (Unaudited) | | | (Unaudited) | | | (Unaudited) | | | (Unaudited) | |
| | | | | | | | | | | | | |
| Cost of private placement occurred on January 5, 2010 | | | 1,287,901 | | | | - | | | | 1,287,901 | | | | - | |
| | | | | | | | | | | | | | | | | |
| Non-operating expense | | | 1 | | | | 4,618 | | | | 22,093 | | | | 4,682 | |
| | | | | | | | | | | | | | | | | |
| | | $ | 1,287,902 | | | $ | 4,618 | | | $ | 1,309,994 | | | $ | 4,682 | |
PRC Tax
The PRC’s legislative body, the National People’s Congress, adopted the unified Enterprise Income Tax (“EIT”) Law on March 16, 2007. This new tax law replaces the existing separate income tax laws for domestic enterprises and foreign-invested enterprises and became effective on January 1, 2008. Under the new tax law, a unified income tax rate is set at 25% for both domestic enterprises and foreign-invested enterprises. However, there will be a transition period for enterprises, whether foreign-invested or domestic, that are currently receiving preferential tax treatments granted by relevant tax authorities. Enterprises that are subject to an enterprise income tax rate lower than 25% may continue to enjoy the lower rate and will transit into the new rate over a five year period beginning on the effective date of the EIT Law. Enterprises that are currently entitled to exemptions for a fixed term may continue to enjoy such treatment until the exemption term expires. Preferential tax treatments may continue to be granted to industries and projects that qualify for such preferential treatments under the new law.
| | | Three months ended March 31, 2010 | | | Three months ended March 31, 2009 | | | Nine months ended March 31, 2010 | | | Nine months ended March 31, 2009 | |
| | | (Unaudited) | | | (Unaudited) | | | (Unaudited) | | | (Unaudited) | |
| | | | | | | | | | | | | |
| Income before tax | | $ | 1,468,428 | | | $ | 2,528,404 | | | $ | 7,687,259 | | | $ | 7,437,908 | |
| | | | | | | | | | | | | | | | | |
| Income tax expense | | $ | 585,135 | | | $ | 423,569 | | | $ | 2,193,931 | | | $ | 1,224,833 | |
United States Tax
The Company is subject to income tax in the United States. No provision for income tax in the United States has been made as the Company had no taxable income for the three months and nine months ended March 31, 2010. The statutory tax rate is 34%.
A reconciliation of the effective income tax rate to the US federal rate is as follows:
| | | March 31, 2010 | | | June 30, 2009 | |
| | | | | | | |
| United States Tax at statutory rate | | $ | 2,609,135 | | | $ | 2,528,889 | |
| Foreign tax rate difference | | | (415,204 | ) | | | (1,384,301 | ) |
| Exemption in taxation | | | (2,193,931 | ) | | | (1,144,588 | ) |
| | | | | | | | | |
| | | $ | - | | | $ | - | |
Certain of the Group’s revenue (including sales revenue) are subject to output VAT generally calculated at 6%, 7%, 13% and 17% of the selling price. Input credit relating to input VAT paid on purchase can be used to offset the output VAT.
The net amount of VAT expense for the 9 months ended are shown as follows:
| | | March 31, 2010 | | | March 31, 2009 | |
| | | | | | | |
| Net value added tax expense | | $ | 6,627,557 | | | $ | 5,274,607 | |
| 17. | COMMITMENTS AND CONTINGENCIES |
There are no foreseeable material commitments or contingencies as of March 31, 2010 and June 30, 2009.
| Common stock | | | | | | | | | | | | |
| | | | | | Common stock | | | | |
| | | Note | | | Shares | | | Value ($) | | | Amount($) | |
| | | | | | | | | | | | | |
| As of June 30, 2009 | | | | | | 3,450,000 | | | | 0.001 | | | | 3,450.00 | |
| | | | | | | | | | | | | | | | |
| Issued to shareholders of Change High Limited under Share Exchange Agreement date January 5, 2010 | | a | | | | 13,162,500 | | | | 0.001 | | | | 13,162.50 | |
| | | | | | | | | | | | | | | | |
| Cancellation of shares | | a | | | | (1,500,000 | ) | | | 0.001 | | | | (1,500.00 | ) |
| Issue of common stock | | b | | | | 1,137,500 | | | | 0.001 | | | | 1,137.50 | |
| | | | | | | | | | | | | | | | |
| As of March 31, 2010 | | | | | | 16,250,000 | | | | | | | | 16,250.00 | |
| (a) | On the Closing Date, pursuant to the terms of the Share Exchange Agreement date January 5, 2010, the Company acquired all of the outstanding equity securities (the “Chance High Shares”) of Chance High from the Chance High Shareholders, and the Chance High Shareholders transferred and contributed all of their Chance High Shares to the Company. In exchange, the Company issued to Chance High Shareholders an aggregate of 13,162,500 newly issued shares of common stock, par value $0.001 per share (the “Common Stock”). In addition, pursuant to the terms of the Share Exchange Agreement, Anthony Zaradic, the former President and Chief Executive Officer of the Company, cancelled a total of 1,500,000 shares of Common Stock. |
| (b) | Issued 687,500 shares to Cawston Enterprises Limited and 450,000 shares to Regeneration Capital Group, LLC and its affiliates as consulting services fees rendered to the Company. |
As of March 31, 2010, the Company has 150,000,000 shares of common stock authorized and 16,250,000 shares of common stock issued and outstanding.
Additional paid-in capital
| | | As of March 31, 2010 | | | As of June 30, 2009 | |
| | | (Unaudited) | | | (Audited) | |
| | | | | | | |
| Additional paid-in capital | | $ | 3,378,203 | | | $ | 2,974,520 | |
According to the laws and regulations in the PRC, Bohai is required to provide for certain statutory funds, namely, reserve fund by an appropriation from net profit after taxes but before dividend distribution based on the local statutory financial statements of the PRC company prepared in accordance with the accounting principles and relevant financial regulations.
Bohai in PRC is required to allocate at least 10% of its net profit to the reserve fund until the balance of such fund has reached 50% of its registered capital. Appropriation of enterprise expansion fund are determined at the discretion of it directors.
The reserve fund can only be used, upon approval by the relevant authority, to offset accumulated losses or increase capital. The enterprise expansion fund can only be used to increase capital upon approval by the relevant authority.
The potential credit risk of the company is mainly attributable to its debtors and bank balances. In respect of debtors, the Group has policies in place to ensure that it will only accept customers from countries which are politically stable and customers with an appropriate credit history. In addition, all the bank balances were made with financial institutions with high-credit quality. Thus, the Group is not considered to be subject to significant credit risk.
The Group’s interest rate risk is primarily attributable to its short-term borrowings, loan to a third party and loan to equity holders. The Group’s borrowings carry interest at fixed rate. The management has not used any interest rate swaps to hedge its exposure to interest rate risk.
All of the carrying amounts of the Group’s financial assets and liabilities of short term maturities approximate their fair values.
Item 2. Management’s Discussion and Analysis of Financial Conditions of Operations.
The following discussion and analysis of financial condition and results of operations relates to the operations and financial condition reported in the unaudited condensed consolidated financial statements of the Company for the three months ended March 31, 2010 and 2009, and should be read in conjunction with such financial statements and related notes included in this report. Those statements in the following discussion that are not historical in nature should be considered to be forward looking statements that are inherently uncertain. Actual results and the timing of the events may differ materially from those contained in these forward looking statements due to a number of factors, including those discussed in the “Cautionary Note on Forward Looking Statements” set forth elsewhere in this Report.
Overview
We were incorporated under the laws of the State of Nevada on January 9, 2008. Since January 5, 2010, our business consists of the production, manufacturing and distribution of herbal pharmaceuticals in the People’s Republic of China (“China” or “the PRC”) which are based on traditional Chinese medicine. We are based in the city of Yantai, Shandong Province, China.
Our medicines are intended to address rheumatoid arthritis, viral infections, gynecological diseases, cardio vascular issues and respiratory diseases. We have obtained Drug Approval Numbers in China for 29 varieties of traditional Chinese herbal medicines in 2004 and we currently produces 10 varieties of approved traditional Chinese herbal medicines in seven delivery systems: tablets, granules, capsules, syrup, concentrated powder, tincture and medicinal wine. Of these 10 products, 4 are prescription drugs and 6 are over-the-counter products.
Prior to January 5, 2010, we were a public “shell” company operating under the name “Link Resources, Inc.” On January 5, 2010, we consummated a share exchange transaction (the “Share Exchange”) pursuant to which we acquired the parent company of Yantai Bohai Pharmaceuticals Group Co. Ltd., our principal operating subsidiary, which is a Chinese variable interest entity that we (through a Chinese wholly-owned foreign enterprise subsidiary) control through certain contractual arrangements.
Our post-Share Exchange organization structure is summarized below:
Use of estimates
In preparing financial statements in conformity with accounting principles generally accepted in the United States of America, management makes estimates and assumptions that affect the reported amounts of assets liabilities and disclosures of contingent assets and liabilities at the dates of the financial statements, as well as the reported amounts of revenues and expenses during the reporting periods. These accounts and estimates include, but are not limited to, the valuation of accounts receivable, inventories, deferred income taxes and the estimation of useful lives of property, plant and equipment. Actual results could differ from those estimates.
Accounts Receivable
Accounts receivable consists of amounts due from customers. We extend unsecured credit to our customers in the ordinary course of business but mitigate the associated risks by performing credit checks and actively pursuing past due accounts. An allowance for doubtful accounts is established and determined based on management’s assessment of known requirements, aging of receivables, payment history, the customer’s current credit worthiness and the economic environment.
Revenue recognition
Revenue represents the invoiced value of goods sold recognized upon the delivery of goods to customers. Revenue is recognized when all of the following criteria are met:
| | · | Persuasive evidence of an arrangement exists; |
| | | Delivery has occurred or services have been rendered; |
| | | The seller’s price to the buyer is fixed or determinable; and |
| | | Collectability is reasonably assured. Payments have been established. |
Inventories
Inventories are valued at the lower of cost or market with cost is determined on the weighted average method. Finished goods inventories consist of raw materials, direct labor and overhead associated with the manufacturing process. In assessing the ultimate realization of inventories, management makes judgments as to future demand requirements compared to current or committed inventory levels. Our reserve requirements generally increase or decrease due to management’s projected demand requirements, market conditions and product life cycle changes. As of March 31, 2010 and June 30, 2009, we did not make any allowance for slow-moving or defective inventories.
Property, plant and equipment
Property, plant and equipment, other than construction in progress, are stated at cost, less depreciation and amortization and accumulated impairment loss. Cost represents the purchase price of the asset and other costs incurred to bring the asset into its existing use. Maintenance, repairs and betterments, including replacement of minor items, are charged to expense; major additions to physical properties are capitalized.
Depreciation of property, plant and equipment is calculated to written off the cost, less their estimated residual value, if any, using the straight-line method over their estimated useful lives. The principal annual rates are as follows:
| Leasehold land and buildings | 30 to 40 years |
| Motor vehicles | 10 years |
| Plant and machinery | 10 years |
| Office equipment | 5 years |
Upon sale or disposition, the applicable amounts of asset cost and accumulated depreciation are removed from the accounts and the net amount less proceeds from disposal is charged or credited to income.
Construction in progress mainly represents expenditures in respect of our corporate campus and machinery under construction, which campus was completed, and at which production began, in 2009. Assets under construction are not depreciated until the construction is completed and the assets are ready for their intended use.
Income Taxes
Income taxes are accounted for under the asset and liability method. Deferred tax assets and liabilities are recognized for the future tax consequences attributable to differences between the financial statement carrying amounts of existing assets and liabilities and their respective tax bases and operating loss and tax credit carry-forwards. Deferred tax assets are reduced by a valuation allowance to the extent management concludes it is more likely than not that the assets will not be realized. Deferred tax assets and liabilities are measured using enacted tax rates expected to apply to taxable income in the years in which those temporary differences are expected to be recovered or settled. The effect on deferred tax assets and liabilities of a change in tax rates is recognized in the statements of income and comprehensive income in the periods that includes the enactment date.
Operating Results
Three Months Ended March 31, 2010 Compared to Three Months Ended March 31, 2009
| | | Three Months Ended December 31, | |
| | | 2010 | | | 2009 | |
| | | | | | | |
| Sales | | $ | 15,323,878 | | | $ | 12,476,400 | |
| | | | | | | | | |
| Less: Sales Tax | | | (231,870 | ) | | | (200,622 | ) |
| | | | | | | | | |
| Net sales | | | 15,092,008 | | | | 12,275,778 | |
| | | | | | | | | |
| Cost of sales | | | (2,609,515 | ) | | | (2,019,864 | ) |
| | | | | | | | | |
| Gross profit | | | 12,482,493 | | | | 10,255,914 | |
| | | | | | | | | |
| Selling, general and administrative expenses | | | (9,465,589 | ) | | | (7,670,130 | ) |
| | | | | | | | | |
| Interest expenses | | | (260,574 | ) | | | (52,921 | ) |
| | | | | | | | | |
| Operating income | | | 2,756,330 | | | | 2,532,863 | |
| | | | | | | | | |
| Other income | | | - | | | | 158 | |
| | | | | | | | | |
| Finance and non-operating costs | | | (1,287,902 | ) | | | (4,618 | ) |
| | | | | | | | | |
| Income before taxes | | | 1,468,428 | | | | 2,528,403 | |
| | | | | | | | | |
| Income taxes | | | (585,135 | ) | | | (423,569 | ) |
| | | | | | | | | |
| Net income | | | 883,293 | | | | 2,104,834 | |
Sales
Net Sales for the three months ended March 31, 2010 increase by approximately $2,816,230 or (22.94%) to $15,092,008 as compared to $12,275,778 for the three months ended March 31, 2009. This increase was primarily due to the significant increase of our revenue on all the products as a result of the effective implementation of marketing strategy in the calendar year ended March 31, 2010.
Cost of Sales
Our cost of sales for the three months ended March 31, 2010 was $ 2,609,515 as compared to $2,019,864 for the three months ended March 31, 2009, representing and decrease of 29.19 %. The decrease was mainly attributable to the increase in cost of raw material by $265,960 as a result of the increase of sales.
Gross Profit
We achieved gross profit of $12,482,493 for the three months ended March 31, 2010, compared to $10,255,914 for the same quarter of the previous year, representing a 21.71 % quarter to quarter decrease. Our overall gross profit margin as a percentage of revenue are 82.71% and 83.30% for the three months ended March 31, 2010 and 2009, respectively.
Selling, General and Administrative Expenses
Our operating expenses, consisting of selling, general and administrative expenses, increased by approximately $1,795,459, to $9,465,589, for the three months ended March 31, 2010, from $7,670,130 for the same quarter of the previous year. This increase is mainly attributable to increase of advertising expense, which was reduced in amounting to $669,802 during the period.
Interest Expense
Interest expense was $260,574 for the three months ended March 31, 2010, compared to $52,921 for the three months ended March 31, 2009. The increase represents accrued interest from issue of convertible promissory notes during the period. The loans were used for working capital and capital expenditures for the expansion of production through acquisition of plants and machinery to improve the efficiency of the production lines.
Income Tax
Our provisions for income taxes for the three months ended March 31, 2010 and 2009 were $585,135 and $423,569, respectively, an decrease of $161,566 or 38.14% from period to period. The increase in tax provision was due to significant decrease of income before tax during the period.
Net Income
We had a net income of $883,293 for the three months ended March 31, 2010, as compared to net income of $2,104,835 for the three months ended March 31, 2009. The decrease in net income is primarily attributable to a significant increase of finance cost in amount to $1,287,902 that was incurred in connection with our private placement and share exchange transactions that occurred in the quarter ended March 31, 2010.
Foreign Currency Translation Gains
During the three months ended March 31, 2010, the RMB relatively stable against the U.S. dollar, and we recognized a foreign currency translation gain of $24,191.
Nine Months Ended March 31, 2010 Compared to the Nine Months Ended March 31, 2009
The following table sets forth our statement of operations for the period indicated:
| | | Nine Months Ended March 31, | |
| | | 2010 | | | 2009 | |
| | | | | | | |
| Sales | | $ | 46,072,455 | | | $ | 35,883,215 | |
| | | | | | | | | |
| Less: Sales Tax | | | (729,975 | ) | | | (580,207 | ) |
| | | | | | | | | |
| Net sales | | | 45,342,480 | | | | 35,253,008 | |
| | | | | | | | | |
| Cost of sales | | | (7,475,740 | ) | | | (5,966,876 | ) |
| | | | | | | | | |
| Gross profit | | | 37,866,740 | | | | 29,286,132 | |
| | | | | | | | | |
| Selling, general and administrative expenses | | | (28,471,469 | ) | | | (21,675,279 | ) |
| | | | | | | | | |
| Interest expenses | | | (416,882 | ) | | | (168,422 | ) |
| | | | | | | | | |
| Operating income | | | 8,978,389 | | | | 7,442,431 | |
| | | | | | | | | |
| Non-operating income | | | 18,864 | | | | 158 | |
| | | | | | | | | |
| Finance and non-operating costs | | | (1,309,994 | ) | | | (4,682 | ) |
| | | | | | | | | |
| Income before taxes | | | 7,687,259 | | | | 7,437,907 | |
| | | | | | | | | |
| Income taxes | | | (2,193,931 | ) | | | (1,224,883 | ) |
| | | | | | | | | |
| Net income | | | 5,493,328 | | | $ | 6,213,074 | |
Sales
Net sales for the nine months ended March 31, 2010 was $45,342,480, an increase of approximately $10,089,472, or 28.6%, from $35,253,008 in the nine months ended March 31, 2009. This increase was primarily due to the significant increase of our revenue on all the products as a result of the effective implementation of marketing strategy in the calendar year ended March 31, 2010.
Cost of Sales
Our cost of sales for the nine months ended March 31, 2010 was $7,475,740 as compared to $5,966,876 for the nine months ended March 31, 2009, representing an increase of $1,508,864, or 25.28%. The increase was mainly attributable to the increase of raw materials cost by $1,343,246 as a result of the increase of sales.
Gross Profit
For the nine months ended March 31, 2010 as compared to the nine months ended March 31, 2009, we generated gross profit of $37,866,740 and $29,286,132, respectively, reflecting an increase of approximately $8,580,608, or 29.30%. The increase in our gross profit was mainly due to significantly increase of sales income.
Selling, General and Administrative Expenses
We incurred general and administrative expenses of $28,471,469 for the nine months ended March 31, 2010, representing an increase of $6,796,190, or 31.35%, compared to $21,675,279 for the nine months ended March 31, 2009. This increase was mainly due to the increase of cost of advertising and percentages of commissions to sales representative allocated in our branch offices throughout China.
Interest Expense
Interest expense was $416,882 for the nine months ended March 31, 2010, compared to $168,422 for the nine months ended March 31, 2009. The increase is largely due to proceeds of convertible promissory notes during the period. The loans were used for working capital and capital expenditures for the expansion of production through acquisition of production plants and equipment to improve the efficiency of production.
Income Tax
For the nine months ended March 31, 2010, income tax expense was $2,193,931, increase of $969,098, or 79.12%, from $1,224,833 for the nine months ended March 31, 2009. The increase was mainly due to income before tax increase during the period.
Net Income
We had net income of $5,493,328, or 12.11% of net revenue, for the nine months ended March 31, 2010, as compared to net income $6,213,074, or 17.62% of net revenue, for the nine months ended March 31, 2009, representing a decrease of $719,746, or 11.58 %. The decrease in our net income was due mainly as a result of the financing costs of 1,287,901 incurred in connection with our private placement and share exchange transactions that occurred in the quarter ended March 31, 2010.
Foreign Currency Translation Gains
During the fiscal period ended March 31, 2010, the RMB steadily rose against the U.S. dollar, and we recognized a foreign currency translation gain of $34,692.
Liquidity and Capital Resources
We have historically funded our operation primarily through paid-in capital, sales of goods and short term loans from financial institutions in China. Net cash used in operating activities for the three months ended March 31, 2010 was $2,711,889 compared to cash provided by $2,503,932 for the three months ended March 31, 2009. During the three months ended March 31, 2010, net cash used from operating activities by $2,711,889, and cash borrowed from bank and investors amounted to $4,381,153 and 12,000,000 respectively and repayment of borrowing from previous period amounted to $4,381,153 which resulted in a net cash inflow $7,915,403. The Company may seek to raise additional capital through sales of common stock, as well as seeking financing from third parties.
Operating activities
For the three months ended March 31, 2010, cash used in operating activities totaled $2,711,889 compared to cash provided by operating activities of $2,503,932 for the three months ended March 31, 2009. This was primarily attributable to cash used in prepayment for other payable during the three month ended March 31, 2010.
Investing activities
For the three months ended March 31, 2010, net cash outflow for investing activities was approximately $84,518 compared to cash provided by investing activities of $191,977 in the three months ended March 31, 2009. This increase was primarily attributable to purchase of property plant and equipment during the period.
Financing activities
Financing activities provided net cash inflow of $10,711,810 during the three months ended March 31, 2010 primarily as a result of issue of convertible promissory notes during the period. As of March 31, 2010, the proceeds from short-term borrowings and convertible promissory notes amounted to $4,393,665 and $12,000,000 respectively, the repayment of borrowings amounted to $4,381,153, which resulted in a net cash outflow by financing activities of $10,711,810.
Off-Balance Sheet Arrangements
We did not engage in any “off-balance sheet arrangements” (as that term is defined in Item 303(a)(4)(ii) of Regulation S-K) during the three months ended March 31, 2010. We have not entered into any financial guarantees or other commitments to guarantee the payment obligations of any third parties. We have not entered into any derivative contracts that are indexed to our shares and classified as stockholder’s equity or that are not reflected in our condensed consolidated financial statements. Furthermore, we do not have any retained or contingent interest in assets transferred to an unconsolidated entity that serves as credit, liquidity or market risk support to such entity. We do not have any variable interest in any unconsolidated entity that provides financing, liquidity, market risk, or credit support to us or engages in leasing, hedging, or research and development services with us.
Inflation
In recent years, the Chinese economy has experienced periods of rapid expansion and high rates of inflation. During the past ten years, the rate of inflation in China has been as high as 20.7% and as low as -2.2%. These factors have led to the adoption by Chinese government, from time to time, of various corrective measures designed to restrict the availability of credit or regulate growth and contain inflation. While inflation has been more moderate since 1995, high inflation may in the future cause Chinese government to impose controls on credit and/or prices, or to take other action, which could inhibit economic activity in China, and thereby harm the market for our products.
| Item 3. | Quantitative and Qualitative Disclosures about Market Risk |
Not applicable
| Item 4T. | Controls and Procedures |
Evaluation of Disclosure Controls and Procedures
As of the end of the period covered by this Quarterly Report, the Company’s sole executive officer (the “Certifying Officer”), conducted evaluations of the Company’s disclosure controls and procedures. As defined under Sections 13a–15(e) and 15d–15(e) of the Securities Exchange Act of 1934, as amended (the “Exchange Act”), the term “disclosure controls and procedures” means controls and other procedures of an issuer that are designed to ensure that information required to be disclosed by the issuer in the reports that it files or submits under the Exchange Act is recorded, processed, summarized and reported, within the time periods specified in the SEC’s rules and forms. Disclosure controls and procedures include without limitation, controls and procedures designed to ensure that information required to be disclosed by an issuer in the reports that it files or submits under the Exchange Act is accumulated and communicated to the issuer’s management, including the Certifying Officers, to allow timely decisions regarding required disclosures.
Based on this evaluation, the Certifying Officer has concluded that the Company’s disclosure controls and procedures were effective to ensure that material information is recorded, processed, summarized and reported by management of the Company on a timely basis in order to comply with the Company’s disclosure obligations under the Exchange Act and the rules and regulations promulgated thereunder.
Changes in Internal Control over Financial Reporting
Further, there were no changes in the Company’s internal control over financial reporting during the Company’s fiscal quarter December 31, 2009 that materially affected, or are reasonably likely to materially affect, the Company’s internal control over financial reporting.
Limitations on the Effectiveness of Internal Controls
Readers are cautioned that our management does not expect that our disclosure controls and procedures or our internal control over financial reporting will necessarily prevent all fraud and material error. An internal control system, no matter how well conceived and operated, can provide only reasonable, not absolute, assurance that the objectives of the control system are met. Because of the inherent limitations in all control systems, no evaluation of controls can provide absolute assurance that all control issues and instances of fraud, if any, within the Company have been detected. The design of any system of controls also is based in part upon certain assumptions about the likelihood of future events, and there can be no assurance that any control design will succeed in achieving its stated goals under all potential future conditions. Over time, control may become inadequate because of changes in conditions, or the degree of compliance with the policies or procedures may deteriorate.
PART II - OTHER INFORMATION
Exhibit Number | | Description of Exhibit |
| | | |
| 31.1 | | Certification of Principal Executive Officer and Principal Financial Officer pursuant to Rule 13a-14 and Rule 15d-14(a), promulgated under the Securities and Exchange Act of 1934, as amended. |
| | | |
| 32.1 | | Certification pursuant to 18 U.S.C. Section 1350, as adopted pursuant to Section 906 of the Sarbanes-Oxley Act of 2002 (Chief Executive Officer and Acting Chief Financial Officer). |
SIGNATURES
Pursuant to the requirements of the Securities Exchange Act of 1934, the registrant has duly caused this report to be signed on its behalf by the undersigned thereunto duly authorized.
| | Bohai Pharmaceuticals Group, Inc. |
| | | |
| Dated: May 17, 2010 | By: | /s/ Hongwei Qu |
| | | Name: Hongwei Qu Title: Chief Executive Officer, President, Interim Chief Financial Officer, Secretary and Treasurer (Principal Executive Officer and Principal Financial and Accounting Officer) |