
Fiscal Year 2018, First Quarter AUGUST 7, 2017 EARNINGS CALL PRESENTATION

HORACIO ROZANSKI PRESIDENT AND CHIEF EXECUTIVE OFFICER LLOYD HOWELL CHIEF FINANCIAL OFFICER AND TREASURER CURT RIGGLE VICE PRESIDENT INVESTOR RELATIONS 1 CALL PARTICIPANTS
DISCLAIMER 2 Forward Looking Safe Harbor Statement Certain statements contained in this presentation and in related comments by our management include “forward‐looking statements” within the meaning of the Private Securities Litigation Reform Act of 1995. Examples of forward‐looking statements include information concerning Booz Allen’s preliminary financial results, financial outlook and guidance, including forecasted revenue, Diluted EPS, and Adjusted Diluted EPS, future quarterly dividends, and future improvements in operating margins, as well as any other statement that does not directly relate to any historical or current fact. In some cases, you can identify forward‐looking statements by terminology such as “may,” “will,” “could,” “should,” “forecasts,” “expects,” “intends,” “plans,” “anticipates,” “projects,” “outlook,” “believes,” “estimates,” “predicts,” “potential,” “continue,” “preliminary,” or the negative of these terms or other comparable terminology. Although we believe that the expectations reflected in the forward‐looking statements are reasonable, we can give you no assurance these expectations will prove to have been correct. These forward‐looking statements relate to future events or our future financial performance and involve known and unknown risks, uncertainties and other factors that may cause our actual results, levels of activity, performance or achievements to differ materially from any future results, levels of activity, performance or achievements expressed or implied by these forward‐looking statements. A number of important factors could cause actual results to differ materially from those contained in or implied by these forward‐looking statements, including those factors discussed in our filings with the Securities and Exchange Commission (SEC), including our Annual Report on Form 10‐K for the fiscal year ended March 31, 2017, which can be found at the SEC’s website at www.sec.gov. All forward‐looking statements attributable to us or persons acting on our behalf are expressly qualified in their entirety by the foregoing cautionary statements. All such statements speak only as of the date made and, except as required by law, we undertake no obligation to update or revise publicly any forward‐looking statements, whether as a result of new information, future events or otherwise. Note Regarding Non‐GAAP Financial Data Information Booz Allen discloses in the following information Revenue, Excluding Billable Expenses, Adjusted Operating Income, Adjusted EBITDA, Adjusted EBITDA Margin, Adjusted Net Income, Adjusted Diluted EPS, and Free Cash Flow which are not recognized measurements under GAAP, and when analyzing Booz Allen’s performance or liquidity as applicable, investors (i) evaluate each adjustment in our reconciliation of revenue to Revenue Excluding Billable Expenses, operating income to Adjusted Operating Income, net income to Adjusted EBITDA, Adjusted EBITDA Margin, Adjusted Net Income and Adjusted Diluted Earnings Per Share, and net cash provided by operating activities to Free Cash Flow, and the explanatory footnotes regarding those adjustments, each as defined under GAAP, (ii) use Revenue, Excluding Billable Expenses, Adjusted Operating Income, Adjusted EBITDA, Adjusted EBITDA Margin, Adjusted Net Income, and Adjusted Diluted EPS in addition to, and not as an alternative to revenue, operating income, net income or diluted EPS as measures of operating results, and (iii) use Free Cash Flow in addition to and not as an alternative to net cash provided by operating activities as a measure of liquidity, each as defined under GAAP. The Financial Appendix includes a reconciliation of Revenue, Excluding Billable Expenses, Adjusted Operating Income, Adjusted EBITDA, Adjusted EBITDA Margin, Adjusted Net Income, Adjusted Diluted EPS, and Free Cash Flow to the most directly comparable financial measure calculated and presented in accordance with GAAP. Booz Allen presents these supplemental performance measures because it believes that these measures provide investors and securities analysts with important supplemental information with which to evaluate Booz Allen’s performance, long term earnings potential, or liquidity, as applicable and to enable them to assess Booz Allen’s performance on the same basis as management. These supplemental performance and liquidity measurements may vary from and may not be comparable to similarly titled measures by other companies in Booz Allen’s industry. With respect to our expectations under “Fiscal 2018 Full Year Outlook,” reconciliation of Adjusted Diluted EPS guidance to the closest corresponding GAAP measure is not available without unreasonable efforts on a forward‐looking basis due to our inability to predict our stock price, equity grants and dividend declarations during the course of fiscal 2018. Projecting future stock price, equity grants and dividends to be declared would be necessary to accurately calculate the difference between Adjusted Diluted EPS and GAAP EPS as a result of the effects of the two‐class method and related possible dilution used in the calculation of EPS. Consequently, any attempt to disclose such reconciliation would imply a degree of precision that could be confusing or misleading to investors. We expect the variability of the above charges to have an unpredictable, and potentially significant, impact on our future GAAP financial results.

FINANCIAL HIGHLIGHTS Q1 FY18 KEY PERFORMANCE INDICATORS • Accelerating growth in Revenue, Excluding Billable Expenses compared to prior year’s quarter • Record Backlog, reflecting growth of 17.1% compared to prior year’s quarter • Strongest Q1 Book‐to‐Bill since our IPO • Demand‐driven headcount growth and improved labor productivity STRATEGIC GROWTH INDICATORS AND OUTLOOK • On track to maintain our position as the industry growth leader (1) • New award activity and pipeline growth across our portfolio • Defense and Intelligence business is becoming a significant engine for growth • Federal civil business continues to expand beyond a strong trailing 2‐year growth trend • Increased client demand in areas where we’ve invested in advanced capabilities and talent including digital solutions, cyber, analytics and engineering 3 (1) Industry consists of CACI, CSRA, Engility Holdings, Leidos, ManTech, and Science Applications International Corp.
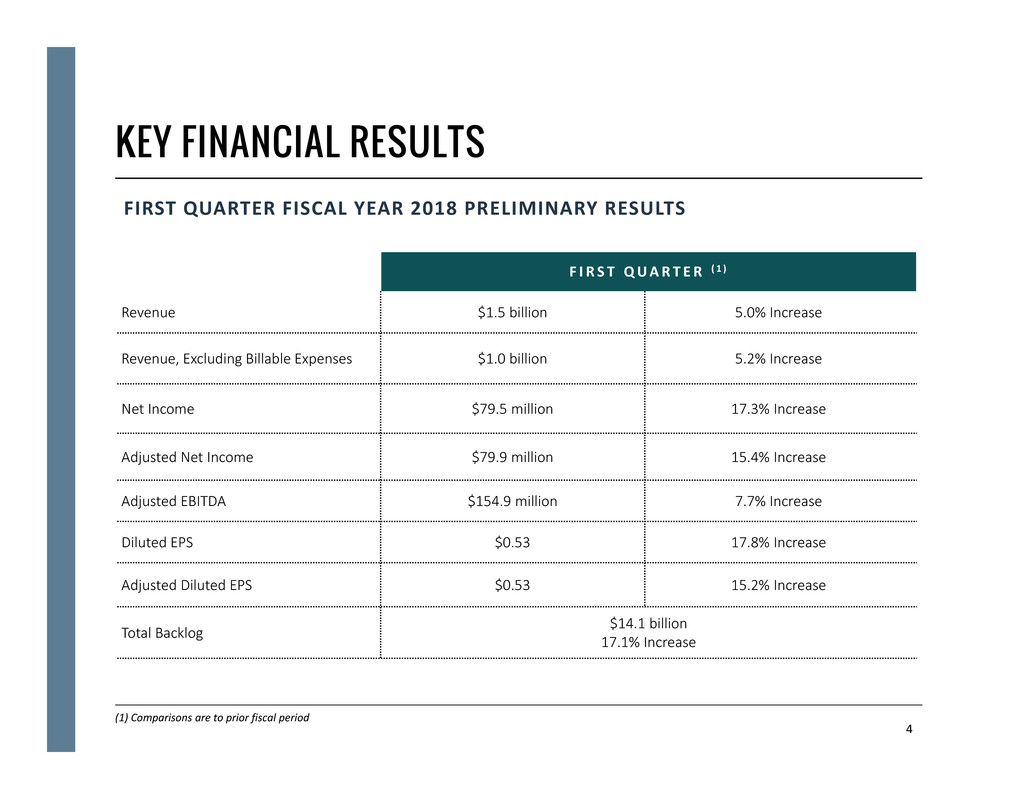
KEY FINANCIAL RESULTS FIRST QUARTER FISCAL YEAR 2018 PRELIMINARY RESULTS 4 F I R S T QUART E R ( 1 ) Revenue $1.5 billion 5.0% Increase Revenue, Excluding Billable Expenses $1.0 billion 5.2% Increase Net Income $79.5 million 17.3% Increase Adjusted Net Income $79.9 million 15.4% Increase Adjusted EBITDA $154.9 million 7.7% Increase Diluted EPS $0.53 17.8% Increase Adjusted Diluted EPS $0.53 15.2% Increase Total Backlog $14.1 billion 17.1% Increase (1) Comparisons are to prior fiscal period
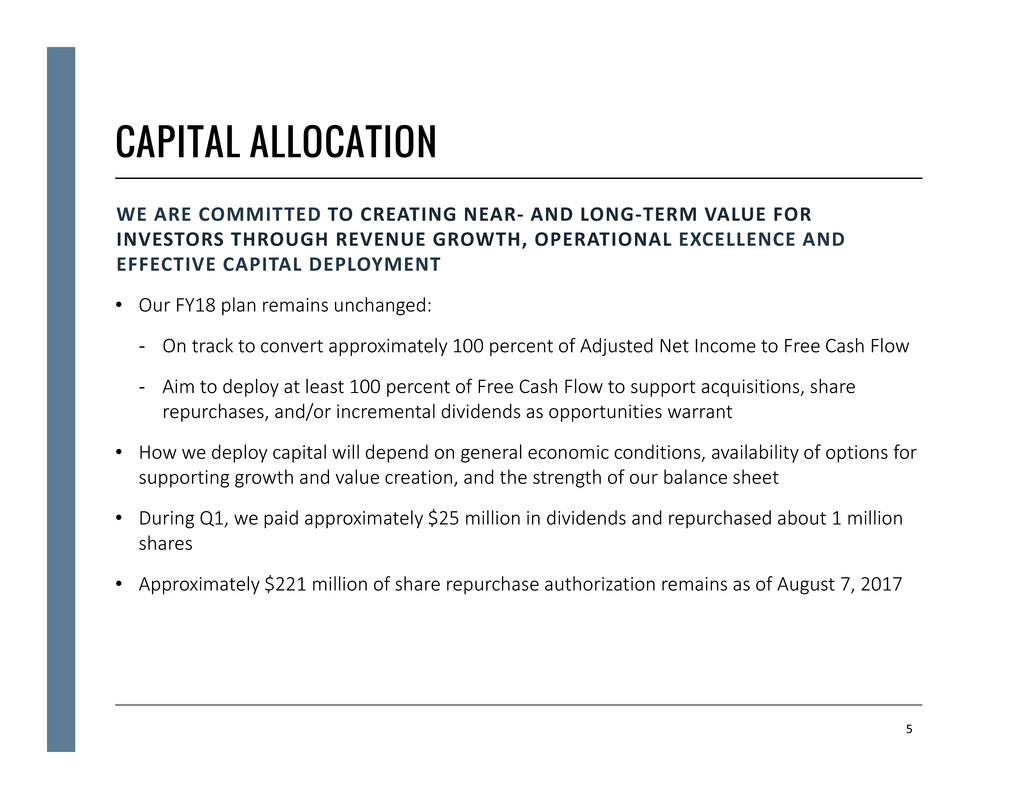
CAPITAL ALLOCATION 5 WE ARE COMMITTED TO CREATING NEAR‐ AND LONG‐TERM VALUE FOR INVESTORS THROUGH REVENUE GROWTH, OPERATIONAL EXCELLENCE AND EFFECTIVE CAPITAL DEPLOYMENT • Our FY18 plan remains unchanged: ‐ On track to convert approximately 100 percent of Adjusted Net Income to Free Cash Flow ‐ Aim to deploy at least 100 percent of Free Cash Flow to support acquisitions, share repurchases, and/or incremental dividends as opportunities warrant • How we deploy capital will depend on general economic conditions, availability of options for supporting growth and value creation, and the strength of our balance sheet • During Q1, we paid approximately $25 million in dividends and repurchased about 1 million shares • Approximately $221 million of share repurchase authorization remains as of August 7, 2017

FINANCIAL OUTLOOK We increased the top and bottom end of our Diluted EPS and Adjusted Diluted EPS guidance range by $0.04 to reflect the adoption of a new accounting standard, ASU 2016‐09, which changed the accounting for certain aspects of employee equity awards and resulted in an income tax benefit of $6.9 million. 1) Full Fiscal Year 2018 Estimated Weighted Average Diluted Share Count of 149.5 million shares, which excludes the impact of any potential FY18 share repurchase activities 2) Assumes an effective tax rate in the range of 37% to 38% 3) FY18 guidance does not reflect any costs we will incur in this period in connection with the previously disclosed US Department of Justice investigation. At this stage of the investigation, the Company is not able to reasonably estimate such costs. 6 F I SCAL 2018 FUL L YEAR OUTLOOK ( 3 ) Revenue Growth in the Range of Four to Seven Percent Diluted EPS (1)(2) $1.80 ‐ $1.90 Adjusted Diluted EPS (1)(2) $1.83 ‐ $1.93
APPENDIX 7

NON-GAAP FINANCIAL INFORMATION • “Revenue, Excluding Billable Expenses" represents revenue less billable expenses. We use Revenue, Excluding Billable Expenses because it provides management useful information about the company's operating performance by excluding the impact of costs that are not indicative of the level of productivity of our consulting staff headcount and our overall direct labor, which management believes provides useful information to our investors about our core operations. • "Adjusted Operating Income" represents operating income before adjustments related to the amortization of intangible assets resulting from the acquisition of our Company by the Carlyle Group. We prepare Adjusted Operating Income to eliminate the impact of items we do not consider indicative of ongoing operating performance due to their inherent unusual, extraordinary, or non‐recurring nature or because they result from an event of a similar nature. • "Adjusted EBITDA” represents net income before income taxes, net interest and other expense and depreciation and amortization. “Adjusted EBITDA Margin” is calculated as Adjusted EBITDA divided by revenue. Booz Allen prepares Adjusted EBITDA and Adjusted EBITDA Margin to eliminate the impact of items it does not consider indicative of ongoing operating performance due to their inherent unusual, extraordinary or non‐recurring nature or because they result from an event of a similar nature. • "Adjusted Net Income" represents net income before: (i) adjustments related to the amortization of intangible assets resulting from the acquisition of our Company by the Carlyle Group, and (ii) amortization or write‐off of debt issuance costs and write‐off of original issue discount, in each case net of the tax effect where appropriate calculated using an assumed effective tax rate. We prepare Adjusted Net Income to eliminate the impact of items, net of tax, we do not consider indicative of ongoing operating performance due to their inherent unusual, extraordinary, or non‐recurring nature or because they result from an event of a similar nature. • "Adjusted Diluted EPS" represents diluted EPS calculated using Adjusted Net Income as opposed to net income. Additionally, Adjusted Diluted EPS does not contemplate any adjustments to net income as required under the two‐class method as disclosed in the footnotes to the financial statements. • "Free Cash Flow" represents the net cash generated from operating activities less the impact of purchases of property and equipment. 8
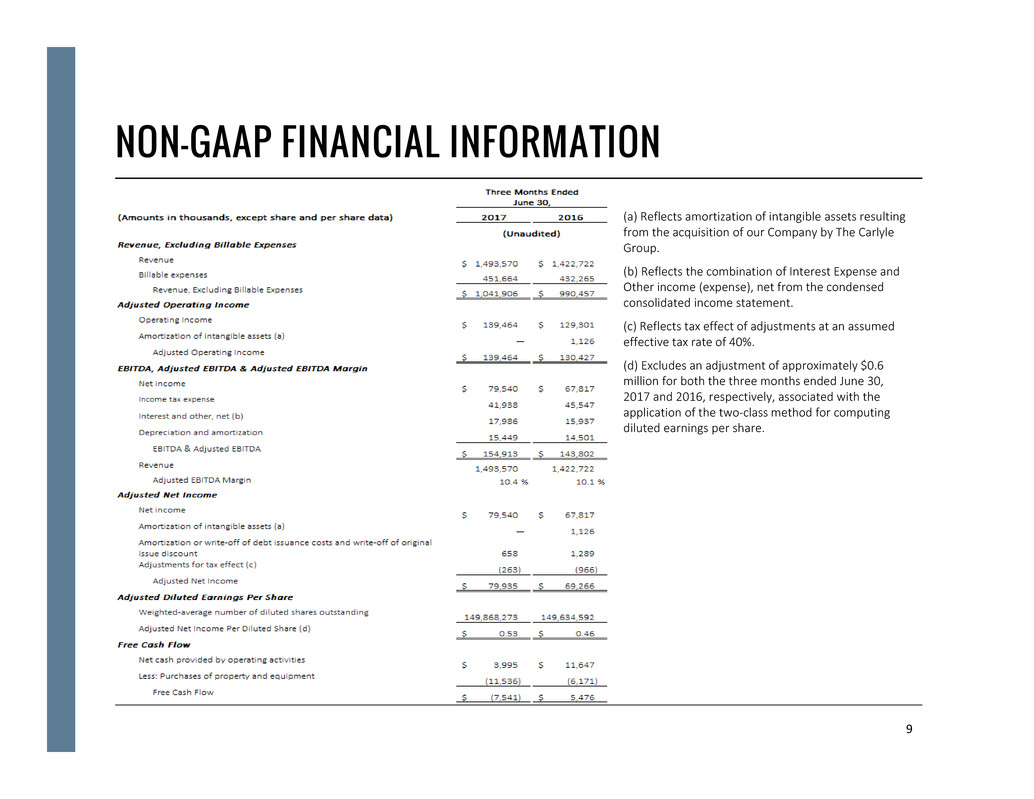
NON-GAAP FINANCIAL INFORMATION 9 (a) Reflects amortization of intangible assets resulting from the acquisition of our Company by The Carlyle Group. (b) Reflects the combination of Interest Expense and Other income (expense), net from the condensed consolidated income statement. (c) Reflects tax effect of adjustments at an assumed effective tax rate of 40%. (d) Excludes an adjustment of approximately $0.6 million for both the three months ended June 30, 2017 and 2016, respectively, associated with the application of the two‐class method for computing diluted earnings per share.
FINANCIAL RESULTS – KEY DRIVERS First Quarter 2018 – Below is a summary of Booz Allen’s results for the fiscal 2018 first quarter and the key factors driving those results as compared to the first quarter of fiscal 2017: • Revenue increased by 5.0% to $1.49 billion. This increase was driven primarily by continued strength in client demand, which led to increased staff headcount and direct client staff labor productivity over the prior year period, partially offset by a decrease in spending as compared to the prior year period. Growth in revenue was also due to an increase in billable expenses over the prior year period. • Revenue, Excluding Billable Expenses increased 5.2% to $1.04 billion primarily as a result of the increased client demand, which led to increased staff headcount and direct client staff labor productivity. Consulting staff headcount increased by over 830 professionals as compared to the prior year period. • Operating Income and Adjusted Operating Income increased 7.9% and 6.9%, respectively, to $139.5 million primarily driven by revenue growth and reduced spending as compared to the prior year period. • Net income increased 17.3% to $79.5 million. Adjusted Net Income increased 15.4% to $79.9 million. These increases were primarily driven by the same factors as Operating Income and Adjusted Operating Income, as well as a decrease in our income tax expense due to the adoption of a new accounting standard, ASU 2016‐09, that resulted in an additional income tax benefit of $6.9 million during the three months ended June 30, 2017. • EBITDA and Adjusted EBITDA increased 7.7% to $154.9 million due to the same factors as Operating Income and Adjusted Operating Income, respectively. • Diluted EPS increased to $0.53 from $0.45 in the prior year period, and Adjusted Diluted EPS increased to $0.53 from $0.46 in the prior year period. The increases were primarily driven by the same factors as Net Income and Adjusted Net Income. • Net cash provided by operating activities was $4.0 million as compared to $11.6 million in the prior year period. The decline in cash from operations was primarily the result of a $13.6 million one‐time tax payment as a condition of our recent acquisition of eGov Holdings, Inc., and an increase in accounts receivable, which is the result of revenue growth and the timing to convert such revenue to billings and collections, as well as administrative delays in client collections. Free Cash Flow declined $13.0 million from the prior year period due to the same factors affecting cash provided by operations, as well as an increase of $5.4 million in capital expenditures due to the timing of leasehold improvements to update existing office space. • As of June 30, 2017, total backlog was $14.1 billion, an increase of 17.1 percent compared to June 30, 2016 as a result of unfunded awards and priced options across all elements of our business. 10


