
Fiscal Year 2023, Third Quarter January 27, 2023 EARNINGS CALL PRESENTATION

2 HORACIO ROZANSKI President and Chief Executive Officer MATT CALDERONE Chief Financial Officer NATHAN RUTLEDGE Director & Head of Investor Relations CALL PARTICIPANTS
3 DISCLAIMER Forward Looking Safe Harbor Statement Certain statements contained in this presentation and in related comments by our management include “forward-looking statements” within the meaning of the Private Securities Litigation Reform Act of 1995. Examples of forward-looking statements include information concerning Booz Allen’s preliminary financial results, financial outlook and guidance, including forecasted revenue, Adjusted EBITDA, Diluted EPS, Adjusted Diluted EPS, future quarterly dividends, and future improvements in operating margins, as well as any other statement that does not directly relate to any historical or current fact. In some cases, you can identify forward-looking statements by terminology such as “may,” “will,” “could,” “should,” “forecasts,” “expects,” “intends,” “plans,” “anticipates,” “projects,” “outlook,” “believes,” “estimates,” “predicts,” “potential,” “continue,” “preliminary,” or the negative of these terms or other comparable terminology. Although we believe that the expectations reflected in the forward-looking statements are reasonable, we can give you no assurance these expectations will prove to have been correct. These forward-looking statements relate to future events or our future financial performance and involve known and unknown risks, uncertainties and other factors that may cause our actual results, levels of activity, performance or achievements to differ materially from any future results, levels of activity, performance or achievements expressed or implied by these forward-looking statements. A number of important factors could cause actual results to differ materially from those contained in or implied by these forward-looking statements, including those factors discussed in our filings with the Securities and Exchange Commission (SEC), including our Annual Report on Form 10-K for the fiscal year ended March 31, 2022, which can be found at the SEC’s website at www.sec.gov. All forward-looking statements attributable to us or persons acting on our behalf are expressly qualified in their entirety by the foregoing cautionary statements. All such statements speak only as of the date made and, except as required by law, we undertake no obligation to update or revise publicly any forward- looking statements, whether as a result of new information, future events or otherwise. Note Regarding Non-GAAP Financial Data Information Booz Allen discloses Revenue, Excluding Billable Expenses, Adjusted Operating Income, Adjusted EBITDA, Adjusted EBITDA Margin on Revenue, Adjusted EBITDA Margin on Revenue, Excluding Billable Expenses, Adjusted Net Income, Adjusted Diluted EPS, Free Cash Flow, Free Cash Flow Conversion, and Net Leverage Ratio, which are not recognized measurements under accounting principles generally accepted in the United States, or GAAP, and when analyzing Booz Allen’s performance or liquidity as applicable, investors should (i) evaluate each adjustment in our reconciliation of revenue to Revenue, Excluding Billable Expenses, operating income to Adjusted Operating Income, net income attributable to common stockholders to Adjusted EBITDA, Adjusted EBITDA Margin on Revenue, Adjusted EBITDA Margin on Revenue, Excluding Billable Expenses, Adjusted Net Income and Adjusted Diluted EPS, and net cash used in operating activities to Free Cash Flow and Free Cash Flow Conversion, and net debt to Net Leverage Ratio and the explanatory footnotes regarding those adjustments, each as defined under GAAP, (ii) use Revenue, Excluding Billable Expenses, Adjusted Operating Income, Adjusted EBITDA, Adjusted EBITDA Margin on Revenue, Adjusted EBITDA Margin on Revenue Excluding Billable Expenses, Adjusted Net Income, and Adjusted Diluted EPS in addition to, and not as an alternative to, revenue, operating income, net income attributable to common stockholders or diluted EPS as measures of operating results, each as defined under GAAP, (iii) use Free Cash Flow, Free Cash Flow Conversion, and Net Leverage Ratio, in addition to, and not as an alternative to, net cash used in operating activities as a measure of liquidity, each as defined under GAAP, and (iv) use Net Leverage Ratio in addition to, and not as an alternative to, net debt as a measure of Booz Allen's debt leverage. The Appendix includes a reconciliation of Revenue, Excluding Billable Expenses, Adjusted Operating Income, Adjusted EBITDA, Adjusted EBITDA Margin on Revenue, Adjusted EBITDA Margin on Revenue, Excluding Billable Expenses, Adjusted Net Income, Adjusted Diluted EPS, Free Cash Flow, Free Cash Flow Conversion, and Net Leverage Ratio to the most directly comparable financial measure calculated and presented in accordance with GAAP. Booz Allen presents these supplemental performance measures because it believes that these measures provide investors and securities analysts with important supplemental information with which to evaluate Booz Allen’s performance, long term earnings potential, or liquidity, as applicable, and to enable them to assess Booz Allen’s performance on the same basis as management. These supplemental performance and liquidity measurements may vary from and may not be comparable to similarly titled measures by other companies in Booz Allen’s industry. With respect to our expectations under “Financial Outlook”, "Fiscal Year 2023 Operating Cash Bridge" and "Fiscal Year 2023 ADEPS Bridge," reconciliation of Adjusted Diluted EPS guidance, Adjusted EBITDA, and Adjusted EBITDA Margin on Revenue to the closest corresponding GAAP measure is not available without unreasonable efforts on a forward-looking basis due to our inability to predict our stock price, equity grants and dividend declarations with respect to Adjusted Diluted EPS, and our net income, net interest and other expenses with respect to Adjusted EBITDA and Adjusted EBITDA Margin on Revenue, during the course of fiscal 2023. With respect to Adjusted Diluted EPS guidance, projecting future stock price, equity grants and dividends to be declared would be necessary to accurately calculate the difference between Adjusted Diluted EPS and GAAP EPS as a result of the effects of the two-class method and related possible dilution used in the calculation of EPS. Consequently, any attempt to disclose such reconciliation would imply a degree of precision that could be confusing or misleading to investors. We expect the variability of the above charges to have an unpredictable, and potentially significant, impact on our future GAAP financial results. For the same reason, a reconciliation of Adjusted EBITDA and Adjusted EBITDA Margin on Revenue guidance for fiscal 2023 and 2025 and of Adjusted EBITDA guidance through fiscal 2025 to the closest corresponding GAAP measures are not available without unreasonable efforts on a forward-looking basis due to our inability to predict specific quantifications of the amounts that would be required to reconcile such measures. Accordingly, Booz Allen is relying on the exception provided by Item 10(e)(1)(i)(B) of Regulation S-K to exclude these reconciliations.

4 KEY FINANCIAL RESULTS THIRD QUARTER FISCAL YEAR 2023 RESULTS (1) Comparisons are to prior fiscal year period. (2) Reconciliations of Adjusted EBITDA and Adjusted EBITDA Margin on Revenue can be found on Slide 14. Net Income attributable to common stockholders was $31.0 million and $340.2 million for the three and nine months ended December 31, 2022. Net income margin attributable to common stockholders was 1.4% and 5.0% for the three and nine months ended December 31, 2022. THIRD QUARTER (1) FISCAL YEAR-TO-DATE (12/31/22) (1) Revenue $2.3 billion +12.1% $6.8 billion +11.4% Revenue, Excluding Billable Expenses $1.6 billion +11.2% $4.8 billion +10.4% Net Income $31 million (76.2)% $340 million (9.6)% Adjusted EBITDA2 $244 million +9.8% $783 million +7.2% Adjusted EBITDA Margin on Revenue2 10.7% (1.8)% 11.5% (3.4)% Adjusted Net Income $142 million +4.0% $471 million +4.0% Diluted EPS $0.23 (75.8)% $2.54 (8.0)% Adjusted Diluted EPS $1.07 +4.9% $3.55 +6.0% Net Cash Provided by Operating Activities $139 million +547.4% $366 million (24.0)%
5

6 KEY FINANCIAL RESULTS THIRD QUARTER FISCAL YEAR 2023 RESULTS (1) Comparisons are to prior fiscal year period. (2) Reconciliations of Adjusted EBITDA and Adjusted EBITDA margin on Revenue can be found on Slide 14. Net Income attributable to common stockholders was $31.0 million and $340.2 million for the three and nine months ended December 31, 2022. Net income margin attributable to common stockholders was 1.4% and 5.0% for the three and nine months ended December 31, 2022. THIRD QUARTER (1) FISCAL YEAR-TO-DATE (12/31/22) (1) Revenue $2.3 billion +12.1% $6.8 billion +11.4% Revenue, Excluding Billable Expenses $1.6 billion +11.2% $4.8 billion +10.4% Net Income $31 million (76.2)% $340 million (9.6)% Adjusted EBITDA2 $244 million +9.8% $783 million +7.2% Adjusted EBITDA Margin on Revenue2 10.7% (1.8)% 11.5% (3.4)% Adjusted Net Income $142 million +4.0% $471 million +4.0% Diluted EPS $0.23 (75.8)% $2.54 (8.0)% Adjusted Diluted EPS $1.07 +4.9% $3.55 +6.0% Net Cash Provided by Operating Activities $139 million +547.4% $366 million (24.0)% Page 4 intentionally repeated

7 $22.0 HISTORICAL BACKLOG & BOOK-TO-BILL (1) For more information on the components of backlog, and the differences between backlog and remaining performance obligations, please see the Company's Form 10-K for the fiscal year ended March 31, 2022; totals may not sum due to rounding. (2) Backlog presented includes backlog acquired in the Company's acquisition of EverWatch during the three months ended December 31, 2022. Backlog presented includes approximately $273 million from EverWatch as of December 31, 2022. BACKLOG ($ IN BILLIONS) (1)(2) BOOK-TO-BILL TRENDS $20.7 $23.0 $24.6 $23.3 $24.0 $26.8 $29.0 $27.8 $29.2 $28.6 $31.8 $30.0 $3.4 $3.4 $4.5 $3.6 $3.5 $3.5 $4.9 $4.0 $3.7 $4.0 $5.5 $4.5 $4.5 $4.7 $6.2 $6.0 $6.1 $9.0 $9.5 $9.4 $9.9 $10.0 $10.4 $10.1 $12.8 $14.8 $13.9 $13.7 $14.4 $14.3 $14.6 $14.3 $15.6 $14.6 $16.0 $15.4 Funded Unfunded Priced Options 4Q20 1Q21 2Q21 3Q21 4Q21 1Q22 2Q22 3Q22 4Q22 1Q23 2Q23 3Q23 0.38x 2.17x 1.77x 0.32x 1.38x 1.30x 2.03x 0.39x 1.66x 0.72x 2.40x 0.09x Quarterly Book-to-Bill LTM Book-to-Bill 4Q20 1Q21 2Q21 3Q21 4Q21 1Q22 2Q22 3Q22 4Q22 1Q23 2Q23 3Q23 0.0x 1.0x 2.0x 3.0x 4.0x

8 CAPITAL ALLOCATION DELIVERING STRONG CAPITAL RETURNS THROUGH EFFICIENT CAPITAL DEPLOYMENT STRATEGY – Our multi-year capital deployment plan is to follow a disciplined and opportunistic approach, subject to market conditions – In Q3 FY2023, we deployed approximately $510.2 million: – $57.3 million through quarterly dividends; – $10.8 million through share repurchases; and – $442.1 million through our acquisition of EverWatch. – The Board authorized a dividend of $0.47 per share payable on March 1, 2023 to stockholders of record on February 10, 2023 – Share repurchase authorization capacity is $965.2 million available as of December 31, 2022 – Our capital allocation priorities remain: operating needs, quarterly dividend, strategic M&A, share repurchases, and debt repayment HISTORICAL CAPITAL DEPLOYMENT ($ IN MILLIONS)(1)QUARTERLY CAPITAL DEPLOYMENT ($ IN MILLIONS)(1) $138.8 $180.9 $116.5 $86.9 $510.2 $49.8 $57.4 $58.9 $57.0 $57.3 $82.8 $119.6 $57.6 $29.9 $10.8 $6.2 $4.0 $— $— $442.1 Quarterly Dividends Share Repurchases M&A 3Q22 4Q22 1Q23 2Q23 3Q23 $364.2 $333.2 $571.3 $1,493.9 $894.5 $114.2 $146.6 $181.1 $209.1 $230.6 $250.0 $186.6 $318.1 $419.3 $217.8 $72.2 $865.5 $446.1 Quarterly Dividends Share Repurchases M&A FY19 FY20 FY21 FY22 LTM (3)(4) (1) Totals may not sum due to rounding. (2) Includes share repurchases transacted but not settled and paid. (3) Represents payments for strategic investments, net of cash acquired. (4) Total amount of capital deployed for fiscal 2022 does not include ~$2 million in applicable fees related to our acquisition of Tracepoint. (2) (3)(4) (2)
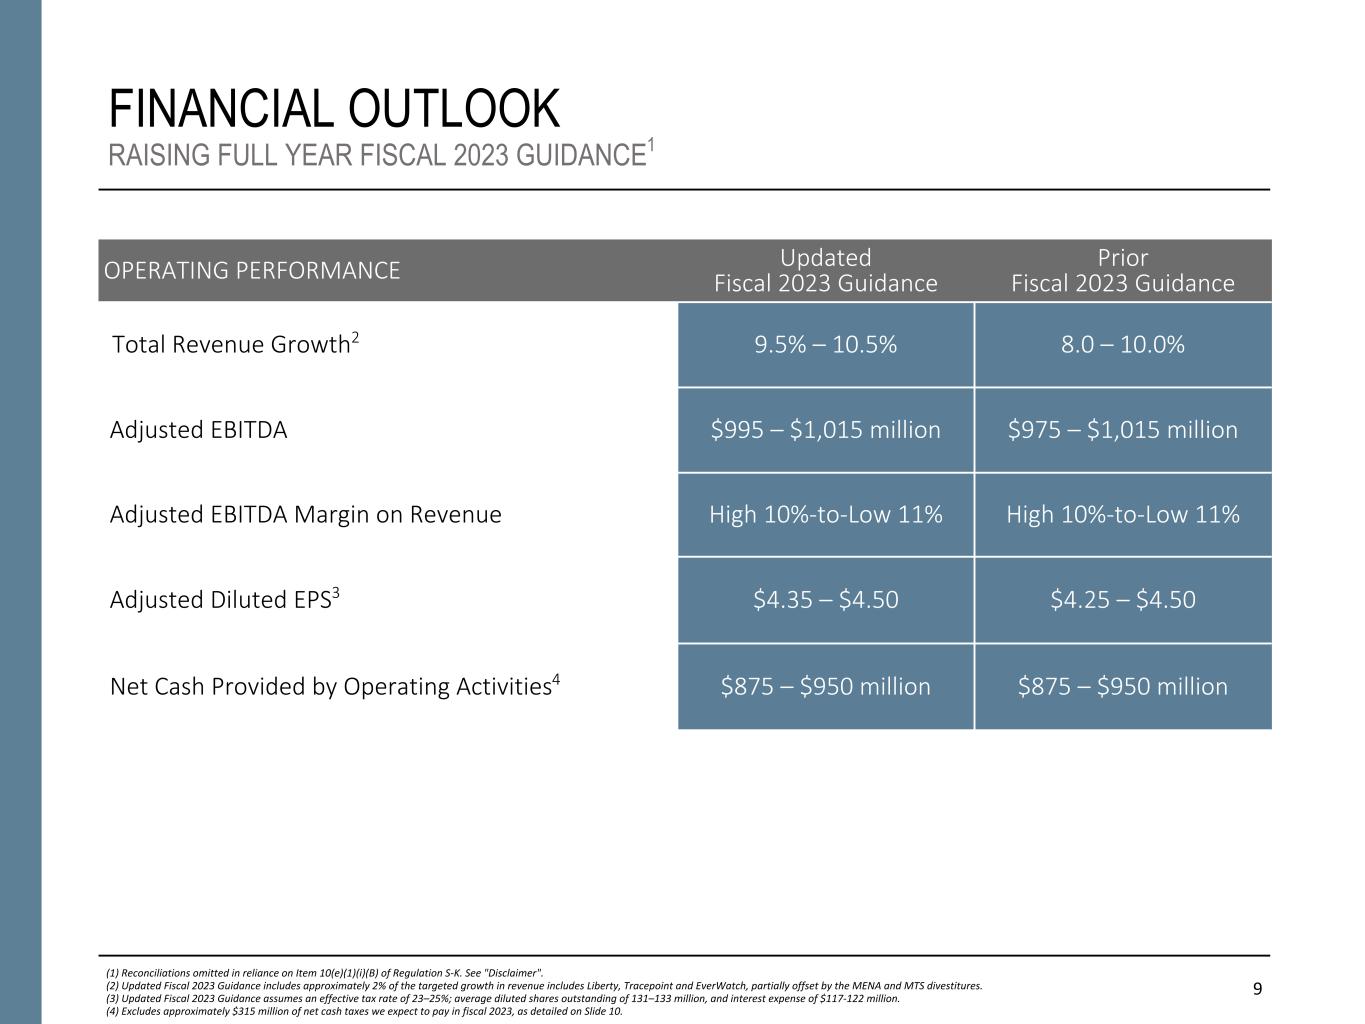
9 FINANCIAL OUTLOOK RAISING FULL YEAR FISCAL 2023 GUIDANCE1 OPERATING PERFORMANCE Updated Fiscal 2023 Guidance Prior Fiscal 2023 Guidance Total Revenue Growth2 9.5% – 10.5% 8.0 – 10.0% Adjusted EBITDA $995 – $1,015 million $975 – $1,015 million Adjusted EBITDA Margin on Revenue High 10%-to-Low 11% High 10%-to-Low 11% Adjusted Diluted EPS3 $4.35 – $4.50 $4.25 – $4.50 Net Cash Provided by Operating Activities4 $875 – $950 million $875 – $950 million (1) Reconciliations omitted in reliance on Item 10(e)(1)(i)(B) of Regulation S-K. See "Disclaimer". (2) Updated Fiscal 2023 Guidance includes approximately 2% of the targeted growth in revenue includes Liberty, Tracepoint and EverWatch, partially offset by the MENA and MTS divestitures. (3) Updated Fiscal 2023 Guidance assumes an effective tax rate of 23–25%; average diluted shares outstanding of 131–133 million, and interest expense of $117-122 million. (4) Excludes approximately $315 million of net cash taxes we expect to pay in fiscal 2023, as detailed on Slide 10.

10 FISCAL YEAR 2023 OPERATING CASH BRIDGE (1) Totals may not sum due to rounding. (2) Adding back fiscal year 2022 cash tax payments to show an equal comparison to fiscal year 2023 Operating Cash Flow before cash tax payments. (3) Reflects the expected impact of the midpoints of fiscal 2023 Adjusted EBITDA range of $995-1,015 million, interest expense range of $117-122 million, and effective tax rate range of 23-25 percent. (4) Guidance reflects (i) cash taxes associated with tax law changes and strategic planning of $175 million, offset by (ii) a partial tax refund of $175 million received in October 2022 associated with prior strategic tax planning initiatives. (5) Reflects the Company's refined estimate of cash to be paid in fiscal 2023 based upon current tax obligations relating to research and development expenditures. Operating Cash Bridge FY22 to FY23 Current Guidance1 Original Guidance1 FY22 Operating Cash $737 million $737 million FY22 Net Cash Paid for Income Taxes2 $(127) million $(127) million Adjusted EBITDA Growth3 ~$60 – $80 million ~$40 – $80 million Interest Expense3 ~$(26) million ~$(25) million Net Changes in Working Capital ~$(23) – $33 million ~$(4) – $31 million FY23 Operating Cash Excluding Net Cash to be Paid for Income Taxes $875 - $950 million $875 - $950 million Effective Tax Rate3 ~$(175) million ~$(175) million Tax Law Changes & Strategic Planning4 $— $— Section 1745 ~$(140) million ~$(140) million FY23 Operating Cash $560 - $635 million $560 - $635 million

11 FISCAL YEAR 2023 ADEPS BRIDGE ADEPS BRIDGE FROM FY22 TO FY23 Updated Guidance1 Original Guidance1 FY22 ADEPS $4.21 $4.21 Revenue Growth ~$0.51 – $0.56 ~$0.43 – $0.53 Adjusted EBITDA Margin ~$(0.15) – $(0.05) ~$(0.19) – $(0.05) FY23 Operational ADEPS $4.57 – $4.72 $4.45 – $4.70 Depreciation and Amortization2 ~$(0.03) ~$(0.03) Interest Expense3 ~$(0.15) ~$(0.14) Income Tax Expense4 ~$(0.06) ~$(0.06) Other Below-the-Line Items5 ~$0.02 ~$0.04 FY23 ADEPS $4.35 – $4.50 $4.25 – $4.50 (1) Totals may not sum due to rounding. (2) Reflects the incremental increase in depreciation and amortization related to investments in infrastructure and technology. (3) Reflects the midpoint of the fiscal 2023 estimated interest expense range as compared to fiscal 2022 results. (4) Reflects the midpoint of the fiscal 2023 estimated effective tax rate range as compared to fiscal 2022 results. (5) Reflects the estimated interest income and lower average diluted shares outstanding from fiscal 2022 to fiscal 2023.

12 APPENDIX

13 NON-GAAP FINANCIAL INFORMATION • "Revenue, Excluding Billable Expenses" represents revenue less billable expenses. We use Revenue, Excluding Billable Expenses because it provides management useful information about the Company's operating performance by excluding the impact of costs that are not indicative of the level of productivity of our client staff headcount and our overall direct labor, which management believes provides useful information to our investors about our core operations. • "Adjusted Operating Income" represents operating income before acquisition and divestiture costs, financing transaction costs, significant acquisition amortization, and the reserve associated with the U.S. Department of Justice investigation disclosed in Note 15 to the Condensed Consolidated Financial Statements in the Company's Form 10-Q for the period ended December 31, 2022. We prepare Adjusted Operating Income to eliminate the impact of items we do not consider indicative of ongoing operating performance due to their inherent unusual, extraordinary, or non-recurring nature or because they result from an event of a similar nature. • "Adjusted EBITDA" represents net income attributable to common stockholders before income taxes, net interest and other expense and depreciation and amortization and before certain other items, including acquisition and divestiture costs, financing transaction costs, and the reserve associated with the U.S. Department of Justice investigation disclosed in Note 15 to the Condensed Consolidated Financial Statements in the Company's Form 10-Q for the period ended December 31, 2022. “Adjusted EBITDA Margin on Revenue” is calculated as Adjusted EBITDA divided by revenue. Adjusted EBITDA Margin on Revenue, Excluding Billable Expenses is calculated as Adjusted EBITDA divided by Revenue, Excluding Billable Expenses. We prepare Adjusted EBITDA, Adjusted EBITDA Margin on Revenue, and Adjusted EBITDA Margin on Revenue, Excluding Billable Expenses to eliminate the impact of items we do not consider indicative of ongoing operating performance due to their inherent unusual, extraordinary or non-recurring nature or because they result from an event of a similar nature. • "Adjusted Net Income" represents net income attributable to common stockholders before: (i) acquisition and divestiture costs, (ii) financing transaction costs, (iii) significant acquisition amortization, (iv) the reserve associated with the U.S. Department of Justice investigation disclosed in Note 15 to the Condensed Consolidated Financial Statements in the Company's Form 10-Q for the period ended December 31, 2022, (v) gain associated with equity method investment activity, (vi) gain associated with divestitures or deconsolidation, and (vii) amortization and write-off of debt issuance costs and debt discount, in each case net of the tax effect where appropriate calculated using an assumed effective tax rate. We prepare Adjusted Net Income to eliminate the impact of items, net of tax, we do not consider indicative of ongoing operating performance due to their inherent unusual, extraordinary, or non-recurring nature or because they result from an event of a similar nature. We view Adjusted Net Income as an important indicator of performance consistent with the manner in which management measures and forecasts the Company's performance and the way in which management is incentivized to perform. • "Adjusted Diluted EPS" represents diluted EPS calculated using Adjusted Net Income as opposed to net income. Additionally, Adjusted Diluted EPS does not contemplate any adjustments to net income as required under the two-class method as disclosed in the footnotes to our consolidated financial statements in our Form 10-K for the fiscal year ended March 31, 2022. • "Free Cash Flow" represents the net cash generated from operating activities less the impact of purchases of property, equipment and software. "Free Cash Flow Conversion" is calculated as Free Cash Flow divided by Adjusted Net Income. • "Net Leverage Ratio" is calculated as net debt (total debt less cash) divided by Adjusted EBITDA over the prior twelve months.
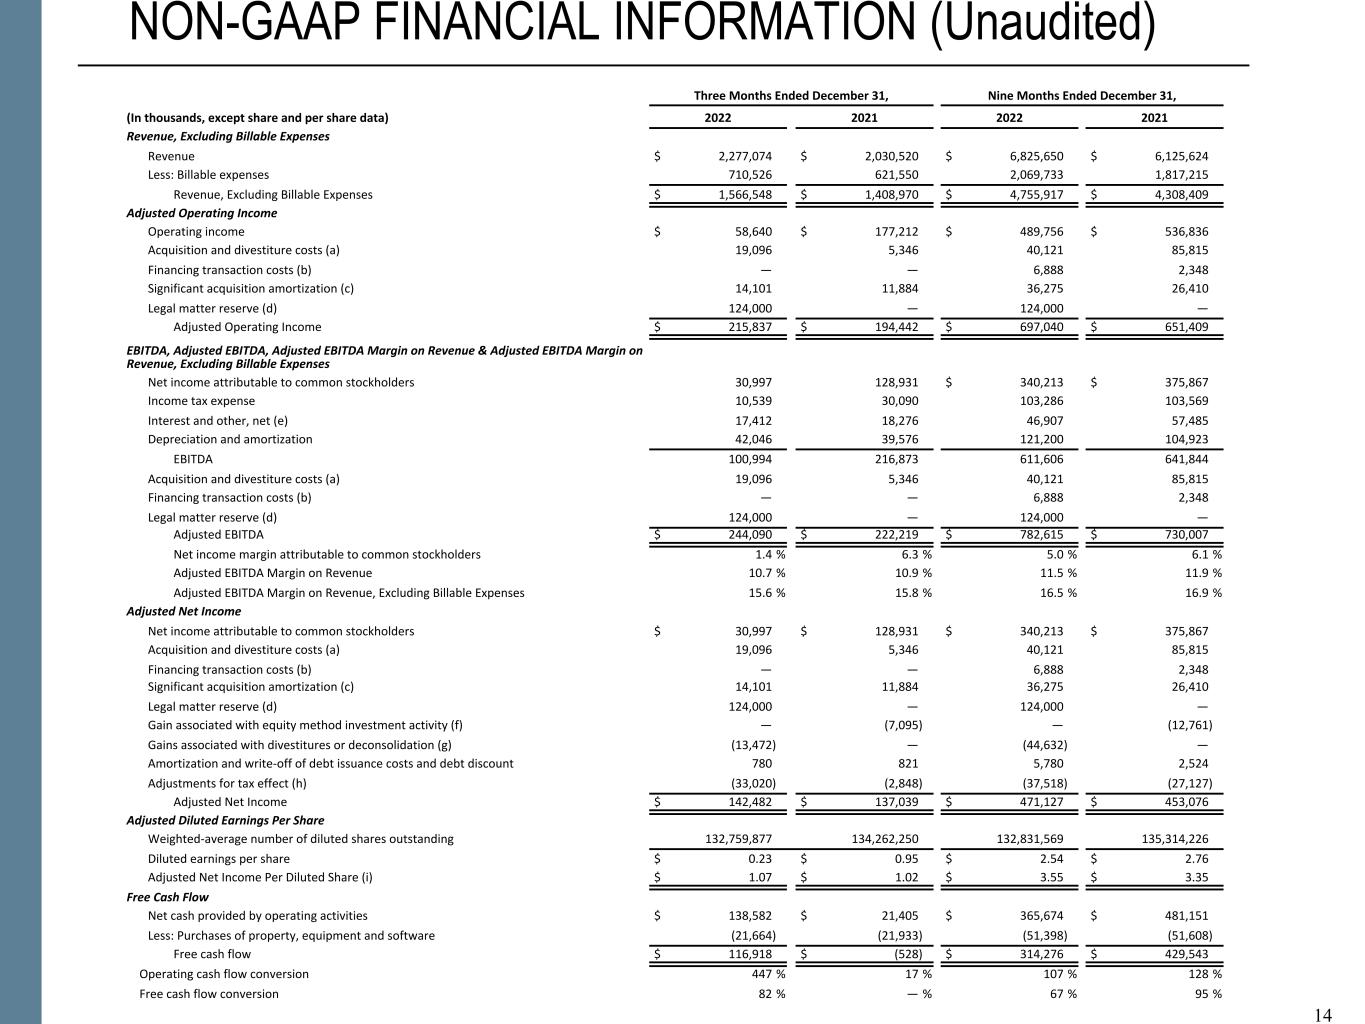
14 NON-GAAP FINANCIAL INFORMATION (Unaudited) Three Months Ended December 31, Nine Months Ended December 31, (In thousands, except share and per share data) 2022 2021 2022 2021 Revenue, Excluding Billable Expenses Revenue $ 2,277,074 $ 2,030,520 $ 6,825,650 $ 6,125,624 Less: Billable expenses 710,526 621,550 2,069,733 1,817,215 Revenue, Excluding Billable Expenses $ 1,566,548 $ 1,408,970 $ 4,755,917 $ 4,308,409 Adjusted Operating Income Operating income $ 58,640 $ 177,212 $ 489,756 $ 536,836 Acquisition and divestiture costs (a) 19,096 5,346 40,121 85,815 Financing transaction costs (b) — — 6,888 2,348 Significant acquisition amortization (c) 14,101 11,884 36,275 26,410 Legal matter reserve (d) 124,000 — 124,000 — Adjusted Operating Income $ 215,837 $ 194,442 $ 697,040 $ 651,409 EBITDA, Adjusted EBITDA, Adjusted EBITDA Margin on Revenue & Adjusted EBITDA Margin on Revenue, Excluding Billable Expenses Net income attributable to common stockholders 30,997 128,931 $ 340,213 $ 375,867 Income tax expense 10,539 30,090 103,286 103,569 Interest and other, net (e) 17,412 18,276 46,907 57,485 Depreciation and amortization 42,046 39,576 121,200 104,923 EBITDA 100,994 216,873 611,606 641,844 Acquisition and divestiture costs (a) 19,096 5,346 40,121 85,815 Financing transaction costs (b) — — 6,888 2,348 Legal matter reserve (d) 124,000 — 124,000 — Adjusted EBITDA $ 244,090 $ 222,219 $ 782,615 $ 730,007 Net income margin attributable to common stockholders 1.4 % 6.3 % 5.0 % 6.1 % Adjusted EBITDA Margin on Revenue 10.7 % 10.9 % 11.5 % 11.9 % Adjusted EBITDA Margin on Revenue, Excluding Billable Expenses 15.6 % 15.8 % 16.5 % 16.9 % Adjusted Net Income Net income attributable to common stockholders $ 30,997 $ 128,931 $ 340,213 $ 375,867 Acquisition and divestiture costs (a) 19,096 5,346 40,121 85,815 Financing transaction costs (b) — — 6,888 2,348 Significant acquisition amortization (c) 14,101 11,884 36,275 26,410 Legal matter reserve (d) 124,000 — 124,000 — Gain associated with equity method investment activity (f) — (7,095) — (12,761) Gains associated with divestitures or deconsolidation (g) (13,472) — (44,632) — Amortization and write-off of debt issuance costs and debt discount 780 821 5,780 2,524 Adjustments for tax effect (h) (33,020) (2,848) (37,518) (27,127) Adjusted Net Income $ 142,482 $ 137,039 $ 471,127 $ 453,076 Adjusted Diluted Earnings Per Share Weighted-average number of diluted shares outstanding 132,759,877 134,262,250 132,831,569 135,314,226 Diluted earnings per share $ 0.23 $ 0.95 $ 2.54 $ 2.76 Adjusted Net Income Per Diluted Share (i) $ 1.07 $ 1.02 $ 3.55 $ 3.35 Free Cash Flow Net cash provided by operating activities $ 138,582 $ 21,405 $ 365,674 $ 481,151 Less: Purchases of property, equipment and software (21,664) (21,933) (51,398) (51,608) Free cash flow $ 116,918 $ (528) $ 314,276 $ 429,543 Operating cash flow conversion 447 % 17 % 107 % 128 % Free cash flow conversion 82 % — % 67 % 95 % 14

15 NON-GAAP FINANCIAL INFORMATION (Unaudited) 15 (a) Represents costs associated with the acquisition efforts of the Company related to transactions for which the Company has entered into a letter of intent to acquire a controlling financial interest in the target entity, as well as the divestiture costs incurred in divesting a portion of our business. Acquisition and divestiture costs primarily include costs associated with (i) buy-side and sell-side due diligence activities, (ii) compensation expenses associated with employee retention, and (iii) legal and advisory fees primarily associated with the acquisitions of Liberty IT Solutions, LLC (“Liberty”) and Tracepoint Holdings, LLC (“Tracepoint”) in fiscal 2022, and the acquisition of EverWatch Corp. (“EverWatch”) and the divestitures of our management consulting business serving the Middle East and North Africa (“MENA”) and our Managed Threat Services business ("MTS") in fiscal 2023. (b) Reflects expenses associated with debt financing activities incurred during the first quarter of fiscal 2022 and second quarter of fiscal 2023. (c) Amortization expense associated with acquired intangibles from significant acquisitions. Significant acquisitions include acquisitions which the Company considers to be beyond the scope of our normal operations. Significant acquisition amortization includes amortization expense associated with the acquisition of Liberty in the first quarter of fiscal 2022 and the acquisition of EverWatch in the third quarter of fiscal 2023. (d) Reserve associated with the U.S. Department of Justice's investigation of the Company. See Note 15, “Commitments and Contingencies,” to the condensed consolidated financial statements for further information. (e) Reflects the combination of Interest expense and Other income, net from the condensed consolidated statement of operations. (f) Represents a gain in the second quarter of fiscal 2022 associated with the Company's remeasurement of its previously held equity method investment in Tracepoint, and a gain in the third quarter of fiscal 2022 associated with the divestiture of a controlling financial interest in SnapAttack. (g) Represents the gain recognized on the divestitures of the Company's MENA business in the second quarter of fiscal 2023, its MTS business in the third quarter of fiscal 2023, and the gain on the deconsolidation of an artificial intelligence software platform business in the third quarter of fiscal 2023. (h) Reflects the tax effect of adjustments at an assumed effective tax rate of 26%, which approximates the blended federal and state tax rates, and consistently excludes the impact of other tax credits and incentive benefits realized. The tax effect of certain discrete items is calculated specifically and may vary from the general 26% rate. (i) Excludes adjustments of approximately $0.5 million and $2.6 million of net earnings for the three and nine months ended December 31, 2022, respectively, and $0.9 million and $2.4 million of net earnings for the three and nine months ended December 31, 2021, respectively, associated with the application of the two-class method for computing diluted earnings per share.
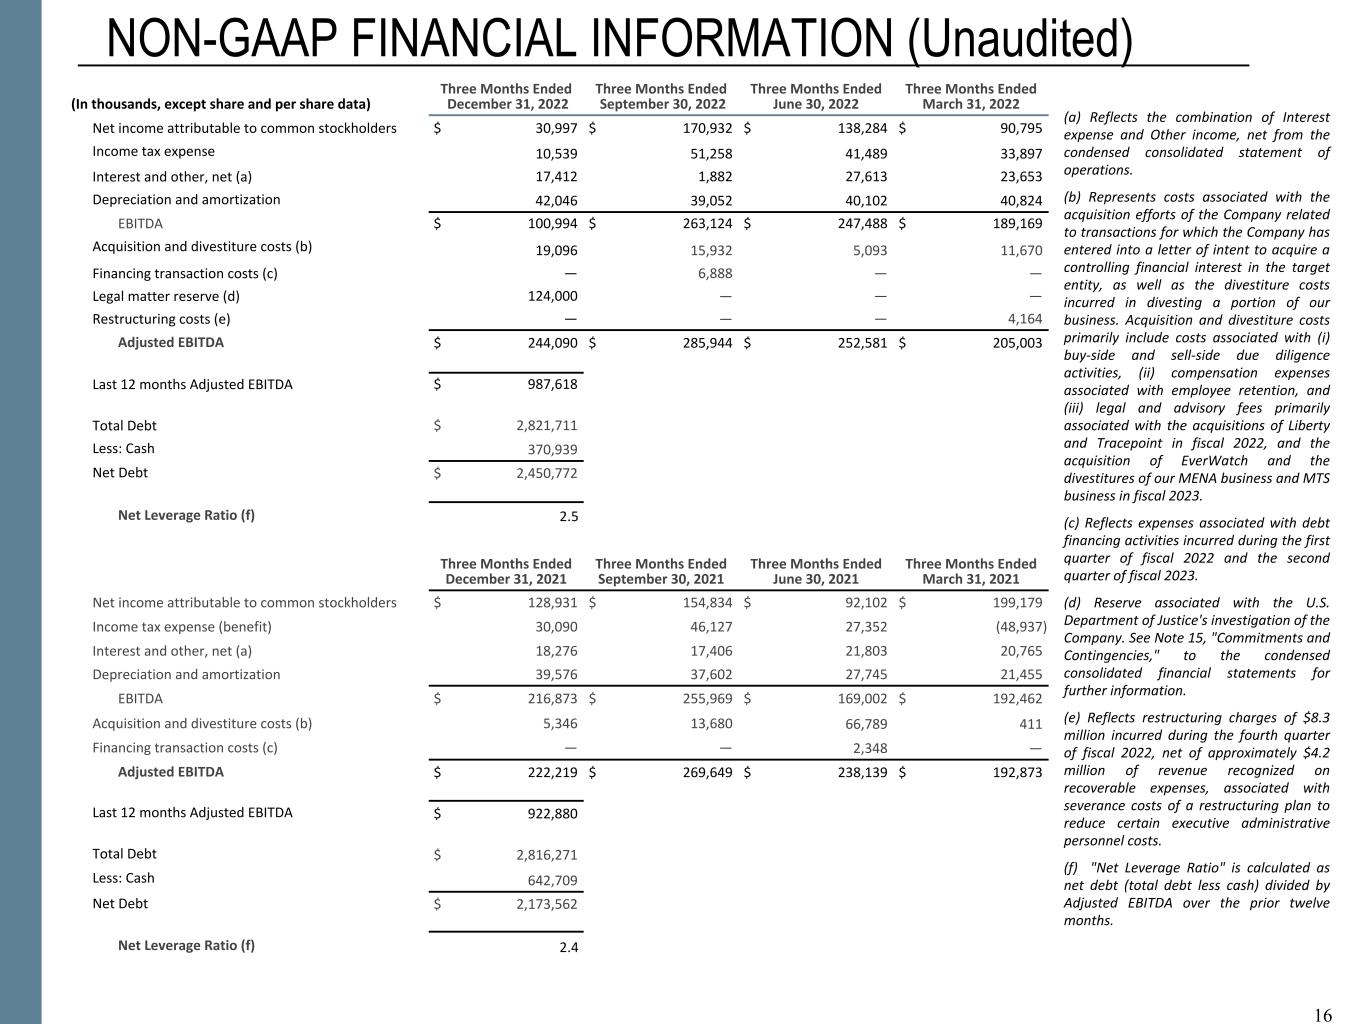
16 NON-GAAP FINANCIAL INFORMATION (Unaudited) (In thousands, except share and per share data) Three Months Ended December 31, 2022 Three Months Ended September 30, 2022 Three Months Ended June 30, 2022 Three Months Ended March 31, 2022 Net income attributable to common stockholders $ 30,997 $ 170,932 $ 138,284 $ 90,795 Income tax expense 10,539 51,258 41,489 33,897 Interest and other, net (a) 17,412 1,882 27,613 23,653 Depreciation and amortization 42,046 39,052 40,102 40,824 EBITDA $ 100,994 $ 263,124 $ 247,488 $ 189,169 Acquisition and divestiture costs (b) 19,096 15,932 5,093 11,670 Financing transaction costs (c) — 6,888 — — Legal matter reserve (d) 124,000 — — — Restructuring costs (e) — — — 4,164 Adjusted EBITDA $ 244,090 $ 285,944 $ 252,581 $ 205,003 Last 12 months Adjusted EBITDA $ 987,618 Total Debt $ 2,821,711 Less: Cash 370,939 Net Debt $ 2,450,772 Net Leverage Ratio (f) 2.5 Three Months Ended December 31, 2021 Three Months Ended September 30, 2021 Three Months Ended June 30, 2021 Three Months Ended March 31, 2021 Net income attributable to common stockholders $ 128,931 $ 154,834 $ 92,102 $ 199,179 Income tax expense (benefit) 30,090 46,127 27,352 (48,937) Interest and other, net (a) 18,276 17,406 21,803 20,765 Depreciation and amortization 39,576 37,602 27,745 21,455 EBITDA $ 216,873 $ 255,969 $ 169,002 $ 192,462 Acquisition and divestiture costs (b) 5,346 13,680 66,789 411 Financing transaction costs (c) — — 2,348 — Adjusted EBITDA $ 222,219 $ 269,649 $ 238,139 $ 192,873 Last 12 months Adjusted EBITDA $ 922,880 Total Debt $ 2,816,271 Less: Cash 642,709 Net Debt $ 2,173,562 Net Leverage Ratio (f) 2.4 16 (a) Reflects the combination of Interest expense and Other income, net from the condensed consolidated statement of operations. (b) Represents costs associated with the acquisition efforts of the Company related to transactions for which the Company has entered into a letter of intent to acquire a controlling financial interest in the target entity, as well as the divestiture costs incurred in divesting a portion of our business. Acquisition and divestiture costs primarily include costs associated with (i) buy-side and sell-side due diligence activities, (ii) compensation expenses associated with employee retention, and (iii) legal and advisory fees primarily associated with the acquisitions of Liberty and Tracepoint in fiscal 2022, and the acquisition of EverWatch and the divestitures of our MENA business and MTS business in fiscal 2023. (c) Reflects expenses associated with debt financing activities incurred during the first quarter of fiscal 2022 and the second quarter of fiscal 2023. (d) Reserve associated with the U.S. Department of Justice's investigation of the Company. See Note 15, "Commitments and Contingencies," to the condensed consolidated financial statements for further information. (e) Reflects restructuring charges of $8.3 million incurred during the fourth quarter of fiscal 2022, net of approximately $4.2 million of revenue recognized on recoverable expenses, associated with severance costs of a restructuring plan to reduce certain executive administrative personnel costs. (f) "Net Leverage Ratio" is calculated as net debt (total debt less cash) divided by Adjusted EBITDA over the prior twelve months.

17 FINANCIAL RESULTS – KEY DRIVERS Third Quarter Fiscal 2023 – Below is a summary of the key factors driving results for the fiscal 2023 third quarter ended December 31, 2022 as compared to the prior year period: • Revenue increased 12.1% to $2.3 billion and Revenue, Excluding Billable Expenses increased 11.2% to $1.6 billion. Revenue growth was primarily driven by a combination of headcount growth, salary increases, and strong demand for our solutions, as well as higher staff utilization as compared to the prior year period. The increase in revenue also includes approximately $28.6 million of contributions related to the Company's acquisition of EverWatch in the third quarter of fiscal 2023. • Operating income decreased 66.9% to $58.6 million and Adjusted Operating Income increased 11.0% to $215.8 million. Operating income was negatively impacted by a $124.0 million reserve associated with the U.S. Department of Justice's investigation of the Company recorded in the third quarter of fiscal 2023, as well as less favorable contract mix, higher unallowable spending, higher billable expense mix and inflationary pressures, partially offset by strong contract-level performance. The increase in Adjusted Operating Income was driven by the same factors impacting Operating Income with the exception of the aforementioned legal matter reserve, which did not impact Adjusted Operating Income. • Net income decreased 76.2% to $30.7 million, and net income attributable to common stockholders decreased 76.0% to $31.0 million. These changes were primarily driven by the same factors as operating income, as well as higher interest expense, partially offset by a net gain of $8.9 million from the de-consolidation of an artificial intelligence software platform business, and a $4.6 million pre-tax gain associated with the divestiture of the Company's Managed Threat Services business. Adjusted Net income increased 4.0% to $142.5 million. The change in Adjusted Net Income was primarily driven by the same factors as Adjusted Operating Income, as well as higher income tax expense. • EBITDA decreased 53.4% to $101.0 million and Adjusted EBITDA increased 9.8% to $244.1 million.These changes were due to the same factors as operating income and Adjusted Operating Income, respectively. • Diluted EPS decreased to $0.23 from $0.95 and Adjusted Diluted EPS increased to $1.07 from $1.02. The changes were primarily driven by the same factors as Net Income and Adjusted Net Income, respectively, as well as a lower share count in the second quarter of fiscal 2023. • Net cash provided by operating activities was $138.6 million for the quarter ended December 31, 2022, as compared to $21.4 million in the prior year period. Free Cash Flow was $116.9 million for the three months ended December 31, 2022, as compared to $(0.5) million in the prior year period. The increase in net cash provided by operating activities was primarily driven by collections from revenue growth and a net benefit from cash taxes paid during the quarter, partially offset by acquisition and divestiture related costs paid during the third quarter of fiscal 2023.


