Fiscal Year 2025, Third Quarter January 31, 2025 EARNINGS CALL PRESENTATION

2 HORACIO ROZANSKI Chairman, Chief Executive Officer & President MATT CALDERONE Executive Vice President, Chief Financial Officer DUSTIN DARENSBOURG Head of Investor Relations CALL PARTICIPANTS
3 DISCLAIMER Forward Looking Safe Harbor Statement Certain statements contained in this presentation and in related comments by our management include “forward-looking statements” within the meaning of the Private Securities Litigation Reform Act of 1995. Examples of forward-looking statements include information concerning Booz Allen’s preliminary financial results, financial outlook and guidance, including forecasted revenue, Adjusted EBITDA, Diluted EPS, Adjusted Diluted EPS, future quarterly dividends, and future improvements in operating margins, as well as any other statement that does not directly relate to any historical or current fact. In some cases, you can identify forward-looking statements by terminology such as “may,” “will,” “could,” “should,” “forecasts,” “expects,” “intends,” “plans,” “anticipates,” “projects,” “outlook,” “believes,” “estimates,” “predicts,” “potential,” “continue,” “preliminary,” or the negative of these terms or other comparable terminology. Although we believe that the expectations reflected in the forward-looking statements are reasonable, we can give you no assurance these expectations will prove to have been correct. These forward-looking statements relate to future events or our future financial performance and involve known and unknown risks, uncertainties and other factors that may cause our actual results, levels of activity, performance or achievements to differ materially from any future results, levels of activity, performance or achievements expressed or implied by these forward-looking statements. A number of important factors could cause actual results to differ materially from those contained in or implied by these forward-looking statements, including those factors discussed in our filings with the Securities and Exchange Commission (SEC), including our Annual Report on Form 10-K for the fiscal year ended March 31, 2024, which can be found at the SEC’s website at www.sec.gov. All forward-looking statements attributable to us or persons acting on our behalf are expressly qualified in their entirety by the foregoing cautionary statements. All such statements speak only as of the date made and, except as required by law, we undertake no obligation to update or revise publicly any forward- looking statements, whether as a result of new information, future events or otherwise. Note Regarding Non-GAAP Financial Data Information Booz Allen discloses Revenue, Excluding Billable Expenses, Adjusted Operating Income, Adjusted EBITDA, Adjusted EBITDA Margin on Revenue, Adjusted EBITDA Margin on Revenue, Excluding Billable Expenses, Adjusted Net Income, Adjusted Diluted EPS, Free Cash Flow, Free Cash Flow Conversion, Net Leverage Ratio and organic revenue, which are not recognized measurements under accounting principles generally accepted in the United States, or GAAP, and when analyzing Booz Allen’s performance or liquidity, as applicable, investors should (i) evaluate each adjustment in our reconciliation of revenue to Revenue, Excluding Billable Expenses, operating income to Adjusted Operating Income, net income attributable to common stockholders to Adjusted EBITDA, Adjusted EBITDA Margin on Revenue, Adjusted EBITDA Margin on Revenue, Excluding Billable Expenses, Adjusted Net Income and Adjusted Diluted EPS, and net cash provided by operating activities to Free Cash Flow and Free Cash Flow Conversion, and net debt to Net Leverage Ratio and the explanatory footnotes regarding those adjustments, each as defined under GAAP, (ii) use Revenue, Excluding Billable Expenses, Adjusted Operating Income, Adjusted EBITDA, Adjusted EBITDA Margin on Revenue, Adjusted EBITDA Margin on Revenue, Excluding Billable Expenses, Adjusted Net Income, and Adjusted Diluted EPS in addition to, and not as an alternative to, revenue, operating income, net income attributable to common stockholders or diluted EPS, as measures of operating results, each as defined under GAAP, (iii) use Free Cash Flow, Free Cash Flow Conversion, and Net Leverage Ratio, in addition to, and not as an alternative to, net cash provided by operating activities as a measure of liquidity, each as defined under GAAP, and (iv) use Net Leverage Ratio in addition to, and not as an alternative to, net debt as a measure of Booz Allen's debt leverage. The Appendix includes a reconciliation of Revenue, Excluding Billable Expenses, Adjusted Operating Income, Adjusted EBITDA, Adjusted EBITDA Margin on Revenue, Adjusted EBITDA Margin on Revenue, Excluding Billable Expenses, Adjusted Net Income, Adjusted Diluted EPS, Free Cash Flow, Free Cash Flow Conversion, and Net Leverage Ratio to the most directly comparable financial measure calculated and presented in accordance with GAAP. Booz Allen presents these supplemental performance measures because it believes that these measures provide investors and securities analysts with important supplemental information with which to evaluate Booz Allen’s performance, long term earnings potential, or liquidity, as applicable, and to enable them to assess Booz Allen’s performance on the same basis as management. These supplemental performance and liquidity measurements may vary from and may not be comparable to similarly titled measures by other companies in Booz Allen’s industry. With respect to our expectations under “Financial Outlook”, reconciliation of Adjusted Diluted EPS guidance, Adjusted EBITDA, and Adjusted EBITDA Margin on Revenue to the closest corresponding GAAP measure is not available without unreasonable efforts on a forward-looking basis due to our inability to predict our stock price, equity grants and dividend declarations with respect to Adjusted Diluted EPS, and our net income, net interest and other expenses with respect to Adjusted EBITDA and Adjusted EBITDA Margin on Revenue, during the course of fiscal 2025. With respect to Adjusted Diluted EPS guidance, projecting future stock price, equity grants and dividends to be declared would be necessary to accurately calculate the difference between Adjusted Diluted EPS and GAAP EPS as a result of the effects of the two-class method and related possible dilution used in the calculation of EPS. Consequently, any attempt to disclose such reconciliation would imply a degree of precision that could be confusing or misleading to investors. We expect the variability of the above charges to have an unpredictable, and potentially significant, impact on our future GAAP financial results. For the same reason, a reconciliation of Adjusted EBITDA and Adjusted EBITDA Margin on Revenue guidance for fiscal 2025, of Adjusted EBITDA guidance through fiscal 2025, and of inorganic revenue contributions through fiscal 2025 to the closest corresponding GAAP measures are not available without unreasonable efforts on a forward-looking basis due to our inability to predict specific quantifications of the amounts that would be required to reconcile such measures. Accordingly, Booz Allen is relying on the exception provided by Item 10(e)(1)(i)(B) of Regulation S-K to exclude these reconciliations.
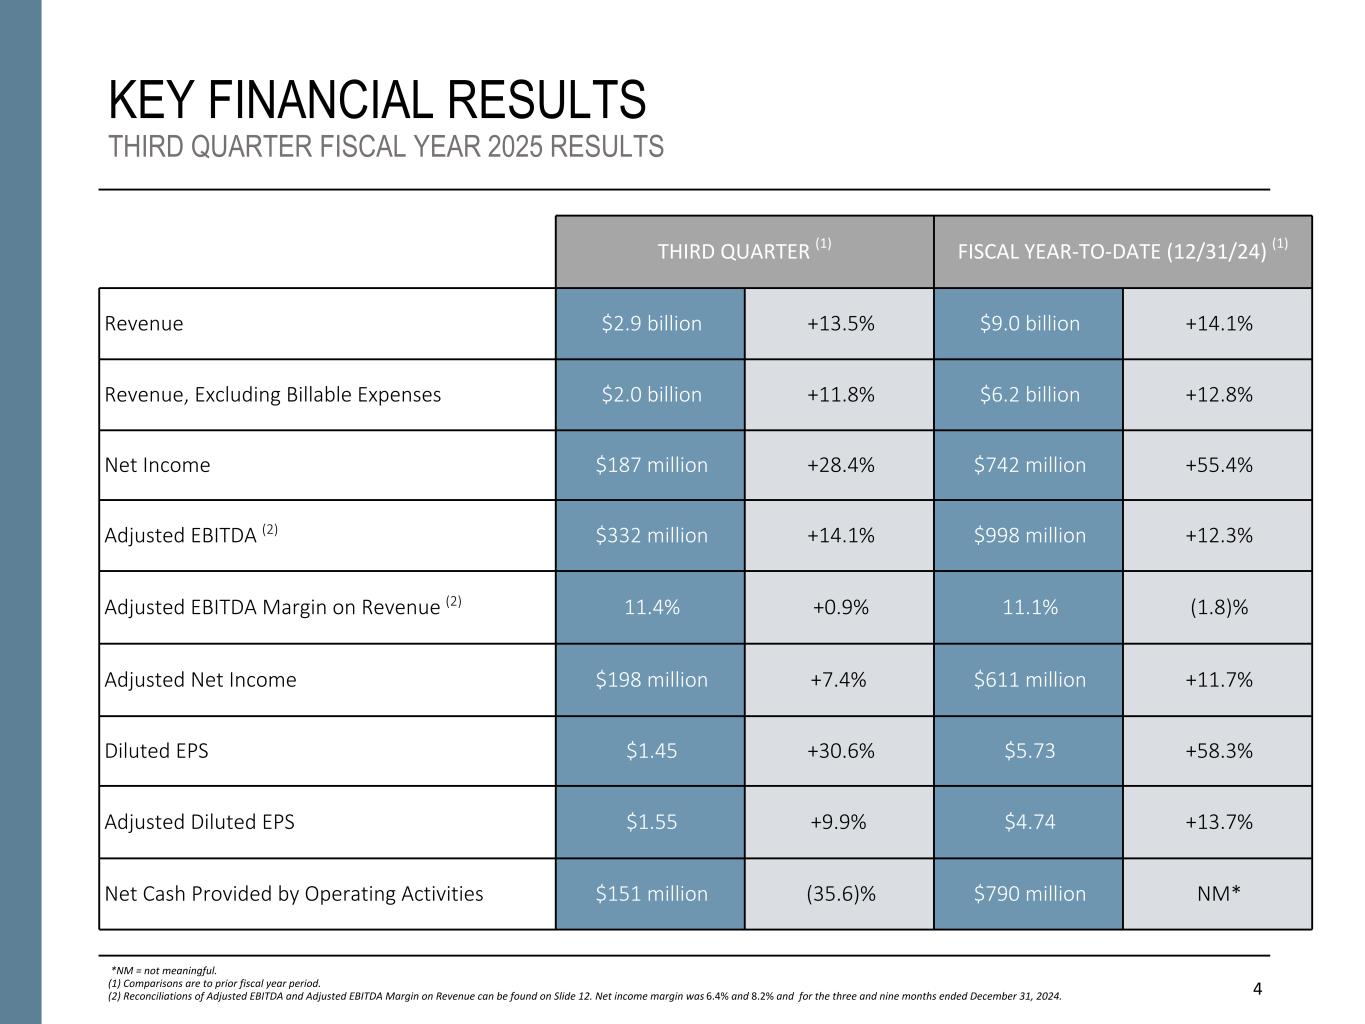
4 KEY FINANCIAL RESULTS THIRD QUARTER FISCAL YEAR 2025 RESULTS *NM = not meaningful. (1) Comparisons are to prior fiscal year period. (2) Reconciliations of Adjusted EBITDA and Adjusted EBITDA Margin on Revenue can be found on Slide 12. Net income margin was 6.4% and 8.2% and for the three and nine months ended December 31, 2024. THIRD QUARTER (1) FISCAL YEAR-TO-DATE (12/31/24) (1) Revenue $2.9 billion +13.5% $9.0 billion +14.1% Revenue, Excluding Billable Expenses $2.0 billion +11.8% $6.2 billion +12.8% Net Income $187 million +28.4% $742 million +55.4% Adjusted EBITDA (2) $332 million +14.1% $998 million +12.3% Adjusted EBITDA Margin on Revenue (2) 11.4% +0.9% 11.1% (1.8)% Adjusted Net Income $198 million +7.4% $611 million +11.7% Diluted EPS $1.45 +30.6% $5.73 +58.3% Adjusted Diluted EPS $1.55 +9.9% $4.74 +13.7% Net Cash Provided by Operating Activities $151 million (35.6)% $790 million NM*
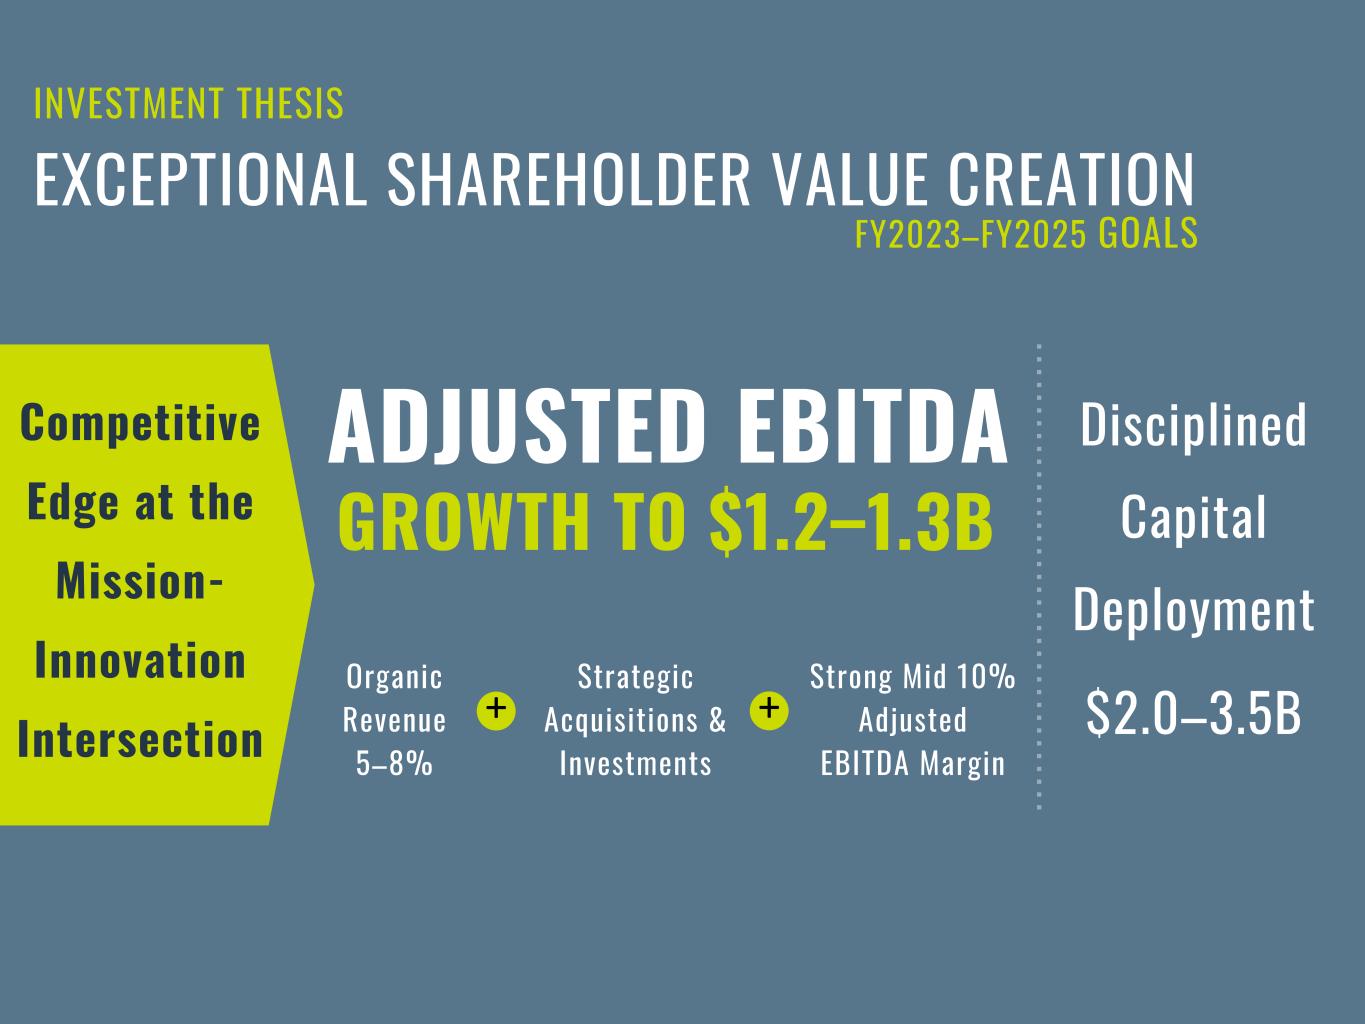
INVESTMENT THESIS EXCEPTIONAL SHAREHOLDER VALUE CREATION FY2023–FY2025 GOALS Competitive Edge at the Mission- Innovation Intersection ADJUSTED EBITDA GROWTH TO $1.2–1.3B Disciplined Capital Deployment $2.0–3.5B Organic Revenue 5–8% Strategic Acquisitions & Investments Strong Mid 10% Adjusted EBITDA Margin + +
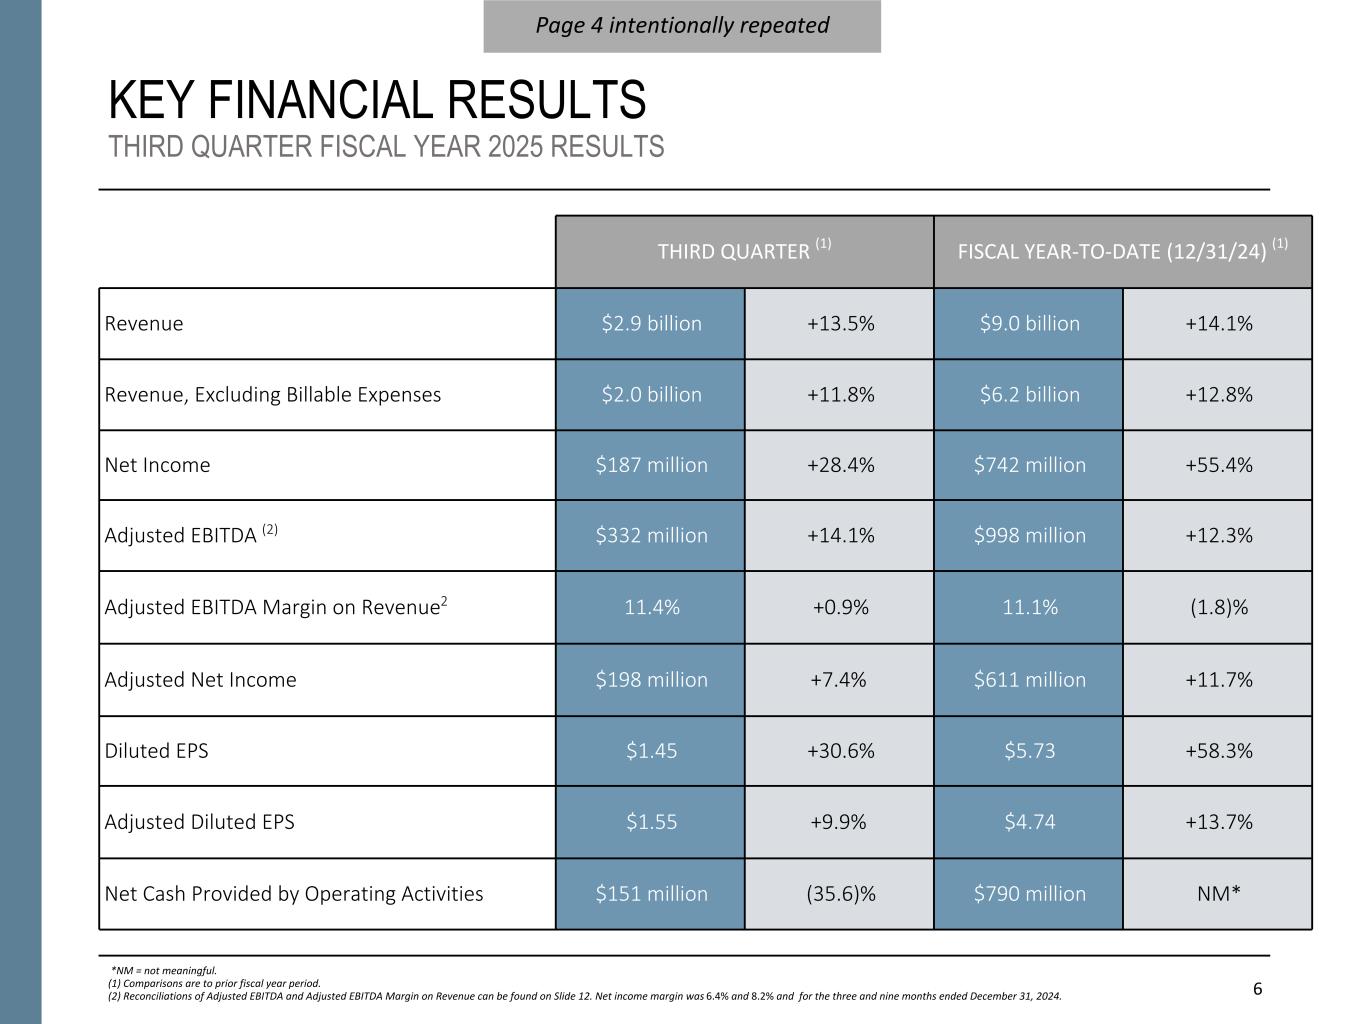
6 KEY FINANCIAL RESULTS THIRD QUARTER FISCAL YEAR 2025 RESULTS THIRD QUARTER (1) FISCAL YEAR-TO-DATE (12/31/24) (1) Revenue $2.9 billion +13.5% $9.0 billion +14.1% Revenue, Excluding Billable Expenses $2.0 billion +11.8% $6.2 billion +12.8% Net Income $187 million +28.4% $742 million +55.4% Adjusted EBITDA (2) $332 million +14.1% $998 million +12.3% Adjusted EBITDA Margin on Revenue2 11.4% +0.9% 11.1% (1.8)% Adjusted Net Income $198 million +7.4% $611 million +11.7% Diluted EPS $1.45 +30.6% $5.73 +58.3% Adjusted Diluted EPS $1.55 +9.9% $4.74 +13.7% Net Cash Provided by Operating Activities $151 million (35.6)% $790 million NM* Page 4 intentionally repeated *NM = not meaningful. (1) Comparisons are to prior fiscal year period. (2) Reconciliations of Adjusted EBITDA and Adjusted EBITDA Margin on Revenue can be found on Slide 12. Net income margin was 6.4% and 8.2% and for the three and nine months ended December 31, 2024.
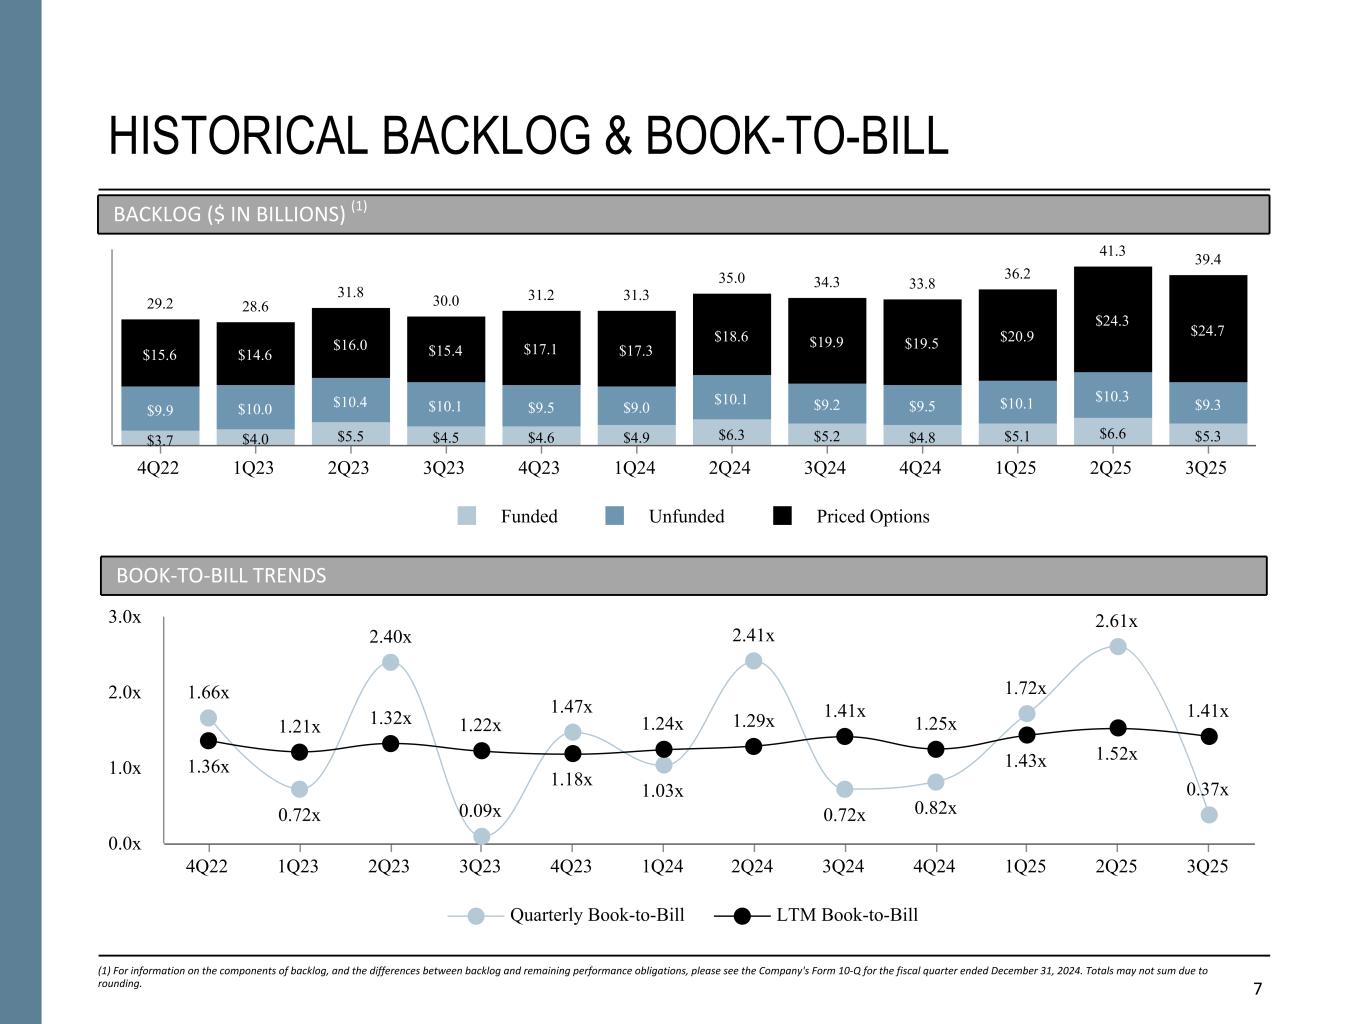
7 $22.0 HISTORICAL BACKLOG & BOOK-TO-BILL (1) For information on the components of backlog, and the differences between backlog and remaining performance obligations, please see the Company's Form 10-Q for the fiscal quarter ended December 31, 2024. Totals may not sum due to rounding. BACKLOG ($ IN BILLIONS) (1) BOOK-TO-BILL TRENDS 29.2 28.6 31.8 30.0 31.2 31.3 35.0 34.3 33.8 36.2 41.3 39.4 $3.7 $4.0 $5.5 $4.5 $4.6 $4.9 $6.3 $5.2 $4.8 $5.1 $6.6 $5.3 $9.9 $10.0 $10.4 $10.1 $9.5 $9.0 $10.1 $9.2 $9.5 $10.1 $10.3 $9.3 $15.6 $14.6 $16.0 $15.4 $17.1 $17.3 $18.6 $19.9 $19.5 $20.9 $24.3 $24.7 Funded Unfunded Priced Options 4Q22 1Q23 2Q23 3Q23 4Q23 1Q24 2Q24 3Q24 4Q24 1Q25 2Q25 3Q25 1.66x 0.72x 2.40x 0.09x 1.47x 1.03x 2.41x 0.72x 0.82x 1.72x 2.61x 0.37x 1.36x 1.21x 1.32x 1.22x 1.18x 1.24x 1.29x 1.41x 1.25x 1.43x 1.52x 1.41x Quarterly Book-to-Bill LTM Book-to-Bill 4Q22 1Q23 2Q23 3Q23 4Q23 1Q24 2Q24 3Q24 4Q24 1Q25 2Q25 3Q25 0.0x 1.0x 2.0x 3.0x

8 CAPITAL ALLOCATION DELIVERING STRONG CAPITAL RETURNS THROUGH EFFICIENT CAPITAL DEPLOYMENT STRATEGY – Our multi-year capital deployment plan follows a disciplined and opportunistic approach, subject to market conditions – In Q3 FY2025, we deployed approximately $227.6 million: – $65.5 million through quarterly dividends; – $148.8 million through share repurchases(2); – $9.3 million through strategic investments(3); and $4.0 million through acquisitions(3) – The Board authorized a dividend increase of 7.8% to $0.55 per share payable on March 4, 2025 to stockholders of record on February 14, 2025 – Share repurchase authorization capacity is approximately $554.7 million as of December 31, 2024. The Board authorized on January 28, 2025 an increase in total share repurchase authorization capacity of $500 million, bringing available capacity to approximately $1.0 billion. HISTORICAL CAPITAL DEPLOYMENT ($ IN MILLIONS) (1)QUARTERLY CAPITAL DEPLOYMENT ($ IN MILLIONS) (1) 164.2 200.2 251.5 300.3 227.6 $61.7 $66.6 $67.1 $65.8 $65.5 $94.5 $127.3 $89.5 $232.3 $148.8 $8.1 $6.2 $94.9 $2.1 $13.3 Quarterly Dividends Share Repurchases M&A 3Q24 4Q24 1Q25 2Q25 3Q25 571.3 1,493.9 905.0 691.7 979.5 $181.1 $209.1 $235.7 $253.4 $265.1 $318.1 $419.3 $224.0 $415.0 $597.9$72.2 $865.5 $445.3 $23.3 $116.6 Quarterly Dividends Share Repurchases M&A FY21 FY22 FY23 FY24 LTM (3) (1) Totals may not sum due to rounding. (2) Includes share repurchases transacted but not settled and paid. (3) Represents payments for acquisitions, net of cash acquired, and strategic investments. (2) (3) (2)
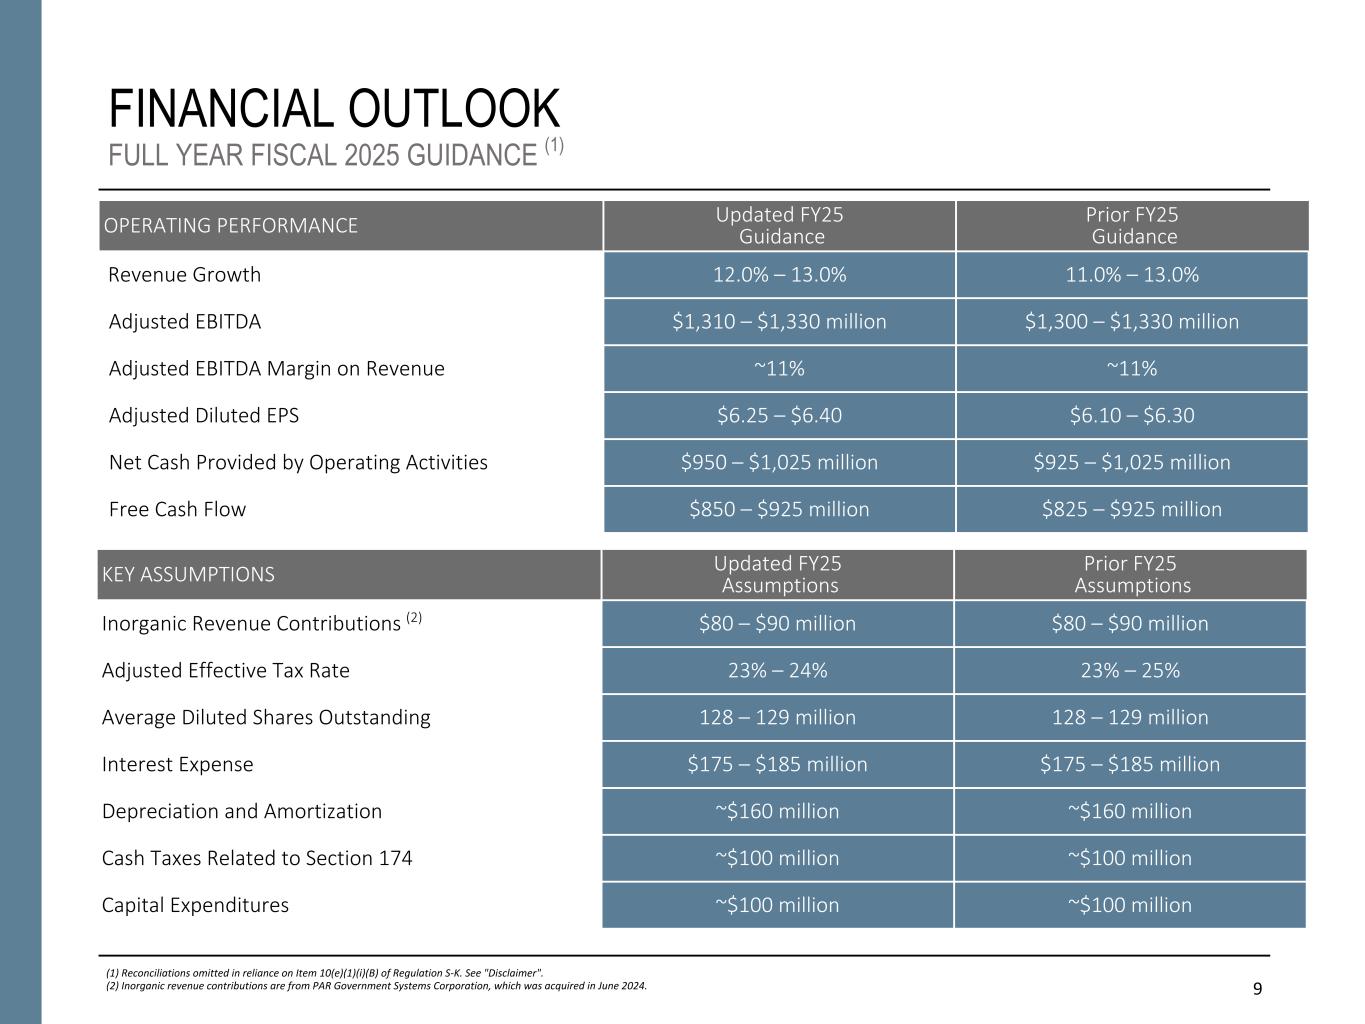
9 FINANCIAL OUTLOOK FULL YEAR FISCAL 2025 GUIDANCE (1) OPERATING PERFORMANCE Updated FY25 Guidance Prior FY25 Guidance Revenue Growth 12.0% – 13.0% 11.0% – 13.0% Adjusted EBITDA $1,310 – $1,330 million $1,300 – $1,330 million Adjusted EBITDA Margin on Revenue ~11% ~11% Adjusted Diluted EPS $6.25 – $6.40 $6.10 – $6.30 Net Cash Provided by Operating Activities $950 – $1,025 million $925 – $1,025 million Free Cash Flow $850 – $925 million $825 – $925 million (1) Reconciliations omitted in reliance on Item 10(e)(1)(i)(B) of Regulation S-K. See "Disclaimer". (2) Inorganic revenue contributions are from PAR Government Systems Corporation, which was acquired in June 2024. KEY ASSUMPTIONS Updated FY25 Assumptions Prior FY25 Assumptions Inorganic Revenue Contributions (2) $80 – $90 million $80 – $90 million Adjusted Effective Tax Rate 23% – 24% 23% – 25% Average Diluted Shares Outstanding 128 – 129 million 128 – 129 million Interest Expense $175 – $185 million $175 – $185 million Depreciation and Amortization ~$160 million ~$160 million Cash Taxes Related to Section 174 ~$100 million ~$100 million Capital Expenditures ~$100 million ~$100 million

10 APPENDIX
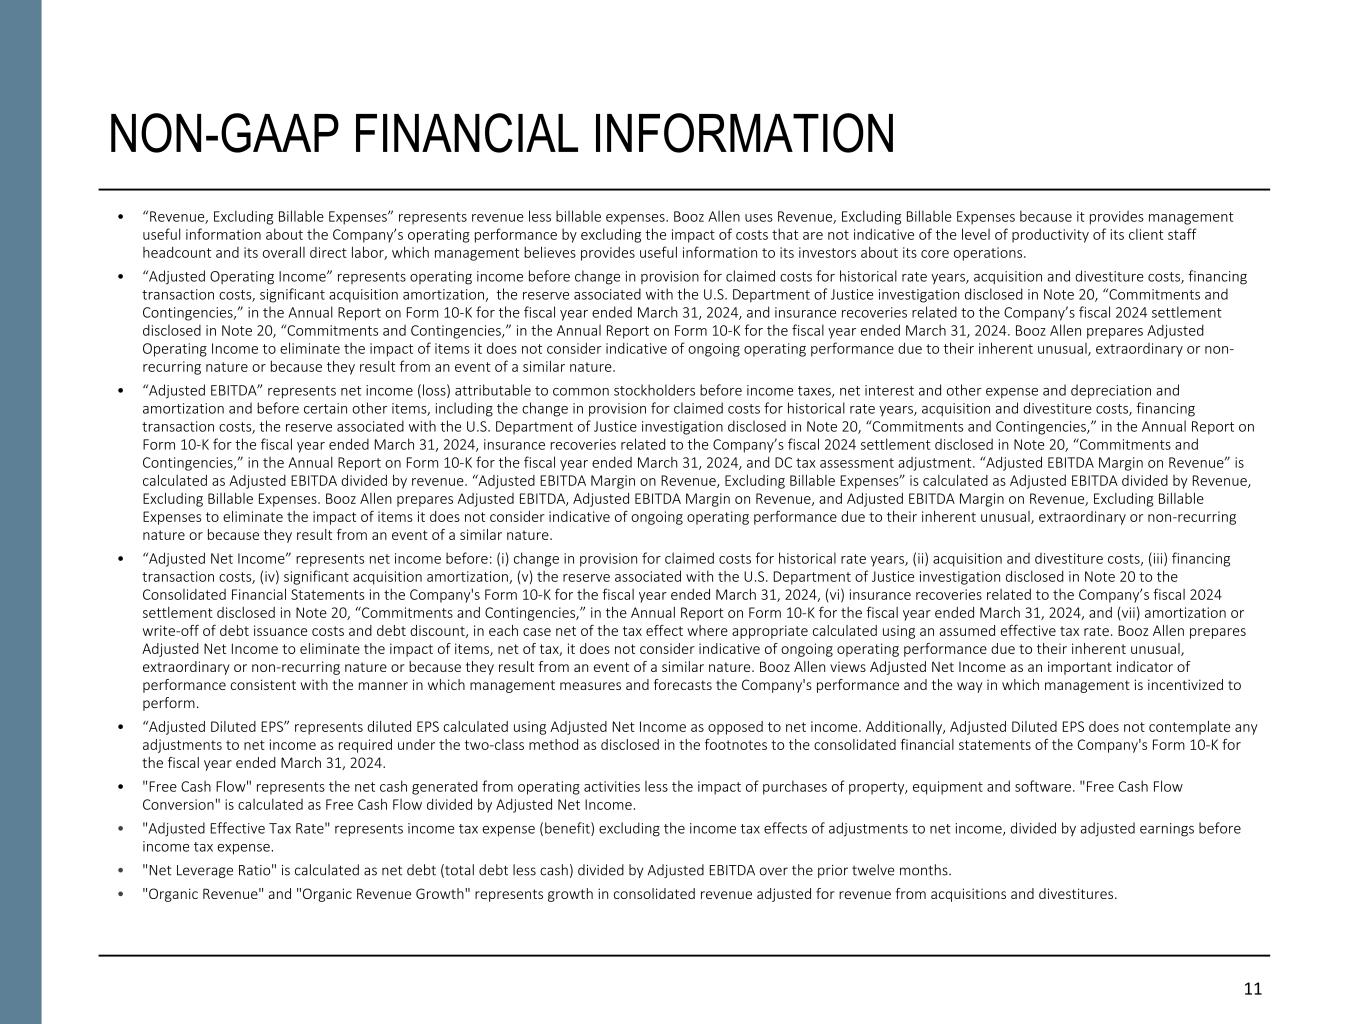
11 NON-GAAP FINANCIAL INFORMATION • “Revenue, Excluding Billable Expenses” represents revenue less billable expenses. Booz Allen uses Revenue, Excluding Billable Expenses because it provides management useful information about the Company’s operating performance by excluding the impact of costs that are not indicative of the level of productivity of its client staff headcount and its overall direct labor, which management believes provides useful information to its investors about its core operations. • “Adjusted Operating Income” represents operating income before change in provision for claimed costs for historical rate years, acquisition and divestiture costs, financing transaction costs, significant acquisition amortization, the reserve associated with the U.S. Department of Justice investigation disclosed in Note 20, “Commitments and Contingencies,” in the Annual Report on Form 10-K for the fiscal year ended March 31, 2024, and insurance recoveries related to the Company’s fiscal 2024 settlement disclosed in Note 20, “Commitments and Contingencies,” in the Annual Report on Form 10-K for the fiscal year ended March 31, 2024. Booz Allen prepares Adjusted Operating Income to eliminate the impact of items it does not consider indicative of ongoing operating performance due to their inherent unusual, extraordinary or non- recurring nature or because they result from an event of a similar nature. • “Adjusted EBITDA” represents net income (loss) attributable to common stockholders before income taxes, net interest and other expense and depreciation and amortization and before certain other items, including the change in provision for claimed costs for historical rate years, acquisition and divestiture costs, financing transaction costs, the reserve associated with the U.S. Department of Justice investigation disclosed in Note 20, “Commitments and Contingencies,” in the Annual Report on Form 10-K for the fiscal year ended March 31, 2024, insurance recoveries related to the Company’s fiscal 2024 settlement disclosed in Note 20, “Commitments and Contingencies,” in the Annual Report on Form 10-K for the fiscal year ended March 31, 2024, and DC tax assessment adjustment. “Adjusted EBITDA Margin on Revenue” is calculated as Adjusted EBITDA divided by revenue. “Adjusted EBITDA Margin on Revenue, Excluding Billable Expenses” is calculated as Adjusted EBITDA divided by Revenue, Excluding Billable Expenses. Booz Allen prepares Adjusted EBITDA, Adjusted EBITDA Margin on Revenue, and Adjusted EBITDA Margin on Revenue, Excluding Billable Expenses to eliminate the impact of items it does not consider indicative of ongoing operating performance due to their inherent unusual, extraordinary or non-recurring nature or because they result from an event of a similar nature. • “Adjusted Net Income” represents net income before: (i) change in provision for claimed costs for historical rate years, (ii) acquisition and divestiture costs, (iii) financing transaction costs, (iv) significant acquisition amortization, (v) the reserve associated with the U.S. Department of Justice investigation disclosed in Note 20 to the Consolidated Financial Statements in the Company's Form 10-K for the fiscal year ended March 31, 2024, (vi) insurance recoveries related to the Company’s fiscal 2024 settlement disclosed in Note 20, “Commitments and Contingencies,” in the Annual Report on Form 10-K for the fiscal year ended March 31, 2024, and (vii) amortization or write-off of debt issuance costs and debt discount, in each case net of the tax effect where appropriate calculated using an assumed effective tax rate. Booz Allen prepares Adjusted Net Income to eliminate the impact of items, net of tax, it does not consider indicative of ongoing operating performance due to their inherent unusual, extraordinary or non-recurring nature or because they result from an event of a similar nature. Booz Allen views Adjusted Net Income as an important indicator of performance consistent with the manner in which management measures and forecasts the Company's performance and the way in which management is incentivized to perform. • “Adjusted Diluted EPS” represents diluted EPS calculated using Adjusted Net Income as opposed to net income. Additionally, Adjusted Diluted EPS does not contemplate any adjustments to net income as required under the two-class method as disclosed in the footnotes to the consolidated financial statements of the Company's Form 10-K for the fiscal year ended March 31, 2024. • "Free Cash Flow" represents the net cash generated from operating activities less the impact of purchases of property, equipment and software. "Free Cash Flow Conversion" is calculated as Free Cash Flow divided by Adjusted Net Income. • "Adjusted Effective Tax Rate" represents income tax expense (benefit) excluding the income tax effects of adjustments to net income, divided by adjusted earnings before income tax expense. • "Net Leverage Ratio" is calculated as net debt (total debt less cash) divided by Adjusted EBITDA over the prior twelve months. • "Organic Revenue" and "Organic Revenue Growth" represents growth in consolidated revenue adjusted for revenue from acquisitions and divestitures.
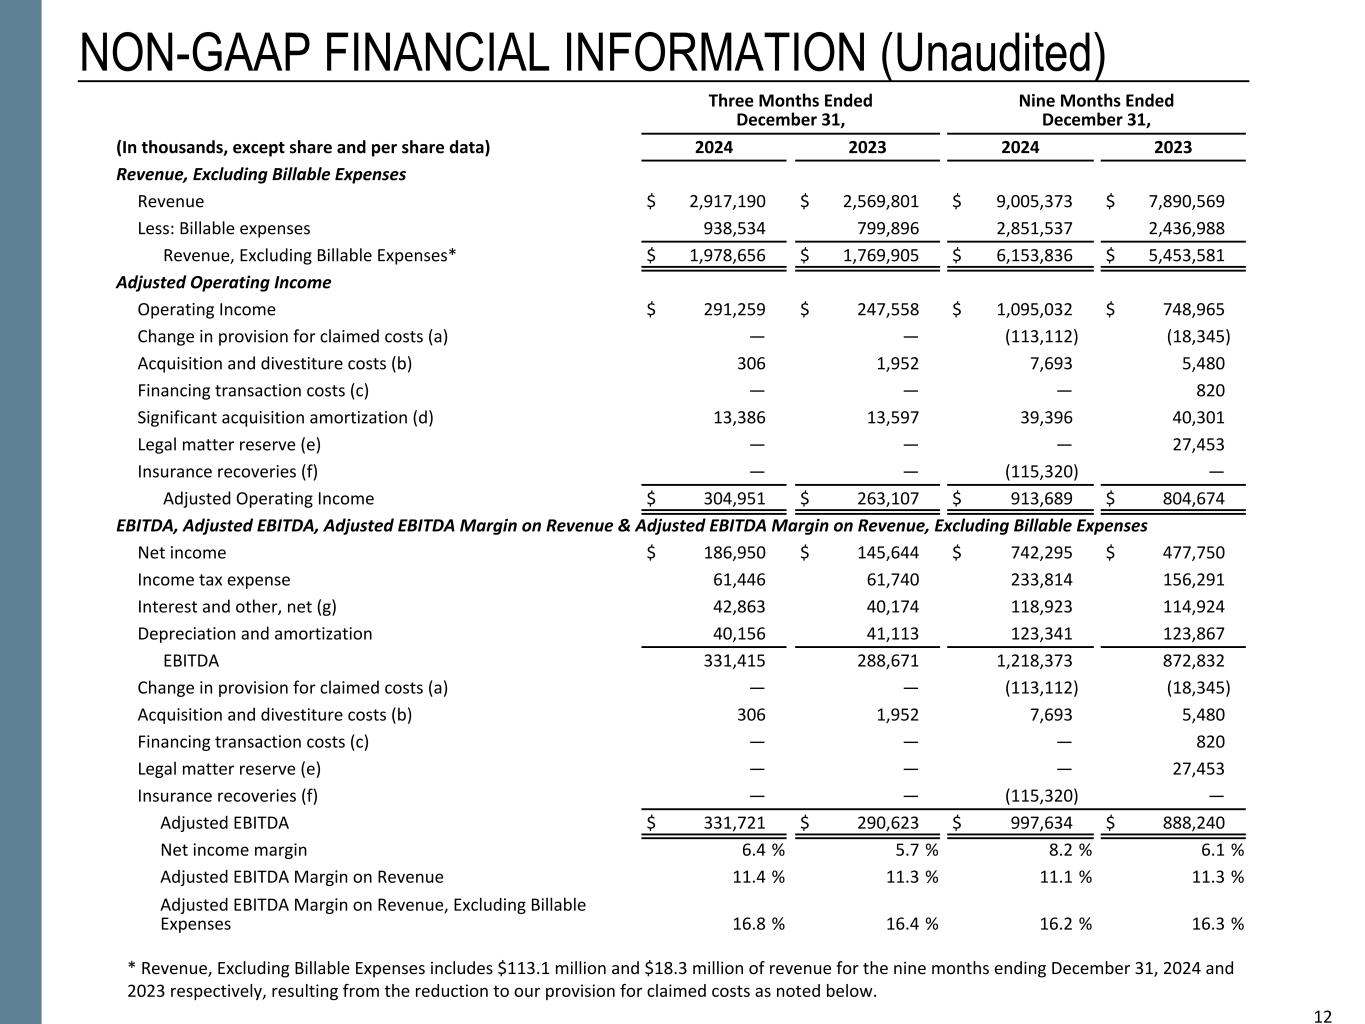
12 NON-GAAP FINANCIAL INFORMATION (Unaudited) Three Months Ended December 31, Nine Months Ended December 31, (In thousands, except share and per share data) 2024 2023 2024 2023 Revenue, Excluding Billable Expenses Revenue $ 2,917,190 $ 2,569,801 $ 9,005,373 $ 7,890,569 Less: Billable expenses 938,534 799,896 2,851,537 2,436,988 Revenue, Excluding Billable Expenses* $ 1,978,656 $ 1,769,905 $ 6,153,836 $ 5,453,581 Adjusted Operating Income Operating Income $ 291,259 $ 247,558 $ 1,095,032 $ 748,965 Change in provision for claimed costs (a) — — (113,112) (18,345) Acquisition and divestiture costs (b) 306 1,952 7,693 5,480 Financing transaction costs (c) — — — 820 Significant acquisition amortization (d) 13,386 13,597 39,396 40,301 Legal matter reserve (e) — — — 27,453 Insurance recoveries (f) — — (115,320) — Adjusted Operating Income $ 304,951 $ 263,107 $ 913,689 $ 804,674 EBITDA, Adjusted EBITDA, Adjusted EBITDA Margin on Revenue & Adjusted EBITDA Margin on Revenue, Excluding Billable Expenses Net income $ 186,950 $ 145,644 $ 742,295 $ 477,750 Income tax expense 61,446 61,740 233,814 156,291 Interest and other, net (g) 42,863 40,174 118,923 114,924 Depreciation and amortization 40,156 41,113 123,341 123,867 EBITDA 331,415 288,671 1,218,373 872,832 Change in provision for claimed costs (a) — — (113,112) (18,345) Acquisition and divestiture costs (b) 306 1,952 7,693 5,480 Financing transaction costs (c) — — — 820 Legal matter reserve (e) — — — 27,453 Insurance recoveries (f) — — (115,320) — Adjusted EBITDA $ 331,721 $ 290,623 $ 997,634 $ 888,240 Net income margin 6.4 % 5.7 % 8.2 % 6.1 % Adjusted EBITDA Margin on Revenue 11.4 % 11.3 % 11.1 % 11.3 % Adjusted EBITDA Margin on Revenue, Excluding Billable Expenses 16.8 % 16.4 % 16.2 % 16.3 % 12 * Revenue, Excluding Billable Expenses includes $113.1 million and $18.3 million of revenue for the nine months ending December 31, 2024 and 2023 respectively, resulting from the reduction to our provision for claimed costs as noted below.
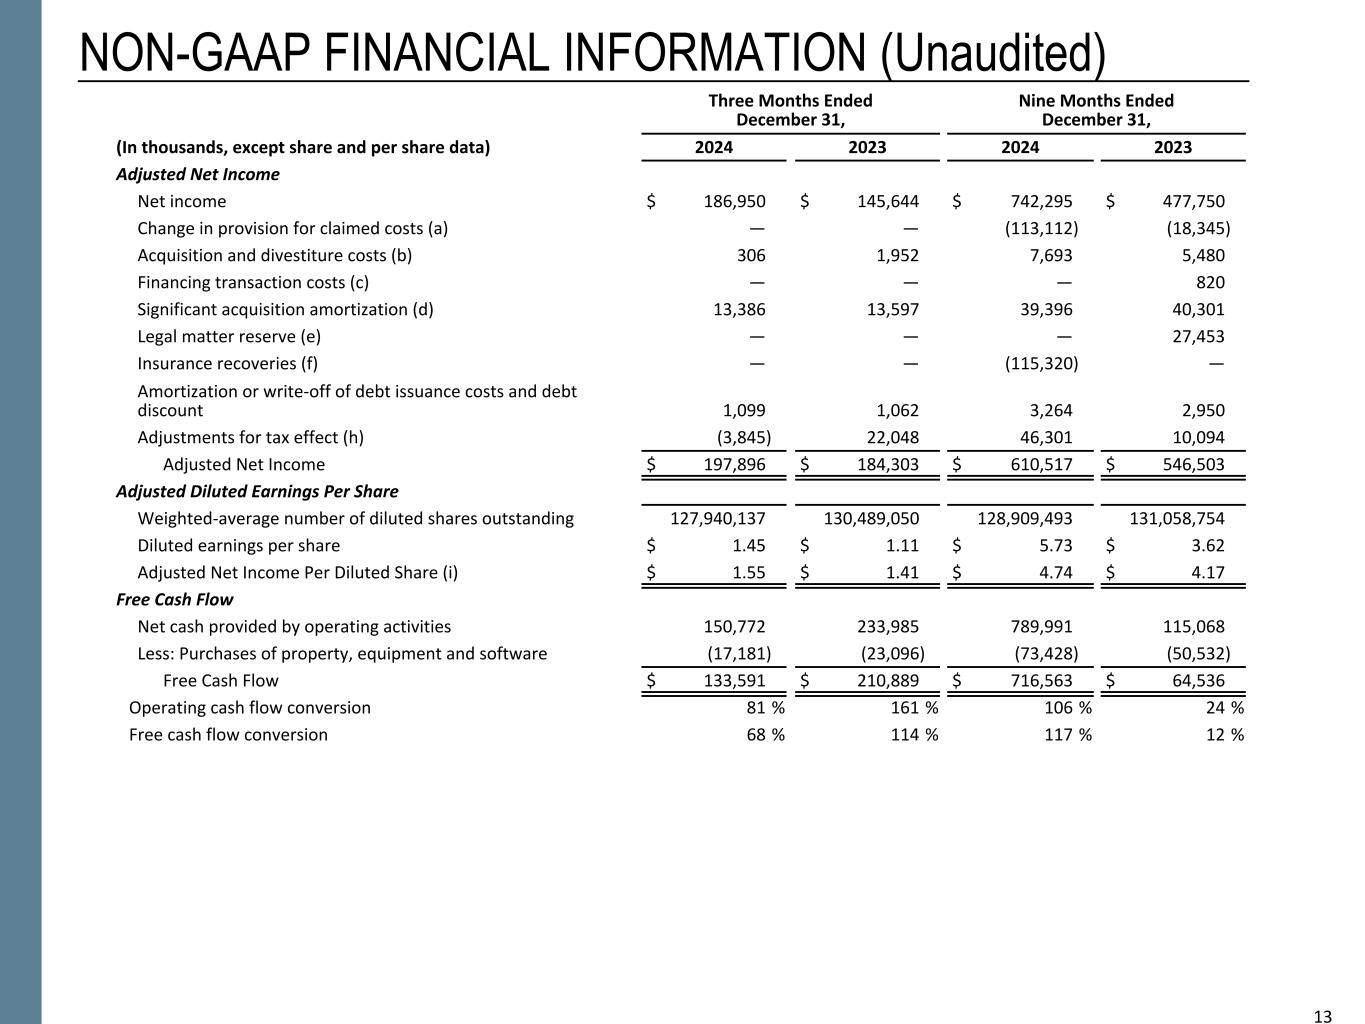
13 NON-GAAP FINANCIAL INFORMATION (Unaudited) Three Months Ended December 31, Nine Months Ended December 31, (In thousands, except share and per share data) 2024 2023 2024 2023 Adjusted Net Income Net income $ 186,950 $ 145,644 $ 742,295 $ 477,750 Change in provision for claimed costs (a) — — (113,112) (18,345) Acquisition and divestiture costs (b) 306 1,952 7,693 5,480 Financing transaction costs (c) — — — 820 Significant acquisition amortization (d) 13,386 13,597 39,396 40,301 Legal matter reserve (e) — — — 27,453 Insurance recoveries (f) — — (115,320) — Amortization or write-off of debt issuance costs and debt discount 1,099 1,062 3,264 2,950 Adjustments for tax effect (h) (3,845) 22,048 46,301 10,094 Adjusted Net Income $ 197,896 $ 184,303 $ 610,517 $ 546,503 Adjusted Diluted Earnings Per Share Weighted-average number of diluted shares outstanding 127,940,137 130,489,050 128,909,493 131,058,754 Diluted earnings per share $ 1.45 $ 1.11 $ 5.73 $ 3.62 Adjusted Net Income Per Diluted Share (i) $ 1.55 $ 1.41 $ 4.74 $ 4.17 Free Cash Flow Net cash provided by operating activities 150,772 233,985 789,991 115,068 Less: Purchases of property, equipment and software (17,181) (23,096) (73,428) (50,532) Free Cash Flow $ 133,591 $ 210,889 $ 716,563 $ 64,536 Operating cash flow conversion 81 % 161 % 106 % 24 % Free cash flow conversion 68 % 114 % 117 % 12 % 13

14 NON-GAAP FINANCIAL INFORMATION (Unaudited) 14 (a) Represents the reduction to our provision for claimed costs for years prior to fiscal 2025 recorded during the second quarters of fiscal 2025 and 2024, which resulted in a corresponding increase to revenue, as a result of the Defense Contract Audit Agency's findings related to its audits of our claimed costs for multiple fiscal years. See Note 15, “Commitments and Contingencies,”to the condensed consolidated financial statements in the Company's Form 10-Q for the quarter ended December 31, 2024 for further information. (b) Represents costs associated with the acquisition efforts of the Company related to transactions for which the Company has entered into a letter of intent to acquire a controlling financial interest in the target entity. Transactions primarily include the acquisitions of EverWatch Corp. (“EverWatch”) in fiscal 2023 and PAR Government Systems Corporation (“PGSC”) in fiscal 2025. See Note 5, “Acquisition, Goodwill, and Intangible Assets,” to the condensed consolidated financial statements in the Company's Form 10-Q for the quarter ended December 31, 2024 for further information. (c) Reflects expenses associated with debt financing activities incurred during the second quarter of fiscal 2024. (d) Amortization expense associated with acquired intangibles from significant acquisitions. (e) Reserve associated with the U.S. Department of Justice's investigation of the Company. See Note 20, “Commitments and Contingencies,” to the consolidated financial statements contained within the Annual Report on Form 10-K for the fiscal year ended March 31, 2024 for further information. (f) Reflects insurance recoveries from claims related to the Company’s fiscal 2024 settlement as described in Note 20, “Commitments and Contingencies,” to the consolidated financial statements contained within the Annual Report on Form 10-K for the fiscal year ended March 31, 2024. (g) Reflects the combination of Interest expense and Other income, net from the condensed consolidated statement of operations. (h) Reflects the tax effect of adjustments at an assumed effective tax rate of 26%, which approximates the blended federal and state tax rates, and consistently excludes the impact of other tax credits and incentive benefits realized. The tax effect of certain discrete items is calculated specifically and may vary from the general 26% rate. The prior period tax effect also includes an adjustment related to the indirect effects of the application of Section 174 of the Tax Cuts and Jobs Act of 2017 ($26.0 million and $22.0 million for the three and nine months ended December 31, 2023, respectively). (i) Excludes adjustments of approximately $1.1 million and $4.1 million of net earnings for the three and nine months ended December 31, 2024, respectively, and approximately $1.2 million and $3.9 million of net earnings for the three and nine months ended December 31, 2023 respectively, associated with the application of the two-class method for computing diluted earnings per share.
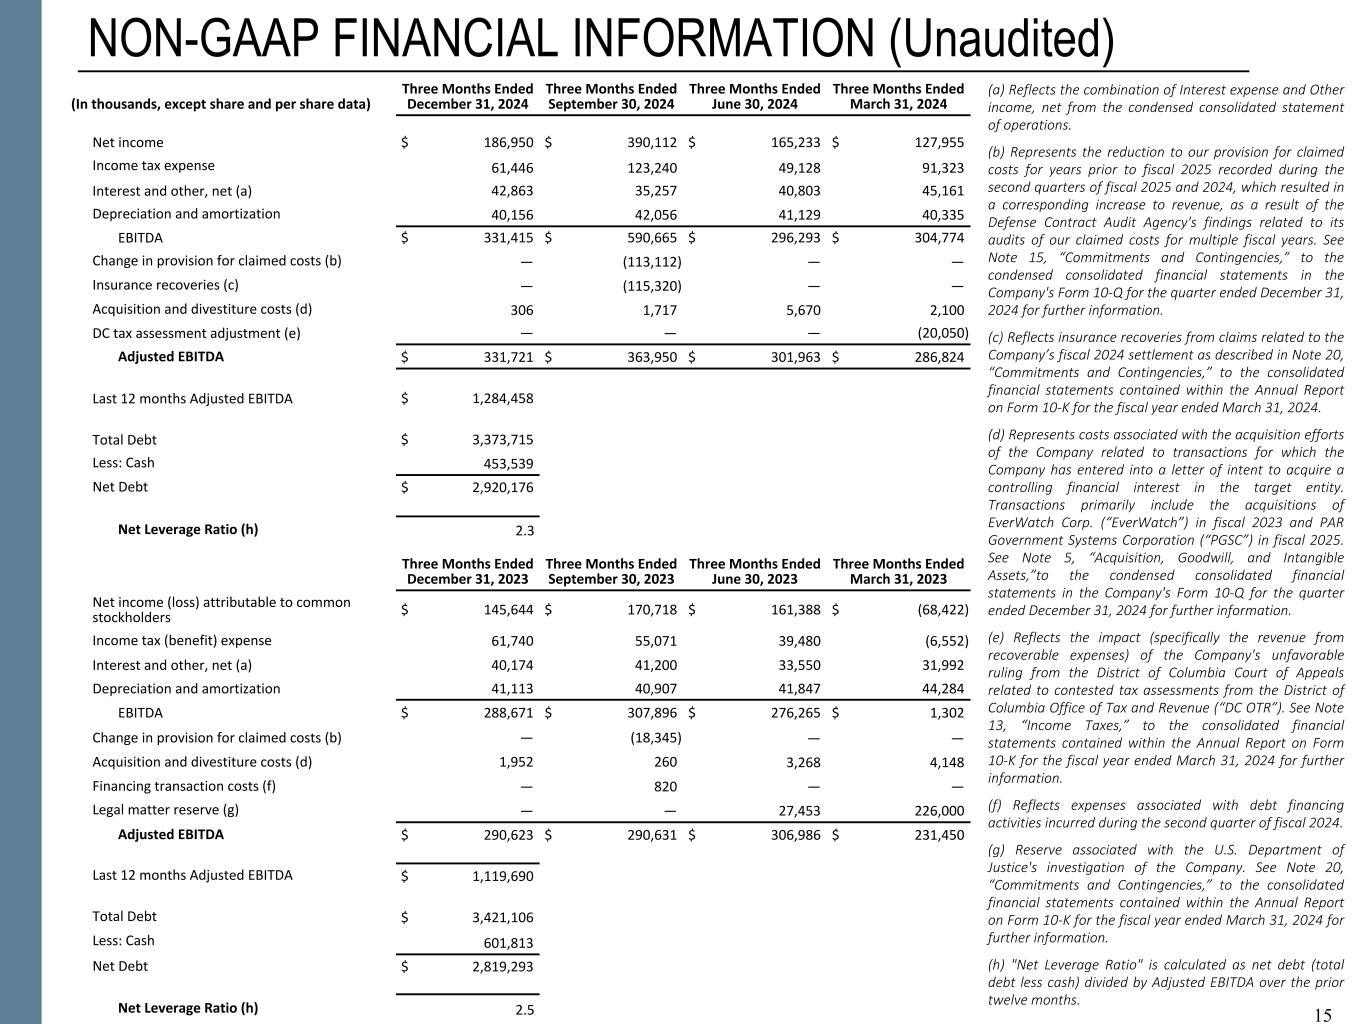
15 NON-GAAP FINANCIAL INFORMATION (Unaudited) (In thousands, except share and per share data) Three Months Ended December 31, 2024 Three Months Ended September 30, 2024 Three Months Ended June 30, 2024 Three Months Ended March 31, 2024 Net income $ 186,950 $ 390,112 $ 165,233 $ 127,955 Income tax expense 61,446 123,240 49,128 91,323 Interest and other, net (a) 42,863 35,257 40,803 45,161 Depreciation and amortization 40,156 42,056 41,129 40,335 EBITDA $ 331,415 $ 590,665 $ 296,293 $ 304,774 Change in provision for claimed costs (b) — (113,112) — — Insurance recoveries (c) — (115,320) — — Acquisition and divestiture costs (d) 306 1,717 5,670 2,100 DC tax assessment adjustment (e) — — — (20,050) Adjusted EBITDA $ 331,721 $ 363,950 $ 301,963 $ 286,824 Last 12 months Adjusted EBITDA $ 1,284,458 Total Debt $ 3,373,715 Less: Cash 453,539 Net Debt $ 2,920,176 Net Leverage Ratio (h) 2.3 Three Months Ended December 31, 2023 Three Months Ended September 30, 2023 Three Months Ended June 30, 2023 Three Months Ended March 31, 2023 Net income (loss) attributable to common stockholders $ 145,644 $ 170,718 $ 161,388 $ (68,422) Income tax (benefit) expense 61,740 55,071 39,480 (6,552) Interest and other, net (a) 40,174 41,200 33,550 31,992 Depreciation and amortization 41,113 40,907 41,847 44,284 EBITDA $ 288,671 $ 307,896 $ 276,265 $ 1,302 Change in provision for claimed costs (b) — (18,345) — — Acquisition and divestiture costs (d) 1,952 260 3,268 4,148 Financing transaction costs (f) — 820 — — Legal matter reserve (g) — — 27,453 226,000 Adjusted EBITDA $ 290,623 $ 290,631 $ 306,986 $ 231,450 Last 12 months Adjusted EBITDA $ 1,119,690 Total Debt $ 3,421,106 Less: Cash 601,813 Net Debt $ 2,819,293 Net Leverage Ratio (h) 2.5 15 (a) Reflects the combination of Interest expense and Other income, net from the condensed consolidated statement of operations. (b) Represents the reduction to our provision for claimed costs for years prior to fiscal 2025 recorded during the second quarters of fiscal 2025 and 2024, which resulted in a corresponding increase to revenue, as a result of the Defense Contract Audit Agency's findings related to its audits of our claimed costs for multiple fiscal years. See Note 15, “Commitments and Contingencies,” to the condensed consolidated financial statements in the Company's Form 10-Q for the quarter ended December 31, 2024 for further information. (c) Reflects insurance recoveries from claims related to the Company’s fiscal 2024 settlement as described in Note 20, “Commitments and Contingencies,” to the consolidated financial statements contained within the Annual Report on Form 10-K for the fiscal year ended March 31, 2024. (d) Represents costs associated with the acquisition efforts of the Company related to transactions for which the Company has entered into a letter of intent to acquire a controlling financial interest in the target entity. Transactions primarily include the acquisitions of EverWatch Corp. (“EverWatch”) in fiscal 2023 and PAR Government Systems Corporation (“PGSC”) in fiscal 2025. See Note 5, “Acquisition, Goodwill, and Intangible Assets,”to the condensed consolidated financial statements in the Company's Form 10-Q for the quarter ended December 31, 2024 for further information. (e) Reflects the impact (specifically the revenue from recoverable expenses) of the Company's unfavorable ruling from the District of Columbia Court of Appeals related to contested tax assessments from the District of Columbia Office of Tax and Revenue (“DC OTR”). See Note 13, “Income Taxes,” to the consolidated financial statements contained within the Annual Report on Form 10-K for the fiscal year ended March 31, 2024 for further information. (f) Reflects expenses associated with debt financing activities incurred during the second quarter of fiscal 2024. (g) Reserve associated with the U.S. Department of Justice's investigation of the Company. See Note 20, “Commitments and Contingencies,” to the consolidated financial statements contained within the Annual Report on Form 10-K for the fiscal year ended March 31, 2024 for further information. (h) "Net Leverage Ratio" is calculated as net debt (total debt less cash) divided by Adjusted EBITDA over the prior twelve months.
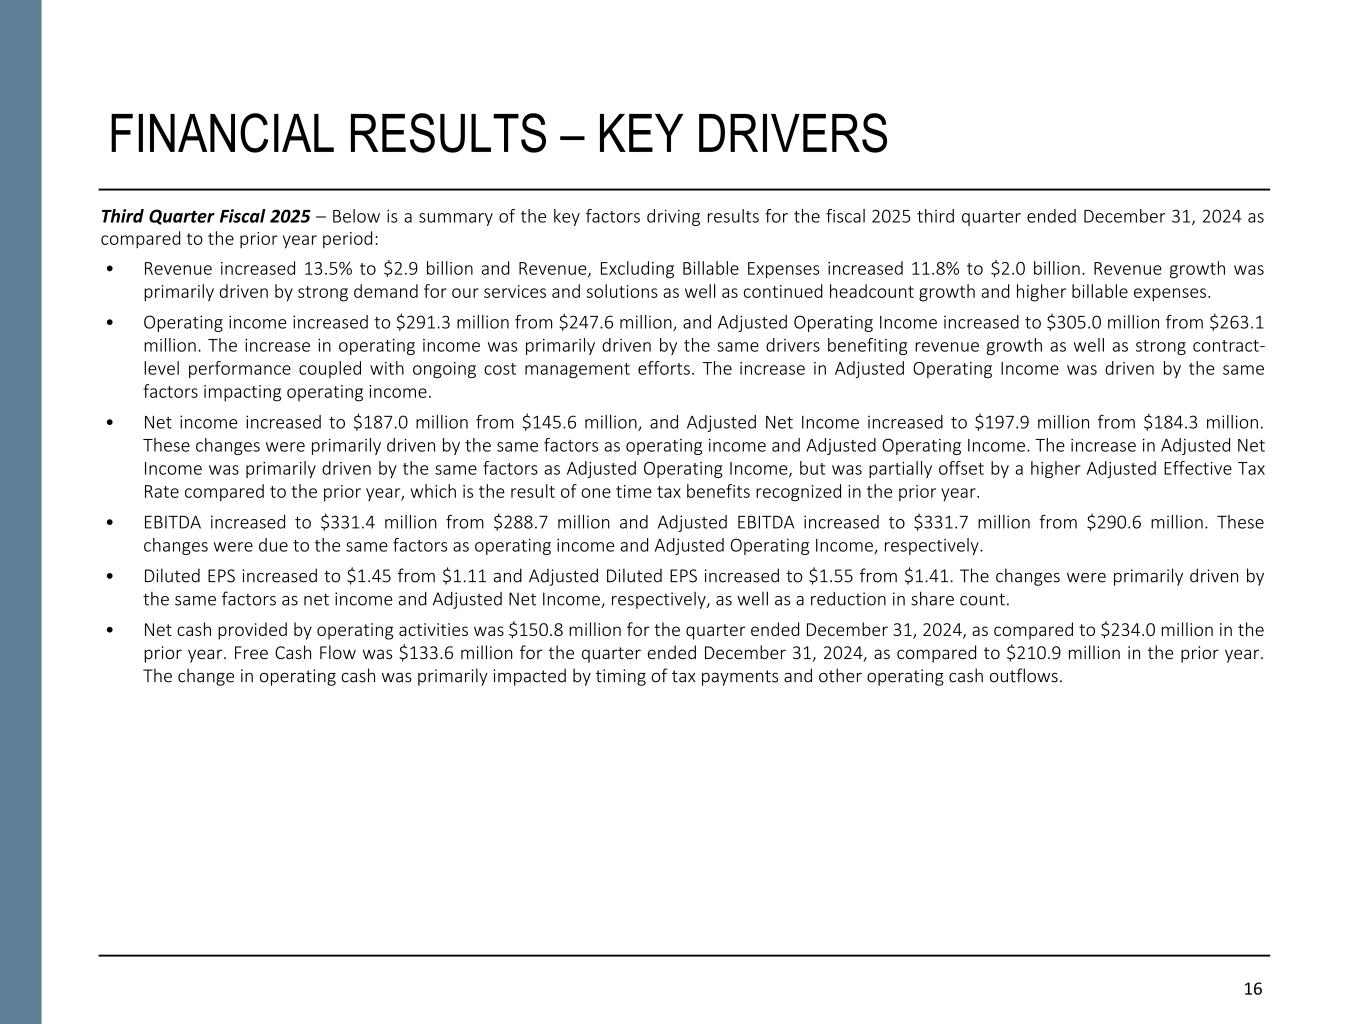
16 FINANCIAL RESULTS – KEY DRIVERS Third Quarter Fiscal 2025 – Below is a summary of the key factors driving results for the fiscal 2025 third quarter ended December 31, 2024 as compared to the prior year period: • Revenue increased 13.5% to $2.9 billion and Revenue, Excluding Billable Expenses increased 11.8% to $2.0 billion. Revenue growth was primarily driven by strong demand for our services and solutions as well as continued headcount growth and higher billable expenses. • Operating income increased to $291.3 million from $247.6 million, and Adjusted Operating Income increased to $305.0 million from $263.1 million. The increase in operating income was primarily driven by the same drivers benefiting revenue growth as well as strong contract- level performance coupled with ongoing cost management efforts. The increase in Adjusted Operating Income was driven by the same factors impacting operating income. • Net income increased to $187.0 million from $145.6 million, and Adjusted Net Income increased to $197.9 million from $184.3 million. These changes were primarily driven by the same factors as operating income and Adjusted Operating Income. The increase in Adjusted Net Income was primarily driven by the same factors as Adjusted Operating Income, but was partially offset by a higher Adjusted Effective Tax Rate compared to the prior year, which is the result of one time tax benefits recognized in the prior year. • EBITDA increased to $331.4 million from $288.7 million and Adjusted EBITDA increased to $331.7 million from $290.6 million. These changes were due to the same factors as operating income and Adjusted Operating Income, respectively. • Diluted EPS increased to $1.45 from $1.11 and Adjusted Diluted EPS increased to $1.55 from $1.41. The changes were primarily driven by the same factors as net income and Adjusted Net Income, respectively, as well as a reduction in share count. • Net cash provided by operating activities was $150.8 million for the quarter ended December 31, 2024, as compared to $234.0 million in the prior year. Free Cash Flow was $133.6 million for the quarter ended December 31, 2024, as compared to $210.9 million in the prior year. The change in operating cash was primarily impacted by timing of tax payments and other operating cash outflows.


