UNITED STATES
SECURITIES AND EXCHANGE COMMISSION
Washington, D.C. 20549
FORM 10-K
 | | |
| x | | ANNUAL REPORT PURSUANT TO SECTION 13 OR 15(d)
OF THE SECURITIES EXCHANGE ACT OF 1934 |
For the fiscal year ended December 31, 2012
OR
| | |
| o | | TRANSITION REPORT PURSUANT TO SECTION 13 OR 15(d)
OF THE SECURITIES EXCHANGE ACT OF 1934 |
For the Transition Period From to
Commission File Number: 0-53856
OCEAN SHORE HOLDING CO.
(Exact name of registrant as specified in its charter)
| | |
| New Jersey | | 80-0282446 |
(State or other jurisdiction of
incorporation or organization) | | (I.R.S. Employer
Identification No.) |
| | |
| 1001 Asbury Avenue, Ocean City, New Jersey | | 08226 |
| (Address of principal executive offices) | | (Zip Code) |
Registrant’s telephone number, including area code: (609) 399-0012
Securities registered pursuant to Section 12(b) of the Act:
| | |
| Title of each class | | Name of each exchange on which registered |
| Common Stock, par value $0.01 per share | | The NASDAQ Stock Market LLC |
Securities registered pursuant to Section 12(g) of the Act: None
Indicate by check mark if the registrant is a well-known seasoned issuer, as defined in Rule 405 of the Securities Act. Yeso Nox
Indicate by check mark if the registrant is not required to file reports pursuant to Section 13 or Section 15(d) of the Act. Yeso Nox
Indicate by check mark whether the registrant (1) has filed all reports required to be filed by Section 13 or 15(d) of the Securities Exchange Act of 1934 during the preceding 12 months (or for such shorter period that the registrant was required to file such reports), and (2) has been subject to such filing requirements for the past 90 days. Yesx Noo
Indicate by check mark whether the registrant has submitted electronically and posted on its corporate Web site, if any, every Interactive Data File required to be submitted and posted pursuant to Rule 405 of Regulation S-T during the preceding 12 months (or for such shorter period that the registrant was required to submit and post such files). Yesx Noo
Indicate by check mark if disclosure of delinquent filers pursuant to Item 405 of Regulation S-K is not contained herein, and will not be contained, to the best of the registrant’s knowledge, in definitive proxy or information statements incorporated by reference in Part III of this Form 10-K or any amendment to this Form 10-K.x
Indicate by check mark whether the registrant is a large accelerated filer, an accelerated filer, a non-accelerated filer or a smaller reporting company. See the definitions of “large accelerated filer” “accelerated filer” and “smaller reporting company” in Rule 12b-2 of the Exchange Act.
| | | | | | |
| Large Accelerated Filer | | o | | Accelerated Filer | | x |
| Non-accelerated Filer | | o | | Smaller Reporting Company | | o |
Indicate by check mark whether the registrant is a shell company (as defined by Rule 12b-2 of the Act).Yeso Nox
The aggregate market value of the common stock held by non-affiliates as of June 29, 2012 was $79,967,770, based on a closing price of $12.75.
The number of shares outstanding of the registrant’s common stock as of March 1, 2013 was 6,954,116.
DOCUMENTS INCORPORATED BY REFERENCE
Portions of the Proxy Statement for the 2013 Annual Meeting of Stockholders are incorporated by reference in Part III of this Form 10-K.
TABLE OF CONTENTS
INDEX
| | |
| | Page |
Part I
| | | | |
Item 1. Business | | | 1 | |
Item 1A. Risk Factors | | | 14 | |
Item 1B. Unresolved Staff Comments | | | 17 | |
Item 2. Properties | | | 17 | |
Item 3. Legal Proceedings | | | 17 | |
Item 4. Mine Safety Disclosure | | | 17 | |
Part II
| | | | |
Item 5. Market for Registrant’s Common Equity, Related Stockholder Matters and Issuer Purchases of Equity Securities | | | 18 | |
Item 6. Selected Financial Data | | | 19 | |
Item 7. Management’s Discussion and Analysis of Financial Condition and
Results of Operations | | | 21 | |
Item 7A. Quantitative and Qualitative Disclosures About Market Risk | | | 43 | |
Item 8. Financial Statements and Supplementary Data | | | 44 | |
Item 9. Changes in and Disagreements With Accountants on Accounting and
Financial Disclosure | | | 92 | |
Item 9A. Controls and Procedures | | | 92 | |
Item 9B. Other Information | | | 92 | |
Part III
| | | | |
Item 10. Directors, Executive Officers and Corporate Governance | | | 93 | |
Item 11. Executive Compensation | | | 93 | |
Item 12. Security Ownership of Certain Beneficial Owners and Management and Related Stockholder Matters | | | 93 | |
Item 13. Certain Relationships and Related Transactions, and Director Independence | | | 94 | |
Item 14. Principal Accountant Fees and Services | | | 94 | |
Part IV
| | | | |
Item 15. Exhibits and Financial Statement Schedules | | | 95 | |
| SIGNATURES | | | 98 | |
i
TABLE OF CONTENTS
PART I
Item 1. BUSINESS
General
Ocean Shore Holding Co. (“Ocean Shore Holding” or the “Company”) is the holding company for Ocean City Home Bank (the “Bank”). The Company’s assets consist of its investment in Ocean City Home Bank and its liquid investments. The Company is primarily engaged in the business of directing, planning, and coordinating the business activities of the Bank. The Company’s most significant asset is its investment in the Bank.
Ocean City Home Bank is a federally chartered savings bank. The Bank operates as a community-oriented financial institution offering a wide range of financial services to consumers and businesses in our market area. The Bank attracts deposits from the general public, small businesses and municipalities and uses those funds to originate a variety of consumer and commercial loans, which we hold primarily for investment.
Our Web site address iswww.ochome.com. We make available on our Web site, free of charge, our annual report on Form 10-K, quarterly reports on Form 10-Q, current reports on Form 8-K and amendments to these reports filed or furnished pursuant to Section 13(a) or 15(d) of the Exchange Act. Information on our Web site should not be considered a part of this Form 10-K.
Market Area
We are headquartered in Ocean City, New Jersey, and serve the southern New Jersey shore communities through a total of twelve full-service offices, of which ten are located in Atlantic County and two in Cape May County. Our markets are in the southeastern corner of New Jersey, approximately 65 miles east of Philadelphia and 130 miles south of New York.
The economy of Atlantic County is dominated by the service sector, of which the gaming industry in nearby Atlantic City is the primary employer. The national economic downturn that began in 2007 has negatively impacted the gaming industry resulting in a reduction in employment. On the brighter side in 2012, one large new casino opened and a $150 million renovation of the former Trump Marina Hotel Casino into the Golden nugget Atlantic City was completed. Several entertainment related developments that continue the trend of transforming Atlantic City from a gambling to an all-inclusive tourist destination are currently in the pipeline. Resorts Hotel and Casino is building a $35 million Jimmy Buffet themed Margaritaville complex. Other ventures include the $21 million makeover of the Steel Pier and the recently proposed construction of a $134 million convention center at Harrah’s Resort Atlantic City. While Ocean City Home Bank is not engaged in lending to the casino industry, the employment or businesses of many of Ocean City Home Bank’s customers directly or indirectly benefit from the industry. Although we have not experienced a significant impact from the downturn in the gaming industry, evidence of the general economic downturn is reflected in the increased level of classified assets, nonperforming loans and charge-offs in our loan portfolio.
The economy of Cape May County is dominated by the tourism industry, as the county’s shore area has been a summer vacation destination for over 100 years. Many visitors maintain second homes in the area which are used seasonally, and there is an active rental market as well as hotels and motels serving other visitors to the area.
Competition
We face significant competition for the attraction of deposits and origination of loans. Our most direct competition for deposits has historically come from the many financial institutions operating in our market area. We also face competition for investors’ funds from money market funds, mutual funds and other corporate and government securities. Our competition for loans comes primarily from financial institutions in our market area and, to a lesser extent, from other financial service providers, such as mortgage companies and mortgage brokers. Competition for loans also comes from non-depository financial service companies that have entered the mortgage market, such as insurance companies, securities companies and specialty finance companies.
1
TABLE OF CONTENTS
Several large banks operate in our market area, including Bank of America, PNC Bank, Wells Fargo & Company, and TD Bank. These institutions are significantly larger than us and, therefore, have significantly greater resources. According to data provided by the Federal Deposit Insurance Corporation, as of June 30, 2012, we had a deposit market share of 10.4% in Atlantic County, which represented the 4th largest deposit market share, respectively, out of 16 banks with offices in the county. In Cape May County, at that same date we had a deposit market share of 9.7%, which represented the 6th largest market share out of 14 banks with offices in the county.
We expect competition to remain intense in the future as a result of continuing legislative, regulatory and technological changes and the continuing trend of consolidation in the financial services industry. Competition for deposits and the origination of loans could limit our growth in the future.
Lending Activities
One- to Four-Family Residential Loans. Our primary lending activity is the origination of mortgage loans to enable borrowers to purchase or refinance existing homes in our market area. We offer fixed-rate and adjustable-rate mortgage loans with terms up to 40 years. Interest rates and payments on our adjustable-rate mortgage loans generally adjust periodically after an initial fixed period that ranges from one to 10 years.
Borrower demand for adjustable-rate loans versus fixed-rate loans is a function of the level of interest rates, the expectations of changes in the level of interest rates, and the difference between the interest rates and loan fees offered for fixed-rate mortgage loans and the initial period interest rates and loan fees for adjustable-rate loans. The relative amount of fixed and adjustable-rate mortgage loans that can be originated at any time is largely determined by the demand for each in a competitive environment. The loan fees charged, interest rates and other provisions of mortgage loans are determined by us on the basis of our own pricing criteria and competitive market conditions.
In order to attract borrowers, we have developed products and policies to provide flexibility in times of changing interest rates. For example, some of our adjustable-rate loans permit the borrower to convert the loan to a fixed-rate loan. In addition, for a fixed fee plus a percentage of the loan amount, we will allow the borrower to modify a loan’s interest rate, term or program to equal the current rate for the desired loan product. We also offer loans that require the payment of interest only for a period of years.
While one- to four-family residential real estate loans are normally originated with up to 40-year terms, such loans typically remain outstanding for substantially shorter periods because borrowers will prepay their loans in full upon sale of the property pledged as security or upon refinancing the original loan. Therefore, average loan maturity is a function of, among other factors, the level of purchase and sale activity in the real estate market, prevailing interest rates and the interest rates payable on outstanding loans.
Because of our location on the South Jersey shore, many of the properties securing our residential mortgages are second homes or rental properties. At December 31, 2012, 38.6% of our one- to four-family mortgage loans were secured by second homes and 13.5% were secured by rental properties. If the property is a second home, our underwriting emphasizes the borrower’s ability to repay the loan out of current income. If the property is a rental property, we focus on the anticipated income from the property. Interest rates on loans secured by rental properties are typically 1/2% higher than comparable loans secured by primary or secondary residences. Although the industry generally considers mortgage loans secured by rental properties or second homes to have a higher risk of default than mortgage loans secured by the borrower’s primary residence, we generally have not experienced credit problems on these types of loans.
We generally do not make conventional loans with loan-to-value ratios exceeding 95% and generally make loans with a loan-to-value ratio in excess of 80% only when secured by first and/or second liens on owner-occupied one- to four-family residences or private mortgage insurance. When the residence securing the loan is not the borrower’s primary residence, loan-to-value ratios are limited to 80% when secured by a first lien or 90% when secured by a first and second lien or private mortgage insurance. We require all properties securing mortgage loans to be appraised by a board-approved independent appraiser. We require title insurance on all first mortgage loans. Borrowers must obtain hazard insurance, and flood insurance for loans on property located in a flood zone, before closing the loan.
2
TABLE OF CONTENTS
In an effort to provide financing for low and moderate income and first-time buyers, we offer special home buyers programs. We offer adjustable-rate residential mortgage loans through these programs to qualified individuals and originate the loans using modified underwriting guidelines, including reduced fees and loan conditions.
We have not originated subprime loans (i.e., mortgage loans aimed at borrowers who do not qualify for market interest rates because of problems with their credit history). We briefly offered “alt-A” loans (i.e., mortgage loans aimed at borrowers with better credit scores who borrow with alternative documentation such as little or no verification of income), but have discontinued that practice and have few such loans in our portfolio.
Commercial and Multi-Family Real Estate Loans. We offer fixed-rate and adjustable-rate mortgage loans secured by commercial real estate. In the past, we originated loans secured by multi-family properties and we still have a few in our portfolio. Our commercial real estate loans are generally secured by condominiums, small office buildings and owner-occupied commercial properties located in our market area.
We originate fixed-rate and adjustable-rate commercial real estate loans for terms up to 20 years. Interest rates and payments on adjustable-rate loans typically adjust every five years after a five-year initial fixed period to a rate typically 3 to 4% above the five-year constant maturity Treasury index. In some instances, there are adjustment period or lifetime interest rate caps. Loans are secured by first mortgages and amounts generally do not exceed 80% of the property’s appraised value.
In reaching a decision on whether to make a commercial real estate loan, we consider the net operating income of the property, the borrower’s expertise, credit history and profitability and the value of the underlying property. In addition, with respect to commercial real estate rental properties, we will also consider the term of the lease and the nature and financial strength of the tenants. We generally require that the properties securing these real estate loans have debt service coverage ratios (the ratio of earnings before debt service to debt service) of at least 1.25x. Environmental surveys are generally required for commercial real estate loans of $500,000 or more.
Construction Loans. We originate loans to individuals and, to a lesser extent, builders to finance the construction of residential dwellings. We also make construction loans for commercial development projects, including condominiums, apartment buildings and owner-occupied properties used for businesses. Our construction loans generally provide for the payment of interest only during the construction phase, which is usually 12 months. At the end of the construction phase, the loan generally converts to a permanent mortgage loan. Loans generally can be made with a maximum loan-to-value ratio of 90% on residential construction and 80% on commercial construction. Before making a commitment to fund a residential construction loan, we require an appraisal of the property by an independent licensed appraiser. We also require an inspection of the property before disbursement of funds during the term of the construction loan.
Commercial Loans. We make commercial business loans to a variety of professionals, sole proprietorships and small businesses in our market area. We offer term loans for capital improvements, equipment acquisition and long-term working capital. These loans are secured by business assets other than real estate, such as business equipment and inventory, and are originated with maximum loan-to-value ratios of 80%. We originate lines of credit to finance the working capital needs of businesses to be repaid by seasonal cash flows or to provide a period of time during which the business can borrow funds for planned equipment purchases. We also offer time notes, letters of credit and loans guaranteed by the Small Business Administration. Time notes are short-term loans and will only be granted on the basis of a defined source of repayment of principal and interest from a specific foreseeable event.
When making commercial business loans, we consider the financial statements of the borrower, the borrower’s payment history of both corporate and personal debt, the debt service capabilities of the borrower, the projected cash flows of the business, the viability of the industry in which the customer operates and the value of the collateral.
Consumer Loans. At December 31, 2012, nearly all of our consumer loans were home equity loans or lines of credit. The small remainder of our consumer loan portfolio consisted of loans secured by passbook or certificate accounts, secured and unsecured personal loans and home improvement loans.
3
TABLE OF CONTENTS
The procedures for underwriting consumer loans include an assessment of the applicant’s payment history on other debts and ability to meet existing obligations and payments on the proposed loan. Although the applicant’s creditworthiness is a primary consideration, the underwriting process also includes a comparison of the value of the collateral, if any, to the proposed loan amount. Home equity lines of credit have adjustable rates of interest that are indexed to the prime rate as reported inThe Wall Street Journal. In 2009 we introduced a rate floor of 4½% on new and renewed lines of credit. Home equity loans are fixed-rate loans. We offer home equity loans with a maximum combined loan-to-value ratio at underwriting of 90% and lines of credit with a maximum loan-to-value ratio of 80%. A home equity line of credit may be drawn down by the borrower for an initial period of ten years from the date of the loan agreement. During this period, the borrower has the option of paying, on a monthly basis, either principal and interest or only interest. After the initial draw period, the line of credit is frozen and the amount outstanding must be repaid over the remaining ten years of the loan term.
Loan Underwriting Risks.
Adjustable-Rate Loans. While we anticipate that adjustable-rate loans will better offset the adverse effects of an increase in interest rates as compared to fixed-rate mortgages, the increased mortgage payments required of adjustable-rate loan borrowers in a rising interest rate environment could cause an increase in delinquencies and defaults. The marketability of the underlying property also may be adversely affected in a high interest rate environment. In addition, although adjustable-rate mortgage loans help make our asset base more responsive to changes in interest rates, the extent of this interest sensitivity is limited by the annual and lifetime interest rate adjustment limits.
Commercial Real Estate Loans. Loans secured by commercial real estate generally have larger balances and involve a greater degree of risk than residential mortgage loans. Of primary concern in commercial real estate lending is the borrower’s creditworthiness and the feasibility and cash flow potential of the project. Payments on loans secured by income properties often depend on the successful operation and management of the properties. As a result, repayment of such loans may be subject to a greater extent than residential real estate loans to adverse conditions in the real estate market or the economy. To monitor cash flows on income properties, we require borrowers and loan guarantors, if any, to provide annual financial statements on commercial real estate loans.
Construction Loans. Construction financing is generally considered to involve a higher degree of risk of loss than long-term financing on improved, occupied real estate. Risk of loss on a construction loan depends largely upon the accuracy of the initial estimate of the property’s value at completion of construction and the estimated cost (including interest) of construction. During the construction phase, a number of factors could result in delays and cost overruns. If the estimate of construction costs proves to be inaccurate, we may be required to advance funds beyond the amount originally committed to permit completion of the building. If the estimate of value proves to be inaccurate, we may be confronted, at or before the maturity of the loan, with a building having a value that is insufficient to assure full repayment. If we are forced to foreclose on a building before or at completion due to a default, there can be no assurance that we will be able to recover all of the unpaid balance of, and accrued interest on, the loan as well as related foreclosure and holding costs.
Commercial Loans. Unlike residential mortgage loans, which generally are made on the basis of the borrower’s ability to make repayment from his or her employment or other income, and which are secured by real property whose value tends to be more easily ascertainable, commercial loans are of higher risk and typically are made on the basis of the borrower’s ability to make repayment from the cash flow of the borrower’s business. As a result, the availability of funds for the repayment of commercial loans may depend substantially on the success of the business itself. Further, any collateral securing such loans may depreciate over time, may be difficult to appraise and may fluctuate in value.
Consumer Loans. Home equity and home improvement loans are generally subject to the same risks as residential mortgage loans. Other consumer loans may entail greater risk than residential mortgage loans, particularly in the case of consumer loans that are unsecured or secured by assets that depreciate rapidly. In such cases, repossessed collateral for a defaulted consumer loan may not provide an adequate source of repayment for the outstanding loan and the remaining deficiency often does not warrant further substantial collection efforts against the borrower. In addition, consumer loan collections depend on the borrower’s
4
TABLE OF CONTENTS
continuing financial stability, and therefore are more likely to be adversely affected by job loss, divorce, illness or personal bankruptcy. Furthermore, the application of various federal and state laws, including federal and state bankruptcy and insolvency laws, may limit the amount that can be recovered on such loans.
Loan Originations, Purchases and Sales. Loan originations come from a number of sources. We have a good working relationship with many realtors in our market area and employ three account executives solely for the purpose of soliciting loans. Our Web site accepts on-line applications and branch personnel are trained to take applications. We also employ four commercial loan officers.
We generally originate loans for portfolio but from time to time will sell residential mortgage loans in the secondary market. Our decision to sell loans is based on prevailing market interest rate conditions and interest rate risk management. We sold no loans in the years ended December 31, 2012, 2011 and 2010. At December 31, 2012, we had no loans held for sale.
During 2012, we purchased $342 thousand in loans through a local mortgage broker. At December 31, 2012, purchased loans totaled $7.9 million.
Loan Approval Procedures and Authority. Our lending activities follow written, non-discriminatory, underwriting standards and loan origination procedures established by our board of directors and management. The board of directors has granted loan approval authority to certain officers up to prescribed limits, depending on the officer’s experience and tenure. The Chief Executive Officer or Chief Lending Officer may combine their lending authority with that of one or more other officers. All extensions of credit that exceed $1.0 million in the aggregate require the approval or ratification of the board of directors.
Loans to One Borrower. The maximum amount that we may lend to one borrower and the borrower’s related entities is generally limited, by regulation, to 15% of our stated capital and reserves. At December 31, 2012, our regulatory limit on loans to one borrower was $14.9 million. At that date, our largest lending relationship was $4.2 million, which consisted of a residential real estate mortgage located in Atlantic County, New Jersey, which was performing according to its original repayment terms at December 31, 2012.
Loan Commitments. We issue commitments for fixed-rate and adjustable-rate mortgage loans conditioned upon the occurrence of certain events. Commitments to originate mortgage loans are legally binding agreements to lend to our customers. Commitments, excluding lines and letters of credit, as of December 31, 2012 totaled $17.4 million.
Investment Activities
We have legal authority to invest in various types of liquid assets, including U.S. Treasury obligations, securities of various federal agencies and of state and municipal governments, mortgage-backed securities and certificates of deposit of federally insured institutions. Within certain regulatory limits, we also may invest a portion of our assets in corporate securities and mutual funds. We also are required to maintain an investment in Federal Home Loan Bank of New York stock. While we have the authority under applicable law and our investment policies to invest in derivative securities, we had no such investments at December 31, 2012.
Our investment objectives are to provide and maintain liquidity, to provide collateral for pledging requirements, to establish an acceptable level of interest rate and credit risk, to provide an alternate source of low-risk investments when demand for loans is weak and to generate a favorable return. Our board of directors has the overall responsibility for the investment portfolio, including approval of the investment policy and appointment of the Investment Committee. The Investment Committee consists of the Chief Executive Officer and Chief Financial Officer. The Investment Committee is responsible for implementation of the investment policy and monitoring our investment performance. Individual investment transactions are reviewed and approved by the board of directors on a monthly basis, while portfolio composition and performance are reviewed at least quarterly by the Investment Committee.
At December 31, 2012, 48.9% of our investment portfolio consisted of mortgage-backed securities issued primarily by government sponsored enterprises (“GSE”) Fannie Mae, Freddie Mac and Ginnie Mae. None of our mortgage-backed securities had underlying collateral that would be considered subprime (i.e., mortgage loans advanced to borrowers who do not qualify for market interest rates because of problems with their credit history). All mortgage-backed securities owned by us as of December 31, 2012 possessed the highest
5
TABLE OF CONTENTS
possible investment credit rating at that date. The remainder of the portfolio consisted primarily of corporate securities, U.S. agency securities and municipal securities.
Deposit Activities and Other Sources of Funds
General. Deposits, borrowings and loan repayments are the major sources of our funds for lending and other investment purposes. Loan repayments are a relatively stable source of funds, while deposit inflows and outflows and loan prepayments are significantly influenced by general interest rates and money market conditions.
Deposit Accounts. Substantially all of our depositors are residents of New Jersey. Deposits are attracted from within our market area through the offering of a broad selection of deposit instruments, including noninterest-bearing demand accounts (such as money market accounts), regular savings accounts and certificates of deposit. Deposit account terms vary according to the minimum balance required, the time periods the funds must remain on deposit and the interest rate, among other factors. In determining the terms of our deposit accounts, we consider the rates offered by our competition, our liquidity needs, profitability to us, matching deposit and loan products and customer preferences and concerns. We generally review our deposit mix and pricing weekly. Our current strategy is to offer competitive rates on certificates of deposit and stress our high level of service and technology. At December 31, 2012, we did not have any brokered deposits.
In addition to accounts for individuals, we also offer a variety of deposit accounts designed for the businesses operating in our market area. Our business banking deposit products include commercial checking accounts, a sweep account, and special accounts for realtors, attorneys and non-profit organizations. The promotion of commercial deposit accounts is an important part of our effort to increase our core deposits and reduce our funding costs. At December 31, 2012, commercial deposits totaled $168.3 million, or 21.0% of total deposits.
Since 1996, we have offered deposit services to municipalities and local school boards in our market area. At December 31, 2012, we had $157.6 million in deposits from 10 municipalities and 16 school boards, all in the form of checking accounts. We emphasize high levels of service in order to attract and retain these accounts. Municipal deposit accounts differ from business accounts in that we pay interest on those deposits and we pledge collateral (typically investment securities), in accordance with the requirements of New Jersey’s Governmental Unit Deposit Protection Act, with the New Jersey Department of Banking to secure the portion of the deposits that are not covered by federal deposit insurance. Unlike time deposits by municipalities, which often move from bank to bank in search of the highest available rate, checking accounts tend to be stable relationships.
Borrowings. We utilize advances from the Federal Home Loan Bank of New York and securities sold under agreements to repurchase to supplement our supply of investable funds and to meet deposit withdrawal requirements. The Federal Home Loan Bank functions as a central reserve bank providing credit for member financial institutions. As a member, we are required to own capital stock in the Federal Home Loan Bank and are authorized to apply for advances on the security of such stock and certain mortgage loans and other assets (principally securities which are obligations of, or guaranteed by, the United States), provided certain standards related to creditworthiness have been met. Advances are made under several different programs, each having its own interest rate and range of maturities. Depending on the program, limitations on the amount of advances are based either on a fixed percentage of an institution’s net worth or on the Federal Home Loan Bank’s assessment of the institution’s creditworthiness. Under its current credit policies, the Federal Home Loan Bank generally limits advances to 30% of a member’s assets using mortgage collateral and an additional 20% using pledged securities for a total maximum indebtedness of 50% of assets. The Federal Home Loan Bank determines specific lines of credit for each member institution.
Personnel
As of December 31, 2012 we had 151 full-time employees and 45 part-time employees, none of whom is represented by a collective bargaining unit. We believe our relationship with our employees is good.
Subsidiaries
Ocean Shore Holding’s only subsidiary is Ocean City Home Bank.
6
TABLE OF CONTENTS
Ocean City Home Bank’s only active subsidiary is Seashore Financial Services, LLC. Seashore Financial Services receives commissions from referrals for the sale of insurance and investment products.
EXECUTIVE OFFICERS OF THE REGISTRANT
The Board of Directors annually elects the executive officers of Ocean Shore Holding and Ocean City Home Bank, who serve at the Board’s discretion. Our executive officers are:
| | |
| Name | | Position |
| Steven E. Brady | | President and Chief Executive Officer of Ocean Shore Holding and
Ocean City Home Bank |
| Anthony J. Rizzotte | | Executive Vice President of Ocean Shore Holding and Executive Vice President and Chief Lending Officer of Ocean City Home Bank |
| Kim Davidson | | Executive Vice President of Ocean City Home Bank and Corporate Secretary of Ocean Shore Holding and Ocean City Home Bank |
| Janet Bossi | | Executive Vice President of Loan Administration of Ocean City Home Bank |
| Paul Esposito | | Senior Vice President of Operations of Ocean City Home Bank |
| Donald F. Morgenweck | | Senior Vice President and Chief Financial Officer of Ocean Shore Holding and Ocean City Home Bank |
Below is information regarding our executive officers who are not also directors. Each executive officer has held his or her current position for at least the last five years. Ages presented are as of December 31, 2012.
Anthony J. Rizzotte has been Executive Vice President and Chief Lending Officer of Ocean City Home Bank and Vice President of Ocean Shore Holding since 1991. Mr. Rizzotte was named Executive Vice President of Ocean Shore Holding in 2004. Age 57.
Kim Davidson has been the Executive Vice President of Ocean City Home Bank since 2005, prior to which she served as the Senior Vice President of Business Development of Ocean City Home Bank since 2001. She has also served as the Corporate Secretary of Ocean Shore Holding and Ocean City Home Bank since 2004. Prior to becoming a senior vice president, Ms. Davidson was a vice president of Ocean City Home Bank. Age 52.
Janet Bossi has been the Executive Vice President of Loan Administration of Ocean City Home Bank since December 2012. Prior to becoming an executive vice president, Ms. Bossi was a senior vice president of Ocean City Home Bank. Age 46.
Paul Esposito has been the Senior Vice President of Operations of Ocean City Home Bank since 1999. Prior to becoming a senior vice president, Mr. Esposito was a vice president of Ocean City Home Bank. Age 63.
Donald F. Morgenweck has been Senior Vice President and Chief Financial Officer of Ocean City Home Bank and Vice President of Ocean Shore Holding since March 2001. Mr. Morgenweck was named Senior Vice President and Chief Financial Officer of Ocean Shore Holding in 2004. Prior to joining Ocean City Home Bank, Mr. Morgenweck was a Vice President at Summit Bank. Age 58.
REGULATION AND SUPERVISION
General
Ocean City Home Bank, as a federal savings association, is currently subject to extensive regulation, examination and supervision by the Office of the Comptroller of the Currency, as its primary federal regulator, and by the Federal Deposit Insurance Corporation as the insurer of its deposits. Ocean City Home Bank is a member of the Federal Home Loan Bank System and its deposit accounts are insured up to applicable limits by the Deposit Insurance Fund of the Federal Deposit Insurance Corporation. Ocean City Home Bank must file reports with the Office of the Comptroller of the Currency concerning its activities and financial condition in addition to obtaining regulatory approvals before entering into certain transactions such as mergers with, or
7
TABLE OF CONTENTS
acquisitions of, other financial institutions. There are periodic examinations by the Office of the Comptroller of the Currency to evaluate Ocean City Home Bank’s safety and soundness and compliance with various regulatory requirements. This regulatory structure is intended primarily for the protection of the insurance fund and depositors. The regulatory structure also gives the regulatory authorities extensive discretion in connection with their supervisory and enforcement activities and examination policies, including policies with respect to the classification of assets and the establishment of an adequate allowance for loan losses for regulatory purposes. Any change in such policies, whether by the Office of the Comptroller of the Currency, the Federal Deposit Insurance Corporation or Congress, could have a material adverse effect on Ocean Shore Holding and Ocean City Home Bank and their operations.
The Dodd-Frank Wall Street Reform and Consumer Protection Act of 2010 (the “Dodd-Frank Act”) made extensive changes to the regulation of Ocean City Home Bank. Under the Dodd-Frank Act, the Office of Thrift Supervision was eliminated and responsibility for the supervision and regulation of federal savings associations such as Ocean City Home Bank was transferred to the Office of the Comptroller of the Currency on July 21, 2011. The Office of the Comptroller of the Currency is the agency that is primarily responsible for the regulation and supervision of national banks. Additionally, the Dodd-Frank Act created a new Consumer Financial Protection Bureau as an independent bureau of the Federal Reserve Board. The Consumer Financial Protection Bureau assumed responsibility for the implementation of the federal financial consumer protection and fair lending laws and regulations and has authority to impose new requirements. However, institutions of less than $10 billion in assets, such as Ocean City Home Bank, will continue to be examined for compliance with consumer protection and fair lending laws and regulations by, and be subject to the enforcement authority of, their prudential regulators.
Certain of the regulatory requirements that are applicable to Ocean City Home Bank and Ocean Shore Holding are described below. This description of statutes and regulations is not intended to be a complete explanation of such statutes and regulations and their effects on Ocean City Home Bank and Ocean Shore Holding.
Capital Requirements
The applicable capital regulations require savings associations to meet three minimum capital standards: a 1.5% tangible capital to total assets ratio, a 4% Tier 1 capital to total assets leverage ratio (3% for institutions receiving the highest rating on the CAMELS examination rating system) and an 8% risk-based capital ratio. In addition, the prompt corrective action standards discussed below also establish, in effect, a minimum 2% tangible capital standard, a 4% leverage ratio (3% for institutions receiving the highest rating on the CAMELS system) and, together with the risk-based capital standard itself, a 4% Tier 1 risk-based capital standard. The regulations also require that, in meeting the tangible, leverage and risk- based capital standards, institutions must generally deduct investments in and loans to subsidiaries engaged in activities as principal that are not permissible for a national bank.
The risk-based capital standard for savings associations requires the maintenance of Tier 1 (core) and total capital (which is defined as core capital and supplementary capital less certain specified deductions from total capital such as reciprocal holdings of depository institution capital instruments and equity investments) to risk-weighted assets of at least 4% and 8%, respectively. In determining the amount of risk-weighted assets, all assets, including certain off-balance sheet activities, recourse obligations, residual interests and direct credit substitutes, are multiplied by a risk-weight factor assigned by the capital regulation based on the risks believed inherent in the type of asset. Tier 1 (core) capital is generally defined as common stockholders’ equity (including retained earnings), certain noncumulative perpetual preferred stock and related surplus and minority interests in equity accounts of consolidated subsidiaries, less intangibles other than certain mortgage servicing rights and credit card relationships. The components of supplementary capital (Tier 2 capital) include cumulative preferred stock, long-term perpetual preferred stock, mandatory convertible debt securities, subordinated debt and intermediate preferred stock, the allowance for loan and lease losses limited to a maximum of 1.25% of risk-weighted assets and up to 45% of unrealized gains on available-for-sale equity securities with readily determinable fair market values. Overall, the amount of supplementary capital included as part of total capital cannot exceed 100% of core capital.
8
TABLE OF CONTENTS
The Office of the Comptroller of the Currency also has authority to establish individual minimum capital requirements in appropriate cases upon a determination that an institution’s capital level is or may become inadequate in light of the particular risks or circumstances. At December 31, 2012, Ocean City Home Bank met each of its capital requirements.
Savings and loan holding companies are not currently subject to specific regulatory capital requirements. The Dodd-Frank Act, however, requires the Federal Reserve Board to promulgate consolidated capital requirements for depository institution holding companies, including savings and loan holding companies, that are no less stringent, both quantitatively and in terms of components of capital, than those applicable to institutions themselves. On August 30, 2012, the federal banking agencies issued proposed rules that would implement the “Basel III” regulatory capital reforms and changes required by the Dodd-Frank Act. “Basel III” refers to two consultative documents released by the Basel Committee on Banking Supervision in December 2009, the rules text released in December 2010, and loss absorbency rules issued in January 2011, which include significant changes to bank capital, leverage and liquidity requirements.
The proposed rules include new risk-based capital and leverage ratios, which would be phased in from 2013 to 2019, and would revise the definition of what constitutes “capital” for purposes of calculating those ratios. The proposed new minimum capital level requirements applicable to Ocean Shore Holding and Ocean City Home Bank under the proposals would be: (i) a new common equity Tier 1 capital ratio of 4.5%; (ii) a Tier 1 capital ratio of 6% (increased from 4%); (iii) a total capital ratio of 8% (unchanged from current rules); and (iv) a Tier 1 leverage ratio of 4% for all institutions. The proposed rules would eliminate the inclusion of certain instruments, such as trust preferred securities, from tier 1 capital. Instruments issued prior to May 19, 2010 will be grandfathered for companies with consolidated assets of $15 billion or less and phased out over a period of 10 years ending in 2022. The proposed rules would also establish a “capital conservation buffer” of 2.5% above the new regulatory minimum capital requirements, which must consist entirely of common equity Tier 1 capital and would result in the following minimum ratios: (i) a common equity Tier 1 capital ratio of 7.0%, (ii) a Tier 1 capital ratio of 8.5%, and (iii) a total capital ratio of 10.5%. The new capital conservation buffer requirement would be phased in beginning in January 2016 at 0.625% of risk-weighted assets and would increase by that amount each year until fully implemented in January 2019. An institution would be subject to limitations on paying dividends, engaging in share repurchases, and paying discretionary bonuses if its capital level falls below the buffer amount. These limitations would establish a maximum percentage of eligible retained income that could be utilized for such actions.
Federal Banking Regulation
Business Activities. The activities of federal savings banks, such as Ocean City Home Bank, are governed by federal laws and regulations. Those laws and regulations delineate the nature and extent of the business activities in which federal savings banks may engage. In particular, certain lending authority for federal savings banks, e.g., commercial, non-residential real property loans and consumer loans, is limited to a specified percentage of the institution’s capital or assets.
Prompt Corrective Regulatory Action. Prompt corrective action regulations provide five classifications: well capitalized, adequately capitalized, undercapitalized, significantly undercapitalized and critically undercapitalized, although these terms are not used to represent overall financial condition. If adequately capitalized, regulatory approval is required to accept broker deposits. The Office of the Comptroller of the Currency is required to take certain supervisory actions against undercapitalized institutions, the severity of which depends upon the institution’s degree of undercapitalization. In addition, numerous mandatory supervisory actions become immediately applicable to an undercapitalized institution, including, but not limited to, increased monitoring by regulators and restrictions on growth, capital distributions and expansion. The Office of the Comptroller of the Currency could also take any one of a number of discretionary supervisory actions, including the issuance of a capital directive and the replacement of senior executive officers and directors. Significantly and critically undercapitalized institutions are subject to additional mandatory and discretionary measures.
Insurance of Deposit Accounts. Ocean City Home Bank’s deposits are insured up to applicable limits by the Deposit Insurance Fund of the Federal Deposit Insurance Corporation. Under the Federal Deposit Insurance Corporation’s existing risk-based assessment system, insured institutions are assigned to one of four
9
TABLE OF CONTENTS
risk categories based on supervisory evaluations, regulatory capital levels and certain other factors, with less risky institutions paying lower assessments. An institution’s assessment rate depends upon the category to which it is assigned. Assessment rates range from seven to 77.5 basis points on the institution’s assessment base, which is calculated as total assets minus tangible equity.
Deposit insurance per account owner is currently $250,000. The Federal Deposit Insurance Corporation adopted an optional Temporary Liquidity Guarantee Program by which, for a fee, non-interest bearing transaction accounts would receive unlimited insurance coverage until December 31, 2010, which was later extended to December 31, 2012. Ocean City Home Bank opted to participate in the unlimited coverage for noninterest bearing transaction accounts.
The Federal Deposit Insurance Corporation has authority to increase insurance assessments. A significant increase in insurance premiums would likely have an adverse effect on the operating expenses and results of operations of Ocean City Home Bank. Management cannot predict what insurance assessment rates will be in the future.
Loans to One Borrower. Federal law provides that savings associations are generally subject to the limits on loans to one borrower applicable to national banks. Generally, subject to certain exceptions, a savings association may not make a loan or extend credit to a single or related group of borrowers in excess of 15% of its unimpaired capital and surplus. An additional amount may be lent, equal to 10% of unimpaired capital and surplus, if secured by specified readily-marketable collateral.
Qualified Thrift Lender Test. Federal law requires savings associations to meet a qualified thrift lender test. Under the test, a savings association is required to either qualify as a “domestic building and loan association” under the Internal Revenue Code or maintain at least 65% of its “portfolio assets” (total assets less: (i) specified liquid assets up to 20% of total assets; (ii) intangibles, including goodwill; and (iii) the value of property used to conduct business) in certain “qualified thrift investments” (primarily residential mortgages and related investments, including certain mortgage-backed securities but also including education, credit card and small business loans) in at least nine months out of each 12-month period.
A savings association that fails the qualified thrift lender test is subject to certain operating restrictions, including dividend limitations. The Dodd-Frank Act made noncompliance with the qualified thrift lender test a violation of law that could result in an enforcement action. As of December 31, 2012, Ocean City Home Bank maintained 83.7% of its portfolio assets in qualified thrift investments and, therefore, met the qualified thrift lender test.
Limitation on Capital Distributions. Federal regulations impose limitations upon all capital distributions by a savings association, including cash dividends, payments to repurchase its shares and payments to shareholders of another institution in a cash-out merger. Under the regulations, an application to and the prior approval of the Office of the Comptroller of the Currency is required before any capital distribution if the institution does not meet the criteria for “expedited treatment” of applications under Office of the Comptroller of the Currency regulations (i.e., generally, examination and Community Reinvestment Act ratings in the two top categories), the total capital distributions for the calendar year exceed net income for that year plus the amount of retained net income for the preceding two years, the institution would be undercapitalized following the distribution or the distribution would otherwise be contrary to a statute, regulation or agreement with the Office of the Comptroller of the Currency. If an application is not required, the institution must still provide 30 days prior written notice to the Board of Governors of the Federal Reserve System of the capital distribution if, like Ocean City Home Bank, it is a subsidiary of a holding company, as well as an informational notice filing to the Office of the Comptroller of the Currency. If Ocean City Home Bank’s capital ever fell below its regulatory requirements or the Office of the Comptroller of the Currency notified it that it was in need of increased supervision, its ability to make capital distributions could be restricted. In addition, the Office of the Comptroller of the Currency could prohibit a proposed capital distribution by any institution, which would otherwise be permitted by the regulation, if the Office of the Comptroller of the Currency determines that such distribution would constitute an unsafe or unsound practice.
10
TABLE OF CONTENTS
Community Reinvestment Act. All federal savings associations have a responsibility under the Community Reinvestment Act and related regulations to help meet the credit needs of their communities, including low- and moderate-income neighborhoods. An institution’s failure to satisfactorily comply with the provisions of the Community Reinvestment Act could result in denials of regulatory applications. Responsibility for administering the Community Reinvestment Act, unlike other fair lending laws, is not being transferred to the Consumer Financial Protection Bureau. Ocean City Home Bank received a “satisfactory” Community Reinvestment Act rating in its most recently completed examination.
Transactions with Related Parties. Federal law limits Ocean City Home Bank’s authority to engage in transactions with “affiliates” (e.g., any entity that controls or is under common control with Ocean City Home Bank, including Ocean Shore Holding and their other subsidiaries). The aggregate amount of covered transactions with any individual affiliate is limited to 10% of the capital and surplus of the savings association. The aggregate amount of covered transactions with all affiliates is limited to 20% of the savings association’s capital and surplus. Certain transactions with affiliates are required to be secured by collateral in an amount and of a type specified by federal law. The purchase of low quality assets from affiliates is generally prohibited. Transactions with affiliates must generally be on terms and under circumstances that are at least as favorable to the institution as those prevailing at the time for comparable transactions with non-affiliated companies. In addition, savings associations are prohibited from lending to any affiliate that is engaged in activities that are not permissible for bank holding companies and no savings association may purchase the securities of any affiliate other than a subsidiary.
The Sarbanes-Oxley Act of 2002 generally prohibits loans by Ocean Shore Holding to its executive officers and directors. However, the law contains a specific exception for loans by a depository institution to its executive officers and directors in compliance with federal banking laws. Under such laws, Ocean City Home Bank’s authority to extend credit to executive officers, directors and 10% shareholders (“insiders”), as well as entities such persons control, is limited. The laws limit both the individual and aggregate amount of loans that Ocean City Home Bank may make to insiders based, in part, on Ocean City Home Bank’s capital level and requires that certain board approval procedures be followed. Such loans are required to be made on terms substantially the same as those offered to unaffiliated individuals and not involve more than the normal risk of repayment. There is an exception for loans made pursuant to a benefit or compensation program that is widely available to all employees of the institution and does not give preference to insiders over other employees. Loans to executive officers are subject to additional limitations based on the type of loan involved.
Enforcement. The Office of the Comptroller of the Currency currently has primary enforcement responsibility over savings associations and has authority to bring actions against the institution and all institution-affiliated parties, including shareholders, and any attorneys, appraisers and accountants who knowingly or recklessly participate in wrongful actions likely to have an adverse effect on an insured institution. Formal enforcement action may range from the issuance of a capital directive or cease and desist order to removal of officers and/or directors to institution of receivership, conservatorship or termination of deposit insurance. Civil penalties cover a wide range of violations and can amount to $25,000 per day, or even $1 million per day in especially egregious cases. The Federal Deposit Insurance Corporation has the authority to recommend to the Office of the Comptroller of the Currency that enforcement action be taken with respect to a particular savings association. If action is not taken by the Office of the Comptroller of the Currency, the Federal Deposit Insurance Corporation has authority to take such action under certain circumstances. Federal law also establishes criminal penalties for certain violations.
Federal Home Loan Bank System. Ocean City Home Bank is a member of the Federal Home Loan Bank System, which consists of 12 regional Federal Home Loan Banks. The Federal Home Loan Bank provides a central credit facility primarily for member institutions. Ocean City Home Bank, as a member of the Federal Home Loan Bank of New York, is required to acquire and hold shares of capital stock in that Federal Home Loan Bank. Ocean City Home Bank was in compliance with this requirement with an investment in Federal Home Loan Bank of New York stock at December 31, 2012 of $6.4 million.
11
TABLE OF CONTENTS
Federal Reserve Board System. The Federal Reserve Board regulations require savings associations to maintain non-interest earning reserves against their transaction accounts (primarily Negotiable Order of Withdrawal (NOW) and regular checking accounts). For 2013, the regulations provided that reserves be maintained against aggregate transaction accounts as follows: a 3% reserve ratio is assessed on net transaction accounts up to and including $71.0 million; a 10% reserve ratio is applied above $71.0 million. The first $11.5 million of otherwise reservable balances (subject to adjustments by the Federal Reserve Board) are exempted from the reserve requirements. The amounts are adjusted annually and, for 2013, require a 3% ratio for up to $79.5 million and an exemption of $12.4 million. Ocean City Home Bank complies with the foregoing requirements.
Other Regulations
Ocean City Home Bank’s operations are also subject to federal laws applicable to credit transactions, including the:
| • | Truth-In-Lending Act, governing disclosures of credit terms to consumer borrowers; |
| • | Home Mortgage Disclosure Act of 1975, requiring financial institutions to provide information to enable the public and public officials to determine whether a financial institution is fulfilling its obligation to help meet the housing needs of the community it serves; |
| • | Equal Credit Opportunity Act, prohibiting discrimination on the basis of race, creed or other prohibited factors in extending credit; |
| • | Fair Credit Reporting Act of 1978, governing the use and provision of information to credit reporting agencies; |
| • | Fair Debt Collection Act, governing the manner in which consumer debts may be collected by collection agencies; and rules and regulations of the various federal agencies charged with the responsibility of implementing such federal laws. |
The operations of Ocean City Home Bank also are subject to laws such as the:
| • | Right to Financial Privacy Act, which imposes a duty to maintain confidentiality of consumer financial records and prescribes procedures for complying with administrative subpoenas of financial records; |
| • | Electronic Funds Transfer Act and Regulation E promulgated thereunder, which govern automatic deposits to and withdrawals from deposit accounts and customers’ rights and liabilities arising from the use of automated teller machines and other electronic banking services; and |
| • | Check Clearing for the 21st Century Act (also known as “Check 21”), which gives “substitute checks,” such as digital check images and copies made from that image, the same legal standing as the original paper check. |
Holding Company Regulation
General. As a savings and loan holding company, Ocean Shore Holding is subject to Federal Reserve Board regulations, examinations, supervision, reporting requirements and regulations regarding its activities. In addition, the Federal Reserve Board has enforcement authority over Ocean Shore Holding and its non-savings institution subsidiaries. Among other things, this authority permits the Federal Reserve Board to restrict or prohibit activities that are determined to be a serious risk to Ocean City Home Bank.
Ocean Shore Holding is a unitary savings and loan holding company within the meaning of federal law. As a unitary savings and loan holding company that was in existence prior to May 4, 1999, Ocean Shore Holding is generally not restricted as to the types of business activities in which it may engage, provided that Ocean City Home Bank continues to be a qualified thrift lender.
Federal law prohibits a savings and loan holding company from, directly or indirectly or through one or more subsidiaries, acquiring more than 5% of the voting stock of another savings association, or savings and loan holding company thereof, without prior written approval of the Federal Reserve Board or from acquiring or retaining, with certain exceptions, more than 5% of a non-subsidiary holding company or savings
12
TABLE OF CONTENTS
association. A savings and loan holding company is also prohibited from acquiring more than 5% of a company engaged in activities other than those authorized by federal law or acquiring or retaining control of a depository institution that is not insured by the FDIC. In evaluating applications by holding companies to acquire savings associations, the Federal Reserve Board must consider the financial and managerial resources and future prospects of the company and institution involved, the effect of the acquisition on the risk to the insurance funds, the convenience and needs of the community and competitive factors.
The Federal Reserve Board is prohibited from approving any acquisition that would result in a multiple savings and loan holding company controlling savings associations in more than one state, except: (i) the approval of interstate supervisory acquisitions by savings and loan holding companies; and (ii) the acquisition of a savings association in another state if the laws of the state of the target savings association specifically permit such acquisitions. The states vary in the extent to which they permit interstate savings and loan holding company acquisitions.
Source of Strength. The Dodd-Frank Act also extends the “source of strength” doctrine to savings and loan holding companies. The regulatory agencies must promulgate regulations implementing the “source of strength” policy that holding companies act as a source of strength to their subsidiary depository institutions by providing capital, liquidity and other support in times of financial stress.
Dividends. The FRB has the power to prohibit dividends by savings and loan holding companies if their actions constitute unsafe or unsound practices. The FRB has issued a policy statement on the payment of cash dividends by bank holding companies, which also applies to savings and loan holding companies and which expresses the FRB’s view that a holding company should pay cash dividends only to the extent that the company’s net income for the past year is sufficient to cover both the cash dividends and a rate of earnings retention that is consistent with the company’s capital needs, asset quality and overall financial condition. The FRB also indicated that it would be inappropriate for a holding company experiencing serious financial problems to borrow funds to pay dividends. Under the prompt corrective action regulations, the FRB may prohibit a bank holding company from paying any dividends if the holding company’s bank subsidiary is classified as “undercapitalized.”
Acquisition of Ocean Shore Holding. Under the Federal Change in Bank Control Act, a notice must be submitted to the Federal Reserve Board if any person (including a company), or group acting in concert, seeks to acquire direct or indirect “control” of a savings and loan holding company or savings association. Under certain circumstances, a change of control may occur, and prior notice is required, upon the acquisition of 10% or more of the outstanding voting stock of the company or institution, unless the Federal Reserve Board has found that the acquisition will not result in a change of control of Ocean Shore Holding. Under the Change in Control Act, the Federal Reserve Board generally has 60 days from the filing of a complete notice to act, taking into consideration certain factors, including the financial and managerial resources of the acquirer and the anti-trust effects of the acquisition. Any company that acquires control would then be subject to regulation as a savings and loan holding company.
13
TABLE OF CONTENTS
The current economic conditions pose significant challenges that could adversely affect our financial condition and results of operations.
Our success depends to a large degree on the general economic conditions in Atlantic and Cape May Counties, New Jersey. Our market has experienced a significant downturn in which we have seen falling home prices, rising foreclosures and an increased level of commercial and consumer delinquencies. If economic conditions do not improve or continue to decline, we could experience any of the following consequences, each of which could further adversely affect our business:
| • | demand for our products and services could decline; |
| • | problem assets and foreclosures may increase; and |
| • | loan losses may increase. |
We could experience further adverse consequences in the event of a prolonged economic downturn in our market due to our exposure to commercial loans across various lines of business. A prolonged economic downturn could adversely affect collateral values or cash flows of the borrowing businesses, and as a result our primary source of repayment could be insufficient to service the debt. Another adverse consequence in the event of a prolonged economic downturn in our market could be the loss of collateral value on commercial and real estate loans that are secured by real estate located in our market area. A further significant decline in real estate values in our market would mean that the collateral for many of our loans would provide less security. As a result, we would be more likely to suffer losses on defaulted loans because our ability to fully recover on defaulted loans by selling the real estate collateral would be diminished.
Future economic conditions in our market will depend on factors outside of our control such as political and market conditions, broad trends in industry and finance, legislative and regulatory changes, changes in government, military and fiscal policies and inflation.
Our emphasis on residential mortgage loans exposes us to a risk of loss due to a decline in property values.
At December 31, 2012, $522.2 million, or 74.1%, of our loan portfolio consisted of one- to four-family residential mortgage loans, and $61.3 million, or 8.7%, of our loan portfolio consisted of home equity loans. Declines in real estate values could cause some of our mortgage and home equity loans to be inadequately collateralized, which would expose us to a greater risk of loss in the event that we seek to recover on defaulted loans by selling the real estate collateral. Because of our location on the South Jersey shore, many of the properties securing our residential mortgages are second homes or rental properties. At December 31, 2012, 38.6% of our one- to four-family mortgage loans were secured by second homes and 13.5% were secured by rental properties. These loans generally are considered to be more risky than loans secured by the borrower’s permanent residence, since the borrower is typically dependent upon rental income to meet debt service requirements, in the case of a rental property, and when in financial difficulty is more likely to make payments on the loan secured by the borrower’s primary residence before a vacation home.
Commercial lending may expose us to increased lending risks.
At December 31, 2012, $107.8 million, or 15.3%, of our loan portfolio consisted of commercial and multi-family real estate loans, commercial construction loans and commercial business loans. These types of loans generally expose a lender to greater risk of non-payment and loss than one- to four-family residential mortgage loans because repayment of the loans often depends on the successful operation of the property and the income stream of the borrowers. Such loans typically involve larger loan balances to single borrowers or groups of related borrowers compared to one- to four-family residential mortgage loans. Also, many of our commercial borrowers have more than one loan outstanding with us. Consequently, an adverse development with respect to one loan or one credit relationship can expose us to a significantly greater risk of loss compared to an adverse development with respect to a one- to four-family residential mortgage loan.
14
TABLE OF CONTENTS
Higher loan losses could require us to increase our allowance for loan losses through a charge to earnings.
When we loan money we incur the risk that our borrowers do not repay their loans. We reserve for loan losses by establishing an allowance through a charge to earnings. The amount of this allowance is based on our assessment of loan losses inherent in our loan portfolio. The process for determining the amount of the allowance is critical to our financial results and condition. It requires subjective and complex judgments about the future, including forecasts of economic or market conditions that might impair the ability of our borrowers to repay their loans. We might underestimate the loan losses inherent in our loan portfolio and have loan losses in excess of the amount reserved. We might increase the allowance because of changing economic conditions. For example, in a rising interest rate environment, borrowers with adjustable-rate loans could see their payments increase. There may be a significant increase in the number of borrowers who are unable or unwilling to repay their loans, resulting in our charging off more loans and increasing our allowance. In addition, when real estate values decline, the potential severity of loss on a real estate-secured loan can increase significantly, especially in the case of loans with high combined loan-to-value ratios. In addition, our determination as to the amount of our allowance for loan losses is subject to review by Ocean City Home’s primary regulator, the Office of the Comptroller of the Currency, as part of its examination process, which may result in the establishment of an additional allowance based upon the judgment of the Office of the Comptroller of the Currency after a review of the information available at the time of its examination. Our allowance for loan losses amounted to 0.57% of total loans outstanding and 69.5% of nonperforming loans at December 31, 2012. Our allowance for loan losses at December 31, 2012, may not be sufficient to cover future loan losses. A large loss could deplete the allowance and require increased provisions to replenish the allowance, which would negatively affect earnings.
If we conclude that the decline in value of any of our investment securities is other than temporary, we are required to write down the value of that security through a charge to earnings.
We evaluate our securities portfolio for other-than-temporary impairment throughout the year. Each investment that has a fair value less than book value is reviewed on a quarterly basis. An impairment charge is recorded against individual securities if management’s review concludes that the decline in value is other than temporary. As of December 31, 2012, our investment portfolio included nine corporate debt securities with a book value of $11.5 million and an estimated fair value of $10.5 million. Changes in the expected cash flows of these securities and/or prolonged price declines may result in our concluding in future periods that the impairment of these securities is other than temporary, which would require a charge to earnings to write down the value of these securities. At December 31, 2012, we had an investment of $6.4 million in capital stock of the Federal Home Loan Bank of New York. If the Federal Home Loan Bank of New York is unable to meet minimum regulatory capital requirements or is required to aid the remaining Federal Home Loan Banks, our holding of Federal Home Loan Bank stock may be determined to be other than temporarily impaired and may require a charge to our earnings, which could have a material impact on our financial condition, results of operations and cash flows. Any charges for other-than-temporary impairment would not impact cash flow, tangible capital or liquidity.
Higher FDIC deposit insurance premiums and assessments will hurt our earnings.
The recent economic recession has caused a high level of bank failures, which has dramatically increased Federal Deposit Insurance Corporation resolution costs and led to a significant reduction in the balance of the Deposit Insurance Fund. As a result, the Federal Deposit Insurance Corporation has significantly increased the initial base assessment rates paid by financial institutions for deposit insurance. Increases in the base assessment rate have increased our deposit insurance costs and negatively impacted our earnings. Additional increases in the base assessment rate or additional special assessments would negatively impact our earnings.
Changes in interest rates could reduce our net interest income and earnings.
Our net interest income is the interest we earn on loans and investments less the interest we pay on our deposits and borrowings. Our net interest spread is the difference between the yield we earn on our assets and the interest rate we pay for deposits and our other sources of funding. Changes in interest rates — up or down — could adversely affect our net interest spread and, as a result, our net interest income and net interest
15
TABLE OF CONTENTS
margin. Although the yield we earn on our assets and our funding costs tend to move in the same direction in response to changes in interest rates, one can rise or fall faster than the other, causing our net interest margin to expand or contract. Our liabilities tend to be shorter in duration than our assets, so they may adjust faster in response to changes in interest rates. As a result, when interest rates rise, our funding costs may rise faster than the yield we earn on our assets, causing our net interest margin to contract until the yield catches up. This contraction could be more severe following a prolonged period of lower interest rates, as a larger proportion of our fixed rate residential loan portfolio will have been originated at those lower rates and borrowers may be more reluctant or unable to sell their homes in a higher interest rate environment. Changes in the slope of the “yield curve” — or the spread between short-term and long-term interest rates — could also reduce our net interest margin. Normally, the yield curve is upward sloping, meaning short-term rates are lower than long-term rates. Because our liabilities tend to be shorter in duration than our assets, when the yield curve flattens or even inverts, we could experience pressure on our net interest margin as our cost of funds increases relative to the yield we can earn on our assets.
Strong competition within our market area could reduce our profits and slow growth.
We face intense competition both in making loans and attracting deposits. This competition has made it more difficult for us to make new loans and at times has forced us to offer higher deposit rates. Price competition for loans and deposits might result in us earning less on our loans and paying more on our deposits, which would reduce net interest income. Competition also makes it more difficult to grow loans and deposits. As of June 30, 2012, which is the most recent date for which information is available, we held 10.4% of the deposits in Atlantic County, New Jersey, which represented the 4th largest share of deposits, respectively, out of 16 financial institutions with offices in the county. As of June 30, 2012, we held 9.7% of the deposits in Cape May County, New Jersey, which was the 6th largest share of deposits out of 14 financial institutions with offices in the county. Some of the institutions with which we compete have substantially greater resources and lending limits than we have and may offer services that we do not provide. We expect competition to increase in the future as a result of legislative, regulatory and technological changes and the continuing trend of consolidation in the financial services industry. Our profitability depends upon our continued ability to compete successfully in our market area.
Our profitability may suffer because of rapid and unpredictable changes in the highly regulated environment in which we operate.
The banking industry is subject to extensive regulation by state and federal banking authorities. Many of the banking regulations that govern us are intended to protect depositors, the public or the insurance fund maintained by the FDIC rather than our shareholders. Banking regulations affect our lending practices, capital structure, investment practices, dividend policy and many other aspects of our business. These requirements may constrain our rate of growth, and changes in regulations could adversely affect our ability to grow. The burden imposed by these federal and state regulations may place banks at a competitive disadvantage compared to less regulated competitors. In addition, the cost of compliance with regulatory requirements could adversely affect our ability to operate profitably.
We operate in a highly regulated industry and may be adversely affected by supervisory actions of our regulators.
Since the financial crisis that began in 2008, the federal regulatory agencies have taken stronger supervisory actions against financial institutions that have experienced increased loan losses and other weaknesses. Actions include entering into written agreements and cease and desist orders that place certain limitations on such institutions’ operations. Federal bank regulators recently have also been using with more frequency their ability to impose individual minimal capital requirements on banks, which requirements may be higher than those which would otherwise qualify the bank as being “well capitalized” under prompt corrective action regulations. If we were to become subject to a supervisory agreement or higher individual capital requirements, such action may have a negative impact on our ability to execute our business plans, as well as our ability to grow, pay dividends or engage in mergers and acquisitions and may result in restrictions in our operations.
16
TABLE OF CONTENTS
Regulation of the financial services industry is undergoing major changes, and future legislation could increase our cost of doing business or harm our competitive position.
In 2010 and 2011, in response to the financial crisis and recession that began in 2008, significant regulatory and legislative laws were enacted resulting in broader reform and increased regulation impacting financial institutions. The Dodd-Frank Wall Street Reform and Consumer Protection Act (the “Dodd-Frank Act”) has created a significant shift in the way financial institutions operate. The Dodd-Frank Act restructured the regulation of depository institutions by merging the Office of Thrift Supervision, which previously regulated Ocean City Home Bank, into the Office of the Comptroller of the Currency, and assigning the regulation of savings and loan holding companies, including Ocean City Home, to the Board of Governors of the Federal Reserve System. The Dodd-Frank Act also created the Consumer Financial Protection Bureau to administer consumer protection and fair lending laws, a function that was formerly performed by the depository institution regulators. As required by the Dodd-Frank Act, the federal banking regulators have proposed new consolidated capital requirements that will limit our ability to borrow at the holding company level and invest the proceeds from such borrowings as capital in Ocean City Home Bank that could be leveraged to support additional growth. The Dodd-Frank Act contains various other provisions designed to enhance the regulation of depository institutions and prevent the recurrence of a financial crisis such as occurred in 2008-2009. The full impact of the Dodd-Frank Act on our business and operations will not be known for years until regulations implementing the statute are written and adopted. The Dodd-Frank Act may have a material impact on our operations, particularly through increased regulatory burden and compliance costs. Any future legislative changes could have a material impact on our profitability, the value of assets held for investment or collateral for loans. Future legislative changes could require changes to business practices or force us to discontinue businesses and potentially expose us to additional costs, liabilities, enforcement action and reputational risk.
ITEM 1B. UNRESOLVED STAFF COMMENTS
None.
ITEM 2. PROPERTIES
We currently conduct business through our twelve full-service banking offices in Ocean City, Marmora, Linwood, Ventnor, Egg Harbor Township, Absecon, Northfield, Margate City, Mays Landing, Galloway, Hammonton and Egg Harbor City, New Jersey. We own all of our offices, except for those in Absecon, Northfield and Hammonton. The lease for our Absecon office expires in 2014 and has an option for an additional five years. The lease for our Northfield office expires in 2021 and has an option for an additional one year. The lease for our Hammonton office expires in 2021 and has an option for an additional one year. The net book value of the land, buildings, furniture, fixtures and equipment owned by us was $13.4 million at December 31, 2012.
ITEM 3. LEGAL PROCEEDINGS
Periodically, there have been various claims and lawsuits against us, such as claims to enforce liens, condemnation proceedings on properties in which we hold security interests, claims involving the making and servicing of real property loans and other issues incident to our business. We are not a party to any pending legal proceedings that we believe would have a material adverse effect on our financial condition, results of operations or cash flows.
ITEM 4. MINE SAFETY DISCLOSURE
Not applicable.
17
TABLE OF CONTENTS
PART II
| ITEM 5. | MARKET FOR REGISTRANT’S COMMON EQUITY, RELATED STOCKHOLDER MATTERS AND ISSUER PURCHASES OF EQUITY SECURITIES |
The Company’s common stock is listed on the Nasdaq Global Market (“NASDAQ”) under the trading symbol “OSHC.” The following table sets forth the high and low sales prices of the common stock and dividends paid per share for the years ended December 31, 2012 and 2011. See Item 1,“Business — Regulation and Supervision — Limitation on Capital Distributions” and note 2 in the notes to the consolidated financial statements for more information relating to restrictions on dividends.
| | | | | | |
| | High | | Low | | Dividends
Paid Per Share |
Year Ended December 31, 2012:
| | | | | | | | | | | | |
| Fourth Quarter | | $ | 14.97 | | | $ | 12.94 | | | $ | 0.06 | |
| Third Quarter | | | 13.63 | | | | 12.10 | | | | 0.06 | |
| Second Quarter | | | 12.75 | | | | 11.45 | | | | 0.06 | |
| First Quarter | | | 11.75 | | | | 10.05 | | | | 0.06 | |
Year Ended December 31, 2011:
| | | | | | | | | | | | |
| Fourth Quarter | | $ | 10.88 | | | $ | 10.05 | | | $ | 0.06 | |
| Third Quarter | | | 12.45 | | | | 10.01 | | | | 0.06 | |
| Second Quarter | | | 13.00 | | | | 12.01 | | | | 0.06 | |
| First Quarter | | | 13.25 | | | | 11.40 | | | | 0.06 | |
As of March 1, 2013, there were approximately 728 holders of record of the Company’s common stock.
The following performance graph and related information shall not be deemed “soliciting material” or to be filed with the SEC, nor shall such information be incorporated by reference into any future filings under the Securities Act of 1933 or the Securities Exchange Act of 1934, each as amended, except to the extent that we specifically incorporate it by reference into such filing.
The following graph compares the changes in the cumulative total return to holders of our common stock with that of the Nasdaq Composite Index and the SNL Thrift Index. The comparison of the cumulative total returns for each investment assumes that $100 was invested in our common stock and the respective index on December 31, 2007 and includes reinvestment of all dividends.
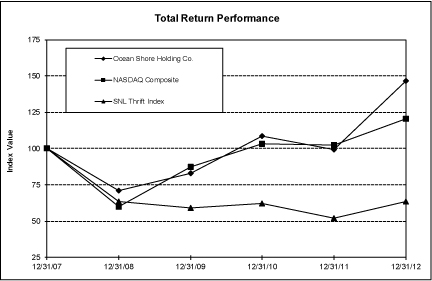
| | | | | | | | | | | | |
| | Period Ending |
| Index | | 12/31/07 | | 12/31/08 | | 12/31/09 | | 12/31/10 | | 12/31/11 | | 12/31/12 |
| Ocean Shore Holding Co. | | | 100.00 | | | | 70.91 | | | | 83.12 | | | | 108.79 | | | | 99.49 | | | | 146.38 | |
| NASDAQ Composite | | | 100.00 | | | | 60.02 | | | | 87.24 | | | | 103.08 | | | | 102.26 | | | | 120.42 | |
| SNL Thrift Index | | | 100.00 | | | | 63.64 | | | | 59.35 | | | | 62.01 | | | | 52.17 | | | | 63.45 | |
18
TABLE OF CONTENTS
Purchases of Equity Securities by the Issuer and Affiliated Purchases During the 4th Quarter of 2012
| | | | | | | | |
| Period | | (a)
Total number of Shares
(or Units) Purchased | | (b)
Average Price Paid per Share (or Unit) | | (c)
Total Number of Shares (or units) Purchased as Part of Publicly Announced Plans or Programs(1) | | (d)
Maximum Number (or Appropriate Dollar Value) of Shares (or units) that May Yet Be Purchased Under the Plans or Programs |
| Month #1 October 1, 2012 through October 31, 2012 | | | 30,600 | | | $ | 13.55 | | | | 30,600 | | | | — | |
| Month #2 November 1, 2012 through November 30, 2012 | | | — | | | | — | | | | — | | | | — | |
| Month #3 December 1, 2012 through December 31, 2012 | | | — | | | | — | | | | — | | | | — | |
| Total | | | | | | | | | | | | | | | | |

| (1) | On March 20, 2012, the Company’s Board of Directors approved the repurchase of up to 365,000 shares of the Company’s common stock. The repurchase program was completed on October 1, 2012 at a cost of $4.7 million or $12.96 per share. |
ITEM 6. SELECTED FINANCIAL DATA
| | | | | | | | | | |
| | At or For the Year Ended December 31, |
| | | 2012 | | 2011 | | 2010 | | 2009 | | 2008 |
| | | (Dollars in thousands, except per share amounts) |
Financial Condition Data:
| | | | | | | | | | | | | | | | | | | | |
| Total assets | | $ | 1,045,488 | | | $ | 994,730 | | | $ | 839,857 | | | $ | 770,145 | | | $ | 678,474 | |
| Investment securities | | | 116,774 | | | | 52,732 | | | | 23,721 | | | | 29,427 | | | | 37,405 | |
| Loans receivable, net | | | 703,898 | | | | 727,626 | | | | 660,340 | | | | 663,663 | | | | 594,452 | |
| Deposits | | | 801,765 | | | | 752,455 | | | | 603,334 | | | | 537,422 | | | | 455,955 | |
| Borrowings | | | 125,464 | | | | 125,464 | | | | 125,464 | | | | 125,464 | | | | 149,264 | |
| Total equity | | | 104,728 | | | | 104,680 | | | | 100,554 | | | | 97,335 | | | | 64,387 | |
Operating Data:
| | | | | | | | | | | | | | | | | | | | |
| Interest and dividend income | | $ | 36,851 | | | $ | 38,087 | | | $ | 37,716 | | | $ | 37,225 | | | $ | 35,919 | |
| Interest expense | | | 10,217 | | | | 12,186 | | | | 13,829 | | | | 15,038 | | | | 17,093 | |
| Net interest income | | | 26,634 | | | | 25,901 | | | | 23,887 | | | | 22,187 | | | | 18,826 | |
| Provision for loan losses | | | 893 | | | | 473 | | | | 892 | | | | 1,251 | | | | 373 | |
| Net interest income after provision for loan losses | | | 25,741 | | | | 25,428 | | | | 22,995 | | | | 20,936 | | | | 18,453 | |
| Other income | | | 4,003 | | | | 3,538 | | | | 3,403 | | | | 3,101 | | | | 2,768 | |
| Impairment charge on AFS securities | | | — | | | | — | | | | — | | | | (1,077 | ) | | | (2,235 | ) |
| Other expenses | | | 21,563 | | | | 20,376 | | | | 17,523 | | | | 16,134 | | | | 14,265 | |
| Income before taxes | | | 8,181 | | | | 8,590 | | | | 8,875 | | | | 6,826 | | | | 4,721 | |
| Provision for income taxes | | | 3,180 | | | | 3,532 | | | | 3,431 | | | | 2,615 | | | | 1,792 | |
| Net income | | $ | 5,001 | | | $ | 5,058 | | | $ | 5,444 | | | $ | 4,211 | | | $ | 2,929 | |
Per Share Data*:
| | | | | | | | | | | | | | | | | | | | |
| Earnings per share, basic | | $ | 0.75 | | | $ | 0.75 | | | $ | 0.80 | | | $ | 0.60 | | | $ | 0.42 | |
| Earnings per share, diluted | | $ | 0.74 | | | $ | 0.74 | | | $ | 0.80 | | | $ | 0.59 | | | $ | 0.41 | |
| Dividends per share | | | 0.24 | | | | 0.24 | | | | 0.24 | | | | 0.23 | | | | 0.17 | |
| Dividend payout ratio | | | 34.5 | % | | | 34.6 | % | | | 32.2 | % | | | 16.9 | % | | | 18.3 | % |
| Weighted average shares – basic | | | 6,652,537 | | | | 6,748,334 | | | | 6,798,317 | | | | 7,064,161 | | | | 7,039,134 | |
| Weighted average shares – diluted | | | 6,715,404 | | | | 6,831,989 | | | | 6,798,317 | | | | 7,112,526 | | | | 7,117,657 | |
| * | Earnings per share, dividends per share and average common shares have been adjusted where appropriate to reflect the impact of the second-step conversion and reorganization of the Company, which occurred on December 18, 2009. |
19
20
TABLE OF CONTENTS
| ITEM 7. | MANAGEMENT’S DISCUSSION AND ANALYSIS OF FINANCIAL CONDITION AND RESULTS OF OPERATIONS |
Forward-Looking Statements
This report contains “forward-looking statements” within the meaning of the Private Securities Litigation Reform Act of 1995. Forward-looking statements can be identified by words such as “anticipates,” “intends,” “plans,” “seeks,” “believes,” “estimates,” “expects,” “will,” “may,” “could,” “should,” “can” and similar references to future periods. Examples of forward-looking statements include, but are not limited to, statements we make about: future results of the Company; expectations for loan losses and the sufficiency of our loan loss allowance to cover future loan losses; the expected outcome and impact of legal, regulatory and legislative developments; and the Company’s plans, objectives and strategies.
Forward-looking statements are based on our current expectations and assumptions regarding our business, the economy and other future conditions. Because forward-looking statements relate to the future, they are subject to inherent uncertainties, risks and changes in circumstances that are difficult to predict. Our actual results may differ materially from those contemplated by the forward-looking statements. We caution you, therefore, against relying on any of these forward-looking statements. They are neither statements of historical fact nor guarantees or assurances of future performance. While there is no assurance that any list of risks and uncertainties or risk factors is complete, important factors that could cause actual results to differ materially from those in the forward-looking statements include the following, without limitation:
| • | the effect of political and economic conditions and geopolitical events; |
| • | economic conditions that affect the general economy, housing prices, the job market, consumer confidence and spending habits; |
| • | the level and volatility of the capital markets and interest rates; |
| • | investor sentiment and confidence in the financial markets; |
| • | the impact of current, pending and future legislation, regulation and legal actions; |
| • | changes in accounting standards, rules and interpretations; |
| • | various monetary and fiscal policies and regulations of the U.S. government; and |
| • | the other factors described in “Risk Factors” in this report. |
Any forward-looking statement made by us in this report speaks only as of the date on which it is made. Factors or events that could cause our actual results to differ may emerge from time to time, and it is not possible for us to predict all of them. We undertake no obligation to publicly update any forward-looking statement, whether as a result of new information, future developments or otherwise, except as may be required by law.
General Overview
We conduct community banking activities by accepting deposits and making loans in our market area. Our lending products include residential mortgage loans, commercial loans and mortgages, and home equity and other consumer loans. We also maintain an investment portfolio consisting primarily of mortgage-backed securities to manage our liquidity and interest rate risk. Our loan and investment portfolios are funded with deposits as well as collateralized borrowings from the Federal Home Loan Bank of New York.
Income. Our primary source of pre-tax income is net interest income. Net interest income is the difference between interest income, which is the income that we earn on our loans and investments, and interest expense, which is the interest that we pay on our deposits and borrowings. Our net interest income is affected by a variety of factors, including the mix of interest-earning assets in our portfolio and changes in levels of interest rates. Growth in net interest income is dependent upon our ability to prudently manage the balance sheet for growth, combined with how successfully we maintain or increase net interest margin, which is net interest income as a percentage of average interest-earning assets.
21
TABLE OF CONTENTS
A secondary source of income is non-interest income, or other income, which is revenue that we receive from providing products and services. The majority of our non-interest income generally comes from service charges (mostly from service charges on deposit accounts). We also earn income on bank-owned life insurance and receive commissions for various services. In some years, we recognize income from the sale of securities and real estate owned.
Allowance for Loan Losses. The allowance for loan losses is a valuation allowance for probable losses inherent in the loan portfolio as of the balance sheet date. We evaluate the need to establish allowances against losses on loans on a monthly basis. When additional allowances are necessary, a provision for loan losses is charged to earnings.
Expenses. The noninterest expenses we incur in operating our business consist primarily of expenses for salaries and employee benefits and for occupancy and equipment. We also incur expenses for items such as professional services, advertising, office supplies, insurance, telephone, and postage. Our largest noninterest expense is for salaries and employee benefits, which consist primarily of salaries and wages paid to our employees, payroll taxes, and expenses for health insurance, retirement plans and other employee benefits. Occupancy and equipment expenses, which are the fixed and variable costs of buildings and equipment, consist primarily of depreciation charges, ATM and data processing expenses, furniture and equipment expenses, maintenance, real estate taxes and costs of utilities. Federal Deposit Insurance Corporation assessments are a specified percentage of assessable deposits.
Acquisition of CBHC Financialcorp, Inc.
On August 1, 2011, the Company acquired all of the outstanding common stock of CBHC, parent company of Select Bank, in a cash-out merger for a total purchase price of $12.5 million. Select Bank has been merged into the Bank, with the Bank as the surviving entity. Based in Egg Harbor City, New Jersey, CBHC operated five banking offices in Atlantic County, New Jersey at the date of acquisition. As a result of the transaction, the Company has expanded its service area in Atlantic County. The results of operations acquired in the CBHC transaction have been included in the Company’s financial results since August 1, 2011.
Critical Accounting Policies, Judgments and Estimates
The discussion and analysis of the financial condition and results of operations are based on our consolidated financial statements, which are prepared in conformity with generally accepted accounting principles in the United States of America. The preparation of these financial statements requires management to make estimates and assumptions affecting the reported amounts of assets and liabilities, disclosure of contingent assets and liabilities, and the reported amounts of income and expenses. We consider the accounting policies discussed below to be critical accounting policies. The estimates and assumptions that we use are based on historical experience and various other factors and are believed to be reasonable under the circumstances. Actual results may differ from these estimates under different assumptions or conditions, resulting in a change that could have a material impact on the carrying value of our assets and liabilities and our results of operations.
Allowance for Loan Losses. The allowance for loan losses is the amount estimated by management as necessary to cover losses inherent in the loan portfolio at the balance sheet date. The allowance is established through the provision for loan losses, which is charged to income. Determining the amount of the allowance for loan losses necessarily involves a high degree of judgment. Among the material estimates required to establish the allowance are the following: loss exposure at default; the amount and timing of future cash flows on impacted loans; value of collateral; and determination of loss factors to be applied to the various elements of the portfolio. All of these estimates are susceptible to significant change. Although we believe that we use the best information available to establish the allowance for loan losses, future adjustments to the allowance may be necessary if economic conditions differ substantially from the assumptions used in making the evaluation. In addition, the Office of the Comptroller of the Currency, as an integral part of its examination process, periodically reviews our allowance for loan losses. Such agency may require us to recognize adjustments to the allowance based on its judgments about information available to it at the time of its examination. The allowance for loan losses is maintained at a level that management considers adequate to provide for estimated losses and impairment based upon an evaluation of known and inherent risk in the loan portfolio. Loan impairment is evaluated based on the fair value of collateral or estimated net realizable value.
22
TABLE OF CONTENTS
A provision for loan losses is charged to operations based on management’s evaluation of the estimated losses that have been incurred in the Company’s loan portfolio. It is the policy of management to provide for losses on unidentified loans in its portfolio in addition to classified loans.
Management monitors its allowance for loan losses monthly and makes adjustments to the allowance through the provision for loan losses as economic conditions and other pertinent factors indicate. The quarterly review and adjustment of the qualitative factors employed in the allowance methodology and the updating of historic loss experience allow for timely reaction to emerging conditions and trends. In this context, a series of qualitative factors are used in a methodology as a measurement of how current circumstances are affecting the loan portfolio. Included in these qualitative factors are:
| • | Levels of past due, classified and non-accrual loans, troubled debt restructurings and modifications; |
| • | Nature and volume of loans; |
| • | Changes in lending policies and procedures, underwriting standards, collections, charge-offs and recoveries, and for commercial loans, the level of loans being approved with exceptions to policy; |
| • | Experience, ability and depth of management and staff; |
| • | National and local economic and business conditions, including various market segments; |
| • | Quality of our loan review system and degree of Board oversight; |
| • | Concentrations of credit by industry, geography and collateral type, with a specific emphasis on real estate, and changes in levels of such concentrations; and |
| • | Effect of external factors, including the deterioration of collateral values, on the level of estimated credit losses in the current portfolio. |
In determining the allowance for loan losses, management has established both specific and general pooled allowances. Values assigned to the qualitative factors and those developed from historic loss experience provide a dynamic basis for the calculation of reserve factors for both pass-rated loans (general pooled allowance) and those criticized and classified loans without reserves (specific allowance). The amount of the specific allowance is determined through a loan-by-loan analysis of non-performing loans. Loans not individually reviewed are evaluated as a group using reserve factor percentages based on qualitative and quantitative factors described above. In determining the appropriate level of the general pooled allowance, management makes estimates based on internal risk ratings, which take into account such factors as debt service coverage, loan-to-value ratios, and external factors. If a loan is identified as impaired and is collateral dependant, an appraisal is obtained to provide a base line in determining whether the carrying amount of the loan exceeds the net realizable value. We recognize impairment through a provision estimate or a charge-off is recorded when management determines we will not collect 100% of a loan based on foreclosure of the collateral, less cost to sell the property, or the present value of expected cash flows.
As changes in our operating environment occur and as recent loss experience fluctuates, the factors for each category of loan based on type and risk rating will change to reflect current circumstances and the quality of the loan portfolio. Given that the components of the allowance are based partially on historical losses and on risk rating changes in response to recent events, required reserves may trail the emergence of any unforeseen deterioration in credit quality.
Other Than Temporary Impairment. We assess whether a decline is other than temporary with respect to a debt security which has a fair value less than the book value by considering whether (1) we have the intent to sell the security, (2) it is more likely than not that we will be required to sell the security before recovery, or (3) we do not expect to recover the entire amortized cost basis of the security. We bifurcate the impact on securities where impairment in value was deemed to be other than temporary between the component representing credit loss and the component representing loss related to other factors, when the security is not otherwise intended to be sold or is required to be sold. The portion of the fair value decline attributable to credit loss must be recognized through a charge to earnings. The credit component is determined by comparing the present value of the cash flows expected to be collected, discounted at the rate in effect before recognizing any OTTI, with the amortized cost basis of the debt security. We use the cash
23
TABLE OF CONTENTS
flow expected to be realized from the security, which includes assumptions about interest rates, timing and severity of defaults, estimates of potential recoveries, the cash flow distribution from the bond indenture and other factors, then apply a discount rate equal to the effective yield of the security. The difference between the present value of the expected cash flows and the amortized book value is considered a credit loss. The fair market value of the security is determined using the same expected cash flows, where market-based observable inputs are not available; the discount rate is a rate we determine from open market and other sources as appropriate for the security. The fair value is based on market prices or market-based observable inputs when available. The difference between the fair market value and the credit loss is recognized in other comprehensive income. Additional information regarding our accounting for investment securities is included in notes 2 and 3 to the notes to consolidated financial statements.
Deferred Income Taxes. We account for income taxes in accordance with Financial Accounting Standards Board (“FASB”) Accounting Standards Codification (“ASC”) FASB ASC 740,Income Taxes.FASB ASC 740 requires the recording of deferred income taxes that reflect the net tax effects of temporary differences between the carrying amounts of assets and liabilities for financial reporting purposes and the amounts used for income tax purposes. Under this method, deferred tax assets and liabilities are recognized for the future tax consequences attributable to differences between the financial statement carrying amounts of existing assets and liabilities and their respective tax bases. If current available information raises doubt as to the realization of the deferred tax assets, a valuation allowance is established. Deferred tax assets and liabilities are measured using enacted tax rates expected to apply to taxable income in the years in which those temporary differences are expected to be recovered or settled. We exercise significant judgment in evaluating the amount and timing of recognition of the resulting tax liabilities and assets. These judgments require us to make projections of future taxable income as well as judgments about availability of capital gains. The judgments and estimates we make in determining our deferred tax assets, which are inherently subjective, are reviewed on a continual basis as regulatory and business factors change. Any reduction in estimated future taxable income may require us to record an additional valuation allowance against our deferred tax assets. Further, an inability to employ a qualifying tax strategy to utilize our deferred tax asset arising from capital losses may give rise to an additional valuation allowance. An increase in the valuation allowance would result in additional income tax expense in the period, which would negatively affect earnings. FASB ASC 740 prescribes a minimum probability threshold that a tax position must meet before a financial statement benefit is recognized. When applicable, we recognize interest and penalties related to unrecognized tax benefits in the provision for income taxes in the consolidated income statement. Assessment of uncertain tax positions under FASB ASC 740 requires careful consideration of the technical merits of a position based on management’s analysis of tax regulations and interpretations. Significant judgment may be involved in applying the requirements of FASB ASC 740.
Our adherence to FASB ASC 740 may result in increased volatility in quarterly and annual effective income tax rates, as FASB ASC 740 requires that any change in judgment or change in measurement of a tax position taken in a prior period be recognized as a discrete event in the period in which it occurs. Factors that could impact management’s judgment include changes in income, tax laws and regulations, and tax planning strategies.
Fair Value Measurement. We account for fair value measurement in accordance with FASB ASC 820,Fair Value Measurements and Disclosures. FASB ASC 820 establishes a framework for measuring fair value. FASB ASC 820 defines fair value as the price that would be received to sell an asset or paid to transfer a liability in an orderly transaction between market participants at the measurement date, emphasizing that fair value is a market-based measurement and not an entity-specific measurement. FASB ASC 820 clarifies the application of fair value measurement in a market that is not active. FASB ASC 820 also includes additional factors for determining whether there has been a significant decrease in market activity, affirms the objective of fair value when a market is not active, eliminates the presumption that all transactions are not orderly unless proven otherwise, and requires an entity to disclose inputs and valuation techniques, and changes therein, used to measure fair value. FASB ASC 820 addresses the valuation techniques used to measure fair value. These valuation techniques include the market approach, income approach and cost approach. The market approach uses prices or relevant information generated by market transactions involving identical or comparable assets or liabilities. The income approach involves converting future amounts to a single present
24
TABLE OF CONTENTS
amount. The measurement is valued based on current market expectations about those future amounts. The cost approach is based on the amount that currently would be required to replace the service capacity of the asset.
FASB ASC 820 establishes a fair value hierarchy, which prioritizes the inputs to valuation techniques used to measure fair value into three broad levels. The fair value hierarchy gives the highest priority to quoted prices in active markets for identical assets or liabilities (Level 1) and the lowest priority to unobservable inputs (Level 3). A financial instrument’s categorization within the fair value hierarchy is based upon the lowest level of input that is significant to the instrument’s fair value measurement. The three levels within the fair value hierarchy are described as follows:
| • | Level 1 — Quoted prices (unadjusted) in active markets for identical assets or liabilities. |
| • | Level 2 — Inputs other than quoted prices included within Level 1 that are observable for the asset or liability, either directly or indirectly. Level 2 inputs include: quoted prices for similar assets or liabilities in active markets; quoted prices for identical or similar assets or liabilities in markets that are not active; inputs other than quoted prices that are observable for the asset or liability; and inputs that are derived principally from or corroborated by observable market data by correlation or other means. |
| • | Level 3 — Unobservable inputs that are supported by little or no market activity and that are significant to the fair value of the assets or liabilities. Level 3 assets and liabilities include financial instruments whose value is determined using pricing models, discounted cash flow methodologies, or similar techniques, as well as instruments for which the determination of fair value requires significant management judgment or estimation. |
We measure financial assets and liabilities at fair value in accordance with FASB ASC 820. These measurements involve various valuation techniques and models, which involve inputs that are observable, when available, and include the following significant financial instruments: investment securities available for sale and derivative financial instruments. The following is a summary of valuation techniques utilized by us for our significant financial assets and liabilities which are valued on a recurring basis.
Investment securities available for sale. Where quoted prices for identical securities are available in an active market, securities are classified within Level 1 of the valuation hierarchy. If quoted market prices are not available, then fair values are estimated using quoted prices of securities with similar characteristics or discounted cash flows based on observable market inputs and are classified within Level 2 of the fair value hierarchy. In certain cases where there is limited activity or less transparency around inputs to the valuation, securities are classified within Level 3 of the valuation hierarchy. Level 3 market value measurements include an internally developed discounted cash flow model combined with using market data points of similar securities with comparable credit ratings in addition to market yield curves with similar maturities in determining the discount rate. In addition, significant estimates and unobservable inputs are required in the determination of Level 3 market value measurements. If actual results differ significantly from the estimates and inputs applied, it could have a material effect on our consolidated financial statements.
In addition, certain assets are measured at fair value on a nonrecurring basis; that is, the instruments are not measured at fair value on an ongoing basis but are subject to fair value adjustments in certain circumstances (for example, when there is evidence of impairment). We measure impaired loans, FHLB stock and loans transferred into other real estate owned at fair value on a non-recurring basis.
We review and validate the valuation techniques and models utilized for measuring financial assets and liabilities at least quarterly.
Goodwill and Core Deposit Intangibles. Goodwill is the excess of the purchase price over the fair value of the tangible and identifiable intangible assets and liabilities of companies acquired through business combinations accounted for under the purchase method. Core deposit intangibles are a measure of the value of checking, savings and other-low cost deposits acquired in business combinations accounted for under the purchase method. Core deposit intangibles are amortized over the estimated useful lives of the existing deposit relationships acquired, but not exceeding 15 years. The Company evaluates the identifiable intangibles at its
25
TABLE OF CONTENTS
Ocean City Home Bank subsidiary for impairment when an indicator of impairment exists, but not less than annually. Separable intangible assets that are not deemed to have an indefinite life continue to be amortized over their useful lives.
Goodwill and other indefinite lived intangible assets are not amortized on a recurring basis, but rather are subject to periodic impairment testing. Management performs an annual goodwill impairment test and whenever events occur or circumstances change that indicates the fair value of a reporting unit may be below its carrying value.
Balance Sheet Analysis
General. Total assets increased $50.8 million, or 5.1%, to $1,045.5 million at December 31, 2012 from $994.7 million at December 31, 2011. Total loans, net, decreased $23.7 million, or 3.3%, during 2012 to $703.9 million as heavy refinance activity caused repayments to exceed new loan originations. Investment and mortgage-backed securities increased $64.0 million, or 121.4%, during 2012 to $116.8 million as we deployed some of our excess cash generated through deposits and loan payoffs. Cash and cash equivalents increased $7.8 million to $163.4 million. The increase in investments and mortgage-backed securities resulted from new purchases of short duration agency investments of $93.2 million offset by normal repayments, calls and payoffs of $29.2 million. The increase in cash and cash equivalents resulted from increased deposit activity and cash flow from loans offset by increased investment activity.
Deposits grew $49.3 million, or 6.6%, to $801.8 million at December 31, 2012 from December 31, 2011. The Company continued its focus on core deposits, which increased $75.7 million, or 14.9%, to $584.3 million. Certificates of deposit decreased $26.4 million, or 10.8%, to $217.5 million at December 31, 2012 compared to December 31, 2011. Total borrowings remained unchanged at $125.5 million, including $110.0 million of FHLB advances.
Loans. Our primary lending activity is the origination of loans secured by real estate. Total loans, net, represented 67.3% of total assets at December 31, 2012, compared to 73.1% of total assets at December 31, 2011.
Loans receivable, net, decreased $23.7 million, or 3.3%, in 2012 to $703.9 million at December 31, 2012. Loan originations in 2012 totaled $169.3 million, which was an increase of $34.7 million over 2011. The higher origination activity was offset by payoffs and payments received of $191.2 million, which was an increase of $42.3 million over 2011. The increased origination and payoff activity in 2012 resulted from lower rates on mortgages creating a higher than normal loan refinance environment. One- to four-family residential loans decreased $25.7 million, or 4.7%, to $522.2 million representing 74.1% of total loans. One- to four-family residential loan originations accounted for $108.5 million, or 64.1%, of total loan originations. Commercial real estate mortgages increased $2.9 million, or 3.8%, to $80.0 million representing 11.4% of total loans. Commercial real estate loan originations totaled $9.6 million, or 5.7%, of total loan originations. Construction loans increased $5.7 million, or 48.0%, to $17.5 million representing 2.5% of total loans. Construction loan originations totaled $21.7 million, or 12.8%, of total loan originations. Commercial loans decreased $1.0 million, or 4.2%, to $22.9 million representing 3.3% of total loans. Commercial loan originations totaled $14.5 million, or 8.6%, of total originations. Consumer loans, almost all of which are home equity loans, decreased $5.4 million, or 8.0%, to $62.2 million representing 8.8% of total loans. Consumer loan originations totaled $14.9 million, or 8.8%, of total loan originations. The following table sets forth the composition of our loan portfolio by type of loan at the dates indicated:
26
TABLE OF CONTENTS
Table 1: Loan Portfolio Analysis
| | | | | | | | | | | | | | | | | | | | |
| | | | | | | | | | | | | | | | | | | | |
| At December 31, |
| | | 2012 | | 2011 | | 2010 | | 2009 | | 2008 |
| (Dollars in thousands) | | Amount | | Percent | | Amount | | Percent | | Amount | | Percent | | Amount | | Percent | | Amount | | Percent |
Real estate-mortgage:
| | | | | | | | | | | | | | | | | | | | | | | | | | | | | | | | | | | | | | | | |
| One- to four-family residential | | $ | 522,206 | | | | 74.1 | % | | $ | 547,906 | | | | 75.2 | % | | $ | 514,853 | | | | 77.8 | % | | $ | 521,361 | | | | 78.6 | % | | $ | 464,731 | | | | 78.2 | % |
| Commercial and multi-family | | | 80,013 | | | | 11.3 | | | | 77,073 | | | | 10.6 | | | | 55,238 | | | | 8.4 | | | | 49,802 | | | | 7.5 | | | | 42,612 | | | | 7.2 | |
| Total real estate- mortgage loans | | | 602,219 | | | | 85.4 | | | | 624,979 | | | | 85.8 | | | | 570,091 | | | | 86.2 | | | | 571,163 | | | | 86.1 | | | | 507,343 | | | | 85.4 | |
| Real estate-construction: | | | | | | | | | | | | | | | | | | | | | | | | | | | | | | | | | | | | | | | | |
| Residential | | | 12,709 | | | | 1.8 | | | | 8,057 | | | | 1.1 | | | | 7,785 | | | | 1.2 | | | | 5,606 | | | | 0.8 | | | | 7,858 | | | | 1.3 | |
| Commercial | | | 4,821 | | | | 0.7 | | | | 3,791 | | | | 0.5 | | | | 3,724 | | | | 0.6 | | | | 2,937 | | | | 0.4 | | | | 1,021 | | | | 0.2 | |
| Total real estate- construction loans | | | 17,530 | | | | 2.5 | | | | 11,848 | | | | 1.6 | | | | 11,509 | | | | 1.8 | | | | 8,543 | | | | 1.2 | | | | 8,879 | | | | 1.5 | |
| Commercial | | | 22,932 | | | | 3.3 | | | | 23,937 | | | | 3.3 | | | | 21,963 | | | | 3.3 | | | | 22,893 | | | | 3.4 | | | | 17,111 | | | | 2.8 | |
Consumer:
| | | | | | | | | | | | | | | | | | | | | | | | | | | | | | | | | | | | | | | | |
| Home equity | | | 61,328 | | | | 8.7 | | | | 66,788 | | | | 9.2 | | | | 57,119 | | | | 8.6 | | | | 60,730 | | | | 9.2 | | | | 60,020 | | | | 10.1 | |
| Other | | | 879 | | | | 0.1 | | | | 810 | | | | 0.1 | | | | 776 | | | | 0.1 | | | | 795 | | | | 0.1 | | | | 957 | | | | 0.2 | |
| Total consumer loans | | | 62,207 | | | | 8.8 | | | | 67,598 | | | | 9.3 | | | | 57,895 | | | | 8.7 | | | | 61,525 | | | | 9.3 | | | | 60,977 | | | | 10.3 | |
| Total loans | | | 704,888 | | | | 100.0 | % | | | 728,362 | | | | 100.0 | % | | | 661,458 | | | | 100.0 | % | | | 664,124 | | | | 100.0 | % | | | 594,310 | | | | 100.0 | % |
Net deferred loan
costs (fees) | | | 3,007 | | | | | | | | 3,026 | | | | | | | | 2,870 | | | | | | | | 3,015 | | | | | | | | 2,826 | | | | | |
| Allowance for loan losses | | | (3,997 | ) | | | | | | | (3,762 | ) | | | | | | | (3,988 | ) | | | | | | | (3,476 | ) | | | | | | | (2,684 | ) | | | | |
| Loans, net | | $ | 703,898 | | | | | | | $ | 727,626 | | | | | | | $ | 660,340 | | | | | | | $ | 663,663 | | | | | | | $ | 594,452 | | | | | |
The following table sets forth certain information at December 31, 2012 regarding the dollar amount of loan principal repayments coming due during the periods indicated. The table does not include any estimate of prepayments, which significantly shorten the average life of all loans and may cause our actual repayment experience to differ from that shown below. Demand loans having no stated schedule of repayments and no stated maturity are reported as due in one year or less.
Table 2: Contractual Maturities and Interest Rate Sensitivity
| | | | | | | | | | |
| (In thousands) | | Real Estate-Mortgage Loans | | Real Estate-Construction Loans | | Commercial Loans | | Consumer Loans | | Total
Loans |
Amounts due in:
| | | | | | | | | | | | | | | | | | | | |
| One year or less | | $ | 1,203 | | | $ | 15,938 | | | $ | 10,648 | | | $ | 447 | | | $ | 28,236 | |
| More than one to five years | | | 10,969 | | | | 1,592 | | | | 4,609 | | | | 4,753 | | | | 21,923 | |
| More than five years | | | 590,047 | | | | 0 | | | | 7,675 | | | | 57,007 | | | | 654,729 | |
| Total | | $ | 602,219 | | | $ | 17,530 | | | $ | 22,932 | | | $ | 62,207 | | | $ | 704,888 | |
Interest rate terms on amounts due after one year:
| | | | | | | | | | | | | | | | | | | | |
| Fixed-rate loans | | $ | 467,695 | | | $ | 0 | | | $ | 5,819 | | | $ | 31,317 | | | $ | 504,831 | |
| Adjustable-rate loans | | | 133,321 | | | | 1,592 | | | | 6,465 | | | | 30,443 | | | | 171,821 | |
| Total | | $ | 601,016 | | | $ | 1,592 | | | $ | 12,284 | | | $ | 61,760 | | | $ | 676,652 | |
27
TABLE OF CONTENTS
Table 3: Loan Origination, Purchase and Sale Activity
| | | | | | | | | | |
| (In thousands) | | 2012 | | 2011 | | 2010 | | 2009 | | 2008 |
| Total loans, net, at beginning of period | | $ | 727,626 | | | $ | 660,340 | | | $ | 663,663 | | | $ | 594,452 | | | $ | 528,058 | |
Loans originated:
| | | | | | | | | | | | | | | | | | | | |
| Real estate-mortgage | | | 117,816 | | | | 88,369 | | | | 87,052 | | | | 119,446 | | | | 108,797 | |
| Real estate-construction | | | 21,737 | | | | 17,873 | | | | 18,033 | | | | 14,407 | | | | 14,117 | |
| Commercial | | | 14,474 | | | | 15,517 | | | | 13,995 | | | | 14,411 | | | | 13,308 | |
| Consumer | | | 14,911 | | | | 12,847 | | | | 16,854 | | | | 23,237 | | | | 23,860 | |
| Total loans originated | | | 168,938 | | | | 134,606 | | | | 135,934 | | | | 171,501 | | | | 160,082 | |
| Loans purchased | | | 342 | | | | 554 | | | | 1,174 | | | | 38 | | | | 4,379 | |
| Loans acquired through acquisition of Select Bank | | | — | | | | 81,608 | | | | — | | | | — | | | | — | |
Deduct:
| | | | | | | | | | | | | | | | | | | | |
| Real estate loan principal repayments | | | 155,087 | | | | 109,380 | | | | 104,365 | | | | 69,164 | | | | 62,778 | |
| Loan sales | | | — | | | | — | | | | — | | | | — | | | | — | |
| Other repayments | | | 36,351 | | | | 39,593 | | | | 35,410 | | | | 31,175 | | | | 35,460 | |
| Total loan repayments | | | 191,438 | | | | 148,973 | | | | 139,775 | | | | 100,339 | | | | 98,238 | |
| Transfer to real estate owned | | | 1,049 | | | | 191 | | | | — | | | | 925 | | | | — | |
| Loans charged-off | | | 378 | | | | 700 | | | | — | | | | 461 | | | | — | |
Increase (decrease) due to deferred loan fees and allowance for
loan losses | | | (143 | ) | | | 382 | | | | (656 | ) | | | (603 | ) | | | 171 | |
Net (decrease) increase in
loan portfolio | | | (23,728 | ) | | | 67,286 | | | | (3,323 | ) | | | 69,211 | | | | 66,394 | |
| Total loans, net, at end of period | | $ | 703,898 | | | $ | 727,626 | | | $ | 660,340 | | | $ | 663,663 | | | $ | 594,452 | |
Securities. At December 31, 2012 our securities portfolio represented 11.2% of total assets, compared to 5.3% at December 31, 2011. Investment securities increased $64.0 million to $116.8 million at December 31, 2012 from $52.7 million at December 31, 2011 primarily as the result of increases of $45 million of GNMA mortgage-backed securities, $14.4 million of U. S. agency securities and $5.1 million of municipal securities. During 2012, we invested a portion of the excess liquidity generated through our deposit generation activities and loan repayments into investment securities. The following table sets forth amortized cost and fair value information relating to our investment and mortgage-backed securities portfolios at the dates indicated:
28
TABLE OF CONTENTS
Table 4: Investment Securities
| | | | | | | | | | | | |
| | At December 31, |
| | | 2012 | | 2011 | | 2010 |
| (Dollars in thousands) | | Amortized Cost | | Fair
Value | | Amortized Cost | | Fair
Value | | Amortized Cost | | Fair
Value |
Securities available for sale:
| | | | | | | | | | | | | | | | | | | | | | | | |
| U.S. Government and agencies | | $ | 40,068 | | | $ | 40,091 | | | $ | 25,660 | | | $ | 25,685 | | | $ | — | | | $ | — | |
| Agency mortgage-backed | | | 54,420 | | | | 55,636 | | | | 13,447 | | | | 14,128 | | | | 12,609 | | | | 13,405 | |
| Corporate debt | | | 11,487 | | | | 10,466 | | | | 7,700 | | | | 6,110 | | | | 8,199 | | | | 6,403 | |
| Municipal | | | — | | | | — | | | | 830 | | | | 832 | | | | 1,420 | | | | 1,431 | |
| Total debt securities | | | 105,975 | | | | 106,193 | | | | 47,637 | | | | 46,755 | | | | 22,228 | | | | 21,239 | |
| Equity securities | | | 3 | | | | 13 | | | | 3 | | | | 13 | | | | 3 | | | | 14 | |
Total securities available
for sale | | | 105,978 | | | | 106,206 | | | | 47,640 | | | | 46,768 | | | | 22,231 | | | | 21,253 | |
Securities held to maturity:
| | | | | | | | | | | | | | | | | | | | | | | | |
| Agency mortgage-backed | | | 1,425 | | | | 1,559 | | | | 1,944 | | | | 2,128 | | | | 2,467 | | | | 2,639 | |
| Municipal | | | 9,143 | | | | 9,143 | | | | 4,020 | | | | 4,020 | | | | — | | | | — | |
| Total securities held to maturity | | | 10,568 | | | | 10,702 | | | | 5,964 | | | | 6,148 | | | | 2,467 | | | | 2,639 | |
| Total | | $ | 116,546 | | | $ | 116,908 | | | $ | 53,604 | | | $ | 52,916 | | | $ | 24,698 | | | $ | 23,891 | |
At December 31, 2012, we had no investments in a single company or entity (other than the U.S. Government or an agency of the U.S. Government) that had an aggregate book value in excess of 10% of our equity.
The following table sets forth the stated maturities and weighted average yields of debt securities at December 31, 2012. Certain mortgage-backed securities have adjustable interest rates and will reprice annually within the various maturity ranges. These repricing schedules are not reflected in the table below. At December 31, 2012, mortgage-backed securities with adjustable rates totaled $ 2.7 million. Weighted average yields are on a tax-equivalent basis.
Table 5: Investment Maturities Schedule
| | | | | | | | | | | | | | | | | | | | |
| | | | | | | | | | | | | | | | | | | | |
| | One Year
or Less | | More than One Year to Five Years | | More than Five Years to Ten Years | | More than
Ten Years | | Total |
At December 31, 2012
(Dollars in thousands) | | Carrying Value | | Weighted Average Yield | | Carrying Value | | Weighted Average Yield | | Carrying Value | | Weighted Average Yield | | Carrying Value | | Weighted Average Yield | | Carrying Value | | Weighted Average Yield |
Securities available for sale:
| | | | | | | | | | | | | | | | | | | | | | | | | | | | | | | | | | | | | | | | |
| U.S. Government and agency | | $ | 32 | | | | 3.88 | % | | $ | 36 | | | | 1.11 | % | | $ | 10,000 | | | | 1.00 | % | | $ | 30,000 | | | | 1.49 | % | | $ | 40,068 | | | | 1.36 | % |
| Mortgage-backed | | | — | | | | — | | | | 300 | | | | 4.38 | % | | | 10,382 | | | | 1.67 | % | | | 43,738 | | | | 2.30 | % | | | 54,420 | | | | 2.22 | % |
| Corporate debt | | | — | | | | — | | | | 6,783 | | | | 2.20 | % | | | — | | | | — | | | | 4,704 | | | | 5.20 | % | | | 11,487 | | | | 3.43 | % |
| Total securities available for sale | | $ | 32 | | | | 3.88 | % | | $ | 7,119 | | | | 2.29 | % | | $ | 20,382 | | | | 1.43 | % | | $ | 78,442 | | | | 2.16 | % | | $ | 105,975 | | | | 2.03 | % |
Securities held to maturity:
| | | | | | | | | | | | | | | | | | | | | | | | | | | | | | | | | | | | | | | | |
| Mortgage-backed | | $ | — | | | | — | | | $ | — | | | | — | | | $ | 32 | | | | 5.95 | % | | $ | 1,393 | | | | 5.37 | % | | $ | 1,425 | | | | 5.38 | % |
| Municipal | | | 9,143 | | | | 1.04 | % | | | — | | | | — | | | | — | | | | — | | | | — | | | | — | | | | 9,143 | | | | 1.04 | % |
| Total held to maturity debt securities | | $ | 9,143 | | | | 1.04 | % | | $ | — | | | | — | | | $ | 32 | | | | 5.95 | % | | $ | 1,393 | | | | 5.37 | % | | $ | 10,568 | | | | 1.62 | % |
| Total | | $ | 9,175 | | | | 1.05 | % | | $ | 7,119 | | | | 2.29 | % | | $ | 20,414 | | | | 1.44 | % | | $ | 79,835 | | | | 2.22 | % | | $ | 116,543 | | | | 1.99 | % |
29
TABLE OF CONTENTS
Deposits. Our primary source of funds are retail deposit accounts held primarily by individuals and businesses within our market area. We also actively solicit deposits from municipalities in our market area. Municipal deposit accounts differ from business accounts in that we pay interest on those deposits and we pledge collateral (typically investment securities) with the New Jersey Department of Banking to secure the portion of the deposits that are not covered by federal deposit insurance. At December 31, 2012 and 2011, there were approximately $157.6 million and $118.8 million of such deposits.
Our deposit base is comprised of demand deposits, savings accounts and time deposits. Deposits increased $49.3 million, or 6.6%, in 2012. The Company continued its focus on core deposits, which increased $75.7 million, or 14.9%, to $584.3 million. The change in deposits consisted of increases in demand deposits of $39.1 million and savings accounts of $36.5 million offset by decreases in time deposits of $26.4 million. Total borrowings remained unchanged at $125.5 million, including $110.0 million of FHLB advances.
We aggressively market checking and savings accounts, as these tend to provide longer-term customer relationships and a lower cost of funding compared to time deposits. Due to our marketing efforts and sales efforts, we have been able to attract core deposits of 72.9% of total deposits at December 31, 2012, compared to 67.6% in 2011.
Table 6: Deposits
| | | | | | | | | | | | |
| | At December 31, |
| (Dollars in thousands) | | 2012 | | 2011 | | 2010 |
| | | Amount | | Percent | | Amount | | Percent | | Amount | | Percent |
| Noninterest-bearing demand deposits | | $ | 108,612 | | | | 13.6 | % | | $ | 75,551 | | | | 10.0 | % | | $ | 62,071 | | | | 10.3 | % |
| Interest-bearing demand deposits | | | 308,789 | | | | 38.5 | | | | 302,721 | | | | 40.3 | | | | 227,832 | | | | 37.8 | |
| Savings accounts | | | 166,861 | | | | 20.8 | | | | 130,324 | | | | 17.3 | | | | 102,467 | | | | 17.0 | |
| Time deposits | | | 217,503 | | | | 27.1 | | | | 243,859 | | | | 32.4 | | | | 210,964 | | | | 34.9 | |
| Total | | $ | 801,765 | | | | 100.0 | % | | $ | 752,455 | | | | 100.0 | % | | $ | 603,334 | | | | 100.0 | % |
Table 7: Time Deposit Maturities of $100,000 or More
| | |
| At December 31, 2012 (In thousands) | | Certificates of Deposit |
Maturity Period
| | | | |
| Three months or less | | $ | 16,102 | |
| Over three through six months | | | 10,785 | |
| Over six through twelve months | | | 18,479 | |
| Over twelve months | | | 34,244 | |
| Total | | $ | 79,610 | |
Borrowings. We utilize borrowings from a variety of sources to supplement our supply of funds for loans and investments and to meet deposit withdrawal requirements.
30
TABLE OF CONTENTS
Table 8: Borrowings
| | | | | | |
| | Year Ended December 31, |
| (Dollars in thousands) | | 2012 | | 2011 | | 2010 |
Maximum amount outstanding at any month end
during the period:
| | | | | | | | | | | | |
| FHLB advances | | $ | 110,000 | | | $ | 110,000 | | | $ | 110,000 | |
| Subordinated debt | | | 15,464 | | | | 15,464 | | | | 15,464 | |
Average amounts outstanding during the period:
| | | | | | | | | | | | |
| FHLB advances | | $ | 110,000 | | | $ | 110,000 | | | $ | 110,000 | |
| Subordinated debt | | | 15,464 | | | | 15,464 | | | | 15,464 | |
Weighted average interest rate during the period:
| | | | | | | | | | | | |
| FHLB advances | | | 4.24 | % | | | 4.23 | % | | | 4.23 | % |
| Subordinated debt | | | 8.67 | | | | 8.67 | | | | 8.67 | |
Balance outstanding at end of period:
| | | | | | | | | | | | |
| FHLB advances | | $ | 110,000 | | | $ | 110,000 | | | $ | 110,000 | |
| Subordinated debt | | | 15,464 | | | | 15,464 | | | | 15,464 | |
Weighted average interest rate at end of period:
| | | | | | | | | | | | |
| FHLB advances | | | 4.00 | % | | | 4.23 | % | | | 4.23 | % |
| Subordinated debt | | | 8.67 | | | | 8.67 | | | | 8.67 | |
Federal Home Loan Bank advances were unchanged at $110.0 million at December 31, 2012 from December 31, 2011. These advances mature starting in 2014 through 2017.
Subordinated debt reflects the junior subordinated deferrable interest debentures issued by us in 1998 to a business trust formed by us that issued $15.0 million of preferred securities in a private placement.
Results of Operations for the Years Ended December 31, 2012, 2011 and 2010
Table 9: Overview of 2012, 2011 and 2010
| | | | | | | | | | |
| (Dollars in thousands) | | 2012 | | 2011 | | 2010 | | % Change
2012/2011 | | % Change
2011/2010 |
| Net income | | $ | 5,001 | | | $ | 5,058 | | | $ | 5,444 | | | | (1.1) % | | | | (7.1) % | |
| Return on average assets | | | 0.48 | % | | | 0.54 | % | | | 0.66 | % | | | (11.1 | ) | | | (18.2 | ) |
| Return on average equity | | | 4.73 | % | | | 4.90 | % | | | 5.45 | % | | | (3.5 | ) | | | (10.1 | ) |
| Average equity to average assets | | | 10.20 | % | | | 11.03 | % | | | 12.17 | % | | | (7.5 | ) | | | (9.4 | ) |
2012 vs. 2011. Net income decreased $57 thousand, or 1.1%, in 2012 to $5.0 million. The decrease was due to increases in the provision for loan losses of $420 thousand and other expenses of $1.2 million offset by increases in net interest income of $732 thousand and other income of $465 thousand and a decrease in taxes of $351 thousand.
2011 vs. 2010. Net income decreased $386 thousand, or 7.1%, in 2011 to $5.1 million. The decrease was due primarily to expenses of $586 thousand (net of tax) related to the acquisition of CBHC Financialcorp, Inc and its subsidiary Select Bank. Other expenses excluding acquisition costs increased $2.0 million and were offset by increases in net interest income of $2.0 million and other income of $135 thousand and a decrease in the provision for loan losses of $419 thousand.
Net Interest Income.
2012 vs. 2011. Net interest income increased $732 thousand, or 2.8%, to $26.6 million for 2012 from $25.9 million in 2011. The increase in net interest income for 2012 was primarily attributable to a lower cost of deposits and an increase in interest earning assets offset by higher interest-bearing deposits and lower yield on earning assets.
31
TABLE OF CONTENTS
Total interest and dividend income decreased $1.2 million, or 3.2%, to $36.9 million for 2012, as a decrease in the yield on earnings assets was partially offset by an increase in the average balance of loans and investments. Interest income on loans decreased $1.6 million as the decrease in the average yield of 31 basis points to 4.87% was partially offset by an increase in the average balance of the portfolio of $11.2 million, or 1.6%. The decrease in the average yield was the result of lower rates on new loans originated. Increased balances offset by a lower yield in the investment portfolio accounted for the 17.1% increase of $374 thousand in interest income on investment securities in 2012. The average balance of the investment portfolio increased $41.9 million, or 95.3%, in 2012, while the average yield decreased 200 basis points to 2.99% as a result of lower rates earned on new investments in the portfolio.
Total interest expense decreased $2.0 million, or 16.2%, to $10.2 million for 2012 as interest paid on deposits declined while interest paid on borrowings was unchanged. The average balance of interest-bearing deposits increased $79.4 million, or 12.7%, in 2012 due to increases of $42.0 million in the average balance of interest-bearing checking, $30.2 million in the average balance of savings accounts and $7.2 million in the average balance of certificates of deposit. The increase in the average balance of deposits during 2012 was due primarily to organic growth at the branch level. The average interest rate paid on deposits decreased 38 basis points as a result of the prevailing lower interest rate environment during 2012. Interest paid on borrowings decreased $54 thousand or 0.9% in 2012. The average rate paid on borrowings decreased 4 basis points.
2011 vs. 2010. Net interest income increased $2.0 million, or 8.4%, to $25.9 million for 2011 from $23.9 million in 2010. The increase in net interest income for 2011 was primarily attributable to a lower cost of deposits and an increase in interest earning assets.
Total interest and dividend income increased $371 thousand, or 1.0%, to $38.0 million for 2011, as growth in interest income was enhanced by an increase in the average balance of loans and investments, which was partially offset by a decrease in the yield on earnings assets. Interest income on loans increased $7 thousand as the average balance of the portfolio grew $24.6 million, or 3.7%, but was offset by the average yield decrease of 19 basis points to 5.18%. The decrease in the average yield was the result of lower rates on new loans originated. Increased balances offset by a lower yield in the investment portfolio accounted for the 20.0% increase of $365 thousand in interest income on investment securities in 2011. The average balance of the investment portfolio increased $17.3 million, or 65.1%, in 2011, while the average yield decreased 188 basis points to 4.98% as a result of lower rates earned on new investments in the portfolio.
Total interest expense decreased $1.6 million, or 11.9%, to $12.2 million for 2011 as interest paid on deposits declined while interest paid on borrowings was unchanged. The average balance of interest-bearing deposits increased $99.2 million, or 18.8%, in 2011 due to increases of $58.6 million in the average balance of interest-bearing checking, $29.3 million in the average balance of savings accounts and $11.4 million in the average balance of certificates of deposit. The increase in the average balance of deposits during 2011 was due primarily to deposits acquired from Select Bank which added approximately $55 million to the average balance of deposits in 2011. The average interest rate paid on deposits decreased 50 basis points as a result of the prevailing lower interest rate environment during 2011. Interest paid on borrowings was unchanged in 2011.
32
TABLE OF CONTENTS
Table 10: Net Interest Income — Changes Due to Rate and Volume
| | | | | | | | | | | | |
| | 2012 Compared to 2011 | | 2011 Compared to 2010 |
| | | Increase (Decrease)
Due to | | | | Increase (Decrease)
Due to | | |
| (In thousands) | | Volume | | Rate | | Net | | Volume | | Rate | | Net |
Interest and dividend income:
| | | | | | | | | | | | | | | | | | | | | | | | |
| Loans receivable | | $ | 617 | | | $ | (2,228 | ) | | $ | (1,611 | ) | | $ | 187 | | | $ | (180 | ) | | $ | 7 | |
| Investment securities | | | 646 | | | | (271 | ) | | | 375 | | | | 629 | | | | (265 | ) | | | 364 | |
| Total interest-earning assets | | | 1,263 | | | | (2,499 | ) | | | (1,236 | ) | | | 816 | | | | (445 | ) | | | 371 | |
Interest expense:
| | | | | | | | | | | | | | | | | | | | | | | | |
| Deposits | | | 905 | | | | (2,820 | ) | | | (1,915 | ) | | | 2,072 | | | | (3,715 | ) | | | (1,643 | ) |
| FHLB advances | | | — | | | | (54 | ) | | | (54 | ) | | | — | | | | — | | | | — | |
| Subordinated debt | | | — | | | | — | | | | — | | | | — | | | | — | | | | — | |
| Total interest-bearing liabilities | | | 905 | | | | (2,874 | ) | | | (1,969 | ) | | | 2,072 | | | | (3,715 | ) | | | (1,643 | ) |
| Net change in interest income | | $ | 358 | | | $ | 375 | | | $ | 733 | | | $ | (1,256 | ) | | $ | 3,270 | | | $ | 2,014 | |
Provision for Loan Losses.
2012 vs. 2011. Provision for loan losses increased $420 thousand to $893 thousand in 2012 as compared to $473 thousand in 2011. The increase in the provision for loan losses for 2012 resulted from increases in reserves required on classified and non-performing loans in 2012 compared to 2011. Loan loss provisions in 2012 were primarily to maintain a reserve level deemed appropriate by management in light of factors such as the level of classified loans, non-performing loans, the level of charge-offs and the current economic conditions.
2011 vs. 2010. Provision for loan losses decreased $419 thousand to $473 thousand in 2011 as compared to $892 thousand in 2010. The decrease in the provision for loan losses for 2011 resulted from decreases in specific reserves required on non-performing loans in 2011 compared to 2010. Loan loss provisions in 2011 were primarily to maintain a reserve level deemed appropriate by management in light of factors such as the level of non-performing loans, growth in the loan portfolio, level of charge-offs and the current economic conditions.
Other Income. The following table shows the components of other income and the percentage changes from year to year.
Table 11: Other Income Summary
| | | | | | | | | | |
| (Dollars in thousands) | | 2012 | | 2011 | | 2010 | | % Change
2012/2011 | | % Change
2011/2010 |
| Service charges | | $ | 1,792 | | | $ | 1,648 | | | $ | 1,700 | | | | 8.8 | % | | | (3.1 | )% |
| Cash surrender value of life insurance | | | 633 | | | | 522 | | | | 553 | | | | 21.3 | | | | (5.6 | ) |
| Gain (loss) on sale of AFS securities | | | 65 | | | | 10 | | | | — | | | | 550.0 | | | | N/M | |
| Other | | | 1,513 | | | | 1,358 | | | | 1,150 | | | | 11.3 | | | | 18.1 | |
| Total | | $ | 4,003 | | | $ | 3,538 | | | $ | 3,403 | | | | 13.1 | % | | | 4.0 | % |
N/M — not measurable
2012 vs. 2011. Total other income increased $465 thousand, or 13.1%, in 2012 from 2011 due primarily to increases of $155 thousand in fees collected on debit card commissions, $144 thousand in service charges collected on deposit accounts and $111 thousand in income on the cash surrender value of bank-owned life insurance.
2011 vs. 2010. Total other income increased $135 thousand, or 4.0%, in 2011 from 2010 due primarily to an increase of $208 thousand in fees collected on debit card commissions offset by decreases of $52 thousand in service charges collected on deposit accounts and $31 thousand in income on the cash surrender value of bank-owned life insurance.
33
TABLE OF CONTENTS
Other Expense. The following table shows the components of other expense and the percentage changes from year to year.
Table 12: Other Expense Summary
| | | | | | | | | | |
| (Dollars in thousands) | | 2012 | | 2011 | | 2010 | | % Change
2012/2011 | | % Change
2011/2010 |
| Salaries and employee benefits | | $ | 12,330 | | | $ | 11,201 | | | $ | 9,805 | | | | 10.1 | % | | | 14.2 | % |
| Occupancy and equipment | | | 5,027 | | | | 4,620 | | | | 3,952 | | | | 8.8 | | | | 16.9 | |
| FDIC deposit insurance | | | 506 | | | | 717 | | | | 670 | | | | (29.4 | ) | | | 7.0 | |
| Advertising | | | 488 | | | | 497 | | | | 433 | | | | (1.8 | ) | | | 14.8 | |
| Professional services | | | 1,118 | | | | 1,298 | | | | 807 | | | | (13.9 | ) | | | 60.8 | |
| Supplies | | | 282 | | | | 267 | | | | 226 | | | | 5.6 | | | | 18.1 | |
| Telephone | | | 134 | | | | 123 | | | | 101 | | | | 8.9 | | | | 21.8 | |
| Postage | | | 209 | | | | 190 | | | | 171 | | | | 10.0 | | | | 11.1 | |
| Charitable contributions | | | 151 | | | | 146 | | | | 137 | | | | 3.4 | | | | 6.6 | |
| Insurance | | | 176 | | | | 161 | | | | 146 | | | | 9.3 | | | | 10.3 | |
| Real estate owned expenses | | | 51 | | | | 1 | | | | 5 | | | | N/M | | | | (80.0 | ) |
| All other | | | 1,091 | | | | 1,155 | | | | 1,070 | | | | (5.5 | ) | | | 7.9 | |
| Total | | $ | 21,563 | | | $ | 20,376 | | | $ | 17,523 | | | | 5.8 | % | | | 16.3 | % |
2012 vs. 2011. Total other expenses increased $1.2 million, or 5.8 %, to $21.6 million in 2012 compared to $20.4 million in 2011. Additional operating costs associated with two branch locations added in the 2011 acquisition of Select Bank totaled $742 thousand. The remaining expense changes were the result of normal increases and decreases in year over year operations.
2011 vs. 2010. Total other expenses increased $2.9 million, or 16.3%, to $20.4 million in 2011 compared to $17.5 million in 2010. Costs associated with the acquisition of CBHC Financialcorp and its subsidiary Select Bank accounted for $826 thousand in expenses in 2011. Costs resulting from the addition of the ongoing operations of Select Bank increased salaries and benefits $272 thousand, occupancy and equipment $180 thousand and all other expenses $64 thousand. The remaining expense increases were the result of normal increases in year over year operations.
Income Taxes.
2012 vs. 2011. Income tax expense was $3.2 million for 2012 compared to $3.5 million for 2011. The effective tax rate for 2012 was 38.9% compared to 41.1% for 2011. The decrease in income tax expense for the year ended 2012 compared to 2011 was primarily the result of lower taxable income.
2011 vs. 2010. Income tax expense was $3.5 million for 2011 compared to $3.4 million for 2010. The effective tax rate for 2011 was 41.1% compared to 38.7% for 2010. The increase in income tax expense for the year ended 2011 compared to 2010 was primarily the result of lower taxable income offset by merger expenses that are not tax deductable.
Average Balances and Yields. The following table presents information regarding average balances of assets and liabilities, the total dollar amounts of interest income and dividends from average interest-earning assets, the total dollar amounts of interest expense on average interest-bearing liabilities, and the resulting average yields and costs. The yields and costs for the periods indicated are derived by dividing income or expense by the average balances of assets or liabilities, respectively, for the periods presented. For purposes of this table, average balances have been calculated using the average daily balances and nonaccrual loans are included in average balances only. Loan fees are included in interest income on loans and are insignificant. Interest income on loans and investment securities has not been calculated on a tax equivalent basis because the impact would be insignificant.
34
TABLE OF CONTENTS
Table 13: Average Balance Tables
| | | | | | | | | | | | | | | | | | |
| | Year Ended December 31, |
| | | 2012 | | 2011 | | 2010 |
| (Dollars in Thousands) | | Average Balance | | Interest and Dividends | | Yield/ Cost | | Average Balance | | Interest and Dividends | | Yield/ Cost | | Average Balance | | Interest and Dividends | | Yield/ Cost |
Assets:
| | | | | | | | | | | | | | | | | | | | | | | | | | | | | | | | | | | | |
Interest-earning assets:
| | | | | | | | | | | | | | | | | | | | | | | | | | | | | | | | | | | | |
| Loans | | $ | 704,737 | | | $ | 34,286 | | | | 4.87 | % | | $ | 693,496 | | | $ | 35,897 | | | | 5.18 | % | | $ | 668,910 | | | $ | 35,890 | | | | 5.37 | % |
| Investment securities | | | 85,834 | | | | 2,565 | | | | 2.99 | | | | 43,943 | | | | 2,190 | | | | 4.98 | | | | 26,623 | | | | 1,826 | | | | 6.86 | |
| Total interest-earning assets | | | 790,571 | | | | 36,851 | | | | 4.66 | | | | 737,439 | | | | 38,087 | | | | 5.16 | | | | 695,533 | | | | 37,716 | | | | 5.42 | |
| Noninterest-earning assets | | | 245,494 | | | | | | | | | | | | 197,815 | | | | | | | | | | | | 125,265 | | | | | | | | | |
| Total assets | | $ | 1,036,065 | | | | | | | | | | | $ | 935,254 | | | | | | | | | | | $ | 820,798 | | | | | | | | | |
Liabilities and equity:
| | | | | | | | | | | | | | | | | | | | | | | | | | | | | | | | | | | | |
Interest-bearing liabilities:
| | | | | | | | | | | | | | | | | | | | | | | | | | | | | | | | | | | | |
| Interest-bearing demand deposits | | $ | 325,904 | | | | 845 | | | | 0.26 | % | | $ | 283,921 | | | | 1,598 | | | | 0.56 | % | | $ | 225,365 | | | | 2,389 | | | | 1.06 | % |
| Savings accounts | | | 146,688 | | | | 394 | | | | 0.27 | | | | 116,498 | | | | 759 | | | | 0.65 | | | | 87,220 | | | | 904 | | | | 1.04 | |
| Certificates of deposit | | | 232,560 | | | | 2,978 | | | | 1.28 | | | | 225,313 | | | | 3,775 | | | | 1.68 | | | | 213,945 | | | | 4,482 | | | | 2.09 | |
| Total interest-bearing deposits | | | 705,152 | | | | 4,217 | | | | 0.98 | | | | 625,732 | | | | 6,132 | | | | 0.98 | | | | 526,530 | | | | 7,775 | | | | 1.48 | |
| FHLB advances | | | 110,000 | | | | 4,659 | | | | 4.24 | | | | 110,000 | | | | 4,713 | | | | 4.29 | | | | 110,000 | | | | 4,713 | | | | 4.29 | |
| Subordinated debt | | | 15,464 | | | | 1,341 | | | | 8.67 | | | | 15,464 | | | | 1,341 | | | | 8.67 | | | | 15,464 | | | | 1,341 | | | | 8.67 | |
| Total borrowings | | | 125,464 | | | | 6,000 | | | | 4.78 | | | | 125,464 | | | | 6,054 | | | | 4.83 | | | | 125,464 | | | | 6,054 | | | | 4.83 | |
| Total interest-bearing liabilities | | | 830,616 | | | | 10,217 | | | | 1.23 | | | | 751,196 | | | | 12,186 | | | | 1.62 | | | | 651,994 | | | | 13,829 | | | | 2.12 | |
| Noninterest-bearing demand accounts | | | 88,683 | | | | | | | | | | | | 69,980 | | | | | | | | | | | | 59,825 | | | | | | | | | |
| Other | | | 11,099 | | | | | | | | | | | | 10,893 | �� | | | | | | | | | | | 9,127 | | | | | | | | | |
| Total liabilities | | | 930,398 | | | | | | | | | | | | 832,069 | | | | | | | | | | | | 720,946 | | | | | | | | | |
| Retained earnings | | | 105,667 | | | | | | | | | | | | 103,185 | | | | | | | | | | | | 99,852 | | | | | | | | | |
| Total liabilities and retained earnings | | $ | 1,036,065 | | | | | | | | | | | $ | 935,254 | | | | | | | | | | | $ | 820,798 | | | | | | | | | |
| Net interest income | | | | | | $ | 26,634 | | | | | | | | | | | $ | 25,901 | | | | | | | | | | | $ | 23,887 | | | | | |
| Interest rate spread | | | | | | | | | | | 3.43 | % | | | | | | | | | | | 3.54 | % | | | | | | | | | | | 3.30 | % |
| Net interest margin | | | | | | | | | | | 3.37 | % | | | | | | | | | | | 3.51 | % | | | | | | | | | | | 3.43 | % |
| Average interest-earning assets to average interest- bearing liabilities | | | 95.18 | % | | | | | | | | | | | 98.17 | % | | | | | | | | | | | 106.68 | % | | | | | | | | |
Risk Management
Overview. Managing risk is an essential part of successfully managing a financial institution. Our most prominent risk exposures are credit risk, interest rate risk and market risk. Credit risk is the risk of not collecting the interest and/or the principal balance of a loan or investment when it is due. Interest rate risk is the potential reduction of interest income as a result of changes in interest rates. Market risk arises from fluctuations in interest rates that may result in changes in the values of financial instruments, such as available-for-sale securities that are accounted for on a mark-to-market basis. Other risks that we face are operational risks, liquidity risks and reputation risk. Operational risks include risks related to fraud, regulatory compliance, processing errors, technology and disaster recovery. Liquidity risk is the possible inability to fund obligations to depositors, lenders or borrowers. Reputation risk is the risk that negative publicity or press, whether true or not, could cause a decline in our customer base or revenue.
Credit Risk Management. Our strategy for credit risk management focuses on having well-defined credit policies and uniform underwriting criteria and providing prompt attention to potential problem loans.
35
TABLE OF CONTENTS
Our strategy also emphasizes the origination of one- to four-family mortgage loans, which typically have lower default rates than other types of loans and are secured by collateral that generally holds its value better than other types of collateral.
When a borrower fails to make a required loan payment, we take a number of steps to have the borrower cure the delinquency and restore the loan to current status. We make initial contact with the borrower when the loan becomes 15 days past due. If payment is not then received by the 30th day of delinquency, additional letters and phone calls generally are made. Generally, when the loan becomes 60 days past due, we send a letter notifying the borrower that we will commence foreclosure proceedings if the loan is not brought current within 30 days. Generally, when the loan becomes 90 days past due, we commence foreclosure proceedings against any real property that secures the loan or attempt to repossess any personal property that secures a consumer loan. If a foreclosure action is instituted and the loan is not brought current, paid in full, or refinanced before the foreclosure sale, the real property securing the loan generally is sold at foreclosure. We may consider loan workout arrangements with certain borrowers under certain circumstances.
Management informs the board of directors monthly of the amount of loans delinquent more than 30 days, all loans in foreclosure and all foreclosed and repossessed property that we own.
Analysis of Nonperforming and Classified Assets. We consider repossessed assets and loans that are 90 days or more past due to be nonperforming assets. When a loan becomes 90 days delinquent, the loan is placed on nonaccrual status at which time the accrual of interest ceases and the allowance for any uncollectible accrued interest is established and charged against operations. Typically, payments received on a nonaccrual loan are applied to the outstanding principal and interest as determined at the time of collection of the loan.
Real estate that we acquire as a result of foreclosure or by deed-in-lieu of foreclosure is classified as real estate owned until it is sold. When property is acquired it is recorded at the lower of its cost, which is the unpaid balance of the loan, plus foreclosure costs, or fair market value at the date of foreclosure. Holding costs and declines in fair value after acquisition of the property result in charges against income.
Nonperforming assets totaled $6.7 million, or 0.64%, of total assets, at December 31, 2012, compared to $6.6 million, or 0.66%, total assets at December 31, 2011. Non-performing assets consisted of twenty residential mortgage loans totaling $3.9 million, three commercial mortgage loans totaling $1.3 million, one commercial loan totaling $200 thousand, seven consumer equity loans totaling $342 thousand and five real estate owned properties totaling $906 thousand. Specific reserves recorded for these loans at December 31, 2012 were $465 thousand.
Table 14: Nonperforming Assets
| | | | | | | | | | |
| | At December 31, |
| (Dollars in thousands) | | 2012 | | 2011 | | 2010 | | 2009 | | 2008 |
Nonaccrual loans:
| | | | | | | | | | | | | | | | | | | | |
| Real estate – mortgage loans | | $ | 3,850 | | | $ | 4,768 | | | $ | 4,282 | | | $ | 1,593 | | | $ | 1,861 | |
| Real estate – commercial and multifamily | | | 1,275 | | | | 392 | | | | 729 | | | | 139 | | | | — | |
| Real estate – construction | | | 84 | | | | — | | | | — | | | | — | | | | — | |
| Commercial | | | 200 | | | | 318 | | | | 134 | | | | 22 | | | | — | |
| Consumer | | | 342 | | | | 198 | | | | 77 | | | | 91 | | | | 112 | |
| Total | | | 5,751 | | | | 5,676 | | | | 5,222 | | | | 1,845 | | | | 1,973 | |
| Troubled debt restructurings – nonaccrual | | | — | | | | 805 | | | | — | | | | — | | | | — | |
| Total nonaccrual loans | | | 5,751 | | | | 6,481 | | | | 5,222 | | | | 1,845 | | | | 1,973 | |
| Real estate owned | | | 906 | | | | 98 | | | | 98 | | | | 98 | | | | — | |
| Total nonperforming assets | | $ | 6,657 | | | $ | 6,579 | | | $ | 5,320 | | | $ | 1,943 | | | $ | 1,973 | |
| Total nonperforming loans to total loans | | | 0.82 | % | | | 0.89 | % | | | 0.79 | % | | | 0.28 | % | | | 0.33 | % |
| Total nonperforming loans to total assets | | | 0.55 | % | | | 0.65 | % | | | 0.62 | % | | | 0.24 | % | | | 0.29 | % |
| Total nonperforming assets to total assets | | | 0.64 | % | | | 0.66 | % | | | 0.63 | % | | | 0.25 | % | | | 0.29 | % |
36
TABLE OF CONTENTS
Interest income that would have been recorded for the year ended December 31, 2012 had nonaccruing loans been current according to their original terms amounted to $273 thousand.
Federal regulations require us to review and classify our assets on a regular basis. In addition, the Office of the Comptroller of the Currency has the authority to identify problem assets and, if appropriate, require them to be classified. There are three classifications for problem assets: substandard, doubtful and loss. “Substandard assets” must have one or more defined weaknesses and are characterized by the distinct possibility that we will sustain some loss if the deficiencies are not corrected. “Doubtful assets” have the weaknesses of substandard assets with the additional characteristic that the weaknesses make collection or liquidation in full on the basis of currently existing facts, conditions and values questionable, and there is a high possibility of loss. An asset classified as “loss” is considered uncollectible and of such little value that continuance as an asset of the institution is not warranted. The regulations also provide for a “special mention” category, described as assets which do not currently expose us to a sufficient degree of risk to warrant classification but do possess credit deficiencies or potential weaknesses deserving our close attention. When we classify an asset as substandard or doubtful we establish a specific allowance for loan losses. If we classify an asset as loss, we charge off an amount equal to 100% of the portion of the asset classified loss.
Classified assets increased to $20.0 million at December 31, 2012 from $16.6 million at December 31, 2011. The increase in classified assets reflects the addition of $1.8 million in residential mortgage loans, $1.5 million in commercial mortgage loans, $84 thousand of construction loans and $390 thousand in consumer loans offset by a decrease of $245 thousand in commercial loans.
Table 15: Classified Assets
| | | | | | |
| | At December 31, |
| (In thousands) | | 2012 | | 2011 | | 2010 |
| Special mention assets | | $ | 6,551 | | | $ | 5,527 | | | $ | 1,125 | |
| Substandard assets | | | 13,497 | | | | 10,928 | | | | 10,381 | |
| Doubtful and loss assets | | | — | | | | 149 | | | | 409 | |
| Total classified assets | | $ | 20,048 | | | $ | 16,604 | | | $ | 11,915 | |
Table 16: Loan Delinquencies(1)
| | | | | | | | | | | | |
| | At December 31, |
| | | 2012 | | 2011 | | 2010 |
| (In thousands) | | 30 – 59 Days Past Due | | 60 – 89 Days Past Due | | 30 – 59 Days Past Due | | 60 – 89 Days Past Due | | 30 – 59 Days Past Due | | 60 – 89
Days Past Due |
| Real estate-mortgage loans | | $ | 2,228 | | | $ | — | | | $ | 666 | | | $ | — | | | $ | 1,584 | | | $ | — | |
| Commercial loans | | | 524 | | | | — | | | | 12 | | | | — | | | | 82 | | | | — | |
| Consumer loans | | | 404 | | | | 124 | | | | 219 | | | | 199 | | | | — | | | | — | |
| Total | | $ | 3,156 | | | $ | 124 | | | $ | 897 | | | $ | 199 | | | $ | 1,666 | | | $ | — | |
| (1) | Excludes loans that are on nonaccrual status. |
At each of the dates in the above table, delinquent mortgage loans consisted primarily of loans secured by residential real estate.
Analysis and Determination of the Allowance for Loan Losses. The allowance for loan losses is a valuation allowance for probable losses inherent in the loan portfolio as of the balance sheet date. We evaluate the need to establish allowances against losses on loans on a monthly basis. When additional allowances are necessary, a provision for loan losses is charged to earnings.
Our methodology for assessing the appropriateness of the allowance for loan losses consists of two key elements: (1) specific allowances for impaired or collateral-dependent loans; and (2) a general valuation allowance on the remainder of the loan portfolio. Although we determine the amount of each element of the allowance separately, the entire allowance for loan losses is available for the entire portfolio. See“Critical
37
TABLE OF CONTENTS
Accounting Policies, Judgments and Estimates” and note 2 of the notes to the consolidated financial statements for additional information on the determination of the allowance for loan losses.
At December 31, 2012, our allowance for loan losses represented 0.57% of total net loans. The allowance for loan losses increased to $4.0 million at December 31, 2012 from $3.8 million at December 31, 2011 due to provisions for loan losses of $893 thousand offset by net charge-offs of $658 thousand. The increase in the provision for loan losses for 2012 was primarily to maintain a reserve level deemed appropriate by management in light of factors such as the level of classified loans, non-performing loans, the level of charge-offs and the current economic conditions. At December 31, 2012, the specific allowance on impaired or collateral-dependent loans was $465 thousand and the general valuation allowance on the remainder of the loan portfolio was $3.5 million.
At December 31, 2011, our allowance for loan losses represented 0.52% of total net loans. The allowance for loan losses decreased to $3.7 million at December 31, 2011 from $4.0 million at December 31, 2010 due to provisions for loan losses of $473 thousand offset by net charge-offs of $699 thousand. The decrease in the provision for loan losses for 2011 was primarily to maintain a reserve level deemed appropriate by management in light of factors such as the level of non-performing loans, lack of growth in the loan portfolio and the current economic conditions. At December 31, 2011, the specific allowance on impaired or collateral-dependent loans was $386 thousand and the general valuation allowance on the remainder of the loan portfolio was $3.3 million.
Table 17: Allocation of Allowance for Loan Losses
| | | | | | | | | | | | | | | | | | |
| | At December 31, |
| | | 2012 | | 2011 | | 2010 |
| (Dollars in thousands) | | Amount | | % of Allowance to Total Allowance | | % of Loans in Category to Total Loans | | Amount | | % of Allowance to Total Allowance | | % of Loans in Category to Total Loans | | Amount | | % of Allowance to Total Allowance | | % of Loans in Category to Total Loans |
| Real estate-mortgage loans | | $ | 3,094 | | | | 77.4 | % | | | 85.4 | % | | $ | 2,973 | | | | 79.0 | % | | | 85.8 | % | | $ | 3,013 | | | | 75.6 | % | | | 85.3 | % |
| Real estate-construction loans | | | 187 | | | | 4.7 | | | | 2.5 | | | | 98 | | | | 2.6 | | | | 1.6 | | | | 32 | | | | 0.8 | | | | 2.0 | |
| Commercial | | | 286 | | | | 7.2 | | | | 3.3 | | | | 229 | | | | 6.1 | | | | 3.3 | | | | 269 | | | | 6.7 | | | | 3.4 | |
| Consumer | | | 430 | | | | 10.7 | | | | 8.8 | | | | 462 | | | | 12.3 | | | | 9.3 | | | | 674 | | | | 16.9 | | | | 9.3 | |
Total allowance for
loan losses | | $ | 3,997 | | | | 100.0 | % | | | 100.0 | % | | $ | 3,762 | | | | 100.0 | % | | | 100.0 | % | | $ | 3,988 | | | | 100.0 | % | | | 100.0 | % |
| | | | | | | | | | | | |
| | At December 31, |
| | | 2009 | | 2008 |
| (Dollars in Thousands) | | Amount | | % of Allowance to Total Allowance | | % of Loans in Category to Total Loans | | Amount | | % of Allowance to Total Allowance | | % of
Loans in
Category
to Total
Loans |
| Real estate-mortgage loans | | $ | 2,745 | | | | 79.0 | % | | | 86.1 | % | | $ | 1,693 | | | | 63.1 | % | | | 85.3 | % |
| Real estate-construction loans | | | 49 | | | | 1.4 | | | | 1.2 | | | | 39 | | | | 1.5 | | | | 1.5 | |
| Commercial | | | 276 | | | | 7.9 | | | | 3.4 | | | | 605 | | | | 22.5 | | | | 2.9 | |
| Consumer | | | 406 | | | | 11.7 | | | | 9.3 | | | | 347 | | | | 12.9 | | | | 10.3 | |
| Total allowance for loan losses | | $ | 3,476 | | | | 100.0 | % | | | 100.0 | % | | $ | 2,684 | | | | 100.0 | % | | | 100.0 | % |
Although we believe that we use the best information available to establish the allowance for loan losses, future adjustments to the allowance for loan losses may be necessary and our results of operations could be adversely affected if circumstances differ substantially from the assumptions used in making the determinations. Furthermore, while we believe we have established our allowance for loan losses in conformity with generally accepted accounting principles, there can be no assurance that regulators, in reviewing our loan portfolio, will not request us to increase our allowance for loan losses. In addition, because future events affecting borrowers and collateral cannot be predicted with certainty, there can be no assurance that the existing allowance for loan losses is adequate or that increases will not be necessary should the quality of any loans deteriorate as a result of the factors discussed above. Any material increase in the allowance for loan losses may adversely affect our financial condition and results of operations.
38
TABLE OF CONTENTS
Table 18: Analysis of Loan Loss Experience
| | | | | | | | | | |
| | Year Ended December 31, |
| (Dollars in thousands) | | 2012 | | 2011 | | 2010 | | 2009 | | 2008 |
| Allowance at beginning of period | | $ | 3,762 | | | $ | 3,988 | | | $ | 3,476 | | | $ | 2,684 | | | $ | 2,307 | |
| Provision for loan losses | | $ | 893 | | | $ | 473 | | | $ | 892 | | | $ | 1,251 | | | $ | 373 | |
Charge-offs:
| | | | | | | | | | | | | | | | | | | | |
| Real estate-mortgage loans | | | 557 | | | | 559 | | | | 16 | | | | 420 | | | | — | |
| Real estate-construction loans | | | — | | | | — | | | | — | | | | — | | | | — | |
| Commercial loans | | | 29 | | | | 90 | | | | 47 | | | | — | | | | — | |
| Consumer loans | | | 105 | | | | 51 | | | | 317 | | | | 40 | | | | — | |
| Total charge-offs | | | 691 | | | | 700 | | | | 380 | | | | 460 | | | | — | |
Recoveries:
| | | | | | | | | | | | | | | | | | | | |
| Real estate-mortgage loans | | | 13 | | | | — | | | | — | | | | — | | | | — | |
| Real estate-construction loans | | | — | | | | — | | | | — | | | | — | | | | — | |
| Commercial loans | | | 20 | | | | — | | | | — | | | | — | | | | — | |
| Consumer loans | | | — | | | | 1 | | | | — | | | | 1 | | | | 4 | |
| Total recoveries | | | 33 | | | | 1 | | | | — | | | | 1 | | | | 4 | |
| Net charge-offs (recoveries) | | | 658 | | | | 699 | | | | 380 | | | | 459 | | | | (4 | ) |
| Allowance at end of period | | $ | 3,997 | | | $ | 3,762 | | | $ | 3,988 | | | $ | 3,476 | | | $ | 2,684 | |
| Allowance to nonperforming loans | | | 69.5 | % | | | 58.0 | % | | | 76.4 | % | | | 188.4 | % | | | 136.0 | % |
| Allowance to total loans outstanding at the end of the period | | | 0.57 | % | | | 0.52 | % | | | 0.60 | % | | | 0.52 | % | | | 0.45 | % |
| Net charge-offs to average loans outstanding during the period | | | 0.09 | % | | | 0.10 | % | | | 0.06 | % | | | 0.07 | % | | | N/M | |
N/M — not measurable as nonperforming loans and charge-offs are not material enough to allow for meaningful calculations.
In 2012, we experienced charge-offs of $691 thousand on 18 loans based on current appraisals of properties securing non-performing loans.
Interest Rate Risk Management. We manage the interest rate sensitivity of our interest-bearing liabilities and interest-earning assets in an effort to minimize the adverse effects of changes in the interest rate environment. Deposit accounts typically react more quickly to changes in market interest rates than mortgage loans because of the shorter maturities of deposits. To reduce the potential volatility of our earnings, we have sought to improve the match between asset and liability maturities and rates, while maintaining an acceptable interest rate spread. We have adopted an interest rate risk action plan pursuant to which we manage our interest rate risk. Under this plan, we have: periodically sold fixed-rate mortgage loans; extended the maturities of our borrowings; increased commercial lending, which emphasizes the origination of shorter term, prime-based loans; emphasized the generation of core deposits, which provides a more stable, lower cost funding source; and structured our investment portfolio to include more liquid securities. We currently do not participate in hedging programs, interest rate swaps or other activities involving the use of derivative financial instruments.
We have an Asset/Liability Committee, which includes members of both the board of directors and management, to communicate, coordinate and control all aspects involving asset/liability management. The committee establishes and monitors the volume, maturities, pricing and mix of assets and funding sources with the objective of managing assets and funding sources to provide results that are consistent with liquidity, growth, risk limits and profitability goals.
Net Interest Income Simulation Analysis. We analyze our interest rate sensitivity position to manage the risk associated with interest rate movements through the use of interest income simulation. The matching of assets and liabilities may be analyzed by examining the extent to which such assets and liabilities are
39
TABLE OF CONTENTS
“interest sensitive.” An asset or liability is said to be interest rate sensitive within a specific time period if it will mature or reprice within that time period.
Our goal is to manage asset and liability positions to moderate the effects of interest rate fluctuations on net interest income. Interest income simulations are completed quarterly and presented to the Asset/Liability Committee. The simulations provide an estimate of the impact of changes in interest rates on net interest income under a range of assumptions. The numerous assumptions used in the simulation process are reviewed by the Asset/Liability Committee on a quarterly basis. Changes to these assumptions can significantly affect the results of the simulation. The simulation incorporates assumptions regarding the potential timing in the repricing of certain assets and liabilities when market rates change and the changes in spreads between different market rates. The simulation analysis incorporates management’s current assessment of the risk that pricing margins will change adversely over time due to competition or other factors.
Simulation analysis is only an estimate of our interest rate risk exposure at a particular point in time. We continually review the potential effect changes in interest rates could have on the repayment of rate sensitive assets and funding requirements of rate sensitive liabilities.
The table below sets forth an approximation of our exposure as a percentage of estimated net interest income for the next 12- and 24-month periods using interest income simulation. The simulation uses projected repricing of assets and liabilities at December 31, 2012 on the basis of contractual maturities, anticipated repayments and scheduled rate adjustments. Prepayment rates can have a significant impact on interest income simulation. Because of the large percentage of loans and mortgage-backed securities we hold, rising or falling interest rates have a significant impact on the prepayment speeds of our earning assets that in turn affect the rate sensitivity position. When interest rates rise, prepayments tend to slow. When interest rates fall, prepayments tend to rise. Our asset sensitivity would be reduced if prepayments slow and vice versa. While we believe such assumptions to be reasonable, there can be no assurance that assumed prepayment rates will approximate actual future mortgage-backed security and loan repayment activity.
Table 19: Net Interest Income Simulation
| | | | |
| | At December 31, 2012 Percentage Change in Estimated Net Interest Income Over |
| | | 12 Months | | 24 Months |
| 200 basis point increase in rates | | | 12.01 | % | | | 15.82 | % |
| 100 basis point decrease in rates | | | (1.92 | ) | | | (4.89 | ) |
Management believes that under the current rate environment, a change of interest rates downward of 200 basis points is not possible as the treasury yield curve is below 200 basis points for maturities of 2 years or less. Therefore, management has deemed a change in interest rates downward of 200 basis points not measurable. This limit will be re-evaluated periodically and may be modified as appropriate.
The 200 and 100 basis point changes in rates in the above table is assumed to occur evenly over the following 12- and 24- months. Based on the scenario above, net interest income would be positively affected (within our internal guidelines) in the 12- and 24-month periods if rates rose by 200 basis points. Additionally, if rates declined by 100 basis points net interest income would be negatively affected (within our internal guidelines) in the 12- and 24-month periods.
Economic Value of Equity Analysis. In addition to a net interest income simulation analysis, we use an interest rate sensitivity analysis prepared by the Office of the Comptroller of the Currency to review our level of interest rate risk. This analysis measures interest rate risk by computing changes in economic value of equity of our cash flows from assets, liabilities and off-balance sheet items in the event of a range of assumed changes in market interest rates. Economic value of equity represents the market value of portfolio equity and is equal to the market value of assets minus the market value of liabilities, with adjustments made for off-balance sheet items. This analysis assesses the risk of loss in market risk sensitive instruments in the event of a sudden and sustained 50 to 300 basis point increase or 50 to 100 basis point decrease in market interest rates with no effect given to any steps that we might take to counter the effect of that interest rate movement. We measure interest rate risk by modeling the changes in net portfolio value over a variety of interest rate scenarios. The following table, which is based on information that we provide to the Office of the Comptroller
40
TABLE OF CONTENTS
of the Currency, presents the change in our net portfolio value at December 31, 2012 that would occur in the event of an immediate change in interest rates based on Office of the Comptroller of the Currency assumptions, with no effect given to any steps that we might take to counteract that change.
Table 20: EVE Analysis
| | | | | | | | | | |
| | Economic Value of Equity
(Dollars in Thousands) | | Economic Value of Equity as
% of Portfolio Value of Assets |
| Basis Point (“bp”) Change in Rates | | $ Amount | | $ Change | | % Change | | EVE Ratio | | Change |
| 300 bp | | $ | 117,062 | | | $ | (15,277 | ) | | | (11.54 | )% | | | 11.81 | % | | | (60)bp | |
| 200 | | | 124,585 | | | | (7,753 | ) | | | (5.86 | ) | | | 12.23 | | | | (18 | ) |
| 100 | | | 129,194 | | | | (3,145 | ) | | | (2.38 | ) | | | 12.37 | | | | (4 | ) |
| 50 | | | 130,435 | | | | (1,904 | ) | | | (1.44 | ) | | | 12.36 | | | | (5 | ) |
| 0 | | | 132,339 | | | | — | | | | — | | | | 12.41 | | | | — | |
| (50) | | | 129,572 | | | | (2,767 | ) | | | (2.09 | ) | | | 12.07 | | | | (34 | ) |
| (100) | | | 127,317 | | | | (5,022 | ) | | | (3.79 | ) | | | 11.82 | | | | (59 | ) |
The Company uses certain assumptions in assessing its interest rate risk. These assumptions relate to interest rates, loan prepayment rates, deposit decay rates, and the market values of certain assets under differing interest rate scenarios, among others. As with any method of measuring interest rate risk, certain shortcomings are inherent in the method of analysis presented in the foregoing table. For example, although certain assets and liabilities may have similar maturities or periods to repricing, they may react in different degrees to changes in market interest rates. Also, the interest rates on certain types of assets and liabilities may fluctuate in advance of changes in market interest rates, while interest rates on other types may lag behind changes in market rates. Additionally, certain assets, such as adjustable-rate mortgage loans, have features that restrict changes in interest rates on a short-term basis and over the life of the asset. Further, in the event of a change in interest rates, expected rates of prepayments on loans and early withdrawals from certificates could deviate significantly from those assumed in calculating the table.
Liquidity Management. The term “liquidity” refers to our ability to generate adequate amounts of cash to fund loan originations, the purchase of investment securities, deposit withdrawals, repayment of borrowings and operating expenses. Our ability to meet our current financial obligations is a function of balance sheet structure, the ability to liquidate assets and the availability of alternative sources of funds. To meet the needs of clients and manage risk, we engage in liquidity planning and management.
Our primary sources of funds consist of deposit inflows, loan repayments, maturities and sales of investment securities and borrowings from the Federal Home Loan Bank of New York. While maturities and scheduled amortization of loans and securities are predictable sources of funds, deposit flows, calls of investment securities and borrowed funds, and prepayments on loans and mortgage-backed securities are greatly influenced by general interest rates, economic conditions and competition.
We regularly adjust our investments in liquid assets based upon our assessment of (1) expected loan demand, (2) expected deposit flows, (3) yields available on interest-earning deposits and securities, and (4) the objectives of our asset/liability management policy.
Our most liquid assets are cash and cash equivalents and interest-bearing deposits. The levels of these assets depend on our operating, financing, lending and investing activities during any given period. At December 31, 2012, cash and cash equivalents totaled $163.4 million. Securities classified as available-for-sale whose market value exceeds our cost, which provide additional sources of liquidity, totaled $84.4 million at December 31, 2012. In addition, at December 31, 2012, we had the ability to borrow an additional $266.1 million from the Federal Home Loan Bank of New York, which included available overnight lines of credit of $263.6 million. On that date, we had no overnight advances outstanding.
At December 31, 2012, we had $65.4 million in commitments outstanding, which included $11.1 million in undisbursed construction loans, $29.1 million in unused home equity lines of credit and $19.0 million in commercial lines and letters of credit. Certificates of deposit due within one year of December 31, 2012 totaled $135.8 million, or 62.5% of certificates of deposit. The large percentage of certificates of deposit that mature within one year reflects customers’ hesitancy to invest their funds for long periods in the current low
41
TABLE OF CONTENTS
interest rate environment. If these maturing deposits do not remain with us, we will be required to seek other sources of funds, including other certificates of deposit and lines of credit. Depending on market conditions, we may be required to pay higher rates on such deposits or other borrowings than we currently pay on the certificates of deposit due on or before December 31, 2013. We believe, however, based on past experience that a significant portion of our certificates of deposit will remain with us. We have the ability to attract and retain deposits by adjusting the interest rates offered.
Table 21: Outstanding Loan Commitments
| | | | | | | | | | |
| | Amount of Commitment Expiration — Per Period |
| At December 31, 2012 (In thousands) | | Total | | Less than One Year | | One to Three Years | | Three to Five Years | | More Than 5 Years |
| Commitments to originate loans | | $ | 6,268 | | | $ | — | | | $ | — | | | $ | — | | | $ | 6,268 | |
| Unused portion of unsecured consumer lines of credit | | | 29 | | | | — | | | | — | | | | — | | | | 29 | |
| Unused portion of home equity lines of credit | | | 29,052 | | | | 473 | | | | 360 | | | | 1,150 | | | | 27,069 | |
| Unused portion of commercial lines of credit | | | 17,254 | | | | 16,207 | | | | 797 | | | | 68 | | | | 182 | |
| Unused portion of commercial letters of credit | | | 1,717 | | | | 1,468 | | | | 249 | | | | — | | | | — | |
| Undisbursed portion of construction loans in process | | | 11,097 | | | | 6,301 | | | | 4,796 | | | | — | | | | — | |
| Total | | $ | 65,417 | | | $ | 24,449 | | | $ | 6,202 | | | $ | 1,218 | | | $ | 33,548 | |
Table 22: Contractual Obligations
| | | | | | | | | | |
| | | | Payments due by period |
| At December 31, 2012 (In thousands) | | Total | | Less than One Year | | One to
Three Years | | Three to
Five Years | | More Than
5 Years |
| Short-term debt obligations | | $ | — | | | $ | — | | | $ | — | | | $ | — | | | $ | — | |
| Long-term debt obligations | | | 244,288 | | | | 7,192 | | | | 33,781 | | | | 138,207 | | | | 65,108 | |
| Time deposits | | | 217,474 | | | | 135,825 | | | | 70,127 | | | | 9,349 | | | | 2,173 | |
| Operating lease obligations(1) | | | 1,458 | | | | 242 | | | | 477 | | | | 386 | | | | 353 | |
| Total | | $ | 463,220 | | | $ | 143,259 | | | $ | 104,385 | | | $ | 147,942 | | | $ | 67,634 | |
| (1) | Payments are for lease of real property. |
Our primary investing activities are the origination of loans and the purchase of securities. Our primary financing activities consist of activity in deposit accounts, Federal Home Loan Bank advances and reverse repurchase agreements. Deposit flows are affected by the overall level of interest rates, the interest rates and products offered by us and our local competitors and other factors. We generally manage the pricing of our deposits to be competitive and to increase core deposit and commercial banking relationships. Occasionally, we offer promotional rates on certain deposit products to attract deposits.
Table 23: Summary of Investing and Financing Activities
| | | | | | |
| | Year Ended December 31, |
| (In thousands) | | 2012 | | 2011 | | 2010 |
Investing activities:
| | | | | | | | | | | | |
| Loan originations, net of repayments | | $ | (21,722 | ) | | $ | (14,285 | ) | | $ | 1,573 | |
| Securities purchased | | | 117,399 | | | | 55,495 | | | | 1,474 | |
| Loans purchased | | | 342 | | | | 554 | | | | 714 | |
Financing activities:
| | | | | | | | | | | | |
| Increase in deposits | | $ | 49,453 | | | $ | 26,277 | | | $ | 65,912 | |
| Increase (decrease) in FHLB advances | | | — | | | | — | | | | — | |
Increase (decrease) in securities sold under
agreements to repurchase | | | — | | | | — | | | | — | |
42
TABLE OF CONTENTS
The Company is a separate legal entity from Ocean City Home Bank and must provide for its own liquidity. In addition to its operating expenses, the Company is responsible for paying any dividends declared to its shareholders, and interest and principal on outstanding debt, if any. The Company also has repurchased shares of its common stock. The Company’s primary source of income is dividends received from Ocean City Home Bank. The amount of dividends that Ocean City Home Bank may declare and pay to the Company in any calendar year, without the receipt of prior approval from the Federal Reserve Board and the Office of the Comptroller of the Currency, but with prior notice to the Federal Reserve Board and the Office of the Comptroller of the Currency, cannot exceed net income for that year to date plus retained net income (as defined) for the preceding two calendar years. The Company received dividends from Ocean City Home Bank for the years ended December 31, 2012, 2011 and 2010 of $3.6 million, $3.2 million and $1.5 million, respectively. At December 31, 2012, the Company had liquid assets of $4.2 million.
Capital Management. We are subject to various regulatory capital requirements administered by the Office of the Comptroller of the Currency, including a risk-based capital measure. The risk-based capital guidelines include both a definition of capital and a framework for calculating risk-weighted assets by assigning balance sheet assets and off-balance sheet items to broad risk categories. Under these requirements the federal bank regulatory agencies have established quantitative measures to ensure that minimum thresholds for Tier 1 Capital, Total Capital and Leverage (Tier 1 Capital divided by average assets) ratios are maintained. Failure to meet minimum capital requirements can trigger certain mandatory and possibly additional discretionary, actions by regulators that could have a direct material effect on our operations and financial position. Under the capital adequacy guidelines and the regulatory framework for prompt corrective action, Ocean City Home Bank must meet specific capital guidelines that involve quantitative measures of assets and certain off-balance sheet items as calculated under regulatory accounting practices. It is our intention to maintain “well-capitalized” risk-based capital levels. Ocean City Home Bank’s capital amounts and classifications are also subject to qualitative judgments by the federal bank regulators about components, risk weightings, and other factors. At December 31, 2012, Ocean City Home Bank exceeded all of its regulatory capital requirements and is considered “well capitalized” under regulatory guidelines.
Off-Balance Sheet Arrangements. In the normal course of operations, we engage in a variety of financial transactions that, in accordance with accounting principles generally accepted in the United States of America, are not recorded in our financial statements. These transactions involve, to varying degrees, elements of credit, interest rate and liquidity risk. Such transactions are used primarily to manage customers’ requests for funding and take the form of loan commitments and lines of credit. For information about our loan commitments and unused lines of credit, see note 10 of the notes to the consolidated financial statements.
For the years ended December 31, 2012 and 2011, we engaged in no off-balance-sheet transactions reasonably likely to have a material effect on our financial condition, results of operations or cash flows.
Impact of Recent Accounting Pronouncements
For a discussion of the impact of recent accounting pronouncements, see note 2 of the notes to the consolidated financial statements included in this Form 10-K.
Effect of Inflation and Changing Prices
The financial statements and related financial data presented in this Form 10-K have been prepared in accordance with generally accepted accounting principles, which require the measurement of financial position and operating results in terms of historical dollars without considering the change in the relative purchasing power of money over time due to inflation. The primary impact of inflation on our operations is reflected in increased operating costs. Unlike most industrial companies, virtually all the assets and liabilities of a financial institution are monetary in nature. As a result, interest rates generally have a more significant impact on a financial institution’s performance than do general levels of inflation. Interest rates do not necessarily move in the same direction or to the same extent as the prices of goods and services.
ITEM 7A. QUANTITATIVE AND QUALITATIVE DISCLOSURES ABOUT MARKET RISK
The information required by this item is incorporated herein by reference to Part II, Item 7, and “Management’s Discussion and Analysis of Financial Condition and Results of Operations.”
43
TABLE OF CONTENTS
ITEM 8. FINANCIAL STATEMENTS AND SUPPLEMENTARY DATA
Management’s Annual Report on Internal Control Over Financial Reporting
The management of the Company is responsible for establishing and maintaining adequate internal control over financial reporting. The internal control process has been designed under our supervision to provide reasonable assurance regarding the reliability of financial reporting and the preparation of the Company’s financial statements for external reporting purposes in accordance with accounting principles generally accepted in the United States of America.
Management conducted an assessment of the effectiveness of the Company’s internal control over financial reporting as of December 31, 2012, utilizing the framework established in Internal Control — Integrated Framework issued by the Committee of Sponsoring Organizations of the Treadway Commission (COSO). Based on this assessment, management has determined that the Company’s internal control over financial reporting as of December 31, 2012 is effective.
Our internal control over financial reporting includes policies and procedures that pertain to the maintenance of records that accurately and fairly reflect, in reasonable detail, transactions and dispositions of assets; and provide reasonable assurances that: (1) transactions are recorded as necessary to permit preparation of financial statements in accordance with accounting principles generally accepted in the United States; (2) receipts and expenditures are being made only in accordance with authorizations of management and the directors of the Company; and (3) unauthorized acquisition, use, or disposition of the Company’s assets that could have a material effect on the Company’s financial statements are prevented or timely detected.
All internal control systems, no matter how well designed, have inherent limitations. Therefore, even those systems determined to be effective can provide only reasonable assurance with respect to financial statement preparation and presentation. Also, projections of any evaluation of effectiveness to future periods are subject to the risk that controls may become inadequate because of changes in conditions, or that the degree of compliance with the policies or procedures may deteriorate.
The effectiveness of the Company’s internal control over financial reporting as of December 31, 2012, has been audited by Deloitte & Touche LLP, an independent registered public accounting firm, as stated in their report which appears herein.
44
TABLE OF CONTENTS
REPORT OF INDEPENDENT REGISTERED PUBLIC ACCOUNTING FIRM
To the Board of Directors and Stockholders of
Ocean Shore Holding Co. and subsidiaries:
We have audited the internal control over financial reporting of Ocean Shore Holding Co. and subsidiaries (the “Company”) as of December 31, 2012, based on criteria established inInternal Control — Integrated Frameworkissued by the Committee of Sponsoring Organizations of the Treadway Commission. The Company's management is responsible for maintaining effective internal control over financial reporting and for its assessment of the effectiveness of internal control over financial reporting, included in the accompanying Management’s Annual Report on Internal Control over Financial Reporting. Our responsibility is to express an opinion on the Company's internal control over financial reporting based on our audit.
We conducted our audit in accordance with the standards of the Public Company Accounting Oversight Board (United States). Those standards require that we plan and perform the audit to obtain reasonable assurance about whether effective internal control over financial reporting was maintained in all material respects. Our audit included obtaining an understanding of internal control over financial reporting, assessing the risk that a material weakness exists, testing and evaluating the design and operating effectiveness of internal control based on the assessed risk, and performing such other procedures as we considered necessary in the circumstances. We believe that our audit provides a reasonable basis for our opinion.
A company's internal control over financial reporting is a process designed by, or under the supervision of, the company's principal executive and principal financial officers, or persons performing similar functions, and effected by the company's board of directors, management, and other personnel to provide reasonable assurance regarding the reliability of financial reporting and the preparation of financial statements for external purposes in accordance with generally accepted accounting principles. A company's internal control over financial reporting includes those policies and procedures that (1) pertain to the maintenance of records that, in reasonable detail, accurately and fairly reflect the transactions and dispositions of the assets of the company; (2) provide reasonable assurance that transactions are recorded as necessary to permit preparation of financial statements in accordance with generally accepted accounting principles, and that receipts and expenditures of the company are being made only in accordance with authorizations of management and directors of the company; and (3) provide reasonable assurance regarding prevention or timely detection of unauthorized acquisition, use, or disposition of the company's assets that could have a material effect on the financial statements.
Because of the inherent limitations of internal control over financial reporting, including the possibility of collusion or improper management override of controls, material misstatements due to error or fraud may not be prevented or detected on a timely basis. Also, projections of any evaluation of the effectiveness of the internal control over financial reporting to future periods are subject to the risk that the controls may become inadequate because of changes in conditions, or that the degree of compliance with the policies or procedures may deteriorate. In our opinion, the Company maintained, in all material respects, effective internal control over financial reporting as of December 31, 2012, based on the criteria established inInternal Control — Integrated Frameworkissued by the Committee of Sponsoring Organizations of the Treadway Commission.
We have also audited, in accordance with the standards of the Public Company Accounting Oversight Board (United States), the consolidated financial statements as of and for the year ended December 31, 2012 of the Company and our report dated March 18, 2013 expressed an unqualified opinion on those financial statements and included an explanatory paragraph regarding the Company’s change in the presentation of comprehensive income due to the adoption of Accounting Standards Update 2011-05.
/s/ Deloitte & Touche LLP
Philadelphia, PA
March 18, 2013
45
TABLE OF CONTENTS
REPORT OF INDEPENDENT REGISTERED PUBLIC ACCOUNTING FIRM
To the Board of Directors and Stockholders of
Ocean Shore Holding Co. and subsidiaries:
We have audited the accompanying consolidated statements of financial condition of Ocean Shore Holding Co. and subsidiaries (the “Company”) as of December 31, 2012 and 2011, and the related consolidated statements of income and comprehensive income, changes in stockholders’ equity, and cash flows for each of the three years in the period ended December 31, 2012. These consolidated financial statements are the responsibility of the Company's management. Our responsibility is to express an opinion on the consolidated financial statements based on our audits.
We conducted our audits in accordance with the standards of the Public Company Accounting Oversight Board (United States). Those standards require that we plan and perform the audit to obtain reasonable assurance about whether the financial statements are free of material misstatement. An audit includes examining, on a test basis, evidence supporting the amounts and disclosures in the financial statements. An audit also includes assessing the accounting principles used and significant estimates made by management, as well as evaluating the overall financial statement presentation. We believe that our audits provide a reasonable basis for our opinion.
In our opinion, such consolidated financial statements present fairly, in all material respects, the financial position of Ocean Shore Holding Co. and subsidiaries as of December 31, 2012 and 2011, and the results of their operations and their cash flows for each of the three years in the period ended December 31, 2012, in conformity with accounting principles generally accepted in the United States of America.
As noted in Note 2 to the consolidated financial statements, the Company changed its presentation of comprehensive income due to the adoption of Accounting Standards Update 2011-05.
We have also audited, in accordance with the standards of the Public Company Accounting Oversight Board (United States), the Company's internal control over financial reporting as of December 31, 2012, based on the criteria established inInternal Control — Integrated Framework issued by the Committee of Sponsoring Organizations of the Treadway Commission and our report dated March 18, 2013 expressed an unqualified opinion on the Company's internal control over financial reporting.
/s/ Deloitte & Touche LLP
Philadelphia, PA
March 18, 2013
46
TABLE OF CONTENTS
OCEAN SHORE HOLDING CO. AND SUBSIDIARIES
CONSOLIDATED STATEMENTS OF FINANCIAL CONDITION
(Dollars in thousands, except par value amounts)
| | | | |
| | December 31, |
| | | 2012 | | 2011 |
ASSETS
| | | | | | | | |
| Cash and amounts due from depository institutions | | $ | 8,504 | | | $ | 6,616 | |
| Interest-earning bank balances | | | 154,918 | | | | 149,037 | |
| Cash and cash equivalents | | | 163,422 | | | | 155,653 | |
| Investment securities held to maturity (estimated fair value – $10,702 at December 31, 2012 and $6,148 at December 31, 2011) | | | 10,568 | | | | 5,964 | |
| Investment securities available for sale (amortized cost – $105,978 at December 31, 2012 and $47,640 at December 31, 2011) | | | 106,206 | | | | 46,768 | |
| Loans – net of allowance for loan losses of $3,997 and $3,762 at December 31, 2012 and 2011 | | | 703,898 | | | | 727,626 | |
Accrued interest receivable:
| | | | | | | | |
| Loans | | | 2,390 | | | | 2,551 | |
| Investment securities | | | 191 | | | | 294 | |
| Federal Home Loan Bank stock – at cost | | | 6,390 | | | | 6,435 | |
| Office properties and equipment – net | | | 13,435 | | | | 14,055 | |
| Prepaid expenses and other assets | | | 5,574 | | | | 6,768 | |
| Real estate owned | | | 906 | | | | 98 | |
| Cash surrender value of life insurance | | | 22,531 | | | | 18,813 | |
| Deferred tax asset | | | 4,672 | | | | 4,484 | |
| Goodwill | | | 4,630 | | | | 4,544 | |
| Other intangible assets | | | 675 | | | | 677 | |
| TOTAL ASSETS | | $ | 1,045,488 | | | $ | 994,730 | |
LIABILITIES AND STOCKHOLDERS' EQUITY
| | | | | | | | |
LIABILITIES:
| | | | | | | | |
| Non-interest bearing deposits | | $ | 108,612 | | | $ | 75,551 | |
| Interest bearing deposits | | | 693,153 | | | | 676,904 | |
| Advances from Federal Home Loan Bank | | | 110,000 | | | | 110,000 | |
| Junior subordinated debentures | | | 15,464 | | | | 15,464 | |
| Advances from borrowers for taxes and insurance | | | 3,708 | | | | 3,999 | |
| Accrued interest payable | | | 1,257 | | | | 1,146 | |
| Other liabilities | | | 8,566 | | | | 6,986 | |
| Total liabilities | | | 940,760 | | | | 890,050 | |
COMMITMENTS AND CONTINGENCIES (Note 10)
| | | | | | | | |
STOCKHOLDERS' EQUITY:
| | | | | | | | |
Preferred stock, $.01 par value, 5,000,000 shares authorized, no
shares issued | | | — | | | | — | |
Common stock, $.01 par value, 25,000,000 shares authorized, 7,307,590 issued and 6,936,733 outstanding shares at December 31, 2012 and 7,307,590 issued and 7,291,643 outstanding shares at
December 31, 2011 | | | 73 | | | | 73 | |
| Additional paid in capital | | | 64,842 | | | | 64,409 | |
| Retained earnings – partially restricted | | | 48,518 | | | | 45,147 | |
| Treasury stock – at cost: 370,857 at December 31, 2012 and 15,947 at December 31, 2011 | | | (4,777 | ) | | | (174 | ) |
| Common stock acquired by employee benefit plans | | | (3,323 | ) | | | (3,665 | ) |
| Deferred compensation plans trust | | | (561 | ) | | | (539 | ) |
| Accumulated other comprehensive loss | | | (44 | ) | | | (571 | ) |
| Total stockholders' equity | | | 104,728 | | | | 104,680 | |
| TOTAL LIABILITIES AND STOCKHOLDERS' EQUITY | | $ | 1,045,488 | | | $ | 994,730 | |
See notes to consolidated financial statements.
47
TABLE OF CONTENTS
OCEAN SHORE HOLDING CO. AND SUBSIDIARIES
CONSOLIDATED STATEMENTS OF INCOME AND COMPREHENSIVE INCOME
(Dollars in thousands, except per share amounts)
| | | | | | |
| | Years Ended December 31, |
| | | 2012 | | 2011 | | 2010 |
INTEREST AND DIVIDEND INCOME:
| | | | | | | | | | | | |
| Taxable interest and fees on loans | | $ | 34,286 | | | $ | 35,897 | | | $ | 35,890 | |
| Taxable interest on mortgage-backed securities | | | 987 | | | | 680 | | | | 838 | |
| Non-taxable interest on municipal securities | | | 36 | | | | 79 | | | | 73 | |
| Taxable interest and dividends on investments securities | | | 1,542 | | | | 1,431 | | | | 915 | |
| Total interest and dividend income | | | 36,851 | | | | 38,087 | | | | 37,716 | |
INTEREST EXPENSE:
| | | | | | | | | | | | |
| Deposits | | | 4,217 | | | | 6,132 | | | | 7,775 | |
| Borrowings | | | 6,000 | | | | 6,054 | | | | 6,054 | |
| Total interest expense | | | 10,217 | | | | 12,186 | | | | 13,829 | |
| NET INTEREST INCOME | | | 26,634 | | | | 25,901 | | | | 23,887 | |
| PROVISION FOR LOAN LOSSES | | | 893 | | | | 473 | | | | 892 | |
NET INTEREST INCOME AFTER PROVISION FOR
LOAN LOSSES | | | 25,741 | | | | 25,428 | | | | 22,995 | |
OTHER INCOME:
| | | | | | | | | | | | |
| Service charges | | | 1,792 | | | | 1,648 | | | | 1,700 | |
| Increase in cash surrender value of life insurance | | | 633 | | | | 522 | | | | 553 | |
| Gain on sale of securities | | | 65 | | | | 10 | | | | — | |
| Other | | | 1,513 | | | | 1,358 | | | | 1,150 | |
| Total other income | | | 4,003 | | | | 3,538 | | | | 3,403 | |
OTHER EXPENSES:
| | | | | | | | | | | | |
| Salaries and employee benefits | | | 12,330 | | | | 11,201 | | | | 9,805 | |
| Occupancy and equipment | | | 5,027 | | | | 4,620 | | | | 3,952 | |
| Federal insurance premiums | | | 506 | | | | 717 | | | | 670 | |
| Advertising | | | 488 | | | | 497 | | | | 433 | |
| Professional services | | | 1,118 | | | | 1,298 | | | | 807 | |
| Real estate owned activity | | | 51 | | | | 1 | | | | 5 | |
| Charitable contributions | | | 151 | | | | 146 | | | | 137 | |
| Other operating expenses | | | 1,892 | | | | 1,896 | | | | 1,714 | |
| Total other expenses | | | 21,563 | | | | 20,376 | | | | 17,523 | |
| INCOME BEFORE INCOME TAXES | | | 8,181 | | | | 8,589 | | | | 8,876 | |
INCOME TAXES:
| | | | | | | | | | | | |
| Current | | | 3,793 | | | | 3,719 | | | | 3,933 | |
| Deferred | | | (613 | ) | | | (187 | ) | | | (502 | ) |
| Total income taxes | | | 3,180 | | | | 3,532 | | | | 3,431 | |
| NET INCOME | | $ | 5,001 | | | $ | 5,058 | | | $ | 5,444 | |
OTHER COMPREHENSIVE INCOME, NET OF TAX
| | | | | | | | | | | | |
| Unrealized gain on available for sale securities | | | 675 | | | | 60 | | | | 438 | |
| Unrealized loss on post retirement life benefit | | | (148 | ) | | | — | | | | — | |
| Total other comprehensive income, net of tax | | | 527 | | | | 60 | | | | 438 | |
| TOTAL COMPREHENSIVE INCOME | | $ | 5,528 | | | $ | 5,118 | | | $ | 5,882 | |
| Earnings per share basic | | $ | 0.75 | | | $ | 0.75 | | | $ | 0.80 | |
| Earnings per share diluted | | $ | 0.74 | | | $ | 0.74 | | | $ | 0.80 | |
See notes to consolidated financial statements.
48
TABLE OF CONTENTS
OCEAN SHORE HOLDING CO. AND SUBSIDIARIES
CONSOLIDATED STATEMENTS OF CHANGES IN STOCKHOLDERS' EQUITY
FOR THE YEARS ENDED DECEMBER 31, 2012, 2011 AND 2010
(Dollars in thousands)
| | | | | | | | | | | | | | | | |
| | Common Stock | | Additional Paid-In Capital | | Retained Earnings | | Treasury Stock | | Common Stock Acquired for Employee Benefit Plans | | Deferred Compensation Plans Trust | | Accumulated Other Comprehensive (Loss) | | Total Stockholders' Equity |
| BALANCE – January 1, 2010 | | $ | 73 | | | $ | 65,214 | | | $ | 37,935 | | | $ | — | | | $ | (4,322 | ) | | $ | (496 | ) | | $ | (1,069 | ) | | $ | 97,335 | |
Comprehensive income:
| | | | | | | | | | | | | | | | | | | | | | | | | | | | | | | | |
| Net income | | | — | | | | — | | | | 5,444 | | | | — | | | | — | | | | — | | | | — | | | | 5,444 | |
Other comprehensive income –
| | | | | | | | | | | | | | | | | | | | | | | | | | | | | | | | |
| Unrealized holding gain arising during the period (net of tax of $253) | | | — | | | | — | | | | — | | | | — | | | | — | | | | — | | | | 438 | | | | 438 | |
Comprehensive income:
| | | | | | | | | | | | | | | | | | | | | | | | | | | | | | | 5,882 | |
| Purchase of treasury stock | | | — | | | | — | | | | — | | | | (115 | ) | | | — | | | | — | | | | — | | | | (115 | ) |
Unallocated ESOP shares commited to
employees | | | — | | | | — | | | | — | | | | — | | | | 314 | | | | — | | | | — | | | | 314 | |
| Excess of fair value above cost of ESOP shares committed to be released | | | — | | | | 51 | | | | — | | | | — | | | | — | | | | — | | | | — | | | | 51 | |
| Non-vested shares | | | — | | | | 307 | | | | — | | | | — | | | | — | | | | — | | | | — | | | | 307 | |
| Stock options | | | — | | | | 92 | | | | — | | | | — | | | | — | | | | — | | | | — | | | | 92 | |
| Purchase of restricted stock shares | | | — | | | | (1,634 | ) | | | — | | | | — | | | | — | | | | — | | | | — | | | | (1,634 | ) |
Purchase of shares by deferred compensation
plans trust | | | — | | | | — | | | | — | | | | — | | | | — | | | | (20 | ) | | | — | | | | (20 | ) |
| Current year dividends declared | | | — | | | | — | | | | (1,753 | ) | | | — | | | | — | | | | — | | | | — | | | | (1,753 | ) |
| Unallocated ESOP dividends applied to ESOP loan payment | | | — | | | | — | | | | 111 | | | | — | | | | — | | | | — | | | | — | | | | 111 | |
| Proceeds from sales of common stock, net | | | — | | | | (16 | ) | | | — | | | | — | | | | — | | | | — | | | | — | | | | (16 | ) |
Exchange of shares due to 2nd step stock
offering | | | — | | | | — | | | | — | | | | — | | | | — | | | | — | | | | — | | | | — | |
| BALANCE – December 31, 2010 | | $ | 73 | | | $ | 64,014 | | | $ | 41,737 | | | $ | (115 | ) | | $ | (4,008 | ) | | $ | (516 | ) | | $ | (631 | ) | | $ | 100,554 | |
Comprehensive income:
| | | | | | | | | | | | | | | | | | | | | | | | | | | | | | | | |
| Net income | | | — | | | | — | | | | 5,058 | | | | — | | | | — | | | | — | | | | — | | | | 5,058 | |
Other comprehensive income –
| | | | | | | | | | | | | | | | | | | | | | | | | | | | | | | | |
| Unrealized holding gain arising during the period (net of tax of $44) | | | — | | | | — | | | | — | | | | — | | | | — | | | | — | | | | 60 | | | | 60 | |
Comprehensive income:
| | | | | | | | | | | | | | | | | | | | | | | | | | | | | | | 5,118 | |
| Purchase of treasury stock | | | — | | | | — | | | | — | | | | (59 | ) | | | — | | | | — | | | | — | | | | (59 | ) |
Unallocated ESOP shares commited to
employees | | | — | | | | — | | | | — | | | | — | | | | 343 | | | | — | | | | — | | | | 343 | |
| Excess of fair value above cost of ESOP shares committed to be released | | | — | | | | 55 | | | | — | | | | — | | | | — | | | | — | | | | — | | | | 55 | |
| Non-vested shares | | | — | | | | 202 | | | | — | | | | — | | | | — | | | | — | | | | — | | | | 202 | |
| Stock options | | | — | | | | 138 | | | | — | | | | — | | | | — | | | | — | | | | — | | | | 138 | |
Purchase of shares by deferred compensation
plans trust | | | — | | | | — | | | | — | | | | — | | | | — | | | | (23 | ) | | | — | | | | (23 | ) |
| Current year dividends declared | | | — | | | | — | | | | (1,751 | ) | | | — | | | | — | | | | — | | | | — | | | | (1,751 | ) |
| Unallocated ESOP dividends applied to ESOP loan payment | | | — | | | | — | | | | 103 | | | | — | | | | — | | | | — | | | | — | | | | 103 | |
| BALANCE – December 31, 2011 | | $ | 73 | | | $ | 64,409 | | | $ | 45,147 | | | $ | (174 | ) | | $ | (3,665 | ) | | $ | (539 | ) | | $ | (571 | ) | | $ | 104,680 | |
See notes to consolidated financial statements.
49
TABLE OF CONTENTS
OCEAN SHORE HOLDING CO. AND SUBSIDIARIES
CONSOLIDATED STATEMENTS OF CHANGES IN STOCKHOLDERS' EQUITY
FOR THE YEARS ENDED DECEMBER 31, 2012, 2011 AND 2010 – (Continued)
(Dollars in thousands)
| | | | | | | | | | | | | | | | |
| | | | | | | | | | | | | | | | |
| | Common Stock | | Additional Paid-In Capital | | Retained Earnings | | Treasury Stock | | Common Stock Acquired for Employee Benefit Plans | | Deferred Compensation Plans Trust | | Accumulated Other Comprehensive (Loss) | | Total Stockholders' Equity |
Comprehensive income:
| | | | | | | | | | | | | | | | | | | | | | | | | | | | | | | | |
| Net income | | | — | | | | — | | | | 5,001 | | | | — | | | | — | | | | — | | | | — | | | | 5,001 | |
Other comprehensive income –
| | | | | | | | | | | | | | | | | | | | | | | | | | | | | | | | |
| Unrealized holding loss arising from adjustment to Post Retirment Life Benefit | | | — | | | | — | | | | — | | | | — | | | | — | | | | — | | | | (148 | ) | | | (148 | ) |
| Unrealized holding gain arising during the period (net of tax of $426) | | | — | | | | — | | | | — | | | | — | | | | — | | | | — | | | | 675 | | | | 675 | |
Comprehensive income:
| | | | | | | | | | | | | | | | | | | | | | | | | | | | | | | 5,528 | |
| Purchase of treasury stock | | | — | | | | — | | | | — | | | | (4,798 | ) | | | — | | | | — | | | | — | | | | (4,798 | ) |
Unallocated ESOP shares commited to
employees | | | — | | | | — | | | | — | | | | — | | | | 342 | | | | — | | | | — | | | | 342 | |
| Excess of fair value above cost of ESOP shares committed to be released | | | — | | | | 81 | | | | — | | | | — | | | | — | | | | — | | | | — | | | | 81 | |
| Non-vested shares | | | — | | | | 204 | | | | — | | | | — | | | | — | | | | — | | | | — | | | | 204 | |
| Stock options | | | — | | | | 148 | | | | — | | | | — | | | | — | | | | — | | | | — | | | | 148 | |
| Stock options Exercised | | | — | | | | — | | | | — | | | | 195 | | | | — | | | | — | | | | — | | | | 195 | |
Purchase of shares by deferred compensation
plans trust | | | — | | | | — | | | | — | | | | — | | | | — | | | | (22 | ) | | | — | | | | (22 | ) |
| Current year dividends declared | | | — | | | | — | | | | (1,725 | ) | | | — | | | | — | | | | — | | | | — | | | | (1,725 | ) |
| Unallocated ESOP dividends applied to ESOP loan payment | | | — | | | | — | | | | 95 | | | | — | | | | — | | | | — | | | | — | | | | 95 | |
| BALANCE – December 31, 2012 | | $ | 73 | | | $ | 64,842 | | | $ | 48,518 | | | $ | (4,777 | ) | | $ | (3,323 | ) | | $ | (561 | ) | | $ | (44 | ) | | $ | 104,728 | |
See notes to consolidated financial statements.
50
TABLE OF CONTENTS
OCEAN SHORE HOLDING CO. AND SUBSIDIARIES
CONSOLIDATED STATEMENTS OF CASH FLOWS
(Dollars in thousands)
| | | | | | |
| | Years Ended December 31, |
| | | 2012 | | 2011 | | 2010 |
OPERATING ACTIVITIES:
| | | | | | | | | | | | |
| Net income | | | 5,001 | | | $ | 5,058 | | | $ | 5,444 | |
Adjustments to reconcile net income to net cash provided by operating activities:
| | | | | | | | | | | | |
| Depreciation and amortization | | | 1,338 | | | | 893 | | | | 1,157 | |
| Provision for loan losses | | | 893 | | | | 473 | | | | 892 | |
| Deferred income taxes | | | (613 | ) | | | (187 | ) | | | (502 | ) |
| Stock based compensation expense | | | 807 | | | | 737 | | | | 764 | |
| Gain on call of AFS securities | | | (65 | ) | | | (10 | ) | | | — | |
| Cash surrender value of life insurance | | | (633 | ) | | | (522 | ) | | | (553 | ) |
Changes in assets and liabilities which provided (used) cash:
| | | | | | | | | | | | |
| Accrued interest receivable | | | 264 | | | | 12 | | | | 123 | |
| Prepaid expenses and other assets | | | 1,194 | | | | (379 | ) | | | 792 | |
| Accrued interest payable | | | 111 | | | | (47 | ) | | | 1 | |
| Other liabilities | | | 1,431 | | | | 892 | | | | 492 | |
| Net cash provided by operating activities | | | 9,728 | | | | 6,920 | | | | 8,610 | |
INVESTING ACTIVITIES:
| | | | | | | | | | | | |
Principal collected on:
| | | | | | | | | | | | |
| Mortgage-backed securities available for sale | | | 4,372 | | | | 3,733 | | | | 4,639 | |
| Mortgage-backed securities held to maturity | | | 519 | | | | 521 | | | | 963 | |
| Collateralized mortgage obligations | | | — | | | | 31 | | | | — | |
| Agency securities available for sale | | | 3,750 | | | | — | | | | — | |
| Loans originated, net of repayments | | | 21,722 | | | | 14,317 | | | | 3,461 | |
Purchases of:
| | | | | | | | | | | | |
| Loans receivable | | | (342 | ) | | | (554 | ) | | | (1,174 | ) |
| Investment securities held to maturity | | | (11,143 | ) | | | (4,900 | ) | | | (1,474 | ) |
| Investment securities available for sale | | | (106,256 | ) | | | (50,595 | ) | | | — | |
| Federal Home Loan Bank stock | | | | | | | | | | | (124 | ) |
| Office properties and equipment | | | (590 | ) | | | (949 | ) | | | (383 | ) |
| Life insurance contracts | | | (3,085 | ) | | | (3,400 | ) | | | (1,500 | ) |
Proceeds from sales of:
| | | | | | | | | | | | |
| Federal Home Loan Bank stock | | | 45 | | | | 21 | | | | — | |
| Investment securities available for sale | | | — | | | | 714 | | | | 772 | |
| Premise owned | | | 177 | | | | — | | | | — | |
| Real estate owned | | | 241 | | | | 206 | | | | — | |
Proceeds from maturities and calls of:
| | | | | | | | | | | | |
| Investment securities held to maturity | | | 6,020 | | | | 1,000 | | | | 1,474 | |
| Investment securities available for sale | | | 39,735 | | | | 26,105 | | | | — | |
| Mortgage-backed securities available for sale | | | — | | | | 131 | | | | — | |
| Cash used for acquistion, net of cash acquired | | | — | | | | 27,054 | | | | — | |
| Net cash (used in) provided by investing activities | | | (44,835 | ) | | | 13,435 | | | | 6,654 | |
FINANCING ACTIVITIES:
| | | | | | | | | | | | |
| Increase in deposits | | $ | 49,452 | | | $ | 26,277 | | | $ | 65,912 | |
| Dividends paid | | | (1,725 | ) | | | (1,751 | ) | | | (1,753 | ) |
| Purchase of shares by deferred compensation plans trust | | | (22 | ) | | | (23 | ) | | | (1,654 | ) |
| Purchase of treasury stock | | | (4,798 | ) | | | (59 | ) | | | (115 | ) |
| Stock options exercised | | | 165 | | | | — | | | | — | |
| Unallocated ESOP dividends applied to ESOP loan | | | 95 | | | | 103 | | | | 111 | |
| (Decrease) increase in advances from borrowers for taxes and insurance | | | (291 | ) | | | (114 | ) | | | 88 | |
| Proceeds from issuance of common stock | | | — | | | | — | | | | (16 | ) |
| Net cash provided by financing activities | | | 42,876 | | | | 24,433 | | | | 62,573 | |
| INCREASE IN CASH AND CASH EQUIVALENTS | | | 7,769 | | | | 44,788 | | | | 77,837 | |
| CASH AND CASH EQUIVALENTS – Beginning of period | | | 155,653 | | | | 110,865 | | | | 33,028 | |
| CASH AND CASH EQUIVALENTS – End of period | | $ | 163,422 | | | $ | 155,653 | | | $ | 110,865 | |
SUPPLEMENTAL DISCLOSURES OF CASH FLOW INFORMATION – Cash paid during the period for:
| | | | | | | | | | | | |
| Interest | | $ | 10,252 | | | $ | 12,232 | | | $ | 13,828 | |
| Income taxes | | $ | 2,921 | | | $ | 3,450 | | | $ | 4,178 | |
SUPPLEMENTAL DISCLOSURES OF NON-CASH ITEMS
| | | | | | | | | | | | |
| Transfers of loans to real estate owned | | $ | 1,049 | | | $ | 206 | | | $ | — | |
See notes to consolidated financial statements.
51
TABLE OF CONTENTS
OCEAN SHORE HOLDING CO. AND SUBSIDIARIES
NOTES TO CONSOLIDATED FINANCIAL STATEMENTS
(All dollar amounts presented in the tables, except share and per share amounts, are in thousands)
1. NATURE OF OPERATIONS AND THE REORGANIZATION
Ocean Shore Holding Co. (“Company”) is the holding company for Ocean City Home Bank (“Bank”), a federally chartered savings bank. The Company is a unitary savings and loan holding company and conducts its operations primarily through the Bank. The Bank has one active subsidiary, Seashore Financial Services, LLC, which receives commissions from the sale of insurance products.
The Bank’s market area consists of Atlantic and Cape May counties, New Jersey. Through a twelve-branch network, the Bank operates as a retail banking concern in the communities of Ocean City and Marmora within Cape May County, and Linwood, Absecon, Ventnor, Margate, Mays Landing, Egg Harbor Township and Galloway Township within Atlantic County. The Bank is engaged in the business of attracting time and demand deposits from the general public, small businesses and municipalities, and investing such deposits primarily in residential mortgage loans, consumer loans and small commercial loans.
The Bank is subject to regulatory supervision and examination by the Office of the Comptroller of the Currency (the “OCC”), its primary regulator, and the Federal Deposit Insurance Corporation (the “FDIC”) which insures its deposits. The Bank is a member of and owns capital stock in the Federal Home Loan Bank (the “FHLB”) of New York, which is one of the twelve regional banks that comprise the FHLB System.
2. BASIS OF PRESENTATION AND SUMMARY OF SIGNIFICANT ACCOUNTING POLICIES
Basis of Presentation — The consolidated financial statements of the Company include the accounts of the Bank and the Bank’s wholly owned subsidiary, Seashore Financial LLC, and are presented in conformity with accounting principles generally accepted in the United States of America (“GAAP”). Intercompany accounts and transactions have been eliminated in consolidation.
Use of Estimates in the Preparation of Financial Statements — The preparation of the consolidated financial statements in conformity with GAAP requires management to make estimates and assumptions that affect the reported amounts of assets and liabilities and disclosure of contingent assets and liabilities at the date of the consolidated financial statements and the reported amounts of income and expenses during the reporting period. The most significant estimates and assumptions in the Company’s consolidated financial statements relate to the allowance for loan losses, goodwill and intangible impairment, deferred income taxes and the fair value measurements of financial instruments. Actual results could differ from those estimates.
Segment Information — In accordance with Financial Accounting Standards Board (“FASB”) Accounting Standards Update (“ASU”) FASB ASC 280,Segment Reporting (FASB ASC 280), the Company has one reportable operating segment, “Community Banking.” All of the Company’s activities are interrelated, and each activity is dependent and assessed based on how each of the activities of the Company supports the others. For example, lending is dependent upon the ability of the Company to fund itself with deposits and other borrowings, and manage interest rate and credit risk. Accordingly, all significant operating decisions are based upon analysis of the Company as one segment or unit.
Treasury Stock — Stock held in treasury by the Company is accounted for using the cost method, which treats stock held in treasury as a reduction to total stockholders’ equity.
On March 20, 2012, the Company announced that its Board of Directors authorized a stock repurchase program under which the Company will repurchase up to 365,000 shares of the Company’s outstanding common stock, or approximately 5% of outstanding shares. The repurchase program was conducted through open market purchases and completed on October 1, 2012 totaling $4.7 million at a weighted average cost of $12.96 per share.
52
TABLE OF CONTENTS
OCEAN SHORE HOLDING CO. AND SUBSIDIARIES
NOTES TO CONSOLIDATED FINANCIAL STATEMENTS
(All dollar amounts presented in the tables, except share and per share amounts, are in thousands)
2. BASIS OF PRESENTATION AND SUMMARY OF SIGNIFICANT ACCOUNTING POLICIES – (continued)
The Company held 370,857 shares in treasury stock at a cost of $4.8 million at December 31, 2012 and 15,947 shares at a cost of $174 thousand at December 31, 2011.
Concentration of Credit Risk — The majority of the Company’s loans are secured by 1 to 4 family real estate or made to businesses in Atlantic or Cape May Counties, New Jersey.
Investment Securities — The Company’s debt securities include both those that are held to maturity and those that are available for sale. The purchase and sale of the Company’s debt securities are recorded as of the trade date. At December 31, 2012 and 2011, the Company had no unsettled purchases or sales of investment securities. The following provides further information on the Company’s accounting for debt securities:
| a. | Held to Maturity — Debt securities that management has the positive intent and ability to hold until maturity are classified as held to maturity and are carried at their remaining unpaid principal balance, net of unamortized premiums or unaccreted discounts. Premiums are amortized and discounts are accreted using the interest method over the estimated remaining term of the underlying security. |
| b. | Available for Sale — Debt and equity securities that will be held for indefinite periods of time, including securities that may be sold in response to changes in market interest or prepayment rates, needs for liquidity and changes in the availability of and the yield of alternative investments, are classified as available for sale. These securities are carried at estimated fair value. Fair values are based on quoted prices for identical assets in active markets, quoted prices for similar assets in markets that are either actively or not actively traded, or, in some cases where there is limited activity or less transparency around inputs, internally developed discounted cash flow models. Unrealized gains and losses that are not concluded to be other than temporary, are excluded from earnings and are reported net of tax in other comprehensive income. Upon the sale of securities, any unamortized premium or unaccreted discount is considered in the determination of gain or loss from the sale. Realized gains and losses on the sale or call of investment securities are recorded as of the trade date, reported in the Consolidated Statements of Income and Comprehensive Income and determined using the adjusted cost of the specific security sold or called. Sales of available for sale securities for the twelve months ended December 31, 2011 totaled $714 thousand. There were no sales of available for sale securities for the twelve months ended December 31, 2012 and 2010. |
In accordance with FASB ASC 325-40,Beneficial Interests in Securitized Financial Assets, and FASB ASC 320-10,Investments — Debt and Equity Securities, the Company evaluates its debt securities portfolio for other-than-temporary impairment (“OTTI”) throughout the year. Each investment, which has a fair value less than the book value is reviewed on a quarterly basis by management. Management considers at a minimum the following factors that, both individually or in combination, could indicate that the decline is other-than-temporary: (a) the Company has the intent to sell the security; (b) it is more likely than not that it will be required to sell the security before recovery; and (c) the Company does not expect to recover the entire amortized cost basis of the security. An impairment charge is recorded if the review described above concludes that the decline in value is other-than-temporary. Among the factors that are considered in determining intent is a review of capital adequacy, interest rate risk profile and liquidity at the Company. The guidance allows the Company to bifurcate the impact on securities where impairment in value was deemed to be other than temporary between the component representing credit loss and the component representing loss related to other factors, when the security is not otherwise intended to be sold or is required to be sold. The portion of the fair value decline attributable to credit loss must be recognized through a charge to earnings. The portion of the fair value decline not attributable to credit loss is recognized through other comprehensive income. For securities accounted for under FASB ASC 310-10, the credit loss component is determined by comparing the present value of the cash flows expected to be collected, discounted at the effective interest rate
53
TABLE OF CONTENTS
OCEAN SHORE HOLDING CO. AND SUBSIDIARIES
NOTES TO CONSOLIDATED FINANCIAL STATEMENTS
(All dollar amounts presented in the tables, except share and per share amounts, are in thousands)
2. BASIS OF PRESENTATION AND SUMMARY OF SIGNIFICANT ACCOUNTING POLICIES – (continued)
implicit in the security at the date of acquisition, with the amortized cost basis of the debt security. For securities accounted for under FASB 325-40, if the present value of the original estimate at the initial transaction date (or the last date previously revised) of cash flows expected to be collected is greater than the present value of the current estimate of cash flows expected to be collected, the difference is considered to be the credit loss component. For all securities, the Company’s expected cash flow estimates include assumptions about interest rates, timing and severity of defaults, estimates of potential recoveries, the cash flow distribution from the bond indenture and other factors, The Company did not record any OTTI for the years ended December 31, 2012, 2011 and 2010.
Deferred Loan Fees — The Bank defers all loan origination fees, net of certain direct loan origination costs. The balance is accreted into income as a yield adjustment over the life of the loan using the level-yield method. Deferred loan fees are recorded as a component of “Loans — net” in the statement of financial condition.
Unearned Discounts and Premiums — Unearned discounts and premiums on loans, investments and mortgage-backed securities purchased are accreted and amortized, respectively, over the estimated life of the related asset using the interest method.
Office Properties and Equipment-Net — Office properties and equipment are recorded at cost. Depreciation is computed using the straight-line method over the expected useful lives of the related assets as follows: buildings and improvements, ten to thirty nine years or at the lesser of the life of improvement or the lease; furniture and equipment, three to seven years. The costs of maintenance and repairs are expensed as incurred, and renewals and betterments are capitalized.
Real Estate Owned — Real estate owned is comprised of property acquired through foreclosure, in lieu of deed and bank property that is not in use. The property acquired through foreclosure is carried at the lower of the related loan balance or fair value of the property based on an appraisal less estimated cost to dispose. Losses arising from foreclosure transactions are charged against the allowance for loan losses. Bank property is carried at the lower of cost or fair value less estimated cost to dispose. Costs to maintain real estate owned and any subsequent gains or losses are included in the Company’s Consolidated Statements of Operations.
Bank Owned Life Insurance — The Company has purchased life insurance policies on certain key employees. The Bank is the primary beneficiary of insurance policies on the lives of officers and employees of the Bank. These policies are recorded at their cash surrender value and the Bank has recognized any increase in cash surrender value of life insurance, net of insurance costs, in the consolidated statements of income. The cash surrender value of the insurance policies is recorded as an asset in the statements of financial condition. The company accounts for split dollar life insurance in accordance with FASB ASC 715-60,Defined Benefit Plans — Other Post-Retirement. The guidance provides for determining a liability for the postretirement benefit obligation as well as recognition and measurement of the associated asset on the basis of the terms of the collateral assignment agreement.
Allowance for Loan Losses — The allowance for loan losses is the amount estimated by management as necessary to cover losses inherent in the loan portfolio at the balance sheet date. The allowance is established through the provision for loan losses, which is charged to income. Determining the amount of the allowance for loan losses necessarily involves a high degree of judgment. Among the material estimates required to establish the allowance are the following: loss exposure at default; the amount and timing of future cash flows on impacted loans; value of collateral; and determination of loss factors to be applied to the various elements of the portfolio. All of these estimates are susceptible to significant change. Although we believe that we use the best information available to establish the allowance for loan losses, future adjustments to the allowance may be necessary if economic conditions differ substantially from the assumptions used in making the evaluation. In addition, the OCC, as an integral part of its examination process, periodically reviews our
54
TABLE OF CONTENTS
OCEAN SHORE HOLDING CO. AND SUBSIDIARIES
NOTES TO CONSOLIDATED FINANCIAL STATEMENTS
(All dollar amounts presented in the tables, except share and per share amounts, are in thousands)
2. BASIS OF PRESENTATION AND SUMMARY OF SIGNIFICANT ACCOUNTING POLICIES – (continued)
allowance for loan losses. Such agency may require us to recognize adjustments to the allowance based on its judgments about information available to it at the time of its examination. The allowance for loan losses is maintained at a level that management considers adequate to provide for estimated losses and impairment based upon an evaluation of known and inherent risk in the loan portfolio. Loan impairment is evaluated based on the fair value of collateral or estimated net realizable value. A provision for loan losses is charged to operations based on management’s evaluation of the estimated losses that have been incurred in the Company’s loan portfolio. It is the policy of management to provide for losses on unidentified loans in its portfolio in addition to classified loans.
Management monitors its allowance for loan losses monthly and makes adjustments to the allowance through the provision for loan losses as economic conditions and other pertinent factors indicate. The quarterly review and adjustment of the qualitative factors employed in the allowance methodology and the updating of historic loss experience allow for timely reaction to emerging conditions and trends. In this context, a series of qualitative factors are used in a methodology as a measurement of how current circumstances are affecting the loan portfolio.
In determining the allowance for loan losses, management has established both general pooled and specific allowances. Values assigned to the qualitative factors and those developed from historic loss experience provide a dynamic basis for the calculation of reserve factors for performing loans (general pooled allowance). The amount of the specific allowance is determined through a loan-by-loan analysis of non-performing loans. Loans not individually reviewed are evaluated as a group using reserve factor percentages based on qualitative and quantitative factors described above. In determining the appropriate level of the general pooled allowance, management makes estimates based on internal risk ratings, which take into account such factors as debt service coverage, loan-to-value ratios, and external factors. If a loan is identified as impaired and is collateral dependant, an appraisal is obtained to provide a base line in determining whether the carrying amount of the loan exceeds the net realizable value. We recognize impairment through a provision estimate or a charge-off is recorded when management determines we will not collect 100% of a loan based on foreclosure of the collateral, less cost to sell the property, or the present value of expected cash flows.
As changes in our operating environment occur and as recent loss experience fluctuates, the factors for each category of loan based on type and risk rating will change to reflect current circumstances and the quality of the loan portfolio. Given that the components of the allowance are based partially on historical losses and on risk rating changes in response to recent events, required reserves may trail the emergence of any unforeseen deterioration in credit quality.
Loans are considered past due 16 days or more past the due date. Loans are considered delinquent if 30 days or more past due. Loans over 90 days past due are placed on non-accrual status. Payments received on non-accrual loans are applied to principal, interest and escrow on mortgage loans and to accrued interest followed by principal on all other loans. Loans are returned to accrual status when no payment is over 90 days past due. Unsecured loans are charged off when becoming more than 90 days past due. Secured loans are charged off to the extent the loan amount exceeds the appraised value of the collateral when over 90 days past due and management believes the uncollectability of the loan balance is confirmed.
Interest income on impaired loans other than nonaccrual loans is recognized on an accrual basis. Interest income on nonaccrual loans is recognized only as collected.
Goodwill and Core Deposit Intangibles — Goodwill is the excess of the purchase price over the fair value of the tangible and identifiable intangible assets and liabilities of companies acquired through business combinations accounted for under the purchase method. Core deposit intangibles are a measure of the value of checking, savings and other-low cost deposits acquired in business combinations accounted for under the
55
TABLE OF CONTENTS
OCEAN SHORE HOLDING CO. AND SUBSIDIARIES
NOTES TO CONSOLIDATED FINANCIAL STATEMENTS
(All dollar amounts presented in the tables, except share and per share amounts, are in thousands)
2. BASIS OF PRESENTATION AND SUMMARY OF SIGNIFICANT ACCOUNTING POLICIES – (continued)
purchase method. Core deposit intangibles are amortized over the estimated useful lives of the existing deposit relationships acquired, but not exceeding 15 years. The Company evaluates the identifiable intangibles for impairment when an indicator of impairment exists, but not less than annually. Separable intangible assets that are not deemed to have an indefinite life continue to be amortized over their useful lives.
Goodwill is not amortized on a recurring basis, but rather is subject to periodic impairment testing. Management performs an annual goodwill impairment test and whenever events occur or circumstances change that indicates the fair value of a reporting unit may be below its carrying value.
Loans Held for Sale and Loans Sold — The Bank originates mortgage loans held for investment and for sale. At origination, the mortgage loan is identified as either held for sale or for investment. Mortgage loans held for sale are carried at the lower of cost or forward committed contracts (which approximates market), determined on a net aggregate basis. The Bank had no loans classified as held for sale at December 31, 2012 and 2011.
Income Taxes — The Company accounts for income taxes in accordance with FASB ASC 740,Income Taxes.FASB ASC 740 requires the recording of deferred income taxes that reflect the net tax effects of temporary differences between the carrying amounts of assets and liabilities for financial reporting purposes and the amounts used for income tax purposes. Under this method, deferred tax assets and liabilities are recognized for the future tax consequences attributable to differences between the financial statement carrying amounts of existing assets and liabilities and their respective tax bases. If current available information raises doubt as to the realization of the deferred tax assets, a valuation allowance is established. Deferred tax assets and liabilities are measured using enacted tax rates expected to apply to taxable income in the years in which those temporary differences are expected to be recovered or settled. We exercise significant judgment in evaluating the amount and timing of recognition of the resulting tax liabilities and assets. These judgments require us to make projections of future taxable income as well as judgments about availability of capital gains. The judgments and estimates we make in determining our deferred tax assets, which are inherently subjective, are reviewed on a continual basis as regulatory and business factors change. Any reduction in estimated future taxable income may require us to record an additional valuation allowance against our deferred tax assets. Further, an inability to employ a qualifying tax strategy to utilize our deferred tax asset arising from capital losses may give rise to an additional valuation allowance. An increase in the valuation allowance would result in additional income tax expense in the period, which would negatively affect earnings. FASB ASC 740 prescribes a minimum probability threshold that a tax position must meet before a financial statement benefit is recognized. When applicable, we recognize interest and penalties related to unrecognized tax benefits in the provision for income taxes in the consolidated statement of income. Assessment of uncertain tax positions under FASB ASC 740 requires careful consideration of the technical merits of a position based on management’s analysis of tax regulations and interpretations. Judgment may be involved in applying the requirements of FASB ASC 740.
Our adherence to FASB ASC 740 may result in increased volatility in quarterly and annual effective income tax rates, as FASB ASC 740 requires that any change in judgment or change in measurement of a tax position taken in a prior period be recognized as a discrete event in the period in which it occurs. Factors that could impact management’s judgment include changes in income, tax laws and regulations, and tax planning strategies.
Interest Rate Risk — The Bank is engaged principally in providing first mortgage loans to borrowers. At December 31, 2012 and 2011, approximately two-thirds of the Bank’s assets consisted of assets that earned interest at fixed interest rates. Those assets were funded with long-term fixed rate liabilities and with short-term liabilities that have interest rates that vary with market rates over time. The shorter duration of the interest-sensitive liabilities indicates that the Bank is exposed to interest rate risk because, in a rising rate
56
TABLE OF CONTENTS
OCEAN SHORE HOLDING CO. AND SUBSIDIARIES
NOTES TO CONSOLIDATED FINANCIAL STATEMENTS
(All dollar amounts presented in the tables, except share and per share amounts, are in thousands)
2. BASIS OF PRESENTATION AND SUMMARY OF SIGNIFICANT ACCOUNTING POLICIES – (continued)
environment, liabilities will be repricing faster at higher interest rates, thereby reducing the market value of long-term assets and net interest income.
Earnings Per Share — Basic earnings per share is computed by dividing net income available to common shareholders by the weighted average number of shares of common stock outstanding, net of any treasury shares, during the period. Diluted earnings per share is calculated by dividing net income available to common shareholders by the weighted average number of shares of common stock outstanding, net of any treasury shares, after consideration of the potential dilutive effect of common stock equivalents, based upon the treasury stock method using an average market price of common shares sold during the period.
Other Comprehensive Income (Loss) — The Company classifies items of other comprehensive income (loss) by their nature and displays the accumulated balance of other comprehensive income (loss) separately from retained earnings and additional paid-in capital in the equity section of the Consolidated Statements of Financial Condition. Amounts categorized as other comprehensive income (loss) represent net unrealized gains or losses on investment securities available for sale and post retirement benefits, net of tax of $426 thousand. Reclassifications are made to avoid double counting in comprehensive income (loss) items which are displayed as part of net income for the period. There are no reclassifications during the periods presented. The following table presents the changes in Accumulated Other Comprehensive Income (Loss) by component as of December 31, 2012.
| | | | | | |
| | Accumulated Other Comprehensive Income (Loss) Year Ended December 31, 2012 |
| | | Unrealized Gains (Loss) on AFS Securities | | Unrealized Loss on Post Retirement Life | | Accumulated Other Comprehensive Income |
| Beginning balance | | $ | (571 | ) | | $ | — | | | $ | (571 | ) |
| Current-period change | | | 675 | | | | (148 | ) | | | 527 | |
| Ending Balance | | $ | 104 | | | $ | (148 | ) | | $ | (44 | ) |
Stock Based Compensation — Stock-based compensation is accounted for in accordance with FASB ASC 718,Compensation — Stock Compensation. The Company establishes fair value for its equity awards to determine their cost. The Company recognizes the related expense for employees over the appropriate vesting period, or when applicable, service period. However, consistent with the stock compensation topic of the FASB Accounting Standards Codification, the amount of stock-based compensation recognized at any date must at least equal the portion of the grant date value of the award that is vested at that date and as a result it may be necessary to recognize the expense using a ratable method. In accordance with FASB ASC 505-50,Equity-Based Payments to Non-Employees, the compensation expense for non-employees is recognized on the grant date, or when applicable, the service period.
The Company’s 2005 and 2010 Equity-Based Incentive Plans (the “Equity Plans”) authorize the issuance of shares of common stock pursuant to awards that may be granted in the form of stock options to purchase common stock (“options”) and awards of shares of common stock (“stock awards”). The purpose of the Equity Plans is to attract and retain personnel for positions of substantial responsibility and to provide additional incentive to certain officers, directors, advisory directors, employees and other persons to promote the success of the Company. Under the Equity Plans, options expire ten years after the date of grant, unless terminated earlier under the option terms. A committee of non-employee directors has the authority to determine the conditions upon which the options granted will vest. Options are granted at the then fair market value of the Company’s stock.
57
TABLE OF CONTENTS
OCEAN SHORE HOLDING CO. AND SUBSIDIARIES
NOTES TO CONSOLIDATED FINANCIAL STATEMENTS
(All dollar amounts presented in the tables, except share and per share amounts, are in thousands)
2. BASIS OF PRESENTATION AND SUMMARY OF SIGNIFICANT ACCOUNTING POLICIES – (continued)
Determining the fair value of Stock-based awards at measurement date requires judgment, including estimating the expected term of the stock options and the expected volatility of the Company’s stock. In addition, judgment is required in estimating the amount of stock-based awards that are expected to be forfeited. If actual results differ significantly from these estimates or different key assumptions were used, it could have a material effect on the Company’s consolidated financial statements.
In accordance with FASB ASC 718, the fair value of the stock options granted is estimated on the date of the grant using the Black-Scholes option pricing model which uses the assumptions noted in the table below. Stock options have been historically granted a for a 10 year term. The risk-free interest rate is based on the U.S. Treasury yield curve in effect at the time of the grant. The expected term of the option is the estimated time the option will be exercised. The expected volatility is based on the historical volatility of the Company’s stock price.
Weighted Average Assumptions Used in Balck-Scholes Option Pricing Model
| | | | | | |
| Years Ended December 31, | | 2012 | | 2011 | | 2010 |
| Fair value of options granted during the year | | $ | 2.90 | | | $ | 2.77 | | | $ | 2.76 | |
| Risk-free rate of return | | | 0.97 | % | | | 1.14 | % | | | 1.15 | % |
| Expected term in months | | | 72 | | | | 72 | | | | 72 | |
| Expected volatility | | | 35 | % | | | 46 | % | | | 45 | % |
| Expected dividends | | $ | 0.24 | | | $ | 0.24 | | | $ | 0.24 | |
The Equity Plans also authorize the grant of stock options to officers, employees and directors of the Company to acquire shares of common stock with an exercise price equal to the fair market value of the common stock on the grant date. Options will generally become vested and exercisable at the rate of 20% per year over five years. A total of 649,313 shares of common stock have been approved for issuance pursuant to the grant of stock options under the Equity Plans of which 17,500 options were granted on November 19, 2012, 53,018 options were awarded on August 17, 2011, 13,600 options were awarded on March 15, 2011, 257,010 options were awarded on August 18, 2010, 34,182 were options were awarded on November 20, 2007, 21,103 options were awarded on November 21, 2006 and 348,203 options were awarded on August 10, 2005. At December 31, 2012, 19,000 options issued in 2010, 3,516 options issued in 2007, 3,517 options issued in 2006 and 54,077 options issued in 2005 have been forfeited. At December 31, 2012, 15,193 shares have been exercised.
In June 2010, the shareholders of the Company approved the adoption of the 2010 Equity Based Incentive Plan (the “2010 Equity Plan”). The 2010 Equity Plan provides for the grant of shares of common stock of the Company to officers, directors and employees of the Company. In order to fund the grant of shares under the 2010 Equity Plan, the Company established the Equity Plan Trust (the “Trust”) which purchased 141,306 shares of the Company’s common stock in the open market for approximately $1.6 million, resulting in an average price of $11.53 per share. The Company made sufficient contributions to the Trust to fund these purchases. No additional purchases are expected to be made by the Trust under this plan.
Common Stock Acquired for Employee Benefit Plans — Unearned ESOP shares are not considered outstanding for calculating net income per common share and are shown as a reduction of stockholders’ equity and presented as Common Stock Acquired for Employee Benefit Plans. During the period the ESOP shares are committed to be released, the Company recognizes compensation cost equal to the fair value of the ESOP shares. When the shares are released, Common Stock Acquired for Employee Benefit Plans is reduced by the cost of the ESOP shares released and the differential between the fair value and the cost is charged/credited to additional paid-in capital. The loan receivable from the ESOP to the Company is not reported as an asset nor
58
TABLE OF CONTENTS
OCEAN SHORE HOLDING CO. AND SUBSIDIARIES
NOTES TO CONSOLIDATED FINANCIAL STATEMENTS
(All dollar amounts presented in the tables, except share and per share amounts, are in thousands)
2. BASIS OF PRESENTATION AND SUMMARY OF SIGNIFICANT ACCOUNTING POLICIES – (continued)
is the debt of the ESOP reported as a liability in the Company’s consolidated financial statements. At December 31, 2012 and 2011, unearned ESOP shares totaled 361,036 and 395,302 shares, respectively.
Statement of Cash Flows — For purposes of reporting cash flows, cash and cash equivalents include cash on hand, amounts due from banks, interest-bearing deposits and federal funds sold. Generally, federal funds are purchased and sold for one-day periods.
New Accounting Pronouncements — In September 2011, the FASB issued ASU 2011-08,Testing Goodwill for Impairment. This update amends the current guidance on testing goodwill for impairment. Under the revised guidance, entities testing goodwill for impairment have the option of performing a qualitative assessment before calculating the fair value of the reporting unit. If entities determine, on the basis of qualitative factors, that the fair value of the reporting unit is more likely than not less than the carrying amount, the two-step impairment test would be required. This update does not change how goodwill is calculated or assigned to reporting units, nor does it revise the requirement to test goodwill annually for impairment. In addition, the update does not amend the requirement to test goodwill for impairment between annual tests if events or circumstances warrant; however, it does revise the examples of events and circumstances that an entity should consider. The amendment was effective for annual and interim goodwill impairment tests performed for fiscal years beginning after December 15, 2011, with early adoption permitted. The adoption of this accounting guidance did not have a material impact on the Company’s consolidated financial statements.
In June 2011, the FASB issued ASU 2011-05,Presentation of Comprehensive Income. This update to comprehensive income guidance requires all non-owner changes in stockholders’ equity be presented either in a single continuous statement of comprehensive income or two separate but consecutive statements. In the two-statement approach, the first statement should present total net income and its components followed consecutively by a second statement that should present total other comprehensive income, the components of other comprehensive income, and the total of comprehensive income. The new accounting guidance was effective beginning January 1, 2012 and was applied retrospectively. The adoption of this update impacted the presentation and disclosure of the Company’s financial statements but did not impact its results of operations, financial position, or cash flows.
In May 2011, the FASB issued ASU 2011-04,Amendments to Achieve Common Fair Value Measurement and Disclosure Requirements in U.S. GAAP and International Financial Reporting Standards. This update to fair value measurement guidance addresses changes to concepts regarding performing fair value measurements including: (i) the application of the highest and best use and valuation premise; (ii) the valuation of an instrument classified in the reporting entity’s shareholders’ equity; (iii) the valuation of financial instruments that are managed within a portfolio; and (iv) the application of premiums and discounts. This update also enhances disclosure requirements about fair value measurements, including providing information regarding Level 3 measurements such as quantitative information about unobservable inputs, further discussion of the valuation processes used and assumption sensitivity analysis. The new accounting guidance was effective beginning January 1, 2012, and was applied prospectively. The adoption of this update impacted the presentation and disclosure of the Company’s financial statements but did not impact its results of operations, financial position, or cash flows.
In December 2011, the FASB issued ASU No. 2011-12, ASU No. 2011-12,Comprehensive Income (Topic 220): Deferral of the Effective Date for Amendments to the Presentation of Reclassifications of Items Out of Accumulated Other Comprehensive Income in Accounting Standards Update No. 2011-05. This update defers the effective date for the part of ASU No. 2011-05 that would have required adjustments of items out of accumulated other comprehensive income to be presented on the components of both net income and other comprehensive income in the financial statements until FASB can adequately evaluate the costs and benefits of
59
TABLE OF CONTENTS
OCEAN SHORE HOLDING CO. AND SUBSIDIARIES
NOTES TO CONSOLIDATED FINANCIAL STATEMENTS
(All dollar amounts presented in the tables, except share and per share amounts, are in thousands)
2. BASIS OF PRESENTATION AND SUMMARY OF SIGNIFICANT ACCOUNTING POLICIES – (continued)
this presentation requirement. The new accounting guidance was effective beginning January 1, 2012 and was applied retrospectively. The adoption of this update impacted the presentation and disclosure of the Company’s financial statements but did not impact its results of operations, financial position, or cash flows.
In July 2012, the FASB issued ASU No. 2012-02,Testing Indefinite-Lived Intangible Assets for Impairment. This update amends the current guidance on testing indefinite-lived intangible assets for impairment. Under the revised guidance, entities testing indefinite-lived intangible assets for impairment have the option of performing a qualitative assessment before calculating the fair value of the asset. An entity will have an option not to calculate annually the fair value of an indefinite-lived intangible asset if the entity determines that it is not more likely than not that the asset is impaired. The amendments are effective for annual and interim indefinite-lived intangible assets impairment tests performed for fiscal years beginning after September 15, 2012, with early adoption permitted. The adoption of this accounting guidance did not have a material impact on the Company’s consolidated financial statements.
In February 2013, the FASB issued ASU 2013-02,Other Comprehensive Income. This update requires companies to provide information about the amounts reclassified out of accumulated other comprehensive income by component. In addition, an entity is required to present, either on the face of the statement where net income is presented or in the notes, significant amounts reclassified out of accumulated other comprehensive income by the respective line items of net income but only if the amount reclassified is required under U.S. GAAP to be reclassified to net income in its entirety in the same reporting period. For other amounts that are not required under U.S. GAAP to be reclassified in their entirety to net income, an entity is required to cross reference to other disclosures required under U.S. GAAP that provide additional detail about those amounts. The amendments are effective prospectively for reporting periods beginning after December 15, 2013, with early adoption permitted. The Company does not anticipate the adoption of this update will have a material impact on its consolidated financial statements.
3. INVESTMENT SECURITIES
Investment securities are summarized as follows:
| | | | | | | | |
| | December 31, 2012 |
| | | Amortized Cost | | Gross Unrealized Gain | | Gross Unrealized Loss | | Estimated Fair Value |
Held to Maturity
| | | | | | | | | | | | | | | | |
| Debt Securities – Municipal | | $ | 9,143 | | | $ | — | | | $ | — | | | $ | 9,143 | |
| US treasury and government sponsored entity mortgage-backed securities | | | 1,425 | | | | 134 | | | | — | | | | 1,559 | |
| Totals | | $ | 10,568 | | | $ | 134 | | | $ | — | | | $ | 10,702 | |
Available for Sale
| | | | | | | | | | | | | | | | |
Debt securities:
| | | | | | | | | | | | | | | | |
| Corporate | | $ | 11,487 | | | $ | 174 | | | $ | (1,195 | ) | | $ | 10,466 | |
| US treasury and federal agencies | | | 40,068 | | | | 28 | | | | (5 | ) | | | 40,091 | |
| Equity securities | | | 3 | | | | 12 | | | | (2 | ) | | | 13 | |
| US treasury and government sponsored entity mortgage-backed securities | | | 54,420 | | | | 1,230 | | | | (14 | ) | | | 55,636 | |
| Totals | | $ | 105,978 | | | $ | 1,444 | | | $ | (1,216 | ) | | $ | 106,206 | |
60
TABLE OF CONTENTS
OCEAN SHORE HOLDING CO. AND SUBSIDIARIES
NOTES TO CONSOLIDATED FINANCIAL STATEMENTS
(All dollar amounts presented in the tables, except share and per share amounts, are in thousands)
3. INVESTMENT SECURITIES – (continued)
| | | | | | | | |
| | December 31, 2011 |
| | | Amortized Cost | | Gross Unrealized Gain | | Gross Unrealized Loss | | Estimated Fair Value |
Held to Maturity
| | | | | | | | | | | | | | | | |
| Debt Securities – Municipal | | $ | 4,020 | | | $ | — | | | $ | — | | | $ | 4,020 | |
| US treasury and government sponsored entity mortgage-backed securities | | | 1,944 | | | | 184 | | | | — | | | | 2,128 | |
| Totals | | $ | 5,964 | | | $ | 184 | | | $ | — | | | $ | 6,148 | |
Available for Sale
| | | | | | | | | | | | | | | | |
Debt securities:
| | | | | | | | | | | | | | | | |
| Municipal | | $ | 830 | | | $ | 2 | | | $ | — | | | $ | 832 | |
| Corporate | | | 7,700 | | | | 35 | | | | (1,625 | ) | | | 6,110 | |
| US treasury and federal agencies | | | 25,660 | | | | 25 | | | | — | | | | 25,685 | |
| Equity securities | | | 3 | | | | 12 | | | | (2 | ) | | | 13 | |
| US treasury and government sponsored entity mortgage-backed securities | | | 13,447 | | | | 707 | | | | (26 | ) | | | 14,128 | |
| Totals | | $ | 47,640 | | | $ | 781 | | | $ | (1,653 | ) | | $ | 46,768 | |
The following table provides the gross unrealized losses and fair value, aggregated by investment category and length of time the individual securities have been in a continuous unrealized loss position at December 31, 2012 and 2011:
| | | | | | | | | | | | |
| | December 31, 2012 |
| | | Less Than 12 Months | | 12 Months or Longer | | Total |
| | | Estimated Fair Value | | Gross Unrealized Loss | | Estimated Fair Value | | Gross Unrealized Loss | | Estimated Fair Value | | Gross Unrealized Loss |
Debt securities:
| | | | | | | | | | | | | | | | | | | | | | | | |
| US treasuries | | $ | 5,995 | | | $ | (5 | ) | | $ | 32 | | | $ | — | | | $ | 6,027 | | | $ | (5 | ) |
| Corporate | | | — | | | | — | | | | 3,509 | | | | (1,195 | ) | | | 3,509 | | | | (1,195 | ) |
US Treasury and government sponsored entity
mortgage-backed securities | | | 1,659 | | | | (7 | ) | | | 600 | | | | (7 | ) | | | 2,259 | | | | (14 | ) |
| Equity securities | | | — | | | | — | | | | 1 | | | | (2 | ) | | | 1 | | | | (2 | ) |
| Totals | | $ | 7,654 | | | $ | (12 | ) | | $ | 4,142 | | | $ | (1,204 | ) | | $ | 11,796 | | | $ | (1,216 | ) |
| | | | | | | | | | | | |
| | December 31, 2011 |
| | | Less Than 12 Months | | 12 Months or Longer | | Total |
| | | Estimated Fair Value | | Gross Unrealized Loss | | Estimated Fair Value | | Gross Unrealized Loss | | Estimated Fair Value | | Gross Unrealized Loss |
Debt securities:
| | | | | | | | | | | | | | | | | | | | | | | | |
| US treasuries | | $ | 33 | | | $ | — | | | $ | — | | | $ | — | | | $ | 33 | | | $ | — | |
| Corporate | | | — | | | | — | | | | 4,077 | | | | (1,625 | ) | | | 4,077 | | | | (1,625 | ) |
US Treasury and government sponsored entity
mortgage-backed securities | | | 2,685 | | | | (26 | ) | | | — | | | | — | | | | 2,685 | | | | (26 | ) |
| Equity securities | | | — | | | | — | | | | 1 | | | | (2 | ) | | | 1 | | | | (2 | ) |
| Totals | | $ | 2,718 | | | $ | (26 | ) | | $ | 4,078 | | | $ | (1,627 | ) | | $ | 6,796 | | | $ | (1,653 | ) |
61
TABLE OF CONTENTS
OCEAN SHORE HOLDING CO. AND SUBSIDIARIES
NOTES TO CONSOLIDATED FINANCIAL STATEMENTS
(All dollar amounts presented in the tables, except share and per share amounts, are in thousands)
3. INVESTMENT SECURITIES – (continued)
Management has reviewed its investment securities as of December 31, 2012 and 2011 and has determined that all declines in fair value below amortized cost are temporary.
Management evaluates securities for other-than-temporary impairment at least on a quarterly basis, and more frequently when economic or market concerns warrant such evaluation. The Company determines whether the unrealized losses are temporary in accordance with FASB ASC 325-40, when applicable, and FASB ASC 320-10. The evaluation is based upon factors such as the creditworthiness of the issuers/guarantors, the underlying collateral, if applicable, and the continuing performance of the securities. Management also evaluates other facts and circumstances that may be indicative of an OTTI condition. This includes, but is not limited to, an evaluation of the type of security, length of time and extent to which the fair value has been less than cost, and near-term prospects of the issuer.
Below is a roll forward of the credit losses on securities for which the Company has recorded other than temporary impairment charges through earnings and other comprehensive income.
| | | | |
| | 2012 | | 2011 |
| Credit component of OTTI as of January 1, | | $ | 3,000 | | | $ | 3,000 | |
Additions for credit related OTTI charges on previously
unimpaired securities | | | — | | | | — | |
| Reductions for securities sold during the period | | | — | | | | — | |
| Reductions for increases in cash flows expected to be collected and recognized over the remaining life of the security | | | — | | | | — | |
| Additional increases as a result of impairment charges recognized on investments for which an OTTI was previously recognized | | | — | | | | — | |
| Credit component of OTTI as of December 31, | | $ | 3,000 | | | $ | 3,000 | |
Two pooled trust preferred collateralized debt obligations (“CDOs”) backed by bank trust capital securities have been determined to be other-than-temporarily impaired in 2009 and 2008, due solely to credit related factors. These securities have Fitch credit ratings below investment grade at December 31, 2012. Each of the securities is in the mezzanine levels of credit subordination. The underlying collateral consists of the bank trust capital securities of over 50 institutions. A summary of key assumptions utilized to forecast future expected cash flows on the securities determined to have OTTI were as follows as of December 31, 2012
and 2011:
| | | | |
| | December 31, 2012 | | December 31, 2011 |
| Future loss rate assumption per annum | | .8% to 1.2% | | .8% to 1.2% |
| Expected cumulative loss percentage | | 27.8% | | 27.8% |
| Cumulative loss percentage to date | | 37.0% to 33.2% | | 37.0% to 33.2% |
| Remaining life | | 29 years | | 30 years |
Corporate Debt Securities — The Company’s investments in corporate debt securities consist of corporate debt securities issued by large financial institutions and single issuer and CDOs backed by bank trust preferred capital securities.
At December 31, 2012, one debt security and two single issue trust preferred securities had been in a continuous unrealized loss position for 12 months or longer. Those securities had aggregate depreciation of 25.4% from the Company’s amortized cost basis. The decline is primarily attributable to depressed pricing of two private placement single issuer trust preferred securities. There has been limited secondary market trading for these types of securities, as a declining domestic economy and increasing credit losses in the banking industry have led to illiquidity in the market for these types of securities. The unrealized loss on these debt securities relates principally to the increased credit spread and a lack of liquidity currently in the financial
62
TABLE OF CONTENTS
OCEAN SHORE HOLDING CO. AND SUBSIDIARIES
NOTES TO CONSOLIDATED FINANCIAL STATEMENTS
(All dollar amounts presented in the tables, except share and per share amounts, are in thousands)
3. INVESTMENT SECURITIES – (continued)
markets for these types of investments. These securities were performing in accordance with their contractual terms as of December 31, 2012, and had paid all contractual cash flows since the Company’s initial investment. Management believes these unrealized losses are not other-than-temporary based upon the Company’s analysis that the securities will perform in accordance with their terms and the Company’s intent not to sell or lack of requirement to sell these investments for a period of time sufficient to allow for the anticipated recovery of fair value, which may be maturity. The Company expects recovery of fair value when market conditions have stabilized and that the Company will receive all contractual principal and interest payments related to those investments.
At December 31, 2011, two debt securities and two single issue trust preferred securities had been in a continuous unrealized loss position for 12 months or longer. Those securities had aggregate depreciation of 29.0% from the Company’s amortized cost basis. The decline is primarily attributable to depressed pricing of two private placement single issuer trust preferred securities. There has been limited secondary market trading for these types of securities, as a declining domestic economy and increasing credit losses in the banking industry have led to illiquidity in the market for these types of securities. The unrealized loss on these debt securities relates principally to the increased credit spread and a lack of liquidity currently in the financial markets for these types of investments. These securities were performing in accordance with their contractual terms as of December 31, 2011, and had paid all contractual cash flows since the Company’s initial investment. Management believes these unrealized losses are not other-than-temporary based upon the Company’s analysis that the securities will perform in accordance with their terms and the Company’s intent not to sell or lack of requirement to sell these investments for a period of time sufficient to allow for the anticipated recovery of fair value, which may be maturity. The Company expects recovery of fair value when market conditions have stabilized and that the Company will receive all contractual principal and interest payments related to those investments.
United States Treasury and Government Sponsored Enterprise Mortgage-backed Securities — The Company’s investments in United States government sponsored enterprise notes consist of debt obligations of the Federal Home Loan Bank (“FHLB”), Federal Home Loan Mortgage Corporation (“Freddie Mac”), and Federal National Mortgage Association (“Fannie Mae”). At December 31, 2012, two U.S Treasury securities and three agency mortgage-backed securities had been in a continuous unrealized loss position for 12 months or longer. Those securities had aggregate depreciation of 0.6% from the Company’s amortized cost basis. These securities were performing in accordance with their contractual terms as of December 31, 2012, and had paid all contractual cash flows since the Company’s initial investment. Management believes these unrealized losses are not other-than-temporary based upon the Company’s analysis that the securities will perform in accordance with their terms and the Company’s intent not to sell or lack of requirement to sell these investments for a period of time sufficient to allow for the anticipated recovery of fair value, which may be maturity. The Company expects recovery of fair value when market conditions have stabilized and that the Company will receive all contractual principal and interest payments related to those investments. At December 31, 2011, the Company had no agency mortgage-backed securities with unrealized losses for 12 months or longer.
63
TABLE OF CONTENTS
OCEAN SHORE HOLDING CO. AND SUBSIDIARIES
NOTES TO CONSOLIDATED FINANCIAL STATEMENTS
(All dollar amounts presented in the tables, except share and per share amounts, are in thousands)
3. INVESTMENT SECURITIES – (continued)
The amortized cost and estimated fair value of debt securities available for sale at December 31, 2012 and 2011 by contractual maturity are shown below. Expected maturities will differ from contractual maturities because borrowers may have the right to call or prepay obligations with or without call or prepayment penalties.
| | | | | | | | |
| | December 31, 2012 |
| | | Held to Maturity | | Available for Sale Securities |
| | | Amortized Cost | | Estimated Fair Value | | Amortized Cost | | Estimated Fair Value |
| Due within 1 year | | $ | 9,143 | | | $ | 9,143 | | | $ | 32 | | | $ | 32 | |
| Due after 1 year through 5 years | | | — | | | | — | | | | 6,819 | | | | 6,994 | |
| Due after 5 years through 10 years | | | — | | | | — | | | | 10,000 | | | | 10,004 | |
| Due after 10 years | | | — | | | | — | | | | 34,704 | | | | 33,527 | |
| Total | | $ | 9,143 | | | $ | 9,143 | | | $ | 51,555 | | | $ | 50,557 | |
| | | | | | | | |
| | December 31, 2011 |
| | | Held to Maturity | | Available for Sale Securities |
| | | Amortized Cost | | Estimated Fair Value | | Amortized Cost | | Estimated Fair Value |
| Due within 1 year | | $ | 4,020 | | | $ | 4,020 | | | $ | — | | | $ | — | |
| Due after 1 year through 5 years | | | — | | | | — | | | | 1,033 | | | | 961 | |
| Due after 5 years through 10 years | | | — | | | | — | | | | 10,037 | | | | 10,052 | |
| Due after 10 years | | | — | | | | — | | | | 23,121 | | | | 21,613 | |
| Total | | $ | 4,020 | | | $ | 4,020 | | | $ | 34,191 | | | $ | 32,626 | |
Equity securities had a cost of $3 thousand and a fair value of $13 thousand as of December 31, 2012 and a cost of $3 thousand and a fair value of $13 thousand as of December 31, 2011. Mortgage-backed securities had a cost of $55.8 million and a fair value of $57.2 million as of December 31, 2012 and a cost of $15.4 million and a fair value of $16.3 million as of December 31, 2011.
4. LOANS RECEIVABLE — NET
Loans receivable consist of the following:
| | | | |
| | December 31, |
| | | 2012 | | 2011 |
Real estate – mortgage:
| | | | | | | | |
| One-to-four family residential | | $ | 522,206 | | | $ | 547,906 | |
| Commercial and multi-family | | | 80,013 | | | | 77,073 | |
| Total real – estate mortgage | | | 602,219 | | | | 624,979 | |
Real estate – construction:
| | | | | | | | |
| Residential | | | 12,709 | | | | 8,057 | |
| Commercial | | | 4,821 | | | | 3,791 | |
| Total real estate – construction | | | 17,530 | | | | 11,848 | |
| Commercial | | | 22,932 | | | | 23,937 | |
Consumer
| | | | | | | | |
| Home equity | | | 61,328 | | | | 66,788 | |
| Other consumer loans | | | 879 | | | | 810 | |
| Total consumer loans | | | 62,207 | | | | 67,598 | |
| Total loans | | | 704,888 | | | | 728,362 | |
| Net deferred loan cost | | | 3,007 | | | | 3,026 | |
| Allowance for loan losses | | | (3,997 | ) | | | (3,762 | ) |
| Net total loans | | $ | 703,898 | | | $ | 727,626 | |
64
TABLE OF CONTENTS
OCEAN SHORE HOLDING CO. AND SUBSIDIARIES
NOTES TO CONSOLIDATED FINANCIAL STATEMENTS
(All dollar amounts presented in the tables, except share and per share amounts, are in thousands)
4. LOANS RECEIVABLE — NET – (continued)
The Bank grants loans to customers primarily in its local market area. The ultimate repayment of these loans is dependent to a certain degree on the local economy and real estate market. The intent of management is to hold loans originated and purchased to maturity.
The Bank is servicing loans for the benefit of others totaling approximately $6.7 million and $10.9 million at December 31, 2012 and 2011, respectively. Servicing loans for others generally consists of collecting mortgage payments, disbursing payments to investors and occasionally processing foreclosures. Loan servicing income is recorded upon receipt and includes servicing fees from investors and certain charges collected from borrowers, such as late payment fees.
The Bank originates and purchases both fixed and adjustable interest rate loans. At December 31, 2012 and 2011, the composition of these loans was approximately $515.4 million and $545.7 million, respectively, of fixed rate loans and $189.5 million and $182.7 million, respectively, of adjustable rate loans.
Changes in the allowance for loan losses are as follows:
| | | | | | |
| | Years Ended December 31, |
| | | 2012 | | 2011 | | 2010 |
| Balance, beginning of year | | $ | 3,762 | | | $ | 3,988 | | | $ | 3,476 | |
| Provision for loan loss | | | 893 | | | | 473 | | | | 892 | |
| Charge-offs | | | (691 | ) | | | (700 | ) | | | (380 | ) |
| Recoveries | | | 33 | | | | 1 | | | | — | |
| Balance, end of year | | $ | 3,997 | | | $ | 3,762 | | | $ | 3,988 | |
The provision for loan losses charged to expense is based upon past loan loss experiences and an evaluation of losses in the current loan portfolio, including the evaluation of impaired loans. The Company established a provision for loan losses of $893 thousand for the year ended December 31, 2012 as compared to $473 thousand for the comparable period in 2011. The increase in the allowance for loan losses for the year ended December 31, 2012 compared to 2011 resulted from general reserves required of $156 thousand in 2012 compared to 2011 due to an increase in classified loans and additional specific reserves on impaired loans of $79 thousand in 2012 compared to 2011.
A loan is considered to be impaired when, based upon current information and events, it is probable that the Bank will be unable to collect all amounts due according to the contractual terms of the loan. An insignificant delay or insignificant shortfall in amount of payments does not necessarily result in the loan being identified as impaired. For this purpose, delays less than 90 days are considered to be insignificant. As of December 31, 2012, 2011 and 2010, the impaired loan balance was measured for impairment based on the fair value of the loans’ collateral. Loans collectively evaluated for impairment include residential real estate loans, consumer loans, and smaller balance commercial and commercial real estate loans.
65
TABLE OF CONTENTS
OCEAN SHORE HOLDING CO. AND SUBSIDIARIES
NOTES TO CONSOLIDATED FINANCIAL STATEMENTS
(All dollar amounts presented in the tables, except share and per share amounts, are in thousands)
4. LOANS RECEIVABLE — NET – (continued)
Non-performing loans at December 31, 2012 and 2011 consisted of non-accrual loans that amounted to $5.8 million and $5.7 million, respectively, and non-accrual troubled debt restructurings of $0 and $805 thousand, respectively. The reserve for delinquent interest on loans totaled $321 thousand and $425 thousand at December 31, 2012 and 2011, respectively.
Year-end non-accrual loans segregated by class of loans are as follows:
| | | | |
| | 2012 | | 2011 |
Real Estate
| | | | | | | | |
| 1 – 4 Family Residential | | $ | 3,850 | | | $ | 4,769 | |
| Commercial and Multi-Family | | | 1,275 | | | | 392 | |
| Real Estate Construction | | | 84 | | | | — | |
| Commercial | | | 200 | | | | 318 | |
| Consumer | | | 342 | | | | 198 | |
| Non-accrual loans | | | 5,751 | | | | 5,677 | |
| Troubled debt restructuring, non-accrual | | | — | | | | 805 | |
| Total non-accrual loans | | $ | 5,751 | | | $ | 6,482 | |
A rollforward of the Company’s nonaccretable and accretable yield on loans accounted for under ASU 310-30, Loans and Debts Securities Acquired with Deteriorated Credit Quality, is shown below for the year-ended December 31, 2012:
| | | | | | | | |
| | Contractual Receivable Amount | | Nonaccretable (Yield)/
Premium | | Accretable (Yield)/
Premium | | Carrying Amount |
| Balance at January 1, 2012 | | $ | 78,040 | | | $ | (3,836 | ) | | $ | 1,284 | | | $ | 75,488 | |
| Principal Reductions | | | (13,852 | ) | | | — | | | | — | | | | (13,852 | ) |
| Charge-offs, net | | | (498 | ) | | | 498 | | | | — | | | | — | |
| Accretion of loan discount (premium) | | | — | | | | — | | | | (301 | ) | | | (301 | ) |
| Transfer between nonaccretable and accretable yield | | | — | | | | — | | | | — | | | | — | |
| Settlement Adjustments | | | — | | | | (85 | ) | | | — | | | | (85 | ) |
| Balance at December 31, 2012 | | $ | 63,690 | | | $ | (3,423 | ) | | $ | 983 | | | $ | 61,250 | |
66
TABLE OF CONTENTS
OCEAN SHORE HOLDING CO. AND SUBSIDIARIES
NOTES TO CONSOLIDATED FINANCIAL STATEMENTS
(All dollar amounts presented in the tables, except share and per share amounts, are in thousands)
4. LOANS RECEIVABLE — NET – (continued)
An age analysis of past due loans, segregated by class of loans, as of December 31, 2012 and 2011 is as follows:
| | | | | | | | | | | | |
| | 30 – 59 Days Past Due | | 60 – 89 Days Past Due | | Greater Than 90 Days | | Total Past Due | | Current | | Total Loan Receivables |
2012
| | | | | | | | | | | | | | | | | | | | | | | | |
Real Estate
| | | | | | | | | | | | | | | | | | | | | | | | |
| 1 – 4 Family Residential | | $ | 1,988 | | | $ | — | | | $ | 3,850 | | | $ | 5,838 | | | $ | 516,368 | | | $ | 522,206 | |
| Commercial and Multi-Family | | | 240 | | | | — | | | | 1,275 | | | | 1,515 | | | | 78,498 | | | | 80,013 | |
| Construction | | | — | | | | — | | | | 84 | | | | 84 | | | | 17,446 | | | | 17,530 | |
| Commercial | | | 524 | | | | — | | | | 200 | | | | 724 | | | | 22,208 | | | | 22,932 | |
| Consumer | | | 404 | | | | 124 | | | | 342 | | | | 870 | | | | 61,337 | | | | 62,207 | |
| Total | | $ | 3,156 | | | $ | 124 | | | $ | 5,751 | | | $ | 9,031 | | | $ | 695,857 | | | $ | 704,888 | |
2011
| | | | | | | | | | | | | | | | | | | | | | | | |
Real Estate
| | | | | | | | | | | | | | | | | | | | | | | | |
| 1 – 4 Family Residential | | $ | 666 | | | $ | — | | | $ | 4,769 | | | $ | 5,435 | | | $ | 542,471 | | | $ | 547,906 | |
| Commercial and Multi-Family | | | 12 | | | | — | | | | 392 | | | | 404 | | | | 76,669 | | | | 77,073 | |
| Construction | | | — | | | | — | | | | — | | | | — | | | | 11,848 | | | | 11,848 | |
| Commercial | | | — | | | | — | | | | 318 | | | | 318 | | | | 23,619 | | | | 23,937 | |
| Consumer | | | 219 | | | | 199 | | | | 198 | | | | 616 | | | | 66,982 | | | | 67,598 | |
| Total | | $ | 897 | | | $ | 199 | | | $ | 5,677 | | | $ | 6,773 | | | $ | 721,589 | | | $ | 728,362 | |
Year end impaired loans are set forth the in the following table. No interest income was recognized on impaired loans subsequent to their classification as impaired.
| | | | | | | | |
| | Recorded Investment | | Unpaid Principal Balance | | Related Allowance | | Average Recorded Investment |
2012
| | | | | | | | | | | | | | | | |
With no related allowance recorded
| | | | | | | | | | | | | | | | |
Real Estate
| | | | | | | | | | | | | | | | |
| 1 – 4 Family Residential | | $ | 2,429 | | | $ | 2,429 | | | $ | — | | | $ | 202 | |
| Commercial and Multi-Family | | | 1,275 | | | | 1,275 | | | | — | | | | 425 | |
| Construction | | | 84 | | | | 84 | | | | | | | | 84 | |
| Commercial | | | — | | | | — | | | | — | | | | — | |
| Consumer | | | 342 | | | | 342 | | | | — | | | | 57 | |
With an allowance recorded
| | | | | | | | | | | | | | | | |
Real Estate
| | | | | | | | | | | | | | | | |
| 1 – 4 Family Residential | | | 3,307 | | | | 3,438 | | | | 369 | | | | 331 | |
| Commercial and Multi-Family | | | — | | | | — | | | | — | | | | — | |
| Commercial | | | 200 | | | | 200 | | | | 69 | | | | 200 | |
| Consumer | | | 128 | | | | 128 | | | | 27 | | | | 128 | |
Total
| | | | | | | | | | | | | | | | |
Real Estate
| | | | | | | | | | | | | | | | |
| 1 – 4 Family Residential | | $ | 5,736 | | | $ | 5,867 | | | $ | 369 | | | $ | 533 | |
| Commercial and Multi-Family | | | 1,275 | | | | 1,275 | | | | — | | | | 425 | |
| Construction | | | 84 | | | | 84 | | | | — | | | | 84 | |
| Commercial | | | 200 | | | | 200 | | | | 69 | | | | 200 | |
| Consumer | | | 470 | | | | 470 | | | | 27 | | | | 185 | |
67
TABLE OF CONTENTS
OCEAN SHORE HOLDING CO. AND SUBSIDIARIES
NOTES TO CONSOLIDATED FINANCIAL STATEMENTS
(All dollar amounts presented in the tables, except share and per share amounts, are in thousands)
4. LOANS RECEIVABLE — NET – (continued)
| | | | | | | | |
| | Recorded Investment | | Unpaid Principal Balance | | Related Allowance | | Average Recorded Investment |
2011
| | | | | | | | | | | | | | | | |
With no related allowance recorded
| | | | | | | | | | | | | | | | |
Real Estate
| | | | | | | | | | | | | | | | |
| 1 – 4 Family Residential | | $ | 2,287 | | | $ | 2,287 | | | $ | — | | | $ | 191 | |
| Commercial and Multi-Family | | | 392 | | | | 392 | | | | — | | | | 131 | |
| Commercial | | | 318 | | | | 318 | | | | — | | | | 106 | |
| Consumer | | | 184 | | | | 184 | | | | — | | | | 37 | |
With an allowance recorded
| | | | | | | | | | | | | | | | |
Real Estate
| | | | | | | | | | | | | | | | |
| 1 – 4 Family Residential | | | 3,286 | | | | 3,765 | | | | 372 | | | | 329 | |
| Commercial and Multi-Family | | | — | | | | — | | | | — | | | | — | |
| Commercial | | | — | | | | — | | | | — | | | | — | |
| Consumer | | | 14 | | | | 14 | | | | 14 | | | | 14 | |
Total
| | | | | | | | | | | | | | | | |
Real Estate
| | | | | | | | | | | | | | | | |
| 1 – 4 Family Residential | | $ | 5,573 | | | $ | 6,052 | | | $ | 372 | | | $ | 519 | |
| Commercial and Multi-Family | | | 392 | | | | 392 | | | | — | | | | 131 | |
| Commercial | | | 318 | | | | 318 | | | | — | | | | 106 | |
| Consumer | | | 198 | | | | 198 | | | | 14 | | | | 51 | |
| |
Included in the Company’s loan portfolio are modified commercial loans. Per FASB ASC 310-40, Troubled Debt Restructuring (“TDR”), a modification is one in which the creditor, for economic or legal reasons related to the debtor’s financial difficulties, grants a concession to the debtor that it would not otherwise consider, such as providing for a below market interest rate and/or forgiving principal or previously accrued interest; this modification may stem from an agreement or be imposed by law or a court, and may involve a multiple note structure. Generally, prior to the modification, the loans which are modified as a TDR are already classified as non-performing. These loans may only be returned to performing (i.e. accrual status) after considering the borrower’s sustained repayment performance for a reasonable amount of time, generally six months; this sustained repayment performance may include the period of time just prior to the restructuring. As of December 31, 2012, the Company entered into four TDR agreements with a total carrying value of $1.7 million, all of which were performing.
Included in impaired loans at December 31, 2012 were four TDRs which had a specific reserve of $177 thousand. The following table presents an analysis of the Company’s TDR agreement entered into during the years ending December 31, 2012 and 2011.
| | | | | | |
| | As of December 31, 2012 |
| | | | | Outstanding Recorded Investment |
| | | Number of Contracts | | Pre-Modification | | Post-Modification |
| 1 – 4 Family Residential Real Estate | | | 3 | | | $ | 1,548 | | | $ | 1,548 | |
| Consumer Loan | | | 1 | | | | 128 | | | | 128 | |
| Total | | | 4 | | | $ | 1,676 | | | $ | 1,676 | |
68
TABLE OF CONTENTS
OCEAN SHORE HOLDING CO. AND SUBSIDIARIES
NOTES TO CONSOLIDATED FINANCIAL STATEMENTS
(All dollar amounts presented in the tables, except share and per share amounts, are in thousands)
4. LOANS RECEIVABLE — NET – (continued)
| | | | | | |
| | As of December 31, 2011 |
| | | | | Outstanding Recorded Investment |
| | | Number of Contracts | | Pre-Modification | | Post-Modification |
| 1 – 4 Family Residential Real Estate | | | 1 | | | $ | 805 | | | $ | 805 | |
Federal regulations require us to review and classify our assets on a regular basis. In addition, the Office of Comptroller of the Currency has the authority to identify problem assets and, if appropriate, require them to be classified. There are three classifications for problem assets: substandard, doubtful and loss. “Substandard assets” must have one or more defined weaknesses and are characterized by the distinct possibility that we will sustain some loss if the deficiencies are not corrected. “Doubtful assets” have the weaknesses of substandard assets with the additional characteristic that the weaknesses make collection or liquidation in full on the basis of currently existing facts, conditions and values questionable, and there is a high possibility of loss. An asset classified as “loss” is considered uncollectible and of such little value that continuance as an asset of the institution is not warranted. The regulations also provide for a “special mention” category, described as assets which do not currently expose us to a sufficient degree of risk to warrant classification but do possess credit deficiencies or potential weaknesses deserving our close attention. When we classify an asset as substandard or doubtful we establish a specific allowance for loan losses. If we classify an asset as loss, we charge off an amount equal to 100% of the portion of the asset classified loss.
The following table presents classified loans by class of loans as of December 31, 2012 and 2011.
| | | | | | | | | | | | | | | | | | | | |
| | Real Estate | | | | | | | | |
| | | 1 – 4 Family Residential | | Commercial and Multi-Family | | Construction | | Commercial | | Consumer |
| | | 2012 | | 2011 | | 2012 | | 2011 | | 2012 | | 2011 | | 2012 | | 2011 | | 2012 | | 2011 |
Grade:
| | | | | | | | | | | | | | | | | | | | | | | | | | | | | | | | | | | | | | | | |
| Special Mention | | $ | 2,394 | | | $ | 1,779 | | | $ | 3,582 | | | $ | 3,518 | | | $ | 84 | | | $ | — | | | $ | 62 | | | $ | — | | | $ | 429 | | | $ | 229 | |
| Substandard | | | 7,367 | | | | 6,135 | | | | 4,213 | | | | 2,760 | | | | — | | | | — | | | | 1,188 | | | | 1,495 | | | | 729 | | | | 539 | |
| Doubtful and Loss | | | — | | | | 149 | | | | — | | | | — | | | | — | | | | — | | | | — | | | | — | | | | — | | | | — | |
| Total | | $ | 9,761 | | | $ | 8,063 | | | $ | 7,795 | | | $ | 6,278 | | | $ | 84 | | | $ | — | | | $ | 1,250 | | | $ | 1,495 | | | $ | 1,158 | | | $ | 768 | |
The following table presents the credit risk profile of loans based on payment activity as of December 31, 2012 and 2011.
| | | | | | | | | | | | | | | | | | | | |
| | Real Estate | | | | | | | | |
| | | 1 – 4 Family Residential | | Commercial and Multi-Family | | Construction | | Commercial | | Consumer |
| | | 2012 | | 2011 | | 2012 | | 2011 | | 2012 | | 2011 | | 2012 | | 2011 | | 2012 | | 2011 |
| Performing | | $ | 518,356 | | | $ | 542,333 | | | $ | 78,738 | | | $ | 76,680 | | | $ | 17,446 | | | $ | 11,848 | | | $ | 22,732 | | | $ | 23,619 | | | $ | 61,865 | | | $ | 67,400 | |
| Non-Performing | | | 3,850 | | | | 5,573 | | | | 1,275 | | | | 393 | | | | 84 | | | | — | | | | 200 | | | | 318 | | | | 342 | | | | 198 | |
| Total | | $ | 522,206 | | | $ | 547,906 | | | $ | 80,013 | | | $ | 77,073 | | | $ | 17,530 | | | $ | 11,848 | | | $ | 22,932 | | | $ | 23,937 | | | $ | 62,207 | | | $ | 67,598 | |
The following table details activity in the allowance for possible loan losses by portfolio segment for the years ended December 31, 2012 and 2011. Allocation of a portion of the allowance to one category does not preclude its availability to absorb losses in other categories.
69
TABLE OF CONTENTS
OCEAN SHORE HOLDING CO. AND SUBSIDIARIES
NOTES TO CONSOLIDATED FINANCIAL STATEMENTS
(All dollar amounts presented in the tables, except share and per share amounts, are in thousands)
4. LOANS RECEIVABLE — NET – (continued)
| | | | | | | | | | | | |
| | Real Estate | | | | | | |
| | | 1 – 4 Family Residential | | Commercial and
Multi-Family | | Construction | | Commercial | | Consumer | | Total |
2012
| | | | | | | | | | | | | | | | | | | | | | | | |
Allowance for credit losses:
| | | | | | | | | | | | | | | | | | | | | | | | |
| Beginning Balance | | $ | 2,513 | | | $ | 460 | | | $ | 98 | | | $ | 229 | | | $ | 462 | | | $ | 3,762 | |
| Charge-offs | | | (557 | ) | | | — | | | | — | | | | (29 | ) | | | (105 | ) | | | (691 | ) |
| Recoveries | | | 13 | | | | — | | | | — | | | | 20 | | | | — | | | | 33 | |
| Provision for loan losses | | | 616 | | | | 49 | | | | 89 | | | | 66 | | | | 73 | | | | 893 | |
| Ending balance | | $ | 2,585 | | | $ | 509 | | | $ | 187 | | | $ | 286 | | | $ | 430 | | | $ | 3,997 | |
| Ending balance: individually evaluated for impairment | | $ | 369 | | | $ | — | | | $ | — | | | $ | 69 | | | $ | 27 | | | $ | 465 | |
| Ending balance: collectively evaluated for impariment | | $ | 2,216 | | | $ | 509 | | | $ | 187 | | | $ | 217 | | | $ | 403 | | | $ | 3,532 | |
Loan Receivables:
| | | | | | | | | | | | | | | | | | | | | | | | |
| Ending balance | | $ | 522,206 | | | $ | 80,013 | | | $ | 17,530 | | | $ | 22,932 | | | $ | 62,207 | | | $ | 704,888 | |
| Ending balance: individually evaluated for impairment | | $ | 5,736 | | | $ | 1,275 | | | $ | 84 | | | $ | 200 | | | $ | 470 | | | $ | 7,765 | |
| Ending balance: collectively evaluated for impariment | | $ | 516,470 | | | $ | 78,738 | | | $ | 17,446 | | | $ | 22,732 | | | $ | 61,737 | | | $ | 697,123 | |
2011
| | | | | | | | | | | | | | | | | | | | | | | | |
Allowance for credit losses:
| | | | | | | | | | | | | | | | | | | | | | | | |
| Beginning Balance | | $ | 2,732 | | | $ | 282 | | | $ | 32 | | | $ | 268 | | | $ | 674 | | | $ | 3,988 | |
| Charge-offs | | | (559 | ) | | | — | | | | — | | | | (90 | ) | | | (51 | ) | | | (700 | ) |
| Recoveries | | | — | | | | — | | | | — | | | | — | | | | 1 | | | | 1 | |
| Provision for loan losses | | | 340 | | | | 178 | | | | 66 | | | | 51 | | | | (162 | ) | | | 473 | |
| Ending balance | | $ | 2,513 | | | $ | 460 | | | $ | 98 | | | $ | 229 | | | $ | 462 | | | $ | 3,762 | |
| Ending balance: individually evaluated for impairment | | $ | 372 | | | $ | — | | | $ | — | | | $ | — | | | $ | 14 | | | $ | 386 | |
| Ending balance: collectively evaluated for impariment | | $ | 2,141 | | | $ | 460 | | | $ | 98 | | | $ | 229 | | | $ | 448 | | | $ | 3,376 | |
Loan Receivables:
| | | | | | | | | | | | | | | | | | | | | | | | |
| Ending balance | | $ | 547,906 | | | $ | 77,073 | | | $ | 11,848 | | | $ | 23,937 | | | $ | 67,598 | | | $ | 728,362 | |
| Ending balance: individually evaluated for impairment | | $ | 5,574 | | | $ | 392 | | | $ | — | | | $ | 318 | | | $ | 198 | | | $ | 6,482 | |
| Ending balance: collectively evaluated for impariment | | $ | 542,332 | | | $ | 76,681 | | | $ | 11,848 | | | $ | 23,619 | | | $ | 67,400 | | | $ | 721,880 | |
70
TABLE OF CONTENTS
OCEAN SHORE HOLDING CO. AND SUBSIDIARIES
NOTES TO CONSOLIDATED FINANCIAL STATEMENTS
(All dollar amounts presented in the tables, except share and per share amounts, are in thousands)
4. LOANS RECEIVABLE — NET – (continued)
Certain directors and officers of the Company have loans with the Bank. Repayments and other includes loans for which there was a change in employee status which resulted in a change in loan classification. Total loan activity for directors and officers was as follows:
| | | | | | |
| | Years Ended December 31, |
| | | 2012 | | 2011 | | 2010 |
| Balance, beginning of year | | $ | 5,432 | | | $ | 5,287 | | | $ | 5,128 | |
| Additions | | | 260 | | | | 858 | | | | 161 | |
| Repayments and other | | | (1,066 | ) | | | (713 | ) | | | (459 | ) |
| Balance, end of year | | $ | 4,626 | | | $ | 5,432 | | | $ | 4,830 | |
5. OFFICE PROPERTIES AND EQUIPMENT — NET
Office properties and equipment are summarized by major classification as follows:
| | | | |
| | December 31, |
| | | 2012 | | 2011 |
| Land | | $ | 3,465 | | | $ | 3,521 | |
| Buildings and improvements | | | 13,344 | | | | 13,460 | |
| Furniture and equipment | | | 7,464 | | | | 6,872 | |
| Total | | | 24,273 | | | | 23,853 | |
| Accumulated depreciation | | | (10,838 | ) | | | (9,798 | ) |
| Net | | $ | 13,435 | | | $ | 14,055 | |
For the years ended December 31, 2012, 2011 and 2010, depreciation expense amounted to $1.0 million, $934 thousand, and $974 thousand, respectively.
6. DEPOSITS
Deposits consist of the following major classifications:
| | | | | | | | |
| | December 31, |
| | | 2012 | | 2011 |
| | | Amount | | Weighted Average Interest Rate | | Amount | | Weighted Average Interest Rate |
| NOW and other demand deposit accounts | | $ | 417,401 | | | | 0.12 | % | | $ | 378,272 | | | | 0.28 | % |
| Passbook savings and club accounts | | | 166,861 | | | | 0.20 | % | | | 130,324 | | | | 0.46 | % |
| Subtotal | | | 584,262 | | | | | | | | 508,596 | | | | | |
Certificates with original maturities:
| | | | | | | | | | | | | | | | |
| Within one year | | | 69,620 | | | | 0.41 | % | | | 83,200 | | | | 0.66 | % |
| One to three years | | | 119,467 | | | | 1.39 | % | | | 135,955 | | | | 1.76 | % |
| Three years and beyond | | | 28,416 | | | | 2.56 | % | | | 24,704 | | | | 3.10 | % |
| Total certificates | | | 217,503 | | | | | | | | 243,859 | | | | | |
| Total | | $ | 801,765 | | | | | | | $ | 752,455 | | | | | |
71
TABLE OF CONTENTS
OCEAN SHORE HOLDING CO. AND SUBSIDIARIES
NOTES TO CONSOLIDATED FINANCIAL STATEMENTS
(All dollar amounts presented in the tables, except share and per share amounts, are in thousands)
6. DEPOSITS – (continued)
The aggregate amount of certificate accounts in denominations of $100 thousand or more at December 31, 2012 and 2011 amounted to $79.6 million and $90.3 million, respectively. Currently, deposit amounts in excess of $250 thousand are generally not federally insured.
Municipal demand deposit accounts in denominations of $100 thousand or more at December 31, 2012 and 2011 amounted to $157.6 million and $118.8 million, respectively.
7. ADVANCES FROM FEDERAL HOME LOAN BANK OF NEW YORK
Advances from the FHLB of New York are as follows:
| | | | | | |
| | Interest Rate | | December 31, |
| Due | | 2012 | | 2011 |
| December 17, 2014 | | | 3.765 | % | | $ | 15,000 | | | $ | 15,000 | |
| December 21, 2015 | | | 4.540 | % | | | 5,000 | | | | 5,000 | |
| April 11, 2016 | | | 4.795 | % | | | 10,000 | | | | 10,000 | |
| August 22, 2016 | | | 4.361 | % | | | — | | | | 10,000 | |
| February 28, 2017 | | | 4.070 | % | | | 10,000 | | | | 10,000 | |
| April 5, 2017 | | | 4.058 | % | | | 10,000 | | | | 10,000 | |
| June 22, 2017 | | | 4.609 | % | | | — | | | | 20,000 | |
| August 1, 2017 | | | 4.320 | % | | | 10,000 | | | | 10,000 | |
| November 16, 2017 | | | 3.875 | % | | | 20,000 | | | | 20,000 | |
| August 22, 2022 | | | 3.497 | % | | | 10,000 | | | | — | |
| October 24, 2022 | | | 3.770 | % | | | 20,000 | | | | — | |
| | | | | | | $ | 110,000 | | | $ | 110,000 | |
The advances are collateralized by FHLB stock and substantially all first mortgage loans. The carrying value of assets pledged to the FHLB of New York was $383.6 million and $403.1 million at December 31, 2012 and 2011, respectively.
The following table sets forth information concerning balances and interest rates on our FHLB advances at the dates and for the periods indicated.
| | | | |
| | December 31, |
| | | 2012 | | 2011 |
| Weighted average balance during the period | | $ | 110,000 | | | $ | 110,000 | |
| Maximum month-end balance during the period | | | 110,000 | | | | 110,000 | |
| Balance outstanding at the end of the period | | | 110,000 | | | | 110,000 | |
| Weighted average interest rate during the period | | | 4.24 | % | | | 4.29 | % |
| Weighted average interest rate at the end of the period | | | 4.00 | % | | | 4.23 | % |
Unused lines of credit and borrowing capacity available for short-term and long-term borrowings from the FHLB of New York at December 31, 2012 and 2011 were $266.1 million and $262.6 million, respectively.
72
TABLE OF CONTENTS
OCEAN SHORE HOLDING CO. AND SUBSIDIARIES
NOTES TO CONSOLIDATED FINANCIAL STATEMENTS
(All dollar amounts presented in the tables, except share and per share amounts, are in thousands)
8. INCOME TAXES
The income tax provision consists of the following:
| | | | | | |
| | Years Ended December 31, |
| | | 2012 | | 2011 | | 2010 |
Income taxes:
| | | | | | | | | | | | |
Current:
| | | | | | | | | | | | |
| Federal | | $ | 2,783 | | | $ | 2,756 | | | $ | 2,899 | |
| State | | | 1,010 | | | | 963 | | | | 1,034 | |
| Total current tax provision | | | 3,793 | | | | 3,719 | | | | 3,933 | |
Deferred:
| | | | | | | | | | | | |
| Federal | | | (396 | ) | | | (90 | ) | | | (293 | ) |
| State | | | (217 | ) | | | (97 | ) | | | (209 | ) |
| Total deferred tax provision (benefit) | | | (613 | ) | | | (187 | ) | | | (502 | ) |
| Total income tax provision | | $ | 3,180 | | | $ | 3,532 | | | $ | 3,431 | |
The Company’s provision for income taxes differs from the amounts determined by applying the statutory federal income tax rate to income before income before taxes as follows:
| | | | | | | | | | | | |
| | Years Ended December 31, |
| | | 2012 | | 2011 | | 2010 |
| | | Amount | | Percent | | Amount | | Percent | | Amount | | Percent |
| Income tax expense at statutory rate | | $ | 2,782 | | | | 34.0 % | | | $ | 2,921 | | | | 34.0 % | | | $ | 3,018 | | | | 34.0 % | |
| State income taxes, net of federal benefit | | | 523 | | | | 6.4 | | | | 571 | | | | 6.7 | | | | 545 | | | | 6.1 | |
Changes in taxes resulting from:
| | | | | | | | | | | | | | | | | | | | | | | | |
| Tax exempt income | | | (223 | ) | | | (2.7 | ) | | | (202 | ) | | | (2.4 | ) | | | (212 | ) | | | (2.3 | ) |
| Non-deductible expenses | | | 98 | | | | 1.2 | | | | 242 | | | | 2.8 | | | | 80 | | | | 0.9 | |
| Total | | $ | 3,180 | | | | 38.9 % | | | $ | 3,532 | | | | 41.1 % | | | $ | 3,431 | | | | 38.7 % | |
The effective tax rate for 2012 was 38.9% compared to 41.1% for 2011. The decrease in the effective tax rate resulted from higher than normal non-deductible expenses in 2011 associated with the acquisition of CBHC Financialcorp Inc. The effective tax rate for 2011 was 41.1% compared to 38.7% for 2010. The effective tax rate resulted from higher than normal non-deductible expenses in 2011 associated with the acquisition of CBHC Financialcorp Inc.
73
TABLE OF CONTENTS
OCEAN SHORE HOLDING CO. AND SUBSIDIARIES
NOTES TO CONSOLIDATED FINANCIAL STATEMENTS
(All dollar amounts presented in the tables, except share and per share amounts, are in thousands)
8. INCOME TAXES – (continued)
Items that gave rise to significant portions of the deferred tax accounts are as follows:
| | | | | | |
| | December 31, |
| | | 2012 | | 2011 | | 2010 |
Deferred tax assets:
| | | | | | | | | | | | |
| Unrealized (gain) loss on available for sale securities | | $ | (124 | ) | | $ | 301 | | | $ | 345 | |
| Allowance for loan losses | | | 1,597 | | | | 1,473 | | | | 1,593 | |
| Nonperforming loans | | | — | | | | 26 | | | | 98 | |
| Deferred compensation | | | 377 | | | | 371 | | | | 362 | |
| Employee benefits | | | 1,777 | | | | 1,564 | | | | 1,334 | |
| Other than temporary impairment | | | 1,020 | | | | 1,020 | | | | 1,020 | |
| Property | | | (172 | ) | | | 18 | | | | 26 | |
| Purchase accounting | | | 972 | | | | 880 | | | | — | |
| Other | | | 85 | | | | 50 | | | | 37 | |
| Total deferred tax assets | | | 5,532 | | | | 5,703 | | | | 4,815 | |
Deferred tax liabilities:
| | | | | | | | | | | | |
| Deferred loan fees | | | (1,172 | ) | | | (1,181 | ) | | | (1,120 | ) |
| Servicing | | | (2 | ) | | | (5 | ) | | | (8 | ) |
| IRC Section 475 mark-to-market | | | 314 | | | | (33 | ) | | | (89 | ) |
| Total deferred tax liabilities | | | (860 | ) | | | (1,219 | ) | | | (1,217 | ) |
| Net deferred tax asset | | $ | 4,672 | | | $ | 4,484 | | | $ | 3,598 | |
Pursuant to ASC-740, the Company is not required to provide deferred taxes on its tax loan loss reserve as of December 31, 1987. The amount of this reserve on which no deferred income taxes have been provided is approximately $2.4 million and is included in retained earnings at December 31, 2012 and 2011. This reserve could be recognized as taxable income and create a current and/or deferred tax liability using the income tax rates then in effect if one of the following occur: (1) the Company’s retained earnings represented by this reserve are used for distributions in liquidation or for any other purpose other than to absorb losses from bad debts; (2) the Company fails to qualify as a Bank, as provided by the Internal Revenue Code; or (3) there is a change in federal tax law.
The Company recognizes, when applicable, interest and penalties related to unrecognized tax benefits in the provision for income taxes in the consolidated statement of income and comprehensive income. As of December 31, 2012, 2011 and 2010, there were no uncertain tax positions. As of December 31, 2012, the tax years ended December 31, 2009 through 2012 were subject to examination by the Internal Revenue Service, while the tax years ended December 31, 2008 through 2012 were subject to New Jersey examination.
9. JUNIOR SUBORDINATED DEBENTURES
In 1998, Ocean Shore Capital Trust I (the “Trust”), a trust created under Delaware law that is wholly owned by the Company, issued $15 million of 8.67% Capital Securities (the “Capital Securities”) with a liquidation amount of $1,000 per Capital Security unit and a scheduled maturity of July 15, 2028. The proceeds from the sale of the Capital Securities were utilized by the Trust to invest in $15.5 million of 8.67% Junior Subordinated Deferrable Interest Debentures (the “Debentures”) of the Company. The Debentures are unsecured and rank subordinate and junior in right of payment to all indebtedness, liabilities and obligations of the Company. The Debentures represent the sole assets of the Trust. Interest on the Capital Securities is cumulative and payable semi-annually in arrears. The Company has the option, subject to required regulatory approval, to prepay the Debentures in whole or in part, at various prepayment prices, plus accrued and unpaid interest thereon to the date of the prepayment.
74
TABLE OF CONTENTS
OCEAN SHORE HOLDING CO. AND SUBSIDIARIES
NOTES TO CONSOLIDATED FINANCIAL STATEMENTS
(All dollar amounts presented in the tables, except share and per share amounts, are in thousands)
10. COMMITMENTS AND CONTINGENCIES
Loan Commitments — As of December 31, 2012, the Company had approximately $17.4 million in outstanding commitments to originate fixed and variable rate loans with market interest rates ranging from 3.00% to 6.25% and approximately $48.1 million in unused lines of credit with interest rates ranging from 3.00% to 6.50% on outstanding balances. Commitments are issued in accordance with the same policies and underwriting procedures as settled loans.
Lease Commitment — The Company leases certain property and equipment under non-cancellable operating leases. Scheduled minimum lease payments are as follows as of December 31, 2012:
| | |
| Year Ending December 31 | | |
| 2013 | | $ | 242 | |
| 2014 | | | 234 | |
| 2015 | | | 242 | |
| 2016 | | | 221 | |
| 2017 | | | 166 | |
| Thereafter | | | 353 | |
| Total | | $ | 1,458 | |
Rent expense for all operating leases was approximately $252 thousand, $222 thousand and $122 thousand for the years ended December 31, 2012, 2011 and 2010, respectively.
Cash Reserve Requirement — The Bank is required to maintain average reserve balances under the Federal Reserve Act and Regulation D issued thereunder. Such reserves totaled approximately $100,000 at December 31, 2012 and 2011.
Restrictions on Funds Transferred — There are various restrictions which limit the ability of a bank subsidiary to transfer funds in the form of cash dividends, loans or advances to the parent company. Under federal law, the approval of the primary regulator is required if dividends declared by the Bank in any year exceed the net profits of that year, as defined, combined with the retained profits for the two preceding years.
Employment Contracts — The Bank has entered into employment contracts with several officers of the Bank whereby such officers would be entitled to a cash payment equal to 2 or 3 years annual compensation, depending on the officer, in the event of a change of control or other specified reasons.
75
TABLE OF CONTENTS
OCEAN SHORE HOLDING CO. AND SUBSIDIARIES
NOTES TO CONSOLIDATED FINANCIAL STATEMENTS
(All dollar amounts presented in the tables, except share and per share amounts, are in thousands)
11. EARNINGS PER SHARE
Basic net income per share is based upon the weighted average number of common shares outstanding, net of any treasury shares, while diluted net income per share is based upon the weighted average number of shares of common stock outstanding, net of any treasury shares, after consideration of the potential dilutive effect of common stock equivalents, based upon the treasury stock method using an average market price for the period, and impact of unallocated ESOP shares.
The calculated basic and diluted earnings per share (“EPS”) are as follows:
| | | | | | |
| | December 31, |
| | | 2012 | | 2011 | | 2010 |
| Numerator – Net Income | | $ | 5,001 | | | $ | 5,058 | | | $ | 5,444 | |
Denominators:
| | | | | | | | | | | | |
| Basic average shares outstanding | | | 6,652,537 | | | | 6,748,334 | | | | 6,798,317 | |
| Net effect of dilutive common stock equivalents | | | 62,867 | | | | 83,655 | | | | — | |
| Diluted average shares outstanding | | | 6,715,404 | | | | 6,831,989 | | | | 6,798,317 | |
Earnings per share:
| | | | | | | | | | | | |
| Basic | | $ | 0.75 | | | $ | 0.75 | | | $ | 0.80 | |
| Diluted | | $ | 0.74 | | | $ | 0.74 | | | $ | 0.80 | |
At December 31, 2012, 2011 and 2010 there were 610,828, 650,804 and 587,504 outstanding options that were anti-dilutive, respectively.
12. REGULATORY CAPITAL REQUIREMENTS
The Bank is subject to various regulatory capital requirements administered by federal banking agencies. Failure to meet minimum capital requirements can initiate certain mandatory — and possibly additional discretionary — actions by regulators that, if undertaken, could have a direct material effect on the Bank’s financial statements. Under capital adequacy guidelines and the regulatory framework for prompt corrective action, the Bank must meet specific capital guidelines that involve quantitative measures of the Bank’s assets, liabilities and certain off-balance-sheet items as calculated under regulatory accounting practices. The Bank’s capital amounts and classification are also subject to qualitative judgments by the regulators about components, risk weightings, and other factors.
Quantitative measures established by regulation to ensure capital adequacy require the Bank to maintain minimum amounts and ratios (set forth in the table below) of tangible and core capital (as defined in the regulations) to total adjusted assets (as defined), and of risk-based capital (as defined) to risk-weighted assets (as defined). Management believes that, as of December 31, 2012 and 2011, the Bank met all capital adequacy requirements to which it is subject.
As of December 31, 2012 and 2011, the most recent notification from the OCC categorized the Bank as “well capitalized” under the regulatory framework for prompt corrective action. To be categorized as well capitalized, the Bank must maintain minimum tangible, core and risk-based ratios as set forth in the table. There are no conditions or events since that notification that management believes have changed the Bank’s category.
76
TABLE OF CONTENTS
OCEAN SHORE HOLDING CO. AND SUBSIDIARIES
NOTES TO CONSOLIDATED FINANCIAL STATEMENTS
(All dollar amounts presented in the tables, except share and per share amounts, are in thousands)
12. REGULATORY CAPITAL REQUIREMENTS – (continued)
The Bank’s actual capital amounts and ratios are also presented in the table.
| | | | | | | | | | | | |
| | Actual | | Required For Capital Adequacy Purposes | | Considered Well Capitalized Under Prompt Corrective Action Provisions |
| | | Amount | | Ratio | | Amount | | Ratio | | Amount | | Ratio |
As of December 31, 2012:
| | | | | | | | | | | | | | | | | | | | | | | | |
| Tangible capital | | $ | 99,341 | | | | 9.62 % | | | $ | 15,489 | | | | 1.50 % | | | | N/A | | | | N/A | |
| Tier 1 leverage capital | | | 99,341 | | | | 9.62 | | | | 41,303 | | | | 4.00 | | | $ | 61,954 | | | | 6.00 % | |
| Tier 1 risk-based capital | | | 99,341 | | | | 19.92 | | | | 19,949 | | | | 4.00 | | | | 29,924 | | | | 6.00 | |
| Total risk-based capital | | | 102,878 | | | | 20.63 | | | | 39,898 | | | | 8.00 | | | | 49,873 | | | | 10.00 | |
As of December 31, 2011:
| | | | | | | | | | | | | | | | | | | | | | | | |
| Tangible capital | | $ | 95,227 | | | | 9.72 % | | | $ | 14,698 | | | | 1.50 % | | | | N/A | | | | N/A | |
| Tier 1 leverage capital | | | 95,227 | | | | 9.72 | | | | 39,196 | | | | 4.00 | | | $ | 58,794 | | | | 6.00 % | |
| Tier 1 risk-based capital | | | 95,227 | | | | 19.40 | | | | 20,318 | | | | 4.00 | | | | 30,476 | | | | 6.00 | |
| Total risk-based capital | | | 98,540 | | | | 18.75 | | | | 40,635 | | | | 8.00 | | | | 50,794 | | | | 10.00 | |
Capital levels at December 31, 2012 and 2011 for the Bank represents only the capital maintained at the Bank level, which is less than the capital of the Company.
Federal banking regulations place certain restrictions on dividends paid by the Bank to the Company. The total dividends that may be paid at any date is generally limited to the earnings of the Bank for the year to date plus retained earnings for the prior two years, net of any prior capital distributions. In addition, dividends paid by the Bank to the Company would be prohibited if the distribution would cause the Bank’s capital to be reduced below the applicable minimum capital requirements. For the period ended December 31, 2012 the Bank paid $3.6 million in dividends to the Company. For the period ended December 31, 2011 the Bank paid $3.2 million in dividends to the Company.
13. BENEFIT PLANS
401(k) Plan
The Company maintains an approved 401(k) Plan. All employees age 18 and over are eligible to participate in the plan at the beginning of the quarter after hire date. The employees may contribute up to 100% of their compensation, subject to IRS limitations, to the plan with the Company matching one-half of the first eight percent contributed. Full vesting in the plan is prorated equally over a five-year period from the date of employment. The Company’s contributions to the 401(k) Plan for the years ended December 31, 2012, 2011 and 2010 were $230 thousand, $183 thousand, and $186 thousand, respectively, and were included as a component of “Salaries and employee benefits” expense.
Deferred Compensation Plans
The Bank maintains a deferred compensation plan whereby certain officers will be provided supplemental retirement benefits for a period of fifteen or twenty years following normal retirement. The benefits under the plan are fully vested for all officers. The Company makes annual contributions, based upon an accrued liability schedule, to a trust for each respective officer organized by the Company to administer the plan so that the amounts required will be provided at the normal retirement dates and thereafter. Assuming normal retirement, the benefits under the plan will be paid in varying amounts between 2013 and 2031. The agreements also provide for payment of benefits in the event of disability, early retirement, termination of employment, or death. The contributions to the plan for the years ended December 31, 2012, 2011 and 2010 were $536 thousand, $479 thousand and $441 thousand, respectively, and were included as a component of
77
TABLE OF CONTENTS
OCEAN SHORE HOLDING CO. AND SUBSIDIARIES
NOTES TO CONSOLIDATED FINANCIAL STATEMENTS
(All dollar amounts presented in the tables, except share and per share amounts, are in thousands)
13. BENEFIT PLANS – (continued)
“Salaries and employee benefits” expense in the statement of income. The accrued liability included as a component of “Other liabilities” in the statement of financial condition was $3.3 million, $2.9 million and $2.4 million for the years ended December 31, 2012, 2011 and 2010, respectively.
The Bank maintains a directors’ deferred compensation plan whereby directors may defer into a retirement account a portion of their monthly director fees for a specified period to provide a specified amount of income for a period of five to ten years following normal retirement. The Company also accrues the interest cost on the deferred fee obligation so that the amounts required will be provided at the normal retirement dates and thereafter. Assuming normal retirement, the benefits under the plan will be paid in varying amounts between 2013 and 2032. Payments of $98 thousand were made from the plan in 2012. The agreements also provide for payment of benefits in the event of disability, early retirement, termination of service, or death. At December 31, 2012 and 2011, the accrued deferred compensation liability amounted to approximately $944 thousand and $928 thousand, respectively, and is included as a component of “Other Liabilities” in the statement of financial condition. The contributions to the plan for the years ended December 31, 2012, 2011 and 2010 were $ 76 thousand, $84 thousand and $117 thousand, respectively, and were included as a component of “Salaries and employee benefits” expense.
The Bank is the owner and primary beneficiary of insurance policies on the lives of participating officers and directors. Such policies were purchased to informally fund the benefit obligations and to allow the Company to honor its contractual obligations in the event of pre-retirement death of a covered officer or director. Certain of the insurance policies owned by the Bank are policies under which the employee’s designated beneficiary is entitled to part of the policy benefits upon the death of the employee. The aggregate cash surrender value of all policies owned by the Company amounted to $22.5 million and $18.8 million at December 31, 2012 and 2011.
During 2004, a Deferred Compensation Stock Plan was established creating a rabbi trust to fund benefit plans for certain officers and directors to acquire shares through deferred compensation plans. During the years ended December 31, 2012 and 2011, 1,166 and 1,370 shares of the Company’s stock were purchased for $15 thousand and $16 thousand, respectively, at various market prices.
Employee Stock Ownership Plan
In December 2004, the Company established an Employee Stock Ownership Plan (“ESOP”) covering all eligible employees as defined by the ESOP. The ESOP is a tax-qualified plan designed to invest primarily in the Company’s common stock that provides employees with the opportunity to receive a funded retirement benefit based primarily on the value of the Company’s common stock.
To purchase the Company’s common stock in December 2004, the ESOP borrowed $3.4 million from the Company to purchase 343,499 shares of the Company’s common stock in the initial public offering. The ESOP loan is being repaid principally from the Bank's contributions to the ESOP over a period of up to 15 years. Dividends declared on common stock held by the ESOP and not allocated to the account of a participant can be used to repay the loan. The number of shares released annually is based upon the ratio that the current principal and interest payment bears to the current and all remaining scheduled future principal and interest payments.
To purchase the Company’s common stock in December 2009, the ESOP borrowed $2.3 million from the Company to purchase 282,611 shares of the Company’s common stock in its second step offering. The ESOP loan is being repaid principally from the Bank's contributions to the ESOP over a period of up to 20 years. Dividends declared on common stock held by the ESOP and not allocated to the account of a participant can be used to repay the loan. The number of shares released annually is based upon the ratio that the current principal and interest payment bears to the current and all remaining scheduled future principal and interest payments.
78
TABLE OF CONTENTS
OCEAN SHORE HOLDING CO. AND SUBSIDIARIES
NOTES TO CONSOLIDATED FINANCIAL STATEMENTS
(All dollar amounts presented in the tables, except share and per share amounts, are in thousands)
13. BENEFIT PLANS – (continued)
During the years ended December 31, 2012, 2011 and 2010, the Company annually released 34,266 shares and recorded an expense related to this plan of approximately $426 thousand, $397 thousand and $366 thousand, respectively.
All shares that have not been released for allocation to participants are held in a suspense account by the ESOP for future allocation as the loan is repaid. Unallocated common stock purchased by the ESOP is recorded as a reduction of stockholders' equity at cost. At December 31, 2012, the ESOP had 361,036 unallocated shares remaining.
Stock Option Plan
A summary of the status of the Company’s stock options under the Equity Plans as of December 31, 2012, 2011 and 2010 and changes during the periods ended December 31, 2012, 2011 and 2010 are presented below.
| | | | | | | | | | | | |
| | Year Ended
December 31, 2012 | | Year Ended
December 31, 2011 | | Year Ended
December 31, 2010 |
| | | Number of shares | | Weighted average exercise price | | Number of shares | | Weighted average exercise price | | Number of shares | | Weighted average exercise price |
| Outstanding at the beginning of the period | | | 650,804 | | | $ | 11.90 | | | | 587,504 | | | $ | 13.10 | | | | 373,592 | | | $ | 13.10 | |
| Granted | | | 17,500 | | | | 13.10 | | | | 66,618 | | | | 11.64 | | | | 257,010 | | | | 10.21 | |
| Exercised | | | (15,193 | ) | | | 10.87 | | | | — | | | | — | | | | — | | | | — | |
| Forfeited | | | (3,798 | ) | | | 12.86 | | | | (3,318 | ) | | | 10.65 | | | | (43,098 | ) | | | 12.03 | |
| Outstanding at the end of the period | | | 649,313 | | | $ | 11.95 | | | | 650,804 | | | $ | 11.90 | | | | 587,504 | | | $ | 11.92 | |
| Exercisable at the end of the period | | | 441,206 | | | $ | 12.48 | | | | 386,365 | | | $ | 12.79 | | | | 329,354 | | | $ | 13.16 | |
| Stock options vested or expected to vest(1) | | | 584,382 | | | $ | 11.95 | | | | | | | | | | | | | | | | | |
| (1) | Includes vested shares and nonvested shares after a forfeiture rate, which is based upon historical data, is applied. |
The weighted average grant date fair value of options granted for the years ended December 31, 2012 and 2011 was $2.90 and $2.77 per share. Options exercised in 2012 totaled 15,193 at an average exercise price of $10.87. No options were exercised during 2011 or 2010. The aggregate intrinsic value of options outstanding and exercisable at December 31, 2012, 2011 and 2010 was $1.0 million, $0 and $0, respectively.
79
TABLE OF CONTENTS
OCEAN SHORE HOLDING CO. AND SUBSIDIARIES
NOTES TO CONSOLIDATED FINANCIAL STATEMENTS
(All dollar amounts presented in the tables, except share and per share amounts, are in thousands)
13. BENEFIT PLANS – (continued)
The following table summarizes all stock options outstanding under the Equity Plan as of December 31, 2012:
| | | | | | |
| | Options Outstanding |
| Date Issued | | Number of Shares | | Weighted Average Exercise Price | | Weighted Average Remaining Contractual Life |
| | | | | | | (in years) |
| August 10, 2005 | | | 292,809 | | | $ | 13.19 | | | | 2.7 | |
| November 21, 2006 | | | 17,586 | | | | 14.78 | | | | 3.9 | |
| November 20, 2007 | | | 25,772 | | | | 11.32 | | | | 4.9 | |
| August 18, 2010 | | | 229,548 | | | | 10.21 | | | | 7.7 | |
| March 15, 2011 | | | 13,600 | | | | 12.06 | | | | 8.2 | |
| August 17, 2011 | | | 52,498 | | | | 11.53 | | | | 8.7 | |
| November 19, 2012 | | | 17,500 | | | | 13.10 | | | | 9.9 | |
| Total | | | 649,313 | | | $ | 11.95 | | | | 5.4 | |
At December 31, 2012, there was $595 thousand of total unrecognized compensation cost related to options granted under the stock option plans. That cost is expected to be recognized over a weighted average period of 2.6 years.
The compensation expense recognized for the period ended December 31, 2012, 2011 and 2010 was $148 thousand, $138 thousand and $92 thousand, respectively.
Summary of Non-vested Stock Award activity:
| | | | | | | | | | | | |
| | Year Ended
December 31, 2012 | | Year Ended
December 31, 2011 | | Year Ended
December 31, 2010 |
| | | Number of shares | | Weighted average exercise price | | Number of shares | | Weighted average exercise price | | Number of shares | | Weighted average exercise price |
| Outstanding at the beginning of the period | | | 80,190 | | | $ | 10.32 | | | | 99,000 | | | $ | 10.21 | | | | 30,125 | | | $ | 13.19 | |
| Issued | | | — | | | | — | | | | 4,950 | | | | 12.06 | | | | 99,000 | | | | 10.21 | |
| Vested | | | 19,800 | | | | 10.30 | | | | 18,810 | | | | 10.21 | | | | 30,125 | | | | 13.19 | |
| Forfeited | | | — | | | | — | | | | 4,950 | | | | 10.21 | | | | — | | | | — | |
| Outstanding at the end of the period | | | 60,390 | | | $ | 10.33 | | | | 80,190 | | | $ | 10.32 | | | | 99,000 | | | $ | 10.21 | |
As of December 31, 2012, there was $529 thousand of total unrecognized compensation costs related to nonvested stock awards. That cost is expected to be recognized over a weighted average period of 2.6 years.
The compensation expense recognized for the period ended December 31, 2012, 2011 and 2010 was $204 thousand, $202 thousand and $308 thousand, respectively.
14. FAIR VALUE MEASUREMENT
The Company accounts for fair value measurement in accordance with FASB ASC 820,Fair Value Measurements and Disclosures. FASB ASC 820 defines fair value, establishes a framework for measuring fair value, and expands disclosures about fair value measurements. FASB ASC 820 does not require any new fair value measurements. The definition of fair value retains the exchange price notion in earlier definitions of fair value. FASB ASC 820 clarifies that the exchange price is the price in an orderly transaction between market
80
TABLE OF CONTENTS
OCEAN SHORE HOLDING CO. AND SUBSIDIARIES
NOTES TO CONSOLIDATED FINANCIAL STATEMENTS
(All dollar amounts presented in the tables, except share and per share amounts, are in thousands)
14. FAIR VALUE MEASUREMENT – (continued)
participants to sell the asset or transfer the liability in the market in which the reporting entity would transact for the asset or liability. The definition focuses on the price that would be received to sell the asset or paid to transfer the liability (an exit price), not the price that would be paid to acquire the asset or received to assume the liability (an entry price). FASB ASC 820 emphasizes that fair value is a market-based measurement, not an entity-specific measurement. FASB ASC 820 also clarifies the application of fair value measurement in a market that is not active.
FASB ASC 820 describes three levels of inputs that may be used to measure fair value:
| Level 1 — | Quoted prices in active markets for identical assets or liabilities. |
| Level 2 — | Observable inputs other than Level 1 prices such as quoted prices for similar assets or liabilities; quoted prices in markets that are not active; or other inputs that are observable or can be corroborated by observable market data for substantially the full term of the assets or liabilities. |
| Level 3 — | Unobservable inputs that are supported by little or no market activity and that are significant to the fair value of the assets or liabilities. Level 3 assets and liabilities include financial instruments whose value is determined using pricing models, discounted cash flow methodologies, or similar techniques, as well as instruments for which the determination of fair value requires significant management judgment or estimation. |
The Company’s assessment of the significance of a particular input to the fair value measurement in its entirety requires judgment and considers factors specific to the asset or liability.
In addition, the Company is to disclose the fair value measurements for financial assets on both a recurring and non-recurring basis.
Those assets as of December 31, 2012 which will continue to be measured at fair value on a recurring basis are as follows:
| | | | | | |
| | Category Used for Fair Value Measurement |
| | | Level 1 | | Level 2 | | Level 3 |
Assets:
| | | | | | | | | | | | |
Securities available for sale:
| | | | | | | | | | | | |
| U.S. Government sponsored entity mortgage-backed securities | | $ | — | | | $ | 55,636 | | | $ | — | |
| U.S. Treasury and federal agencies | | | — | | | | 40,091 | | | | — | |
| State and municipal obligations | | | — | | | | — | | | | — | |
| Corporate securities | | | — | | | | 10,466 | | | | — | |
| Equity securities | | | 13 | | | | — | | | | — | |
| Totals | | $ | 13 | | | $ | 106,193 | | | $ | — | |
81
TABLE OF CONTENTS
OCEAN SHORE HOLDING CO. AND SUBSIDIARIES
NOTES TO CONSOLIDATED FINANCIAL STATEMENTS
(All dollar amounts presented in the tables, except share and per share amounts, are in thousands)
14. FAIR VALUE MEASUREMENT – (continued)
Those assets as of December 31, 2011 which will continue to be measured at fair value on a recurring basis are as follows:
| | | | | | |
| | Category Used for Fair Value Measurement |
| | | Level 1 | | Level 2 | | Level 3 |
Assets:
| | | | | | | | | | | | |
Securities available for sale:
| | | | | | | | | | | | |
| U.S. Government sponsored entity mortgage-backed securities | | $ | — | | | $ | 14,128 | | | $ | — | |
| U.S. Treasury and federal agencies | | | — | | | | 25,685 | | | | — | |
| State and municipal obligations | | | — | | | | 832 | | | | — | |
| Corporate securities | | | — | | | | 6,110 | | | | — | |
| Equity securities | | | 13 | | | | — | | | | — | |
| Totals | | $ | 13 | | | $ | 46,755 | | | $ | — | |
In accordance with the fair value measurement and disclosures topic of the FASB Accounting Standards Codification management assessed whether the volume and level of activity for certain assets have significantly decreased when compared with normal market conditions. The Company concluded that there was not a significant decrease in the volume and level of activity with respect to certain investments included in the corporate debt securities and classified as level 2 in accordance with the framework for fair value measurements. Fair value for such securities is obtained from third party broker quotes. The Company evaluated these values to determine that the quoted price is based on current information that reflects orderly transactions or a valuation technique that reflects market participant assumptions by benchmarking the valuation results and assumptions used against similar securities that are more actively traded in order to assess the reasonableness of the estimated fair values. The fair market value estimates we assign to these securities assume liquidation in an orderly fashion and not under distressed circumstances.
Certain assets are measured at fair value on a nonrecurring basis; that is, the instruments are not measured at fair value on an ongoing basis but are subject to fair value adjustments in certain circumstances (for example, when there is evidence of impairment). The Company measures impaired loans, FHLB stock and loans or bank properties transferred into other real estate owned at fair value on a non-recurring basis.
Summary of Non-Recurring Fair Value Measurements
| | | | | | | | | | |
| | | | Category Used for
Fair Value Measurement | | Total (Losses) |
| | | Total | | Level 1 | | Level 2 | | Level 3 |
December 31, 2012
| | | | | | | | | | | | | | | | | | | | |
Assets:
| | | | | | | | | | | | | | | | | | | | |
| Impaired loans | | $ | 3,634 | | | $ | — | | | $ | 3,434 | | | $ | 200 | | | $ | (271 | ) |
| Real estate owned | | | 808 | | | | — | | | | 808 | | | | — | | | | (108 | ) |
December 31, 2011
| | | | | | | | | | | | | | | | | | | | |
Assets:
| | | | | | | | | | | | | | | | | | | | |
| Impaired loans | | $ | 2,915 | | | $ | — | | | $ | 2,915 | | | $ | — | | | $ | (505 | ) |
The Company considers a loan to be impaired when it becomes probable that the Company will be unable to collect all amounts due in accordance with the contractual terms of the loan agreement. Under FASB ASC 310, collateral dependent impaired loans are valued based on the fair value of the collateral, which is based on appraisals, less cost to sell. These adjustments are based upon observable inputs, and therefore, the fair value measurement has been categorized as a level 2 measurement. In some cases,
82
TABLE OF CONTENTS
OCEAN SHORE HOLDING CO. AND SUBSIDIARIES
NOTES TO CONSOLIDATED FINANCIAL STATEMENTS
(All dollar amounts presented in the tables, except share and per share amounts, are in thousands)
14. FAIR VALUE MEASUREMENT – (continued)
adjustments are made to the appraised values for various factors, including age of the appraisal, age of the comparables included in the appraisal, and known changes in the market and in the collateral. These adjustments are based upon unobservable inputs, and therefore, the fair value measurement has been categorized as a Level 3 measurement. Total loans remeasured at fair value for the twelve months ended December 31, 2012 were $3.6 million. Such loans were carried at the value of $3.9 million immediately prior to remeasurement, resulting in the recognition of impairment through earnings in the amount of $271 thousand. Total loans remeasured at fair value for the twelve months ended December 31, 2011 were $2.9 million. Such loans were carried at the value of $3.4 million immediately prior to remeasurement, resulting in the recognition of impairment through earnings for the life of the loans in the amount of $505 thousand.
Real Estate Owned
Once an asset is determined to be uncollectible, the underlying collateral is repossessed and reclassified to foreclosed real estate and repossessed assets. These assets are carried at lower of cost or fair value of the collateral, less cost to sell. These adjustments are based upon observable inputs, and therefore, the fair value measurement has been categorized as a Level 2 measurement. In some cases, adjustments are made to the appraised values for various factors, including age of the appraisal, age of the comparables included in the appraisal, and known changes in the market and in the collateral. These adjustments are based upon unobservable inputs, and therefore, the fair value measurement would be categorized as a Level 3 measurement. Total real estate owned remeasured at fair value for the twelve months ended December 31, 2012 was $1.0 million, of which $241 thousand was sold. These properties were carried at the value of $916 thousand immediately prior to remeasurement, resulting in the recognition of impairment through earnings in the amount of $108 thousand.
Fair Value of Financial Instruments
In accordance with FASB ASC 825-10-50-10, the Company is required to disclose the fair value of financial instruments. The fair value of a financial instrument is the current amount that would be exchanged between willing parties, other than in a distressed sale. Fair value is best determined using observable market prices; however for many of the Company’s financial instruments no quoted market prices are readily available. In instances where quoted market prices are not readily available, fair value is determined using present value or other techniques appropriate for the particular instrument. These techniques involve some degree of judgment and as a result are not necessarily indicative of the amounts the Company would realize in a current market exchange. Different assumptions or estimation techniques may have a material effect on the estimated fair value.
83
TABLE OF CONTENTS
OCEAN SHORE HOLDING CO. AND SUBSIDIARIES
NOTES TO CONSOLIDATED FINANCIAL STATEMENTS
(All dollar amounts presented in the tables, except share and per share amounts, are in thousands)
14. FAIR VALUE MEASUREMENT – (continued)
| | | | | | | | |
| | December 31, 2012 |
| | | Carrying Amount | | Category Used for Fair Value |
| | | Level 1 | | Level 2 | | Level 3 |
Assets:
| | | | | | | | | | | | | | | | |
| Cash and cash equivalents | | $ | 163,422 | | | $ | 163,422 | | | $ | — | | | $ | — | |
Investment securities:
| | | | | | | | | | | | | | | | |
| Held to maturity | | | 10,568 | | | | — | | | | 10,702 | | | | — | |
| Available for sale | | | 106,206 | | | | 13 | | | | 106,193 | | | | — | |
| Loans receivable, net | | | 703,898 | | | | — | | | | 731,546 | | | | — | |
| Federal Home Loan Bank stock | | | 6,390 | | | | — | | | | 6,390 | | | | — | |
Liabilities:
| | | | | | | | | | | | | | | | |
| NOW and other demand deposit accounts | | | 417,400 | | | | — | | | | 427,510 | | | | — | |
| Passbook savings and club accounts | | | 166,861 | | | | — | | | | 171,848 | | | | — | |
| Certificates | | | 217,503 | | | | — | | | | 215,638 | | | | — | |
| Advances from Federal Home Loan Bank | | | 110,000 | | | | — | | | | 124,140 | | | | — | |
| Junior subordinated debenture | | | 15,464 | | | | — | | | | 12,371 | | | | — | |
| | | | | | | | |
| | December 31, 2011 |
| | | Carrying Amount | | Category Used for Fair Value |
| | | Level 1 | | Level 2 | | Level 3 |
Assets:
| | | | | | | | | | | | | | | | |
| Cash and cash equivalents | | $ | 155,653 | | | $ | 155,653 | | | $ | — | | | $ | — | |
Investment securities:
| | | | | | | | | | | | | | | | |
| Held to maturity | | | 5,964 | | | | — | | | | 6,148 | | | | — | |
| Available for sale | | | 46,768 | | | | 13 | | | | 46,755 | | | | — | |
| Loans receivable, net | | | 727,626 | | | | — | | | | 742,869 | | | | — | |
| Federal Home Loan Bank stock | | | 6,435 | | | | — | | | | 6,435 | | | | — | |
Liabilities:
| | | | | | | | | | | | | | | | |
| NOW and other demand deposit accounts | | | 378,272 | | | | — | | | | 386,988 | | | | — | |
| Passbook savings and club accounts | | | 130,324 | | | | — | | | | 137,074 | | | | — | |
| Certificates | | | 243,859 | | | | — | | | | 242,344 | | | | — | |
| Advances from Federal Home Loan Bank | | | 110,000 | | | | — | | | | 131,037 | | | | — | |
| Junior subordinated debenture | | | 15,464 | | | | — | | | | 10,825 | | | | — | |
Cash and Cash Equivalents — For cash and cash equivalents, the carrying amount is a reasonable estimate of fair value.
Investment and Mortgage-Backed Securities — For investment securities, fair values are based on a combination of quoted prices for identical assets in active markets, quoted prices for similar assets in markets that are either actively or not actively traded and pricing models, discounted cash flow methodologies, or similar techniques that may contain unobservable inputs that are supported by little or no market activity and require significant judgment. For investment securities that do not actively trade in the marketplace, (primarily our investment in trust preferred securities of non-publicly traded companies) fair value is obtained from third party broker quotes. The Company evaluates prices from a third party pricing service, third party broker quotes, and from another independent third party valuation source to determine their estimated fair value. These quotes are benchmarked against similar securities that are more actively traded in order to assess the
84
TABLE OF CONTENTS
OCEAN SHORE HOLDING CO. AND SUBSIDIARIES
NOTES TO CONSOLIDATED FINANCIAL STATEMENTS
(All dollar amounts presented in the tables, except share and per share amounts, are in thousands)
14. FAIR VALUE MEASUREMENT – (continued)
reasonableness of the estimated fair values. The fair market value estimates we assign to these securities assume liquidation in an orderly fashion and not under distressed circumstances. For securities classified as available for sale the changes in fair value are reflected in the carrying value of the asset and are shown as a separate component of stockholders’ equity.
Loans Receivable – Net — The fair value of loans receivable is estimated based on the present value using discounted cash flows based on estimated market discount rates at which similar loans would be made to borrowers and reflect similar credit ratings and interest rate risk for the same remaining maturities.
Federal Home Loan Bank (FHLB) Stock — Although FHLB stock is an equity interest in an FHLB, it is carried at cost because it does not have a readily determinable fair value as its ownership is restricted and it lacks a market. While certain conditions are noted that required management to evaluate the stock for impairment, it is currently probable that the Company will realize its cost basis. Management concluded that no impairment existed as of December 31, 2012 and 2011. The estimated fair value approximates the carrying amount.
NOW and Other Demand Deposit, Passbook Savings and Club, and Certificates Accounts — The fair value of NOW and other demand deposit accounts and passbook savings and club accounts is the amount payable on demand at the reporting date. The fair value of certificates is estimated by discounting future cash flows using interest rates currently offered on certificates with similar remaining maturities.
Advances from FHLB — The fair value was estimated by determining the cost or benefit for early termination of each individual borrowing.
Junior Subordinated Debenture — The fair value was estimated by discounting approximate cash flows of the borrowings by yields estimating the fair value of similar issues.
Commitments to Extend Credit and Letters of Credit — The majority of the Bank’s commitments to extend credit and letters of credit carry current market interest rates if converted to loans. Because commitments to extend credit and letters of credit are generally unassignable by either the Bank or the borrower, they only have value to the Bank and the borrower. The estimated fair value approximates the recorded deferred fee amounts, which are not significant.
The fair value estimates presented herein are based on pertinent information available to management as of December 31, 2012 and 2011. Although management is not aware of any factors that would significantly affect the fair value amounts, such amounts have not been comprehensively revalued for purposes of these consolidated financial statements since December 31, 2012 and 2011, and, therefore, current estimates of fair value may differ significantly from the amounts presented herein.
15. MERGER WITH CBHC FINANCIALCORP, INC.
On August 1, 2011, the Company acquired CBHC Financialcorp, Inc. (“CBHC”) and its wholly-owned subsidiary, Select Bank, a federally chartered savings bank located in Egg Harbor City, New Jersey with $131 million in assets. The total cost of the transaction was $12.5 million. Following the acquisition of CBHC, Select Bank was merged into Ocean City Home Bank.
The CBHC transaction has been accounted for using the acquisition method of accounting and, accordingly, assets acquired, liabilities assumed and consideration exchanged were recorded at estimated fair value on the acquisition date. Fair values are preliminary and subject to refinement for up to one year after the closing date of the acquisition as additional information relative to closing date fair value becomes available. Assets acquired totaled $131.7 million, including $81.6 million in loans, $5.6 million in investment securities, $39.5 million in cash and cash equivalents and $0.7 million of intangibles. Liabilities assumed totaled $123.8 million, including $122.9 million of deposits.
85
TABLE OF CONTENTS
OCEAN SHORE HOLDING CO. AND SUBSIDIARIES
NOTES TO CONSOLIDATED FINANCIAL STATEMENTS
(All dollar amounts presented in the tables, except share and per share amounts, are in thousands)
15. MERGER WITH CBHC FINANCIALCORP, INC. – (continued)
Goodwill of $4.6 million is calculated as the purchase premium after adjusting for the fair value of net assets acquired and consists largely of the synergies and economies of scale expected from combining the operations of the Company and CBHC. An adjustment of $735 thousand was made to goodwill during the measurement period relating to the acquisition of CBHC Financialcorp, Inc., which is now closed, for additional information that was received regarding taxes. This adjustment was also made to the December 31, 2011 reported balance to retrospectively adjust the provisional amount of goodwill recognized at the acquisition date.
The following table summarizes the consideration paid for CBHC and the estimated fair value of the assets acquired and liabilities assumed as of the acquisition date:
| | |
Consideration paid:
| | | | |
| Cash | | $ | 12,459 | |
| Total purchase price | | $ | 12,459 | |
Identifiable assets:
| | | | |
| Cash and cash equivalents | | $ | 39,513 | |
| Investment securities | | | 5,641 | |
| Loans | | | 81,608 | |
| Office properties and equipment | | | 1,134 | |
| Core deposit intangible | | | 667 | |
| Other assets | | | 3,127 | |
| Total identifiable assets | | $ | 131,690 | |
Liabilities:
| | | | |
| Deposits | | $ | 122,879 | |
| Other liabilities | | | 896 | |
| Total liabilities | | $ | 123,775 | |
| Net identifiable assets acquired | | $ | 7,915 | |
| Goodwill | | | 4,544 | |
| Net assets acquired | | $ | 12,459 | |
| | | | | | | | | | | | | | | | | |
In many cases, determining the fair value of the acquired assets and assumed liabilities required the Company to estimate cash flows expected to result from those assets and liabilities and to discount those cash flows at appropriate rates of interest. The most significant of those determinations related to the fair valuation of acquired loans. The acquired loan portfolios were segregated into categories for valuation purposes primarily based on loan type and payment status (performing or nonperforming). The estimated fair values were computed by discounting the expected cash flows from the respective portfolios. Management estimated the cash flows expected to be collected at the acquisition date by using valuation models that incorporated estimates of current key assumptions, such as prepayment speeds, default rates, and loss severity rates. Prepayment assumptions were developed by reference to recent or historical prepayment speeds observed for loans with similar underlying characteristics. Prepayment assumptions were influenced by many factors including, but not limited to, forward interest rates, loan and collateral types, payment status, and current loan-to-value ratios. Default and loss severity rates were developed by reference to recent or historical default and loss rates observed for loans with similar underlying characteristics. Default and loss severity assumptions
86
TABLE OF CONTENTS
OCEAN SHORE HOLDING CO. AND SUBSIDIARIES
NOTES TO CONSOLIDATED FINANCIAL STATEMENTS
(All dollar amounts presented in the tables, except share and per share amounts, are in thousands)
15. MERGER WITH CBHC FINANCIALCORP, INC. – (continued)
were influenced by many factors including, but not limited to, underwriting processes and documentation, vintages, collateral types, collateral locations, estimated collateral values, loan-to-value ratios, and debt-to-income ratios.
The expected cash flows from the acquired loan portfolios were discounted at estimated market rates. The market rates were estimated using a buildup approach which included assumptions with respect to funding cost and funding mix, estimated servicing cost, liquidity premium, and additional spreads, if warranted, to compensate for the uncertainty inherent in the acquired loans. The methods used to estimate the fair values of the covered loans are extremely sensitive to the assumptions and estimates used. While management attempted to use assumptions and estimates that best reflected the acquired loan portfolios and current market conditions, a greater degree of subjectivity is inherent in these values than in those determined in active markets.
Acquired loans that have evidence of deterioration in credit quality since origination and for which it is probable, at acquisition, that the Company will be unable to collect all contractually required payments receivable are accounted for in accordance with ASC Subtopic 310-30, “Loans and Debt Securities Acquired with Deteriorated Credit Quality.” Such loans were initially recorded at fair value (as determined by the present value of expected future cash flows) with no carry-over valuation allowance (i.e., the allowance for loan losses) of CBHC’s previously established allowance for loan losses. Under ASC Subtopic 310-30, loans may be aggregated and accounted for as pools of loans if the loans being aggregated have common risk characteristics. The difference between the undiscounted cash flows expected at acquisition and the investment in the covered loans, or the “accretable yield,” is recognized as interest income utilizing the level-yield method over the life of each pool. Contractually required payments for interest and principal that exceed the undiscounted cash flows expected at acquisition, or the “non-accretable difference,” are not recognized as a yield adjustment or as a loss accrual or a valuation allowance. Increases in expected cash flows subsequent to the acquisition are recognized prospectively through adjustment of the yield on the pool over its remaining life, while decreases in expected cash flows are recognized as impairment through a loss provision and an increase in the allowance for loan losses.
The following is a summary of the loans acquired in the CBHC acquisition:
| | | | | | |
| | Acquired Credit Impaired Loans | | Acquired
Non-Credit Impaired Loans | | Total
Acquired
Loans |
| Contractually required principal and interest at acquisition | | $ | 7,486 | | | $ | 76,526 | | | $ | 84,012 | |
| Contractual cash flows not expected to be collected | | | -2,381 | | | | -1,455 | | | | -3,836 | |
| Expected cash flows at acquisition | | | 5,105 | | | | 75,071 | | | | 80,176 | |
| Interest component of expected cash flows | | | 91 | | | | 1,341 | | | | 1,432 | |
| Fair value of acquired loans | | $ | 5,197 | | | $ | 76,411 | | | $ | 81,608 | |
The core deposit intangible is being amortized over its estimated useful life of approximately 15 years, using an accelerated method. Goodwill, which is not amortized for book purposes, is not deductible for tax purposes.
The fair value of checking, savings and money market deposit accounts acquired from CBHC were assumed to approximate the carrying value as the accounts have no stated maturity and are payable on demand. Certificate of deposit accounts were valued as the present value of the certificates’ expected contracted payments discounted at market rates for similar certificates.
Direct costs related to the CBHC acquisition were expensed as incurred. During the three and twelve months ended December 31, 2011, the Company incurred $90 thousand and $826 thousand, respectively, of acquisition-related expenses. Such expenses were for professional services, fees associated with the conversion
87
TABLE OF CONTENTS
OCEAN SHORE HOLDING CO. AND SUBSIDIARIES
NOTES TO CONSOLIDATED FINANCIAL STATEMENTS
(All dollar amounts presented in the tables, except share and per share amounts, are in thousands)
15. MERGER WITH CBHC FINANCIALCORP, INC. – (continued)
of systems and integration of operations, costs related to office consolidations, marketing and promotion expenses, retention and severance compensation costs, and other costs.
The operating results of the Company for the period ended December 31, 2011 include the operating results of the acquired assets and assumed liabilities for the 153 days from the acquisition date of August 1, 2011. The operation of CBHC provided $1.4 million in revenue, net of interest expense, and $579 thousand in net income for the period from the acquisition and is included in the consolidated financial statements. CBHC’s results of operations prior to the acquisition are not included in the Company’s consolidated statement of income.
The following table presents certain pro forma information as if CBHC had been acquired on January 1, 2010. This information combines the historical results of CBHC into the Company’s consolidated statement of income, with adjustments to reflect certain fair valuation adjustments and acquisition-related activity. The Company expects to achieve operating cost savings and other business synergies as a result of the acquisition that are not reflected in the pro forma amounts. These pro forma results are presented for illustrative purposes and are not intended to represent or be indicative of the actual results of operations of the combined company that would have been achieved had the acquisition occurred at the beginning of each period presented, nor are they intended to represent or be indicative of future results of operations.
| | | | |
| | Pro Forma Years Ended December 31, |
| | | 2011 | | 2010 |
| Total revenues(a) | | $ | 31,908 | | | $ | 32,140 | |
| Net income | | $ | 5,116 | | | $ | 6,681 | |
| (a) | Represents net interest income plus other income. |
16. GOODWILL AND INTANGIBLE ASSETS
Goodwill totaled $4.6 million at December 31, 2012 as compared to $4.5 million at December 31, 2011. The Company completed its annual goodwill impairment test as of August 1, 2012 and concluded that goodwill was not impaired.
The core deposit intangible totaled $675 thousand at December 31, 2012 as compared to $677 thousand at December 31, 2011. The core deposit intangible is being amortized over its estimated useful life of approximately 15 years from August 1, 2011.
17. REAL ESTATE OWNED
Summary of Real Estate Owned Activity:
| | | | | | | | | | |
| | 2012 | | 2011 |
| | | Residential Property | | Commercial Property | | Total | | Residential Property | | Total |
| Balance, January 1, | | $ | 98 | | | $ | — | | | $ | 98 | | | $ | 98 | | | $ | 98 | |
| Transfers into Real Estate Owned | | | 555 | | | | 494 | | | | 1,049 | | | | 206 | | | | 206 | |
| Sales of Real Estate Owned | | | (241 | ) | | | — | | | | (241 | ) | | | (206 | ) | | | (206 | ) |
| Balance, December 31, | | $ | 412 | | | $ | 494 | | | $ | 906 | | | $ | 98 | | | $ | 98 | |
88
TABLE OF CONTENTS
OCEAN SHORE HOLDING CO. AND SUBSIDIARIES
NOTES TO CONSOLIDATED FINANCIAL STATEMENTS
(All dollar amounts presented in the tables, except share and per share amounts, are in thousands)
18. RELATED PARTY TRANSACTION
The Company obtains legal services from McCrosson and Stanton, PC, a legal firm located in Ocean City, NJ. Dorothy F. McCrosson, a Director at the Company since January 2011, is Managing Partner at McCrosson and Stanton, PC. Legal fees paid to McCrosson and Stanton, PC was $172, $136 and $114 thousand during the years ended December 31, 2012, 2011 and 2010, respectively.
19. PARENT ONLY FINANCIAL INFORMATION
The following are the condensed financial statements for Ocean Shore Holding Co. (Parent company):
CONDENSED STATEMENTS OF FINANCIAL CONDITION — PARENT ONLY
| | | | |
| | December 31, |
| | | 2012 | | 2011 |
Assets:
| | | | | | | | |
| Cash and cash equivilents | | $ | 4,241 | | | $ | 5,925 | |
| Investment securities | | | 4,578 | | | | 5,254 | |
| Investment in subsidiary | | | 105,439 | | | | 102,143 | |
| Other assets | | | 6,202 | | | | 7,110 | |
| Total assets | | $ | 120,460 | | | $ | 120,432 | |
Liabilities:
| | | | | | | | |
| Junior subordinated debenture | | $ | 15,464 | | | $ | 15,464 | |
| Other liabilities | | | 268 | | | | 288 | |
| Total liabilities | | | 15,732 | | | | 15,752 | |
| Stockholders' equity | | | 104,728 | | | | 104,680 | |
| Total liabilities and stockholders' equity | | $ | 120,460 | | | $ | 120,432 | |
CONDENSED STATEMENTS OF INCOME AND COMPREHENSIVE INCOME — PARENT ONLY
| | | | | | |
| | Years Ended December 31, |
| | | 2012 | | 2011 | | 2010 |
| Interest income | | $ | 500 | | | $ | 659 | | | $ | 898 | |
| Interest expense | | | 1,341 | | | | 1,341 | | | | 1,341 | |
| Net interest loss | | | (841 | ) | | | (682 | ) | | | (443 | ) |
| Other Income | | | 15 | | | | — | | | | — | |
| Other expenses | | | 147 | | | | 158 | | | | 170 | |
| Loss before income tax benefit and equity in undistributed earnings in subsidiary | | | (973 | ) | | | (840 | ) | | | (613 | ) |
| Income tax | | | (331 | ) | | | (286 | ) | | | (208 | ) |
| Loss before equity in undistributed earnings in subsidiary | | | (642 | ) | | | (554 | ) | | | (405 | ) |
| Dividends distributed from subsidiary | | | 3,600 | | | | — | | | | — | |
| Equity in undistributed earnings of subsidiary | | | 2,043 | | | | 5,612 | | | | 5,849 | |
| Net income | | $ | 5,001 | | | $ | 5,058 | | | $ | 5,444 | |
Other comprehensive income, net of tax
| | | | | | | | |
| Unrealized gain on available for sale securities | | | 675 | | | | 60 | | | | 438 | |
| Unrealized (loss) on post retirement life benefit | | | (148 | ) | | | — | | | | — | |
| Total other comprehensive income, net of tax | | | 527 | | | | 60 | | | | 438 | |
| Total comprehensive income | | $ | 5,528 | | | $ | 5,118 | | | $ | 5,882 | |
89
TABLE OF CONTENTS
OCEAN SHORE HOLDING CO. AND SUBSIDIARIES
NOTES TO CONSOLIDATED FINANCIAL STATEMENTS
(All dollar amounts presented in the tables, except share and per share amounts, are in thousands)
19. PARENT ONLY FINANCIAL INFORMATION – (continued)
CONDENSED STATEMENTS OF CASH FLOWS — PARENT ONLY
| | | | | | |
| | Years Ended December 31, |
| | | 2012 | | 2011 | | 2010 |
OPERATING ACTIVITIES:
| | | | | | | | | | | | |
| Net income | | $ | 5,001 | | | $ | 5,058 | | | | 5,444 | |
| Equity in undistributed earnings in subsidiary | | | (5,643 | ) | | | (5,612 | ) | | | (5,849 | ) |
| Net amortization of investment premiums/discounts | | | 4 | | | | 5 | | | | 8 | |
| Dividends from subsidiary | | | 3,600 | | | | 3,200 | | | | — | |
Changes in assets and liabilities which provided (used) cash:
| | | | | | | | | | | | |
| Accrued interest receivable | | | (1 | ) | | | 26 | | | | 5 | |
| Prepaid expenses and other assets | | | 519 | | | | 13,474 | | | | (1,636 | ) |
| Other liabilities | | | (21 | ) | | | (39 | ) | | | 648 | |
| Intercompany payables | | | 0 | | | | (1 | ) | | | 1 | |
| Net cash provided by (used in) operating activities | | | 3,459 | | | | 16,111 | | | | (1,379 | ) |
INVESTING ACTIVITIES:
| | | | | | | | | | | | |
Principal repayment of mortgage backed securities held
to maturity | | | 342 | | | | 426 | | | | 562 | |
Principal repayment of mortgage backed securities
available for sale | | | 562 | | | | 878 | | | | 1,116 | |
| Principal payments on ESOP loan | | | 311 | | | | 297 | | | | 282 | |
| Proceeds from call of investment secruities available for sale | | | 0 | | | | 500 | | | | — | |
| Net cash provided by investing activities | | | 1,215 | | | | 2,101 | | | | 1,960 | |
FINANCING ACTIVITIES:
| | | | | | | | | | | | |
| Purchase of treasury stock | | | (4,798 | ) | | | (59 | ) | | | (115 | ) |
| Proceeds from stock options exercised | | | 165 | | | | | | | | | |
| Proceeds from issuance of common stock | | | — | | | | — | | | | (16 | ) |
| Capital contribution to subsidiary | | | — | | | | — | | | | 8 | |
| Dividends received | | | — | | | | — | | | | 1,500 | |
| Dividends paid | | | (1,725 | ) | | | (1,751 | ) | | | (1,753 | ) |
| Cash used for acquisition, net of cash acquired | | | — | | | | (11,787 | ) | | | — | |
| Net cash (used in) financing activities | | | (6,359 | ) | | | (13,597 | ) | | | (376 | ) |
| Net increase in cash & cash equivalents | | | (1,684 | ) | | | 4,615 | | | | 205 | |
| Cash and cash equivalents – beginning | | | 5,925 | | | | 1,310 | | | | 1,105 | |
| Cash and cash equivalents – ending | | $ | 4,241 | | | $ | 5,925 | | | $ | 1,310 | |
90
TABLE OF CONTENTS
OCEAN SHORE HOLDING CO. AND SUBSIDIARIES
NOTES TO CONSOLIDATED FINANCIAL STATEMENTS
(All dollar amounts presented in the tables, except share and per share amounts, are in thousands)
20. QUARTERLY FINANCIAL DATA (unaudited)
| | | | | | | | |
| | Quarter Ended |
| | | March 31, 2012 | | June 30,
2012 | | September 30, 2012 | | December 31, 2012 |
| Total interest income | | $ | 9,611 | | | $ | 9,413 | | | $ | 9,075 | | | $ | 8,751 | |
| Total interest expense | | | 2,726 | | | | 2,616 | | | | 2,567 | | | | 2,308 | |
| Net interest income | | | 6,885 | | | | 6,797 | | | | 6,508 | | | | 6,443 | |
| Provision for loan losses | | | 173 | | | | 253 | | | | 148 | | | | 320 | |
Net interest income after provision for
loan losses | | | 6,712 | | | | 6,544 | | | | 6,360 | | | | 6,123 | |
| Other income | | | 905 | | | | 966 | | | | 1,029 | | | | 1,104 | |
| Other expense | | | 5,401 | | | | 5,391 | | | | 5,447 | | | | 5,323 | |
| Income before income taxes | | | 2,216 | | | | 2,119 | | | | 1,942 | | | | 1,904 | |
| Income taxes | | | 862 | | | | 822 | | | | 750 | | | | 746 | |
| Net income | | $ | 1,354 | | | $ | 1,297 | | | $ | 1,192 | | | $ | 1,158 | |
| Earnings per share basic(1) | | $ | 0.20 | | | $ | 0.19 | | | $ | 0.18 | | | $ | 0.18 | |
| Earnings per share diluted(1) | | $ | 0.20 | | | $ | 0.19 | | | $ | 0.18 | | | $ | 0.18 | |
| (1) | Earnings per share are computed independently for each period presented. |
Consequently, the sum of the quarters may not equal the total earnings per share for the year.
| | | | | | | | |
| | Quarter Ended |
| | | March 31, 2011 | | June 30,
2011 | | September 30, 2011 | | December 31, 2011 |
| Total interest income | | $ | 9,038 | | | $ | 9,168 | | | $ | 9,998 | | | $ | 9,883 | |
| Total interest expense | | | 3,063 | | | | 3,005 | | | | 3,221 | | | | 2,896 | |
| Net interest income | | | 5,975 | | | | 6,163 | | | | 6,777 | | | | 6,987 | |
| Provision for loan losses | | | 75 | | | | 128 | | | | 141 | | | | 129 | |
Net interest income after provision for
loan losses | | | 5,900 | | | | 6,035 | | | | 6,636 | | | | 6,858 | |
| Other income | | | 802 | | | | 862 | | | | 935 | | | | 939 | |
| Other expense | | | 4,656 | | | | 4,810 | | | | 5,521 | | | | 5,389 | |
| Income before income taxes | | | 2,046 | | | | 2,087 | | | | 2,050 | | | | 2,408 | |
| Income taxes | | | 841 | | | | 929 | | | | 835 | | | | 927 | |
| Net income | | $ | 1,205 | | | $ | 1,158 | | | $ | 1,215 | | | $ | 1,481 | |
| Earnings per share basic(1) | | $ | 0.18 | | | $ | 0.17 | | | $ | 0.18 | | | $ | 0.22 | |
| Earnings per share diluted(1) | | $ | 0.18 | | | $ | 0.17 | | | $ | 0.18 | | | $ | 0.22 | |
| (1) | Earnings per share are computed independently for each period presented. |
Consequently, the sum of the quarters may not equal the total earnings per share for the year.
* * * * * *
91
TABLE OF CONTENTS
| ITEM 9. | CHANGES IN AND DISAGREEMENTS WITH ACCOUNTANTS ON ACCOUNTING AND FINANCIAL DISCLOSURE |
None.
ITEM 9A. CONTROLS AND PROCEDURES
| (a) | Disclosure Controls and Procedures |
The Company’s management, including the Company’s principal executive officer and principal financial officer, have evaluated the effectiveness of the Company’s “disclosure controls and procedures,” as such term is defined in Rule 13a-15(e) promulgated under the Securities Exchange Act of 1934, as amended (the “Exchange Act”). Based upon their evaluation, the principal executive officer and principal financial officer concluded that, as of the end of the period covered by this report, the Company’s disclosure controls and procedures were effective.
| (b) | Internal Controls over Financial Reporting |
Management’s annual report on internal control over financial reporting is located on page 44 of this Form 10-K.
Report of Independent Registered Public Accounting Firm is located on page 45 of this Form 10-K.
| (c) | Changes to Internal Control Over Financial Reporting |
There have been no changes in the Company’s internal control over financial reporting during the quarter ended December 31, 2012 that have materially affected, or are reasonably likely to materially affect, the Company’s internal control over financial reporting.
| ITEM 9B. | OTHER INFORMATION |
None.
92
TABLE OF CONTENTS
PART III
| ITEM 10. | DIRECTORS, EXECUTIVE OFFICERS AND CORPORATE GOVERNANCE |
The information relating to the directors and officers of Ocean Shore Holding, information regarding compliance with Section 16(a) of the Exchange Act and information regarding the audit committee and audit committee financial expert is incorporated herein by reference to Ocean Shore Holding’s Proxy Statement for the 2013 Annual Meeting of Stockholders and to Part I, Item 1,“Business — Executive Officers of the Registrant” to this Annual Report on Form 10-K.
Ocean Shore Holding has adopted a code of ethics that applies to its principal executive officer, the principal financial officer and principal accounting officer. See Exhibit 14.0 to this Annual Report on Form 10-K.
| ITEM 11. | EXECUTIVE COMPENSATION |
The information regarding executive compensation is incorporated herein by reference to Ocean Shore Holding’s Proxy Statement for the 2013 Annual Meeting of Stockholders.
| ITEM 12. | SECURITY OWNERSHIP OF CERTAIN BENEFICIAL OWNERS AND MANAGEMENT AND RELATED STOCKHOLDERS MATTERS |
| (a) | Security Ownership of Certain Beneficial Owners |
Information required by this item is incorporated herein by reference to the section captioned “Stock Ownership” in Ocean Shore Holding’s Proxy Statement for the 2013 Annual Meeting of Stockholders.
| (b) | Security Ownership of Management |
Information required by this item is incorporated herein by reference to the section captioned “Stock Ownership” in Ocean Shore Holding’s Proxy Statement for the 2013 Annual Meeting of Stockholders.
Management of Ocean Shore Holding knows of no arrangements, including any pledge by any person or securities of Ocean Shore Holding, the operation of which may at a subsequent date result in a change in control of the registrant.
| (d) | Equity Compensation Plan Information |
The following table sets forth information as of December 31, 2012 about Company common stock that may be issued upon the exercise of options under the Company’s equity incentive plans. The plans were approved by the Company’s stockholders.
| | | | | | |
| Plan Category | | Number of securities to be issued upon the exercise of outstanding options, warrants and rights | | Weighted-average exercise price of outstanding options, warrants and rights | | Number of securities remaining available for future issuance under equity compensation plans (excluding securities reflected in the first column) |
| Equity compensation plans approved by security holders | | | 649,313 | | | $ | 11.95 | | | | 66,306 | |
| Equity compensation plans not approved by security holders | | | — | | | | — | | | | — | |
| Total | | | 649,313 | | | $ | 11.95 | | | | 66,306 | |
93
TABLE OF CONTENTS
| ITEM 13. | CERTAIN RELATIONSHIPS AND RELATED TRANSACTIONS, AND DIRECTOR INDEPENDENCE |
The information relating to certain relationships and related transactions and director independence is incorporated herein by reference to Ocean Shore Holding’s Proxy Statement for the 2013 Annual Meeting of Stockholders.
| ITEM 14. | PRINCIPAL ACCOUNTANT FEES AND SERVICES |
The information relating to the principal accountant fees and expenses is incorporated herein by reference to Ocean Shore Holding’s Proxy Statement for the 2013 Annual Meeting of Stockholders.
94
TABLE OF CONTENTS
PART IV
| ITEM 15. | EXHIBITS, FINANCIAL STATEMENT SCHEDULES |
| (1) | The financial statements required in response to this item are incorporated by reference from Item 8 of this report. |
| (2) | All financial statement schedules are omitted because they are not required or applicable, or the required information is shown in the consolidated financial statements or the notes thereto. |
| | | | |
| Exhibit No. | | Description | | Incorporated by Reference to: |
| 3.1 | | Certificate of Incorporation of Ocean Shore Holding Co. | | Exhibit 3.1 to Registration Statement on Form S-1 (File No. 333-153454), as amended, initially filed on September 12, 2008. |
| 3.2 | | Bylaws of Ocean Shore Holding Co. | | Exhibit 3.2 to Registration Statement on Form S-1 (File No. 333-153454), as amended, initially filed on September 12, 2008. |
| 4.1 | | No long-term debt instrument issued by Ocean Shore Holding Co. exceeds 10% of consolidated assets or is registered. In accordance with paragraph 4(iii) of Item 601(b) of Regulation S-K, Ocean Shore Holding Co. will furnish the Securities and Exchange Commission copies of long-term debt instruments and related agreements upon request |
| 10.1* | | Amended and Restated Employment Agreement by and between Ocean Shore Holding Co., Ocean City Home Bank and Steven E. Brady | | Exhibit 10.1 to Form 10-K for the year ended December 31, 2008, SEC File No. 000-51000. |
| 10.2* | | Amended and Restated Salary Continuation Agreement by and between Ocean City Home Bank and Steven E. Brady | | Exhibit 10.0 to Form 10-Q for the quarter ended June 30, 2008, SEC File No 000-51000. |
| 10.3* | | Salary Continuation Agreement by and between Ocean City Home Bank and Kim M. Davidson and all amendments thereto | | Exhibit 10.1 to Form 8-K filed on April 22, 2010, SEC File No. 000-53856. |
| 10.4* | | Salary Continuation Agreement by and between Ocean City Home Bank and Anthony J. Rizzotte and all amendments thereto | | Exhibit 10.9 to Registration Statement on Form S-1 (File No. 333-118597), as amended, initially filed on August 27, 2004. |
| 10.5* | | Split Dollar Life Insurance Agreement by and between Ocean City Home Bank and Steven E. Brady | | Exhibit 10.10 to Registration Statement on Form S-1 (File No. 333-118597), as amended, initially filed on August 27, 2004. |
| 10.6* | | Split Dollar Life Insurance Agreement by and between Ocean City Home Bank and Kim M. Davidson | | Exhibit 10.2 to Form 8-K filed on April 22, 2010, SEC File No. 000-53856. |
| 10.7* | | Split Dollar Life Insurance Agreement by and between Ocean City Home Bank and Anthony J. Rizzotte | | Exhibit 10.11 to Registration Statement on Form S-1 (File No. 333-118597), as amended, initially filed on August 27, 2004. |
| 10.8* | | Amended and Restated Change in Control Agreement by and between Ocean City Home Bank and Anthony J. Rizzotte | | Exhibit 10.6 to Form 10-K for the year ended December 31, 2008, SEC File No. 000-51000. |
95
TABLE OF CONTENTS
| | | | |
| Exhibit No. | | Description | | Incorporated by Reference to: |
| 10.9* | | Amended and Restated Change in Control Agreement by and between Ocean City Home Bank and Donald Morgenweck | | Exhibit 10.7 to Form 10-K for the year ended December 31, 2008, SEC File No. 000-51000. |
| 10.10* | | Amended and Restated Change in Control Agreement by and between Ocean City Home Bank and Kim M. Davidson | | Exhibit 10.8 to Form 10-K for the year ended December 31, 2008, SEC File No. 000-51000. |
| 10.11* | | Change in Control Agreement by and between Ocean City Home Bank and Janet Bossi | | Exhibit 10.1 to Form 8-K filed on December 20, 2012, SEC File No. 000-53856. |
| 10.12* | | Amended and Restated Change in Control Agreement by and between Ocean City Home Bank and Paul Esposito | | Exhibit 10.10 to Form 10-K for the year ended December 31, 2008, SEC File No. 000-51000. |
| 10.13* | | Amended and Restated Ocean City Home Bank Directors’ Deferred Compensation Plan | | Exhibit 10.11 to Form 10-K for the year ended December 31, 2008, SEC File No. 000-51000. |
| 10.14* | | Ocean City Home Bank Director and Executive Life Insurance Plan | | Exhibit 10.12 to Registration Statement on Form S-1 (File No. 333-118597), as amended, initially filed on August 27, 2004. |
| 10.15* | | Amended and Restated Ocean City Home Bank Supplemental Executive Retirement Plan | | Exhibit 10.13 to Form 10-K for the year ended December 31, 2008, SEC File No. 000-51000. |
| 10.16 | | Amended and Restated Ocean City Home Bank Change in Control Severance Compensation Plan | | Exhibit 10.14 to Form 10-K for the year ended December 31, 2008, SEC File No. 000-51000. |
| 10.17* | | Ocean City Home Bank Stock-Based Deferred Compensation Plan, as amended | | Exhibit 10.15 to Form 10-K for the year ended December 31, 2008, SEC File No. 000-51000. |
| 10.18* | | Ocean Shore Holding Co. 2005 Equity Incentive Plan | | Appendix A to definitive Proxy Statement filed on June 7, 2005, SEC File No. 000-51000. |
| 10.19* | | Ocean Shore Holding Co. 2010 Equity Incentive Plan | | Appendix A to definitive Proxy Statement filed on May 19, 2010, SEC File No. 000-53856. |
| 10.20* | | Form of Restricted Stock Award Agreement, Form of Non-Statutory Stock Option Award Agreement, and Form of Incentive Stock Option Award Agreement for the Ocean Shore Holding Co. 2005 Equity Incentive Plan | | Exhibit 10 to Registration Statement on Form S-8 (File No. 333-121595) filed on August 15, 2005. |
| 10.21* | | Form of Incentive Stock Option Award Agreement | | Exhibit 99.2 to Registration Statement on Form S-8 (File No. 333-168525) filed on August 4, 2010. |
| 10.22* | | Form of Non-Statutory Stock Option Award Agreement | | Exhibit 99.3 to Registration Statement on Form S-8 (File No. 333-168525) filed on August 4, 2010). |
| 10.23* | | Form of Restricted Stock Award Agreement | | Exhibit 99.4 to Registration Statement on Form S-8 (File No. 333-168525) filed on August 4, 2010. |
| 14 | | Code of Ethics and Business Conduct |
| 21 | | Subsidiaries | | Exhibit 21.0 to Form 10-K for the year ended December 31, 2009, SEC File No. 000-53856. |
| 23 | | Consent of Deloitte & Touche LLP |
| 31.1 | | Rule 13a-14(a)/15d-14(a) Certification of Chief Executive Officer |
96
TABLE OF CONTENTS
| | | | |
| Exhibit No. | | Description | | Incorporated by Reference to: |
| 31.2 | | Rule 13a-14(a)/15d-14(a) Certification of Chief Financial Officer |
| 32 | | Section 1350 Certification of Chief Executive Officer and Chief Financial Officer |
| 101.0** | | The following materials from the Ocean Shore Holding Co. Annual Report on Form 10-K for the year ended December 31, 2011 formatted in Extensible Business Reporting Language (XBRL): (i) the Consolidated Statements of Financial Condition, (ii) the Consolidated Statements of Income, (iii) the Consolidated Statements of Cash Flows and (iv) the notes to the Consolidated Statements, tagged as blocks of text. | | |
| * | Management contract or compensatory plan, contract or arrangement. |
| ** | Pursuant to Rule 406T of Regulation S-T, the Interactive Data Files on Exhibit 101 hereto are deemed not filed or part of a registration statement or prospectus for purposes of Sections 11 or 12 of the Securities Act of 1933, as amended, are deemed not filed for purposes of Section 18 of the Securities and Exchange Act of 1934, as amended, and otherwise are not subject to liability under those sections. |
97
TABLE OF CONTENTS
SIGNATURES
Pursuant to the requirements of Section 13 or 15(d) of the Securities Exchange Act of 1934, the Registrant has duly caused this report to be signed on its behalf by the undersigned, thereunto duly authorized.
OCEAN SHORE HOLDING CO.
| | |
| Date: March 18, 2013 | | By: /s/ Steven E. Brady
Steven E. Brady
President and Chief Executive Officer |
Pursuant to the requirements of the Securities Exchange Act of 1934, this report has been signed below by the following persons on behalf of the Registrant and in the capacities and on the dates indicated.
| | | | |
| Name | | Title | | Date |
/s/ Steven E. Brady
Steven E. Brady | | President, Chief Executive Officer
(principal executive officer) | | March 18, 2013 |
/s/ Donald F. Morgenweck
Donald F. Morgenweck | | Senior Vice President and
Chief Financial Officer
(principal accounting and financial officer) | | March 18, 2013 |
/s/ Frederick G. Dalzell
Frederick G. Dalzell, M.D. | | Director | | March 18, 2013 |
/s/ Christopher J. Ford
Christopher J. Ford | | Director | | March 18, 2013 |
/s/ Dorothy F. McCrosson
Dorothy F. McCrosson, Esq. | | Director | | March 18, 2013 |
/s/ Robert A. Previti
Robert A. Previti, Ed.D. | | Director | | March 18, 2013 |
/s/ John L. Van Duyne.
John L. Van Duyne, Jr. | | Director | | March 18, 2013 |
/s/ Samuel R. Young
Samuel R. Young | | Director | | March 18, 2013 |
98