Exhibit 99.1
PRO FORMA VALUATION REPORT
OCEAN SHORE HOLDING CO.
Ocean City, New Jersey
HOLDING COMPANY FOR:
OCEAN CITY HOME BANK
Ocean City, New Jersey
Dated As Of:
August 22, 2008
Prepared By:
RP® Financial, LC.
1700 North Moore Street
Suite 2210
Arlington, Virginia 22209
RP® FINANCIAL, LC.
Financial Services Industry Consultants
August 22, 2008
Boards of Directors
OC Financial MHC
Ocean Shore Holding Co.
Ocean City Home Bank
1001 Asbury Avenue
Ocean City, New Jersey 08226-3329
Members of the Boards of Directors:
At your request, we have completed and hereby provide an independent appraisal (“Appraisal”) of the estimated pro forma market value of the common stock to be issued by Ocean Shore Holding Co., Ocean City, New Jersey (“OSHC” or the “Company”) in connection with the mutual-to-stock conversion of OC Financial MHC (the “MHC”). The MHC currently has a majority ownership interest in, and its principal asset consists of, approximately 57.20% of the common stock of OSHC (the “MHC Shares”), the mid-tier holding company for Ocean City Home Bank, Ocean City, New Jersey (the “Bank”). The remaining 42.80% of OSHC’s common stock is owned by public stockholders. OSHC, which completed its initial public stock offering in December 2004, owns 100% of the common stock of the Bank. It is our understanding that OSHC will offer its stock, representing the majority ownership interest held by the MHC, in a subscription offering to Eligible Account Holders, Supplemental Eligible Account Holders and Other Members. To the extent that shares remain available for purchase after satisfaction of all subscriptions received in the subscription offering, the shares may be offered for sale in a community offering to members of the local community and the public at large.
This Appraisal is furnished pursuant to the requirements of the Code of Federal Regulations 563b.7 and has been prepared in accordance with the “Guidelines for Appraisal Reports for the Valuation of Savings and Loan Associations Converting from Mutual to Stock Form of Organization” of the Office of Thrift Supervision (“OTS”), which have been adopted in practice by the Federal Deposit Insurance Corporation (“FDIC”).
Plan of Conversion and Stock Issuance
On August 20, 2008, the respective Boards of Directors of the MHC, the Company and the Bank adopted a Plan of Conversion and Reorganization (the “Plan of Conversion”), pursuant to which the mutual holding company will convert to the stock form of organization. Pursuant to the Plan of Conversion, (i) the MHC will convert to stock form, (ii) the MHC and the Company will merge into the Bank and the Bank will become a wholly owned subsidiary of a newly chartered stock company (the “Company”), (iii) the shares of common stock of the Company held by persons other than the MHC will be converted into shares of common stock of the Company pursuant to an exchange ratio designed to preserve the percentage ownership
| Washington Headquarters | ||
| Rosslyn Center | Telephone: (703) 528-1700 | |
| 1700 North Moore Street, Suite 2210 | Fax No.: (703) 528-1788 | |
| Arlington, VA 22209 | Toll-Free No.: (866) 723-0594 | |
| www.rpfinancial.com | E-Mail: mail@rpfinancial.com |
Boards of Directors
August 22, 2008
Page 2
interests of such persons, and (iv) the Company will offer and sell shares of its common stock to certain depositors of the Bank, residents of Bank’s local community and shareholders of the Company and others in the manner and subject to the priorities set forth in the Plan of Conversion. As of August 22, 2008, the MHC’s ownership interest in OSHC approximated 57.20%. The Company will also issue shares of its common stock to the public stockholders of OSHC pursuant to an exchange ratio that will result in the public shareholders owning the same aggregate percentage of the newly issued OSHC common stock as owned immediately prior to the conversion. As of August 22, 2008, the public stockholders’ ownership interest in OSHC approximated 42.80%.
RP® Financial, LC.
RP® Financial, LC. (“RP Financial”) is a financial consulting firm serving the financial services industry nationwide that, among other things, specializes in financial valuations and analyses of business enterprises and securities, including the pro forma valuation for savings institutions converting from mutual-to-stock form. The background and experience of RP Financial is detailed in Exhibit V-1. We believe that, except for the fee we will receive for our appraisal, we are independent of the Company, the Bank, the MHC and the other parties engaged by the Bank or the Company to assist in the stock conversion process.
Valuation Methodology
In preparing our Appraisal, we have reviewed the regulatory applications of OSHC, the Bank and the MHC, including the prospectus as filed with the OTS and the Securities and Exchange Commission (“SEC”). We have conducted a financial analysis of OSHC, the Bank and the MHC that has included a review of audited financial information for fiscal years ended December 31, 2003 through 2007, a review of various unaudited information and internal financial reports through June 30, 2008, and due diligence related discussions with OSHC’s management; Deloitte & Touche, LLP, the Company’s independent auditor; Kilpatrick Stockton, LLP, the Company’s conversion counsel; and Sandler O’Neill & Partners, L.P., the Company’s financial and marketing advisor in connection with the stock offering. All assumptions and conclusions set forth in the Appraisal were reached independently from such discussions. In addition, where appropriate, we have considered information based on other available published sources that we believe are reliable. While we believe the information and data gathered from all these sources are reliable, we cannot guarantee the accuracy and completeness of such information.
We have investigated the competitive environment within which OSHC operates and have assessed OSHC’s relative strengths and weaknesses. We have kept abreast of the changing regulatory and legislative environment for financial institutions and analyzed the potential impact on OSHC and the industry as a whole. We have analyzed the potential effects of the stock conversion on OSHC’s operating characteristics and financial performance as they relate to the pro forma market value of OSHC. We have analyzed the assets held by the MHC, which will be consolidated with OSHC’s assets and equity pursuant to the completion of conversion. We have reviewed the economic and demographic characteristics of the Company’s primary market area. We have compared OSHC’s financial performance and condition with selected publicly-traded thrifts in accordance with the Valuation Guidelines, as
Boards of Directors
August 22, 2008
Page 3
well as all publicly-traded thrifts and thrift holding companies. We have reviewed the current conditions in the securities markets in general and the market for thrift stocks in particular, including the market for existing thrift issues, initial public offerings by thrifts and thrift holding companies, and second-step conversion offerings. We have excluded from such analyses thrifts subject to announced or rumored acquisition, and/or institutions that exhibit other unusual characteristics.
The Appraisal is based on OSHC’s representation that the information contained in the regulatory applications and additional information furnished to us by OSHC and its independent auditor, legal counsel and other authorized agents are truthful, accurate and complete. We did not independently verify the financial statements and other information provided by OSHC, or its independent auditor, legal counsel and other authorized agents nor did we independently value the assets or liabilities of OSHC. The valuation considers OSHC only as a going concern and should not be considered as an indication of OSHC’s liquidation value.
Our appraised value is predicated on a continuation of the current operating environment for OSHC and for all thrifts and their holding companies. Changes in the local, state and national economy, the legislative and regulatory environment for financial institutions and mutual holding companies, the stock market, interest rates, and other external forces (such as natural disasters or significant world events) may occur from time to time, often with great unpredictability and may materially impact the value of thrift stocks as a whole or the value of OSHC’s stock alone. It is our understanding that there are no current plans for selling control of OSHC following completion of the second-step stock offering. To the extent that such factors can be foreseen, they have been factored into our analysis.
The estimated pro forma market value is defined as the price at which OSHC’s common stock, immediately upon completion of the second-step stock offering, would change hands between a willing buyer and a willing seller, neither being under any compulsion to buy or sell and both having reasonable knowledge of relevant facts.
Valuation Conclusion
It is our opinion that, as of August 22, 2008, the estimated aggregate pro forma valuation of the shares to be issued in the conversion of the MHC, including: (1) newly-issued shares representing the MHC’s ownership interest in OSHC, and (2) exchange shares issued to existing public shareholders of OSHC, was $78,670,386 at the midpoint, equal to 8,741,204 shares at a per share value of $9.00. The resulting range of value pursuant to regulatory guidelines and the corresponding number of shares based on the Board approved $9.00 per share offering price is set forth below.
Boards of Directors
August 22, 2008
Page 4
| Total Shares | Offering Shares | Exchange Shares Issued to the Public Shareholders | Exchange Ratio | ||||||||||
Shares | (x | ) | |||||||||||
Maximum | 10,052,384 | 5,750,000 | 4,302,384 | 1.20773 | |||||||||
Midpoint | 8,741,204 | 5,000,000 | 3,741,204 | 1.05020 | |||||||||
Minimum | 7,430,023 | 4,250,000 | 3,180,023 | 0.89267 | |||||||||
Distribution of Shares | |||||||||||||
Maximum | 100.00 | % | 57.20 | % | 42.80 | % | |||||||
Midpoint | 100.00 | % | 57.20 | % | 42.80 | % | |||||||
Minimum | 100.00 | % | 57.20 | % | 42.80 | % | |||||||
Aggregate Market Value(1) | |||||||||||||
Maximum | 90,471,456 | $ | 51,750,000 | 38,721,456 | |||||||||
Midpoint | 78,670,836 | $ | 45,000,000 | 33,670,836 | |||||||||
Minimum | 66,870,207 | $ | 38,250,000 | 28,620,207 | |||||||||
| (1) | Based on offering price of $9.00 per share. |
Establishment of the Exchange Ratio
OTS regulations provide that in a conversion of a mutual holding company, the minority stockholders are entitled to exchange the public shares for newly issued shares of OSHC stock as a fully converted company. The Board of Directors of the MHC has independently determined the exchange ratio. The determined exchange ratio has been designed to preserve the current aggregate percentage ownership in OSHC equal to 57.20% as of June 30, 2008. The exchange ratio to be received by the existing minority shareholders of OSHC will be determined at the end of the offering, based on the total number of shares sold in the subscription and community offerings. Based upon this calculation, and the valuation conclusion and offering range concluded above, the exchange ratio would be 0.89267 shares, 1.05020 shares, and 1.20773 shares of newly issued shares of OSHC stock for each share of stock held by the public shareholders at the minimum, midpoint, and maximum of the offering range, respectively. RP Financial expresses no opinion on the proposed exchange of newly issued Company shares for the shares held by the public stockholders or on the proposed exchange ratio.
Limiting Factors and Considerations
Our valuation is not intended, and must not be construed, as a recommendation of any kind as to the advisability of purchasing shares of the common stock. Moreover, because such valuation is necessarily based upon estimates and projections of a number of matters, all of
Boards of Directors
August 22, 2008
Page 5
which are subject to change from time to time, no assurance can be given that persons who purchase shares of common stock in the conversion will thereafter be able to buy or sell such shares at prices related to the foregoing valuation of the estimated pro forma market value thereof. The appraisal reflects only a valuation range as of this date for the pro forma market value of OSHC immediately upon issuance of the stock and does not take into account any trading activity with respect to the purchase and sale of common stock in the secondary market following the completion of the second-step offering.
RP Financial’s valuation was based on the financial condition, operations and shares outstanding of OSHC as of June 30, 2008, the date of the financial data included in the prospectus. The proposed exchange ratio to be received by the current public stockholders of OSHC and the exchange of the public shares for newly issued shares of OSHC common stock as a full public company was determined independently by the Boards of Directors of the MHC, OSHC and the Bank. RP Financial expresses no opinion on the proposed exchange ratio to public stockholders or the exchange of public shares for newly issued shares.
RP Financial is not a seller of securities within the meaning of any federal and state securities laws and any report prepared by RP Financial shall not be used as an offer or solicitation with respect to the purchase or sale of any securities. RP Financial maintains a policy which prohibits RP Financial, its principals or employees from purchasing stock of its client institutions.
This valuation will be updated as provided for in the conversion regulations and guidelines. These updates will consider, among other things, any developments or changes in the financial performance and condition of OSHC, management policies, and current conditions in the equity markets for thrift shares, both existing issues and new issues. These updates may also consider changes in other external factors which impact value including, but not limited to: various changes in the legislative and regulatory environment for financial institutions, the stock market and the market for thrift stocks, and interest rates. Should any such new developments or changes be material, in our opinion, to the valuation of the shares, appropriate adjustments to the estimated pro forma market value will be made. The reasons for any such adjustments will be explained in the update at the date of the release of the update. The valuation will also be updated at the completion of OSHC’s stock offering.
| Respectfully submitted, |
RP® FINANCIAL, LC.
/s/ James P. Hennessey |
| James P. Hennessey |
| Director |
| RP® Financial, L.C | TABLE OF CONTENTS | |
| i |
TABLE OF CONTENTS
OCEAN SHORE HOLDING CO.
OCEAN CITY HOME BANK
Ocean City, New Jersey
DESCRIPTION | PAGE NUMBER | |||
CHAPTER ONE | OVERVIEW AND FINANCIAL ANALYSIS | |||
Introduction | I.1 | |||
Plan of Conversion and Reorganization | I.2 | |||
Purpose of the Reorganization | I.2 | |||
Strategic Overview | I.3 | |||
Balance Sheet Trends | I.6 | |||
Income and Expense Trends | I.11 | |||
Interest Rate Risk Management | I.16 | |||
Lending Activities and Strategy | I.17 | |||
Asset Quality | I.20 | |||
Funding Composition and Strategy | I.21 | |||
Subsidiaries | I.22 | |||
Legal Proceedings | I.22 | |||
CHAPTER TWO | MARKET AREA | |||
Introduction | II.1 | |||
Market Area Demographics | II.2 | |||
Summary of Local Economy and Workforce | II.4 | |||
Unemployment Trends | II.8 | |||
Market Area Deposit Characteristics | II.8 | |||
CHAPTER THREE | PEER GROUP ANALYSIS | |||
Peer Group Selection | III.1 | |||
Financial Condition | III.6 | |||
Income and Expense Components | III.9 | |||
Loan Composition | III.12 | |||
Credit Risk | III.12 | |||
Interest Rate Risk | III.15 | |||
Summary | III.17 | |||
| RP® Financial, L.C | TABLE OF CONTENTS | |
| ii |
TABLE OF CONTENTS
OCEAN SHORE HOLDING CO.
OCEAN CITY HOME BANK
Ocean City, New Jersey
(continued)
DESCRIPTION | PAGE NUMBER | |||||
| CHAPTER FOUR | VALUATION ANALYSIS | |||||
Introduction | IV.1 | |||||
Appraisal Guidelines | IV.1 | |||||
RP Financial Approach to the Valuation | IV.1 | |||||
Valuation Analysis | IV.2 | |||||
1. Financial Condition | IV.3 | |||||
2. Profitability, Growth and Viability of Earnings | IV.4 | |||||
3. Asset Growth | IV.5 | |||||
4. Primary Market Area | IV.5 | |||||
5. Dividends | IV.7 | |||||
6. Liquidity of the Shares | IV.7 | |||||
7. Marketing of the Issue | IV.8 | |||||
| A. | The Public Market | IV.8 | ||||
| B. | The New Issue Market | IV.15 | ||||
| C. | The Acquisition Market | IV.17 | ||||
| D. | Trading in OSHC’s Stock | IV.17 | ||||
8. Management | IV.18 | |||||
9. Effect of Government Regulation and Regulatory Reform | IV.18 | |||||
Summary of Adjustments | IV.19 | |||||
Valuation Approaches | IV.19 | |||||
1. Earnings Approach (“P/E” and “Core P/E”) | IV.21 | |||||
2. Book Value Approach (“P/B” and “P/TB”) | IV.21 | |||||
3. Assets Approach (“P/A”) | IV.22 | |||||
Valuation Conclusion | IV.22 | |||||
Establishment of the Exchange Ratio | IV.23 | |||||
| RP® Financial, LC. | LIST OF TABLES | |
| iii |
LIST OF TABLES
OCEAN SHORE HOLDING CO.
OCEAN CITY HOME BANK
Ocean City, New Jersey
TABLE | DESCRIPTION | PAGE | ||
| 1.1 | Historical Balance Sheets | I.7 | ||
| 1.2 | Historical Income Statements | I.12 | ||
| 2.1 | Map of Branch Locations | II.1 | ||
| 2.2 | Summary Demographic Data | II.3 | ||
| 2.3 | Estimated and Projected Employment | II.5 | ||
| 2.4 | Major Employers in Cape May and Atlantic Counties | II.7 | ||
| 2.5 | Unemployment Trends | II.8 | ||
| 2.6 | Cape May County and Atlantic County Deposit Detail | II.9 | ||
| 3.1 | Peer Group of Publicly-Traded Thrifts | III.3 | ||
| 3.2 | Balance Sheet Composition and Growth Rates | III.7 | ||
| 3.3 | Income as a % of Average Assets and Yields, Costs, Spreads | III.10 | ||
| 3.4 | Loan Portfolio Composition and Related Information | III.13 | ||
| 3.5 | Credit Risk Measures and Related Information | III.14 | ||
| 3.6 | Interest Rate Risk Measures and Net Interest Income Volatility | III.16 | ||
| 4.1 | Peer Group Market Area Comparative Analysis | IV.6 | ||
| 4.2 | Pricing Characteristics and After-Market Trends | IV.16 | ||
| 4.3 | Public Market Pricing | IV.24 | ||
| RP® Financial, LC. | OVERVIEW AND FINANCIAL ANALYSIS | |
| I. 1 |
I. OVERVIEW AND FINANCIAL ANALYSIS
Introduction
Ocean City Home Bank (the “Bank”), organized in 1887, is a federally chartered stock savings bank which conducts operations through its main office in Ocean City, New Jersey. The Bank serves the southern New Jersey shore communities through a main office and branch office which are situated in Cape May County and six branch offices which are situated in Atlantic County. The Bank’s markets are in the southeastern corner of New Jersey, approximately 65 miles east of Philadelphia and 130 miles south of New York.
Ocean Shore Holding Co. (“OSHC” or the “Company”) was organized on April 22, 1998, concurrent with the Bank’s reorganization from a federally-chartered mutual savings bank into a two-tiered mutual holding company structure. In conjunction with the reorganization, OC Financial, MHC (the “MHC”), was formed and concurrently owns all the capital stock of the Company. No stock was issued publicly pursuant to the reorganization. The Bank transferred $100,000 of retained earnings to the Company and $50,000 of retained earnings to the MHC. At the same time, the Bank converted to a federally-chartered stock savings bank with the Company owning all of its outstanding stock. The Company is a unitary savings and loan holding company and conducts its operations primarily through the Bank.
On December 21, 2004, the Company completed a minority stock issuance, selling a minority ownership position (i.e., 45.7% of the total outstanding shares) to the public while the MHC retained a majority ownership interest (54.3% ownership). Gross proceeds raised in pursuant to the minority stock issuance totaled $38.4 million while additional shares with a value of $1.7 million based on the IPO price of $10.00 per share were contributed to the Ocean City Home Charitable Foundation, Inc. (the “Foundation”) resulting in no cash proceeds for the Company.
The most significant asset of the Company is its equity investment in the Bank; in addition, the Company has extended a loan to the Bank’s employee stock ownership plan (“ESOP”). As of June 30, 2008, the Company had $657.8 million in assets, $413.7 million in deposits and total equity of $63.6 million, or 9.66% of total assets. The Company’s audited financial statements are included by reference as Exhibit I-1. The Bank is a member of the Federal Home Loan Bank (“FHLB”) system, and its deposits are insured up to the regulatory maximums by the Federal Deposit Insurance Corporation (“FDIC”).
| RP® Financial, LC. | OVERVIEW AND FINANCIAL ANALYSIS | |
| I. 2 |
Plan of Conversion and Reorganization
On August 19, 2008, OSHC announced that the Boards of Directors of the MHC, OSHC and the Bank unanimously adopted a Plan of Conversion and Reorganization (the “Plan of Conversion”), pursuant to which OSHC will convert from the two-tier MHC structure to the full stock holding company structure and concurrently conduct a second-step conversion offering (“Second Step Conversion” or “Offering”) that will represent the MHC’s ownership interest in OSHC. As of June 30, 2008, the MHC’s ownership interest in OSHC approximated 57.1%. Pursuant to the plan of conversion, OSHC, which owns 100% of the Bank, will be succeeded by a new federally chartered stock corporation named OSHC Group, Inc. (“OSHC” or the “Company”). The Company will also issue exchange shares of its common stock to the public shareholders pursuant to an exchange ratio that will result in the same 42.9% aggregate ownership percentage as immediately before the Offering.
Purpose of the Reorganization
The Second Step Conversion will increase the capital level to support further expansion, improve the overall competitive position of OSHC in the local market area, enhance profitability and reduce interest rate risk. Importantly, the additional equity will provide a larger capital base for continued growth and diversification, as well as increase the lending capability including the funds available for lending. Future growth opportunities are expected through the current branch network as well as through de novo branching in the regional markets served. Additionally, the Company anticipates that growth opportunities will result from regional bank consolidation in the local market, particularly in the current economic and operating environment, and the resulting fallout of customers who are attracted to OSHC’s customer service and products and services. The MHC structure has limited the opportunity to acquire other institutions – so the Second Step Conversion should facilitate the Company’s ability to pursue such acquisitions through increased capital as well as the ability to use common stock as merger consideration. Further, the Second Step Conversion will increase the public ownership, which is expected to improve the liquidity of the common stock.
The projected use of stock proceeds is highlighted below.
| • | The Company. The Company is expected to retain up to 50% of the net conversion proceeds. At present, Company funds, net of the loan to the ESOP, are expected to be invested initially into high quality investment securities with short- to intermediate-term maturities, generally consistent |
| RP® Financial, LC. | OVERVIEW AND FINANCIAL ANALYSIS | |
| I. 3 |
with the current investment mix. Over time, Company funds are anticipated to be utilized for various corporate purposes, possibly including acquisitions, infusing additional equity into the Bank, repurchases of common stock, and the payment of regular and/or special cash dividends. |
| • | The Bank. The balance of the net offering proceeds will be infused into the Bank. Cash proceeds (i.e., net proceeds less deposits withdrawn to fund stock purchases) infused into the Bank are anticipated to become part of general operating funds, and are expected to initially be invested in short-term investments pending longer term deployment, i.e., funding lending activities, general corporate purposes and/or expansion and diversification. |
The Company expects to continue to pursue a controlled growth strategy, leveraging its strong pro forma capital, growing primarily through the current delivery channels. If appropriate, OSHC may also consider various capital management strategies to assist in the long-run objective of increasing return on equity.
Strategic Overview
Throughout much of its corporate history, the Company’s strategic focus has been that of a community-oriented financial institution with a primary focus on meeting the borrowing, savings and other financial needs of its local customers in Atlantic and Cape May Counties. In this regard, the Company has historically pursued a residential lending strategy for portfolio, with a moderate level of diversification into construction lending and commercial real estate lending. The Company has emphasized high quality and flexible customer service, capitalizing on its local orientation and relatively broad array of products and services.
In the early 1990s, the Company was a relatively small institution with approximately $100 million in total assets and conducted operations through two offices. Subsequently, under the direction of current management, OSHC embarked on a growth and expansion strategy which included: (1) adding six branch offices in the regional area; (2) increasing total assets to more than $650 million as of June 30, 2008. The Company’s growth has been facilitated by the development of targeted niches which have included focusing on residential mortgage lending including jumbo loans and/or loans secured by second homes and investment properties (estimated to approximate 50% of the residential mortgage portfolio), adoption of a sales culture to facilitate growth of lower costing savings and transaction accounts including accounts to commercial customers. The Company has also been successful in implementing a deposit program for local municipalities.
| RP® Financial, LC. | OVERVIEW AND FINANCIAL ANALYSIS | |
| I. 4 |
The Company’s branching strategy commenced in 1994 with the opening of the Ventnor and Linwood offices. While the addition of these two offices substantially bolstered the market presence, they also entailed significant startup costs, thereby impairing the near term earnings position. The reduced earnings coupled with its modest capital surplus, led management to pursue the MHC reorganization for the purpose of issuing debt at the mid-tier level to bolster the Bank’s capital position (the timing of the debt issuance was prior to the completion of the minority stock issuance within the MHC structure in 2004). The additional capital, both through debt issued prior to the minority stock issuance and from the common equity raised through the minority stock issuance in 2004 facilitated the ability to pursue additional branching opportunities – the Egg Harbor Township office opened in 1998, the Absecon office opened in 2002, and the Northfield and Margate branches opened in 2005 and 2006, respectively.
Residential loan growth has been facilitated by the employment of two commissioned loan originators while growth of the commercial loan portfolio has been fostered by the employment of four experienced commercial lenders (including two in executive management) as well as support staff. The majority of the Company’s residential mortgage loans are originated internally by the Company’s commissioned loan officers. As noted above, OSHC has developed a niche in the area of residential mortgage lending including lending on second homes and investment properties in the local market. Moreover, jumbo mortgage lending (i.e., loans above the conforming loan limits) has always been an important element of the Company’s mortgage lending.
The majority of the Company’s permanent residential mortgage volume has been in 15 and 30 year mortgage loans. As a portfolio lender (secondary market sales have been limited), the Company has willingly accepted the interest rate risk related to such loans while managing its interest rate risk exposure through other techniques.
In addition to residential mortgage lending, the Company has sought to diversify the portfolio to including commercial mortgage and non-mortgage loans as well as construction loans. With the increased emphasis on the development of commercial account relationships, OSHC has developed extensive policies and procedures pertaining to credit standards and the administration of commercial accounts. Additionally, the Company has employed a total of four loan officers who have local commercial lending experience to conduct the commercial lending
| RP® Financial, LC. | OVERVIEW AND FINANCIAL ANALYSIS | |
| I. 5 |
operations while also developing the appropriate support functions in the loan underwriting, credit administration and loan servicing functions. Despite the commercial loan growth, residential mortgage loans continue to comprise the largest portion of the loan portfolio at $444.9 million, or 78.4% of total loans, as of June 30, 2008. In addition, the home equity loan portfolio has grown, and such loans totaled $57.1 million, or 10.1% of total loans, at June 30, 2008.
The Company’s interest-earning assets (“IEA”) also consist of interest-earning deposits and short-to-intermediate term investment securities and MBS, the majority of which are currently classified as available for sale (“AFS”). The Company’s general balance sheet objective is to deploy funds primarily into loans and maintain moderate balances of cash and investments, given the higher yields on loans. At the same time, this broad objective has been tempered as the Company has sought to utilize the investment portfolio as a means of shortening the average duration of the asset portfolio given the fixed rate lending emphasis. The liquidity of the investment portfolio has also been a key objective given the high proportion of transaction accounts.
Retail deposits have consistently served as the primary interest-bearing funding source for the Company. The Company has sought to increase the deposit base through management’s efforts to develop a comprehensive sales culture throughout the principal customer contact points of the Company. In this regard, OSHC’s focus has been on developing broad customer relationships emphasizing the value that the Company brings to the customer relationship as a whole. These sales oriented strategies have also been implemented to attract both commercial and consumer account relationships with a focus on building transaction accounts.
The Company’s focus on service and convenience has been reflected in both the renovation of existing branches and ongoing development of new branches. The Company has introduced alternative delivery mechanisms including ATMs, a telephone call center and Internet banking to support the relatively high level of transaction accounts. Partially as a result of the recent checking account growth, transaction and savings accounts currently comprise a larger portion of the Company’s deposit composition than certificate of deposits (“CDs”).
OSHC has sought to establish a niche in marketing transaction accounts to local municipalities and school districts. As of June 30, 2008, the Company had deposit relationships with five municipal governments and thirteen school districts. As of June 30, 2008, municipal
| RP® Financial, LC. | OVERVIEW AND FINANCIAL ANALYSIS | |
| I. 6 |
deposits totaled $56.1 million, equal to 13.6% of total deposits and 42.4% of interest-bearing checking accounts. Management believes that the success of this public unit deposit program is attributable to the high level of service provided, competitive rate structure and lower fee structure.
The Company has typically utilized borrowings in two different respects: (1) as a supplemental funding source to favorably manage funding costs and to manage interest rate risk; and (2) longer-term borrowings to finance growth and diversification as a supplement to funding operations through deposits. Following the Second Step Conversion, the Company believes it will continue to utilize FHLB advances when the “all in” cost of funds compares favorably to deposits.
The Company’s earnings base is largely dependent upon net interest income and operating expense levels, reflecting a traditional operating strategy. In this regard, the Company’s earnings from fiscal 2005 through 2007 were impacted by spread compression, reflecting the impact of Federal Reserve rate hikes which caused a flattening yield curve and rising funding costs for the Company. However, recent rate reductions by the Fed have positively impacted OSHC’s spreads which, coupled with balance sheet growth, has resulted in a favorable spread and overall earnings trend for the last several quarters.
The post-offering business plan of the Company is expected to be similar to the recent strategy with similar products and services. Specifically, the Company will continue to be an independent community-oriented financial institution with a commitment to local real estate and non-mortgage financing with operations funded by retail deposits, borrowings, equity capital and internal cash flows. The Company expects to continue to emphasize permanent residential mortgage lending and, to a lesser extent, commercial real estate and construction lending. Balance sheet growth is expected to be enhanced through the establishment of additional branches in the regional market (two de novo branches are targeted to be established within the next 18 months).
Balance Sheet Trends
Growth Trends
The Company’s strategy of growth and expansion, both through internal growth at existing branches and de novo branching, is evidenced in Table 1.1. Since December 31, 2003,
| RP® Financial, LC. | OVERVIEW AND FINANCIAL ANALYSIS | |
| I. 7 |
Table 1.1
Ocean Shore Holding Co.
Historical Balance Sheets
| As of the Fiscal Year Ended December 31, | As of June 30, 2008 | Compounded Annual Growth Rate | |||||||||||||||||||||||||||||||||||||
| 2003 | 2004 | 2005 | 2006 | 2007 | |||||||||||||||||||||||||||||||||||
| Amount | Pct(1) | Amount | Pct(1) | Amount | Pct(1) | Amount | Pct(1) | Amount | Pct(1) | Amount | Pct(1) | Pct(1) | |||||||||||||||||||||||||||
| ($000) | (%) | ($000) | (%) | ($000) | (%) | ($000) | (%) | ($000) | (%) | ($000) | (%) | (%) | |||||||||||||||||||||||||||
Total Amount of: | |||||||||||||||||||||||||||||||||||||||
Assets | $ | 479,844 | 100.00 | % | $ | 528,444 | 100.00 | % | $ | 543,846 | 100.00 | % | $ | 562,260 | 100.00 | % | $ | 629,523 | 100.00 | % | $ | 657,837 | 100.00 | % | 7.26 | % | |||||||||||||
Securities -HTM | 3,807 | 0.79 | % | 10,544 | 2.00 | % | 9,729 | 1.79 | % | 5,266 | 0.94 | % | 4,657 | 0.74 | % | 4,407 | 0.67 | % | 3.31 | % | |||||||||||||||||||
Securities -AFS | 123,865 | 25.81 | % | 106,259 | 20.11 | % | 84,462 | 15.53 | % | 62,865 | 11.18 | % | 54,259 | 8.62 | % | 39,012 | 5.93 | % | -22.64 | % | |||||||||||||||||||
Loans receivable (net) | 301,778 | 62.89 | % | 340,585 | 64.45 | % | 412,005 | 75.76 | % | 433,342 | 77.07 | % | 528,058 | 83.88 | % | 567,312 | 86.24 | % | 15.06 | % | |||||||||||||||||||
Cash and cash equivalents | 28,759 | 5.99 | % | 47,396 | 8.97 | % | 13,400 | 2.46 | % | 33,357 | 5.93 | % | 9,540 | 1.52 | % | 10,978 | 1.67 | % | -19.27 | % | |||||||||||||||||||
Deposits | 390,274 | 81.33 | % | 415,328 | 78.59 | % | 416,914 | 76.66 | % | 417,024 | 74.17 | % | 415,231 | 65.96 | % | 413,735 | 62.89 | % | 1.31 | % | |||||||||||||||||||
FHLB advances | 10,000 | 2.08 | % | 10,000 | 1.89 | % | 27,000 | 4.96 | % | 54,000 | 9.60 | % | 120,230 | 19.10 | % | 149,190 | 22.68 | % | 82.32 | % | |||||||||||||||||||
Subordinated debt | 15,464 | 3.22 | % | 15,464 | 2.93 | % | 15,464 | 2.84 | % | 15,464 | 2.75 | % | 15,464 | 2.46 | % | 15,464 | 2.35 | % | 0.00 | % | |||||||||||||||||||
Other borrowings | 35,504 | 7.40 | % | 22,840 | 4.32 | % | 18,460 | 3.39 | % | 7,090 | 1.26 | % | 8,000 | 1.27 | % | 7,250 | 1.10 | % | -29.74 | % | |||||||||||||||||||
Equity | 23,975 | 5.00 | % | 59,795 | 11.32 | % | 60,568 | 11.14 | % | 62,551 | 11.12 | % | 63,047 | 10.02 | % | 63,551 | 9.66 | % | 24.19 | % | |||||||||||||||||||
Loans/Deposits | 77.32 | % | 82.00 | % | 98.82 | % | 103.91 | % | 127.17 | % | 137.12 | % | |||||||||||||||||||||||||||
Offices Open | 6 | 6 | 6 | 7 | 8 | 8 | |||||||||||||||||||||||||||||||||
| (1) | Percent of assets except as noted. |
Source: Ocean Shore Holding Co.’s prospectus, SNL Financial, and RP® Financial, LC. calculations.
| RP® Financial, LC. | OVERVIEW AND FINANCIAL ANALYSIS | |
| I. 8 |
total assets increased at a 7.3% compounded annual rate, from $479.8 million to $657.8 million currently. Loans have realized a faster growth rate than total assets and thus increased in proportion to total assets, from 62.9% at December 31, 2003, to 86.2% at June 30, 2008, which limited the net interest margin compression during the challenging yield curve environment (i.e., modestly sloped to flat or slightly inverted yield curve) which prevailed during fiscal 2006 and 2007. Specifically, loans have increased at a 15.1% rate over the period from the end of fiscal 2003 through June 30, 2008, while investment securities diminished over the corresponding timeframe, both in dollar terms and in proportion to total assets.
The Company’s assets are funded through a combination of deposits, borrowings and retained earnings. Deposits have always comprised the majority of funding liabilities but growth has been limited over the last several years as asset growth has largely been funded by borrowings. Specifically, since the end of fiscal 2003, the balance of deposits has increased by $23.5 million to equal $413.7 million, and thus reflects a compounded annual growth rate of only 1.3%. At the same time, borrowings in the form of FHLB advances have increased from $10.0 million as of the end of fiscal 2003, to $149.2 million as of June 30, 2008, which reflects an 82.3% compounded annual growth rate. The balance of subordinated debt has remained unchanged since 2003, while reverse repurchase agreements have diminished.
Annual equity growth equaled 24.2% since the end of fiscal 2003, with the expanded equity base primarily reflecting the impact of retained earnings over the period and the minority stock issuance completed in fiscal 2004. Since the end of fiscal 2004, equity has increased from $59.8 million to $63.6 million which is attributable to retained earnings exceeding dividend payments and stock repurchases for the period. Modest growth of capital since completion of the minority stock issuance coupled with balance sheet growth achieved over the period resulted in a diminishing capital ratio since 2004. Specifically, the equity-to-assets ratio declined from 11.3% as of the end of fiscal 2004 (just after the 2004 minority stock issuance) to 9.7% as of June 30, 2008. Going forward, the post-offering equity growth rate is expected to be impacted by a number of factors including the higher level of capitalization, the reinvestment and leveraging of the offering proceeds, the expense of the stock benefit plans and the potential impact of dividends and stock repurchases.
Loans Receivable
Loans receivable totaled $567.3 million, or 86.2% of total assets, as of June 30, 2008, and reflects steady growth since year end 2003. Permanent 1-4 family mortgage loans
| RP® Financial, LC. | OVERVIEW AND FINANCIAL ANALYSIS | |
| I. 9 |
comprise the largest segment of the loan portfolio, equal to 78.4% of total loans. The residential mortgage loan portfolio consists primarily of fixed rate mortgage loans, which comprise the substantial majority of residential mortgage loans originated. The Company is a portfolio lender and typically retains the longer term fixed rate loans it originates; secondary market loan sales have been limited.
Notwithstanding the recent efforts to expand commercial lending, OSHC remains primarily a residential mortgage lender. Overall, mortgage loans (including loans secured by 1-4 family properties, multi-family and commercial mortgages and properties under construction) comprised 86.9% of total loans, while home equity loans comprised an additional 10.1% of total loans. Commercial and industrial loans (“C&I loans”) currently approximate 2.9% of total loans while consumer loans (excluding home equity loans) total less than 1% of total loans. Loan portfolio diversification to date has primarily been in commercial real estate lending.
Cash, Investments and Mortgage-Backed Securities
The intent of the Company’s investment policy is to provide adequate liquidity, to generate a favorable return on excess investable funds and to support the established credit and interest rate risk objectives. The ratio of cash and investments including MBS has fluctuated based primarily on loan demand and cash inflows from deposits and borrowings and has declined since the end of fiscal 2003, from 32.6% of assets to 8.3% as of June 30, 2008. The comparatively modest level of cash and investments currently is reflective of the Company’s general preference to invest in whole loans coupled with recent loan growth which has resulted in the redeployment of funds from investments into loans.
The Company’s investment securities and MBS equaled $43.4 million, or 6.6% of total assets, as of June 30, 2008, while cash and interest bearing deposits and term deposits totaled $11.0 million, or 1.7% of assets. As of June 30, 2008, the cash and investments portfolio consisted of cash, interest-earning deposits in other financial institutions, mortgage-backed securities issued by Ginnie Mae, Fannie Mae or Freddie Mac, U.S. government agency obligations and other high quality investments, including investment grade securities issued by corporations and municipalities. Additionally, the Company maintains permissible equity investments such as FHLB stock with a fair value of $8.0 million as of June 30, 2008. The Company’s investment securities are classified both as held-to-maturity (“HTM”) and available for sale (“AFS”), with the HTM portfolio primarily comprised of MBS (see Exhibit I-3 for the investment portfolio composition).
| RP® Financial, LC. | OVERVIEW AND FINANCIAL ANALYSIS | |
| I. 10 |
No major changes to the composition and practices with respect to the management of the investment portfolio are anticipated over the near term, except that it is expected that the Company will generally classify securities as AFS at the time of purchase (including MBS). The level of cash and investments is anticipated to increase initially following the Second Step Conversion, pending gradual redeployment into higher yielding loans.
Bank Owned Life Insurance
As of June 30, 2008, the balance of bank owned life insurance (“BOLI”) totaled $10.6 million,which reflects growth since the end of fiscal 2003 primarily owing to increases in the cash surrender value of the policies. The balance of the BOLI reflects the value of life insurance contracts on selected members of the Bank’s management and has been purchased with the intent to offset various benefit program expenses on a tax advantaged basis. The increase in the cash surrender value of the BOLI is recognized as an addition to other non-interest income on an annual basis.
Funding Structure
Since fiscal year-end 2003, deposits have increased at a 1.31% compounded annual rate. Deposit growth has been limited in recent periods owing to a conscious decision by the Company to limit deposits costs in a challenging earnings and spread environment which prevailed through fiscal 2007, preferring to rely primary on FHLB advances to fund asset growth achieved since fiscal 2003. The limited deposit growth which has been realized since fiscal 2005 has primarily been realized in the CD portfolio, which increased from $130.5 million or 31.3% of deposits as of the end of fiscal 2005, to 40.5% of deposits as of June 30, 2008.
Notwithstanding the recent growth in CDs in proportion to total deposits, checking and savings accounts continue to comprise the majority of the Company’s deposit base and reflect the success of marketing initiatives designed to attract savings and transaction accounts from local retail and business customers. Moreover, OSHC’s has enjoyed success in attracting business checking and sweep accounts and demand deposits for municipalities pursuant to a marketing initiative which commenced at the beginning of the decade. The municipal deposits totaled $56.1 million as of June 30, 2008, while municipal deposit balances outstanding are typically in the range of $50 million to $90 million and the Company has depository relationships with various municipal entities in southern New Jersey.
| RP® Financial, LC. | OVERVIEW AND FINANCIAL ANALYSIS | |
| I. 11 |
The Company typically utilizes borrowings: (1) when such funds are priced attractively relative to deposits; (2) to lengthen the duration of liabilities; (3) to enhance earnings when attractive revenue enhancement opportunities arise; and (4) to generate additional liquid funds, if required. Borrowed funds, primarily consisting of FHLB advances have been the primary source of funds utilized to fund asset growth
A portion of the funds borrowed by the Company in the form of subordinated debt was infused into the Company to bolster regulatory capital to facilitate growth and branching initiatives. Subordinated debt totaled $15.5 million, equal to 2.4% of total assets as of June 30, 2008.
Equity
As a mutual institution, the Company’s equity was primarily impacted by the level of earnings. With the completion of the minority stock issuance in December 2004, OSHC’s equity was more than doubled to $59.8 million, or 11.3% of assets as of December 31, 2004. Since fiscal year end 2004 of the limited increase in retained earnings has reflected the Company’s capital strategies, including the payment of shareholder dividends and share repurchases. As a result, the Company’s equity has only grown to $63.6 million, as of June 30, 2008, reflecting a 1.8% compounded annual rate of growth since completion of the minority stock issuance. However, the equity ratio has declined since fiscal 2004 reflecting the impact of asset growth. The Bank maintained strong surpluses relative to its regulatory capital requirements at June 30, 2008, and thus qualified as a “well capitalized” institution. The offering proceeds will serve to further strengthen the Company’s regulatory capital position and support further growth. As discussed previously, the post-offering equity growth rate is expected to be impacted by a number of factors including the higher level of capitalization, the reinvestment of the offering proceeds, the expense of the stock benefit plans and the potential impact of dividends and stock repurchases.
Income and Expense Trends
Table 1.2 shows the Company’s historical income statements for the past five years and for the 12 months ended June 30, 2008. The Company’s core earnings were relatively stable from fiscal 2003 to fiscal 2004 when the Company was a mutual institution but subsequently increased in fiscal 2005 and 2006 as the benefit of reinvestment of the net conversion proceeds
| RP® Financial, LC. | OVERVIEW AND FINANCIAL ANALYSIS | |
| I. 12 |
Table 1.2
Ocean Shore Holding Co.
Historical Income Statements
| As of the Fiscal Year Ended December 31, | ||||||||||||||||||||||||||||||||||||||||||
| 2003 | 2004 | 2005 | 2006 | 2007 | For the 12 Months Ended June 30, 2008 | |||||||||||||||||||||||||||||||||||||
| Amount | Pct(1) | Amount | Pct(1) | Amount | Pct(1) | Amount | Pct(1) | Amount | Pct(1) | Amount | Pct(1) | |||||||||||||||||||||||||||||||
| ($000) | (%) | ($000) | (%) | ($000) | (%) | ($000) | (%) | ($000) | (%) | ($000) | (%) | |||||||||||||||||||||||||||||||
Interest Income | $ | 22,516 | 4.81 | % | $ | 22,722 | 4.52 | % | $ | 26,272 | 4.87 | % | $ | 29,839 | 5.31 | % | $ | 32,619 | 5.49 | % | $ | 34,765 | 5.72 | % | ||||||||||||||||||
Interest Expense | (10,015 | ) | -2.14 | % | (9,398 | ) | -1.87 | % | (11,017 | ) | -2.04 | % | (14,620 | ) | -2.60 | % | (17,481 | ) | -2.94 | % | (17,984 | ) | -2.96 | % | ||||||||||||||||||
Net Interest Income | $ | 12,501 | 2.67 | % | $ | 13,324 | 2.65 | % | $ | 15,255 | 2.83 | % | $ | 15,219 | 2.71 | % | $ | 15,138 | 2.55 | % | $ | 16,781 | 2.76 | % | ||||||||||||||||||
Provision for Loan Losses | (360 | ) | -0.08 | % | (360 | ) | -0.07 | % | (300 | ) | -0.06 | % | (300 | ) | -0.05 | % | (261 | ) | -0.04 | % | (270 | ) | -0.04 | % | ||||||||||||||||||
Net Interest Income after Provisions | $ | 12,141 | 2.59 | % | $ | 12,964 | 2.58 | % | $ | 14,955 | 2.77 | % | $ | 14,919 | 2.65 | % | $ | 14,877 | 2.51 | % | $ | 16,511 | 2.72 | % | ||||||||||||||||||
Other Operating Income | 2,008 | 0.43 | % | 2,389 | 0.48 | % | 2,316 | 0.43 | % | 2,332 | 0.41 | % | 2,622 | 0.44 | % | 2,727 | 0.45 | % | ||||||||||||||||||||||||
Operating Expense | (10,002 | ) | -2.14 | % | (11,002 | ) | -2.19 | % | (12,201 | ) | -2.26 | % | (12,806 | ) | -2.28 | % | (13,069 | ) | -2.20 | % | (13,318 | ) | -2.19 | % | ||||||||||||||||||
Net Operating Income | $ | 4,147 | 0.89 | % | $ | 4,351 | 0.87 | % | $ | 5,070 | 0.94 | % | $ | 4,445 | 0.79 | % | $ | 4,430 | 0.75 | % | $ | 5,920 | 0.97 | % | ||||||||||||||||||
Net Gain(Loss) on Sale of Securities | — | 0.00 | % | — | 0.00 | % | — | 0.00 | % | — | 0.00 | % | — | 0.00 | % | (362 | ) | -0.06 | % | |||||||||||||||||||||||
Expense of Charitable Foundation | — | 0.00 | % | (2,000 | ) | -0.40 | % | — | 0.00 | % | — | 0.00 | % | — | 0.00 | % | — | 0.00 | % | |||||||||||||||||||||||
Net Gain(Loss) on Sale of Loans | 118 | 0.03 | % | — | 0.00 | % | — | 0.00 | % | — | 0.00 | % | — | 0.00 | % | — | 0.00 | % | ||||||||||||||||||||||||
Total Non-Operating Income/(Expense) | $ | 118 | 0.03 | % | $ | (2,000 | ) | -0.40 | % | $ | — | 0.00 | % | $ | — | 0.00 | % | $ | — | 0.00 | % | $ | (362 | ) | -0.06 | % | ||||||||||||||||
Net Income Before Tax | $ | 4,265 | 0.91 | % | $ | 2,351 | 0.47 | % | $ | 5,070 | 0.94 | % | $ | 4,445 | 0.79 | % | $ | 4,430 | 0.75 | % | $ | 5,557 | 0.91 | % | ||||||||||||||||||
Income Taxes | (1,551 | ) | -0.33 | % | (1,045 | ) | -0.21 | % | (1,994 | ) | -0.37 | % | (1,296 | ) | -0.23 | % | (1,639 | ) | -0.28 | % | (2,068 | ) | -0.34 | % | ||||||||||||||||||
Net Income (Loss) Before Extraord. Items | $ | 2,714 | 0.58 | % | $ | 1,306 | 0.26 | % | $ | 3,076 | 0.57 | % | $ | 3,149 | 0.56 | % | $ | 2,791 | 0.47 | % | $ | 3,489 | 0.57 | % | ||||||||||||||||||
Estimated Core Net Income | ||||||||||||||||||||||||||||||||||||||||||
Net Income | $ | 2,714 | 0.58 | % | $ | 1,306 | 0.26 | % | $ | 3,076 | 0.57 | % | $ | 3,149 | 0.56 | % | $ | 2,791 | 0.47 | % | $ | 3,489 | 0.57 | % | ||||||||||||||||||
Addback(Deduct): Non-Recurring (Inc)/Exp | (118 | ) | -0.03 | % | 2,000 | 0.40 | % | — | 0.00 | % | — | 0.00 | % | — | 0.00 | % | 362 | 0.06 | % | |||||||||||||||||||||||
Tax Effect (2) | 47 | 0.01 | % | (799 | ) | -0.16 | % | — | 0.00 | % | — | 0.00 | % | — | 0.00 | % | (145 | ) | -0.02 | % | ||||||||||||||||||||||
Estimated Core Net Income | $ | 2,643 | 0.56 | % | $ | 2,507 | 0.50 | % | $ | 3,076 | 0.57 | % | $ | 3,149 | 0.56 | % | $ | 2,791 | 0.47 | % | $ | 3,707 | 0.61 | % | ||||||||||||||||||
Memo: | ||||||||||||||||||||||||||||||||||||||||||
Expense Coverage Ratio (3) | 124.99 | % | 121.11 | % | 125.03 | % | 118.84 | % | 115.83 | % | 126.00 | % | ||||||||||||||||||||||||||||||
Efficiency Ratio (4) | 68.94 | % | 70.02 | % | 69.44 | % | 72.96 | % | 73.59 | % | 68.27 | % | ||||||||||||||||||||||||||||||
Effective Tax Rate | 36.37 | % | 44.45 | % | 39.33 | % | 29.16 | % | 37.00 | % | 37.21 | % | ||||||||||||||||||||||||||||||
| (1) | Reflects income and expense as a percent of average assets. |
| (2) | Assumes a 39.94% effective tax rate for federal & state income taxes. |
| (3) | Net interest income divided by operating expenses. |
| (4) | Operating expenses as a percent of the sum of net interest income and other operating income (excluding gains on sale). |
Source: Ocean Shore Holding Co.’s prospectus, SNL Financial, and RP® Financial, LC. calculations.
| RP® Financial, LC. | OVERVIEW AND FINANCIAL ANALYSIS | |
| I. 13 |
and balance sheet growth were realized into earnings. Earnings diminished in fiscal 2007 relative to the prior two fiscal years as net interest income diminished modest due to spread compression and as operating costs continued to increase. Earnings have been increasing in the most recent fiscal year to equal $3.5 million, or 0.56% of average assets, for the twelve months ended June 30, 2008, as reversion to a positively sloped yield curve environment has improved the Company’s interest rate spreads. These and other trends with respect to OSHC’s income and expenses will be discussed in the balance of this section.
Net Interest Income
Net interest income has grown over the period reflected in Table 1.2 primarily due to balance sheet growth and an increase in the proportion of higher yielding loans reflecting the redeployment of funds out of the cash and investment portfolio (the investment portfolio has been diminishing in recent periods). Specifically, net interest income increased from $12.5 million in fiscal 2003 to $16.8 million for the 12 months ended June 30, 2008. However, the ratio of net interest income to average has remained fluctuated modestly over the corresponding time frame, increasing to a peak level of 2.83% of average assets before diminishing to 2.55% of average assets in fiscal 2007. Net interest income increased to $16.8 million, or 2.76% of average assets for the twelve months ended June 30, 2008.
Spread compression was a key factor contributing to the flat level of net interest income experienced over the fiscal 2005 to 2007 periods while balance sheet growth prevented the level of net interest income from declining significantly. In this regard, the Federal Reserve increased the targeted federal funds rate to 5.25% through June 2006 and maintained this level for over a year through September 2007 leading to a flat to mildly inverted yield curve which adversely impacted OSHC’s interest rate spreads. Subsequent reductions in the targeted federal funds rate by the Federal Reserve have favorably impacted the Company’s yield-cost spreads.
Specifically, the Company’s interest rate spread decreased from 2.75% in fiscal 2005, to 2.40% in fiscal 2007 while increasing to 2.59% over the first six months of fiscal 2008 (see Exhibit I-4). The initial reinvestment of the offering proceeds should increase net interest income as the funds are reinvested, with longer-term earnings benefits realized through leveraging of the proceeds.
| RP® Financial, LC. | OVERVIEW AND FINANCIAL ANALYSIS | |
| I. 14 |
Loan Loss Provisions
Provisions for loan losses have typically been limited reflecting the Company’s relatively strong asset quality historically and the secured nature of the loan portfolio; the majority of the loan portfolio is secured by real estate collateral in the Company’s relatively strong local market area. Going forward, the Company will continue to evaluate the adequacy of the level of general valuation allowances (“GVAs”) on a regular basis, and establish additional loan loss provisions in accordance with the Company’s asset classification and loss reserve policies.
For the 12 months ended June 30, 2008, loan loss provisions totaled $270,000, or 0.04% of average assets, which reflects modest growth in the loan portfolio rather than specific loan problems. The level of loan loss provisions also limited chargeoffs; loan chargeoffs equaled $4,000 in fiscal 2007 while there were no chargeoffs for the six months ended June 30, 2008.
Non-Interest Income
Other income has shown an upward trend in dollar terms and as a percent of average assets since fiscal 2003, from $2.0 million (0.43% of average assets) to $2.7 million (0.45% of average assets) for the 12 months ended June 30, 2008, reflecting OSHC’s balance sheet growth, expansion of overall business volumes and continued growth of fee generating products such as commercial lending and transaction accounts. The bulk of OSHC’s fee income is comprised of fees related to its depository activities, lending, and mortgage servicing. However, the Company has also diversified into non-traditional product lines (primarily brokerage services), which provide a modest amount fee income. Additionally, non-interest income was further enhanced by the purchase of BOLI, wherein the income from the increase in the cash surrender value of the policies is reflected as non-interest income. Growth in the level of non-interest operating income is expected to be gradual in future periods.
Operating Expenses
The Company’s operating expenses have increased in recent years due to asset growth, increased lending activities in both the residential and commercial portfolios, de novo branching and revenue diversification strategies. Specifically, cost increases reflect increased business volumes facilitated by the employment of seasoned commercial lenders and support
| RP® Financial, LC. | OVERVIEW AND FINANCIAL ANALYSIS | |
| I. 15 |
staff and the opening of four full service branch offices since 1998. While operating expenses have experienced a pronounced increase, commensurate asset growth resulted in limited growth of the ratio of operating expenses in relation to average assets. Specifically, fiscal 2003 operating expenses approximated $10.0 million, or 2.14% of average assets, while operating expenses approximated $13.3 million, or 2.19% of average assets, for the most recent 12 months period ending June 30, 2008.
Operating expenses are expected to increase on a post-offering basis as a result of the expense of the additional stock-related benefit plans, as well as the planned branching and growth initiatives which are currently underway. At the same time, continued balance sheet growth and reinvestment of the offering proceeds should largely offset the anticipated expense increase.
Non-Operating Income/Expense
Non-operating income and expenses have typically had a limited impact on earnings over the last several years, and have primarily consisted of gains on the sale of loans and investments. The most significant non-operating item was the expense of a charitable foundation established by the Company in connection with the minority stock issuance in 2004, which totaled $2.0 million. For the twelve months ended June 30, 2008, OSHC reported losses on securities totaling $362,000 (0.06% of average assets) reflecting a valuation impairment charge ($312,000) and a loss on the sale of securities ($50,000).
Taxes
The Company’s average tax rate has ranged between 29.16% and 44.45% over the last five fiscal years and equaled 37.21% for the 12 months ended June 30, 2008. The Company is evaluating the merits of establishing a special purpose investment subsidiary for the purpose of minimizing its state tax liability, which approximates 9.0% of pre-tax income. If the Company pursues this strategy, the Company’s marginal tax rate on taxable income may be reduced from approximately 40%, to as low as 37%, which would reflect its marginal federal corporate tax rate.
| RP® Financial, LC. | OVERVIEW AND FINANCIAL ANALYSIS | |
| I. 16 |
Efficiency Ratio
The Company’s efficiency ratio fluctuated in a narrow range from 68.9% to 70.0% over the fiscal 2003 to 2005 period, while subsequently increasing (i.e., becoming less favorable) through fiscal 2007 to a level of 73.59%. The increasing trend during the fiscal 2005 to 2007 periods was consistent with the trend for core earnings over the period which were diminishing. The efficiency ratio diminished to 68.27% for the twelve months ended June 30, 2008, primarily reflecting the impact of the increasing level of net interest income. On a post-offering basis, the efficiency ratio may show some improvement from the benefit of reinvesting the proceeds from the Offering. However, a portion of the benefit is expected to be offset by the increased expense of the stock benefit plans.
Interest Rate Risk Management
The primary aspects of the Company’s interest rate risk management include:
| • | Diversifying portfolio loans into other types of shorter-term or adjustable rate lending, including commercial and construction lending; |
| • | Maintaining an investment portfolio, comprised of high quality, liquid securities and maintaining an ample balance of securities classified as available for sale; |
| • | Promoting transaction accounts (including municipal deposits) and, when appropriate, longer term CDs; |
| • | Utilizing longer-term borrowing when such funds are attractively priced relative to deposits and prevailing reinvestment opportunities; |
| • | Maintaining a strong capital level; |
| • | Increasing non-interest income; |
| • | Limiting investment in fixed assets and other non-earnings assets; and |
| • | Potentially selling a portion of the fixed rate mortgage loans originated based on risk and profitability considerations. |
The rate shock analysis as of June 30, 2008 (see Exhibit I-5) as prepared by OTS for the Company, reflects a liability sensitive position with the net portfolio value (“NPV”) declining by a 344 basis points pursuant to a positive 200 basis point instantaneous and permanent rate shock, resulting in a post-shock NPV ratio equal to 7.32%. The post-shock NPV ratio for the Company on a consolidated basis is not modeled but may likely be lower given its more leveraged structure on a reported basis. However, in addition to modeling the NPV ratio, the Company also projects the potential changes to its net interest income (“NII”) for a 12 and 24
| RP® Financial, LC. | OVERVIEW AND FINANCIAL ANALYSIS | |
| I. 17 |
month period under rising and falling interest rate scenarios. Pursuant to a positive 200 basis point instantaneous and permanent rate shock, the Company’s net interest income is projected to decrease by less than 7.2% within a 12 month period and by 8.0% over a 24 month period relative to the base case levels, providing evidence of a liability sensitive position over the short term.
Overall, the data indicates mixed that rising rates would have an adverse impact over the short term (i.e., over the next 24 month period). At the same time, there are numerous limitations inherent in such analyses such as the credit risk of Company’s loans pursuant to changing interest rates. Additionally, such analyses do not measure the impact of changing spread relationships as interest rates among various asset and liability accounts rarely move in tandem.
One factor impacting the Company’s interest rate risk which is particularly difficult to quantify is the degree to which deposits will reprice in a response to a change in interest rates. Several factors potentially make the Company’s deposit costs somewhat more volatile than many similar institutions. Specifically, the Company prices its deposits in the upper end of the competitive range which may result in a more rate sensitive depositor base. Additionally, the approximately $56.1 million of municipal transaction accounts as of June 30, 2008, carry rates which are tied to the 91 Day T-bill rate, in effect making these accounts highly sensitive to changes in short term money market rates.
Lending Activities and Strategy
The Company’s lending activities have been focused primarily on 1-4 family permanent mortgage lending. Lending diversification has largely included home equity loans, and to a lesser extent, loans secured by commercial real estate and multi-family loans, construction loans, and consumer loans. Details regarding the Company’s loan portfolio composition and characteristics are included in Exhibits I-6 and I-7. As of June 30, 2008, permanent first mortgage loans secured by residential properties totaled $444.9 million, equal to 78.4% of total loans, while home equity loans totaled $57.1 million, or 10.1% of loans. Commercial real estate and multi-family loans together approximated 6.6% of total loans; the remaining balance was comprised of construction loans and non-mortgage commercial and industrial (“C&I”) loans and various types of consumer credit.
| RP® Financial, LC. | OVERVIEW AND FINANCIAL ANALYSIS | |
| I. 18 |
Residential Lending
As of June 30, 2008, residential mortgage loans equaled $444.9 million, or 78.5% of total loans, the majority of which were fixed rate mortgages. Adjustable rate mortgage (“ARM”) loans approximated $55.8 million as of June 30, 2008 (including hybrid loans). Although the Company originates both fixed rate and adjustable rate 1-4 family loans, market demand is dominated by fixed rate loans. While the Company’s fixed rate loans are offered with a wide range of terms, including 10, 15, 20, 25 and 30 years, the bulk of the recent origination activity has consisted of 15 and 30 year loans.
The majority of the 1-4 family residential mortgage loans conform to standards set by either Freddie Mac or Fannie Mae. Most non-conforming residential loans are non-conforming as to the loan amount (i.e., jumbo loans) or due to the characteristics of the property, while otherwise meeting the agency credit criteria. The Company originates 1-4 family loans up to a loan-to-value (“LTV”) ratio of 95%, with private mortgage insurance (“PMI”) being required for loans in excess of a 80% LTV ratio. The majority of the Company’s construction loan portfolio is secured by residential properties. The substantial portion of 1-4 family mortgage loans have been originated by the Company and are secured by residences in the local market.
As a result of the Company’s market presence in the southern New Jersey shore area, the residential mortgage portfolio has a relatively high proportion of mortgage loans secured by second homes or by investment properties (i.e., seasonal beach rental properties). In this regard, management estimates that approximately 50% the residential mortgage portfolio is comprised of loans secured by the borrower’s primary residence, while the balance is secured by either second homes or rental properties, thus raising the risk profile of such loans.
The Company’s home equity loans including fixed rate amortizing term loans (“HELs”) as well as variable rate lines of credit (“HELOCs”). Such loans typically have shorter maturities and higher interest rates than traditional 1-4 family lending. Home equity loans approximated $57.1 million as of June 30, 2008. When combined with the first mortgage loan, the Company will make home equity loans up to a 90% LTV.
Multi-Family and Commercial Mortgage Lending
Multi-family and commercial mortgage lending has been an area of portfolio diversification for the Company. Such loans are typically secured by properties in southern New Jersey and are generally originated by the Company but may include participation interests
| RP® Financial, LC. | OVERVIEW AND FINANCIAL ANALYSIS | |
| I. 19 |
purchased from other local lenders (including loans which are for low-to-moderate income housing). As of June 30, 2008, multi-family and commercial mortgage loans equaled $37.3 million (6.6% of loans).
Multi-family and commercial mortgage loans are typically offered with fixed rates of interest for the first five years of the loan, which are then subject to call provision or rate adjustment. Such loans typically possess terms ranging from one to five years, with amortization periods of five to 20 years, and LTV ratios of up to 80%, and target a debt-coverage ratio of at least 1.2 times. Multi-family and commercial real estate loans are secured by office buildings, retail and industrial use buildings, apartments and other structures such as strip shopping centers, retail shops and various other properties. Most income producing property loans originated by the Company are for the purpose of financing existing structures rather than new construction.
Construction Loans
Construction lending has been relatively modest overall in recent years as reflected in the construction loan balance of $10.8 million, equal to 1.9% of total loans. The Company originates residential and, to a lesser extent, commercial construction loans. Such lending shortens the average duration of assets and support asset yields. The Company generally limits such loans to known builders and developers with established lending relationships with the Company. The majority of the Company’s construction lending is in Atlantic and Cape May Counties. Construction loans generally have variable rates of interest, terms of up to 2 years (but most typically 12 months) and LTV ratios up to 90% for a residential property and 80% for a commercial property.
Non-Mortgage Lending
The Company’s efforts to increase commercial lending have primarily centered on the development of real estate secured relationships, as the balance of non-mortgage C&I loans are less than one-half the balance of the mortgage secured commercial and multi-family mortgage loan portfolio. As of June 30, 2008, C&I loans totaled $16.2 million, or 2.9% of total loans. The Company offers commercial loans to sole proprietorships, professional partnerships and various other small businesses. The types of commercial loans offered include lines of credit and business term loans. Most line of credit and business term loans are secured by real estate and other assets such as inventory or accounts receivable. The Company also offers time notes, letters of credit and loans guaranteed by the Small Business Administration.
| RP® Financial, LC. | OVERVIEW AND FINANCIAL ANALYSIS | |
| I. 20 |
Consumer loans are generally offered to provide a full line of loan products to customers and typically include student loans, loans on deposits, auto loans, and unsecured personal loans. As of June 30, 2008, consumer loans excluding home equity loans totaled $820,000 million, equal to 0.1% of total loans.
Loan Originations, Purchases and Sales
Exhibit I-8 provides a historical summary of the Company’s lending activities. Consistent with its strategy, 1-4 family permanent mortgage and home equity lending comprised the substantial majority of loan originations over this time frame. Specifically, during fiscal 2007, permanent 1-4 family mortgage loan originations totaled $112.0 million (69.3% of total originations); home equity loan originations, which comprised the substantial majority of consumer loan originations, totaled an additional $27.9 million (17.3% of total originations). Originations of 1-4 family loans increased notably in fiscal 2007 (from $56.2 million in fiscal 2006) reflecting a favorable rate environment, more limited competition, and favorable growth trends locally, and the trend to increasing origination volumes has continued into fiscal 2008.
As reflected in Exhibit I-8, loan purchases and sales have been limited, as the Company is primarily a portfolio lender. Purchases totaled $12.7 million in fiscal 2007, but equaled only $2.3 million for the first six months of fiscal 2008. The last loan sale occurred in fiscal 2003 and totaled $5.1 million.
Asset Quality
The Company’s asset quality has historically been strong and the level of non-performing assets (“NPAs”) is low in relation to industry averages but has been trending upward in recent periods reflecting weakness in the local real estate market. As reflected in Exhibit I-9, the NPA balance was $1.9 million, equal to 0.29% total assets. The ratio of allowances to total loans equaled 0.44% while reserve coverage in relation to NPAs was 129.1% (see Exhibit I-10).
The Company has established detailed asset classification policies and procedures which are consistent with regulatory guidelines. Detailed asset classifications are reviewed monthly by senior management and the Board. Additionally, the Company performs a review of major loans (i.e., balances in excess of $1 million) at least annually while also performing
| RP® Financial, LC. | OVERVIEW AND FINANCIAL ANALYSIS | |
| I. 21 |
reviews of randomly selected homogenous loans. Pursuant to these procedures, when needed, the Company establishes additional valuation allowances to cover anticipated losses in classified or non-classified assets. Such reserve adequacy reviews are conducted by management on at least a quarterly basis.
Funding Composition and Strategy
Deposits have consistently been the Company’s primary source of funds. As of June 30, 2008, deposits totaled $413.7 million, which reflects a modest 1.3% compounded annual growth since the end of fiscal 2003. As previously discussed, the Company has consciously limited its offered deposit rates in recent periods owing to a challenging earnings and spread environment. In view of targeted loan and asset growth, OSHC has preferred to fund asset growth primarily through FHLB advances, which have increased by $139.2 million since the end of fiscal 2003, which reflects an 82.3% compounded annual rate of growth.
Deposit solicitation efforts for the Company have been facilitated by the opening of four branch offices since 1998, the development of a sales oriented call program, and the implementation of a strategy to solicit transaction accounts to local municipalities and school districts. Management believes that the Company’s deposit pricing places the Company in the upper end of the range of the local competition.
Lower costing savings and transaction accounts totaling $246.1 million comprised approximately 59.5% of the Company’s deposits at June 30, 2008 (see Exhibit I-11). The proportion of savings and transaction accounts reflects a modest decrease since fiscal 2005 both as a result of the level of competition locally and owing to increasing short term interest rates since 2005, which increased the relative attractiveness of CDs for many deposit customers. The balance of the deposit base is comprised of CDs ($167.6 million equal to 40.5% of total deposits), the majority of which have remaining maturities of one year or less. As of June 30, 2008, CDs with balances equal to or in excess of $100,000 equaled $56.9 million.
As of June 30, 2008, borrowed funds consisted of subordinated debt ($15.5 million), FHLB advances ($149.2 million) and other borrowed funds ($7.3 million), primarily consisting of variable rate or short term repos. As previously discussed, the subordinated debt was issued by the Company to provide additional capital for the Bank, and to provide investment income at the holding company level through reinvestment into MBS. The Repos have generally been employed to provide short term liquid funds for reinvestment into securities at a positive spread.
| RP® Financial, LC. | OVERVIEW AND FINANCIAL ANALYSIS | |
| I. 22 |
The FHLB advances in the Company’s portfolio generally consist of fixed rate fixed term advances (though many are callable) obtained with objective of extending the duration of liabilities so as to minimize the Company’s interest rate risk exposure.
Subsidiary
The Company has one subsidiary, Seashore Financial Services, LLC., which is primarily involved in the sale of non-deposit investment and insurance products.
Legal Proceedings
Other than the routine legal proceedings that occur in the Company’s ordinary course of business, the Company is not involved in litigation which is expected to have a material impact on the Company’s financial condition or operations.
| RP® Financial, LC. | MARKET AREA | |
| II.1 |
II. MARKET AREA
Introduction
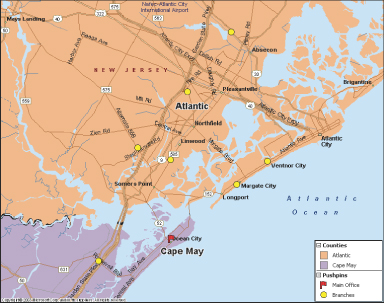
Established in 1887, the Bank has always been operated pursuant to a strategy of strong community service, which it continued after organizing into OSHC, and its dedication to being a community-oriented financial institution has supported customer loyalty and recent growth trends. OSHC is headquartered in Ocean City, New Jersey, and serves the southern New Jersey shore communities through a total of eight full service branches. A total of six branches are located in Atlantic County while two branches are situated in Cape May County. The Company’s markets are in the southeastern corner of New Jersey, approximately 65 miles east of Philadelphia and 130 miles south of New York.
The Company will continue to consider growth through the acquisition of branches or whole institutions if such opportunities should arise, while two de novo branches are planned for the next three years. A map showing the Company’s office coverage is set forth below and details regarding the Company’s offices and recent trends with respect to market interest rate levels are set forth in Exhibit II-1 and II-2, respectively.
Table 2.1
Ocean Shore Holding Co.
Map of Branch Locations
| RP® Financial, LC. | MARKET AREA |
II. 2
OSHC has benefited from a number of key characteristics of its market area. First, Atlantic County is one of the fastest growing areas in New Jersey as a result of a number of factors including the availability of land for development in inland areas at a relatively moderate cost. The comparatively moderate cost of housing and relatively affordable cost of living overall, has attracted many retirees, many of whom formerly resided in the nearby New York and Philadelphia metropolitan areas. The population of retirees has typically facilitated the Company’s deposit growth. Additionally, coastal areas of OSHC’s market are large resort areas with many seasonal businesses and a high proportion of second homes and rental properties. Furthermore, the presence of Atlantic City provides a large source of employment for many residents with its hotels and resorts, restaurants, and other entertainment facilities.
Future growth opportunities for the Company depend on the future growth and stability of the regional economy, demographic growth trends, and the nature and intensity of the competitive environment. These factors have been briefly examined in the following pages to help determine the growth potential that exists for the Company and the relative economic health of the Company’s market area. The growth potential and the stability provided by the market area have a direct bearing on the market value of the Company and will be factored into our valuation analysis accordingly.
Market Area Demographics
Demographic growth has been measured by changes in population, number of households and median household income, with trends in those areas summarized by the data presented in Table 2.2. Atlantic and Cape May Counties had populations of 281,000 and 106,000, respectively, as of 2007 for an aggregate population of 387,000 for the two county market area. Atlantic County is comparatively larger, bolstered by the presence of Atlantic City and the proximity of inland portions of the market to Philadelphia. Moreover, population growth trends for the Atlantic County market are relatively favorable, modestly exceeding the average for the State of New Jersey (i.e., 1.5% annually for Atlantic County versus 0.8% for the State of New Jersey). Growth in Cape May County equaled 0.5% for the 2000-2007 periods reflective of its comparatively remote location from major urban centers which has limited development
| RP® Financial, LC. | MARKET AREA |
II. 3
Table 2.2
Ocean Shore Holding Co.
Summary Demographic Data
| Year | Growth Rate | |||||||||||||||||
| 2000 | 2007 | 2012 | 2000-2007 | 2007-2012 | ||||||||||||||
| Population (000) | ||||||||||||||||||
United States | 281,422 | 306,348 | 325,526 | 1.2 | % | 1.2 | % | |||||||||||
New Jersey | 8,414 | 8,892 | 9,223 | 0.8 | % | 0.7 | % | |||||||||||
Cape May County | 102 | 106 | 108 | 0.5 | % | 0.5 | % | |||||||||||
Atlantic County | 253 | 281 | 302 | 1.5 | % | 1.5 | % | |||||||||||
| Households (000) | ||||||||||||||||||
United States | 105,480 | 115,337 | 122,831 | 1.3 | % | 1.3 | % | |||||||||||
New Jersey | 3,065 | 3,232 | 3,356 | 0.8 | % | 0.8 | % | |||||||||||
Cape May County | 42 | 44 | 46 | 0.8 | % | 0.6 | % | |||||||||||
Atlantic County | 95 | 105 | 113 | 1.5 | % | 1.5 | % | |||||||||||
| Median Household Income ($) | ||||||||||||||||||
United States | $ | 42,164 | $ | 53,154 | $ | 62,503 | 3.4 | % | 3.3 | % | ||||||||
New Jersey | $ | 55,083 | $ | 69,831 | $ | 81,268 | 3.4 | % | 3.1 | % | ||||||||
Cape May County | $ | 41,660 | $ | 52,423 | $ | 61,946 | 3.3 | % | 3.4 | % | ||||||||
Atlantic County | $ | 43,991 | $ | 54,266 | $ | 62,974 | 3.0 | % | 3.0 | % | ||||||||
| Per Capita Income ($) | ||||||||||||||||||
United States | $ | 21,587 | $ | 27,916 | $ | 33,873 | 3.7 | % | 3.9 | % | ||||||||
New Jersey | $ | 27,006 | $ | 35,359 | $ | 42,886 | 3.9 | % | 3.9 | % | ||||||||
Cape May County | $ | 24,172 | $ | 31,409 | $ | 38,102 | 3.8 | % | 3.9 | % | ||||||||
Atlantic County | $ | 21,034 | $ | 26,034 | $ | 30,867 | 3.1 | % | 3.5 | % | ||||||||
2007 HH Income Dist. (%) | Less Than $25,000 | $25,000 to 50,000 | $50,000 to $100,000 | $100,000 + | ||||||||||||||
United States | 21.9 | % | 25.0 | % | 32.3 | % | 20.8 | % | ||||||||||
New Jersey | 16.3 | % | 19.2 | % | 32.4 | % | 32.2 | % | ||||||||||
Cape May County | 21.8 | % | 25.7 | % | 31.6 | % | 20.9 | % | ||||||||||
Atlantic County | 20.2 | % | 25.2 | % | 36.0 | % | 18.6 | % | ||||||||||
Source: ESRI.
| RP® Financial, LC. | MARKET AREA |
II. 4
in areas outside of the beach communities. Population projections prepared by ESRI indicated that future population growth is expected to remain consistent with the recent historical trends and thus, growth in Cape May County will continue to fall below the average for New Jersey and Atlantic County, while the growth rate for Atlantic County is projected to exceed the New Jersey average.
Household growth rates for the Company’s markets as well as the State of New Jersey and the U.S. were similar to the population growth trends, with Atlantic County reporting the highest growth rate of 1.5%. Cape May County and the State of New Jersey reported 0.8% growth in households, which fell below the national average of 1.3% for the 2000 to 2007 time period. The projected growth rates into 2012 remain stable and do not change for the U.S., the State of New Jersey, and Atlantic County. Cape May County will slow down slightly to a 0.6% annual growth rate for the subsequent five year period.
Median household and per capita income in Atlantic and Cape May Counties are lower than the comparable figures for New Jersey which management attributes to several factors. First, there has been an influx of retirees with limited incomes but moderate to substantial wealth. Additionally, since the Company’s market is located outside of a major metropolitan area, income levels are comparatively modest in the absence of an abundance of high paying white collar jobs. As will be shown below, lower paying service jobs provide a relatively large portion of employment overall.
Summary of Local Economy and Workforce
The economy of the Company’s markets is focused on the service sector, owing to the presence of Atlantic City, with its hotels and gaming operations, as well as to the many resort communities present in the southern New Jersey shore area. As reflected in Table 2.3, which shows estimated and projected employment by major occupational group, service occupations provided for approximately 64,350 jobs in Atlantic County as of 2004, equal to 40.2% of all employment, while providing for 17,800 jobs in Cape May County or 36.3% of total employment. Moreover, projections by the New Jersey Department of Labor reflect that services sector will remain the largest single component of the labor market through 2014, and will achieve the greatest job growth
| RP® Financial, LC. | MARKET AREA |
II. 5
Table 2.3
Ocean Shore Holding Co.
Estimated and Projected Employment
By Major Occupational Group, 2004-2014
I. Atlantic County
| 2004 | 2014 | Change: 2004-2014 | Annual Average Job Openings | |||||||||||||||
Occupation | Number | Percent | Number | Percent | Number | Percent | Total* | Growth* | Replacements | |||||||||
Total, All Occupations | 160,150 | 100.0 | 174,950 | 100.0 | 14,850 | 9.3 | 5,920 | 1,730 | 4,200 | |||||||||
Management Occupations | 6,450 | 4.0 | 7,050 | 4.0 | 600 | 9.6 | 190 | 70 | 120 | |||||||||
Business and Financial Operations Occupations | 3,800 | 2.4 | 4,200 | 2.4 | 400 | 10.7 | 120 | 50 | 70 | |||||||||
Computer and Mathematical Occupations | 2,550 | 1.6 | 3,050 | 1.7 | 450 | 18.2 | 80 | 50 | 40 | |||||||||
Architecture and Engineering Occupations | 1,350 | 0.8 | 1,400 | 0.8 | 50 | 4.5 | 40 | 10 | 30 | |||||||||
Life, Physical, and Social Science Occupations | 650 | 0.4 | 700 | 0.4 | 50 | 11.1 | 20 | 10 | 20 | |||||||||
Community and Social Services Occupations | 2,050 | 1.3 | 2,500 | 1.4 | 400 | 20.3 | 80 | 40 | 40 | |||||||||
Legal Occupations | 1,100 | 0.7 | 1,200 | 0.7 | 100 | 8.1 | 20 | 10 | 10 | |||||||||
Education, Training, and Library Occupations | 8,650 | 5.4 | 10,350 | 5.9 | 1,650 | 19.3 | 350 | 170 | 190 | |||||||||
Arts, Design, Entertainment, Sports, and Media Occupations | 1,700 | 1.1 | 1,800 | 1.0 | 100 | 5.6 | 50 | 10 | 30 | |||||||||
Healthcare Practitioners and Technical Occupations | 6,250 | 3.9 | 8,100 | 4.6 | 1,850 | 30.0 | 310 | 190 | 120 | |||||||||
Healthcare Support Occupations | 3,250 | 2.0 | 4,250 | 2.4 | 1,000 | 31.5 | 150 | 100 | 50 | |||||||||
Protective Service Occupations | 6,500 | 4.1 | 6,300 | 3.6 | -200 | -3.1 | 180 | 10 | 170 | |||||||||
Food Preparation and Serving Related Occupations | 21,600 | 13.5 | 23,650 | 13.5 | 2,050 | 9.6 | 1,060 | 210 | 860 | |||||||||
Building and Grounds Cleaning and Maintenance Occupations | 10,100 | 6.3 | 11,300 | 6.5 | 1,200 | 12.0 | 320 | 120 | 200 | |||||||||
Personal Care and Service Occupations | 16,650 | 10.4 | 18,200 | 10.4 | 1,600 | 9.6 | 630 | 170 | 460 | |||||||||
Sales and Related Occupations | 18,350 | 11.5 | 19,450 | 11.1 | 1,150 | 6.1 | 820 | 140 | 680 | |||||||||
Office and Administrative Support Occupations | 21,850 | 13.7 | 22,550 | 12.9 | 700 | 3.2 | 670 | 140 | 530 | |||||||||
Farming, Fishing, and Forestry Occupations | 50 | 0.1 | 100 | 0.1 | 50 | 49.3 | 10 | 0 | 0 | |||||||||
Construction and Extraction Occupations | 7,750 | 4.9 | 8,200 | 4.7 | 450 | 5.8 | 200 | 50 | 150 | |||||||||
Installation, Maintenance, and Repair Occupations | 5,250 | 3.3 | 5,750 | 3.3 | 500 | 9.2 | 170 | 50 | 120 | |||||||||
Production Occupations | 4,550 | 2.8 | 4,300 | 2.5 | -250 | -5.4 | 130 | 20 | 110 | |||||||||
Transportation and Material Moving Occupations | 9,600 | 6.0 | 10,450 | 6.0 | 850 | 8.7 | 320 | 110 | 220 | |||||||||
| * | Average Annual New Jobs will not equal annualized “Employment Change” since, for declining occupations, new jobs are tabulated as zero since no net job growth is projected while the employment change is based solely on the difference between 2004 and 2014 employment totals. |
| Note: | Occupational data include estimates of self-employed and unpaid family workers and are not directly comparable to the industry employment total. Totals may not add due to rounding. Employment data are rounded to the nearest fifty and, job openings are rounded to the nearest ten. Percentages and percent changes are based on unrounded data. |
Source: NJ Department of Labor and Workforce Development
| RP® Financial, LC. | MARKET AREA |
II. 6
Table 2.3 (continued)
Ocean Shore Holding Co.
Estimated and Projected Employment
By Major Occupational Group, 2004-2014
I. Cape May County
| 2004 | 2014 | Change: 2004-2014 | Annual Average Job Openings | |||||||||||||||
Occupation | Number | Percent | Number | Percent | Number | Percent | Total* | Growth* | Replacements | |||||||||
Total, All Occupations | 48,850 | 100.0 | 54,500 | 100.0 | 5,700 | 11.6 | 1,890 | 610 | 1,280 | |||||||||
Management Occupations | 2,050 | 4.2 | 2,300 | 4.2 | 250 | 12.8 | 70 | 30 | 40 | |||||||||
Business and Financial Operations Occupations | 950 | 2.0 | 1,100 | 2.1 | 150 | 16.2 | 30 | 20 | 20 | |||||||||
Computer and Mathematical Occupations | 150 | 0.3 | 150 | 0.3 | 0 | 12.9 | 0 | 0 | 0 | |||||||||
Architecture and Engineering Occupations | 450 | 0.9 | 500 | 0.9 | 50 | 11.5 | 20 | 10 | 10 | |||||||||
Life, Physical, and Social Science Occupations | 150 | 0.3 | 150 | 0.3 | 0 | 5.2 | 0 | 0 | 0 | |||||||||
Community and Social Services Occupations | 1,000 | 2.0 | 1,050 | 1.9 | 50 | 6.2 | 30 | 10 | 20 | |||||||||
Legal Occupations | 150 | 0.4 | 200 | 0.4 | 0 | 9.8 | 0 | 0 | 0 | |||||||||
Education, Training, and Library Occupations | 2,650 | 5.4 | 2,700 | 5.0 | 100 | 2.9 | 70 | 10 | 60 | |||||||||
Arts, Design, Entertainment, Sports, and Media Occupations | 700 | 1.4 | 750 | 1.4 | 50 | 8.6 | 20 | 10 | 10 | |||||||||
Healthcare Practitioners and Technical Occupations | 1,950 | 4.0 | 2,300 | 4.2 | 350 | 18.2 | 70 | 40 | 40 | |||||||||
Healthcare Support Occupations | 1,550 | 3.2 | 1,850 | 3.4 | 250 | 17.0 | 50 | 30 | 20 | |||||||||
Protective Service Occupations | 1,350 | 2.7 | 1,350 | 2.5 | 50 | 2.4 | 40 | 10 | 40 | |||||||||
Food Preparation and Serving Related Occupations | 7,050 | 14.4 | 8,300 | 15.3 | 1,300 | 18.3 | 410 | 130 | 290 | |||||||||
Building and Grounds Cleaning and Maintenance Occupations | 3,300 | 6.7 | 3,850 | 7.0 | 550 | 16.8 | 120 | 60 | 70 | |||||||||
Personal Care and Service Occupations | 2,600 | 5.3 | 3,100 | 5.7 | 500 | 19.0 | 120 | 50 | 70 | |||||||||
Sales and Related Occupations | 6,700 | 13.8 | 7,450 | 13.7 | 750 | 11.1 | 300 | 80 | 220 | |||||||||
Office and Administrative Support Occupations | 7,500 | 15.3 | 7,700 | 14.2 | 250 | 3.2 | 230 | 50 | 190 | |||||||||
Construction and Extraction Occupations | 3,500 | 7.2 | 4,050 | 7.4 | 550 | 15.3 | 130 | 60 | 80 | |||||||||
Installation, Maintenance, and Repair Occupations | 1,650 | 3.4 | 1,850 | 3.4 | 200 | 11.3 | 60 | 20 | 40 | |||||||||
Production Occupations | 1,050 | 2.1 | 1,050 | 1.9 | 0 | 1.1 | 30 | 10 | 30 | |||||||||
Transportation and Material Moving Occupations | 2,500 | 5.1 | 2,750 | 5.1 | 250 | 10.9 | 80 | 30 | 50 | |||||||||
| * | Average Annual New Jobs will not equal annualized “Employment Change” since, for declining occupations, new jobs are tabulated as zero since no net job growth is projected while the employment change is based solely on the difference between 2004 and 2014 employment totals. |
| Note: | Occupational data include estimates of self-employed and unpaid family workers and are not directly comparable to the industry employment total. Totals may not add due to rounding. Employment data are rounded to the nearest fifty and, job openings are rounded to the nearest ten. Percentages and percent changes are based on unrounded data. |
Source: NJ Department of Labor and Workforce Development
| RP® Financial, LC. | MARKET AREA |
II. 7
overall. Other significant components of the labor market include various professional occupations, administrative support jobs, and sales/sales support positions. Overall, the Atlantic County labor market is projected to increase by 9.3% through 2014, while the Cape May County labor market is projected to grow by 11.6% over the corresponding time frame.
The importance of the hotel and gaming operations situated in Atlantic City are evidenced by the data showing the largest employers in Cape May and Atlantic Counties. Specifically, four of the five largest employers and eight of the top 10 largest employers in the market are hotel casinos employing thousands of local residents. Other large employers include several medical facilities and government operations centers. In addition to the large employers listed in Table 2.4, there are numerous small businesses supporting the hotel/casino operations as well as serving many seasonal and part-time residents, particularly in the shore communities.
Table 2.4
Ocean Shore Holding Co.
Major Employers in Cape May and Atlantic Counties
Employer | Employees | |
Borgata Casino Hotel & Spa | 7,093 | |
Bally’s Atlantic City | 5,729 | |
Tropicana Casino & Resort | 4,557 | |
AtlantiCare Health System | 4,465 | |
Trump Taj Mahal Casino Resort | 4,317 | |
Caesars | 4,206 | |
Harrah’s Atlantic City | 3,229 | |
Atlantic City Hilton Casino Resort | 2,890 | |
Resorts Atlantic City | 2,859 | |
Showboat Casino Hotel | 2,841 | |
Trump Plaza Hotel & Casino | 2,668 | |
Trump Marina Casino Resort | 2,211 | |
Shore Memorial Hospital | 1,677 | |
W.J. Hughes Technical Center (FAA) | 1,500 | |
Woodbine Development Center | 1,400 | |
Atlantic City Electric | 1,150 | |
Burdette Tomlin Memorial Hospital | 1,080 | |
| Sources: The Press, Atlantic City, NJ. | ||
| RP® Financial, LC. | MARKET AREA |
II. 8
Unemployment Trends
Unemployment trends in the market area and New Jersey are displayed in Table 2.5. The unemployment rates in the Company’s markets were higher than the New Jersey and national averages as of May 2007 and May 2008, partially reflecting the seasonal nature of local employment. In this regard, unemployment is typically lowest in the summer months when many seasonal businesses servicing tourists and summer residents are open, and highest in the off-season, which peaks during the winter months. Unemployment rates in the Company’s market as well as on a state and national basis have been trending upward for the most recent 12 month period for which data is available, as the regional and national economies have been responding to the troubled housing, credit, and financial sectors that have caused many employers to cut down on employees or limit hiring.
Table 2.5
Ocean Shore Holding Co.
Unemployment Trends (1)
Region | May 2007 Unemployment | May 2008 Unemployment | ||||
United States | 4.5 | % | 5.5 | % | ||
New Jersey | 4.3 | % | 5.4 | % | ||
Cape May County | 5.7 | % | 6.9 | % | ||
Atlantic County | 5.6 | % | 6.4 | % |
| (1) | Unemployment rates are not seasonally adjusted. |
Source: U.S. Bureau of Labor Statistics.
Market Area Deposit Characteristics
Competition for deposits in the Bank’s primary market area is intense, which is the result of a number of factors including the relatively large size and growth characteristics of the markets served by the Bank, and its relative proximity to both the Philadelphia and New York markets. Shown in Table 2.6, the Atlantic County deposit market is dominated by commercial banks which accounted for 89% of all deposits as of June 2007, while savings institutions maintained a 53% market share in Cape May County. Growth rates for savings institutions were comparatively strong in Atlantic County, equal to 7.1%, but were declining in Cape May County at a rate of 2.3% for the
| RP® Financial, LC. | MARKET AREA |
II. 9
Table 2.6
Ocean Shore Holding Co.
Cape May County Deposit Detail
Holding Company Name | Institution Name | HQ City | HQ State | Type | # of Brchs | Total Deposits as of June 30, | Market Share | 2005-2007 CAGR | |||||||||||||||||
| 2005 | 2007 | 2005 | 2007 | ||||||||||||||||||||||
| ($000) | ($000) | (%) | (%) | (%) | |||||||||||||||||||||
Commerce Bancorp Inc. | Commerce Bank NA | Cherry Hill | NJ | Bank | 4 | $ | 320,366 | $ | 348,746 | 12.67 | % | 13.88 | % | 4.34 | % | ||||||||||
PNC Financial Services Group | PNC Bank NA | Pittsburgh | PA | Bank | 10 | $ | 307,139 | $ | 312,634 | 12.15 | % | 12.44 | % | 0.89 | % | ||||||||||
Bank of America Corp. | Bank of America, NA | Charlotte | NC | Bank | 8 | $ | 223,750 | $ | 193,670 | 8.85 | % | 7.71 | % | -6.96 | % | ||||||||||
Sun Bancorp Inc. | Sun National Bank | Vineland | NJ | Bank | 7 | $ | 178,262 | $ | 180,505 | 7.05 | % | 7.18 | % | 0.63 | % | ||||||||||
Wachovia Corp. | Wachovia Bank NA | Charlotte | NC | Bank | 1 | $ | 61,050 | $ | 60,758 | 2.41 | % | 2.42 | % | -0.24 | % | ||||||||||
Boardwalk Bank | Boardwalk Bank | Linwood | NJ | Bank | 2 | $ | 0 | $ | 40,589 | 0.00 | % | 1.61 | % | N.M. | |||||||||||
Caixa Geral de Depositos SA | Crown Bank | Brick | NJ | Bank | 1 | $ | 26,121 | $ | 26,906 | 1.03 | % | 1.07 | % | 1.49 | % | ||||||||||
Newfield Bancorp, Inc. | Newfield National Bank | Newfield | NJ | Bank | 1 | $ | 13,178 | $ | 13,252 | 0.52 | % | 0.53 | % | 0.28 | % | ||||||||||
TOTAL BANKS | 34 | $ | 1,129,866 | $ | 1,177,060 | 44.68 | % | 46.83 | % | 2.07 | % | ||||||||||||||
Sturdy Savings Bank | Sturdy Savings Bank | Stone Harbor | NJ | SB | 7 | $ | 393,191 | $ | 361,911 | 15.55 | % | 14.40 | % | -4.06 | % | ||||||||||
Cape Bancorp, Inc. | Cape Savings Bank | Cape May Court House | NJ | SB | 8 | $ | 295,095 | $ | 307,595 | 11.67 | % | 12.24 | % | 2.10 | % | ||||||||||
Crest Savings Bancorp MHC | Crest Savings Bank (MHC) | Wildwood | NJ | Thrift | 8 | $ | 270,557 | $ | 240,349 | 10.70 | % | 9.56 | % | -5.75 | % | ||||||||||
Ocean Shore Holding Co. (MHC) | Ocean City Home Bank (MHC) | Ocean City | NJ | Thrift | 2 | $ | 235,487 | $ | 206,574 | 9.31 | % | 8.22 | % | -6.34 | % | ||||||||||
Sea Isle Financial Corp. MHC | 1st Bk of Sea Isle City (MHC) | Sea Isle City | NJ | Thrift | 3 | $ | 183,297 | $ | 171,345 | 7.25 | % | 6.82 | % | -3.32 | % | ||||||||||
Franklin Bank | Franklin Bank | Salem | NJ | Thrift | 1 | $ | 21,135 | $ | 24,520 | 0.84 | % | 0.98 | % | 7.71 | % | ||||||||||
Fox Chase Bancorp, Inc. (MHC) | Fox Chase Bank MHC) | Hatboro | PA | Thrift | 2 | $ | 0 | $ | 24,115 | 0.00 | % | 0.96 | % | N.M. | |||||||||||
TOTAL SAVINGS INSTITUTIONS | 31 | $ | 1,398,762 | $ | 1,336,409 | 55.32 | % | 53.17 | % | -2.25 | % | ||||||||||||||
TOTAL BANKS AND SAVINGS INSTITUTIONS | 65 | $ | 2,528,628 | $ | 2,513,469 | 100.00 | % | 100.00 | % | -0.30 | % | ||||||||||||||
NEW JERSEY | 3,351 | $ | 222,555,493 | $ | 222,450,857 | 100.00 | % | 100.00 | % | -0.02 | % | ||||||||||||||
BANKS | 2,407 | $ | 163,755,554 | $ | 150,552,905 | 73.58 | % | 67.68 | % | -4.12 | % | ||||||||||||||
SAVINGS INSTITUTIONS | 944 | $ | 58,799,939 | $ | 71,897,952 | 26.42 | % | 32.32 | % | 10.58 | % | ||||||||||||||
Source: SNL Securities.
| RP® Financial, LC. | MARKET AREA |
II. 10
Table 2.6 (continued)
Ocean Shore Holding Co.
Atlantic County Deposit Detail
Holding Company Name | Institution Name | HQ City | HQ State | Type | # of Brchs | Total Deposits as of June 30, | Market Share | 2005-2007 CAGR | |||||||||||||||||
| 2005 | 2007 | 2005 | 2007 | ||||||||||||||||||||||
| ($000) | ($000) | (%) | (%) | (%) | |||||||||||||||||||||
Bank of America Corp. | Bank of America NA | Charlotte | NC | Bank | 14 | $ | 1,357,530 | $ | 1,197,542 | 29.70 | % | 25.29 | % | -6.08 | % | ||||||||||
Commerce Bancorp Inc. | Commerce Bank NA | Philadelphia | PA | Bank | 8 | $ | 981,688 | $ | 1,047,505 | 21.48 | % | 22.12 | % | 3.30 | % | ||||||||||
Sun Bancorp Inc. | Sun National Bank | Vineland | NJ | Bank | 10 | $ | 436,190 | $ | 454,575 | 9.54 | % | 9.60 | % | 2.09 | % | ||||||||||
Wachovia Corp. | Wachovia Bank NA | Charlotte | NC | Bank | 9 | $ | 333,074 | $ | 379,611 | 7.29 | % | 8.02 | % | 6.76 | % | ||||||||||
Boardwalk Bank | Boardwalk Bank | Linwood | NJ | Bank | 5 | $ | 231,225 | $ | 289,331 | 5.06 | % | 6.11 | % | 11.86 | % | ||||||||||
PNC Financial Services Group | PNC Bank NA | Pittsburgh | PA | Bank | 8 | $ | 277,807 | $ | 269,876 | 6.08 | % | 5.70 | % | -1.44 | % | ||||||||||
Susquehanna Bancshares, Inc. | Susquehanna Bank DV | Bryn Mawr | PA | Bank | 6 | $ | 211,139 | $ | 218,368 | 4.62 | % | 4.61 | % | 1.70 | % | ||||||||||
Absecon Bancorp | First National Bank of Absecon | Absecon | NJ | Bank | 4 | $ | 138,301 | $ | 124,929 | 3.03 | % | 2.64 | % | -4.96 | % | ||||||||||
Parke Bancorp, Inc. | Parke Bank | Sewell | NJ | Bank | 1 | $ | 50,850 | $ | 95,335 | 1.11 | % | 2.01 | % | 36.92 | % | ||||||||||
Fulton Financial Corp. | The Bank | Woodbury | NJ | Bank | 2 | $ | 16,731 | $ | 38,738 | 0.37 | % | 0.82 | % | 52.16 | % | ||||||||||
Caixa Geral de Depositos, SA | Crown Bank | Brick | NJ | Bank | 1 | $ | 18,534 | $ | 24,225 | 0.41 | % | 0.51 | % | 14.33 | % | ||||||||||
Toronto - Dominion Bank | TD Banknorth National Assn. | Wilmington | DE | Bank | 1 | $ | 13,994 | $ | 17,619 | 0.31 | % | 0.37 | % | 12.21 | % | ||||||||||
TOTAL BANKS | 69 | $ | 4,067,063 | $ | 4,157,654 | 88.97 | % | 87.80 | % | 1.11 | % | ||||||||||||||
Ocean Shore Holding Co. (MHC) | Ocean City Home Bank (MHC) | Ocean City | NJ | Thrift | 6 | $ | 197,989 | $ | 214,152 | 4.33 | % | 4.52 | % | 4.00 | % | ||||||||||
Cape Bancorp, Inc. | Cape Savings Bank | Cape May Court House | NJ | SB | 5 | $ | 128,009 | $ | 166,007 | 2.80 | % | 3.51 | % | 13.88 | % | ||||||||||
CBHC Financialcorp Inc. | Select Bank | Egg Harbor | NJ | Thrift | 3 | $ | 87,003 | $ | 109,189 | 1.90 | % | 2.31 | % | 12.03 | % | ||||||||||
Hudson City Bancorp Inc. | Hudson City Savings Bank | Paramus | NJ | SB | 1 | $ | 33,277 | $ | 42,451 | 0.73 | % | 0.90 | % | 12.95 | % | ||||||||||
Fox Chase Bancorp, Inc. (MHC) | Fox Chase Bank MHC) | Hatboro | PA | Thrift | 1 | $ | 57,700 | $ | 42,112 | 1.26 | % | 0.89 | % | -14.57 | % | ||||||||||
OceanFirst Financial Corp. | OceanFirst Bank | Toms River | NJ | Thrift | 1 | $ | 0 | $ | 3,805 | 0.00 | % | 0.08 | % | N.M. | |||||||||||
TOTAL SAVINGS INSTITUTIONS | 17 | $ | 503,978 | $ | 577,716 | 11.03 | % | 12.20 | % | 7.07 | % | ||||||||||||||
TOTAL BANKS AND SAVINGS INSTITUTIONS | 86 | $ | 4,571,041 | $ | 4,735,370 | 100.00 | % | 100.00 | % | 1.78 | % | ||||||||||||||
NEW JERSEY | 3,351 | $ | 222,555,493 | $ | 222,450,857 | 100.00 | % | 100.00 | % | -0.02 | % | ||||||||||||||
BANKS | 2,407 | $ | 163,755,554 | $ | 150,552,905 | 73.58 | % | 67.68 | % | -4.12 | % | ||||||||||||||
SAVINGS INSTITUTIONS | 944 | $ | 58,799,939 | $ | 71,897,952 | 26.42 | % | 32.32 | % | 10.58 | % | ||||||||||||||
Source: SNL Securities.
| RP® Financial, LC. | MARKET AREA |
II. 11
2005 to 2007 period. The data reveals that as of June 30, 2007, OSHC grew at a 4.0% rate in Atlantic County and held the largest market share of deposits in savings institutions, at 4.5%. In Cape May, OSHS deposits declined at a 6.3% rate, but held 8.2% of the county deposits.
The largest competitors in the markets served by the Company are comprised of some of the largest financial institutions in New Jersey and the nation as a whole. In this regard, Commerce Bancorp holds the second largest market share in Atlantic County (22.1%) and the second largest market share in Cape May County (13.9%). Other large competitors include Bank of America, Sun Bancorp, Wachovia and PNC. Additionally, there are numerous other community oriented financial institutions which provide a substantial level of competition to the Company, incorporating many of the same strategies employed by the Company (i.e., offering a high level of service, products and services tailored to meet the local market needs, etc.).
The proceeds from the offering will enhance the Company’s competitiveness by providing increased operating flexibility, including de novo branching, focus on cross-selling and marketing and potential acquisition.
| RP® Financial, LC. | PEER GROUP ANALYSIS | |
| III. 1 |
III. PEER GROUP ANALYSIS
This chapter presents an analysis of OSHC’s operations versus a group of comparable savings institutions (the “Peer Group”), who were selected from the universe of all publicly-traded savings institutions in a manner consistent with the regulatory valuation guidelines. The basis of the pro forma market valuation of OSHC is derived from the pricing ratios of the Peer Group institutions, incorporating valuation adjustments for key differences in relation to the Peer Group. Since no Peer Group can be exactly comparable to OSHC, key areas examined for differences are: financial condition; profitability, growth and viability of earnings; asset growth; primary market area; dividends; liquidity of the shares; marketing of the issue; management; and effect of government regulations and regulatory reform.
Peer Group Selection
The Peer Group selection process is governed by the general parameters set forth in the regulatory valuation guidelines. Accordingly, the Peer Group is comprised of only those publicly-traded savings institutions whose common stock is either listed on a national exchange (New York Stock Exchange, or “NYSE”, and American Stock Exchange, or “AMEX”), or is NASDAQ listed, since their stock trading activity is regularly reported and generally more frequent than non-publicly traded and closely-held institutions. Institutions that are not listed on a national exchange or NASDAQ are inappropriate, since the trading activity for thinly-traded or closely-held stocks is typically highly irregular in terms of frequency and price and thus may not be a reliable indicator of market value. We have also excluded from the Peer Group those companies under acquisition or subject to rumored acquisition, in mutual holding company form and recent conversions, since the pricing ratios of these companies are typically subject to unusual distortion and/or have limited trading history. A recent listing of the universe of all publicly-traded savings institutions is included as Exhibit III-1.
Ideally, the Peer Group, which must have at least 10 members to comply with the regulatory valuation guidelines should be comprised of locally or regionally-based institutions with comparable resources, strategies and financial characteristics. There are approximately 125 publicly-traded institutions nationally, which includes approximately 30 publicly-traded MHCs. Given this limited number of public full stock thrifts, it is typically the case that the Peer Group will be comprised of institutions which are not directly comparable, but the overall group
| RP® Financial, LC. | PEER GROUP ANALYSIS | |
| III. 2 |
will still be the “best fit” group. To the extent that differences exist between the converting institution and the Peer Group, valuation adjustments will be applied to account for the differences. Since OSHC will be a full public company upon completion of the offering, we considered only full stock companies to be viable candidates for inclusion in the Peer Group. From the universe of publicly-traded thrifts, we selected ten institutions with characteristics similar to those of OSHC. In the selection process, we applied the following screen to the universe of all public companies:
| • | Mid-Atlantic Institutions with assets of less than $1 billion. All of the companies meeting the foregoing asset size criteria were profitable on a core basis. BCSB Bancorp of MD and Beacon Federal Bancorp of NY were excluded as both completed their respective conversion transactions within the past 12 months. Both WSB Holdings of MD and Severn Bancorp of MD were excluded as a result of their high ratio of NPAs to assets equal to or in excess of 2% of assets while Carver Bancorp of NY was excluded as a result of its urban location in the heart of New York City and minority ownership, management and customer base. |
Table 3.1 shows the general characteristics of each of the 10 Peer Group companies. While there are expectedly some differences between the Peer Group companies and OSHC, we believe that the Peer Group companies, on average, provide a good basis for valuation subject to valuation adjustments. The following sections present a comparison of OSHC’s financial condition, income and expense trends, loan composition, interest rate risk and credit risk versus the Peer Group as of the most recent publicly available date.
A summary description of the key characteristics of each of the Peer Group companies is detailed below.
| • | ESSA Bancorp, Inc. of PA reported total assets of $985 million and operates 13 branch offices in northeastern Pennsylvania. ESSA Bancorp, Inc., the largest Peer Group member, maintains a high proportion of residential mortgage loans and a low proportion of higher risk-weight construction and commercial mortgage loans relative to the Peer Group average. The level of lower risk-weight lending may contribute to the modest level of NPAs. Earnings are above the Peer Group average partially reflecting the impact of its high capitalization. ESSA Bancorp has the highest capital ratio of any of the Peer Group members as a result of the completion of its standard conversion transaction in April 2007. |
| RP® Financial, LC. | PEER GROUP ANALYSIS | |
| III. 3 |
Table 3.1
Peer Group of Publicly-Traded Thrifts
August 22, 2008(1)
Ticker | Financial Institution | Exchange | Primary Market | Operating Strategy(2) | Total Assets | Offices | Fiscal Year | Conv. Date | Stock Price | Market Value | ||||||||||||||
($) | ($Mil) | |||||||||||||||||||||||
| ESSA | ESSA Bancorp, Inc. of PA (3) | NASDAQ | Stroudsburg, PA | Thrift | $ | 985 | 13 | 09-30 | 04/07 | $ | 13.45 | $ | 226 | |||||||||||
| HARL | Harleysville Savings Fin. Corp. of PA (3) | NASDAQ | Harleysville, PA | Thrift | $ | 825 | 6 | 09-30 | 08/87 | $ | 12.69 | $ | 45 | |||||||||||
| FSBI | Fidelity Bancorp, Inc. of PA (3) | NASDAQ | Pittsburgh, PA | Thrift | $ | 724 | 13 | 09-30 | 06/88 | $ | 11.15 | $ | 34 | |||||||||||
| THRD | TF Financial Corp. of Newtown PA (3) | NASDAQ | Newtown, PA | Thrift | $ | 720 | 15 | 12-31 | 07/94 | $ | 21.50 | $ | 60 | |||||||||||
| ABNJ | American Bancorp of NJ Inc. of NJ (3) | NASDAQ | Bloomfield, NJ | Thrift | $ | 631 | 5 | 09-30 | 10/05 | $ | 10.40 | $ | 114 | |||||||||||
| PBCI | Pamrapo Bancorp, Inc. of NJ (3) | NASDAQ | Bayonne, NJ | Thrift | $ | 603 | 11 | 12-31 | 11/89 | $ | 13.99 | $ | 70 | |||||||||||
| FKFS | First Keystone Financial, Inc. of PA (3) | NASDAQ | Media, PA | Thrift | $ | 519 | 8 | 09-30 | 01/95 | $ | 10.00 | $ | 24 | |||||||||||
| ESBK | Elmira Savings Bank, FSB of NY (3) | NASDAQ | Elmira, NY | Thrift | $ | 471 | M | 11 | 12-31 | 03/85 | $ | 13.50 | $ | 26 | ||||||||||
| WVFC | WVS Financial Corp. of PA (3) | NASDAQ | Pittsburgh, PA | Thrift | $ | 439 | M | 6 | 06-30 | 11/93 | $ | 16.25 | $ | 36 | ||||||||||
| ROME | Rome Bancorp, Inc. of Rome NY (3) | NASDAQ | Rome, NY | Thrift | $ | 328 | 5 | 12-31 | 03/05 | $ | 10.71 | $ | 79 | |||||||||||
| NOTES: | (1) | Or most recent date available (M=March, S=September, D=December, J=June, E=Estimated, and P=Pro Forma). | ||
| (2) | Operating strategies are: Thrift=Traditional Thrift, M.B.=Mortgage Banker, R.E.=Real Estate Developer, Div.=Diversified and Ret.=Retail Banking. | |||
| (3) | BIF-insured savings bank institution. | |||
| Source: | Corporate offering circulars, data derived from information published in SNL Securities Quarterly Thrift Report, and financial reports of publicly-traded thrifts. | |||
| RP® Financial, LC. | PEER GROUP ANALYSIS | |
| III. 4 |
| • | Harleysville Savings Financial Corporation of PAhas $825 million in assets and operates six offices in the Philadelphia MSA. Harleysville Savings Financial Corporation’s balance sheet structure partially reflects a wholesale leveraging strategy based on its relatively high proportion of investment securities and borrowings to assets in comparison to loans and deposits, respectively. The loan portfolio reflects modest diversification beyond 1-4 family residential loans and MBS in comparison to the Peer Group as a whole. Harleysville Savings Financial Corporation’s modest ROA in comparison to the Peer Group average and median reflects its modest yield-cost spread also owing to wholesale leveraging strategy and lesser loan diversification. |
| • | Fidelity Bancorp, Inc. of PAhas assets of $724 million and operates through a total of 13 branch offices in the Pittsburgh metropolitan area. The balance sheet reflects a significant wholesale component with investments and borrowings comprising a larger proportion of total assets in comparison to the Peer Group average. The ROA approximates the Peer Group average reflecting the limited spreads on the wholesale aspects of its operations which are offset by correspondingly low operating expenses. Lending is primarily concentrated in 1-4 family mortgage loans, both in terms of whole loans and through a significant investment in MBS. Credit quality measures are less favorable than the Peer Group average, both in terms of the level of non-performing loans/loans and the reserve coverage ratio in relation to non-performing loans. |
| • | TF Financial Corporation of PAhas assets of $720 million and operates 15 branches in the Philadelphia metropolitan area. The asset structure reflects a relatively higher proportion of loans/assets, with the majority of loans invested in 1-4 family loans, which enhances the comparability to the Company. The relatively high ratio of loans supports TF Financial Corporation’s net interest margin and as a result, the ROA is above the Peer Group average. TF Financial maintained a ratio of NPAs which were below the average for the Peer Group and all publicly traded savings institutions. |
| • | American Bancorp of NJ has $631 million of total assets and operates through five branch offices in northern New Jersey; the similar asset size and New Jersey location enhance the comparability to the Company from a valuation perspective. American Bancorp completed its second step conversion in October 2005 providing it with a capital ratio in excess of the Peer Group average. Notwithstanding the strong capital ratio, operating returns are below the Peer Group average reflecting in part, the impact of recent branching initiatives which have increased expenses without a commensurate increase in revenues. Lending has been focused in 1-4 family loans (whole loans and MBS) with a modestly level of diversification into high risk-weight lending including primarily commercial and multi-family mortgage loans. |
| • | Pamrapo Bancorp, Inc. of NJhas assets of $603 and operates 11 offices in Northern New Jersey (in the New York MSA). The majority of Pamrapo Bancorp’s loan portfolio consists of 1-4 family residential mortgages, while reflecting diversification in commercial and multi-family mortgages, with a limited amount of diversification into construction, C&I and consumer loans. Pamrapo Bancorp generates a relatively high ratio of net interest income which supports the ROA which is modestly above the Peer Group, notwithstanding an operating expense ratio which is also above the Peer Group average. Pamrapo Bancorp’s asset ratio of NPA’s/assets exceeds both the Peer Group average and the average for all publicly traded companies. |
| RP® Financial, LC. | PEER GROUP ANALYSIS | |
| III. 5 |
| • | First Keystone Financial, Inc. of PA with assets of $519 million operates through a total of 8 branches in Pennsylvania within the Philadelphia metropolitan area which is relatively proximate to the Company’s market area. First Keystone Financial’s ROA is well below the Peer Group average reflecting its comparatively modest net interest margin and high operating expense ratio. The balance sheet composition reflects a relatively low proportion of loans high proportion of investments which is a factor in First Keystone Financial’s modest spreads. Credit quality measures appear to be favorable in comparison to the Peer Group average, both in terms of the ratio of NPAs and in terms of reserve coverage to total loans. |
| • | Elmira Savings Bank, FSB of NYreported total assets of $471 million institution operating through 11 offices, with 10 branches located in the southern tier of New York State and one branch located in northern Pennsylvania. Elmira Savings Bank’s balance sheet and income statement reflect the impact of its recent purchase of four branches from First Niagara Financial Group, Inc. completed in December of 2007. The loan portfolio composition reflects the recent emphasis on commercial mortgage, C&I and consumer lending, accompanied by the recent acquisition of the First Niagara branches that included consumer and commercial loans, in addition to deposits. The ROA is below the Peer Group average as the favorable ratio of net interest income/assets in comparison to the Peer Group is more than offset by the relatively high operating expense ratio. |
| • | WVS Financial Corp. of PAwith assets of $439 million operates through a total of 6 branches within the Pittsburgh metropolitan area. The balance sheet reflects a significant wholesale element, as MBS and investments constitute the majority of assets while borrowed funds comprise the largest segment of liabilities. WVS Financial operates with a low risk-weighted asset ratio and limited credit risk exposure as a result of significant investment in securities and MBS. Moreover, earnings are relatively strong as low-cost operating strategy provide WVS Financial Corp. with a very low operating expense ratio which mitigates the limited yield-cost spread generated through the large portfolio of high quality investment securities. |
| • | Rome Bancorp of NY has $328 million of total assets and operates through five retail banking offices in upstate New York. Enhancing the comparability to the Company, Rome Bancorp has a relatively strong capital ratio reflecting the impact of the completion of its second step conversion in March 2005. Rome Bancorp’s strong capital ratio supports its relatively high ROA, while the ROE is comparatively modest. A relatively high level of net income was due to a favorable level of interest expense, while operating expenses were higher than the Peer Group average. Rome has a high proportion of assets invested in loans with diversification into higher risk-weight commercial real estate, C&I and consumer loans at levels in excess of the Peer Group average in aggregate. |
| RP® Financial, LC. | PEER GROUP ANALYSIS | |
| III. 6 |
In aggregate, the Peer Group companies maintain a lower equity level as the industry average (10.68% of assets versus 11.00% for all public companies), generate a higher level of core profitability (0.55% for the Peer Group and 0.18% for all public companies), and generate a higher ROE based on core earnings (5.83% versus 1.73% for all public companies). Overall, the Peer Group’s pricing ratios were at a modest premium to all publicly traded thrift institutions, including both the price/earnings multiple and the price/tangible book value ratio.
| All Publicly-Traded | Peer Group | |||||||
Financial Characteristics (Averages) | ||||||||
Assets ($Mil) | $ | 3,656 | $ | 625 | ||||
Market Capitalization ($Mil) | $ | 393 | $ | 71 | ||||
Equity/Assets (%) | 11.00 | % | 10.68 | % | ||||
Core Return on Average Assets (%) | 0.18 | % | 0.55 | % | ||||
Core Return on Average Equity (%) | 1.73 | % | 5.83 | % | ||||
Pricing Ratios (Averages)(1) | ||||||||
Price/Core Earnings (x) | 18.95 | x | 19.06 | x | ||||
Price/Book (%) | 85.23 | % | 100.14 | % | ||||
Price/Tangible Book (%) | 99.24 | % | 107.22 | % | ||||
Price/Assets (%) | 9.73 | % | 11.34 | % | ||||
| (1) | Based on market prices as of August 22, 2008. |
Source: Corporate reports, offering circulars, and RP Financial, L.C. calculations.
Since there are some key differences between OSHC and this “best fit” Peer Group, we have prepared the following analysis to point out such differences, as well as the similarities.
Financial Condition
Table 3.2 shows comparative balance sheet measures for the Company and the Peer Group (as of June 30, 2008, for the Company and the date of the most recent publicly available information for the Peer Group). OSHC’s equity-to-assets ratio of 9.7% was below the Peer Group’s average equity ratio of 10.9%, respectively, but above the Peer Group median of 9.2% even before the completion of the Second Step Conversion. Tangible equity equaled 9.7% of assets for the Company, versus 10.5% on average for the Peer Group. The increase in OSHC’s pro forma equity position will be favorable from a risk perspective and in terms of future earnings potential through reinvestment and leveraging. At the same time, the Company’s higher pro forma capitalization will also result in a lower return on equity. Both the Company’s and the Peer Group’s capital ratios reflected capital surpluses with respect to the regulatory capital requirements.
| RP® Financial, LC. | PEER GROUP ANALYSIS | |
| III. 7 |
Table 3.2
Balance Sheet Composition and Growth Rates
Comparable Institution Analysis
As of June 30, 2008
| Balance Sheet as a Percent of Assets | Balance Sheet Annual Growth Rates | Regulatory Capital | ||||||||||||||||||||||||||||||||||||||||||||||||||||||||||||
| Cash & Equi- valents | MBS & Invest | BOLI | Loans | Deposits | Borrowed Funds | Subd. Debt | Net Worth | Good- will & Intang | Tng Net Worth | Assets | MBS, Cash & Invest- ments | Loans | Deposits | Borrows. & Subdebt | Net Worth | Tng Net Worth | Tangible | Core | Reg. Cap. | |||||||||||||||||||||||||||||||||||||||||||
Ocean Shore Holding Co. | ||||||||||||||||||||||||||||||||||||||||||||||||||||||||||||||
June 30, 2008 | 1.7 | % | 7.8 | % | 1.6 | % | 86.2 | % | 62.9 | % | 23.8 | % | 2.4 | % | 9.7 | % | 0.0 | % | 9.7 | % | 12.98 | % | -30.03 | % | 21.78 | % | -0.88 | % | 82.50 | % | 1.35 | % | 1.35 | % | 9.77 | % | 9.77 | % | 17.26 | % | ||||||||||||||||||||||
All Public Companies | ||||||||||||||||||||||||||||||||||||||||||||||||||||||||||||||
Averages | 3.4 | % | 19.8 | % | 1.3 | % | 71.0 | % | 66.4 | % | 20.0 | % | 0.6 | % | 11.8 | % | 1.0 | % | 10.9 | % | 8.32 | % | 0.24 | % | 9.73 | % | 4.04 | % | 21.59 | % | -1.36 | % | -2.30 | % | 10.43 | % | 10.32 | % | 16.39 | % | ||||||||||||||||||||||
Medians | 2.4 | % | 16.5 | % | 1.4 | % | 72.9 | % | 67.5 | % | 18.8 | % | 0.0 | % | 10.1 | % | 0.1 | % | 9.1 | % | 6.79 | % | -0.73 | % | 8.77 | % | 1.68 | % | 14.47 | % | -0.35 | % | -0.58 | % | 8.90 | % | 8.82 | % | 13.55 | % | ||||||||||||||||||||||
State of NJ | ||||||||||||||||||||||||||||||||||||||||||||||||||||||||||||||
Averages | 3.0 | % | 24.3 | % | 1.2 | % | 67.5 | % | 65.5 | % | 19.4 | % | 0.3 | % | 13.9 | % | 0.7 | % | 13.2 | % | 9.99 | % | 2.61 | % | 13.48 | % | 8.73 | % | 29.77 | % | -1.07 | % | -1.04 | % | 11.66 | % | 11.66 | % | 21.99 | % | ||||||||||||||||||||||
Medians | 2.5 | % | 23.7 | % | 1.5 | % | 70.6 | % | 67.4 | % | 17.9 | % | 0.0 | % | 13.7 | % | 0.0 | % | 11.9 | % | 12.19 | % | 6.78 | % | 10.60 | % | 3.39 | % | 32.95 | % | 0.78 | % | 1.05 | % | 9.77 | % | 9.77 | % | 20.72 | % | ||||||||||||||||||||||
Comparable Group | ||||||||||||||||||||||||||||||||||||||||||||||||||||||||||||||
Averages | 3.2 | % | 29.5 | % | 1.6 | % | 63.0 | % | 61.0 | % | 26.6 | % | 0.3 | % | 10.9 | % | 0.4 | % | 10.5 | % | 7.35 | % | 4.73 | % | 6.41 | % | 1.97 | % | 24.20 | % | -3.02 | % | -1.27 | % | 12.29 | % | 10.37 | % | 17.10 | % | ||||||||||||||||||||||
Medians | 2.5 | % | 24.0 | % | 1.5 | % | 66.6 | % | 64.8 | % | 22.7 | % | 0.0 | % | 9.2 | % | 0.0 | % | 8.1 | % | 7.17 | % | 3.85 | % | 7.88 | % | -1.41 | % | 14.28 | % | -0.61 | % | -0.59 | % | 11.07 | % | 9.09 | % | 16.48 | % | ||||||||||||||||||||||
Comparable Group | ||||||||||||||||||||||||||||||||||||||||||||||||||||||||||||||
ABNJ | American Bancorp of NJ Inc. of NJ | 5.2 | % | 15.1 | % | 2.1 | % | 74.7 | % | 71.5 | % | 12.9 | % | 0.0 | % | 14.4 | % | 0.0 | % | 14.4 | % | 12.19 | % | 18.65 | % | 10.60 | % | 9.96 | % | NM | -14.23 | % | -14.23 | % | 12.60 | % | 12.60 | % | 20.72 | % | ||||||||||||||||||||||
ESSA | ESSA Bancorp, Inc. of PA | 2.4 | % | 24.4 | % | 1.4 | % | 69.7 | % | 37.6 | % | 39.9 | % | 0.0 | % | 21.1 | % | 0.0 | % | 21.1 | % | 10.38 | % | 2.60 | % | 14.50 | % | -6.74 | % | 39.97 | % | 1.73 | % | 1.73 | % | NA | NA | NA | ||||||||||||||||||||||||
ESBK | Elmira Savings Bank, FSB of NY(1) | 7.5 | % | 21.7 | % | 1.5 | % | 63.5 | % | 79.4 | % | 11.2 | % | 0.0 | % | 8.8 | % | 2.9 | % | 6.0 | % | 25.14 | % | 6.88 | % | 27.74 | % | 27.62 | % | -6.67 | % | NM | 14.19 | % | NA | NA | NA | |||||||||||||||||||||||||
FSBI | Fidelity Bancorp, Inc. of PA | 1.3 | % | 32.8 | % | 0.8 | % | 62.5 | % | 58.5 | % | 33.1 | % | 1.1 | % | 6.2 | % | 0.4 | % | 5.9 | % | -0.43 | % | -0.50 | % | -0.77 | % | -2.28 | % | 3.14 | % | -1.68 | % | -1.72 | % | NA | 7.43 | % | 11.97 | % | ||||||||||||||||||||||
FKFS | First Keystone Financial, Inc. of PA | 5.9 | % | 33.3 | % | 3.0 | % | 54.8 | % | 65.7 | % | 23.9 | % | 2.2 | % | 6.5 | % | 0.0 | % | 6.5 | % | -0.98 | % | 7.12 | % | -6.50 | % | -5.91 | % | 13.50 | % | -0.56 | % | -0.56 | % | 8.64 | % | 8.65 | % | 15.77 | % | |||||||||||||||||||||
HARL | Harleysville Savings Fin. Corp. of PA | 1.2 | % | 40.0 | % | 1.5 | % | 55.3 | % | 53.5 | % | 39.9 | % | 0.0 | % | 5.6 | % | 0.0 | % | 5.6 | % | 5.98 | % | 0.83 | % | 10.55 | % | 1.81 | % | 14.28 | % | -6.20 | % | -6.20 | % | NA | 5.64 | % | 11.45 | % | ||||||||||||||||||||||
PBCI | Pamrapo Bancorp, Inc. of NJ | 3.0 | % | 23.7 | % | 0.3 | % | 71.5 | % | 77.3 | % | 11.8 | % | 0.0 | % | 9.7 | % | 0.0 | % | 9.7 | % | -5.18 | % | -11.26 | % | -2.77 | % | -3.10 | % | -20.22 | % | -0.61 | % | -0.61 | % | 9.54 | % | 9.54 | % | 17.19 | % | |||||||||||||||||||||
ROME | Rome Bancorp, Inc. of Rome NY | 2.6 | % | 2.2 | % | 2.7 | % | 88.0 | % | 63.9 | % | 14.7 | % | 0.0 | % | 19.7 | % | 0.0 | % | 19.7 | % | 5.45 | % | 1.59 | % | 5.87 | % | 1.84 | % | 93.13 | % | -13.69 | % | -13.69 | % | 18.36 | % | 18.36 | % | 25.49 | % | |||||||||||||||||||||
THRD | TF Financial Corp. of Newtown PA | 0.6 | % | 18.5 | % | 2.2 | % | 76.4 | % | 67.7 | % | 21.5 | % | 0.0 | % | 9.6 | % | 0.6 | % | 9.0 | % | 8.37 | % | 5.10 | % | 9.90 | % | -0.53 | % | 54.53 | % | 4.32 | % | 4.64 | % | NA | NA | NA | ||||||||||||||||||||||||
WVFC | WVS Financial Corp. of PA(1) | 2.1 | % | 83.9 | % | 0.0 | % | 13.1 | % | 34.5 | % | 57.0 | % | 0.0 | % | 7.3 | % | 0.0 | % | 7.3 | % | 12.59 | % | 16.34 | % | -5.06 | % | -3.02 | % | 26.16 | % | 3.74 | % | 3.74 | % | NA | NA | NA | ||||||||||||||||||||||||
| (1) | Financial information is for the quarter ending March 31, 2008. |
| Source: | Audited and unaudited financial statements, corporate reports and offering circulars, and RP® Financial, LC. calculations. The information provided in this table has been obtained from sources we believe are reliable, but we cannot guarantee the accuracy or completeness of such information. |
Copyright (c) 2008 by RP® Financial, LC.
| RP® Financial, LC. | PEER GROUP ANALYSIS | |
| III. 8 |
The Company’s asset composition reflects a higher concentration of loans to assets, at 86.2% versus a 63.0% average for the Peer Group. Comparatively, the ratio of cash, investments, and MBS for the Company was lower than for the Peer Group (9.5% of assets versus 32.7% for the Peer Group). Overall, the Company’s interest-earning assets (“IEA”) approximated 95.7% of assets, which equals the comparative Peer Group ratio of 95.7%. On a pro forma basis, the Company’s IEA is expected to increase as the net proceeds are reinvested into IEA.
The Company’s deposits equaled 62.9% of assets, which was slightly above the Peer Group average of 61.0%. A unique aspect of the Company’s deposit base in comparison to the Peer Group is the large balance of public funds; the Peer Group does not report a comparable level of public funds. The Company has utilized borrowings to a slightly lesser extent than the Peer Group, on average, at 26.2% and 26.9% of assets (includes subordinated debt), respectively. Balances of subordinated debt equaled 2.4% versus only 0.3% for the Peer Group. Total interest-bearing liabilities (“IBL”) maintained by OSHC and the Peer Group, equaled 89.1% and 87.9% of assets, respectively. The ratio of IBL will be reduced on a post-offering basis as the Company funds a greater portion of its operations with equity.
OSHC posted higher 12 month asset growth than the Peer Group, at 12.98% and 7.35%, respectively. The Company’s comparatively faster growth is attributable to efforts to expand lending and leverage its equity, particularly following the completion of the minority stock issuance in 2004. The Company’s stronger loan growth (21.78% versus 6.41% for the Peer Group on average) reflects the recent efforts to expand the loan portfolio as well as the Company’s portfolio lending strategy wherein loan sales have been limited over the last five fiscal years. The portfolio of cash, investments and MBS modestly increased for the Peer Group, by 4.73% as compared to the high amount of shrinkage of 30.03% for the Company. The reduction of cash and investments for the Company is reflective of the Company’s general preference to invest in whole loans coupled with recent loan growth which has resulted in the redeployment of funds from investments into loans.
The Company’s deposit growth rate was below the Peer Group average as OSHC’s deposits declined 0.88% while the Peer Group’s deposits grew at a 1.97% average rate. Borrowed funds increased much more rapidly for the Company at an 82.50% annual pace
| RP® Financial, LC. | PEER GROUP ANALYSIS | |
| III. 9 |
versus modest growth of 24.20% for the Peer Group, as the Company increased borrowings to fund new loan originations not funded by deposit growth. As discussed in Section One, deposit growth has been limited in recent periods owing to a conscious decision by the Company to limit deposits costs in a challenging earnings and spread environment which prevailed through fiscal 2007, preferring to rely primary on FHLB advances to fund asset growth based on the availability of borrowed funds at an attractive cost after consideration of the operating costs associated with deposits.
The Company’s equity modestly increased by 1.35% as compared to modest shrinkage of 2.75% for the Peer Group based on the average. Improvement of the Company’s equity and the modest shrinkage for the Peer Group reflects the adoption of dividend and capital management strategies by both the Company and the Peer Group. On a post-offering basis, the Company’s equity growth rate is expected to remain comparatively modest as the benefit of reinvestment of the Offering proceeds may be offset by additional share repurchases, the payment of dividends and as expenses may likely increase reflecting the impact of the expanded stock benefit plans and de novo branching.
Income and Expense Components
Table 3.3 displays comparative statements of operations for the Company and the Peer Group. OSHC and the Peer Group reported net income to average assets ratios of 0.57%, and 0.56%, respectively. The Company’s operating results reflect a favorable level of net interest income offset by a relatively high tax rate in comparison to the Peer Group while the ratio of operating expense and non-interest income as a percent of average assets was relatively comparable to the Peer Group average and medians.
The Company’s interest income and interest expense ratios relative to average assets were relatively favorable in comparison to the Peer Group, resulting in a stronger net interest income ratio. The Company’s higher interest income ratio was realized through earning a high yield on interest-earning assets (5.95% versus 5.75% for the Peer Group) which is reflective of the higher ratio of higher yielding loans in the Company’s interest-earning asset portfolio. The Company’s marginally lower interest expense ratio, 2.96% versus 2.99% of average assets for the Peer Group, reflects the Company’s high level of borrowings as OSHC’s deposit composition is heavily weighted toward lower costs savings and transaction accounts. Overall, the Company’s net interest income ratio of 2.76% compared favorably to the Peer Group average of 2.53% of average assets.
| RP® Financial, LC. | PEER GROUP ANALYSIS | |
| III. 10 |
Table 3.3
Income as Percent of Average Assets and Yields, Costs, Spreads
Comparable Institution Analysis
For the 12 Months Ended June 30, 2008
| Net Interest Income | Other Income | G&A/Other Exp. | Non-Op. Items | Yields, Costs, and Spreads | |||||||||||||||||||||||||||||||||||||||||||||||||||||||
| Net Income | Income | Expense | NII | Loss Provis. on IEA | NII After Provis. | Loan Fees | R.E. Oper. | Other Income | Total Other Income | G&A Expense | Goodwill Amort. | Net Gains | Extrao. Items | Yield On Assets | Cost Of Funds | Yld-Cost Spread | MEMO: Assets/ FTE Emp. | MEMO: Effective Tax Rate | |||||||||||||||||||||||||||||||||||||||||
Ocean Shore Holding Co. | |||||||||||||||||||||||||||||||||||||||||||||||||||||||||||
June 30, 2008 | 0.57 | % | 5.72 | % | 2.96 | % | 2.76 | % | 0.04 | % | 2.72 | % | 0.00 | % | 0.00 | % | 0.45 | % | 0.45 | % | 2.19 | % | 0.00 | % | -0.06 | % | 0.00 | % | 5.95 | % | 3.44 | % | 2.51 | % | $ | 5,180 | 37.21 | % | |||||||||||||||||||||
All Public Companies | |||||||||||||||||||||||||||||||||||||||||||||||||||||||||||
Averages | 0.22 | % | 5.73 | % | 3.02 | % | 2.71 | % | 0.38 | % | 2.33 | % | 0.03 | % | -0.02 | % | 0.66 | % | 0.67 | % | 2.55 | % | 0.08 | % | -0.01 | % | 0.00 | % | 6.07 | % | 3.49 | % | 2.59 | % | $ | 5,781 | 32.25 | % | |||||||||||||||||||||
Medians | 0.44 | % | 5.68 | % | 3.06 | % | 2.70 | % | 0.14 | % | 2.51 | % | 0.00 | % | 0.00 | % | 0.51 | % | 0.51 | % | 2.53 | % | 0.00 | % | 0.00 | % | 0.00 | % | 5.98 | % | 3.54 | % | 2.66 | % | $ | 4,925 | 32.87 | % | |||||||||||||||||||||
State of NJ | |||||||||||||||||||||||||||||||||||||||||||||||||||||||||||
Averages | 0.40 | % | 5.38 | % | 2.94 | % | 2.45 | % | 0.09 | % | 2.36 | % | 0.01 | % | 0.00 | % | 0.31 | % | 0.31 | % | 2.07 | % | 0.00 | % | -0.01 | % | 0.00 | % | 5.67 | % | 3.48 | % | 2.19 | % | $ | 9,980 | 28.16 | % | |||||||||||||||||||||
Medians | 0.29 | % | 5.39 | % | 2.87 | % | 2.58 | % | 0.05 | % | 2.27 | % | 0.00 | % | 0.00 | % | 0.28 | % | 0.28 | % | 2.12 | % | 0.00 | % | 0.00 | % | 0.00 | % | 5.68 | % | 3.49 | % | 2.04 | % | $ | 6,063 | 33.89 | % | |||||||||||||||||||||
Comparable Group | |||||||||||||||||||||||||||||||||||||||||||||||||||||||||||
Averages | 0.56 | % | 5.52 | % | 2.99 | % | 2.53 | % | 0.06 | % | 2.47 | % | 0.01 | % | 0.00 | % | 0.41 | % | 0.43 | % | 2.11 | % | 0.00 | % | 0.02 | % | 0.00 | % | 5.75 | % | 3.39 | % | 2.36 | % | $ | 5,538 | 25.97 | % | |||||||||||||||||||||
Medians | 0.59 | % | 5.55 | % | 3.02 | % | 2.43 | % | 0.05 | % | 2.31 | % | 0.00 | % | 0.00 | % | 0.39 | % | 0.45 | % | 2.27 | % | 0.00 | % | 0.00 | % | 0.00 | % | 5.77 | % | 3.54 | % | 2.10 | % | $ | 5,043 | 26.70 | % | |||||||||||||||||||||
Comparable Group | |||||||||||||||||||||||||||||||||||||||||||||||||||||||||||
ABNJ | American Bancorp of NJ Inc. of NJ | 0.07 | % | 5.24 | % | 3.04 | % | 2.20 | % | 0.09 | % | 2.11 | % | 0.00 | % | 0.00 | % | 0.28 | % | 0.28 | % | 2.31 | % | 0.00 | % | 0.00 | % | 0.00 | % | 5.53 | % | 3.70 | % | 1.83 | % | $ | 7,509 | 5.78 | % | ||||||||||||||||||||
ESSA | ESSA Bancorp, Inc. of PA | 0.75 | % | 5.49 | % | 2.75 | % | 2.74 | % | 0.06 | % | 2.68 | % | 0.07 | % | 0.00 | % | 0.53 | % | 0.59 | % | 2.18 | % | 0.00 | % | 0.00 | % | 0.00 | % | 5.70 | % | 3.57 | % | 2.12 | % | $ | 6,194 | 31.25 | % | ||||||||||||||||||||
ESBK | Elmira Savings Bank, FSB of NY(1) | 0.47 | % | 5.64 | % | 2.99 | % | 2.65 | % | 0.14 | % | 2.51 | % | 0.00 | % | 0.00 | % | 0.55 | % | 0.55 | % | 2.55 | % | 0.04 | % | 0.16 | % | 0.00 | % | 5.93 | % | 3.26 | % | 2.68 | % | $ | 3,955 | 24.69 | % | ||||||||||||||||||||
FSBI | Fidelity Bancorp, Inc. of PA | 0.55 | % | 5.51 | % | 3.34 | % | 2.17 | % | 0.12 | % | 2.05 | % | 0.07 | % | -0.01 | % | 0.43 | % | 0.49 | % | 1.80 | % | 0.00 | % | -0.02 | % | 0.00 | % | 5.69 | % | 3.60 | % | 2.09 | % | $ | 4,958 | 22.26 | % | ||||||||||||||||||||
FKFS | First Keystone Financial, Inc. of PA | 0.15 | % | 5.16 | % | 3.22 | % | 1.94 | % | 0.03 | % | 1.91 | % | 0.00 | % | -0.01 | % | 0.56 | % | 0.54 | % | 2.33 | % | 0.00 | % | 0.01 | % | 0.00 | % | 5.48 | % | 3.50 | % | 1.98 | % | $ | 5,043 | NM | |||||||||||||||||||||
HARL | Harleysville Savings Fin. Corp. of PA | 0.46 | % | 5.34 | % | 3.74 | % | 1.60 | % | 0.01 | % | 1.59 | % | 0.00 | % | 0.00 | % | 0.24 | % | 0.24 | % | 1.22 | % | 0.00 | % | -0.03 | % | 0.00 | % | 5.53 | % | 4.01 | % | 1.52 | % | $ | 8,867 | 21.03 | % | ||||||||||||||||||||
PBCI | Pamrapo Bancorp, Inc. of NJ | 0.62 | % | 5.73 | % | 2.77 | % | 2.96 | % | 0.08 | % | 2.88 | % | 0.00 | % | 0.00 | % | 0.34 | % | 0.34 | % | 2.24 | % | 0.00 | % | 0.00 | % | 0.00 | % | 5.84 | % | 3.09 | % | 2.75 | % | $ | 6,285 | 36.55 | % | ||||||||||||||||||||
ROME | Rome Bancorp, Inc. of Rome NY | 0.93 | % | 5.67 | % | 1.60 | % | 4.08 | % | 0.02 | % | 4.06 | % | 0.00 | % | 0.00 | % | 0.68 | % | 0.68 | % | 3.36 | % | 0.00 | % | 0.01 | % | 0.00 | % | 6.11 | % | 2.08 | % | 4.03 | % | $ | 3,246 | 32.92 | % | ||||||||||||||||||||
THRD | TF Financial Corp. of Newtown PA | 0.70 | % | 5.60 | % | 2.74 | % | 2.86 | % | 0.05 | % | 2.81 | % | 0.00 | % | 0.05 | % | 0.35 | % | 0.40 | % | 2.29 | % | 0.00 | % | 0.04 | % | 0.00 | % | 5.88 | % | 3.08 | % | 2.80 | % | $ | 3,787 | 26.70 | % | ||||||||||||||||||||
WVFC | WVS Financial Corp. of PA(1) | 0.94 | % | 5.79 | % | 3.70 | % | 2.09 | % | -0.02 | % | 2.10 | % | 0.00 | % | 0.00 | % | 0.14 | % | 0.14 | % | 0.86 | % | 0.00 | % | 0.00 | % | 0.00 | % | 5.86 | % | 4.06 | % | 1.80 | % | NM | 32.55 | % | |||||||||||||||||||||
| (1) | Financial information is for the quarter ending March 31, 2008. |
| Source: | Audited and unaudited financial statements, corporate reports and offering circulars, and RP® Financial, LC. calculations. The information provided in this table has been obtained from sources we believe are reliable, but we cannot guarantee the accuracy or completeness of such information. |
Copyright (c) 2008 by RP® Financial, LC.
| RP® Financial, LC. | PEER GROUP ANALYSIS | |
| III. 11 |
Non-interest operating income is a modestly greater contributor to OSHC’s earnings relative to the Peer Group, at 0.45% and 0.41% of average assets, respectively. Both the Company and the Peer Group generate levels of non-interest income which are below the average for all publicly traded companies of 0.66% of average assets, reflecting their emphasis on residential mortgage lending which tends to generate limited levels of non-interest fee income.
OSHC operates with a slightly higher operating expense ratio as compared to the Peer Group, as well. The operating expense ratios for OSHC and the Peer Group were 2.19% and 2.11%, respectively. Intangible assets amortization was nominal for the Peer Group, and the Company had no amortizing intangible assets. On a post-offering basis, the Company’s operating expenses can be expected to increase with the incremental cost of the stock-based benefit plans as well as the planned branching and growth initiatives which are currently underway. At the same time, continued balance sheet growth and reinvestment of the offering proceeds should largely offset the anticipated expense increase as a percent of average assets.
OSHC’s efficiency ratio (operating expenses as a percent of the sum of non-interest operating income and net interest income) of 68.3% is slightly more favorable than the Peer Group’s ratio of 71.3%. On a post-offering basis, the efficiency ratio may show some improvement from the benefit of reinvesting the proceeds from the Offering. However, a portion of the benefit is expected to be offset by the increased expense of the stock benefit plans and the costs of targeted expansion.
Loan loss provisions for the Company and the Peer Group were relatively modest, amounting to 0.04% and 0.06% of average assets for OSHC and the Peer Group, respectively, reflecting relatively strong asset quality for both on average.
Non-operating income and expense were negligible for OSHC and the Peer Group, enhancing their overall comparability; net non-operating losses equaled 0.06% of assets for OSHC versus average gains equal to 0.02% for the Peer Group.
The Company’s effective tax rate for the last 12 months of 37.2% is higher than the Peer Group average of 25.8%. The Company expects that its effective tax rate will continue to approximate the recent historical level over the near term and therefore remaining at a disadvantage in comparison to the Peer Group. At the same time, the Company is evaluating the merits of establishing a special purpose investment subsidiary for the purpose of minimizing its state tax liability which could potentially reduce OSHC’s average tax rate.
| RP® Financial, LC. | PEER GROUP ANALYSIS | |
| III. 12 |
Loan Composition
OSHC’s loan portfolio reflects a comparatively greater concentration of 1-4 family residential mortgage loans and MBS, which aggregated to 81.1% of assets and 62.9% of assets for the Company and the Peer Group, respectively (see Table 3.4). Loans secured by permanent 1-4 family residential mortgage loans equaled 76.3% of assets for the Company versus 46.4% on average for the Peer Group, while MBS comprised 4.8% and 16.6%, respectively. Given the Company’s historical philosophy of retaining the majority of loans originations for portfolio, loans serviced for others represented a less significant off-balance sheet item for OSHC. Both the Company and the Peer Group had a limited level of servicing intangibles.
The Peer Group’s lending activities show greater diversification in various areas of high risk-weight lending including multi-family and commercial mortgage lending. Specifically, multi-family and commercial mortgage loans represented 13.0% of assets, which was greater than the 5.7% ratio for the Company. The Peer Group, on average, was also a more active consumer lender, with 2.5% of assets invested in consumer loans versus 0.1% for the Company. The Peer Group maintained construction loan (2.9% of assets) and business loan (3.7% of assets) portfolios, while the Company was less engaged in these lending areas, reporting 1.6% of assets in construction lending and 2.5% in commercial business. Overall, the Company’s risk-weighted assets to total assets ratio equaled 58.9%, slightly above the Peer Group average of 55.5%.
Credit Risk
The Company’s credit risk exposure appears to be lower than the Peer Group, on average, based on the NPAs ratio which fell below the Peer Group average and a reserve coverage ratio in comparison to NPAs and NPLs which fell between the Peer Group average and median. As shown in Table 3.5, the Company’s ratio of NPAs and accruing loans that are more than 90 days past due was 0.29% and below the Peer Group ratio of 0.65%. The Company maintained a lower non-performing loans/loans ratio than the Peer Group (0.34% versus 0.70% for the Peer Group). Reserve coverage in relation to non-performing assets was
| RP® Financial, LC. | PEER GROUP ANALYSIS | |
| III. 13 |
Table 3.4
Loan Portfolio Composition and Related Information
Comparable Institution Analysis
As of June 30, 2008
| Portfolio Composition as a Percent of Assets | |||||||||||||||||||||||||||||
Institution | MBS | 1-4 Family | Constr. & Land | 5+Unit Comm RE | Commerc. Business | Consumer | RWA/ Assets | Serviced For Others | Servicing Assets | ||||||||||||||||||||
| (%) | (%) | (%) | (%) | (%) | (%) | (%) | ($000) | ($000) | |||||||||||||||||||||
Ocean Shore Holding Co. | 4.82 | % | 76.31 | % | 1.63 | % | 5.67 | % | 2.47 | % | 0.12 | % | 58.86 | % | $ | 6,483 | $ | 47 | |||||||||||
All Public Companies | |||||||||||||||||||||||||||||
Averages | 12.04 | % | 36.84 | % | 7.04 | % | 20.23 | % | 4.51 | % | 2.76 | % | 64.73 | % | $ | 682,020 | $ | 6,023 | |||||||||||
Medians | 9.40 | % | 36.29 | % | 4.72 | % | 18.20 | % | 2.91 | % | 0.64 | % | 65.23 | % | $ | 34,330 | $ | 124 | |||||||||||
State of NJ | |||||||||||||||||||||||||||||
Averages | 16.40 | % | 44.24 | % | 4.83 | % | 15.49 | % | 2.02 | % | 0.56 | % | 54.30 | % | $ | 92,588 | $ | 693 | |||||||||||
Medians | 17.26 | % | 44.39 | % | 2.70 | % | 12.67 | % | 1.22 | % | 0.14 | % | 56.05 | % | $ | 2,155 | $ | 0 | |||||||||||
Comparable Group | |||||||||||||||||||||||||||||
Averages | 16.58 | % | 46.33 | % | 2.90 | % | 13.01 | % | 3.69 | % | 2.46 | % | 55.53 | % | $ | 21,098 | $ | 142 | |||||||||||
Medians | 15.07 | % | 47.18 | % | 2.11 | % | 13.63 | % | 1.22 | % | 0.32 | % | 57.05 | % | $ | 12,285 | $ | 52 | |||||||||||
Comparable Group | |||||||||||||||||||||||||||||
ABNJ | American Bancorp of NJ Inc. of NJ | 15.78 | % | 47.18 | % | 7.07 | % | 17.72 | % | 1.22 | % | 0.14 | % | 56.28 | % | $ | 17,900 | $ | 71 | ||||||||||
ESSA | ESSA Bancorp, Inc. of PA | 15.00 | % | 59.51 | % | 2.11 | % | 4.52 | % | 1.22 | % | 0.19 | % | 44.78 | % | $ | 17,810 | $ | 173 | ||||||||||
ESBK | Elmira Savings Bank, FSB of NY(1) | 15.07 | % | 31.57 | % | 0.33 | % | 13.63 | % | 11.52 | % | 10.64 | % | 62.58 | % | $ | 65,320 | $ | 383 | ||||||||||
FSBI | Fidelity Bancorp, Inc. of PA | 13.17 | % | 42.05 | % | 3.41 | % | 12.60 | % | 3.99 | % | 0.43 | % | 55.12 | % | $ | 0 | $ | 0 | ||||||||||
FKFS | First Keystone Financial, Inc. of PA | 27.52 | % | 38.18 | % | 2.75 | % | 10.28 | % | 2.81 | % | 0.22 | % | 59.06 | % | $ | 44,180 | $ | 243 | ||||||||||
HARL | Harleysville Savings Fin. Corp. of PA | 27.27 | % | 51.19 | % | 0.62 | % | 3.18 | % | 0.51 | % | 0.15 | % | 50.71 | % | $ | 2,950 | $ | 0 | ||||||||||
PBCI | Pamrapo Bancorp, Inc. of NJ | 21.34 | % | 44.72 | % | 1.89 | % | 23.45 | % | 1.22 | % | 0.34 | % | 58.19 | % | $ | 1,690 | $ | 0 | ||||||||||
ROME | Rome Bancorp, Inc. of Rome NY | 0.09 | % | 51.80 | % | 1.01 | % | 14.87 | % | 9.92 | % | 9.72 | % | 72.59 | % | $ | 6,760 | $ | 33 | ||||||||||
THRD | TF Financial Corp. of Newtown PA | 13.99 | % | 50.78 | % | 6.89 | % | 16.82 | % | 0.82 | % | 0.32 | % | 57.81 | % | $ | 54,370 | $ | 513 | ||||||||||
WVFC | WVS Financial Corp. of PA(1) | NA | NA | NA | NA | NA | NA | 38.14 | % | $ | 0 | $ | 0 | ||||||||||||||||
| (1) | Financial information is for the quarter ending March 31, 2008. |
| Source: | SNL Financial LC. and RP® Financial, LC. calculations. The information provided in this table has been obtained from sources we believe are reliable, but we cannot guarantee the accuracy or completeness of such information. |
Copyright (c) 2008 by RP® Financial, LC.
| RP® Financial, LC. | PEER GROUP ANALYSIS | |
| III. 14 |
Table 3.5
Credit Risk Measures and Related Information
Comparable Institution Analysis
As of June 30, 2008 or Most Recent Date Available
Institution | REO/ Assets | NPAs & 90+Del/ Assets | NPLs/ Loans | Rsrves/ Loans | Rsrves/ NPLs | Rsrves/ NPAs & 90+Del | Net Loan Chargoffs | NLCs/ Loans | |||||||||||||||||||
| (%) | (%) | (%) | (%) | (%) | (%) | ($000) | (%) | ||||||||||||||||||||
Ocean Shore Holding Co. | 0.00 | % | 0.29 | % | 0.34 | % | 0.44 | % | 129.06 | % | 129.06 | % | $ | 0 | 0.00 | % | |||||||||||
All Public Companies | |||||||||||||||||||||||||||
Averages | 0.23 | % | 1.52 | % | 1.57 | % | 1.05 | % | 156.03 | % | 111.59 | % | $ | 745 | 0.23 | % | |||||||||||
Medians | 0.06 | % | 0.78 | % | 0.83 | % | 0.91 | % | 96.91 | % | 70.19 | % | $ | 122 | 0.06 | % | |||||||||||
State of NJ | |||||||||||||||||||||||||||
Averages | 0.09 | % | 0.90 | % | 0.58 | % | 0.66 | % | 167.55 | % | 106.66 | % | $ | 172 | 0.02 | % | |||||||||||
Medians | 0.00 | % | 0.83 | % | 0.41 | % | 0.59 | % | 80.55 | % | 70.03 | % | $ | 7 | 0.00 | % | |||||||||||
Comparable Group | |||||||||||||||||||||||||||
Averages | 0.02 | % | 0.65 | % | 0.70 | % | 0.80 | % | 195.59 | % | 186.21 | % | $ | 123 | 0.01 | % | |||||||||||
Medians | 0.00 | % | 0.37 | % | 0.49 | % | 0.70 | % | 120.14 | % | 106.39 | % | $ | 28 | 0.01 | % | |||||||||||
Comparable Group | |||||||||||||||||||||||||||
ABNJ | American Bancorp of NJ Inc. of NJ | 0.00 | % | 0.14 | % | 0.19 | % | 0.63 | % | 332.03 | % | 332.03 | % | $ | 34 | 0.01 | % | ||||||||||
ESSA | ESSA Bancorp, Inc. of PA | 0.00 | % | 0.11 | % | 0.16 | % | 0.65 | % | 405.59 | % | 405.59 | % | $ | 192 | 0.03 | % | ||||||||||
ESBK | Elmira Savings Bank, FSB of NY(1) | 0.00 | % | 0.55 | % | 0.79 | % | 0.80 | % | 97.94 | % | 95.97 | % | $ | 236 | 0.08 | % | ||||||||||
FSBI | Fidelity Bancorp, Inc. of PA | 0.02 | % | 1.65 | % | 2.59 | % | 0.73 | % | 28.10 | % | 27.85 | % | $ | 481 | 0.10 | % | ||||||||||
FKFS | First Keystone Financial, Inc. of PA | 0.00 | % | 0.27 | % | 0.49 | % | 1.17 | % | 238.08 | % | 238.08 | % | $ | 14 | 0.00 | % | ||||||||||
HARL | Harleysville Savings Fin. Corp. of PA | 0.00 | % | 0.07 | % | 0.12 | % | 0.43 | % | 345.07 | % | 345.07 | % | $ | 22 | 0.01 | % | ||||||||||
PBCI | Pamrapo Bancorp, Inc. of NJ | 0.08 | % | 2.10 | % | 0.97 | % | 0.78 | % | 80.55 | % | 26.69 | % | $ | 0 | 0.00 | % | ||||||||||
ROME | Rome Bancorp, Inc. of Rome NY | 0.05 | % | 0.60 | % | 0.59 | % | 0.66 | % | 112.82 | % | 98.21 | % | $ | 2 | -0.01 | % | ||||||||||
THRD | TF Financial Corp. of Newtown PA | 0.04 | % | 0.37 | % | 0.43 | % | 0.52 | % | 120.14 | % | 106.39 | % | $ | 339 | 0.00 | % | ||||||||||
WVFC | WVS Financial Corp. of PA(1) | 0.00 | % | NA | NA | 1.66 | % | NA | NA | $ | (93 | ) | -0.16 | % | |||||||||||||
| (1) | Financial information is for the quarter ending March 31, 2008. |
Source: | Audited and unaudited financial statements, corporate reports and offering circulars, and RP® Financial, LC. calculations. The information provided in this table has been obtained from sources we believe are reliable, but we cannot guarantee the accuracy or completeness of such information. |
Copyright (c) 2008 by RP® Financial, LC.
| RP® Financial, LC. | PEER GROUP ANALYSIS | |
| III. 15 |
below the Peer Group average for the Company (129.06% versus 195.59% for the Peer Group), as was the Company’s reserve coverage in relation to non-performing loans. At the same time, reserve coverage to NPAs and NPLs was higher than the Peer Group medians. The one area of credit quality where the Company falls short of the Peer Group is with respect to the ratio of reserves to total loans, which equaled 0.44% for the Company versus 0.80% for the Peer Group on average and 0.70% based on the median.
One factor potentially impacting the Company’s credit risk exposure is that its market presence in the southern New Jersey shore area provides OSHC with a high proportion of mortgage loans secured by second homes or by investment properties (including seasonal beach rental properties), estimated in the range of 50%. While comparable data is not readily available for the Peer Group, the markets served by the Peer Group are generally not in similar types of markets. At the same time, the performance of the portfolio of second homes and investment properties for the Company has historically been good from an asset quality perspective.
Interest Rate Risk
Table 3.6 reflects various key ratios highlighting the relative interest rate risk exposure. From a balance sheet perspective, OSHC’s lower pre-offering capital position and lower IEA/IBL ratio suggest higher exposure. On a post-offering basis, these ratios should improve relative to the Peer Group.
To analyze interest rate risk associated with the net interest margin, we also reviewed quarterly changes in net interest income as a percent of average assets for OSHC and the Peer Group. In general, the recent relative fluctuations in the Company’s net interest income to average assets ratios were considered to be slightly greater than the Peer Group average, and thus, based on the interest rate environment that prevailed during the period analyzed in Table 3.6, OSHC was viewed as maintaining a similar to modestly greater degree of interest rate risk exposure in the net interest margin. However, the Company’s net interest income ratio should be stabilized to some degree following the Offering, given the initial expected proceeds reinvestment strategy (primarily short-to-intermediate term investment securities) coupled with the higher level of capitalization.
| RP® Financial, LC. | PEER GROUP ANALYSIS | |
| III. 16 |
Table 3.6
Interest Rate Risk Measures and Net Interest Income Volatility
Comparable Institution Analysis
As of June 30, 2008 or Most Recent Date Available
| Balance Sheet Measures | |||||||||||||||||||||||
| Equity/ Assets | IEA/ IBL | Non-Earn. Assets/ Assets | Quarterly Change in Net Interest Income | ||||||||||||||||||||
Institution | 06/30/08 | 03/31/08 | 12/31/07 | 09/30/07 | 06/30/07 | 03/31/07 | |||||||||||||||||
| (%) | (%) | (%) | (change in net interest income is annualized in basis points) | ||||||||||||||||||||
Ocean Shore Holding Co. | 9.7 | % | 107.4 | % | 4.3 | % | 12 | 5 | 8 | 1 | -2 | -11 | |||||||||||
All Public Companies | 10.8 | % | 108.7 | % | 5.8 | % | 8 | 1 | -2 | -1 | 2 | 2 | |||||||||||
State of NJ | 12.8 | % | 111.3 | % | 5.7 | % | 10 | 2 | 0 | -1 | -5 | 8 | |||||||||||
Comparable Group | |||||||||||||||||||||||
Averages | 10.5 | % | 109.3 | % | 4.3 | % | 11 | -1 | -4 | -1 | 1 | 1 | |||||||||||
Medians | 8.2 | % | 107.7 | % | 4.0 | % | 12 | -2 | -5 | -1 | -7 | 5 | |||||||||||
| Comparable Group | |||||||||||||||||||||||
| ABNJ | American Bancorp of NJ Inc. of NJ | 14.4 | % | 112.5 | % | 5.1 | % | 22 | -2 | 5 | -8 | -7 | -15 | ||||||||||
| ESSA | ESSA Bancorp, Inc. of PA | 21.1 | % | 124.4 | % | 3.5 | % | 13 | -1 | -5 | -3 | 66 | NA | ||||||||||
| ESBK | Elmira Savings Bank, FSB of NY(1) | 6.0 | % | 102.4 | % | 7.2 | % | NA | -2 | -8 | 5 | -2 | 15 | ||||||||||
| FSBI | Fidelity Bancorp, Inc. of PA | 5.9 | % | 104.3 | % | 3.4 | % | 8 | 16 | 10 | 1 | 2 | 10 | ||||||||||
| FKFS | First Keystone Financial, Inc. of PA | 6.5 | % | 102.2 | % | 6.0 | % | 7 | 4 | -7 | 4 | -10 | 12 | ||||||||||
| HARL | Harleysville Savings Fin. Corp. of PA | 5.6 | % | 103.3 | % | 3.5 | % | 24 | 13 | -1 | -1 | -7 | 5 | ||||||||||
| PBCI | Pamrapo Bancorp, Inc. of NJ | 9.7 | % | 110.1 | % | 1.9 | % | 16 | -4 | -9 | 3 | -12 | -6 | ||||||||||
| ROME | Rome Bancorp, Inc. of Rome NY | 19.7 | % | 118.0 | % | 7.2 | % | -10 | -12 | 0 | -11 | -12 | -13 | ||||||||||
| THRD | TF Financial Corp. of Newtown PA | 9.0 | % | 107.1 | % | 4.5 | % | 10 | -6 | -16 | 0 | -6 | -30 | ||||||||||
| WVFC | WVS Financial Corp. of PA(1) | 7.3 | % | 108.3 | % | 0.9 | % | NA | -20 | -5 | -1 | -1 | 34 | ||||||||||
| (1) | Financial information is for the quarter ending March 31, 2008. |
NA=Change is greater than 100 basis points during the quarter.
Source: | Audited and unaudited financial statements, corporate reports and offering circulars, and RP® Financial, LC. calculations. The information provided in this table has been obtained from sources we believe are reliable, but we cannot guarantee the accuracy or completeness of such information. |
Copyright (c) 2008 by RP® Financial, LC.
| RP® Financial, LC. | PEER GROUP ANALYSIS | |
| III. 17 |
Summary
Based on the above analysis, RP Financial concluded that the Peer Group forms a reasonable basis for determining the pro forma market value of OSHC. In those areas where differences exist, these will be addressed in the form of valuation adjustments in the next section.
| RP® Financial, LC. | VALUATION ANALYSIS | |
| IV.1 |
IV. VALUATION ANALYSIS
Introduction
This chapter presents the valuation analysis and methodology used to determine OSHC’s estimated pro forma market value of the common stock to be issued in conjunction with the Second Step Conversion transaction. The valuation incorporates the appraisal methodology promulgated by the Federal and state banking agencies for standard conversions and mutual holding company offerings, particularly regarding selection of the Peer Group, fundamental analysis on both the Company and the Peer Group, and determination of the Company’s pro forma market value utilizing the market value approach.
Appraisal Guidelines
The OTS written appraisal guidelines, originally released in October 1983 and updated in late-1994, and adopted by the FDIC, specify the market value methodology for estimating the pro forma market value of an institution. The valuation methodology provides for: (1) the selection of a peer group of comparable publicly-traded institutions, excluding from consideration institutions which have recently converted, subject to acquisition or in MHC form; (2) a financial and operational comparison of the subject company to the selected peer group, identifying key differences and similarities; and (3) a valuation analysis in which the pro forma market value of the subject company is determined based on the market pricing of the peer group as of the date of valuation, incorporating valuation adjustments for key differences. In addition, the pricing characteristics of recent conversions, both at conversion and in the aftermarket, must be considered.
RP Financial Approach to the Valuation
The valuation analysis herein complies with such regulatory approval guidelines. Accordingly, the valuation incorporates a detailed analysis based on the Peer Group, discussed in Chapter III, which constitutes “fundamental analysis” techniques. Additionally, the valuation incorporates a “technical analysis” of recently completed stock conversions, including closing pricing and aftermarket trading of such offerings. It should be noted that these valuation analyses cannot possibly fully account for all the market forces which impact trading activity and pricing characteristics of a particular stock on a given day.
| RP® Financial, LC. | VALUATION ANALYSIS | |
| IV. 2 |
The pro forma market value determined herein is a preliminary value for the Company’s to-be-issued stock. Throughout the Second Step Conversion process, RP Financial will: (1) review changes in OSHC’s operations and financial condition; (2) monitor OSHC’s operations and financial condition relative to the Peer Group to identify any fundamental changes; (3) monitor the external factors affecting value including, but not limited to, local and national economic conditions, interest rates, and the stock market environment, including the market for thrift stocks; and (4) monitor pending conversion offerings (including those in the offering phase), both regionally and nationally. If material changes should occur during the Second Step Conversion process, RP Financial will evaluate if updated valuation reports should be prepared reflecting such changes and their related impact on value, if any. RP Financial will also prepare a final valuation update at the closing of the Offering to determine if the prepared valuation analysis and resulting range of value continues to be appropriate.
The appraised value determined herein is based on the current market and operating environment for the Company and for all thrifts. Subsequent changes in the local and national economy, the legislative and regulatory environment, the stock market, interest rates, and other external forces (such as natural disasters or major world events), which may occur from time to time (often with great unpredictability) may materially impact the market value of all thrift stocks, including OSHC’s value, or OSHC’s value alone. To the extent a change in factors impacting the Company’s value can be reasonably anticipated and/or quantified, RP Financial has incorporated the estimated impact into the analysis.
Valuation Analysis
A fundamental analysis discussing similarities and differences relative to the Peer Group was presented in Chapter III. The following sections summarize the key differences between the Company and the Peer Group and how those differences affect the pro forma valuation. Emphasis is placed on the specific strengths and weaknesses of the Company relative to the Peer Group in such key areas as financial condition, profitability, growth and viability of earnings, asset growth, primary market area, dividends, liquidity of the shares, marketing of the issue, management, and the effect of government regulations and/or regulatory reform. We have also considered the market for thrift stocks, in particular new issues, to assess the impact on value of the Company coming to market at this time.
| RP® Financial, LC. | VALUATION ANALYSIS | |
| IV. 3 |
| 1. | Financial Condition |
The financial condition of an institution is an important determinant in pro forma market value because investors typically look to such factors as liquidity, capital, asset composition and quality, and funding sources in assessing investment attractiveness. The similarities and differences in the Company’s and the Peer Group’s financial strengths are noted as follows:
| • | Overall A/L Composition. Loans and investments funded by retail deposits were the primary components of the Company’s and Peer Group’s balance sheets. The Company’s interest-earning asset composition exhibited a higher concentration of loans with a greater concentration of residential mortgage loans while the Peer Group’s balance sheet was included modestly greater diversification into high risk weight loans. The Company maintains a stronger core deposit mix, but has also utilized borrowings to a greater extent than the Peer Group. The Company’s ratio of IEA/IBL will improve on a post-offering basis, thereby reversing the current disadvantage. |
| • | Credit Quality. The Company’s credit risk profile appears to be comparatively favorable based on lower NPAs/assets and reserve coverage ratios in relation to NPAs and non-performing loans (“NPLs”) which fall between the Peer Group averages and medians. At the same time, the Peer Group’s credit quality ratios are also relatively strong and their history of loan losses and chargeoffs has been limited. Partially offsetting these positive characteristics, the Peer Group maintains higher reserve coverage than the Company in relation to total loans outstanding and OSHC has a relatively high level of loans secured by rental properties and second homes. |
| • | Balance Sheet Liquidity. The Company operated with a lower level of cash and investment securities relative to the Peer Group (9.5% of assets versus 32.7% for the Peer Group). Following the infusion of stock proceeds, the Company’s cash and investments ratio is expected to increase as the proceeds retained at the holding company level will be initially deployed into investments. The Company’s future borrowing capacity was considered to be comparable to the Peer Group’s capacity given the comparable level of borrowings currently maintained by the Company |
| • | Capital. The Company maintains a tangible equity-to-assets ratio which falls between the Peer Group average and median on a pre-conversion basis. Accordingly, following the stock offering, OSHC’s pro forma capital position will exceed the Peer Group’s tangible equity-to-assets ratio. The increase in the Company’s pro forma capital position will result in greater leverage potential and reduce the level of interest-bearing liabilities utilized to fund assets. At the same time, the Company’s more significant capital surplus will likely suppress the pro forma ROE over the short to intermediate term. |
On balance, OSHC’s balance sheet strength was considered modestly greater relative to the Peer Group and, thus, a slight upward adjustment was applied for the Company’s financial condition.
| RP® Financial, LC. | VALUATION ANALYSIS | |
| IV. 4 |
| 2. | Profitability, Growth and Viability of Earnings |
Earnings are a key factor in determining pro forma market value, as the level and risk characteristics of an institution’s earnings stream and the prospects and ability to generate future earnings heavily influence the multiple that the investment community will pay for earnings. The major factors considered in the valuation are described below.
| • | Reported Earnings. The Company reported a similar level of profitability in comparison to the Peer Group for the most recent 12 months as The Company’s operating results reflect a favorable level of net interest income offset by a relatively high tax rate in comparison to the Peer Group while the ratio of operating expenses and non-interest income as a percent of average assets was relatively comparable to the Peer Group average and medians. |
| • | Core Earnings. Non-operating items are limited for both the Company and the Peer Group. Thus, OSHC’s core earnings are expected to approximate the Peer Group’s on a pro forma basis as the Company’s initial proceeds reinvestment benefit will be at least partially offset by the increased stock benefit plans expense |
| • | Interest Rate Risk. Quarterly changes in the Company’s and the Peer Group’s net interest income to average assets ratios indicated that a slightly higher degree of volatility was associated with the Company’s net interest margin reflecting the fixed rate residential mortgage loans which predominate the Company’s IEA. OSHC’s capital ratios and IEA/IBL ratios were less favorable prior to the Second Step Conversion but the infusion of the offering proceeds will lead to improvement relative to the Peer Group. |
| • | Credit Risk. Factors indicating the Company’s lower credit risk profile include lower loan loss provisions, lower NPAs/assets and lower risk-weighted assets ratio. At the same time, the Company’s ratio of reserves to total loans is below the Peer Group average and OSHC has a relatively high level of loans secured by rental properties and second homes, suggesting the credit risk advantage may be marginal. |
| • | Earnings Growth Potential. The Company’s faster balance sheet growth in comparison to the Peer Group suggests stronger earnings growth potential for the Company. Additionally, recent trends with respect to market interest rates which have led to a reversion to a positively sloped yield curve environment have improved the Company’s interest rate spreads, which may also provide an impetus for earnings growth over the near term. Moreover, management expects that on-going infrastructure investments (i.e., in fixed assets, personnel, etc.) including anticipated branching may enhance the long-term earnings growth potential of the Company. At the same time, such expenditures may depress near-term earnings growth potential through the increased expense until offsetting revenues are realized. |
| • | Return on Equity. The Company’s pro forma capital position will exceed the Peer Group average. Thus, notwithstanding the relatively similar ROA, the Company’s pro forma core ROE is anticipated to be lower than the Peer Group average over the near term. |
Overall, we concluded that a slight upward adjustment for profitability, growth and viability of earnings was appropriate, in view of OSHC similar pro forma ROA as well as the factors relating to the Company’s credit risk and interest rate exposure and earnings growth potential.
| RP® Financial, LC. | VALUATION ANALYSIS | |
| IV. 5 |
| 3. | Asset Growth |
The Company’s recent asset growth exceeded the Peer Group average, reflecting the Company’s efforts to support earnings through leveraging equity, which has primarily been centered on loan portfolio growth. On a pro forma basis, the Company should have the equity to facilitate continued growth and expansion. On balance, we believe a slight upward adjustment was warranted for this factor.
| 4. | Primary Market Area |
The general condition of a financial institution’s market area has an impact on value, as future success is in part dependent upon opportunities for profitable activities in the local market area. Operating in the southern New Jersey shore area, the Company faces significant competition for loans and deposits from larger financial institutions, which provide a broader array of services and have significantly larger branch networks.
Demographic and economic trends and characteristics in the Company’s primary market area are relatively favorable to the primary market areas served by the Peer Group companies (see Table 4.1) with growth rates equal to or exceeding the Peer Group averages and medians. At the same time, while per capita income levels for Cape May County exceeded the Peer Group average and median, Atlantic County per capita income levels fell short of the Peer Group average and median.
The deposit market share exhibited by the Company fell within the Peer Group range. As shown in Table 4.1, the Atlantic County unemployment rate fell within the range exhibited by the Peer Group but was above the Peer Group average of 5.4%. While the Cape May County unemployment rate was only 5.4% in June 2008, there is a significant element of seasonality given the many summer jobs available; the winter unemployment rate frequently is in double digits in Cape May County in the winter.
On balance, we concluded that a no adjustment was appropriate for the Company’s market area.
| RP® Financial, LC. | VALUATION ANALYSIS | |
| IV. 6 |
Table 4.1
Ocean Shore Holding Company
Peer Group Market Area Comparative Analysis
| Estimated Population | Projected Population 2012 | Estimated 2000-2007 % Change | Projected 2007-2012 % Change | Per Capita Income | 6/30/07 Deposit Market Share(1) | Unemployment Rate 6/30/2008 | ||||||||||||||||||||
Institution | Headquarters County | 2000 | 2007 | Amount | % State Average | |||||||||||||||||||||
| (000) | (000) | (000) | ||||||||||||||||||||||||
American Bancorp of NJ Inc. of NJ | Essex | 794 | 808 | 818 | 1.84 | % | 1.23 | % | $ | 31,402 | 88.81 | % | 2.64 | % | 6.7 | % | ||||||||||
Elmira Svgs Bank, FSB of NY | Chemung | 91 | 90 | 88 | -1.61 | % | -1.40 | % | $ | 23,585 | 75.80 | % | 20.50 | % | 5.4 | % | ||||||||||
ESSA Bancorp, Inc. of PA | Monroe | 139 | 172 | 200 | 23.91 | % | 16.12 | % | $ | 25,034 | 90.70 | % | 18.95 | % | 5.9 | % | ||||||||||
Fidelity Bancorp, Inc. of PA | Allegheny | 1,282 | 1,241 | 1,211 | -3.18 | % | -2.43 | % | $ | 29,961 | 108.55 | % | 0.74 | % | 5.0 | % | ||||||||||
First Keystone Fin., Inc. of PA | Delaware | 551 | 562 | 569 | 2.07 | % | 1.20 | % | $ | 33,393 | 120.98 | % | 3.38 | % | 5.1 | % | ||||||||||
Harleysville Svgs Fin Cp of PA | Montgomery | 750 | 790 | 818 | 5.26 | % | 3.58 | % | $ | 41,542 | 150.50 | % | 1.65 | % | 4.4 | % | ||||||||||
Pamrapo Bancorp, Inc. of NJ | Hudson | 609 | 622 | 631 | 2.10 | % | 1.47 | % | $ | 27,379 | 77.43 | % | 1.88 | % | 6.5 | % | ||||||||||
Rome Bancorp, Inc. of Rome, NY | Oneida | 235 | 235 | 236 | -0.16 | % | 0.19 | % | $ | 23,798 | 76.48 | % | 5.47 | % | 5.2 | % | ||||||||||
TF Fin. Corp. Of Newtown, PA | Bucks | 598 | 638 | 668 | 6.78 | % | 4.64 | % | $ | 37,687 | 136.54 | % | 1.60 | % | 4.6 | % | ||||||||||
WVS Financial Corp. of PA | Allegheny | 1,282 | 1,241 | 1,211 | -3.18 | % | -2.43 | % | $ | 29,961 | 108.55 | % | 0.29 | % | 5.0 | % | ||||||||||
| Averages: | 633 | 640 | 645 | 3.38 | % | 2.22 | % | $ | 30,374 | 103.43 | % | 5.71 | % | 5.4 | % | |||||||||||
| Medians: | 603 | 630 | 649 | 1.96 | % | 1.21 | % | $ | 29,961 | 99.62 | % | 2.26 | % | 5.2 | % | |||||||||||
Ocean Shore Holding Company | Cape May | 102 | 106 | 108 | 3.35 | % | 2.50 | % | $ | 31,409 | 88.83 | % | 8.22 | % | 5.4 | % | ||||||||||
| Atlantic | 253 | 281 | 302 | 11.09 | % | 7.77 | % | $ | 26,034 | 73.63 | % | 4.52 | % | 6.3 | % | |||||||||||
| (1) | Total institution deposits in headquarters county as percent of total county deposits (banks and thrifts only). |
Sources: SNL, FDIC, US Dept. of Labor.
| RP® Financial, LC. | VALUATION ANALYSIS | |
| IV. 7 |
| 5. | Dividends |
OSHC has indicated its preliminary intent to pay dividends in an amount such that current minority shareholders of OSHC will continue to receive the same total cash dividend payment, with the per share dividend amount adjusted for the exchange ratio in the Second Step Conversion. At the current midpoint valuation, the annual dividend payment would equal $0.19 per share and provide a yield of 2.12% based on the $10.00 per share initial Offering price (i.e., reflects the stated intent to maintain the current dividend of $0.20 per share adjusted for the exchange ratio to minority shareholders). However, future declarations of dividends by the Board of Directors will depend upon a number of factors, including investment opportunities, growth objectives, financial condition, profitability, tax considerations, minimum capital requirements, regulatory limitations, stock market characteristics and general economic conditions.
Nine out of the ten of the Peer Group companies pay regular cash dividends, with implied dividend yields ranging from 1.19% to 5.93%. The average dividend yield on the stocks of the Peer Group institutions was 3.71% as of August 22, 2008, representing an average payout ratio of 38.8% of earnings. As of August 22, 2008, approximately 76% of all fully-converted publicly-traded thrifts had adopted cash dividend policies (see Exhibit IV-1) exhibiting an average yield of 3.0% and an average payout ratio of 40.9% of earnings. The dividend paying thrifts generally maintain higher than average profitability ratios, facilitating their ability to pay cash dividends.
The Company’s indicated dividend policy provides for a modestly lower yield compared to the yield provided by the Peer Group. While the Company’s implied payout ratio of 37.79% of pro forma earnings at the midpoint is similar to the Peer Group’s payout ratio, the Company’s ability to pay a dividend is supported by its higher pro forma equity ratio and expectations that the Company will seek to increase earnings through growth. Accordingly, on balance, we concluded that no adjustment was warranted for purposes of the Company’s dividend policy.
| 6. | Liquidity of the Shares |
The Peer Group is by definition composed of companies that are traded in the public markets. All ten of the Peer Group companies trade on the NASDAQ system. Typically, the number of shares outstanding and market capitalization provides an indication of how much liquidity there will be in a particular stock. The market capitalization of the Peer Group companies ranged from $24.3 million to $225.8 million as of August 22, 2008, with average and
| RP® Financial, LC. | VALUATION ANALYSIS | |
| IV. 8 |
median market values of $71.3 million and $52.7 million, respectively. The shares issued and outstanding to the public shareholders of the Peer Group members ranged from 1.9 million to 16.8 million, with average and median shares outstanding equaling 5.6 million and 3.9 million, respectively. The Company’s pro forma market value and shares outstanding for the Company will modestly exceed the Peer Group average and median, but falls within the Peer Group range. The Company’s shares will continue to be traded on NASDAQ following the Second Step Conversion and overall, we believe the liquidity in the Company’s stock will be relatively similar to the liquidity of the Peer Group’s shares. Accordingly, we have applied no adjustment for this factor.
| 7. | Marketing of the Issue |
We believe that four separate markets need to be considered for thrift stocks such as the Company coming to market: (1) the after-market for public companies, in which trading activity is regular and investment decisions are made based upon financial condition, earnings, capital, ROE, dividends and future prospects; (2) the new issue market in which converting thrifts are evaluated on the basis of the same factors, but on a pro forma basis without the benefit of prior operations as a fully-converted publicly-held company and stock trading history; (3) the acquisition market for thrift franchises in New Jersey; and (4) the market for the public stock of the Company. All of these market factors were considered in the valuation of the Company’s to-be-issued stock.
| A. | The Public Market |
The value of publicly-traded thrift stocks is easily measurable, and is tracked by most investment houses and related organizations. Exhibit IV-1 provides pricing and financial data on all publicly-traded thrifts. In general, thrift stock values react to market stimuli such as interest rates, inflation, perceived industry health, projected rates of economic growth, regulatory issues and stock market conditions in general. Exhibit IV-2 displays historical stock market trends for various indices and includes historical stock price index values for thrifts and commercial banks. Exhibit IV-3 displays historical stock price indices for thrifts only.
In terms of assessing general stock market conditions, the performance of the overall stock market has been mixed over the past year. A disappointing employment report for August 2007, which showed a drop in jobs for the first time in four years, caused stocks to plummet in early-September. However, upbeat news about consumer demand boosted stocks
| RP® Financial, LC. | VALUATION ANALYSIS | |
| IV. 9 |
in mid-September ahead of the Federal Reserve meeting. Stocks soared on news of the Federal Reserve’s decision to cut the federal funds rate by a half of percentage point rate, which exceeded the quarter point rate cut most economists had expected. The larger than expected rate cut generally sustained the positive trend in the broader stock market through the end of the third quarter.
The DJIA started the fourth quarter of 2007 soaring to a record high, which was followed by an uneven market for stocks going into mid-October amid uncertainty over forthcoming third quarter earnings reports. Lackluster earnings and credit concerns sparked a mid-October sell-off, as Standard & Poor’s reduced its rating on more than 1,400 types of residential mortgage-backed securities. Stocks rebounded somewhat in late-October, supported by some good third quarter earnings in the technology sector and the Federal Reserve’s decision to cut rates by a quarter point as expected. Fresh concerns about problems in the credit markets becoming worse, fears of soaring energy prices and the dollar falling caused stocks to plummet in early-November. Following a close below 13000, the DJIA had a one day rebound of over 300 points on bargain hunting. Stocks pulled back heading into the second half of November, reflecting concerns that the weak housing market would depress consumer spending and expectations of more write-downs to be taken on risky debt. Stocks rebounded in late-November and early-December, amid growing expectations that the Federal Reserve would cut rates at its mid-December meeting. News of a 0.25% rate cut by the Federal Reserve sent stocks sharply lower in mid-December 2007, as some investors had hoped for a more significant rate cut. Credit worries and downgrades of several bellwether stocks also contributed to the mid-December pullback in the broader stock market. Weak economic data and expectations that fourth quarter earnings would reflect more large write-downs of subprime mortgage debt by some of the world’s largest banks weighed on stocks in year end trading.
The downward trend in stocks continued at the start of 2008, as mounting concerns about the economy, higher oil prices and news of more large write-downs taken on subprime mortgages and debt all contributed to the negative sentiment in the stock market. IBM’s strong earnings report for the fourth provided a boost to the stock market in mid-January. Stocks tumbled sharply lower heading into the second half of January on investors’ fears of more damage to come from the subprime mortgage crisis following huge fourth quarter losses reported by Citigroup and Merrill Lynch. A surprise 0.75% rate cut by the Federal Reserve on January 22, 2008 helped to limit damage from the prior day’s sell-off in the global markets, which was spurred by fears that a U.S. recession would slow economic growth in the foreign
| RP® Financial, LC. | VALUATION ANALYSIS | |
| IV. 10 |
markets as well. News of a possible bond-insurance bailout triggered a sharp mid-day rebound in the DJIA the day following the rate cut, as the DJIA recovered almost 600 points from morning lows and closed up almost 300 points for the day. Following three consecutive sessions of gains, stocks closed lower at the end of the week on profit taking. Some positive economic data and a second rate cut by the Federal Reserve in nine days helped the broader stock market to close out January on an upbeat note.
Recession fears, fueled by a decline in January service-sector activity, triggered a broad based sell-off in the stock market in early-February 2008. A favorable retail sales report for January helped stocks to rebound in mid-January, which was followed by a downward trend heading into late-February amid higher oil prices, more weak economic data and signs of stagflation. Following a brief rally, stocks plunged at the end of February on concerns about the ongoing credit crisis and rising oil prices. Escalating problems in the bond market and weak economic data, which included job losses in the February employment report and a record number of homes entering foreclosure in the fourth quarter, extended the downturn in the broader stock market during the first part of March. Stocks soared higher heading into mid-March after the Federal Reserve said it would lend Wall Street $200 billion in a move aimed at taking difficult to trade securities temporarily out of circulation. The stock market experienced heightened volatility in mid-March, with the DJIA swinging significantly higher or lower on a daily basis. Stocks declined sharply on news of Bear Stearns’ collapse, which was followed by a more than 400 point increase in the DJIA. The surge in stocks was supported by the Federal Reserve cutting its target rate by 0.75% to 2.25% and Goldman Sachs and Lehman Brothers reporting better than expected earnings. Stocks tumbled the following day, with the DJIA declining by almost 300 points on renewed worries about the economy. Led by financial stocks, the stock market rebounded strongly heading into late-March. Major contributors to the rally in financial stocks were Fannie Mae and Freddie Mac, which rebounded on easing of regulatory constraints, and J.P. Morgan’s increased bid for Bear Stearns from $2 a share to $10 a share. Concerns about the broader economy pressured stocks lower at the close of the first quarter. Overall, the first quarter of 2008 was the worst quarter for the DJIA in five and one-half years, as a 7.6% decline was recorded in the DJIA for the first quarter.
Stocks surged higher at the start of the second quarter of 2008, with the DJIA posting a gain of almost 400 points on news that two major financial firms with significant credit risk issues took steps with to shore up their capital. Uncertainty over first quarter earnings reports provided for a narrow trading range heading in mid-April, which was followed by a
| RP® Financial, LC. | VALUATION ANALYSIS | |
| IV. 11 |
downturn in the broader stock market. Stocks retreated after a disappointing first quarter earnings report from General Electric stoked concerns about the health of both corporate profits and the economy in general. Some better-than-expected first quarter earnings reports provided a boost to stocks in mid-April, which was followed by a narrow trading range through the end of April amid mixed earnings reports and the Federal Reserve’s decision to cut its target rate by 0.25% as expected. The broader stock market started May on a positive note, but then led by a sell-off in financial stocks reversed course heading into mid-May. Higher oil prices and ongoing concerns of eroding credit quality contributed to the decline in financial stocks. The broader stock market showed a positive trend heading into mid-May, which was supported by a slight decline in oil prices and encouraging inflation numbers reflected in the April data for consumer prices. Soaring oil prices and growing concerns about inflation triggered a sell-off in the broader stock heading into the second half of May. A downward trend in the broader stock market prevailed in the second half of May and into early-June, amid concerns about more credit-related losses forecasted for the financial sector and soaring oil prices. Following a one day rebound on surprisingly strong retail sales data for May, a spike in the May unemployment rate accelerated the early-June slide in stocks. Led by a decline in financial shares, the downward trend in stocks prevailed through most of June. The DJIA hit a 2008 low in late-June, as stocks plunged following downgrades of brokerage and automotive stocks and a jump in oil prices.
Selling pressure in the broader market continued into the first half of July 2008, as financial stocks led the downturn on worries about earnings and the economy. For the first time in two years, the DJIA closed below 11000 in mid-July as bank stocks led the market lower following the takeover of IndyMac Bancorp by the FDIC. Led by a rally in financial stocks, stocks rebounded heading into the second half of July. Better-than-expected earnings by some of the major banks and a drop in oil prices below a $130 a barrel were noteworthy contributors to the rally. Led by a sell-off in financial shares, stocks tumbled in late-July on more bad news about the housing market. Stocks rallied at the end on July as investors moved into beaten up financial stocks on hopes that the credit crisis was nearing an end. Lower oil prices and reassuring signals coming out of the Federal Reserve meeting provided a boot to stock in early-August. Volatility in financial stocks prevailed on the broader stock market in mid-August, as concerns about more write-downs plagued the financial sector. On August 22, 2008, the DJIA closed at 11628.06, a decrease of crease of 12.4% year-to-date and 12.1% from one year ago, and the NASDAQ closed at 2414.71, a decrease of 6.3% from one year ago and a decrease of 9.0% year-to-date. The Standard & Poor’s 500 Index closed at 1292.20 on August 22, 2008, a decrease of 12.7% from one year ago and a decrease of 12.0% year-to-date.
| RP® Financial, LC. | VALUATION ANALYSIS | |
| IV. 12 |
The market for thrift stocks has been mixed during the past 12 months, but, in general, thrift stocks have underperformed the broader stock market. The weaker-than-expected employment report for August 2007 depressed thrift issues in early-September, but thrift stocks bounced back in mid-September. The recovery in thrift stocks was aided by news that Countrywide Financial had arranged for an additional $12 billion of secured borrowings. Thrift stocks rallied on news of the larger than expected 50 basis rate cut by the Federal Reserve, although the positive trend in thrift stocks was not sustained through the end of the third quarter. The pull back in thrift stocks reflected ongoing concerns over the weak housing market and the anticipated rise in credit quality related losses that were expected to be seen in third quarter earnings reports.
Thrift stocks traded in a narrow range at the start of the fourth quarter of 2007, but then headed lower in mid-October. The downturn was led by thrifts with exposure to the subprime market, as those institutions reported larger than expected credit losses for the third quarter. The as expected quarter point rate cut by the Federal Reserve helped thrift stocks to stabilize in late-October, although the sell-off in thrift equities resumed in early-November. Institutions with exposure to the subprime mortgage market continued to lead the downturn, as Washington Mutual’s stock plunged on expectations that it would continue to experience significant credit losses in 2008. Beaten down thrift stocks recovered modestly going into mid-November, but the downturn resumed on worries over further deterioration in the subprime market and the depressed housing market. Freddie Mac’s significantly larger-than-expected loss for the third quarter prompted further selling in thrift stocks heading into late-November. Hopes for a rate cut at the next Federal Reserve meeting boosted the thrift sector in late-November. Thrift stocks traded in narrow range in the first week of December, as investors awaited the outcome of the forthcoming Federal Reserve meeting. The mid-December downturn in the broader market following the Federal Reserve’s decision to lower rates a quarter point was evidenced in the thrift sector as well. In contrast to the broader stock market, thrift stocks continued to trade lower the day following the rate cut. The weak housing market, as reflected by a sharp drop in home prices and a drop-off in mortgage application volume, along with inflation worries and predictions of massive write-downs that would be recorded in the fourth quarter were noted factors that depressed thrift stocks through the end of December.
| RP® Financial, LC. | VALUATION ANALYSIS | |
| IV. 13 |
The downward spiral in thrift stocks continued at the beginning of 2008, particularly the stocks of those institutions with significant exposure to the subprime mortgage market such as Countrywide and Washington Mutual. Thrift stocks in general were also hurt by weak housing data and the growing prospects that the housing slump would continue throughout 2008. News of a rise in mortgage delinquencies at Countrywide and rumors of Countrywide going into bankruptcy further contributed to the slide in thrift stocks heading into mid-January. The announced acquisition of Countrywide by Bank of America had little impact on thrift stocks in general. Earnings related worries depressed thrift stocks heading into the second half of January, reflecting expectations that more significant credit quality related losses would be a widespread factor in the fourth quarter earnings reports for thrift institutions in general. Thrift stocks moved higher on the surprise rate cut by the Federal and then spiked higher along with the broader stock market the day following the rate cut. Consistent with the broader stock market, thrift stocks traded lower at the end of the week. For the balance of January and through most of February, thrift stocks generally paralleled trends in the broader market. Financial stocks led the broader market lower at the end of February and into the first part of March, as worries about the health of key financial companies escalated. Shares of thrift stocks were among the hardest hit, as investors dumped thrift stocks in conjunction with a sharp sell-off in the stocks of Fannie Mae and Freddie Mac amid fears that defaults would force them to raise more capital. News of the Federal Reserve’s $200 billion liquidity program sent thrift stocks sharply higher heading into mid-March. Thrift stocks participated in the day-to-day swings experienced in the broader stock market during mid-March, as investors assessed the outlook for mortgage lenders in a slumping market for housing and the possibility of the economy going into recession. The rebound in the stocks of Fannie Mae and Freddie Mac provided a healthy boost to thrift stocks heading into late-March, while troubling economic data and warnings of further write downs pulled thrift stocks lower along with the broader stock market at the close of the first quarter.
Thrift stocks surged higher in conjunction with the broader stock market at the start of the second quarter of 2008, as UBS and Lehman Brothers announced plans to bolster their capital to offset huge losses recorded from writing down troubled investments. A weaker-than-expected employment report for March depressed thrift stocks in early-April, although thrift stocks bounced back on news that Washington Mutual was in discussions to raise $5 billion from private equity-led investors. Thrift stocks drifted lower heading into mid-April in anticipation of first quarter earnings remaining depressed by more write downs on mortgages and
| RP® Financial, LC. | VALUATION ANALYSIS | |
| IV. 14 |
mortgage- related securities. Bargain hunting and some positive first quarter earnings events provided a modest boost to thrift stocks in late-April, while thrift stocks edged lower on news of the Federal Reserve rate cut at the end of April. Calmer credit markets and a better-than-expected employment report for April were somewhat offset by a cut in Countrywide’s credit rating, as thrift stocks traded unevenly at the beginning of May. Higher oil prices and more negative news reported by financial institutions pressured thrift stocks lower going into mid-May. Thrift stocks edged higher along with the broader stock market heading into mid-May and then reversed course on inflation worries, higher oil prices and more weak data coming from the housing sector. In late-May 2008 and early-June, thrift shares settled into a narrow trading range and then sold off along with the broader stock market on news of the spike in the May unemployment rate. Thrift prices deteriorated further heading into mid-June on concerns of mounting credit-related losses as mortgage delinquencies and foreclosures continued to surpass record levels. Following a mild rebound in mid-June, thrift shares tumbled lower at the end of the second quarter as financial shares were pummeled by downgrades by Wall Street analysts and second quarter profit worries.
The downturn in thrift stocks continued in at the start of the third quarter of 2008, with projected second quarter losses becoming more widespread among thrift stocks. Fannie Mae and Freddie Mac dropped to their lowest levels in more than 14 years, as concerns grew about their capital positions. Thrift stocks rallied strongly on comments by the Federal Reserve Chairman that outlined measures to shore up mortgage lending and help markets operate smoothly, but the one-day rally was quickly wiped out by fears about bank stability and the future of the mortgage market heading into mid-July. Most notably, the sell-off in thrift shares was fueled by the failure of IndyMac Bancorp and growing concerns about the solvency of Fannie Mae and Freddie Mac. The sell-off was followed by a sharp rebound in thrift stocks, as some major banks posted better-than-expected earnings and Freddie Mac considered a major stock sale that would have the potential to avoid implementation of a government rescue plan. Weak data for June existing home sales re-ignited fears about the credit crunch and sent thrift stocks sharply lower in late-July. Thrift stocks rebounded along with the broader financial sector at the end of July, with the upward momentum sustained in early-August as investors responded favorably to the outcome of the Federal Reserve meeting and its decision to hold the target rate steady. Concerns of falling home prices resulting in more write-downs pushed thrift stocks lower in mid-August. On August 22, 2008, the SNL Index for all publicly-traded thrifts closed at 839.9, a decrease of 46.2% from one year ago and a decrease of 20.6% year-to-date.
| RP® Financial, LC. | VALUATION ANALYSIS | |
| IV. 15 |
B.The New Issue Market
In addition to thrift stock market conditions in general, the new issue market for converting thrifts is also an important consideration in determining the Company’s pro forma market value. The new issue market is separate and distinct from the market for seasoned thrift stocks in that the pricing ratios for converting issues are computed on a pro forma basis, specifically: (1) the numerator and denominator are both impacted by the conversion offering amount, unlike existing stock issues in which price change affects only the numerator; and (2) the pro forma pricing ratio incorporates assumptions regarding source and use of proceeds, effective tax rates, stock plan purchases, etc. which impact pro forma financials, whereas pricing for existing issues are based on reported financials. The distinction between pricing of converting and existing issues is perhaps no clearer than in the case of the price/book (“P/B”) ratio in that the P/B ratio of a converting thrift will typically result in a discount to book value whereas in the current market for existing thrifts the P/B ratio often reflects a premium to book value. Therefore, it is appropriate to also consider the market for new issues, both at the time of the conversion and in the aftermarket.
The market for recent conversions has pulled back along with the thrift sector in general, with a number of the recent offerings being undersubscribed and typically reflecting only modest price appreciation or, in some cases, trading below their IPO prices in initial after market trading activity. No standard conversions have been completed during the past three months. Home Federal Bancorp of Louisiana, which was seeking to complete a second-step conversion, terminated its offering on August 14, 2008 as stock orders were not sufficient to reach the minimum of the offering range. BCSB Bancorp was the only company to complete a second-step conversion offering in 2008, which closed at a pro forma P/TB of 63.6% and was trading 10% above its IPO price as of August 22, 2008.
As shown in Table 4.2, one mutual holding company offering was completed during the past three months. Auburn Bancorp’s mutual holding company offering was closed at the minimum of the valuation range, raising gross proceeds of $2.3 million. Auburn Bancorp’s mutual holding company offering closed at a pro forma P/TB ratio of 62.0%. Based on closing stock market prices as of August 22, 2008, Auburn Bancorp’s stock price was 5.0% below its IPO price.
| RP® Financial, LC. | VALUATION ANALYSIS | |
| IV. 16 |
Table 4.2
Pricing Characteristics and After-Market Trends
Recent Conversions Completed (Last Three Months)
Institutional Information | Pre-Conversion Data | Offering Information | Contribution to Charitable Found. | Insider Purchases | ||||||||||||||||||||||||||||||||||||||||
| Financial Info. | Asset Quality | % Off Incl. Fdn. | ||||||||||||||||||||||||||||||||||||||||||
| Benefit Plans | ||||||||||||||||||||||||||||||||||||||||||||
Institution | Conver. Date | Ticker | Assets ($Mil) | Equity/ Assets (%) | NPAs/ Assets (%) | Res. Cov. (%) | Gross Proc. ($Mil.) | % Offered (%) | % of Mid. (%) | Exp./ Proc. (%) | Form | % of Offering (%) | ESOP (%) | Recog. Plans (%) | Stk Option (%) | Mgmt. & Dirs. (%)(2) | ||||||||||||||||||||||||||||
Mutual Holding Company Conversions Auburn Bancorp, Inc., ME | 8/19/08 | ABBB-OTCBB | $ | 65 | 6.92 | % | 0.19 | % | 376 | % | $ | 2.3 | 45 | % | 85 | % | 29.6 | % | N.A. | N.A. | 7.6 | % | 3.3 | % | 10.9 | % | 6.6 | % | ||||||||||||||||
Averages—Mutual Holding Company Conversions: | $ | 65 | 6.92 | % | 0.19 | % | 376 | % | $ | 2.3 | 45 | % | 85 | % | 29.6 | % | NA | NA | 7.6 | % | 3.3 | % | 10.9 | % | 6.6 | % | ||||||||||||||||||
Medians—Mutual Holding Company Conversions: | $ | 65 | 6.92 | % | 0.19 | % | 376 | % | $ | 2.3 | 45 | % | 85 | % | 29.6 | % | NA | NA | 7.6 | % | 3.3 | % | 10.9 | % | 6.6 | % | ||||||||||||||||||
Institutional Information | Pro Forma Data | Post-IPO Pricing Trends | |||||||||||||||||||||||||||||||||||||||||||||
| Pricing Ratios(3) | Financial Charac. | Closing Price: | |||||||||||||||||||||||||||||||||||||||||||||
Institution | Initial Dividend Yield (%) | P/TB (%) | Core P/E (x) | P/A (%) | Core ROA (%) | TE/A (%) | Core ROE (%) | IPO Price ($) | First Trading Day ($) | % Change (%) | After First Week (4) ($) | % Change (%) | After First Month (5) ($) | % Change (%) | Thru 8/22/08 ($) | % Change (%) | |||||||||||||||||||||||||||||||
Mutual Holding Company Conversions Auburn Bancorp, Inc., ME | 0.00 | % | 61.5 | % | 26.1x | 7.3 | % | 0.3 | % | 8.8 | % | 3.4 | % | $ | 10.00 | $ | 10.50 | 5.0 | % | $ | 9.50 | -5.0 | % | $ | 9.50 | -5.0 | % | $ | 9.50 | -5.0 | % | ||||||||||||||||
Averages—Mutual Holding Company Conversions: | 0.00 | % | 61.5 | % | 26.1x | 7.3 | % | 0.3 | % | 8.8 | % | 3.4 | % | $ | 10.00 | $ | 10.50 | 5.0 | % | $ | 9.50 | -5.0 | % | $ | 9.50 | -5.0 | % | $ | 9.50 | -5.0 | % | ||||||||||||||||
Medians—Mutual Holding Company Conversions: | 0.00 | % | 61.5 | % | 26.1x | 7.3 | % | 0.3 | % | 8.8 | % | 3.4 | % | $ | 10.00 | $ | 10.50 | 5.0 | % | $ | 9.50 | -5.0 | % | $ | 9.50 | -5.0 | % | $ | 9.50 | -5.0 | % | ||||||||||||||||
Note: *—Appraisal performed by RP Financial;BOLD=RP Financial did the Conversion Business Plan. “NT”—Not Traded; “NA”—Not Applicable, Not Available; C/S-Cash/Stock.
| (1) | Non-OTS regulated thrift. |
| (2) | As a percent of MHC offering for MHC transactions. |
| (3) | Does not take into account the adoption of SOP 93-6. |
| (4) | Latest price if offering is less than one week old. |
| (5) | Latest price if offering is more than one week but less than one month old. |
| (6) | Mutual holding company pro forma data on full conversion basis. |
| (7) | Simultaneously completed acquisition of another financial institution. |
| (8) | Simultaneously converted to a commercial bank charter. |
| (9) | Former credit union. |
August 22, 2008
| RP® Financial, LC. | VALUATION ANALYSIS | |
| IV. 17 |
C.The Acquisition Market
Also considered in the valuation was the potential impact on OSHC’s stock price of recently completed and pending acquisitions of other thrift institutions operating in New Jersey. As shown in Exhibit IV-4, there were five thrift acquisitions completed from the beginning of 2005 through August 22, 2008, and there are no currently pending savings institution acquisitions. The recent acquisition activity involving five New Jersey savings institutions may imply a certain degree of acquisition speculation for the Company’s stock. To the extent that acquisition speculation may impact the Company’s offering, we have largely taken this into account in selecting companies for the Peer Group which operate in markets that have experienced a comparable level of acquisition activity as the Company’s market and, thus, are subject to the same type of acquisition speculation that may influence OSHC’s stock. However, since converting thrifts are subject to a three-year regulatory moratorium from being acquired, acquisition speculation in OSHC’s stock would tend to be less compared to the stocks of the Peer Group companies.
D.Trading in OSHC’s Stock
Since OSHC’s minority stock currently trades under the symbol “OSHC” on the NASDAQ national stock market, RP Financial also considered the recent trading activity in the valuation analysis. OSHC had a total of 8,323,374 shares issued and outstanding at August 22, 2008, of which 3,562,374 shares were held by public shareholders and traded as public securities. As of August 22, 2008, the Company’s closing stock price was $10.22 per share, implying an aggregate value of $85,064,882. There are significant differences between the Company’s minority stock (currently being traded) and the conversion stock that will be issued by the Company. Such differences include different liquidity characteristics (the new conversion stock will be more liquid owing to larger number of public shares available to trade) and a different return on equity for the conversion stock. Since the pro forma impact has not been publicly disseminated to date, it is appropriate to discount the current trading level. As the pro forma impact is made known publicly, the trading level will become more informative.
* * * * * * * * * * *
In determining our valuation adjustment for marketing of the issue, we considered trends in both the overall thrift market, the new issue market including the new issue market for thrift conversions, the local acquisition market for thrift stocks and recent trading activity in the
| RP® Financial, LC. | VALUATION ANALYSIS | |
| IV. 18 |
Company’s minority stock. Taking these factors and trends into account, RP Financial concluded that a moderate downward adjustment was appropriate in the valuation analysis for purposes of marketing of the issue.
| 8. | Management |
OSHC’s management team appears to have experience and expertise in all of the key areas of the Company’s operations. Exhibit IV-5 provides summary resumes of OSHC’s Board of Directors and senior management. The financial characteristics of the Company suggest that the Board and senior management have been effective in implementing an operating strategy that can be well managed by the Company’s present organizational structure. The Company currently does not have any senior management positions that are vacant.
Similarly, the returns, capital positions, and other operating measures of the Peer Group companies are indicative of well-managed financial institutions, which have Boards and management teams that have been effective in implementing competitive operating strategies. Therefore, on balance, we concluded no valuation adjustment relative to the Peer Group was appropriate for this factor.
| 9. | Effect of Government Regulation and Regulatory Reform |
In summary, as a fully-converted OTS regulated institution, OSHC will operate in substantially the same regulatory environment as the Peer Group members — all of whom are adequately capitalized institutions and are operating with no apparent restrictions. Exhibit IV-6 reflects the Company’s pro forma regulatory capital ratios. On balance, no adjustment has been applied for the effect of government regulation and regulatory reform.
| RP® Financial, LC. | VALUATION ANALYSIS | |
| IV. 19 |
Summary of Adjustments
Overall, based on the factors discussed above, we concluded that the Company’s pro forma market value should reflect the following valuation adjustments relative to the Peer Group:
Key Valuation Parameters: | Valuation Adjustment | |
| Financial Condition | Slight Upward | |
| Profitability, Growth and Viability of Earnings | Slight Upward | |
| Asset Growth | Slight Upward | |
| Primary Market Area | No Adjustment | |
| Dividends | No Adjustment | |
| Liquidity of the Shares | No Adjustment | |
| Marketing of the Issue | Moderate Downward | |
| Management | No Adjustment | |
| Effect of Govt. Regulations and Regulatory Reform | No Adjustment |
Valuation Approaches
In applying the accepted valuation methodology promulgated by the OTS and adopted by the FDIC, i.e., the pro forma market value approach, including the fully-converted analysis described above, we considered the three key pricing ratios in valuing the Company’s to-be-issued stock – price/earnings (“P/E”), price/book (“P/B”), and price/assets (“P/A”) approaches — all performed on a pro forma basis including the effects of the stock proceeds. In computing the pro forma impact of the Second Step Conversion and the related pricing ratios, we have incorporated the valuation parameters disclosed in OSHC’s prospectus for Offering expenses, reinvestment rate, effective tax rate and stock benefit plan assumptions (summarized in Exhibits IV-7 and IV-8).
RP Financial’s valuation placed an emphasis on the following:
| • | P/E Approach. The P/E approach is generally the best indicator of long-term value for a stock. Given the similarities between the Company’s and the Peer Group’s operating strategies, earnings composition and overall financial condition, the P/E approach was carefully considered in this valuation. At the same time, since reported earnings for both the Company and the Peer Group included certain non-recurring items, we also made adjustments to earnings to arrive at core earnings estimates for the Company and the Peer Group and resulting price/core earnings ratios. |
| • | P/B Approach. P/B ratios have generally served as a useful benchmark in the valuation of thrift stocks, particularly in the context of a public offering, as |
| RP® Financial, LC. | VALUATION ANALYSIS | |
| IV. 20 |
the earnings approach involves assumptions regarding the use of proceeds. RP Financial considered the P/B approach to be a useful indicator of pro forma value, taking into account the pricing ratios under the P/E and P/A approaches. We have also modified the P/B approach to exclude the impact of intangible assets (i.e., price/tangible book value or “P/TB”), in that the investment community frequently makes this adjustment in its evaluation of this pricing approach. |
| • | P/A Approach. P/A ratios are generally a less reliable indicator of market value, as investors typically assign less weight to assets and attribute greater weight to book value and earnings—we have also given less weight to the assets approach. Furthermore, this approach as set forth in the regulatory valuation guidelines does not take into account the amount of stock purchases funded by deposit withdrawals, thus understating the pro forma P/A ratio. At the same time, the P/A ratio is an indicator of franchise value, and, in the case of highly capitalized institutions, high P/A ratios may limit the investment community’s willingness to pay market multiples for earnings or book value when ROE is expected to be low. |
| • | Trading of OSHC stock. Converting institutions generally do not have stock outstanding. OSHC, however, has public shares outstanding due to the mutual holding company form of ownership. Since OSHC is currently traded on NASDAQ, it is an indicator of investor interest in the Company’s conversion stock and therefore received some weight in our valuation. Based on the August 22, 2008 stock price of $10.22 per share and the 8,323,374 shares of OSHC stock outstanding, the Company’s implied market value of $85.1 million was considered in the valuation process. However, since the conversion stock will have different characteristics than the minority shares, and since pro forma information has not been publicly disseminated to date, the current trading price of OSHC’s stock was somewhat discounted herein and may become more informative towards the closing of the Offering. |
The Company has adopted Statement of Position (“SOP”) 93-6, which causes earnings per share computations to be based on shares issued and outstanding excluding unreleased ESOP shares. For purposes of preparing the pro forma pricing analyses, we have reflected all shares issued in the Offering, including all ESOP shares, to capture the full dilutive impact, particularly since the ESOP shares are economically dilutive, receive dividends and can be voted. However, we did consider the impact of SOP 93-6 in the valuation.
Based on the application of the three valuation approaches, taking into consideration the valuation adjustments discussed above, RP Financial concluded that, as of August 22, 2008, the aggregate pro forma market value of OSHC’s conversion stock was $78,670,836 at the midpoint, equal to 8,741,204 shares at $9.00 per share. The midpoint and resulting valuation range is based on the sale of a 57.20% ownership interest to the public, which provides for a $45.0 million public Offering at the midpoint value.
| RP® Financial, LC. | VALUATION ANALYSIS | |
| IV. 21 |
1.Earnings Approach (“P/E” and “Core P/E”). The application of the P/E valuation method requires calculating the Company’s pro forma market value by applying a valuation P/E multiple to the pro forma earnings base. In applying this technique, we considered both reported earnings and a recurring earnings base, that is, earnings adjusted to exclude any one-time non-operating items, plus the estimated after-tax earnings benefit of the reinvestment of the net proceeds. The Company’s reported earnings equaled $3.489 million for the twelve months ended June 30, 2008. In deriving the Company’s core earnings, the only adjustment made to reported earnings was to eliminate the loss on the Company’s reported losses on securities totaling $362,000 (0.06% of average assets) reflecting a valuation impairment charge ($312,000) and a loss on the sale of securities ($50,000). Accordingly, on a tax affected basis, reflecting the marginal tax rate of 39.9%, the Company’s core earnings were determined to equal $3.707 million for the 12 months ended June 30, 2008 (Note: see Exhibit IV-9 for the adjustments applied to the Peer Group’s earnings in the calculation of core earnings).
Based on the Company’s reported and estimated core earnings, and incorporating the impact of the pro forma assumptions discussed previously, the Company’s pro forma reported and core P/E multiples at the $78.7 million midpoint value equaled 17.86 times and 17.02 times, respectively. The Company’s P/E at the midpoint is at a 36.2% premium relative to the Peer Group median based on reported earnings but is discounted modestly in a range of 1.5% to 10.7% relative to the Peer Group median core P/E multiple and the average reported and core P/E multiples as shown in the table on the following page.
Ocean Shore Holding Co. P/E Premiums/(Discounts) Vs. Peer Group Over Range of Value
| OSHC | Peer Group | OSHC Premiums/(Discounts) | ||||||||||||||||||||||||||||
| P/E | Core P/E | Average | Median | Average | Median | |||||||||||||||||||||||||
| P/E | Core P/E | P/E | Core P/E | P/E | Core P/E | P/E | Core P/E | |||||||||||||||||||||||
Maximum | 19.89 | x | 18.98 | x | 18.13 | x | 19.06 | x | 13.11 | x | 17.71 | x | 9.71 | % | -0.42 | % | 51.72 | % | 7.17 | % | ||||||||||
Midpoint | 17.86 | x | 17.02 | x | 18.13 | x | 19.06 | x | 13.11 | x | 17.71 | x | -1.49 | % | -10.70 | % | 36.23 | % | -3.90 | % | ||||||||||
Minimum | 15.69 | x | 14.93 | x | 18.13 | x | 19.06 | x | 13.11 | x | 17.71 | x | -13.46 | % | -21.67 | % | 19.68 | % | -15.70 | % | ||||||||||
| Source: Table 4.3 | ||||||||||||||||||||||||||||||
2.Book Value Approach (“P/B” and “P/TB”). The application of the P/B valuation method requires calculating the Company’s pro forma market value by applying a valuation P/B ratio, derived from the Peer Group’s P/B ratio, to the Company’s pro forma book value, including $68,000 of net assets at the MHC. In applying the P/B approach, we considered both reported book value (“P/B”) and tangible book value (“P/TB”). Based on the $78.7 million midpoint
| RP® Financial, LC. | VALUATION ANALYSIS | |
| IV. 22 |
valuation, OSHC’s pro forma P/B and P/TB ratios both equaled 77.58%. The resulting discounts to the Peer Group’s P/B and P/TB ratios, both averages and medians, over the range of value appear below.
Ocean Shore Holding Co. P/B Premiums/(Discounts) Vs. Peer Group Over Range of Value
| OSHC | Peer Group | OSHC Premiums/(Discounts) | ||||||||||||||||||||||||||||
| P/B | P/TB | Average | Median | Average | Median | |||||||||||||||||||||||||
| P/B | P/TB | P/B | P/TB | P/B | P/TB | P/B | P/TB | |||||||||||||||||||||||
Maximum | 84.35 | % | 84.35 | % | 100.14 | % | 107.22 | % | 103.36 | % | 111.02 | % | -15.8 | % | -21.3 | % | -18.39 | % | -24.02 | % | ||||||||||
Midpoint | 77.58 | % | 77.58 | % | 100.14 | % | 107.22 | % | 103.36 | % | 111.02 | % | -22.5 | % | -27.6 | % | -24.94 | % | -30.12 | % | ||||||||||
Minimum | 69.98 | % | 69.98 | % | 100.14 | % | 107.22 | % | 103.36 | % | 111.02 | % | -30.1 | % | -34.7 | % | -32.29 | % | -36.97 | % | ||||||||||
| Source: Table 4.3 | ||||||||||||||||||||||||||||||
3.Assets Approach (“P/A”). The P/A valuation methodology determines market value by applying a valuation P/A ratio to the Company’s pro forma asset base, conservatively assuming no deposit withdrawals are made to fund stock purchases. In all likelihood there will be deposit withdrawals, which results in understating the pro forma P/A ratio computed herein. At the midpoint of the valuation range, OSHC’s value equaled 11.31% of pro forma assets which is near parity to the Peer Group average of 11.34% but at a premium to the Peer Group median. The resulting premiums and discount to the Peer Group’s average and median P/A ratios, over the range of value, appear below.
Ocean Shore Holding Co. P/A Premiums/(Discounts) Vs. Peer Group Over Range of Value
| OSHC | Peer Group | OSHC Premiums/ (Discounts) | |||||||||||||
| P/A | Average | Median | Average | Median | |||||||||||
| P/A | P/A | P/A | P/A | ||||||||||||
Maximum | 12.90 | % | 11.34 | % | 8.31 | % | 13.8 | % | 55.23 | % | |||||
Midpoint | 11.31 | % | 11.34 | % | 8.31 | % | -0.3 | % | 36.10 | % | |||||
Minimum | 9.69 | % | 11.34 | % | 8.31 | % | -14.6 | % | 16.61 | % | |||||
| Source: Table 4.3 | |||||||||||||||
Valuation Conclusion
Based on the foregoing, it is our opinion that, as of August 22, 2008, the estimated aggregate pro forma market value of the Company, inclusive of the sale of the MHC’s ownership interest to the public shareholders was $78,670,836 at the midpoint. Based on this
| RP® Financial, LC. | VALUATION ANALYSIS | |
| IV. 23 |
valuation and the approximate 57.20% ownership interest being sold in the public Offering, the midpoint value of the Company’s stock Offering is $45,000,000, equal to 5,000,000 shares at a per share value of $9.00. The resulting range of value pursuant to regulatory guidelines and the corresponding number of shares based on the Board approved $9.00 per share Offering price is set forth below. The pro forma valuation calculations relative to the Peer Group are shown in Table 4.3 and are detailed in Exhibit IV-7 and Exhibit IV-8.
| Total Shares | Offering Shares | Exchange Shares Issued to the Public Shareholders | Exchange Ratio | ||||||||||
Shares | (x | ) | |||||||||||
Maximum | 10,052,384 | 5,750,000 | 4,302,384 | 1.20773 | |||||||||
Midpoint | 8,741,204 | 5,000,000 | 3,741,204 | 1.05020 | |||||||||
Minimum | 7,430,023 | 4,250,000 | 3,180,023 | 0.89267 | |||||||||
Distribution of Shares | |||||||||||||
Maximum | 100.00 | % | 57.20 | % | 42.80 | % | |||||||
Midpoint | 100.00 | % | 57.20 | % | 42.80 | % | |||||||
Minimum | 100.00 | % | 57.20 | % | 42.80 | % | |||||||
Aggregate Market Value(1) | |||||||||||||
Maximum | 90,471,456 | $ | 51,750,000 | 38,721,456 | |||||||||
Midpoint | 78,670,836 | $ | 45,000,000 | 33,670,836 | |||||||||
Minimum | 66,870,207 | $ | 38,250,000 | 28,620,207 | |||||||||
| (1) | Based on offering price of $9.00 per share. |
Establishment of the Exchange Ratio
OTS regulations provide that in a conversion of a mutual holding company, the minority stockholders are entitled to exchange the public shares for newly issued shares of OSHC stock as a fully converted company. The Board of Directors of the MHC has independently determined the exchange ratio. The determined exchange ratio has been designed to preserve the current aggregate percentage ownership in OSHC equal to 42.80% as of August 22, 2008. The exchange ratio to be received by the existing minority shareholders of OSHC will be determined at the end of the Offering, based on the total number of shares sold in the subscription and community offerings. Based upon this calculation, and the valuation conclusion and Offering range concluded above, the exchange ratio would be 0.89267 shares, 1.05020 shares and 1.20773 shares of newly issued shares of OSHC stock for each share of stock held by the public shareholders at the minimum, midpoint, and maximum of the Offering
| RP® Financial, LC. | VALUATION ANALYSIS | |
| IV. 24 |
Table 4.3
Public Market Pricing
Ocean Shore Holding Co.
As of August 22, 2008
| Market Capitalization | Per Share Data | Pricing Ratios(3) | |||||||||||||||||||||||||||
| Price/ Share(1) | Market Value | Core 12 Month EPS(2) | Book Value/ Share | P/E | P/B | P/A | P/TB | P/Core | |||||||||||||||||||||
| ($) | ($Mil) | ($) | ($) | (x) | (%) | (%) | (%) | (x) | |||||||||||||||||||||
Ocean Shore Holding Co. | |||||||||||||||||||||||||||||
Maximum | $ | 9.00 | $ | 90.47 | $ | 0.45 | $ | 10.67 | 19.89 | x | 84.35 | % | 12.90 | % | 84.35 | % | 18.98 | x | |||||||||||
Midpoint | $ | 9.00 | $ | 78.67 | $ | 0.50 | $ | 11.60 | 17.86 | x | 77.58 | % | 11.31 | % | 77.58 | % | 17.02 | x | |||||||||||
Minimum | $ | 9.00 | $ | 66.87 | $ | 0.57 | $ | 12.86 | 15.69 | x | 69.98 | % | 9.69 | % | 69.98 | % | 14.93 | x | |||||||||||
All Public Companies(7) | |||||||||||||||||||||||||||||
Averages | $ | 11.77 | $ | 392.70 | $ | 0.06 | $ | 14.50 | 17.34 | x | 85.23 | % | 9.73 | % | 99.24 | % | 18.95 | x | |||||||||||
Medians | 10.35 | 60.37 | 0.46 | 12.99 | 14.79 | x | 79.18 | % | 8.03 | % | 90.20 | % | 16.18 | x | |||||||||||||||
All Non-MHC State of NJ(7) | |||||||||||||||||||||||||||||
Averages | $ | 14.10 | $ | 1,798.04 | $ | 0.53 | $ | 11.61 | 21.09 | x | 129.67 | % | 14.20 | % | 152.01 | % | 21.88 | x | |||||||||||
Medians | $ | 14.59 | $ | 171.55 | $ | 0.63 | $ | 10.90 | 20.91 | x | 122.29 | % | 13.00 | % | 151.22 | % | 21.94 | x | |||||||||||
Comparable Group Averages | |||||||||||||||||||||||||||||
Averages | $ | 13.36 | $ | 71.33 | $ | 0.85 | $ | 13.86 | 18.13 | x | 100.14 | % | 11.34 | % | 107.22 | % | 19.06 | x | |||||||||||
Medians | $ | 13.07 | $ | 52.67 | $ | 0.74 | $ | 13.43 | 13.11 | x | 103.36 | % | 8.31 | % | 111.02 | % | 17.71 | x | |||||||||||
State of New Jersey (7) | |||||||||||||||||||||||||||||
ABNJ | American Bncrp of NJ Inc of NJ | $ | 10.40 | $ | 113.86 | $ | 0.04 | $ | 8.30 | NM | 125.30 | % | 18.05 | % | 125.30 | % | NM | ||||||||||||
CBNJ | Cape Bancorp, Inc. of NJ | $ | 9.22 | $ | 122.76 | $ | 0.05 | $ | 13.72 | NM | 67.20 | % | 10.59 | % | 96.44 | % | NM | ||||||||||||
HCBK | Hudson City Bancorp, Inc of NJ | $ | 18.01 | $ | 9,355.80 | $ | 0.68 | $ | 9.07 | 26.49 | x | 198.57 | % | 19.03 | % | 205.59 | % | 26.49 | x | ||||||||||
OCFC | OceanFirst Fin. Corp of NJ | $ | 17.82 | $ | 220.34 | $ | 1.04 | $ | 10.06 | 16.05 | x | 177.14 | % | 11.76 | % | 177.14 | % | 17.13 | x | ||||||||||
PBCI | Pamrapo Bancorp, Inc. of NJ | $ | 13.99 | $ | 69.61 | $ | 0.79 | $ | 11.73 | 17.71 | x | 119.27 | % | 11.54 | % | 119.27 | % | 17.71 | x | ||||||||||
PFS | Provident Fin. Serv. Inc of NJ | $ | 15.18 | $ | 905.87 | $ | 0.58 | $ | 16.77 | 24.10 | x | 90.52 | % | 14.24 | % | 188.34 | % | 26.17 | x | ||||||||||
Comparable Group | |||||||||||||||||||||||||||||
ABNJ | American Bncrp of NJ Inc of NJ | $ | 10.40 | $ | 113.86 | $ | 0.04 | $ | 8.30 | NM | 125.30 | % | 18.05 | % | 125.30 | % | NM | ||||||||||||
ESSA | ESSA Bancorp, Inc. of PA | $ | 13.45 | $ | 225.80 | $ | 0.42 | $ | 12.38 | 32.02 | 108.64 | % | 22.93 | % | 108.64 | % | 32.02 | x | |||||||||||
ESBK | Elmira Svgs Bank, FSB of NY | $ | 13.50 | $ | 25.89 | $ | 0.68 | $ | 16.64 | 13.11 | 81.13 | % | 5.50 | % | 141.07 | % | 19.85 | x | |||||||||||
FSBI | Fidelity Bancorp, Inc. of PA | $ | 11.15 | $ | 33.73 | $ | 1.37 | $ | 14.93 | 8.38 | 74.68 | % | 4.66 | % | 79.47 | % | 8.14 | x | |||||||||||
FKFS | First Keystone Fin., Inc of PA | $ | 10.00 | $ | 24.33 | $ | 0.30 | $ | 13.91 | 31.25 | 71.89 | % | 4.68 | % | 71.89 | % | 33.33 | x | |||||||||||
HARL | Harleysville Svgs Fin Cp of PA | $ | 12.69 | $ | 45.10 | $ | 1.07 | $ | 12.94 | 12.44 | 98.07 | % | 5.47 | % | 98.07 | % | 11.86 | x | |||||||||||
PBCI | Pamrapo Bancorp, Inc. of NJ | $ | 13.99 | $ | 69.61 | $ | 0.79 | $ | 11.73 | 17.71 | 119.27 | % | 11.54 | % | 119.27 | % | 17.71 | x | |||||||||||
ROME | Rome Bancorp, Inc. of Rome NY | $ | 10.71 | $ | 78.55 | $ | 0.40 | $ | 8.79 | 26.78 | 121.84 | % | 23.96 | % | 121.84 | % | 26.78 | x | |||||||||||
THRD | TF Fin. Corp. of Newtown PA | $ | 21.50 | $ | 60.24 | $ | 1.68 | $ | 24.65 | 12.36 | 87.22 | % | 8.37 | % | 93.36 | % | 12.80 | x | |||||||||||
WVFC | WVS Financial Corp. of PA | $ | 16.25 | $ | 36.17 | $ | 1.79 | $ | 14.33 | 9.08 | 113.40 | % | 8.24 | % | 113.40 | % | 9.08 | x | |||||||||||
| Dividends(4) | Financial Characteristics(6) | Offering Size | Exchange Ratio | ||||||||||||||||||||||||||||||||||||
| Total Assets | Equity/ Assets | Tang. Eq./ Assets | NPAs/ Assets | Reported | Core | ||||||||||||||||||||||||||||||||||
| Amount/ Share | Yield | Payout Ratio(5) | ROA | ROE | ROA | ROE | |||||||||||||||||||||||||||||||||
| ($) | (%) | (%) | ($Mil) | (%) | (%) | (%) | (%) | (%) | (%) | (%) | ($Mil) | (x) | |||||||||||||||||||||||||||
Ocean Shore Holding Co. | |||||||||||||||||||||||||||||||||||||||
Maximum | $ | 0.17 | 1.84 | % | 36.60 | % | $ | 702 | 15.29 | % | 15.29 | % | 0.27 | % | 0.65 | % | 4.24 | % | 0.68 | % | 4.44 | % | 51.75 | 1.20773 | |||||||||||||||
Midpoint | $ | 0.19 | 2.12 | % | 37.79 | % | $ | 696 | 14.58 | % | 14.58 | % | 0.27 | % | 0.63 | % | 4.34 | % | 0.66 | % | 4.56 | % | 45.00 | 1.05020 | |||||||||||||||
Minimum | $ | 0.22 | 2.49 | % | 39.06 | % | $ | 690 | 13.85 | % | 13.85 | % | 0.28 | % | 0.62 | % | 4.46 | % | 0.65 | % | 4.69 | % | 38.25 | 0.89267 | |||||||||||||||
All Public Companies(7) | |||||||||||||||||||||||||||||||||||||||
Averages | $ | 0.38 | 3.04 | % | 40.93 | % | $ | 3,656 | 11.00 | % | 9.97 | % | 1.79 | % | 0.19 | % | 1.84 | % | 0.18 | % | 1.73 | % | |||||||||||||||||
Medians | $ | 0.33 | 3.00 | % | 31.37 | % | $ | 878 | 9.43 | % | 7.78 | % | 0.87 | % | 0.46 | % | 3.95 | % | 0.44 | % | 3.73 | % | |||||||||||||||||
All Non-MHC State of NJ(7) | |||||||||||||||||||||||||||||||||||||||
Averages | $ | 0.47 | 3.09 | % | 53.13 | % | $ | 9,965 | 11.97 | % | 9.96 | % | 1.04 | % | 0.48 | % | 4.99 | % | 0.47 | % | 4.84 | % | |||||||||||||||||
Medians | $ | 0.46 | 2.79 | % | 70.22 | % | $ | 1,517 | 12.04 | % | 9.48 | % | 0.75 | % | 0.62 | % | 5.20 | % | 0.60 | % | 5.05 | % | |||||||||||||||||
Comparable Group Averages | |||||||||||||||||||||||||||||||||||||||
Averages | $ | 0.51 | 3.71 | % | 38.76 | % | $ | 625 | 10.68 | % | 10.31 | % | 0.65 | % | 0.56 | % | 6.05 | % | 0.55 | % | 5.83 | % | |||||||||||||||||
Medians | $ | 0.60 | 3.83 | % | 40.11 | % | $ | 617 | 8.44 | % | 8.15 | % | 0.37 | % | 0.59 | % | 6.93 | % | 0.60 | % | 5.73 | % | |||||||||||||||||
State of New Jersey (7) | |||||||||||||||||||||||||||||||||||||||
ABNJ | American Bncrp of NJ Inc of NJ | $ | 0.20 | 1.92 | % | NM | $ | 631 | 14.41 | % | 14.41 | % | 0.14 | % | 0.07 | % | 0.45 | % | 0.07 | % | 0.45 | % | |||||||||||||||||
CBNJ | Cape Bancorp, Inc. of NJ | $ | 0.00 | 0.00 | % | 0.00 | % | $ | 1,159 | 15.76 | % | 11.53 | % | 2.22 | % | 0.06 | % | 0.41 | % | 0.07 | % | 0.52 | % | ||||||||||||||||
HCBK | Hudson City Bancorp, Inc of NJ | $ | 0.48 | 2.67 | % | 70.59 | % | $ | 49,163 | 9.58 | % | 9.29 | % | 0.25 | % | 0.79 | % | 7.59 | % | 0.79 | % | 7.59 | % | ||||||||||||||||
OCFC | OceanFirst Fin. Corp of NJ | $ | 0.80 | 4.49 | % | 72.07 | % | $ | 1,874 | 6.64 | % | 6.64 | % | 0.83 | % | 0.71 | % | 11.08 | % | 0.67 | % | 10.38 | % | ||||||||||||||||
PBCI | Pamrapo Bancorp, Inc. of NJ | $ | 0.92 | 6.58 | % | NM | $ | 603 | 9.67 | % | 9.67 | % | 2.10 | % | 0.62 | % | 6.71 | % | 0.62 | % | 6.71 | % | |||||||||||||||||
PFS | Provident Fin. Serv. Inc of NJ | $ | 0.44 | 2.90 | % | 69.84 | % | $ | 6,360 | 15.74 | % | 8.24 | % | 0.67 | % | 0.62 | % | 3.68 | % | 0.57 | % | 3.39 | % | ||||||||||||||||
Comparable Group | |||||||||||||||||||||||||||||||||||||||
ABNJ | American Bncrp of NJ Inc of NJ | $ | 0.20 | 1.92 | % | NM | $ | 631 | 14.41 | % | 14.41 | % | 0.14 | % | 0.07 | % | 0.45 | % | 0.07 | % | 0.45 | % | |||||||||||||||||
ESSA | ESSA Bancorp, Inc. of PA | $ | 0.16 | 1.19 | % | 38.10 | % | $ | 985 | 21.10 | % | 21.10 | % | 0.11 | % | 0.75 | % | 3.41 | % | 0.75 | % | 3.41 | % | ||||||||||||||||
ESBK | Elmira Svgs Bank, FSB of NY | $ | 0.80 | 5.93 | % | NM | $ | 471 | 6.78 | % | 4.02 | % | 0.55 | % | 0.47 | % | 7.18 | % | 0.31 | % | 4.74 | % | |||||||||||||||||
FSBI | Fidelity Bancorp, Inc. of PA | $ | 0.56 | 5.02 | % | 42.11 | % | $ | 724 | 6.24 | % | 5.89 | % | 1.65 | % | 0.55 | % | 8.68 | % | 0.57 | % | 8.94 | % | ||||||||||||||||
FKFS | First Keystone Fin., Inc of PA | $ | 0.00 | 0.00 | % | 0.00 | % | $ | 519 | 6.51 | % | 6.51 | % | 0.27 | % | 0.15 | % | 2.24 | % | 0.14 | % | 2.10 | % | ||||||||||||||||
HARL | Harleysville Svgs Fin Cp of PA | $ | 0.72 | 5.67 | % | 70.59 | % | $ | 825 | 5.58 | % | 5.58 | % | 0.07 | % | 0.46 | % | 7.72 | % | 0.48 | % | 8.10 | % | ||||||||||||||||
PBCI | Pamrapo Bancorp, Inc. of NJ | $ | 0.92 | 6.58 | % | NM | $ | 603 | 9.67 | % | 9.67 | % | 2.10 | % | 0.62 | % | 6.71 | % | 0.62 | % | 6.71 | % | |||||||||||||||||
ROME | Rome Bancorp, Inc. of Rome NY | $ | 0.34 | 3.17 | % | NM | $ | 328 | 19.66 | % | 19.66 | % | 0.60 | % | 0.92 | % | 4.26 | % | 0.92 | % | 4.26 | % | |||||||||||||||||
THRD | TF Fin. Corp. of Newtown PA | $ | 0.80 | 3.72 | % | 45.98 | % | $ | 720 | 9.60 | % | 9.02 | % | 0.37 | % | 0.70 | % | 7.15 | % | 0.68 | % | 6.91 | % | ||||||||||||||||
WVFC | WVS Financial Corp. of PA | $ | 0.64 | 3.94 | % | 35.75 | % | $ | 439 | 7.27 | % | 7.27 | % | NA | 0.94 | % | 12.71 | % | 0.94 | % | 12.71 | % | |||||||||||||||||
| (1) | Average of High/Low or Bid/Ask price per share. |
| (2) | EPS (estimate core basis) is based on actual trailing 12 month data, adjusted to omit non-operating items on a tax-effected basis, and is shown on a pro forma basis where appropriate. |
| (3) | P/E = Price to earnings; P/B = Price to book; P/A = Price to assets; P/TB = Price to tangible book value; and P/Core = Price to core earnings. |
| (4) | Indicated 12 month dividend, based on last quarterly dividend declared. |
| (5) | Indicated 12 month dividend as a percent of trailing 12 month estimated core earnings. |
| (6) | ROA (return on assets) and ROE (return on equity) are indicated ratios based on trailing 12 month common earnings and average common equity and total assets balances. |
| (7) | Excludes from averages and medians those companies the subject of actual or rumored acquisition activities or unusual operating characteristics. |
Source: Corporate reports, offering circulars, and RP Financial, LC. calculations. The information provided in this report has been obtained from sources we believe are reliable, but we cannot guarantee the accuracy or completeness of such information.
| RP® Financial, LC. | VALUATION ANALYSIS | |
| IV. 25 |
range, respectively. RP Financial expresses no opinion on the proposed exchange of newly issued Company shares for the shares held by the public stockholders or on the proposed exchange ratio.
| RP® Financial, LC. | VALUATION ANALYSIS | |
EXHIBITS
NUMERICAL EXHIBITS OMITTED IN ACCORDANCE WITH RULE 202 OF REGULATION S–T, THESE EXHIBITS ARE BEING FILED IN PAPER PURSUANT TO A CONTINUING HARDSHIP EXEMPTION.